the Creative Commons Attribution 4.0 License.
the Creative Commons Attribution 4.0 License.
Impact of climate change on snow avalanche activity in the Swiss Alps
Stephanie Mayer
Martin Hendrick
Adrien Michel
Bettina Richter
Jürg Schweizer
Heini Wernli
Alec van Herwijnen
The cryosphere in mountain regions is rapidly transforming due to climate change, yet the impact of these changes on snow avalanche activity remains uncertain. Here, we use a snow cover model driven by downscaled climate projections to evaluate future alterations in dry- and wet-snow avalanche occurrences throughout the 21st century in the Swiss Alps. We assess avalanche activity by employing machine learning models trained with observed records of avalanches. Our findings indicate an overall decline in the occurrence of dry-snow avalanches during the months of December to May that is partially compensated for by an increase in wet-snow avalanche activity. Depending on elevation and the emission scenario considered, we anticipate a net reduction in the total avalanche activity ranging from under 10 % to as much as 60 % by the end of the century compared to 45–75 avalanche days per year at the beginning of the century. Projections further reveal a shift of wet-snow avalanche activity to earlier winter months. Analysis of changes in prominent snow grain types offers a coherent explanation of projected changes beyond a mere decrease in snow depth and snow cover duration. Overall, our study quantifies for the first time the significant influence of climate change on snow avalanche activity in the Swiss Alps and may serve as a benchmark for further mountain regions with similar avalanche climates.
- Article
(5470 KB) - Full-text XML
- BibTeX
- EndNote
Snow avalanches pose a significant natural hazard in seasonally snow-covered mountain regions around the globe, threatening human lives and infrastructure. Ongoing climate change is substantially changing the duration, extent, and thickness of the seasonal snow cover and consequently may affect the frequency, magnitude, and spatial occurrence of snow avalanches (Intergovernmental Panel on Climate Change, 2022). Indeed, warmer temperatures lead to a shift from solid to liquid precipitation and an earlier snowmelt onset. Numerous studies have quantified the resulting decline in the seasonal snow cover (e.g., Mote et al., 2018; Smith and Bookhagen, 2018; Matiu et al., 2021), and climate projections suggest a continuation of this trend (e.g., Terzago et al., 2014; Fyfe et al., 2017; Verfaillie et al., 2018; Kotlarski et al., 2023). Yet, the impact of climate change on snow avalanches remains unclear, as snow avalanches are triggered by the complex interaction of weather and terrain with the snowpack, rather than just by the amount of snow on the ground (Schweizer et al., 2003). Mere knowledge about changes in duration and depth of the seasonal snow cover is therefore not sufficient to determine the effect of climate change on snow avalanche occurrence.
Throughout a winter season, distinct snow layers are deposited and continuously evolve under the influence of environmental factors such as precipitation, temperature, wind, and radiation. Snow stratigraphy, i.e., the vertical layering of the snowpack, is a key factor in the formation of snow avalanches. Dry-snow slab avalanches, the most destructive avalanches, release due to the failure of a mechanically weak snow layer buried below a cohesive slab (e.g., Bobillier et al., 2021; Bergfeld et al., 2023). Most dry-snow slab avalanches release naturally during or shortly after a snowstorm, but artificial triggering, for instance by skiers, is also possible. Wet-snow avalanches, on the other hand, form when liquid water from melting or rain-on-snow events infiltrates the snowpack and reduces the strength of existing weak layers (Baggi and Schweizer, 2009; Mitterer and Schweizer, 2013). Due to the differences in underlying physical processes, it is essential to distinguish between wet- and dry-snow avalanches when assessing the influence of climate change.
Few historical avalanche data series are of sufficient length, completeness, and homogeneity to detect climate-related trends (Laternser and Schneebeli, 2002; García-Hernández et al., 2017; Favillier et al., 2023). Available studies indicate that rising temperatures have led to a decrease in the number and size of avalanches (Teich et al., 2012; Eckert et al., 2013; Giacona et al., 2021; Peitzsch et al., 2021), especially at lower elevations, and to an increase in the proportion of wet-snow avalanches (Pielmeier et al., 2013; Naaim et al., 2016). The influence of climate change on snowpack stability at higher elevations, where temperature increases have a weaker effect on the snow–rain partitioning, remains largely unclear. Some studies have suggested an increase in dry-snow avalanche activity at higher elevations due to a warming-related intensification of heavy snowfall events (Lavigne et al., 2015), while others have attributed an observed increase in avalanche activity to an enhanced likelihood of wet-snow conditions (Ballesteros-Cánovas et al., 2018). However, these studies either had limited data quality or were rather local in scope, making it difficult to predict future changes at a larger scale, including higher elevations where most avalanches release.
To evaluate changes in snow avalanche activity for future decades, climate projections can be coupled with physics-based snow cover models that resolve the temporal evolution of snow stratigraphy required to assess snow instability. The few existing assessments of future snow stability based on simulated snow cover data (Lazar and Williams, 2008; Castebrunet et al., 2014; Katsuyama et al., 2022) relied on either bulk snowpack or meteorological parameters without accounting for the detailed snow stratigraphy or employed a stability index that is a poor predictor of avalanche activity (Jamieson et al., 2007; Mayer et al., 2023). Thus, there is insufficient understanding of potential changes in avalanche activity within the current century and whether avalanche risk mitigation measures need to be adapted (Eckert et al., 2024).
Our goal is therefore to quantify how and why natural avalanche activity will change for different elevations in the Swiss Alps throughout the 21st century. We use machine learning models to classify dry- and wet-snow avalanche days based on downscaled climate change scenarios and simulated snow stratigraphy. Specifically, we investigate future changes in the occurrence of natural avalanches at middle to high elevations using the CH2018 climate change scenarios (CH2018, 2018) and considering three different emission scenarios (Representative Concentration Pathways; RCP2.6, RCP4.5, and RCP8.5). We apply statistical methods to spatially transfer climate projections from eight members of the CH2018 ensemble to seven automatic weather stations (AWSs) located close to typical avalanche starting zones in the Swiss Alps at elevations ranging from 1800 to 2900 m a.s.l. The downscaled meteorological variables serve as input for the physics-based snow cover model SNOWPACK (Bartelt and Lehning, 2002; Lehning et al., 2002a, b), yielding one-dimensional simulations of snow stratigraphy. To identify dry- and wet-snow avalanche days (AvDs), we employ two recently developed classification models (Mayer et al., 2023; Hendrick et al., 2023). Finally, based on the resulting transient time series of future avalanche activity, we examine changes in the number of avalanche days per winter season, explore changes in the seasonal fluctuations of avalanche activity, and investigate causes of the predicted changes using the simulated snow stratigraphy.
To project changes in dry- and wet-snow avalanche activity throughout the 21st century, we established a model chain to (1) downscale climate projections, (2) simulate snow stratigraphy, and (3) classify dry- and wet-snow avalanche activity (AvD vs. non-AvD) at seven sites in the Swiss Alps on a daily basis.
2.1 Selection of sites
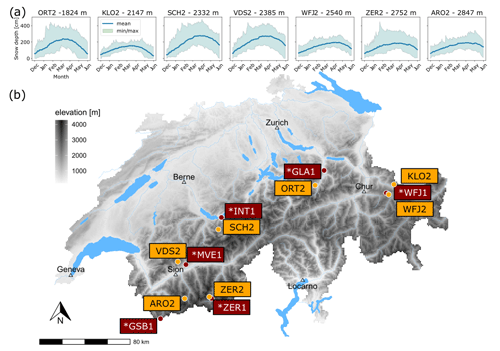
We aimed to project changes in avalanche activity for an elevation range where, even under strong-emissions scenarios, a continuous snow cover over an extended time period is still likely to exist by the end of the century. In mountain regions, the near-surface 0 ° line roughly demarcates the regions where precipitation falls predominantly as either snow or rain (Intergovernmental Panel on Climate Change, 2022). Under strong emissions (RCP8.5), the winter 0 ° line averaged over the country of Switzerland is projected to increase in elevation from today’s level at 850 to up to 1800 m a.s.l. by the end of the century (CH2018, 2018). We therefore selected seven sites at an elevation range above 1800 m a.s.l. where the majority of potential avalanche release areas are located in the Swiss Alps (Bründl et al., 2019). The location of those sites corresponded to the location of AWSs of the IMIS network used in operational avalanche forecasting in Switzerland (Lehning et al., 1999; SLF, 2022). The CH2018 climate scenarios are however only available for AWSs from SwissMetNet of the Federal Office of Meteorology and Climatology MeteoSwiss, which are usually located at lower elevations (<1800 m a.s.l.). To enable a spatial statistical transfer of these climate projections to the higher-elevation IMIS stations, we selected the AWSs from the IMIS network according to the following criteria: (1) sufficiently long time series (≥20 years) of continuously measured data, (2) not more than 2 consecutive days of missing snow depth measurement, and (3) availability of SwissMetNet AWSs included in the CH2018 dataset situated less than 30 km apart in the same climate regime (northern vs. southern flank of the Alps). The geographical positions of the IMIS stations and their associated SwissMetNet stations are depicted in Fig. 1.
The selected seven sites cover different snow climates (Schweizer et al., 2024). According to Mock and Birkeland (2000), the snow climate is classified as maritime and partly transitional for three stations (VDS2, SCH2, ORT2), transitional to maritime for two stations (ZER2, KLO2), and transitional to continental for the remaining two stations (ARO2, WFJ2).
2.2 Climate projections CH2018
The climate projections used in this study are based on the CH2018 climate change scenarios (CH2018, 2018), which are available for three Representative Concentration Pathways (RCPs), each named according to the level of radiative forcing (in W m−2) projected to be reached by the end of the century (Stocker et al., 2013): scenario RCP2.6 corresponds to strong reductions in global emissions, likely limiting global warming to below 2 °C by 2100. In the intermediate scenario, RCP4.5, greenhouse gas emissions peak around mid-century and then decline due to moderate mitigation efforts. The high-emission “worst-case” scenario, RCP8.5, is characterized by a lack of significant mitigation measures and continuous growth in atmospheric greenhouse gas concentrations, without considering potential fossil fuel limitations.
Based on the set of RCPs, projections of changes in the climate system were simulated using an ensemble of general circulation models (GCMs), and the resulting outputs were then used as boundary conditions for a regional climate model (RCM) ensemble over Europe as part of the EURO-CORDEX experiment (Jacob et al., 2014). Finally, the CH2018 climate scenarios were obtained from a statistical downscaling of the EURO-CORDEX ensemble of coarser RCM simulations to AWSs using quantile mapping (QM; Gudmundsson et al., 2012; Rajczak et al., 2016). QM is an established statistical method used to transform the distribution of modeled data so that their statistical properties align more closely with those of observed data. When applied in a climate modeling context, QM involves building a transfer function that relates quantiles from the modeled distribution of a meteorological variable to the corresponding quantiles in the observed distribution for a given reference period. The transfer function is then applied to bias correct a transient time series of the simulated variable. QM is thus primarily a bias correction method but can implicitly serve as a downscaling method if the observed reference data refer to a higher spatial resolution than the climate model (Feigenwinter et al., 2018).
In the context of the CH2018 scenarios, QM implies that when the daily precipitation sum on a given day in a specific RCM grid cell equals the 70th percentile of the reference period's climate simulations, the daily precipitation sum at a corresponding AWS is set to the 70th percentile of the observed daily precipitation at that station during the reference period. In principle, this implies that the downscaling preserves realistic weather patterns, and the downscaled data capture realistic storm events that are present in the RCM simulations if those events are represented in the reference period. However, QM assumes that the relation between conditions in the grid cell and the station is stationary, which might not hold true under changing climatic conditions. Moreover, the QM transfer function is subject to uncertainties due to the limited number of years considered for the calibration, in particular for high and low quantiles. Furthermore, the extremes that have not been observed in the reference period are mapped using a constant extrapolation of the biases for the 1st and 99th percentiles (CH2018, 2018). These limitations should be considered in particular when interpreting results related to extreme events. The CH2018 scenarios are available at a daily resolution for seven variables (daily mean, minimum and maximum air temperature, precipitation, relative humidity, wind speed, and incoming shortwave radiation) for a set of AWSs from SwissMetNet and cover the complete time period 1981–2099.
2.3 Downscaling of climate projections
To spatially transfer the CH2018 scenarios for the SwissMetNet AWSs to the corresponding seven IMIS AWSs situated at the elevation of potential avalanche starting zones, we used a combination of univariate QM (see Sect. 2.2) and multivariate QM (MQM; Cannon, 2018). MQM is a multivariate generalization of QM where the transfer function is based on the multidimensional distribution of different meteorological variables. The MQM approach allowed for bias correction while preserving more realistic inter-variable relationships, providing a distinct advantage over other statistical methods for bias correction. Moreover, it was necessary to downscale the climate scenarios to an hourly resolution, as required to force the SNOWPACK model. In more detail, we conducted the following steps:
-
Transfer of daily climate change scenarios. The CH2018 climate scenarios are based on a spatial transfer of EURO-CORDEX data to SwissMetNet AWSs using univariate QM (see Sect. 2.2). However, univariate QM partially removes correlations between variables (Michel et al., 2021), and EURO-CORDEX data have an unrealistic relationship between precipitation and temperature, with more precipitation on warm days than on cold days as compared to measurements (Meyer et al., 2019). Consequently, solid precipitation, and thus snow depth, is underestimated when forcing snow models with CH2018 data. We therefore used MQM (Cannon, 2018) to restore inter-variable correlations in climate change scenarios based on those observed in the historical time series (the historical IMIS time series), thereby also removing the precipitation bias in the underlying EURO-CORDEX data. Nevertheless, the MQM of Cannon (2018) uses the same bias correction throughout the year without any seasonality. We therefore first corrected for seasonal bias by applying a univariate QM for each day of the year (as in CH2018, 2018) using the method of Kotlarski (2019) and subsequently applied the MQM of Cannon (2018). Using this combination of QM and MQM improved the simulated snow depth over the historical period. Due to the restoration of inter-variable correlations with MQM, we expect that our approach better captures storm characteristics driving avalanche-relevant snow stratigraphy compared to other statistical bias correction methods such as the delta change method (Michel et al., 2021). The QM was applied to the following variables: daily mean, minimum and maximum air temperature, precipitation, relative humidity, wind speed, and incoming shortwave radiation.
-
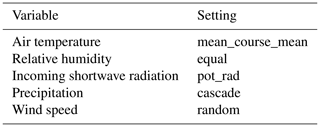
Downscaling climate change scenarios to hourly values. The climate change scenarios obtained through QM inherit the daily resolution of the CH2018 scenarios. We therefore used the MEteoroLOgical observation time series DISaggregation Tool (MELODIST) library (Förster et al., 2016) to reconstruct the daily cycle based on the seven variables obtained in the previous step. This software consists of disaggregation functions to reconstruct daily cycles of meteorological variables. Multiple functions, purely static or based on statistics of past observations at the AWS of interest, are available. The parameters used for the MELODIST library are detailed in Appendix A (Table A2). Finally, hourly-resolution climate change scenarios were obtained for precipitation, air temperature, incoming shortwave radiation, wind speed, and relative humidity.
The downscaling process was implemented individually for each of the seven IMIS AWSs, using the historical time series for the IMIS AWSs (see Appendix B) and the CH2018 climate simulations for the corresponding nearby SwissMetNet AWSs and the same historical time period. For each IMIS AWS, the downscaling scheme was applied to eight climate model chains of the CH2018 ensemble, which are listed in Appendix A (Table A1). Selection criteria for the model chains included availability across all three RCP scenarios (RCP2.6, RCP4.5, and RCP8.5) and inclusion of all variables necessary to drive SNOWPACK. The downscaled climate projections for the IMIS AWSs cover the time period 1990–2099. The same downscaling scheme was applied by Ortner et al. (2024) to investigate the impact of climate change on avalanche runout.
2.4 SNOWPACK simulations
To simulate flat-field snow stratigraphy at the sites of the seven AWSs, we used the physics-based model SNOWPACK (Bartelt and Lehning, 2002; Lehning et al., 2002a, b). Based on meteorological input data, SNOWPACK simulates the one-dimensional vertical snow stratigraphy over time with snow layer thicknesses of the order of centimeters. Distinct layers are described with microstructural properties, such as grain and bond size (order of millimeters), and bulk properties, such as density and liquid water content. Snow grain types are classified according to the microstructural properties (Lehning et al., 2002b; Fierz et al., 2009). Several validation campaigns have demonstrated that modeled and observed snow stratigraphies generally agree well, in particular with respect to critical weak layers (e.g., Lehning et al., 2001; Horton et al., 2014; Richter et al., 2019; Calonne et al., 2020).
Climate projections of snow stratigraphy from 1 September 1990 to 31 May 2099 were obtained by driving SNOWPACK with the hourly downscaled climate scenarios. Simulations were conducted using a computation step size of 15 min. To model the soil heat flux at the bottom of the 3 m deep soil column below the snowpack, we chose a standard constant value of 0.06 W m−2 (Davies and Davies, 2010). The full energy balance at the snow–atmosphere boundary was calculated (Neumann boundary condition). Incoming longwave radiation, which was not included in the climate downscalings, was obtained using the parameterization of Carmona et al. (2014). The flow of liquid water through the snow cover was simulated based on a bucket scheme approach (Bartelt and Lehning, 2002).
For validation purposes, we also performed SNOWPACK simulations using meteorological measurements from the seven AWSs (Sect. 3). In this case, SNOWPACK settings were slightly different from those used for the climate projections, as a different set of meteorological variables was available. Specifically, simulations were driven with measured snow depth rather than with precipitation. Furthermore, we imposed the measured snow surface temperature as the upper Dirichlet boundary condition at the snow–atmosphere boundary. Whenever the snow surface temperature exceeded −1 °C, upper boundary conditions switched to Neumann-type conditions, preventing an underestimation of energy input during ablation periods. All further settings were identical to those used for the climate projections.
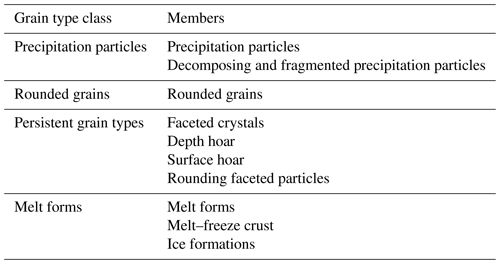
For the analysis of simulated snow stratigraphy, we grouped the simulated primary snow grain types into four classes to combine grain types with similar microstructural characteristics and similar significance with respect to avalanche formation (Table 1). Individual grain types are described in Fierz et al. (2009).
2.5 Assessment of avalanche activity
To assess dry-snow avalanche probability in the vicinity of the AWSs, we used a model that evaluates information on potential weak layers in the simulated snow stratigraphy in combination with the simulated new snow amounts (model “combi” in Mayer et al., 2023). Potential weak layers were identified using a random forest model providing a probability of instability for every layer in the simulated snow stratigraphy (Mayer et al., 2022). The daily maximum of the probability of instability and the 3 d sum of new snow were then combined into a probability of natural avalanche activity based on statistical models that were fit to observed avalanche activity data (Mayer et al., 2023). This dry-snow avalanche model was trained and extensively validated using observations of snow stratigraphy, snow instability, and avalanches (for more details, see Mayer et al., 2023, 2022).
Wet-snow avalanche probability in the vicinity of an AWS was computed with the random forest model described in Hendrick et al. (2023). The model was trained to differentiate between days with and without wet-snow avalanche activity based on a dataset of wet-snow avalanche observations spanning 20 years. Its input features include meteorological variables, e.g., the daily incoming shortwave radiation, as well as variables related to simulated snow stratigraphy, such as the maximum of the liquid water content among all snow layers. The wet-snow model was validated in both nowcast (based on measured variables) and forecast modes (based on variables computed from a numerical weather prediction model, Hendrick et al., 2023).
A day was classified as a dry-snow AvD or wet-snow AvD if the respective model indicated a probability of avalanche occurrence greater than 0.5 and the simulated snow depth was at least 40 cm. For the winter seasons from 1990/1991 through 2098/2099, every day within the period of December to May (DJFMAM) was categorized as either an AvD or a non-AvD with respect to dry- and wet-snow conditions based on the simulated meteorological and snow stratigraphy data. This classification was performed for each of the seven AWSs and for all 24 possible combinations of climate models (N=8) and RCP scenarios (N=3).
2.6 Analysis of projected changes
To evaluate how and why avalanche activity will change throughout the 21st century we analyzed the following:
-
changes in the number of simulated dry- and wet-snow AvDs within the period DJFMAM
-
shifts in the timing of dry- and wet-snow avalanche occurrence using monthly averages
-
changes in the proportion of snow grain types within the DJF snowpack.
All analyses were based on averages over 30-year periods, which allows the climatological influence to be captured. As a reference (REF) period we used the 30-year period spanning the winter seasons 1990/1991–2019/2020. We further defined the end-of-the-century (EOC) period as the winter seasons 2069/2070–2098/2099. To assess the statistical significance of the projected changes, we used Mann–Kendall (MK) test statistics (Mann, 1945; Kendall, 1975).
To investigate the accuracy of our model chain, we validated the downscaled climate scenarios and the simulated avalanche activity for the period where continuous meteorological measurements were available for the seven IMIS AWSs (winters of 2000/2001–2021/2022). We compared the following variables for the months DJFMAM averaged over the period 2000/2001–2021/2022:
-
Seasonal number of AvDs. The predictions of the avalanche activity models were compared based on SNOWPACK simulations forced with either the downscaled climate models or the measurements from the IMIS AWSs.
-
Air temperature. Downscaled climate scenarios were compared with measurements from the IMIS AWSs.
-
Snow depth. SNOWPACK simulations forced with downscaled climate models were compared with measurements from IMIS AWSs.
-
A 3 d sum of new snow height provided by SNOWPACK. This is defined as the sum of three consecutive values of the height of new snow fallen within 24 h. Simulations forced with either downscaled climate models or measurements from the IMIS AWSs were compared. The AWS measurements provide snow depth only and do not measure new snow height. Hence, for this case, SNOWPACK was driven with snow depth measurements, and new snow height was calculated taking into account settlement of the snowpack. For the simulations driven with the downscaled climate model output, SNOWPACK was forced with precipitation, and the height of new snow was again computed considering settlement.
The validation of the avalanche activity models is presented in Fig. 2 for all emission scenarios. Results of the validation of the meteorological variables are presented in Appendix C (Fig. C1 on a monthly basis for emission scenario RCP8.5 and Fig. C2d, h, l on a seasonal basis for all RCP scenarios). The results for the seasonal number of AvDs, snow depth, and 3 d sum of new snow height account for the uncertainties in the reconstructed historical IMIS time series (precipitation and incoming shortwave radiation), uncertainties induced by the use of climate change scenarios (i.e., the part not corrected by the QM), and uncertainties induced by SNOWPACK in deriving the snow depth and 3 d sum of new snow height.

Figure 2Relative differences between the simulated average seasonal (DJFMAM) number of AvDs based on SNOWPACK simulations forced with the downscaled climate models for the 2000/2001–2021/2022 period and the average seasonal number of AvDs based on SNOWPACK simulations forced with measurements from the same time period. Results are shown for relative differences regarding dry-snow (a) and wet-snow (b) AvDs. Colors indicate the different RCP scenarios. The box and whisker plots show the variability within the eight ensemble members, where the line indicates the median, the box extends from the first to the third quartile, the whiskers extend to 1.5 times the interquartile range beyond the box limit, and the black diamonds show outliers. The stations are arranged in order of increasing elevation, from the lowest (ORT2, 1824 m a.s.l.) to the highest (ARO2, 2847 m a.s.l.).
To validate the complete model chain, including both dry- and wet-snow avalanche activity models, we calculated the seasonal number of avalanche days (AvDs) using SNOWPACK simulations. These simulations were forced with either downscaled climate models or AWS measurements, and we then computed the relative difference between the resulting seasonal numbers of AvDs (Fig. 2). For the two lowest stations, the simulations forced with climate models resulted in an overprediction of dry-snow AvDs (about 20 % for ORT2 and KLO2 in Fig. 2a), while for the other stations, differences were smaller, typically an over- or underprediction of the order of 10 % or less. Regarding the seasonal number of wet-snow AvDs, there was a rather clear trend with elevation, with an underprediction of about −20 % for the lowest station and an overprediction of about 10 % for the highest station. Considering the natural daily variability in avalanche activity and the discrepancies in the input data (Fig. C1), the relative differences in the predicted numbers of dry- and wet-snow AvDs are still rather low. Note that we could not validate the AvD predictions with visual avalanche observations, since observational data are not consistently available for the 20-year period we considered. The avalanche prediction models, on the other hand, were thoroughly validated with quality-controlled sets of avalanche observations (Hendrick et al., 2023; Mayer et al., 2023).
For air temperature, snow depth, and the 3 d sum of new snow height, we first computed the day-of-year average for the variable of interest considering 22 values from the climate simulations spanning the period 2000/2001–2021/2022. For each of the climate models, we then compared these values to the corresponding values based on the observed data (Appendix C, Fig. C1). The bias in air temperature was negligible, and the RMSE was about 1 °C, well within daily natural variability. Differences in snow depth were the largest for the station at the lowest elevation (ORT2) and generally decreased with elevation. Overall, simulated values of snow depth were in good agreement with measurements and well within typical variations observed in mountainous terrain (e.g., Helbig and van Herwijnen, 2017), and for five of the seven stations the bias in snow depth was below 10 %. Finally, 3 d sums of new snow height simulated using either downscaled climate model data or IMIS measurements compared well for all stations, with a slight tendency to underpredict the amount of new snow in April and May.
4.1 Response of avalanche activity to warming
By the end of the 21st century, our models project substantial changes in avalanche activity during the months of DJFMAM. Changes in dry-snow, wet-snow, and total avalanche activity relative to the 30-year REF period are depicted using 30-year moving means of the projected seasonal number of AvDs up until the end of the century (Fig. 3). Regarding dry-snow avalanche activity (Fig. 3b–e), the multi-model mean indicates a decrease across all elevations, with the most significant reductions projected towards the end of the century for all RCP scenarios. The largest declines, up to 65 %, are observed under the RCP8.5 scenario. While the eight ensemble members show considerable variation, with some indicating a potential increase of up to 10 % in dry-snow AvDs, particularly during the first half of the century, the majority of members predicts a statistically significant (MK test) decline in dry-snow avalanche activity by the end of the century for all emission scenarios.
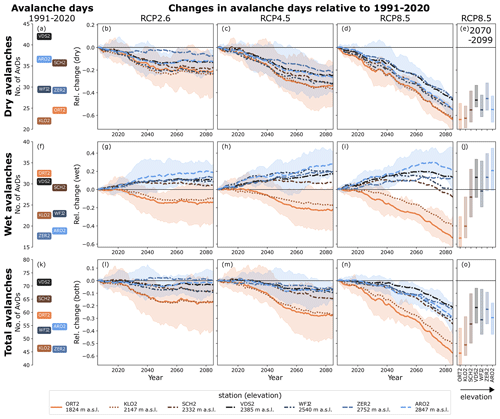
Figure 3Projected changes in dry-snow (b–e), wet-snow (g–j), and total avalanche activity (l–o) for the 21st century (centered 30-year moving average relative to the reference period of 1991–2020) under three different emission scenarios (RCP2.6, RCP4.5, and RCP8.5). The lines show the multi-model mean of the seasonal (DJFMAM) number of AvDs for seven AWSs across the Swiss Alps. The shaded areas indicate the spread of the eight climate ensemble members for the highest and lowest stations. Station identification is facilitated by colors and line styles specified in the bottom legend. The left panels (a, f, k) display the mean seasonal number of AvDs during the reference period for each station, and the right panels (e, j, o) show the mean (line) and spread (colored bars) under RCP8.5 for the period of 2070–2099.
Conversely, wet-snow avalanche activity (Fig. 3g–j) during the months of DJFMAM will increase for stations above 2300 m a.s.l. and decrease for stations at lower elevations. Under RCP2.6 and RCP4.5, the number of wet-snow AvDs projected by the ensemble mean levels off around mid-century at relative increases of 5 %–20 % for stations above 2300 m a.s.l. and at relative decreases of 15 %–20 % for lower stations compared to the REF period. Under the RCP8.5 scenario, stations above 2300 m a.s.l. are projected to experience a peak in the number of wet-snow AvDs during the second half of the century, with a relative increase of 10 %–30 %, followed by a subsequent decrease. For the two stations below 2300 m a.s.l., the decrease in wet-snow avalanche activity is most pronounced towards the end of the century and in particular for the RCP8.5 scenario, with a decrease by 50 %–60 %. Uncertainty within the ensemble is large for all stations, with absolute differences up to 55 % between individual model chains. For most combinations of climate models and RCP scenarios, increasing trends for stations above 2300 m a.s.l. up to the year 2070 and decreasing trends for the lower stations up to the end of the century were statistically significant (MK test). Interestingly, the decrease in dry-snow avalanche activity is mostly offset by the increase in wet-snow avalanche activity, resulting in decreases of less than 10 % in the total number of AvDs per DJFMAM for most stations, except for elevations below 2300 m a.s.l. or under the RCP8.5 scenario in the latter half of the century (Fig. 3l–o). Furthermore, we find a consistent trend with elevation, with more pronounced changes in projected avalanche activity occurring at lower elevations, particularly for wet-snow avalanches (Fig. 3e, j, o).
4.2 Changes in seasonality
To investigate changes in avalanche activity over the course of a winter season, we compared monthly averages (30 d moving sums) of AvDs between the REF and EOC periods (Fig. 4 for RCP8.5 and Appendix D, Fig. D1, for all RCPs).
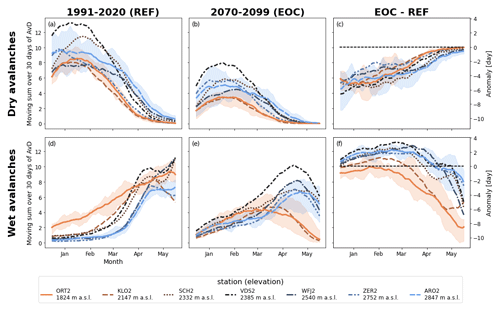
Figure 4The 30 d moving sum of AvDs for dry- (a, b) and wet-snow (d, e) conditions under RCP8.5 for the 1991–2020 (REF) and 2070–2099 (EOC) periods, as well as the resulting anomaly between EOC and REF periods (c, f). The lines indicate the multi-model mean over the considered period, and the shaded areas show the spread of the eight ensemble members for the highest and lowest stations.
Seasonality in dry-snow avalanche activity remains mostly unchanged. Indeed, for both the REF and the EOC periods, dry-snow avalanche activity generally peaks in January and February and decreases thereafter. Yet, the number of AvDs is much lower at the end of the century (negative anomaly for all stations in Fig. 4c). The seasonal distribution of wet-snow AvDs, however, is projected to change. For the REF period, wet-snow avalanche activity between December and February is mostly close to zero and rapidly increases in March, peaking towards the end of the season (Fig. 4d). At the end of the century, however, the increase in wet-snow avalanche activity is more gradual throughout the season, resulting in a higher frequency of avalanches from December to March (positive anomaly for all stations except ORT2 in Fig. 4f). In April and May, though, there is an overall decrease in wet-snow avalanche activity compared to REF (Fig. 4f), and wet-snow avalanche activity will thus peak earlier in the season. Overall, these seasonal changes result in a decrease in the number of wet-snow AvDs for the two lowest stations (ORT2 and KLO2) and an increase for the two highest stations (ZER2 and ARO2), which is consistent across most models (Fig. 3g–i).
4.3 Causes of projected changes
Changes in avalanche activity can be attributed to both weather and snowpack factors. For instance, with higher temperatures there is a decrease in snow cover duration and snowfall amounts (Appendix C, Fig. C2), which results in fewer potential dry-snow AvDs. However, the relative decrease in dry-snow AvDs towards the end of the century is notably larger (by more than 20 % for most stations above 2300 m a.s.l.) than the relative decrease in days with sufficient snow depth and snowfall for natural avalanche release (Appendix D, Fig. D2). Furthermore, the projected increase in wet-snow avalanche activity might also seem counterintuitive with respect to the decrease in snow depth. These discrepancies can be attributed to projected changes in snow stratigraphy.
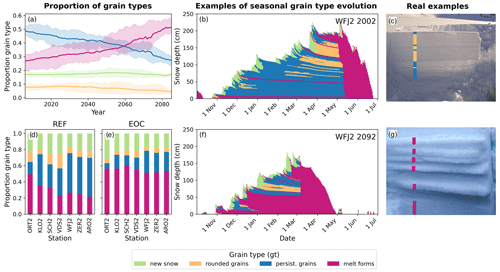
Figure 5(a, d, e) Average proportion of different grain type classes (indicated by colors) within the DJF snowpack under RCP8.5 for the WFJ2 site (2540 m a.s.l.) over the period 2006–2085 (centered around a 30-year moving average) (a) and for all stations averaged over the periods 1991–2020 (d) and 2070–2099 (e). The lines in (a) indicate the multi-model mean of the moving 30-year average proportion of the respective grain type, and the shaded areas show climate model spread. The bars in (d) and (e) refer to the multi-model mean. The stations in (d) and (e) are arranged in order of increasing elevation, from the lowest (ORT2, 1824 m a.s.l.) to the highest (ARO2, 2847 m a.s.l.). (b, f) Examples of the seasonal evolution of snow stratigraphy over one winter season in the reference period (b) and at the end of the century (f). (c, g) Illustration of observed layers consisting of precipitation particles, persistent grain types, and rounded grains (c) and refrozen melt form layers (g). Picture credits: Stephan Harvey (c), Alec van Herwijnen (g).
To investigate the impact of snow stratigraphy, we focused our analysis on four classes of snow grain types grouped according to their microstructural properties (Fig. 5) – precipitation particles, rounded grains, persistent grain types, and melt forms (Table 1). Weak layers associated with dry-snow avalanches (Fig. 5c) typically consist of low-density precipitation particles that cause instabilities during a storm (Bair et al., 2012) or weakly bonded persistent grain types that form under specific meteorological and snowpack conditions following snow deposition (Birkeland, 1998) and can cause instabilities for prolonged periods. Rounded grains form in dry snowpacks with limited temperature differences and are generally well bonded. Melt forms indicate wet-snow conditions resulting from liquid water infiltration into the snowpack, i.e., from surface meltwater or rain. Although water infiltration can destabilize the snowpack and result in wet-snow avalanches (Conway and Raymond, 1993; Savage et al., 2018), the subsequent formation of crusts after refreezing typically stabilizes the snowpack in the long term (Fig. 5g).
The following results are presented only for the strongest-emission scenario (RCP8.5), but changes under other scenarios show similar trends, albeit less pronounced. Our simulations indicate increasing prevalence of melt forms in the snowpack towards the end of the century, while persistent grain types will become less common. At the WFJ2 station, melt forms will replace persistent grain types as the most common grain type in DJF snowpacks around mid-century (red and blue lines in Fig. 5a), a trend also observed at all other stations by the end of the century (Fig. 5d and e). Therefore, the likelihood of forming persistent weak layers associated with dry-snow avalanches will decrease. This decrease is rather intuitive, as persistent grain types primarily form in cold conditions (Colbeck, 1982), and is in line with results of a recent sensitivity study on snow instability (Richter et al., 2020). In contrast, the relative proportion of rounded grains and precipitation particles will remain roughly the same. Since snow depth will generally decrease (Appendix C, Fig. C2e–g), this implies a reduction in the total thickness of precipitation particle layers, a direct consequence of the decrease in the amount of precipitation falling as snow (Appendix C, Fig. C2i–k).
Overall, changes in snow stratigraphy suggest that the occurrence of dry-snow avalanches will decline, as new snow is less likely to fall on a snowpack with persistent weak layers. In contrast, wet-snow avalanches will become more frequent, as the snowpack is more frequently wetted and weakened by meltwater or rain (projections show an up to 3-fold increase in 10 mm rain-on-snow events by the end of the century under RCP8.5). This is illustrated by the snowpack examples shown in Fig. 5b, f, where the snowpack from the REF period mostly consists of persistent and rounded grains, while the EOC snowpack mostly consists of melt forms. Changes in snow stratigraphy thus offer a coherent explanation for the projected changes in dry- and wet-snow avalanche activity that cannot solely be attributed to a reduction in solid precipitation and snow depth.
Our results show that above the current treeline in the Swiss Alps (typically 2100 to 2300 m a.s.l.; Gehrig-Fasel et al., 2007), climate change will lead to drastic changes in avalanche types, yet not necessarily to a substantial decrease in the overall number of AvDs (Fig. 3). At these elevations, a decrease in overall avalanche activity by 20 %–40 % by the end of the 21st century is only projected under the strongest-emission scenario, RCP8.5, while for the other scenarios the decrease is mostly below 10 %.
Unlike previous studies relying on bulk snow cover properties or simple snow instability metrics (Lazar and Williams, 2008; Castebrunet et al., 2014; Katsuyama et al., 2022), we used machine learning models to classify dry- and wet-snow AvDs from simulated snow stratigraphy and meteorological variables. This enabled us to comprehensively evaluate the impact of different climate scenarios on snow avalanche activity, investigate changes in seasonality, and highlight causes of projected changes beyond a mere decrease in snow depth or shortening of the snow season. Projections show that dry- and wet-snow avalanche activities respond differently to climate change and that the overall decrease in dry-snow avalanche activity during DJFMAM is partially compensated for by an increase in wet-snow avalanche activity. The strong projected decline in overall avalanche activity at lower-elevation stations (<2200 m a.s.l.) is in line with other studies (Castebrunet et al., 2014; Giacona et al., 2021), and our projections confirm that under unmitigated emissions, snow avalanches will eventually disappear from progressively higher elevations. While other studies have suggested a warming-induced increase in avalanche activity at high elevations (Lavigne et al., 2015; Ballesteros-Cánovas et al., 2018), our results do not confirm this trend, as the overall avalanche activity during DJFMAM either remains constant or decreases despite the increase in wet-snow AvDs. This discrepancy between our findings for high-elevation stations and those of Lavigne et al. (2015) for high-elevation regions in the French Alps may be attributed to (1) the inadequate representation of extreme events in our model chain, (2) differences in the time periods examined (past observations versus future projections), or (3) data inhomogeneity in the avalanche records used by Lavigne et al. (2015), which could result in misleading conclusions. The study by Ballesteros-Cánovas et al. (2018), based on tree ring analysis from a single slope in the western Himalayas, is not expected to be representative of conditions in the European Alps. Thus, further research is needed to better understand the impact of climate change on avalanche activity at high elevations.
Regarding the projected changes in snow stratigraphy, the warming-induced earlier appearance of melt forms and crusts and the resulting earlier onset of wet-snow avalanche activity are rather intuitive. Previous studies have found similar trends in projections of wet-snow avalanche activity (Lazar and Williams, 2008; Castebrunet et al., 2014) and snowpack simulations based on observations (Reuter et al., 2022). The projected decline in the proportion of persistent grain types within the DJF snowpack is however less straightforward to anticipate. Although the projected decrease in snow depth might suggest favorable conditions for faceting, the predominant influence appears to be the warmer air temperatures. Enhanced temperatures hinder the formation of weak layers by directly affecting the temperature gradient across the snowpack, primarily through the warming of the snow surface via sensible heat transfer from the warmer air. This increase in surface temperature reduces the temperature gradient between the snow surface and the base of the snowpack. A weaker temperature gradient results in less faceting of snow crystals (e.g., Colbeck, 1987). In a sensitivity study, Richter et al. (2020) demonstrated that higher air temperatures resulted in a lower proportion of layers with faceted crystals. Interestingly, Katsuyama et al. (2022) also found a decline in the proportion of persistent weak layers based on climate projections for northern Japan. To further improve our understanding of future avalanche activity, an important next step would be to analyze changes in the predominant grain types of the simulated weakest layers identified by the dry-snow instability model (Mayer et al., 2022), distinguishing between persistent and non-persistent weak layers. Moreover, analyzing the depths of the identified weak layers could yield information on changes in potential avalanche size.
Our projections of future avalanche activity are based on flat-field simulations of snow stratigraphy. Typically, during peak winter (December to February), snow profiles from flat study plots are fairly representative of the snow stratigraphy on west-, north-, and east-facing slopes. During this period, these slopes and flat sites receive relatively little incoming shortwave radiation, resulting in similar faceting processes. Jamieson et al. (2007) have demonstrated that trends of stability indices from flat-field study plots are useful for forecasting dry-snow slab avalanches in surrounding terrain. As the season progresses, differences in radiation become increasingly important. Towards spring, south-facing slopes experience earlier snowmelt and thus earlier transition to stable dry-snow and unstable wet-snow conditions compared to north-facing slopes due to differences in incoming radiation. The stratigraphy of flat fields can then be assumed to lie somewhere in between these two extremes. Therefore, we believe that our analysis of avalanche activity based on flat-field stratigraphy captures the general trend in future avalanche activity in the Swiss Alps. Future research should refine our projections by incorporating simulations on virtual slopes with different aspects. In this context, it is important to note that modeled dry-snow instability is most sensitive to precipitation (Richter et al., 2020), which does not vary between aspects except for the critical effects of wind-driven snow redistribution. Accounting for snow drift when analyzing future changes is particularly challenging, as climate projections for wind are typically very uncertain.
There are uncertainties inherent in all parts of our modeling workflow. Air temperature and precipitation are crucial parameters affecting dry- and wet-snow avalanches (Richter et al., 2020; Bellaire et al., 2017). Precipitation likely has the largest uncertainty in our model chain, stemming from the complex downscaling procedure (see Sect. 2.3). Beyond the downscaling methods, uncertainties also arise from the climate models, the avalanche activity models, and the internal variability of the climate system. The substantial variation in projected avalanche activity demonstrates the importance of using various GCM–RCM chains and RCP scenarios. Nevertheless, all ensemble members consistently projected a decrease in dry-snow AvDs for all stations and an increase in wet-snow AvDs for stations above 2300 m a.s.l. by the end of the century, suggesting that our results are robust.
The output of our model chain describes the probability of avalanche release in potential avalanche starting zones at the elevation of the weather stations. Processes along the avalanche path below the starting zones are not accounted for. Projected changes in avalanche activity therefore do not provide information about avalanche size or runout distance. Nonetheless, the projected decrease in snow depths and increased frequency of wetting events (as indicated by the higher proportion of melt forms) suggest that less snow will be present along the avalanche path, and after avalanche release a cold-to-warm flow regime transition will occur more frequently (Köhler et al., 2018). As a result, fewer avalanches are likely to reach valley bottoms since wet snow or bare ground slows down avalanches along their path, which is consistent with the observed increase in avalanche runout elevations in recent decades (Eckert et al., 2013). To quantify future trends in avalanche size and flow regimes, avalanche dynamics models (e.g., Christen et al., 2010; Li et al., 2021) should be driven with climate projections as demonstrated by Ortner et al. (2024).
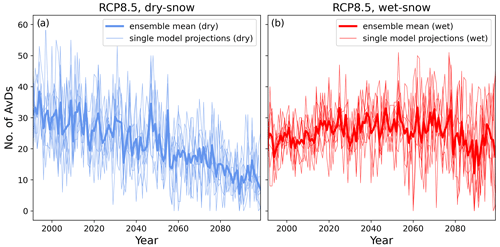
We emphasize that the presented results focus on changes in mean avalanche activity. The applied downscaling method does not fully account for changes in extreme precipitation, and the avalanche activity models do not predict the magnitude or intensity of the activity. Furthermore, by averaging results over 30-year periods (Figs. 3 and 4), inter-annual variations are averaged out. However, considering the results on a per-winter basis, there is substantial inter-annual variability in the number of AvDs (Appendix D, Fig. D3). This is not surprising, as avalanche activity is determined by the sequence of single weather events over the snow season rather than long-term climate means. In all climate scenarios, some winters at the end of the century are projected to have minimal or no dry-snow AvDs, a phenomenon not observed during the reference period. However, with rising wet-snow avalanche activity, the overall likelihood that winters will exceed the median number of AvDs during the reference period will range from roughly 40 % for RCP2.6 to 20 % for RCP8.5 (Fig. 6). Thus, despite significant warming, some winters will still experience high avalanche activity. To accurately project changes in extreme avalanche cycles, it will be necessary to use dynamically downscaled climate projections that resolve extreme precipitation events in mountain regions (e.g., Schär et al., 2020; Lucas-Picher et al., 2021).
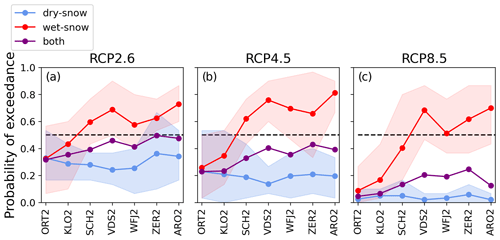
Figure 6Fraction of seasons in the EOC period (2070–2099) that exceeds the median number of AvDs per season (DJFMAM) in the REF period regarding dry-snow (blue), wet-snow (red), and dry- or wet-snow avalanche activity (purple) for the seven stations and different emission scenarios (RCP2.6 a, RCP4.5 b, and RCP8.5 c). The markers show the multi-model mean, and the shaded areas correspond to the full model spread. Markers between individual stations are connected for illustration purposes. Stations are arranged in order of increasing elevation, from the lowest (ORT2, 1824 m a.s.l.) to the highest (ARO2, 2847 m a.s.l.).
Projected changes in avalanche activity call for reviewing current avalanche risk mitigation procedures (Bründl and Margreth, 2021). Avalanche risk is determined by the exposure and vulnerability of an object to a specific avalanche hazard, where the latter is a function of the likelihood of triggering an avalanche and the destructive size of the avalanche (Bründl et al., 2009). In our analysis, we focused on the influence of climate change on the likelihood of triggering an avalanche, and as such we investigated only one component of avalanche risk. Decreasing dry-snow avalanche frequencies, as projected by our models, combined with a possible reduction in avalanche runout demonstrated in other studies (Eckert et al., 2013; Ortner et al., 2024) imply that hazard mapping procedures may need to be revisited. Nevertheless, updating existing hazard maps will demand more refined projections that accurately depict extreme avalanche events as outlined above.
Avalanche forecasting may become more challenging as patterns of avalanche activity change and unexpected, out-of-season events become more frequent. Experience gained so far may prove insufficient for forecasting and managing some future events, such as wet-snow avalanches during the high-winter season (DJF). Addressing such unfamiliar situations will require increased awareness and preparedness among avalanche forecasters and safety personnel. In this context, reliable avalanche prediction models, such as those used in this study or other recent alternatives (e.g., Pérez-Guillén et al., 2022; Viallon-Galinier et al., 2023), will become increasingly important. Finally, the anticipated decrease in the likelihood of persistent weak layer formation implies a reduced hazard potential with respect to accidental avalanches triggered by recreationists. Previous studies have indicated that most avalanches triggered by recreationists fail on persistent weak layers (Schweizer and Jamieson, 2001; Techel et al., 2015). However, the frequency of human-triggered avalanches depends on the number of recreationists in the backcountry and on their behavior. These factors may obscure the climate-related decrease in hazard potential for dry-snow avalanches, resulting in stationary accident rates (Strapazzon et al., 2021).
We quantified changes in avalanche activity throughout the 21st century for seven sites located at mid-to-high elevations (1800–2900 m a.s.l.) in the Swiss Alps using a comprehensive modeling approach. This method integrated downscaled climate scenarios, physics-based simulations of snow stratigraphy, and machine learning models to classify days with and without avalanche occurrence. Our findings revealed elevation-dependent patterns of change, indicating a decrease in the number of dry-snow AvDs alongside an increase in wet-snow AvDs at elevations above 2300 m a.s.l. for all emission scenarios. For the highest-emission scenario, RCP8.5, the number of dry-snow AvDs during DJFMAM is projected to continuously decline throughout the 21st century for all stations, reaching a relative decrease of 45 %–65 % by the end of the century. This change is attributable not only to the decrease in snowfall events but also to the decrease in layers with persistent grain types. On the other hand, projections under the same emission scenario (RCP8.5) indicate that the number of wet-snow avalanche days during DJFMAM at elevations above 2300 m a.s.l. will rise and peak during the latter half of the century, showing a relative increase of 10 %–30 %. Simulations indicated a shift of wet-snow activity to earlier winter months, driven by the increased frequency of wetting events. These results challenge simplistic assumptions about a consistent decline in avalanche occurrences due to diminishing snow cover, highlighting the importance of distinguishing between dry- and wet-snow avalanches.
While our results focus on the Swiss Alps, we anticipate changes in average avalanche activity will be comparable across much of the European Alps and other regions with similar avalanche climates and elevations relative to the average snow line. For example, this includes regions like the Columbia Mountains in western Canada, which are characterized by a transitional snow climate (Shandro and Haegeli, 2018). However, further simulations will have to confirm the transferability of our results. Additionally, future research should focus on changes at higher elevations, where measurements are currently lacking; account for changes in extreme precipitation; and investigate the impact on avalanche size. Dynamical downscaling methods will therefore be required to more accurately project changes in extreme weather events in mountain regions, and avalanche dynamics models should be employed to assess changes in avalanche flow regimes and impact pressures. While such detailed models will entail greater computational cost, they will refine our results and provide essential understanding for developing robust avalanche forecasting and mitigation procedures in a warming climate.
As avalanche activity is projected to change, avalanche risk mitigation procedures should be revisited regularly. At present, procedures such as hazard mapping assume stationary conditions when assessing the probability of extreme events. In view of the changing climate, i.e., transient rather than stationary conditions, it seems reasonable to review the procedures more frequently than in the past, for example every 10 years. Furthermore, given the projected seasonal changes in avalanche activity, so-called unexpected events may occur more frequently, calling for increased awareness and agile risk mitigation procedures.
Table A1Combinations of the GCMs, RCMs, and horizontal resolution of the eight climate model chains from the EURO-CORDEX ensemble used in this study. More details about these climate model chains can be found in Jacob et al. (2014).
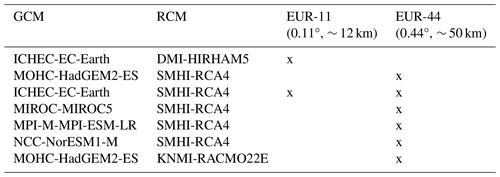
Table A2Settings used in the MELODIST library; see Förster et al. (2016) for details.
To downscale the CH2018 climate scenarios to the specific locations of the seven IMIS AWSs, robust historical time series of meteorological data corresponding to these stations were necessary. These time series should encompass all the essential parameters for driving the snow cover model SNOWPACK (precipitation, air temperature, incoming shortwave radiation, wind speed, relative humidity), aligning with the variables available in the climate scenarios. For the station WFJ2, a quality-checked dataset of meteorological measurements spanning the years 1999–2017 was available (Wever, 2017). For the other stations, we implemented the following steps using the data measured at the IMIS AWSs over the time period 2000–2022:
-
Pre-processing the raw data. First, each IMIS AWS was associated with a nearby SwissMetNet AWS. Data gaps in summer due to IMIS station maintenance were then manually filled with data from the SwissMetNet AWS. Snow depth measurements were cleaned using a high-frequency filter and a second filter implemented in the MeteoIO library (Bavay and Egger, 2014). Remaining gaps or peaks in snow depth were manually cleaned through linear interpolation. Inconsistent values of snow surface temperature, i.e., positive values when the snow depth was larger than 5 cm, were manually replaced with a value of −1 °C.
-
Deriving solid precipitation. Precipitation at the IMIS AWSs is only measured with unreliable rain gauges that are not heated. We therefore estimated solid precipitation values from SNOWPACK simulations driven with measured snow depth (Wever et al., 2015), employing an empirical relationship for new snow density as a function of air temperature, relative humidity, and wind speed (Schmucki et al., 2014).
-
Merging precipitation data. Solid precipitation estimated with SNOWPACK was merged with precipitation data from the nearby SwissMetNet AWSs using an air temperature threshold of 2 °C. Below this threshold, we used the solid precipitation from SNOWPACK; above this threshold, we used precipitation measurements from SwissMetNet. We opted for this approach as the precipitation data from SwissMetNet are reliable solely for liquid precipitation, given that the heated rain gauges encounter undercatch issues during snowy conditions. SNOWPACK forced with measured snow depth, on the other hand, can only retrieve solid precipitation.
-
Incoming shortwave radiation. At an IMIS AWS, incoming shortwave radiation (ISWR) is not measured. Instead, reflected shortwave radiation measurements are used to force SNOWPACK, and ISWR is derived using an estimated snow albedo. In summer, however, the ground albedo is more variable and mostly unknown, resulting in false estimates of ISWR. However, the downscaling schemes require time series spanning whole years. To circumvent this problem, we used ISWR measurements of the nearby SwissMetNet AWSs.
Note that due to uncertainties in the precipitation reconstruction and the simple transfer of ISWR, these time series should be regarded as representative of the area rather than the exact location of the AWSs.
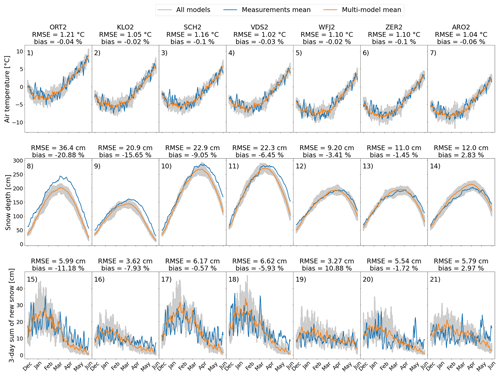
Figure C1Comparison of measured and modeled meteorological variables for each day for the months of December to May over the period 2001–2022 for the seven AWSs used in this study (one column per AWS). The blue lines indicate the daily mean values of the AWS measurements and resulting parameters from SNOWPACK simulations. The orange lines indicate the daily mean of the simulated variables from downscaled climate models and resulting parameters from SNOWPACK simulations for the RCP8.5 scenario. The gray-shaded areas indicate the spread of the eight climate ensemble members. Air temperature (1–7), snow depth (8–14), and 3 d sum of new snow height (15–21).
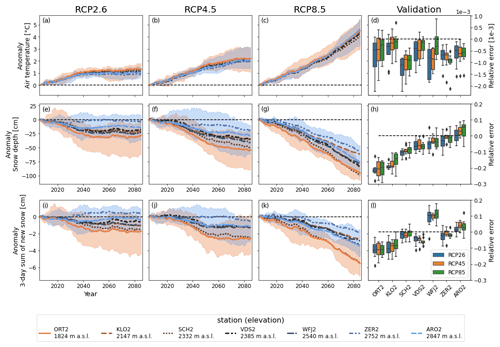
Figure C2Anomalies of air temperature (a, b, c), snow depth (e, f, g), and 3 d sum of new snow height (i, j, k) compared to the REF period for emission scenarios RCP2.6, RCP4.5, and RCP8.5. The lines show the multi-model mean of the respective variable (centered around the 30-year moving mean) for seven AWSs across the Swiss Alps. The shaded areas indicate the spread of the eight ensemble members for the highest and lowest AWSs. Station identification is facilitated by colors and line styles specified in the bottom legend. Validation of downscaled climate models (d, h, l) comparing variables based on climate simulations and resulting SNOWPACK output with AWS measurements and resulting SNOWPACK output for the winter seasons 2000/2001–2021/2022. The box and whisker plots show the variability within the eight ensemble members, where the line indicates the median, the box extends from the first to the third quartile, the whiskers extend to 1.5 times the interquartile range beyond the box limit, and the black diamonds show outliers.
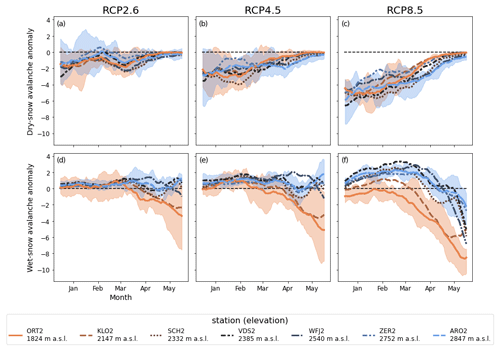
Figure D1Mean monthly dry- and wet-snow avalanche anomaly for the 2070–2099 period compared to the 1991–2020 period for RCP2.6 (a, d), RCP4.5 (b, e), and RCP8.5 (c, f). The lines show the multi-model mean for seven AWSs across the Swiss Alps. The shaded areas indicate the spread of the eight ensemble members for the highest and lowest AWSs. Station identification is facilitated by colors and line styles specified in the bottom legend.
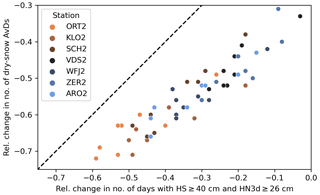
Figure D2Relative changes ((REF–EOC period)/REF) in the number of dry-snow AvDs under emission scenario RCP8.5 versus relative changes in the number of days with a snow depth (HS) of at least 40 cm and 3 d sum of new snow height (HN3d) of at least 26 cm under RCP8.5. The threshold HN3d = 26 cm must be exceeded for a day to be classified as AvD by the HN3d model in Mayer et al. (2023), which represents one component of the dry-snow model used in this study. The dots refer to individual climate model chains (eight per station), and the colors represent the different stations. The dashed black line represents the identity line.
Downscaled climate scenarios, SNOWPACK settings, and projections of avalanche activity are available at the EnviDat data repository https://doi.org/10.16904/envidat.549 (Mayer et al., 2024).
AvH and JS initiated the study, AM conducted the downscaling of climate projections, SM and BR ran the SNOWPACK simulations, and SM and MH applied the avalanche activity models and processed and analyzed the simulations. SM prepared the paper with contributions from all co-authors.
At least one of the (co-)authors is a member of the editorial board of The Cryosphere. The peer-review process was guided by an independent editor, and the authors also have no other competing interests to declare.
Publisher’s note: Copernicus Publications remains neutral with regard to jurisdictional claims made in the text, published maps, institutional affiliations, or any other geographical representation in this paper. While Copernicus Publications makes every effort to include appropriate place names, the final responsibility lies with the authors.
We thank Nicolas Eckert for providing useful advice on our paper. We thank the editor, Edward Bair, and the two anonymous reviewers for their thorough reviews, which contributed to improving our paper.
This work was partly funded by the WSL research program Climate Change Impacts on Alpine Mass Movements (CCAMM).
This paper was edited by Edward Bair and reviewed by two anonymous referees.
Baggi, S. and Schweizer, J.: Characteristics of wet-snow avalanche activity: 20 years of observations from a high alpine valley (Dischma, Switzerland), Nat. Hazards, 50, 97–108, https://doi.org/10.1007/s11069-008-9322-7, 2009. a
Bair, E., Simenhois, R., Birkeland, K., and Dozier, J.: A field study on failure of storm snow slab avalanches, Cold Reg. Sci. Technol., 79-80, 20–28, https://doi.org/10.1016/j.coldregions.2012.02.007, 2012. a
Ballesteros-Cánovas, J. A., Trappmann, D., Madrigal-González, J., Eckert, N., and Stoffel, M.: Climate warming enhances snow avalanche risk in the Western Himalayas, P. Natl. Acad. Sci. USA, 115, 3410–3415, https://doi.org/10.1073/pnas.1716913115, 2018. a, b, c
Bartelt, P. and Lehning, M.: A physical SNOWPACK model for the Swiss avalanche warning Part I: Numerical model, Cold Reg. Sci. Technol., 35, 123–145, https://doi.org/10.1016/S0165-232X(02)00074-5, 2002. a, b, c
Bavay, M. and Egger, T.: MeteoIO 2.4.2: a preprocessing library for meteorological data, Geosci. Model Dev., 7, 3135–3151, https://doi.org/10.5194/gmd-7-3135-2014, 2014. a
Bellaire, S., van Herwijnen, A., Mitterer, C., and Schweizer, J.: On forecasting wet-snow avalanche activity using simulated snow cover data, Cold Reg. Sci. Technol., 144, 28–38, https://doi.org/10.1016/j.coldregions.2017.09.013, 2017. a
Bergfeld, B., van Herwijnen, A., Bobillier, G., Rosendahl, P. L., Weißgraeber, P., Adam, V., Dual, J., and Schweizer, J.: Temporal evolution of crack propagation characteristics in a weak snowpack layer: conditions of crack arrest and sustained propagation, Nat. Hazards Earth Syst. Sci., 23, 293–315, https://doi.org/10.5194/nhess-23-293-2023, 2023. a
Birkeland, K. W.: Terminology and Predominant Processes Associated with the Formation of Weak Layers of Near-Surface Faceted Crystals in the Mountain Snowpack, Arctic Alpine Res., 30, 193–199, https://doi.org/10.2307/1552134, 1998. a
Bobillier, G., Bergfeld, B., Dual, J., Gaume, J., van Herwijnen, A., and Schweizer, J.: Micro-mechanical insights into the dynamics of crack propagation in snow fracture experiments, Scientific Reports, 11, 11711, https://doi.org/10.1038/s41598-021-90910-3, 2021. a
Bründl, M. and Margreth, S.: Integrative risk management: The example of snow avalanches, in: Snow and ice-related hazards, risks, and disasters (Second Edition), Elsevier, Amsterdam, Netherlands, 259–296, https://doi.org/10.1016/B978-0-12-817129-5.00002-0, 2021. a
Bründl, M., Romang, H. E., Bischof, N., and Rheinberger, C. M.: The risk concept and its application in natural hazard risk management in Switzerland, Nat. Hazards Earth Syst. Sci., 9, 801–813, https://doi.org/10.5194/nhess-9-801-2009, 2009. a
Bründl, M., Hafner, E., Bebi, P., Bühler, Y., Margreth, S., Marty, C., Schaer, M., Stoffel, L., Techel, F., Winkler, K., Zweifel, B., and Schweizer, J.: Ereignisanalyse Lawinensituation im Januar 2018, WSL Berichte, 76, WSL Institute for Snow and Avalanche Research SLF, 162 pp., https://www.dora.lib4ri.ch/wsl/islandora/object/wsl:19842 (last access: November 2024), 2019. a
Calonne, N., Richter, B., Löwe, H., Cetti, C., ter Schure, J., Van Herwijnen, A., Fierz, C., Jaggi, M., and Schneebeli, M.: The RHOSSA campaign: multi-resolution monitoring of the seasonal evolution of the structure and mechanical stability of an alpine snowpack , The Cryosphere, 14, 1829–1848, https://doi.org/10.5194/tc-14-1829-2020, 2020. a
Cannon, A. J.: Multivariate quantile mapping bias correction: an N-dimensional probability density function transform for climate model simulations of multiple variables, Clim. Dynam., 50, 31–49, https://doi.org/10.1007/s00382-017-3580-6, 2018. a, b, c, d
Carmona, F., Rivas, R., and Caselles, V.: Estimation of daytime downward longwave radiation under clear and cloudy skies conditions over a sub-humid region, Theoretical and Applied Climatology, 115, 281–295, https://doi.org/10.1007/s00704-013-0891-3, 2014. a
Castebrunet, H., Eckert, N., Giraud, G., Durand, Y., and Morin, S.: Projected changes of snow conditions and avalanche activity in a warming climate: the French Alps over the 2020–2050 and 2070–2100 periods, The Cryosphere, 8, 1673–1697, https://doi.org/10.5194/tc-8-1673-2014, 2014. a, b, c, d
CH2018: CH2018 – Climate Scenarios for Switzerland, Tech. Rep., MeteoSwiss, Eidgenössische Technische Hochschule Zürich (ETH), University of Bern (Unibe), National Centre for Climate Services (NSSC) and Swiss Academy of Science (scnat), ISBN 978-3-9525031-4-0, 2018. a, b, c, d, e
Christen, M., Kowalski, J., and Bartelt, P.: RAMMS: Numerical simulation of dense snow avalanches in three-dimensional terrain, Cold Reg. Sci. Technol., 63, 1–14, https://doi.org/10.1016/j.coldregions.2010.04.005, 2010. a
Colbeck, S.: An Overview of Seasonal Snow Metamorphism, Rev. Geophys., 20, 45–61, 1982. a
Colbeck, S. C.: Snow Metamorphism and Classification, in: Seasonal Snowcovers: Physics, Chemistry, Hydrology. NATO ASI Series, edited by: Jones, H. G., Orville-Thomas, W. J., Springer, Dordrecht, 211, 1–35, https://doi.org/10.1007/978-94-009-3947-9_1, 1987. a
Conway, H. and Raymond, C. F.: Snow stability during rain, J. Glaciol., 39, 635–642, https://doi.org/10.3189/S0022143000016531, 1993. a
Davies, J. H. and Davies, D. R.: Earth's surface heat flux, Solid Earth, 1, 5–24, https://doi.org/10.5194/se-1-5-2010, 2010. a
Eckert, N., Keylock, C. J., Castebrunet, H., Lavigne, A., and Naaim, M.: Temporal trends in avalanche activity in the French Alps and subregions: from occurrences and runout altitudes to unsteady return periods, J. Glaciol., 59, 93–114, https://doi.org/10.3189/2013jog12j091, 2013. a, b, c
Eckert, N., Corona, C., Giacona, F., Gaume, J., Mayer, S., van Herwijnen, A., Hagenmuller, P., and Stoffel, M.: Climate change impacts on snow avalanche activity and related risks, Nature Reviews Earth & Environment, 5, 369–389, https://doi.org/10.1038/s43017-024-00540-2, 2024. a
Favillier, A., Guillet, S., Lopez-Saez, J., Giacona, F., Eckert, N., Zenhäusern, G., Peiry, J., Stoffel, M., and Corona, C.: Identifying and interpreting regional signals in tree-ring based reconstructions of snow avalanche activity in the Goms valley (Swiss Alps), Quaternary Sci. Rev., 307, 108063, https://doi.org/10.1016/j.quascirev.2023.108063, 2023. a
Feigenwinter, I., Kotlarski, S., Casanueva, A., Fischer, A. M., Schwierz, C., Liniger, M. A.: Exploring quantile mapping as a tool to produce user-tailored climate scenarios for Switzerland, Technical Report MeteoSwiss, 270, 44 pp., https://www.meteoswiss.admin.ch/dam/jcr:1b810050-11a2-415d-b439-3b2eb75f9693/MeteoSchweiz_Fachbericht_270_final.pdf (last access: November 2024), 2018. a
Fierz, C., Armstrong, R., Durand, Y., Etchevers, P., Greene, E., McClung, D., Nishimura, K., Satyawali, P., and Sokratov, S.: The international classification for seasonal snow on the ground, HP-VII Technical Document in Hydrology, 83, UNESCO-IHP, Paris, France, 90 pp., https://unesdoc.unesco.org/ark:/48223/pf0000186462 (last access: November 2024), 2009. a, b
Förster, K., Hanzer, F., Winter, B., Marke, T., and Strasser, U.: An open-source MEteoroLOgical observation time series DISaggregation Tool (MELODIST v0.1.1), Geosci. Model Dev., 9, 2315–2333, https://doi.org/10.5194/gmd-9-2315-2016, 2016. a, b
Fyfe, J. C., Derksen, C., Mudryk, L., Flato, G. M., Santer, B. D., Swart, N. C., Molotch, N. P., Zhang, X., Wan, H., Arora, V. K., Scinocca, J., and Jiao, Y.: Large near-term projected snowpack loss over the western United States, Nat. Commun., 14996, https://doi.org/10.1038/ncomms14996, 2017. a
García-Hernández, C., Ruiz-Fernández, J., Sánchez-Posada, C., Pereira, S., Oliva, M., and Vieira, G.: Reforestation and land use change as drivers for a decrease of avalanche damage in mid-latitude mountains (NW Spain), Global Planet. Change, 153, 35–50, https://doi.org/10.1016/j.gloplacha.2017.05.001, 2017. a
Gehrig-Fasel, J., Guisan, A., and Zimmermann, N. E.: Tree line shifts in the Swiss Alps: Climate change or land abandonment?, J. Veg. Sci., 18, 571–582, https://doi.org/10.1111/j.1654-1103.2007.tb02571.x, 2007. a
Giacona, F., Eckert, N., Corona, C., Mainieri, R., Morin, S., Stoffel, M., Martin, B., and Naaim, M.: Upslope migration of snow avalanches in a warming climate, P. Natl. Acad. Sci. USA, 118, e2107306118, https://doi.org/10.1073/pnas.2107306118, 2021. a, b
Gudmundsson, L., Bremnes, J. B., Haugen, J. E., and Engen-Skaugen, T.: Downscaling RCM precipitation to the station scale using statistical transformations–a comparison of methods, Hydrology and Earth System Sciences, 16, 3383–3390, 2012. a
Helbig, N. and van Herwijnen, A.: Subgrid parameterization for snow depth over mountainous terrain from flat field snow depth, Water Resour. Res., 53, 1444–1456, https://doi.org/10.1002/2016WR019872, 2017. a
Hendrick, M., Techel, F., Volpi, M., Olevski, T., Pérez-Guillén, C., van Herwijnen, A., and Schweizer, J.: Automated prediction of wet-snow avalanche activity in the Swiss Alps, J. Glaciol., 69, 1–14, https://doi.org/10.1017/jog.2023.24, 2023. a, b, c, d
Horton, S., Bellaire, S., and Jamieson, B.: Modelling the formation of surface hoar layers and tracking post-burial changes for avalanche forecasting, Cold Reg. Sci. Technol., 97, 81–89, https://doi.org/10.1016/j.coldregions.2013.06.012, 2014. a
Intergovernmental Panel on Climate Change (IPCC): High Mountain Areas’, in The Ocean and Cryosphere in a Changing Climate: Special Report of the Intergovernmental Panel on Climate Change, Cambridge University Press, Cambridge, 131–202, 2022. a, b
Jacob, D., Petersen, J., Eggert, B., Alias, A., Christensen, O. B., Bouwer, L. M., Braun, A., Colette, A., Déqué, M., Georgievski, G., Georgopoulou, E., Gobiet, A., Menut, L., Nikulin, G., Haensler, A., Hempelmann, N., Jones, C., Keuler, K., Kovats, S., Kröner, N., Kotlarski, S., Kriegsmann, A., Martin, E., van Meijgaard, E., Moseley, C., Pfeifer, S., Preuschmann, S., Radermacher, C., Radtke, K., Rechid, D., Rounsevell, M., Samuelsson, P., Somot, S., Soussana, J.-F., Teichmann, C., Valentini, R., Vautard, R., Weber, B., and Yiou, P.: EURO-CORDEX: new high-resolution climate change projections for European impact research, Reg. Environ. Change, 14, 563–578, https://doi.org/10.1007/s10113-013-0499-2, 2014. a, b
Jamieson, B., Zeidler, A., and Brown, C.: Explanation and limitations of study plot stability indices for forecasting dry snow slab avalanches in surrounding terrain, Cold Reg. Sci. Technol., 50, 23–34, https://doi.org/10.1016/j.coldregions.2007.02.010, 2007. a, b
Katsuyama, Y., Katsushima, T., and Takeuchi, Y.: Large-ensemble climate simulations to assess changes in snow stability over northern Japan, J. Glaciol., 69, 577–590, https://doi.org/10.1017/jog.2022.85, 2022. a, b, c
Kendall, M. G.: Rank correlation methods., Oxford Univ. Press, 1975. a
Köhler, A., Fischer, J.-T., Scandroglio, R., Bavay, M., McElwaine, J., and Sovilla, B.: Cold-to-warm flow regime transition in snow avalanches, The Cryosphere, 12, 3759–3774, https://doi.org/10.5194/tc-12-3759-2018, 2018. a
Kotlarski, S.: Quantile Mapping for the CH2018 Swiss Climate Scenarios: qmCH2018 v1.0.1, Zenodo [code], https://doi.org/10.5281/zenodo.3275571, 2019. a
Kotlarski, S., Gobiet, A., Morin, S., Olefs, M., Rajczak, J., and Samacoits, R.: 21st Century alpine climate change, Clim. Dynam., 60, 65–86, https://doi.org/10.1007/s00382-022-06303-3, 2023. a
Laternser, M. and Schneebeli, M.: Temporal trend and spatial distribution of avalanche activity during the last 50 years in Switzerland, Nat. Hazards, 27, 201–230, https://doi.org/10.1023/A:1020327312719, 2002. a
Lavigne, A., Eckert, N., Bel, L., and Parent, E.: Adding expert contributions to the spatiotemporal modelling of avalanche activity under different climatic influences, J. R. Stat. Soc. C-Appl., 64, 651–671, https://doi.org/10.1111/rssc.12095, 2015. a, b, c, d
Lazar, B. and Williams, M.: Climate change in western ski areas: Potential changes in the timing of wet avalanches and snow quality for the Aspen ski area in the years 2030 and 2100, Cold Reg. Sci. Technol., 51, 219–228, https://doi.org/10.1016/j.coldregions.2007.03.015, 2008. a, b, c
Lehning, M., Bartelt, P., and Brown, B.: SNOWPACK model calculations for avalanche warning based upon a new network of weather and snow stations, Cold Reg. Sci. Technol., 30, 145–157, https://doi.org/10.1016/S0165-232X(99)00022-1, 1999. a
Lehning, M., Fierz, C., and Lundy, C.: An objective snow profile comparison method and its application to SNOWPACK, Cold Reg. Sci. Technol., 33, 253–261, https://doi.org/10.1016/S0165-232X(01)00044-1, 2001. a
Lehning, M., Bartelt, P., Brown, R., and Fierz, C.: A physical SNOWPACK model for the Swiss avalanche warning; Part III: meteorological forcing, thin layer formation and evaluation, Cold Reg. Sci. Technol., 35, 169–184, https://doi.org/10.1016/S0165-232X(02)00072-1, 2002a. a, b
Lehning, M., Bartelt, P., Brown, R., Fierz, C., and Satyawali, P.: A physical SNOWPACK model for the Swiss avalanche warning; Part II. Snow microstructure, Cold Reg. Sci. Technol., 35, 147–167, https://doi.org/10.1016/S0165-232X(02)00073-3, 2002b. a, b, c
Li, X., Sovilla, B., Jiang, C., and Gaume, J.: Three-dimensional and real-scale modeling of flow regimes in dense snow avalanches, Landslides, 18, 3393–3406, 2021. a
Lucas-Picher, P., Argüeso, D., Brisson, E., Tramblay, Y., Berg, P., Lemonsu, A., Kotlarski, S., and Caillaud, C.: Convection-permitting modeling with regional climate models: Latest developments and next steps, WIRES Clim. Change, 12, e731, https://doi.org/10.1002/wcc.731, 2021. a
Mann, H.: Nonparametric tests against trend, Econometrica, 13, 245–259, https://doi.org/10.2307/1907187, 1945. a
Matiu, M., Crespi, A., Bertoldi, G., Carmagnola, C. M., Marty, C., Morin, S., Schöner, W., Cat Berro, D., Chiogna, G., De Gregorio, L., Kotlarski, S., Majone, B., Resch, G., Terzago, S., Valt, M., Beozzo, W., Cianfarra, P., Gouttevin, I., Marcolini, G., Notarnicola, C., Petitta, M., Scherrer, S. C., Strasser, U., Winkler, M., Zebisch, M., Cicogna, A., Cremonini, R., Debernardi, A., Faletto, M., Gaddo, M., Giovannini, L., Mercalli, L., Soubeyroux, J.-M., Sušnik, A., Trenti, A., Urbani, S., and Weilguni, V.: Observed snow depth trends in the European Alps: 1971 to 2019, The Cryosphere, 15, 1343–1382, https://doi.org/10.5194/tc-15-1343-2021, 2021. a
Mayer, S., van Herwijnen, A., Techel, F., and Schweizer, J.: A random forest model to assess snow instability from simulated snow stratigraphy, The Cryosphere, 16, 4593–4615, https://doi.org/10.5194/tc-16-4593-2022, 2022. a, b, c
Mayer, S., Techel, F., Schweizer, J., and van Herwijnen, A.: Prediction of natural dry-snow avalanche activity using physics-based snowpack simulations, Nat. Hazards Earth Syst. Sci., 23, 3445–3465, https://doi.org/10.5194/nhess-23-3445-2023, 2023. a, b, c, d, e, f, g
Mayer, S., Hendrick, M., Richter, B., and Michel, A.: 21st century projections of dry- and wet-snow avalanche activity, EnviDat [data set], https://doi.org/10.16904/envidat.549, 2024. a
Meyer, J., Kohn, I., Stahl, K., Hakala, K., Seibert, J., and Cannon, A. J.: Effects of univariate and multivariate bias correction on hydrological impact projections in alpine catchments, Hydrol. Earth Syst. Sci., 23, 1339–1354, https://doi.org/10.5194/hess-23-1339-2019, 2019. a
Michel, A., Varun, S., Lehning, M., and Huwald, H.: Climate change scenarios at hourly time-step over Switzerland from an enhanced temporal downscaling approach, Int. J. Climatol., 41, 3503–3522, https://doi.org/10.1002/joc.7032, 2021. a, b
Mitterer, C. and Schweizer, J.: Analysis of the snow-atmosphere energy balance during wet-snow instabilities and implications for avalanche prediction, The Cryosphere, 7, 205–216, https://doi.org/10.5194/tc-7-205-2013, 2013. a
Mock, C. and Birkeland, K.: Snow avalanche climatology of the Western United States mountain ranges, B. Am. Meteorol. Soc., 81, 2367–2392, https://doi.org/10.1175/1520-0477(2000)081<2367:SACOTW>2.3.CO;2, 2000. a
Mote, P. W., Li, S., Lettenmaier, D. P., Xiao, M., and Engel, R.: Dramatic declines in snowpack in the western US, Npj Climate and Atmospheric Science, 1, 2, https://doi.org/10.1038/s41612-018-0012-1, 2018. a
Naaim, M., Eckert, N., Giraud, G., Faug, T., Chambon, G., Naaim-Bouvet, F., and Richard, D.: Impact du réchauffement climatique sur l'activité avalancheuse et multiplication des avalanches humides dans les Alpes françaises, La Houille Blanche, 102, 12–20, https://doi.org/10.1051/lhb/2016055, 2016. a
Ortner, G., Michel, A., Spieler, M. B. A., Christen, M., Bühler, Y., Bründl, M., and Bresch, D. N.: A novel approach for bridging the gap between climate change scenarios and avalanche hazard indication mapping, Cold Reg. Sci. Technol., 230, 104355, https://doi.org/10.1016/j.coldregions.2024.104355, 2024. a, b, c
Peitzsch, E. H., Pederson, G. T., Birkeland, K. W., Hendrikx, J., and Fagre, D. B.: Climate drivers of large magnitude snow avalanche years in the US northern Rocky Mountains, Scientific Reports, 11, 10032, https://doi.org/10.1038/s41598-021-89547-z, 2021. a
Pérez-Guillén, C., Techel, F., Hendrick, M., Volpi, M., van Herwijnen, A., Olevski, T., Obozinski, G., Pérez-Cruz, F., and Schweizer, J.: Data-driven automated predictions of the avalanche danger level for dry-snow conditions in Switzerland, Nat. Hazards Earth Syst. Sci., 22, 2031–2056, https://doi.org/10.5194/nhess-22-2031-2022, 2022. a
Pielmeier, C., Techel, F., Marty, C. and Stucki, T.: Wet snow avalanche activity in the Swiss Alps – trend analysis for mid-winter season, in: Proceedings ISSW 2013, edited by: Naaim-Bouvet, F., Durand, Y., and Lambert, R., International Snow Science Workshop, 7–11 October 2013, Grenoble, France, ANENA, IRSTEA, Météo-France, Grenoble, France, 1240–1246, https://arc.lib.montana.edu/snow-science/objects/ISSW13_paper_P4-47.pdf (last access: November 2024), 2013. a
Rajczak, J., Kotlarski, S., Salzmann, N., and Schär, C.: Robust climate scenarios for sites with sparse observations: a two-step bias correction approach, Int. J. Climatol., 36, 1226–1243, https://doi.org/10.1002/joc.4417, 2016. a
Reuter, B., Viallon-Galinier, L., Horton, S., van Herwijnen, A., Mayer, S., Hagenmuller, P., and Morin, S.: Characterizing snow instability with avalanche problem types derived from snow cover simulations, Cold Reg. Sci. Technol., 194, 103462, https://doi.org/10.1016/j.coldregions.2021.103462, 2022. a
Richter, B., Schweizer, J., Rotach, M. W., and van Herwijnen, A.: Validating modeled critical crack length for crack propagation in the snow cover model SNOWPACK, The Cryosphere, 13, 3353–3366, https://doi.org/10.5194/tc-13-3353-2019, 2019. a
Richter, B., van Herwijnen, A., Rotach, M. W., and Schweizer, J.: Sensitivity of modeled snow stability data to meteorological input uncertainty, Nat. Hazards Earth Syst. Sci., 20, 2873–2888, https://doi.org/10.5194/nhess-20-2873-2020, 2020. a, b, c, d
Savage, S., Peitzsch, E., Trautman, S., and VandenBos, B.: Forecasting for dry and wet avalanches during mixed rain and snow storm, in: Proceedings of International Snow Science Workshop, Innsbruck, Austria, 1040–1044, 2018. a
Schär, C., Fuhrer, O., Arteaga, A., Ban, N., Charpilloz, C., Girolamo, S. D., Hentgen, L., Hoefler, T., Lapillonne, X., Leutwyler, D., Osterried, K., Panosetti, D., Rüdisühli, S., Schlemmer, L., Schulthess, T. C., Sprenger, M., Ubbiali, S., and Wernli, H.: Kilometer-Scale Climate Models: Prospects and Challenges, B. Am. Meteorol. Soc., 101, E567–E587, https://doi.org/10.1175/BAMS-D-18-0167.1, 2020. a
Schmucki, E., Marty, C., Fierz, C., and Lehning, M.: Evaluation of modelled snow depth and snow water equivalent at three contrasting sites in Switzerland using SNOWPACK simulations driven by different meteorological data input, Cold Reg. Sci. Technol., 99, 27–37, https://doi.org/10.1016/j.coldregions.2013.12.004, 2014. a
Schweizer, J. and Jamieson, J.: Snow cover properties for skier triggering of avalanches, Cold Reg. Sci. Technol., 33, 207–221, 2001. a
Schweizer, J., Jamieson, J., and Schneebeli, M.: Snow avalanche formation, Rev. Geophys., 41, https://doi.org/10.1029/2002RG000123, 2003. a
Schweizer, J., Knappe, L., Reuter, B., and Mayer, S.: On snow and avalanche climates in the Swiss Alps, in: Proceedings ISSW 2024, International Snow Science Workshop, 23–29 September 2024, Tromsø, Norway, 198–203, https://arc.lib.montana.edu/snow-science/objects/ISSW2024_P1.21.pdf (last access: November 2024), 2024. a
Shandro, B. and Haegeli, P.: Characterizing the nature and variability of avalanche hazard in western Canada, Nat. Hazards Earth Syst. Sci., 18, 1141–1158, https://doi.org/10.5194/nhess-18-1141-2018, 2018. a
SLF: Description of automated stations, https://www.slf.ch/en/avalanche-bulletin-and-snow-situation/measured-values/description-of-automated-stations.html, last access: 6 January 2022. a
Smith, T. and Bookhagen, B.: Changes in seasonal snow water equivalent distribution in High Mountain Asia (1987 to 2009), Science Advances, 4, e1701550, https://doi.org/10.1126/sciadv.1701550, 2018. a
Stocker, T., Qin, D., Plattner, G.-K., Tignor, M., Allen, S., Boschung, J., Nauels, A., Xia, Y., Bex, V., and Midgley, P. (Eds.): Climate Change 2013: The Physical Science Basis. Contribution of Working Group I to the Fifth Assessment Report of the Intergovernmental Panel on Climate Change, Cambridge University Press, Cambridge, United Kingdom and New York, NY, USA, ISBN 978-1-107-66182-0, https://www.ipcc.ch/report/ar5/wg1/ (last access: March 2024), 2013. a
Strapazzon, G., Schweizer, J., Chiambretti, I., Maeder, M. B., Brugger, H., and Zafren, K.: Effects of Climate Change on Avalanche Accidents and Survival, Front. Physiol., 12, 639433, https://doi.org/10.3389/fphys.2021.639433, 2021. a
Techel, F., Zweifel, B., and Winkler, K.: Analysis of avalanche risk factors in backcountry terrain based on usage frequency and accident data in Switzerland, Nat. Hazards Earth Syst. Sci., 15, 1985–1997, https://doi.org/10.5194/nhess-15-1985-2015, 2015. a
Teich, M., Zurbriggen, N., Bartelt, P., Grêt-Regamey, A., Marty, C., Ulrich, M., and Bebi, P.: Potential impacts of climate change on snow avalanches starting in forested terrain, in: Proceedings ISSW 2012. International Snow Science Workshop, 16–21 September 2012, Anchorage AK, USA, 244–251, https://arc.lib.montana.edu/snow-science/objects/issw-2012-224-251.pdf (last access: November 2024), 2012. a
Terzago, S., von Hardenberg, J., Palazzi, E., and Provenzale, A.: Snowpack changes in the Hindu Kush–Karakoram–Himalaya from CMIP5 Global Climate Models, J. Hydrometeorol., 15, 2293–2313, 2014. a
Verfaillie, D., Lafaysse, M., Déqué, M., Eckert, N., Lejeune, Y., and Morin, S.: Multi-component ensembles of future meteorological and natural snow conditions for 1500 m altitude in the Chartreuse mountain range, Northern French Alps, The Cryosphere, 12, 1249–1271, https://doi.org/10.5194/tc-12-1249-2018, 2018. a
Viallon-Galinier, L., Hagenmuller, P., and Eckert, N.: Combining modelled snowpack stability with machine learning to predict avalanche activity, The Cryosphere, 17, 2245–2260, https://doi.org/10.5194/tc-17-2245-2023, 2023. a
Wever, N.: WFJ_MOD: Meteorological and snowpack measurements from Weissfluhjoch, Davos, Switzerland, EnviDat [data set], https://doi.org/10.16904/1, 2017. a
Wever, N., Schmid, L., Heilig, A., Eisen, O., Fierz, C., and Lehning, M.: Verification of the multi-layer SNOWPACK model with different water transport schemes, The Cryosphere, 9, 2271–2293, https://doi.org/10.5194/tc-9-2271-2015, 2015. a
- Abstract
- Introduction
- Data and methods
- Validation
- Results
- Discussion
- Conclusions
- Appendix A: Climate scenarios
- Appendix B: Historical time series of meteorological data
- Appendix C: Validation
- Appendix D: Projections of avalanche activity
- Data availability
- Author contributions
- Competing interests
- Disclaimer
- Acknowledgements
- Financial support
- Review statement
- References


