the Creative Commons Attribution 4.0 License.
the Creative Commons Attribution 4.0 License.
Accumulation by avalanches as a significant contributor to the mass balance of a peripheral glacier of Greenland
Bernhard Hynek
Daniel Binder
Michele Citterio
Signe Hillerup Larsen
Jakob Abermann
Geert Verhoeven
Elke Ludewig
Wolfgang Schöner
Greenland's peripheral glaciers are losing mass at an accelerated rate and are contributing significantly to sea level rise, but only a few direct observations are available. In this study, we use the unique combination of high-resolution remote sensing data and direct mass balance observations to quantify the contribution of a singular avalanche event to the mass balance of Freya Glacier (74.38° N, 20.82° W), a small (5.5 km2, 2021) mountain glacier in Northeast Greenland. Elevation changes calculated from repeated photogrammetric surveys in August 2013 and July 2021 show a high spatial variability, ranging from −11 to 18 m, with a glacier-wide mean of 1.56 ± 0.10 m (1.33 ± 0.21 m w.e.). After applying a seasonal correction of −0.6 ± 0.05 m w.e., the geodetic mass balance over the entire 8-year period (2013–2014 to 2020–2021) is found to be 0.73 ± 0.22 m w.e. A significant influence over the near-decadal mass balance stems from the exceptional winter mass balance of 2017–2018, which was 2.5 standard deviations above average (1.89 ± 0.05 m w.e.). After heavy snowfall in mid-February 2018, snow avalanches from the surrounding slopes affected more than one-third of the glacier surface and contributed 0.35 ± 0.04 m w.e., which is close to 20 % of the total winter mass balance of 2017–2018. Remote sensing data show that Freya Glacier is also prone to avalanches in other years but to a lesser spatial extent. Due to a gap in mass balance point observations caused by high accumulation rates (buried stakes) and the COVID-19 pandemic, the recently reported glacier-wide annual mass balances are rather crude estimates and show a negative bias of −0.22 m w.e. a−1 compared to the geodetic mass balance. Finally, we speculate that the projected future warming may increase the likelihood of extreme snowfall, thus potentially increasing the contribution of snow avalanches to the mass balance of mountain glaciers in Northeast Greenland.
- Article
(13660 KB) - Full-text XML
-
Supplement
(2014 KB) - BibTeX
- EndNote
The ice cover of Greenland consists of the Greenland Ice Sheet and approximately 20 300 peripheral glaciers (Abermann et al., 2019b; Rastner et al., 2012). Although Greenland's peripheral glaciers comprise only 4 % of the total ice cover of Greenland, their recent contribution to mass loss from Greenland (11 %) and to global sea level rise is disproportionately high compared to that of the ice sheet (Khan et al., 2022). This confirms their higher sensitivity to current climate change. During the last 60 years, mass loss from Greenland's peripheral glaciers has comprised ∼8 % of the world's land ice contribution to sea level rise (Frederikse et al., 2020; Zemp et al., 2019).
While the overall mass loss from Greenland's peripheral glaciers has accelerated over the last 2 decades, the pattern is heterogeneous on a regional scale (Hugonnet et al., 2021). In Northeast Greenland specifically, the mass loss has decelerated, with continued thinning at lower elevations and thickening at higher elevations (Khan et al., 2022). The decelerated mass loss in Northeast Greenland has been associated with an increase in precipitation (Hugonnet et al., 2021), whereas the reduced mass loss of Icelandic and Scandinavian glaciers, for example, has been associated with North Atlantic cooling (Noël et al., 2022).
However, our knowledge of the individual drivers of mass changes in Greenland's peripheral glaciers is limited as direct observations and process studies are scarce. Machguth et al. (2016b) compiled all reported mass balance observations in Greenland and showed that, while mass balance observations on the ice sheet have increased 10-fold, the peripheral glaciers are still heavily undersampled despite their topographical and climatological complexity. To our knowledge, currently, only 6 out of 20 300 glaciers and ice caps in Greenland are monitored (Abermann et al., 2019b). Three of these are located on the 2600 km long eastern coast: Mittivakkat Glacier on Ammassalik Island (65° N) (Mernild et al., 2013; Yde et al., 2014) and the AP Olsen Ice Cap (Larsen et al., 2024) and Freya Glacier (both at 74° N near Zackenberg Research Station).
The mass balance monitoring at Freya Glacier has been carried out using the direct or glaciological method (Kaser et al., 2003; Østrem and Brugmann, 1991), which is based on various point observations of ablation and accumulation distributed over different elevations on the glacier. These point observations of mass change are then extrapolated to estimate the annual mass balance of the entire glacier, often incorporating additional information such as the position of the snow line. However, the specific implementation of this step may vary among glaciers and observers (Zemp et al., 2013) and also depends on the number and distribution of available point measurements. Annual mass balance measurements are likely to accumulate systematic errors over the years (e.g. Huss et al., 2009); therefore, it is recommended that one compare and, if necessary, homogenise the annual mass balance time series using decadal volume changes based on geodetic surveys of the glacier surface (Huss et al., 2009; Klug et al., 2018; Zemp et al., 2013). On Freya Glacier, these geodetic surveys were carried out in 2013 and 2021 using an image-based 3D surface modelling (IBM) approach.
In the last decade, hybrid photogrammetric computer-vision-based approaches have become commonplace in many academic fields. With photogrammetric methods at their core, these hybrid approaches mainly rely on the computer vision algorithms Structure from Motion (SfM) and Multi-View Stereo (MVS) to digitally extract three-dimensional (3D) surfaces from overlapping images. These 3D surfaces can then be used to produce accurate orthophotos. Often, such SfM–MVS approaches utilise terrestrial photographs acquired with consumer-grade cameras (Piermattei et al., 2015; Marcer et al., 2017) or images obtained via cameras mounted on uncrewed aerial vehicles (UAVs) (e.g. Gindraux et al., 2017; Rossini et al., 2018; Geissler et al., 2021).
Interestingly, there are only a few studies on the contribution of snow avalanches to the mass balance of glaciers despite the apparent importance of this accumulation process. Glaciers with considerable accumulation from avalanches have been associated with high and steep headwalls typical for High Mountain Asia (Laha et al., 2017). Kneib et al. (2024b) showed that a lot of glaciers in the European Alps are also avalanche fed. In the Arctic, rising temperatures may increase the number and intensity of snowfall events, as observed over NE Greenland in 2018 (e.g. Schmidt et al., 2019), which will, in turn, enhance avalanche activity (Abermann et al., 2019a). However, the contribution of avalanches to the mass balance of individual glaciers is difficult to measure; therefore, this has been quantified by applying precipitation factors locally at the base of headwalls to fit the observed ice flux (Laha et al., 2017; Kneib et al., 2024a; Laha et al., 2017).
This study examines the effects of an extraordinary winter accumulation combined with widespread avalanche activity on the mass balance of a High Arctic mountain glacier. In particular, we quantify the contribution of avalanches to the winter mass balance (2017–2018) of Freya Glacier by taking advantage of a detailed ground penetration radar survey of snow depth conducted in April 2018. Furthermore, we demonstrate the imprint of avalanches on high-resolution glacier elevation changes (2013–2021).
We calculate IBM-derived elevation changes and deduce the geodetic mass balance of Freya Glacier between 2013–2014 and 2020–2021. We delineate snow avalanche deposits on the glacier area from February 2018, quantify their mass contribution to the winter mass balance of 2017–2018, and show their imprint on the multi-year geodetic mass balance. Finally, we compare the geodetic mass balance to the cumulative glaciological mass balance, discuss likely error sources with regard to the discrepancy, and emphasise the need for a reanalysis of the glaciological record. This need arises due to the observational gaps caused by travel restrictions during the COVID-19 pandemic and a limited observational network that proved to be insufficient in accounting for the recent spatial variability of surface mass balance on the glacier.
Freya (Freja, Fröya1) Glacier (74 38° N, 20.82° W) is a polythermal mountain glacier (Binder et al., 2009) located on Clavering Island in Northeast Greenland, 10 km southeast of Zackenberg Research Station (Fig. 1). The coastal glacier is oriented towards the northwest, surrounded by steep ridges on both sides, spanning an elevation of 1300 m to 280 m a.s.l., and covering a surface area of 5.5 km2 (2021). The glacier was already subject to glaciological investigations in the late 1930s (Ahlmann, 1942, 1946), likely due to its relatively good accessibility. During the International Polar Year 2007–2008, a mass balance monitoring programme was initiated (Schöner et al., 2009) and has been ongoing since (Hynek et al., 2014; WGMS, 2024). The current monitoring consists of a stake network, an automatic weather station (AWS) of the PROMICE setup (Fausto et al., 2021), and two high-quality webcams (Hynek et al., 2018). Daily images from the two webcams are publicly available via the website foto-webcam.eu (Freya Glacier webcam 1: https://www.foto-webcam.eu/webcam/freya1/ (last access: 28 April 2024) and Freya Glacier webcam 2: https://www.foto-webcam.eu/webcam/freya2/ (last access: 28 April 2024)2).
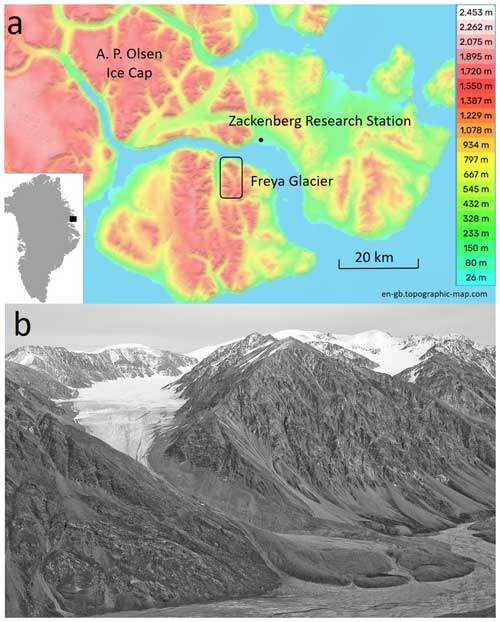
Figure 1(a) Location of Freya Glacier (74.38° N, 20.82° E) on Clavering Island in Northeast Greenland, next to Zackenberg Research Station, and the A.P. Olsen Ice Cap (map from en-gb.topographic-map.com). (b) Picture of Freya Glacier and its surrounding ridges in August 2008 (photo: Bernhard Hynek).
3.1 Geodetic Survey 2013
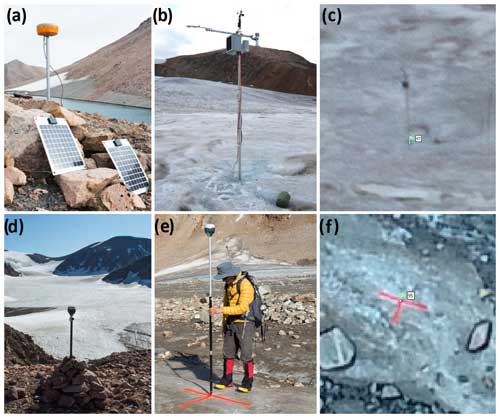
Due to the ease of the process and the suitable topography, SfM–MVS-based image-based 3D surface modelling was the optimal choice for generating a digital elevation model (DEM) of Freya Glacier during the 2013 field campaign. Although no UAV was available, the ridges around the glacier provided useful natural viewpoints for a ground-based survey. Between 11 and 18 August 2013, we took oblique overlapping photographs of the glacier surface from about 450 locations on the slopes on both sides of the glacier using a Nikon D7100 digital single-lens reflex camera with a 20 mm fixed lens. Simultaneously with the image acquisition, we surveyed approximately 100 natural ground control points (GCPs) using a differential GNSS (Global Navigation Satellite System) receiver (Fig. 2a–c). For post-processing of the survey, a temporary GNSS reference station was established on stable rock next to the glacier. We surveyed the upper part of the glacier on 11 and 12 August 2013, when the glacier surface was almost snow-free. Snowfall on 14 August, followed by a period of low visibility, marked the end of the melt season. On 18 August 2013, we surveyed the lower part of the glacier. Surface ablation between the survey dates was below 0.15 m and was partly compensated for by an average fresh-snow height of 0.10 m.
3.2 Geodetic Survey 2021
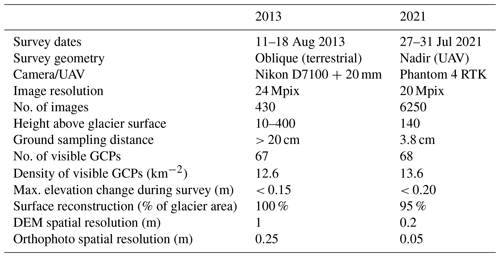
The second high-resolution DEM used in this study stems from 2021. On 29 and 31 July 2021, we used a UAV (DJI Phantom 4 RTK) to obtain an overlapping image series of the glacier surface. On 29 July, we photographed 80 % of the glacier surface (lower part) and finished the drone flights on 31 July. On 28 and 29 July 2021, we surveyed approximately 100 mainly artificial GCPs on the glacier surface using a differential GNSS receiver and a base station that was put up at the same location as in 2013 (Fig. 2d–f). During the survey, surface ablation between 28 and 31 July was less than 0.2 m. Table 1 lists the main characteristics of both photogrammetric surveys.
3.3 GNSS and IBM workflow
GNSS raw logs containing the GCPs and the UAV trajectory were post-processed using the reference station next to the glacier. Coordinates were transformed into the UTM coordinate reference system (zone 27N, EPSG:32627) and to orthometric heights (EGM96). For the accuracy assessment of the surface reconstruction, one subset of the GCPs was used to reference the generated 3D model (control points), and another subset was used to validate the 3D model (independent check points). All GCPs were used to reference the final DEM. GCPs that were not clearly visible in the imagery were used for elevation validation of the final DEM output. The workflow of the DEM and orthophoto generation followed the classical SfM process (e.g. Rossini et al., 2018) using Agisoft Metashape (Agisoft LLC, 2023). Due to the different surface textures (snow-covered vs. snow-free) of the lower and upper 2013 imagery, these parts of the glacier were processed independently and combined into one final DEM afterwards (see the Supplement).
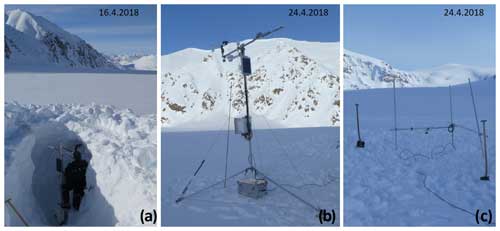
Figure 3Maintenance of the AWS at Freya Glacier in April 2018. (a) The station is 3.5 m tall and was completely covered in snow. (b) The weather station and (c) the stakes with the second ultrasonic device were re-established on the snow surface (photos: Daniel Binder).
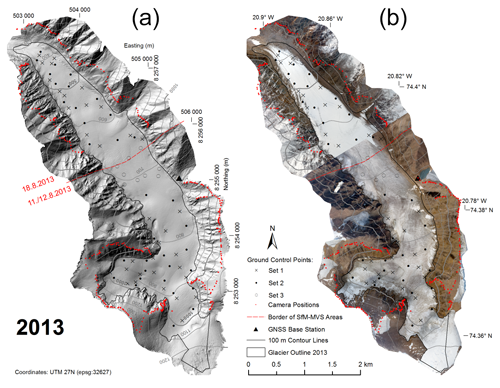
Figure 4(a) Hillshade of the resulting 2013 DEM at 1 m resolution and (b) orthophoto of the survey in August 2013. On both maps, the locations of the photo points, the ground control points (GCPs), and the GNSS base station are indicated. The upper part of the glacier was surveyed on 11 and 12 August. The lower part of the glacier was surveyed on 18 August, after snowfall marked the end of the ablation season of 2013.
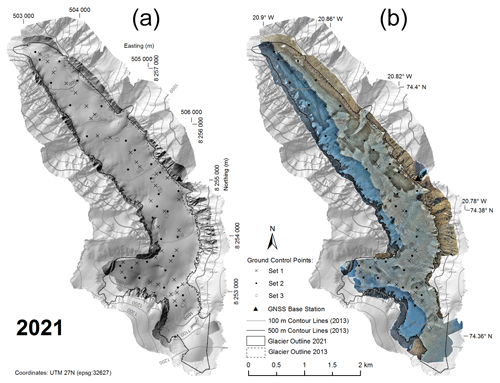
Figure 5(a) Hillshade of the 2021 DEM (dark grey) at 1 m resolution and (b) orthophoto of the survey in July 2021. On both maps, the hillshade of 2013 is displayed in the background, and the locations of the ground control points (GCPs) and the GNSS base station are indicated. The lower part of the glacier was photographed on 27 July 2021, and the upper part was photographed on 31 July 2021.
3.4 Elevation changes
Elevation changes between 2013 and 2021 were calculated by DEM differencing at a 1 m planar resolution. As the georeferencing of the two final DEMs is based on a large number of GCPs, a co-registration of the DEMs (Nuth and Kääb, 2011) was not necessary. Elevation differences in overlapping ice-free terrain had a mean bias of 0.1 m and a standard error of 0.45 m (see the Supplement). Most of the likely stable terrain is rather steep, and, in some areas, the DEM of 2013 might have larger errors than everywhere else; thus, we did not correct for this bias.
3.5 Density assumption and geodetic mass balance
To convert the observed volume change into a mass change, we use the conversion factor of 850 ± 60 kg m−3 recommended by Huss (2013) for periods longer than 5 years, with stable mass balance gradients, the presence of a firn area, and volume changes significantly different from zero. So far, no firn density measurements have been carried out on the glacier in either the accumulation zone or one of the avalanche deposits. The main part of the accumulation that led to the observed positive elevation changes occurred in 2018 and had undergone densification over four melt seasons by the time of the second survey. However, percolation and the possible formation of ice lenses might create high variability in firn density (Vandecrux et al., 2018; Machguth et al., 2016a). Therefore, we decided to follow the recommendation of Huss (2013). In 2013, the survey was conducted very close to the end of the ablation season. In 2021, an adjustment of −0.6 ± 0.05 m w.e. was calculated between the survey on 29 July and that at the end of the ablation season on 5 September based on 10 ablation stake readings.
3.6 Glaciological mass balance
3.6.1 Winter mass balance
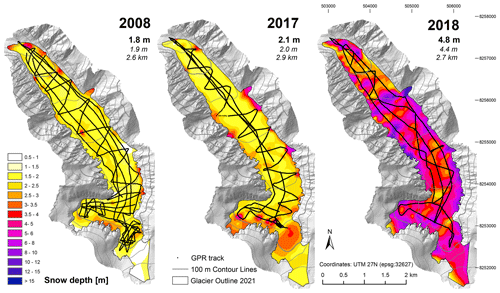
Due to logistical challenges in accessing the glacier with a snow mobile, the number of snow height observations varies considerably from year to year. Distributed winter snow height is measured either by 40–150 manual snow depth probings or by a 800 MHz ground-penetrating radar (GPR) snow survey of several kilometres in length. In April 2018, an extended GPR snow survey with a total length of 27 km was carried out to capture the spatial distribution of snow depth, including the still-visible avalanche deposits. To get a regular grid of snow height, a spline function was fitted to the data. In contrast, snow density was measured at only one location, which was not influenced by avalanches: in a snow pit next to the AWS at an elevation of 680 m (Fig. S4 in the Supplement). Winter mass balance was calculated as a spatial average of snow depth over the whole glacier area multiplied by an extrapolated snow density based on the available measurements next to the AWS. Similar GPR snow surveys with comparable spatial coverages were carried out in spring 2008 and 2017; in other years a reduced sample network was used.
3.6.2 Annual mass balance
Until 2015, annual mass balance measurements were usually carried out in August, and seasonal mass balance was measured at several points distributed across the glacier. Annual glacier-wide mass balance was then determined by extrapolating the point values to the whole glacier area. Depending on the number of point observations, the mean standard error is estimated to be 0.05 m w.e. a−1 (e.g. Pulwicki et al., 2018). Mainly due to high travel costs, but also in accordance with the mass balance monitoring at the A.P. Olsen Ice Cap, the monitoring strategy was changed in 2016 to only one visit per year in spring. At the same time, an automatic monitoring system was installed, namely an automatic weather and mass balance station and an automatic camera to track the retreat of the snow line during summer. Since then, annual mass balance has still been measured at 11 ablation stakes, which usually protrude from the winter snow. At each stake the mass balance of the previous year is determined by measuring the current snow depth and the height change of the stake. However, because of the above-average snow heights of 2018, only two stakes were found in spring 2018 and 2019. In 2020 and 2021, spring measurements were not possible due to the travel restrictions caused by the COVID-19 pandemic. Therefore, the glacier-wide mass balance from 2016–2017 to 2020–2021 was reconstructed using a linear relationship (see the Supplement for details) between the mass balance at the AWS (index stake) and the glacier-wide mass balance based on observations from 2008 to 2016, introducing an estimated uncertainty of 0.2 m w.e. a−1. Most stakes were found again and could be measured in July 2021 and April 2022.
3.7 Quantifying the influence of avalanches on the winter mass balance of 2018
To delineate the avalanche deposits of 2018, we identified areas with a strong increase in snow height along the GPR tracks. In areas without GPR tracks, we completed the delineation using a best estimate based on pictures of avalanche cracks, remnants of avalanches in the orthophoto of 2021, above-average local elevation changes in 2013–2021, and likely avalanche flow paths based on topography. The GPR snow depth data were sampled down to 10 m point distance and then interpolated using a spline function onto a grid of glacier-wide snow heights. To estimate the contribution by avalanches to the winter mass balance of 2018, we calculated spatial averages of the snow height grid in avalanche-affected areas and in avalanche-free areas. To convert snow heights into snow water equivalent, we used the mean snow density of 385 kg m−3 (measured in the snow pit next to the automatic weather station) for areas that are not influenced by avalanches. As snow density typically increases with snow depth and because avalanche deposits have higher snow densities than the undisturbed snow pack, we used higher snow densities for the avalanche deposits: a 5 % increased snow density (404.25 kg m−3) as a best guess and a 10 % increase (423.5 kg m−3) which we interpret as an upper boundary.
3.8 Climate data
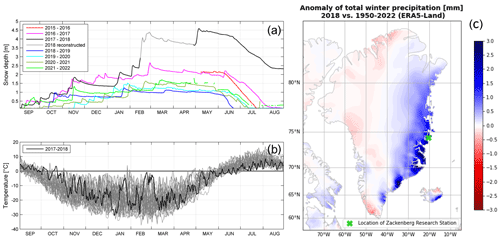
Snow height at the AWS on Freya Glacier is measured by two Campbell SR50 ultrasonic devices, one fixed to the mast of the weather station 3.4 m above the ground and one fixed to an ablation stake. Both sensors were buried in snow by mid-February 2018. On 28 April, the weather station was re-established on the surface (Fig. 3). The data gap of 2.5 months was reconstructed using snow height data from the main weather station at the A.P. Olsen Ice Cap (Larsen et al., 2024; Greenland Ecosystem Monitoring, 2020a), which has a continuous record in 2018 (see Fig. S6). Additionally, we used temperature data from the climate station Zackenberg (Greenland Ecosystem Monitoring, 2020b) and precipitation data from the ERA5 global reanalysis (Hersbach et al., 2020).
4.1 DEM and orthophoto 2013
The shaded relief of the 2013 DEM (Fig. 4a) shows a high level of detail, with only a few artefacts visible in the middle and uppermost parts of the glacier. These artefacts occur where the distance between the photo points and the glacier surface is high and the angle towards the glacier surface is acute. The middle part of the glacier is poorly covered, and the GCPs there (Fig. 4a, set 3) could not be identified in the images and were used to check only the vertical accuracy of the DEM in that area (Table 2). The orthophoto shows almost snow-free conditions in the upper part of the glacier and the new snow on the lower part (Fig. 4b). The surface reconstruction covers the entire glacier area and the adjacent ridges. Since all GCPs are on the glacier surface, the accuracy of the surface reconstruction is expected to drop significantly in the adjacent ridges. The accuracy of the surface reconstruction expressed as RMSE at the check points is significantly worse than the RMSE at the control points, with the lateral accuracy being particularly poorer than the vertical accuracy (Table 2).
4.2 DEM and orthophoto 2021
The shaded relief of the 2021 DEM (Fig. 5a) shows a much higher level of detail due to better measurement geometry and resolution. The ground sampling density (Table 1) and the accuracy of the surface reconstruction (Table 2) of the 2021 survey are both higher than those for the 2013 survey. However, only 95 % of the glacier surface is reconstructed, and the DEM does not extend much to the adjacent ridges due to limited UAV battery supply during fieldwork. Avalanche-affected areas are visible in the orthophoto (Fig. 5b) on the lower and middle part of the glacier, while the upper part was still covered by slush and winter snow.
4.3 Elevation changes and geodetic mass balance
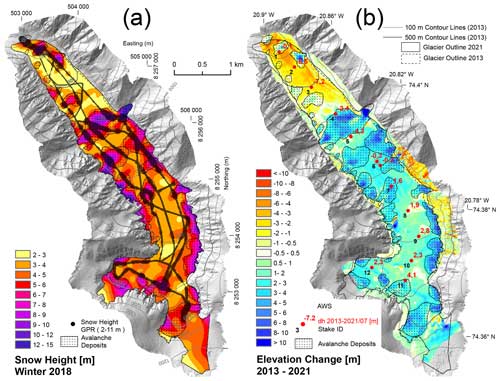
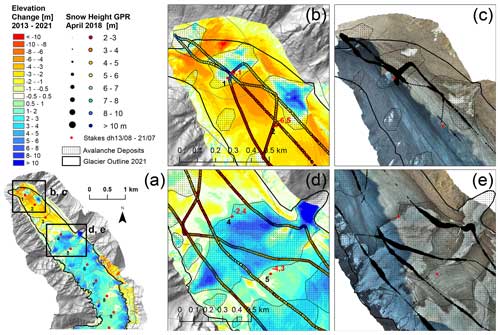
Elevation changes at a 1 m resolution (Fig. 6) were calculated for 95 % of the glacier area, missing only some parts in the upper accumulation zones and a small debris-covered area next to the glacier snout. Elevation changes for these areas were calculated by fitting a spline function to the elevation changes in the surrounding areas to avoid a bias in the geodetic mass balance. Elevation changes show a high spatial variability. Surface lowering is observed on 20 % of the glacier surface, mainly at elevations below 600 m a.s.l., and reaches a minimum of −11 m in the lowest part of the glacier. Above 600 m a.s.l., elevation changes are mainly positive. At the centre line of the glacier, elevation gains are mainly smaller than 2 m. In several distinct areas, predominantly along both sides of the glacier, elevation gains are up to several metres, with a maximum of 17 m. These areas coincide with potential avalanche depositions from large side valleys (Fig. 7). The mean elevation change from August 2013 to July 2021 for the entire glacier is 1.56 ± 0.10 m. The main sources of uncertainty include ablation during the survey, unmeasured areas, and the uncertainty in the delineation of the glacier surface area. Converting this volume change into a mass change – and hereby introducing another uncertainty using a density assumption of 850 ± 60 kg m−3 – we obtain the specific geodetic mass balance from August 2013 to July 2021 as m w.e. After accounting for the mass losses during August 2021, the total 8-year geodetic mass balance (2013–2014 to 2020–2021) adds up to bgeod.8y=0.73 ± 0.22 m w.e. (0.09 m w.e. a−1).
4.4 Winter 2018 and avalanches
In the winter of 2017–2018, a series of low-pressure systems between the southern tip of Greenland and Iceland transported warm and moist air masses to the eastern coast of Greenland, with frequent snowfall leading to above-average winter precipitation sums along large parts of the eastern coast (Fig. 8) and also on Freya Glacier (Fig. 9). Between 12 and 18 February 2018, approximately 1.5 m of snow accumulated within 5 days on Freya Glacier. This led to widespread avalanche activity, and during fieldwork in April 2018, signs of large avalanche deposits were visible across the entire glacier. Particularly in the middle part of the glacier, several large avalanches originating from the tributary valleys on both sides covered large parts of the glacier. In April 2018, avalanche deposits were found on 36 % of the glacier area. Individual GPR-derived snow heights ranged from 2.2 m up to 12.1 m, with a mean snow height of 4.4 m. The pattern of snow height distribution in winter 2018 and the elevation changes show a high similarity (Fig. 6). The area-averaged snow height on the entire glacier is 4.8 m, with 6.2 m on avalanche deposits and 4.0 m in areas without avalanches. The snow height contribution from avalanches averaged over the whole glacier is 0.8 m. Mean snow density at the snow pit next to the AWS at stake 6 was 385 kg m−3. We consider this to be a lower limit for the glacier-wide spatial mean snow density as avalanche snow is likely to have a higher density than the undisturbed snow cover in the middle of the glacier (Sovilla et al., 2001), where the snow density measurement was carried out. Assuming a 5 % higher snow density on the glacier due to compaction and overburden pressure within the avalanche deposits, the specific mass balance contribution of avalanches is 0.35 ± 0.04 m w.e., which accounts for 19 % of the total winter mass balance of 1.89 ± 0.05 m w.e. (Table 3).
4.5 Visibility of avalanches on the glacier surface
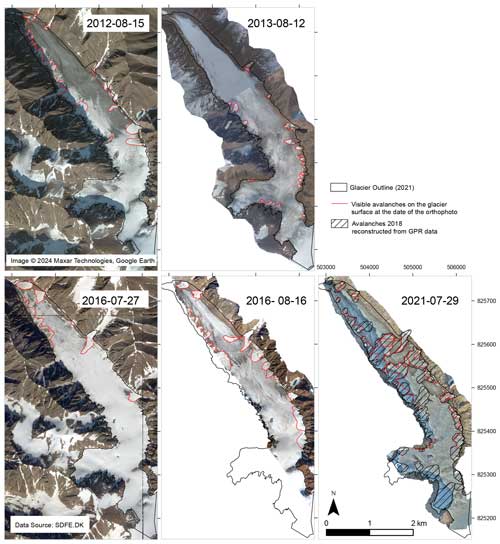
While remnants of snow avalanches have been visible on the glacier surface over several years, particularly between 2012 and 2016 (Figs. 10, 11), their surface extent was smaller compared to 2018. In 2016, at least three avalanche deposits are visible on the orographic right side of the glacier in orthophotos taken in July 2016, and some more can be identified in August 2016 (Fig. 10).
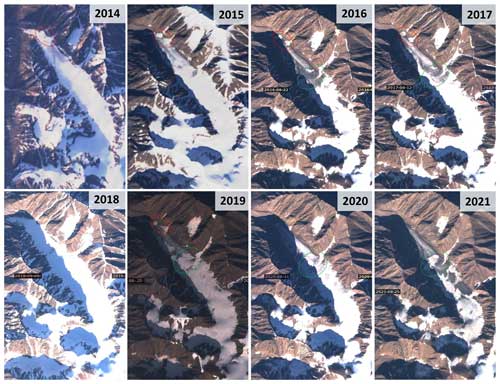
Figure 11Landsat (2014–2015) and Sentinel-2 (2016–2021) images show the snow cover extent at the end of the ablation season in the relevant mass balance period. Avalanche-affected areas are visible in the ablation zone (red) and, in some years, also in the middle of the glacier (green), where large side valleys are located. Landsat images for 2014 and 2015 are courtesy of the US Geological Survey. Copernicus Sentinel-2 data for 2016–2021, processed by ESA, were retrieved from the Sentinel Hub.
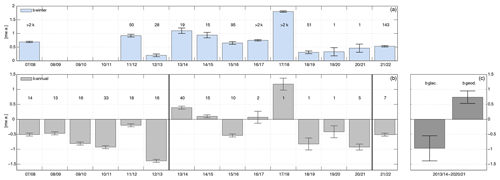
Figure 12Left panels: time series of specific winter mass balances (a) and specific annual mass balances (b) with their estimated uncertainties. The number of point observations available for the mass balance calculation of individual years (winters) is shown as italic numbers. For example, the winter mass balance of 2017–2018 is based on more than 2000 points, while the annual balance of 2017–2018 is based on 1 point observation only. The high number of point observations in winter 2017–2018 corresponds to 10 m along-track mean snow depth values of the extensive GPR survey. (c) Comparison of the cumulative glaciological and geodetic mass balances of 2013–2014 to 2020–2021 and their related uncertainties.
4.6 Glaciological mass balance
The time series of winter and annual mass balances of Freya Glacier are shown in Fig. 12. Prior to 2013, all annual mass balances were negative, with 2013 having the most negative mass balance on record so far. Higher winter mass balances between 2014 and 2018 can be associated with some positive annual mass balances in that period; after 2019, drier winters once again facilitated negative annual mass balances. In particular, stake 1 and stake 4 are influenced by avalanches and show reduced ablation rates (see stake readings in Fig. 6b and Table S1 in the Supplement). The cumulative glaciological mass balance of 2013–2014 to 2020–2021 is −1.0 ± 0.4 m w.e. The bias with respect to the geodetic mass balance is −1.73 m w.e. or −0.22 m w.e. a−1.
The avalanche cycle of 2018 was outstanding with regard to the mass input and the glacier area affected. However, avalanches seem to be a persistent feature on Freya Glacier as their deposits are visible almost every year. It is difficult to date these avalanches and estimate their frequency as older avalanche deposits might get covered by new ones. In the case of the two big avalanches in the middle of the glacier, which originated from opposite sides and travelled almost all the way through to the other side of the glacier in 2018 (green circle in Fig. 11), we have strong evidence that their remnants are still visible in the orthophoto of 2021, more than 3 years after the incident. On the one hand, it takes a few ablation seasons to melt avalanche snow up to 8 m thick, particularly if that snowpack is located in a rather flat area on the glacier, where it is more likely to get densified by the retention of meltwater. On the other hand, winter mass balances in the following years were below average (Fig. 12) and were therefore unlikely to produce avalanches of this size. While avalanche deposits are easy to identify in the ablation area or in rather negative mass balance years, their presence and extent remain equivocal in the upper firn area or in less negative years.
A major uncertainty in the geodetic mass balance is introduced by the density assumption. On Freya Glacier, high accumulation rates by avalanches have generated thick and possibly dense firn layers with high potential for meltwater retention and refreezing.
First, it is difficult to constrain the initial snow density of snow deposited by avalanches without a direct measurement within these deposits. Li et al. (2021) and Sovilla et al. (2001) observed that the snow density of avalanche deposits might be 2 to 3 times higher than the undisturbed snowpack at the time of the avalanche release date. As a best guess, we used 5 % to 10 % higher snow density within the avalanche deposits compared to the undisturbed snow cover to calculate the winter mass balance.
Second, there is a large uncertainty with regard to how the density of these avalanche deposits evolves during the following 4 years as this is mainly influenced by the possible formation of impermeable ice layers by percolating meltwater, as shown by Braithwaite et al. (1994) and Vandecrux et al. (2018). Also, Machguth et al. (2016a) showed that firn loses a part of its capacity to store water after forming near-surface ice layers during strong melt events. While we observed strong melt events on Freya Glacier during the following summers, refreezing of meltwater has already been suspected to a play an important role in the mass balance of Freya Glacier (Ahlmann, 1946) and was observed qualitatively during fieldwork in 2021. The bright glacier surfaces, which are the supposed remnants of avalanches, looked like snow but proved to be as hard as ice. Given all these uncertainties and the lack of firn density measurements at Freya Glacier, we chose to stick to the recommendation of Huss (2013), who showed in a model experiment that a conversion factor between elevation change and mass change of 850 ± 60 kg m−3 is appropriate for a wide range of conditions over longer time periods.
The cumulative glaciological mass balance for the period 2013–2014 to 2020–2021 was estimated in a rather crude way and carries uncertainties for several reasons. The accumulation within the avalanche deposits visible in the satellite images from 2014 to 2016 might have been underestimated. From 2017 to 2021, only one or two point observations were available, and so the glacier-wide mass balance was reconstructed using a linear relationship based on the mass balance at the AWS (stake 6). Another likely reason for the bias between the glaciological and geodetic mass balance is the already mentioned unknown magnitude of meltwater retention by refreezing within deeper firn layers. This process is difficult to measure; in our case, it was not feasible to measure firn density due to logistical reasons. A thorough reanalysis of the annual mass balance series using all available data and following a methodology based on Zemp et al. (2013) is necessary but beyond the scope of this paper.
Regardless of the recent uncertainty in the glaciological mass balance time series of Freya Glacier, there is a shift from rather negative to less negative mass balances starting in 2013–2014, which we attribute to higher winter accumulation between 2014 and 2018. This shift to less negative mass balances – caused by an increase in precipitation over NE Greenland in recent years – has been shown to be a regional effect by Hugonnet et al. (2021) and Khan et al. (2022).
Our study shows that the 8 year geodetic mass balance of Freya Glacier from 2013–2014 to 2020–2021 has been positive (0.73 ± 0.22 m w.e.). A significant positive contribution to the mass balance stems from avalanches originating from the surrounding slopes. While avalanche deposits are visible on the glacier surface to a limited extent almost every year, the winter of 2018 was clearly outstanding. After a heavy precipitation event in mid-February 2018, which caused a snow height increase of 1.5 m within 5 d, widespread avalanche activity affected more than one-third of the glacier area. Based on a detailed GPR survey conducted in April 2018, we estimated the contribution of avalanches to the winter mass balance of 2018 to be 0.35 ± 0.04 m w.e., which is close to 20 % of the winter mass balance of 1.89 ± 0.05 m w.e. We showed that some avalanche deposits are visible on the glacier surface almost every year, leaving a strong imprint on the elevation changes. A main uncertainty in this assessment arises from a lack of snow and firn density measurements, particularly within the avalanche deposits but also in the upper firn areas. The cumulative glaciological mass balance for 2013–2014 to 2020–2021 is negative (−1.0 ± 0.4 m w.e.), suffering from data gaps and only a few point observations in recent years. The magnitude of the bias between the geodetic and glaciological mass balance (−0.22 m w.e. a−1) is similar to bias estimates reported by Andreassen et al. (2016) for 10 glaciers in Norway and is therefore not unexpected (see also Zemp et al., 2013). Likely reasons for this bias include the underestimation of the mass contribution by avalanches, the general lack of distributed accumulation measurements, and possibly the underestimation of refreezing meltwater leading to internal accumulation. Capturing these processes, as well as firn density measurements, should receive more attention in future mass balance monitoring at Freya Glacier. Assuming a higher likelihood of strong winter precipitation events in a warmer climate, we expect accumulation by avalanches to become more important on Arctic mountain glaciers that are situated in or surrounded by steep terrain.
Mass balance data of Freya Glacier are available through the WGMS (https://doi.org/10.5904/wgms-fog-2024-01, WGMS, 2024) and PANGAEA (https://doi.org/10.1594/PANGAEA.831035, Hynek et al., 2014). The DEMs, orthophotos, and glacier outlines of 2013 and 2021 are also available on PANGAEA and in https://doi.org/10.1594/PANGAEA.972888 Hynek et al. (2024b) https://doi.org/10.1594/PANGAEA.972889 Hynek et al. (2024a).
The supplement related to this article is available online at: https://doi.org/10.5194/tc-18-5481-2024-supplement.
BH designed the study, conducted the data analysis, and wrote the paper. BH and DB carried out the geodetic surveys. BH, DB, MC, SHL, JA, and WS carried out the mass balance observations on Freya Glacier. DB analysed the GPR data. GV helped with the planning and processing of the 2013 geodetic survey. WS and EL provided the funding. All the authors provided insights regarding the interpretation of the data and reviewed and edited the paper.
The contact author has declared that none of the authors has any competing interests.
Publisher's note: Copernicus Publications remains neutral with regard to jurisdictional claims made in the text, published maps, institutional affiliations, or any other geographical representation in this paper. While Copernicus Publications makes every effort to include appropriate place names, the final responsibility lies with the authors.
Data from the Greenland Ecosystem Monitoring Programme were provided by the Geological Survey of Denmark and Greenland (GEUS), Denmark, and Asiaq – Greenland Survey, Nuuk, Greenland. The authors are grateful to the logistics team at Zackenberg Research Station for the logistical support of the fieldwork. The authors gratefully acknowledge Geo Boffi for post-processing the GNSS data of 2013, Anders Anker Bjørk for taking overlapping imagery from an aeroplane in August 2016, and Anna Rohrböck for the plotting of the ERA5 data. The comments and suggestions of two anonymous referees and the scientific editor Etienne Berthier substantially improved the paper.
The work is supported by the International School for Alpine Research at Sonnblick Observatory (grant no. ISAR-SBO) and by a research grant from GeoSphere Austria. The survey in 2013 was supported by the Österreichische Gesellschaft für Polarforschung.
This paper was edited by Etienne Berthier and reviewed by two anonymous referees.
Abermann, J., Eckerstorfer, M., Malnes, E., and Hansen, B. U.: A large wet snow avalanche cycle in West Greenland quantified using remote sensing and in situ observations, Nat. Hazards, 97, 517–534, https://doi.org/10.1007/s11069-019-03655-8, 2019a.
Abermann, J., Van As, D., Wacker, S., Langley, K., Machguth, H., and Fausto, R. S.: Strong contrast in mass and energy balance between a coastal mountain glacier and the Greenland ice sheet, J. Glaciol., 65, 263–269, https://doi.org/10.1017/jog.2019.4, 2019b.
Agisoft LLC: Agisoft Metashape 2.1.3 [software], https://www.agisoft.com/downloads/installer/ (last access: 20 November 2024), 2024.
Ahlmann, H. W.: Studies in Northeast Greenland: Part III: Accumulation and Ablation on the Fröya Glacier: Its Regime in 1938–39 and in 1939–40, Geogr. Ann., 24, 1–22, 1942.
Ahlmann, H. W.: The Fröya Glacier 1939–40: Accumulation and Ablation on the Fröya Glacier, Geogr. Ann., 28, 239–257, 1946.
Andreassen, L. M., Elvehøy, H., Kjøllmoen, B., and Engeset, R. V.: Reanalysis of long-term series of glaciological and geodetic mass balance for 10 Norwegian glaciers, The Cryosphere, 10, 535–552, https://doi.org/10.5194/tc-10-535-2016, 2016.
Binder, D., Schöner, W., Brückl, E., Hynek, B., and Weyss, G.: Ground Penetrating Radar Investigations in the North East of Greenland, in: Geophysical Research Abstracts, EGU General Assembly 2009, Wien, https://meetingorganizer.copernicus.org/EGU2009/EGU2009-10903.pdf (last access: 20 November 2024), 2009.
Braithwaite, R. J., Laternser, M., and Pfeffer, W. T.: Variations of near-surface firn density in the lower accumulation area of the Greenland ice sheet, Pâkitsoq, West Greenland, J. Glaciol., 40, 477–485, https://doi.org/10.3189/S002214300001234X, 1994.
Fausto, R. S., van As, D., Mankoff, K. D., Vandecrux, B., Citterio, M., Ahlstrøm, A. P., Andersen, S. B., Colgan, W., Karlsson, N. B., Kjeldsen, K. K., Korsgaard, N. J., Larsen, S. H., Nielsen, S., Pedersen, A. Ø., Shields, C. L., Solgaard, A. M., and Box, J. E.: Programme for Monitoring of the Greenland Ice Sheet (PROMICE) automatic weather station data, Earth Syst. Sci. Data, 13, 3819–3845, https://doi.org/10.5194/essd-13-3819-2021, 2021.
Frederikse, T., Landerer, F., Caron, L., Adhikari, S., Parkes, D., Humphrey, V. W., Dangendorf, S., Hogarth, P., Zanna, L., Cheng, L., and Wu, Y.-H.: The causes of sea-level rise since 1900, Nature, 584, 393–397, https://doi.org/10.1038/s41586-020-2591-3, 2020.
Geissler, J., Mayer, C., Jubanski, J., Münzer, U., and Siegert, F.: Analyzing glacier retreat and mass balances using aerial and UAV photogrammetry in the Ötztal Alps, Austria, The Cryosphere, 15, 3699–3717, https://doi.org/10.5194/tc-15-3699-2021, 2021.
Gindraux, S., Boesch, R., and Farinotti, D.: Accuracy Assessment of Digital Surface Models from Unmanned Aerial Vehicles’ Imagery on Glaciers, Remote Sens., 9, 186, https://doi.org/10.3390/rs9020186, 2017.
Greenland Ecosystem Monitoring: GlacioBasis Zackenberg – Near surface climate – Boom height, ZAC_U (1.0), https://doi.org/10.17897/FWAV-KZ44, 2020a.
Greenland Ecosystem Monitoring: ClimateBasis Zackenberg - Air temperature - Air temperature, 200 cm at 60 min sample (°C) (1.0), https://doi.org/10.17897/XV96-HC57, 2020b.
Hersbach, H., Bell, B., Berrisford, P., Hirahara, S., Horányi, A., Muñoz-Sabater, J., Nicolas, J., Peubey, C., Radu, R., Schepers, D., Simmons, A., Soci, C., Abdalla, S., Abellan, X., Balsamo, G., Bechtold, P., Biavati, G., Bidlot, J., Bonavita, M., De Chiara, G., Dahlgren, P., Dee, D., Diamantakis, M., Dragani, R., Flemming, J., Forbes, R., Fuentes, M., Geer, A., Haimberger, L., Healy, S., Hogan, R. J., Hólm, E., Janisková, M., Keeley, S., Laloyaux, P., Lopez, P., Lupu, C., Radnoti, G., De Rosnay, P., Rozum, I., Vamborg, F., Villaume, S., and Thépaut, J.: The ERA5 global reanalysis, Q. J. Roy. Meteorol. Soc., 146, 1999–2049, https://doi.org/10.1002/qj.3803, 2020.
Higgins, A. K.: Exploration history and place names of northern East Greenland, GEUS Bull., 21, 1–368, https://doi.org/10.34194/geusb.v21.4735, 2010.
Hugonnet, R., McNabb, R., Berthier, E., Menounos, B., Nuth, C., Girod, L., Farinotti, D., Huss, M., Dussaillant, I., Brun, F., and Kääb, A.: Accelerated global glacier mass loss in the early twenty-first century, Nature, 592, 726–731, https://doi.org/10.1038/s41586-021-03436-z, 2021.
Huss, M.: Density assumptions for converting geodetic glacier volume change to mass change, The Cryosphere, 7, 877–887, https://doi.org/10.5194/tc-7-877-2013, 2013.
Huss, M., Bauder, A., and Funk, M.: Homogenization of long-term mass-balance time series, Ann. Glaciol., 50, 198–206, https://doi.org/10.3189/172756409787769627, 2009.
Hynek, B., Weyss, G., Binder, D., Schöner, W., Abermann, J., and Citterio, M.: Mass balance of Freya Glacier, Greenland since 2007/2008, Pangaea [data set], https://doi.org/10.1594/PANGAEA.831035, 2014.
Hynek, B., Binder, D., and Citterio, M.: The Mass balance of Freya Glacier, Greenland, in 2015/2016, Technical Document, ZAMG, https://epic.awi.de/46857/1/Tech_Report_Freya_Glacier_MB_2015-2016.pdf (last access: 20 November 2024), 2018.
Hynek, B., Binder, D., Verhoeven, G., and Schöner, W.: Digital elevation model and orthophoto of Freya Glacier 2013, Pangaea [data set], https://doi.org/10.1594/PANGAEA.972889, 2024a.
Hynek, B., Binder, D., and Larsen, S. H.: Digital elevation model and orthophoto of Freya Glacier 2021, Pangaea [data set], https://doi.org/10.1594/PANGAEA.972888, 2024b.
Kaser, G., Fountain, A., and Jansson, P.: A manual for monitoring the mass balance of mountain glaciers with particular attention to low latitude characteristics. A contribution from the International Commission on Snow and Ice (ICSI) to the UNESCO HKH-Friend programme, IHP-VI, Technical Documents in Hydrology, No. 59, UNESCO, Paris, 107 p. + Appendices, https://wgms.ch/downloads/Kaser_etal_UNESCO_2003.pdf (last access: 20 November 2024), 2003.
Khan, S. A., Colgan, W., Neumann, T. A., van den Broeke, M. R., Brunt, K. M., Noël, B., Bamber, J. L., Hassan, J., and Bjørk, A. A.: Accelerating Ice Loss From Peripheral Glaciers in North Greenland, Geophys. Res. Lett., 49, e2022GL098915, https://doi.org/10.1029/2022GL098915, 2022.
Klug, C., Bollmann, E., Galos, S. P., Nicholson, L., Prinz, R., Rieg, L., Sailer, R., Stötter, J., and Kaser, G.: Geodetic reanalysis of annual glaciological mass balances (2001–2011) of Hintereisferner, Austria, The Cryosphere, 12, 833–849, https://doi.org/10.5194/tc-12-833-2018, 2018.
Kneib, M., Dehecq, A., Gilbert, A., Basset, A., Miles, E. S., Jouvet, G., Jourdain, B., Ducasse, E., Beraud, L., Rabatel, A., Mouginot, J., Carcanade, G., Laarman, O., Brun, F., and Six, D.: Distributed surface mass balance of an avalanche-fed glacier, EGUsphere [preprint], https://doi.org/10.5194/egusphere-2024-1733, 2024a.
Kneib, M., Dehecq, A., Brun, F., Karbou, F., Charrier, L., Leinss, S., Wagnon, P., and Maussion, F.: Mapping and characterization of avalanches on mountain glaciers with Sentinel-1 satellite imagery, The Cryosphere, 18, 2809–2830, https://doi.org/10.5194/tc-18-2809-2024, 2024b.
Laha, S., Kumari, R., Singh, S., Mishra, A., Sharma, T., Banerjee, A., Nainwal, H. C., and Shankar, R.: Evaluating the contribution of avalanching to the mass balance of Himalayan glaciers, Ann. Glaciol., 58, 110–118, https://doi.org/10.1017/aog.2017.27, 2017.
Larsen, S. H., Binder, D., Rutishauser, A., Hynek, B., Fausto, R. S., and Citterio, M.: Climate and ablation observations from automatic ablation and weather stations at A. P. Olsen Ice Cap transect, northeast Greenland, for May 2008 through May 2022, Earth Syst. Sci. Data, 16, 4103–4118, https://doi.org/10.5194/essd-16-4103-2024, 2024.
Li, X., Sovilla, B., Jiang, C., and Gaume, J.: Three-dimensional and real-scale modeling of flow regimes in dense snow avalanches, Landslides, 18, 3393–3406, https://doi.org/10.1007/s10346-021-01692-8, 2021.
Machguth, H., MacFerrin, M., Van As, D., Box, J. E., Charalampidis, C., Colgan, W., Fausto, R. S., Meijer, H. A. J., Mosley-Thompson, E., and Van De Wal, R. S. W.: Greenland meltwater storage in firn limited by near-surface ice formation, Nat. Clim. Change, 6, 390–393, https://doi.org/10.1038/nclimate2899, 2016a.
Machguth, H., Thomsen, H. H., Weidick, A., AhlstrøM, A. P., Abermann, J., Andersen, M. L., Andersen, S. B., BjøRk, A. A., Box, J. E., Braithwaite, R. J., BøGgild, C. E., Citterio, M., Clement, P., Colgan, W., Fausto, R. S., Gleie, K., Gubler, S., Hasholt, B., Hynek, B., Knudsen, N. T., Larsen, S. H., Mernild, S. H., Oerlemans, J., Oerter, H., Olesen, O. B., Smeets, C. J. P. P., Steffen, K., Stober, M., Sugiyama, S., Van As, D., Van Den Broeke, M. R., and Van De Wal, R. S. W.: Greenland surface mass-balance observations from the ice-sheet ablation area and local glaciers, J. Glaciol., 62, 861–887, https://doi.org/10.1017/jog.2016.75, 2016b.
Marcer, M., Stentoft, P. A., Bjerre, E., Cimoli, E., Bjørk, A., Stenseng, L., and Machguth, H.: Three Decades of Volume Change of a Small Greenlandic Glacier Using Ground Penetrating Radar, Structure from Motion, and Aerial Photogrammetry, Arct. Antarct. Alpine Res., 49, 411–425, https://doi.org/10.1657/AAAR0016-049, 2017.
Mernild, S. H., Pelto, M., Malmros, J. K., Yde, J. C., Knudsen, N. T., and Hanna, E.: Identification of snow ablation rate, ELA, AAR and net mass balance using transient snowline variations on two Arctic glaciers, J. Glaciol., 59, 649–659, https://doi.org/10.3189/2013JoG12J221, 2013.
Noël, B., Aðalgeirsdóttir, G., Pálsson, F., Wouters, B., Lhermitte, S., Haacker, J. M., and van den Broeke, M. R.: North Atlantic Cooling is Slowing Down Mass Loss of Icelandic Glaciers, Geophys. Res. Lett., 49, e2021GL095697, https://doi.org/10.1029/2021GL095697, 2022.
Nuth, C. and Kääb, A.: Co-registration and bias corrections of satellite elevation data sets for quantifying glacier thickness change, The Cryosphere, 5, 271–290, https://doi.org/10.5194/tc-5-271-2011, 2011.
Østrem, G. and Brugmann, M.: Glacier Mass Balance Measurements. A manual for field and office work, National Hydrology Research Institute (Canada), NHRI Science Report. 224 pp., https://wgms.ch/downloads/Oestrem_Brugman_GlacierMassBalanceMeasurements_1991.pdf (last access: 20 November 2024), 1991.
Piermattei, L., Carturan, L., and Guarnieri, A.: Use of terrestrial photogrammetry based on structure-from-motion for mass balance estimation of a small glacier in the Italian alps, Earth Surf. Process. Landforms, 40, 1791–1802, https://doi.org/10.1002/esp.3756, 2015.
Pulwicki, A., Flowers, G. E., Radić, V., and Bingham, D.: Estimating winter balance and its uncertainty from direct measurements of snow depth and density on alpine glaciers, J. Glaciol., 64, 781–795, https://doi.org/10.1017/jog.2018.68, 2018.
Rastner, P., Bolch, T., Mölg, N., Machguth, H., Le Bris, R., and Paul, F.: The first complete inventory of the local glaciers and ice caps on Greenland, The Cryosphere, 6, 1483–1495, https://doi.org/10.5194/tc-6-1483-2012, 2012.
Rossini, M., Di Mauro, B., Garzonio, R., Baccolo, G., Cavallini, G., Mattavelli, M., De Amicis, M., and Colombo, R.: Rapid melting dynamics of an alpine glacier with repeated UAV photogrammetry, Geomorphology, 304, 159–172, https://doi.org/10.1016/j.geomorph.2017.12.039, 2018.
Schmidt, N. M., Reneerkens, J., Christensen, J. H., Olesen, M., and Roslin, T.: An ecosystem-wide reproductive failure with more snow in the Arctic, PLoS Biol., 17, e3000392, https://doi.org/10.1371/journal.pbio.3000392, 2019.
Schöner, W., Binder, D., Hynek, B., Weyss, G., Abermann, J., Olefs, M., and Nicus, U.: Climate change and glacier reaction in Zackenberg Region, National Environemtal Research Institute, Aarhus University, Denmark, https://www2.dmu.dk/pub/zero_09.pdf (last access: 20 November 2024), 2009.
Sovilla, B., Sommavilla, F., and Tomaselli, A.: Measurements of mass balance in dense snow avalanche events, Ann. Glaciol., 32, 230–236, https://doi.org/10.3189/172756401781819058, 2001.
Vandecrux, B., Fausto, R. S., Langen, P. L., Van As, D., MacFerrin, M., Colgan, W. T., Ingeman‐Nielsen, T., Steffen, K., Jensen, N. S., Møller, M. T., and Box, J. E.: Drivers of Firn Density on the Greenland Ice Sheet Revealed by Weather Station Observations and Modeling, JGR Earth Surf., 123, 2563–2576, https://doi.org/10.1029/2017JF004597, 2018.
WGMS: Fluctuations of Glaciers Database. World Glacier Monitoring Service (WGMS), Zurich, Switzerland, https://doi.org/10.5904/wgms-fog-2024-01, 2024.
Yde, J. C., Gillespie, M. K., Løland, R., Ruud, H., Mernild, S. H., Villiers, S. D., Knudsen, N. T., and Malmros, J. K.: Volume measurements of Mittivakkat Gletscher, southeast Greenland, J. Glaciol., 60, 1199–1207, https://doi.org/10.3189/2014JoG14J047, 2014.
Zemp, M., Thibert, E., Huss, M., Stumm, D., Rolstad Denby, C., Nuth, C., Nussbaumer, S. U., Moholdt, G., Mercer, A., Mayer, C., Joerg, P. C., Jansson, P., Hynek, B., Fischer, A., Escher-Vetter, H., Elvehøy, H., and Andreassen, L. M.: Reanalysing glacier mass balance measurement series, The Cryosphere, 7, 1227–1245, https://doi.org/10.5194/tc-7-1227-2013, 2013.
Zemp, M., Huss, M., Thibert, E., Eckert, N., McNabb, R., Huber, J., Barandun, M., Machguth, H., Nussbaumer, S. U., Gärtner-Roer, I., Thomson, L., Paul, F., Maussion, F., Kutuzov, S., and Cogley, J. G.: Global glacier mass changes and their contributions to sea-level rise from 1961 to 2016, Nature, 568, 382–386, https://doi.org/10.1038/s41586-019-1071-0, 2019.
According to the Language Secretariat of Greenland (Oqaasileriffik.gl), the official name is spelled as Frejagletsjer (formerly Frejagletcher). While Ahlmann (1946) used Fröya Glacier, in Higgins (2010) the spellings Fröjabreen, Frøya Glacier, and Fröya Glacier were also used. In recent scientific literature (Schöner et al., 2009), the spelling Freya Glacier has been used.
Due to technical problems, the webcams have been offline since April 2024, but older camera images can still be found here.


