the Creative Commons Attribution 4.0 License.
the Creative Commons Attribution 4.0 License.
Multitemporal UAV lidar detects seasonal heave and subsidence on palsas
Mats Olvmo
Sofia Thorsson
Björn Holmer
Heather Reese
In the context of the accelerating impacts of climate change on permafrost landscapes, we use an uncrewed aerial vehicle (UAV) carrying a lidar scanner to investigate seasonal terrain changes in palsas – mounds of frozen peat – since other remote sensing methods have struggled to capture the full dynamics of these landforms. We investigated two palsas (4–5 m in height) in Sweden's largest palsa mire complex, where we performed five field campaigns between September 2022 and September 2023 to track intra-annual frost heave and thaw subsidence. Our approach allowed us to create digital terrain models (DTMs) from high-density point clouds (> 1000 points m−2) and analyze elevation changes over time. We found that both palsas heaved on average 0.15 m (and up to 0.30 m) from September to April and subsided back to their height from the previous year, or slightly below, over the course of the following summer. At one of the palsas, we observed a notable lateral degradation hotspot over the study period in a 225 m2 area, with 0.5–1.9 m height loss, likely initiated during the preceding warm and wet summer months. Part of this degradation occurred between September 2022 and April 2023, suggesting that the degradation of these palsas is not limited to the summer months. Our study shows the substantial value of using UAV lidar for understanding how permafrost areas are changing. It facilitates tracking the ongoing effects of climate change and highlights palsa dynamics that would not be captured by annual measurements alone.
- Article
(12386 KB) - Full-text XML
- BibTeX
- EndNote
In the face of accelerating climate change, permafrost – defined as ground that remains at or below 0 °C for at least 2 consecutive years (Harris et al., 1988) – is warming at a global scale (Biskaborn et al., 2019). Permafrost regions hold approximately 50 % (1300 ± 200 Pg) of the world's terrestrial carbon, making them vital to the global climate system (Hugelius et al., 2020). A significant amount (415 ± 150 Pg carbon) is stored in northern peatlands, nearly half of which is affected by permafrost (Hugelius et al., 2020). In the discontinuous and sporadic permafrost zones, peatland permafrost can be found in palsa mires, consisting of peat plateaus and palsas. Palsas are peat mounds with a core of perennially frozen soil (Seppälä, 1986). Palsa mires are sensitive and heterogeneous ecosystems, which are vulnerable to increased air temperatures and precipitation in the Arctic (Luoto et al., 2004a).
The climatic space for palsas, typically with a mean annual air temperature between −3 and −5 °C and mean annual precipitation < 450 mm, according to Luoto et al. (2004a), is projected to disappear in Fennoscandia by the end of the 21st century (Fewster et al., 2022). In recent studies, an increasing lateral degradation rate of palsas has been reported (Borge et al., 2017; Mamet et al., 2017; Olvmo et al., 2020), which may have far-reaching consequences for these ecosystems and the biodiversity of the subarctic region (Luoto et al., 2004b; Swindles et al., 2015). For example, the loss of palsas can lead to the decline of specialized plant species that are adapted to the unique, dry conditions of palsas. Additionally, animals that depend on these habitats, such as certain bird species and small mammals, are affected (Luoto et al., 2004b). In addition to the threat to biodiversity, the degradation of palsas also impacts reindeer herding, berry picking, and transport for local communities, as these elevated, often dry, parts of the landscape shrink and become more fragmented. The transition from a palsa to a lower-lying wet fen is also associated with an increase in CH4 and CO2 emissions (e.g., Łakomiec et al., 2021; Pirk et al., 2024; Swindles et al., 2015; Voigt et al., 2019) as the stored carbon in these peatlands is subject to microbial re-mobilization when permafrost thaws. The climatic feedback mechanism further highlights the need for continued monitoring of these environments. Therefore, palsa mires are a priority habitat of the EU Species and Habitat Directive (EUNIS – Factsheet for Palsa Mires, 2013). However, in Sweden only about half (47 %) of the total palsa area is situated within a protected area (Backe, 2014).
The degradation of permafrost in palsas is indicated by both lateral erosion and vertical subsidence. Lateral erosion refers to the horizontal shrinkage of the permafrost body along the edges of palsas, often resulting in the formation or expansion of connected water bodies, i.e., thermokarst lakes (Martin et al., 2021). Vertical subsidence, on the other hand, involves the downward sinking of the ground surface as a result of the melting of excess ground ice, leading to a drop in surface elevation. In addition to this, the elevation of permafrost terrain fluctuates cyclically due to annual freeze–thaw cycles within the active layer (Gruber, 2020; Iwahana et al., 2021), although this has not been explicitly studied on palsas. During fall, freezing of water in the soil and its expansion, in addition to the formation of seasonally segregated ice, can cause heaving of the terrain, while terrain subsidence, caused by the melting of both pore ice and segregated ice, occurs during spring and summer (Fu et al., 2022). The melting of excess ground ice (i.e., ice that is in excess of the total pore volume of the ground in unfrozen conditions; Harris et al., 1988) below the active layer causes longer-term subsidence as a result of permafrost thaw. Therefore, thaw subsidence rates are generally higher in ice-rich than in ice-poor permafrost soils (Gruber, 2020; Zwieback and Meyer, 2021).
While there is growing awareness of the importance of monitoring palsa mires, there is a lack of quantitative measurements of their intra-annual heave and subsidence patterns. De la Barreda-Bautista et al. (2022) used interferometric synthetic aperture radar (InSAR) data to analyze thaw-season subsidence on palsas in northern Sweden, finding only sub-centimeter-scale surface level changes. They suggest that this method likely highly underestimated actual displacement rates as a result of spatial averaging. In other recent studies with attempts to quantify both lateral and vertical changes in palsas or peat plateaus, the focus was on multi-year timescales (e.g., Martin et al., 2021; Verdonen et al., 2023) and not on changes occurring within a year. UAV photogrammetry to create digital surface models (DSMs) to study palsas and peat plateaus has been applied more frequently in recent years (e.g., de la Barreda-Bautista et al., 2022; Krutskikh et al., 2023; Martin et al., 2021; Verdonen et al., 2023). However, as described in Verdonen et al. (2023), change analysis from DSMs created with UAV photogrammetry is sensitive to relatively minor changes in vegetation and light conditions. Advances in uncrewed aerial vehicles (UAVs or drones) in combination with light detection and ranging (lidar) technology (Ostrowski et al., 2017) have made it possible to collect accurate, high-resolution (centimeter-scale) digital terrain models (DTMs) and DSMs. Lidar sensors can prove advantageous over regular photographic red–green–blue (RGB) imagery, in that lidar can penetrate through small gaps in the vegetation, allowing the creation of DTMs of the underlying ground, whereas terrain elevation models from RGB cameras require clear sight to the ground surface. Lidar can also be used in low-light conditions as opposed to RGB imagery, which can be beneficial in the Arctic, where daylight is limited during parts of the year. Another advantage that UAV lidar data holds is the absence of the need for ground control points (GCPs) due to the potentially low bias of UAV lidar data positional errors. This advantage drastically saves time and thus costs on repeated visits (Harder et al., 2020). Therefore, the use of repeat UAV lidar scanning is a promising tool for accurate change detection (Curcio et al., 2022; Harder et al., 2020; Jacobs et al., 2021; Lin et al., 2019) but has not yet been widely used to monitor permafrost features. In this study, our objective is to detect and quantify the intra-annual vertical heave and subsidence of two palsas using repeat measurements from UAV lidar data.
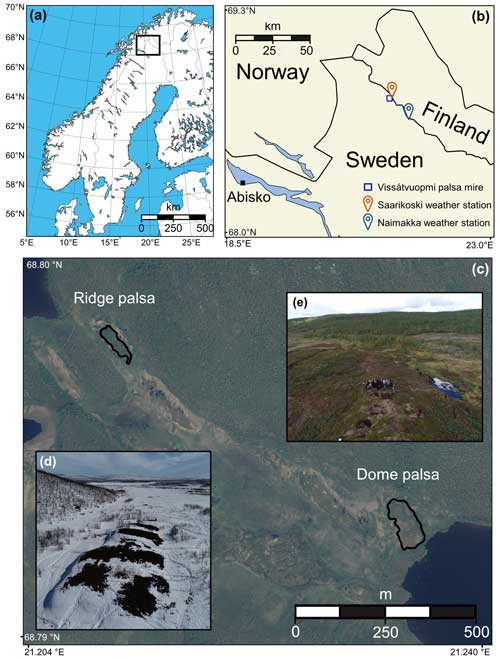
Figure 1(a, b) Location of the Vissátvuopmi palsa mire complex and the weather stations used in northern Sweden. (c) Orthophoto from 2021 (© Lantmäteriet, 2021) showing a segment of the palsa mire and the location of the two studied palsas. (d) Oblique UAV image highlighting the partly snow-covered Ridge palsa in April 2023. (e) Oblique UAV image of the Dome palsa in September 2023.
Located near the Finnish border and just southwest of the Könkämäeno river, Vissátvuopmi is the largest of the eight named coherent palsa mire complexes in Sweden (ca. 150 ha of palsa area; Backe, 2014) at 68°47′50′′ N, 21°11′30′′ E (Fig. 1). According to InSAR data from 2017, 55 % of the total area of these eight palsa complexes is subsiding compared to 98 % of the Vissátvuopmi area (Valman et al., 2024). Notably, Vissátvuopmi and Árbuvuopmi (northwest of Vissátvuopmi) are not part of the EU Natura 2000 network.
Surrounded by mountains up to 700 , the valley in which Vissátvuopmi is located has several larger lakes, thermokarst features, and fens. Two distinct palsas, one ridge-shaped and one dome-shaped (called the “Ridge” and “Dome” palsas from here on) situated at the foot slope of a bedrock hill, are the focus of this study and are located between 443 and 452 (Fig. 1c). Water tables typically do not rise above the mire surface in most of the surroundings of the two studied palsas, except for thermokarst ponds that border the palsas. In September 2023, the Dome palsa was approximately 170 m in length and 75 m in width, with an area of 11 408 m2, and its highest point was about 4 m above the surrounding mire. The Ridge palsa measures about 125 m in length and 40 m in width, with an area of 3522 m2, and its highest point was roughly 5 m above the adjacent mire terrain. The Dome palsa is taller on its northern and eastern sides, while it flattens out on the western and southern sides. An all-terrain vehicle (ATV) track runs over the northeastern part of the palsa, which most certainly contributes to amplified degradation of the underlying permafrost by collecting snow and water. The track is visible in aerial photos from 1994 but is absent in the 1963 photos. A natural depression in the center part of the palsa has the same effect and further fragments this palsa. The Ridge palsa is smaller in area but slightly taller. This palsa consists of several crests of similar elevation with depressions in between. The southeastern margin of this palsa is “tail-shaped” and of lower elevation.
The vegetation over the palsa mire complex is characterized by a mosaic of marshes with grasses and sphagnum mosses, wet heaths with willow, and drier areas with subalpine shrub heath. Birch forest occurs primarily on the slopes surrounding the mire; however, birches are also growing within the palsa mire complex. The palsa vegetation consists of dry heath and mesic heath (Andersson et al., 1985), where the field layer is predominantly low-growing Betula nana (< 35 cm in mean height), Empetrum nigrum ssp. hermaphroditum, and Rubus chamaemorus. The bottom layer consists of lichens in higher and drier areas of the palsa, while sphagnum mosses are in lower-lying, wetter areas. At the edges of the palsa, particularly where pools of water have formed, grasses such as Carex rotundata and C. saxatilis are common, in addition to Eriophorum russeolum (Backe, 2014). The Ridge palsa has a few birch trees growing on the north and south parts of the palsa.
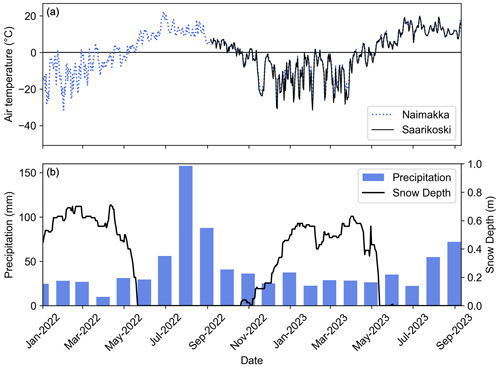
Figure 2Weather data in the study region between January 2022 and September 2023. (a) Mean daily air temperature at ca. 1.5 km (Saarikoski) and at ca. 18 km (Naimakka) from the studied palsas. (b) Monthly precipitation and snow depth observed at Saarikoski.
The Köppen climate type is subarctic (Dfc) and a weather station operated by the Swedish Meteorological Institute (SMHI) in Naimakka (established in 1944), ca. 18 km east of the study site, observed a mean annual air temperature of −1.5 °C and mean annual precipitation of 460 mm in the 1991–2020 standard period. In September 2022, a HOBO® U30-NRC (Onset Computer Corporation) weather station was set up in the nearby settlement of Saarikoski, ca. 1.5 km from the study site (see Fig. 1b for location of the two weather stations). At this station, air temperatures at 2 m above the ground surface are recorded at 2 h intervals. Both precipitation and snow depth have been monitored by SMHI since 2015 at Saarikoski. It is notable that in July 2022 the monthly precipitation was 158 mm, which is more than one-third of the mean annual precipitation (Fig. 2).
Based on aerial photo interpretation, Olvmo et al. (2020) reported average areal decay rates of −0.71 % yr−1 and −1.25 % yr−1 in the Dome and Ridge palsa, respectively, between 1955 and 2016. Additionally, they concluded that palsas in the Vissátvuopmi complex have most likely been in a phase of degradation since the early 20th century.
3.1 Lidar data acquisition
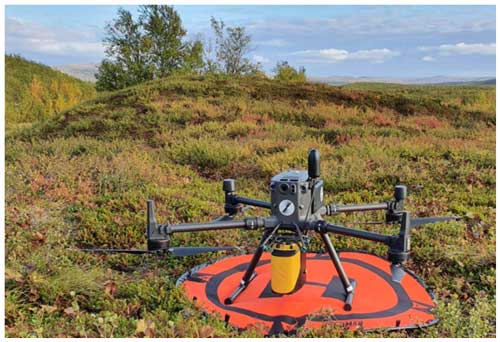
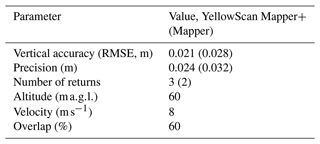
We used repeat UAV-borne lidar scanning to obtain point clouds and create raster-based DTMs at a high temporal and spatial resolution. Flights were performed on 4 September 2022, 26 April 2023, 18 June 2023, 19 July 2023, and 7 September 2023. We conducted the scans on these dates to capture the state of the palsas at the end of summer, then observed them when frozen and continued tracking them throughout the proceeding thawing season. A DJI Matrice 300 RTK UAV was equipped with a YellowScan Mapper (YSM) lidar scanner in September 2022 and a YellowScan Mapper+ (YSM+) in all following flights (Fig. 3). These are lightweight Livox lidar scanners with an Applanix GNSS/INS system. Table 1 shows the properties of the flights and scanner(s). The vertical accuracy and precision of these specific lidar scanners are determined by the manufacturer. They performed 15 flight lines for YSM+ and 13 for YSM at velocities between 5 and 10 m s−1 and between heights between 50 and 120 over a series of surfaces. The assessment with 18 ground-truth points resulted in the values given in Table 1. All surveys in this study were performed within 1 year of the calibration. For both palsas, a flight with high overlap was done and supported by a second flight with additional orthogonal trajectories. The same flight plans were executed for all five scans to ensure equal spatial coverage and resolution.
Table 1Lidar scanner and flight parameters of the flight missions. Where values for YellowScan Mapper differ from YellowScan Mapper+, they are shown within parentheses.
The April 2023 flights were performed during a period of snowmelt so that parts of both palsas were snow-free, while other parts remained snow-covered. Consequently, in order to investigate changes in terrain elevation, the snow-free parts needed to be isolated for analysis. For that reason, flights with a second UAV (DJI Phantom 4 Pro v2.0) with an RGB camera to create orthomosaics were performed on the same day as the lidar scanning.
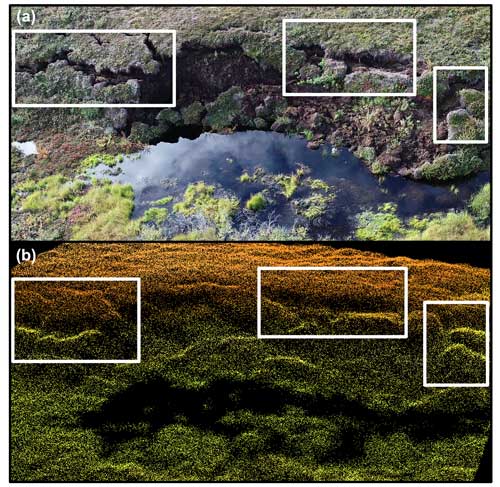
Figure 4(a) RGB photo of a degrading edge and formation of a thermokarst lake at the Dome palsa, taken with a DJI Phantom 4 UAV in September 2022. (b) Dense UAV lidar point cloud taken on the same day with the DJI Matrice 300 RTK equipped with the YellowScan Mapper. Morphological features such as cracks in the surface and individual blocks of peat can clearly be recognized in the point cloud. This section of the palsa reaches a height of ca. 4 m.
Regarding the UAV lidar flights, the average flight time was 6 min and 49 s over the Dome palsa and slightly shorter over the Ridge palsa at 5 min and 13 s. Similarly, flights over the Dome palsa yielded a slightly larger coverage area of 53 993 m2 compared to the Ridge palsa, which covered an area of 42 072 m2, including part of the surrounding mire and forested mountain. The mean point densities over the Dome palsa were 1327 (YSM) and 1462 (YSM+) points m−2 and 1201 (YSM) and 1519 (YSM+) points m−2 at the Ridge palsa. These pulse densities can be regarded as very high, easily allowing the creation of DTMs with high spatial resolution. Terrain features such as surface cracks and blocks of peat are clearly identifiable in the lidar point cloud data, which emphasizes the high quality of the collected data (Fig. 4).
3.2 Point cloud processing and DTM creation
The processing of a lidar point cloud requires several steps, including GPS correction, strip adjustment, classification of ground points, and the creation of a DTM raster. The position data captured by the lidar system during the flights were post-processed in PosPac UAV v. 8.2 (Trimble Applainix, 2023) using PP-RTX for trajectory correction. PP-RTX for UAV uses the Trimble CenterPoint® RTX™ correction service, which computes corrections to satellite orbit and clock data for trajectory correction and positioning based on a global network of tracking stations. This cloud-based solution gives centimeter-level positioning accuracy without the requirement to set up a local base, which makes PP-RTX particularly advantageous for UAV surveys in remote regions. YellowScan's processing software, CloudStation (YellowScan, 2023), was then used for strip adjustment to reduce the relative adjustment error. The point clouds were compared visually for alignment in areas where changes were least likely. Following this, CloudCompare v. 2.12.4 (Girardeau-Montaut, 2023) was used to perform the classification of points into ground and non-ground points using the cloth simulation filter (CSF) (Zhang et al., 2016). The CSF method simulates a virtual cloth dropping onto the inverted point cloud. Points that are close to where the cloth settles are classified as ground, while those that are farther away are considered non-ground. The software allows three adjustable parameters for the CSF classification. Several parameter combinations were tested, and the best result, based on visual inspection of the resulting point cloud, was achieved with the following parameters: “cloth resolution” = 0.10 m (matching the resolution of the created DTMs), “max iterations” = 500, and “classification threshold” = 0.10 m (controlling the distance of points to be classified as ground), resulting in a detailed ground surface. Only ground points were then used to create the DTM, and in this project a grid cell resolution of 0.10 m was chosen. Since the total thickness of the point cloud along the ground was between ca. 0.10 and 0.30 m, the minimum elevation per grid cell was used during the rasterization in order to ensure that the raster represents the ground elevation. A comparison of the lowest point and the 25th percentile elevation in 100 random 0.10 m by 0.10 m areas on each palsa was carried out, which showed no outliers at the ground level. This process was carried out for all five time points, creating a DTM for each scanning and palsa. Finally, the resulting DTMs were used for change detection by subtracting values of one raster from another. For the change detection, the error range was calculated following the topographic error propagation law (Taylor, 1997), where the propagated error was described as the root sum of squares (RSS) of individual errors. For the individual errors, those described in Table 1 were used.
The snow-free parts of the palsas from the April 2023 data were singled out for the computation of heave and subsidence. These areas were identified using georeferenced orthophotos taken on the same day in April as the lidar data, in combination with a hillshade image from the DTM (since the hillshade is smooth where there is snow). Orthophotos that were taken on the same day as the lidar surveys in September 2022 and September 2023 were used to determine the extent of the palsas. For each DTM, the mean elevation of the palsa's surrounding was computed and subtracted from the DTM, which normalizes the elevation of the palsa into the height above the surroundings. Since the definition of palsas is morphological (Harris et al., 1988), the height above its surroundings is per definition the height of the palsa. For the normalization, we used the previously mentioned orthophotos to create a polygon around each palsa, for which the mean elevation was taken per lidar flight. Areas containing open water at any of the time steps, either thermokarst lakes directly around the palsas or other ponds, were not included in these polygons. The transformation from elevation to height simplifies the comparison between the data from the different flights. Since the mire in April was snow-covered, the mire elevation from the closest date (June) was taken for normalizing the April DTM.
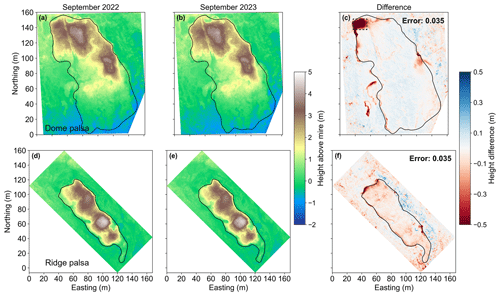
Figure 5DTMs of the Dome (a, b) and Ridge (d, e) palsas on UAV lidar scans in September 2022 and September 2023. The black lines represent the extent of the palsas based on orthomosaics from the same day as the UAV lidar surveys. The difference maps (c, f) show the topographical changes over 1 year, with the palsa extent from the September 2022 orthomosaics in black. The dashed box in (c) shows the “degradation hotspot” on the Dome palsa.
4.1 Annual terrain changes from UAV lidar
Between September 2022 and September 2023, both palsas underwent degradation along their margins (Fig. 5). The largest height change was observed along the northwest edge of the Dome palsa, where an area of 225 m2 (2.6 % of the total palsa area) subsided up to 1.9 m and on average 0.85 m. This corresponds to a 34 % height loss on this part of the palsa. From here on we name this 225 m2 area the “degradation hotspot”. Degradation also occurred within the ATV track that borders the eastern side of this degradation hotspot. The height of the Ridge palsa decreased slightly over the entire landform, with the most loss along the margins in the form of lateral degradation.
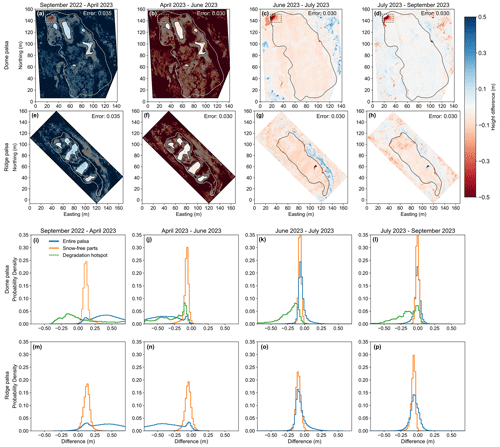
Figure 6Sequential height difference maps of the Dome (a–d) (with the “degradation hotspot” in the dashed rectangles) and Ridge (e–h) palsas between the five UAV lidar DTMs from September 2022 to September 2023. Each panel showcases the topographical changes over successive intervals. Blue indicates elevation gains and red indicates elevation losses. The snow-covered areas (a, b, e, f) are grayed out, leaving the snow-free parts highlighted. Panels (i–p) display histograms with the distribution of height changes, separated into the entire palsa area (including snow-free parts), snow-free parts only, and the degradation hotspot on the Dome palsa.
4.2 Seasonal terrain changes from UAV lidar
By comparing DTMs from consecutive periods, we observed intra-annual terrain variations, i.e., frost heave and thaw subsidence, on the two studied palsas. Change maps for the different time steps are shown in Fig. 6a–h, while Fig. 6i–p show corresponding histograms of change. The first two time steps are largely affected by snow cover in April; hence, the histograms of change show both the entire palsa and only the snow-free parts (Fig. 6i–p).
On the snow-free crests there was an elevation increase (heave) of up to 0.30 m and on average of 0.15 m from September 2022 to April 2023 for both palsas (Fig. 6a and e). Between June and July, both palsas clearly subsided over the whole area (Fig. 6c and g), on average 0.05 m on the Dome palsa and 0.08 m on the Ridge palsa. Subsidence from July to September is only clear on the Ridge palsa, with 0.05 m on average over the entire palsa (Fig. 6h). Despite being snow-covered in April, the degradation hotspot in the northwestern part of the Dome palsa displayed a height decrease of up to 0.4 m between September 2022 and April 2023 (Fig. 6a and i), indicating that subsidence in this area occurred between these months.
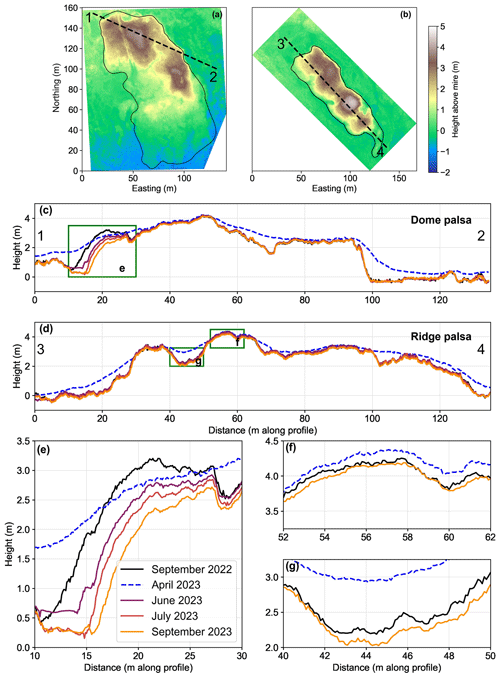
Figure 7Elevation profiles of the Dome and Ridge palsa based on UAV lidar DTMs from September 2022 to September 2023. (a, b) September 2022 DTMs with the corresponding palsa outline. The dashed lines denote the location of elevation profiles 1–2 and 3–4. Panels (c) and (d) provide a general elevation overview of the transect, while (e–g) offer zoomed-in views of specific areas of interest, indicated by the green boxes. The profile from April 2023 mostly shows the snowpack, although some peaks are snow-free (see also Fig. 1d).
Figure 7 shows a time series of elevation changes along profiles, providing another way to look at the heave and subsidence. The degradation hotspot is seen in Fig. 7c and e, where this area progressively degraded vertically up to 1.9 m between September 2022 and September 2023. The ATV track that crosses the Dome palsa shows a subsidence of 0.2–0.3 m over the time period in this study (at ca. 27–29 m in Fig. 7e). On the Ridge palsa it can be seen in Fig. 7f and g that the subsidence was greater in the depressions than on the crests. Heterogeneous snow cover is visible in Fig. 7c and d. The snow thickness is up to ca. 2.0 m at the eastern margin of both palsas and 1.0 to 1.5 m in the depressions, while the crests remain snow-free (see also Fig. 1d).
The mean height of both palsas, calculated by taking all pixels within the snow-free areas, increased 0.15 m between September 2022 and April 2023 (Fig. 8). The subsequent flights throughout the summer season show a successive lowering of the palsa height, i.e., subsidence. As shown in Fig. 6, the rate of subsidence is highest between the June and July flights. The Dome palsa returned to a similar mean height in September 2023 compared to September 2022, while the snow-free parts on the Ridge palsa subsided to a 0.04 m lower mean height in September 2023 than in September 2022, which is also shown in Fig. 5. Overall, the heave and subsidence pattern is very similar across the two studied palsas.
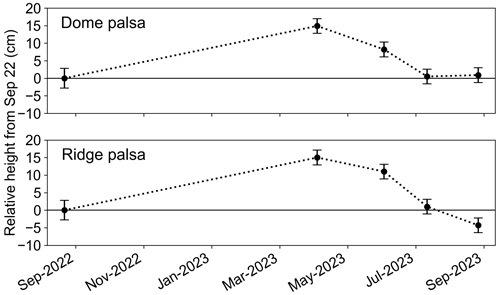
Figure 8Heave and subsidence on the two studied palsas during the 2022–2023 year. Mean height changes relative to September 2022 are plotted (only for the areas that were completely snow-free in April 2023). The cumulative changes in the intermediate steps add up to the total change from September 2022 to September 2023. The error bars represent the scanner-specific RMSE for the respective lidar scanners used.
5.1 Intra-annual heave and subsidence on palsas
The objective of this study was to elucidate and quantify the intra-annual dynamics of two large palsas in the Vissátvuopmi palsa mire, and to achieve this, the use of UAV lidar proved to be an extremely suitable tool. Analysis of the DTMs indicated that both palsas had frost heave of ca. 0.15 m on average between September and April and subsequent thaw subsidence from April to September. This is the first study that covers these dynamics on palsas at such high spatial resolution, although seasonal terrain variability has been investigated in other permafrost environments (Gruber, 2020; Hu et al., 2022; Iwahana et al., 2021; Lin et al., 2019). For example, the heave and subsidence detected in this study are similar to values (0.10–0.14 m) observed in the GNSS positioning survey by Iwahana et al. (2021) on an intact tundra site in Alaska after the warm summer of 2019.
The largest rate of subsidence in our study occurred between June and July 2023, which was 0.05 m on the Dome palsa and 0.08 m on the Ridge palsa. Freeze–thaw cycles within the active layer cause frost heave and thaw subsidence, partially due to the density difference between water and ice. However, the average observed heave of 0.15 m cannot be explained by this process alone and requires the formation of seasonal segregation ice (i.e., ice lenses) within the active layer (Fu et al., 2022; Iwahana et al., 2021). Alternatively, processes within the core of the palsa, for example the infiltration and refreezing along meltwater pathways, might result in seasonal heave and subsidence. To make more conclusive statements about the exact mechanisms, it would be necessary to obtain complementary observations from the interior of these palsas in the form of soil and ice cores. Taking this step in the future would allow the observed changes in the terrain morphology such as those seen here to be better understood in relation to internal palsa dynamics.
The 0.15 m heave is computed on the areas that were snow-free in April and are thus biased towards the crests of the palsas that have a thinner active layer (see Appendix A) as they have a thinner winter snow cover, which limits the insulation of the ground below. Since the magnitude of the heave and subsidence depends on the thickness of the active layer (Iwahana et al., 2021), the areas with a deeper active layer (i.e., those not included in the computation due to remaining snow in April) are therefore expected to have undergone an even larger increase in height between September 2022 and April 2023. A process other than freeze–thaw dynamics that could have affected the lidar measurements is the seasonal oscillation of the peatland surface height due to water table fluctuations, called “mire breathing” (Kellner and Halldin, 2002; Roulet, 1991). By accounting for the elevational changes in the ground surface of the surrounding mire (and thus not open water), we ensure that the presented height values reflect the height of the palsa mounds and thus hold true to the morphological definition of palsas. Since palsa mires are very dynamic landscapes, each correction brings uncertainties. The closely aligned elevation profiles (Fig. 7) give us confidence that the presented height changes are primarily a result of freeze–thaw dynamics of the palsas.
While other studies have applied multitemporal lidar for detecting permafrost dynamics, they have used terrestrial lidar scanning (Anders et al., 2020) rather than UAV-borne lidar or else interannual airborne lidar (e.g., Douglas et al., 2021; Jones et al., 2015), which generally has meter-scale spatial resolutions and infrequent revisit periods. Anders et al. (2020) performed three terrestrial laser scanning (TLS) measurements over 14 months (June 2015, August 2015, and August 2016) to observe thaw subsidence of a permafrost area in Northwest Territories, Canada, finding a total change of 1.4 cm; they determined that the TLS measurements were more accurate than those from field-based surveying. While promising, the mobility and range of UAV lidar are particularly advantageous when surveying permafrost features in peatland or wetland landscapes.
Another approach to quantify longer-term subsidence and the effect of seasonal freeze–thaw dynamics on topography is through the use of InSAR remote sensing (de la Barreda-Bautista et al., 2022; Kou et al., 2021; Valman et al., 2024; Yanagiya et al., 2023), which can be an effective method to detect the signal of subsidence. De la Barreda-Bautista et al. (2022) reported a maximum subsidence rate of 1.5 cm from InSAR data between 2017 and 2020 on a palsa plateau ca. 100 km from the Vissátvuopmi palsa complex. Due to the coarser grid cell size (20 m) of the resulting data, it is likely to underestimate actual heave and subsidence values of smaller isolated features such as palsas. Over the same period and location, they observed 25 cm subsidence from DEMs created with UAV photogrammetry. InSAR subsidence has also been analyzed at the Vissátvuopmi palsa complex (Valman et al., 2024), finding that Vissátvuopmi and the adjacent Árbuvuopmi are the fastest-subsiding complexes of the eight studied in northern Sweden, with maximum subsidence rates of −8.9 and −9.9 mm yr−1 between 2017 and 2021. While the absolute values are not comparable to subsidence rates from our UAV lidar data, possibly due to the larger grid cell size from InSAR analysis, they give important context for the subsidence trend across the entire palsa complex in the years right before our study period. The fact that Vissátvuopmi is among the most quickly deforming complexes and at the same time does not hold a protected status emphasizes the importance of studies conducted here.
In our study, we show that the elevation change of the Dome palsa as a whole from September 2022 to September 2023 was minor and mostly within the 0.030 m error range, while the Ridge palsa subsided on average 0.07 m within 1 year. A hypothesis for this is related to the surrounding thermokarst ponds. The Ridge palsa is surrounded by relatively larger and deeper thermokarst ponds, which could enhance vertical subsidence more centrally in the palsas as a result of increased heat transfer to the palsa core. To find out if the higher subsidence on this palsa is a robust signal and what processes are responsible for this, continued annual lidar surveys and observations of the palsa's interior via geophysical imaging are needed.
5.2 Lateral palsa degradation
The time series from this study not only showed the seasonal heave and subsidence patterns, but also revealed a degradation hotspot on the Dome palsa that formed between September 2022 and April 2023. By comparing the elevation profiles and histograms of change for these two timestamps at the degradation hotspot (Figs. 7e and 6i), we can see that a drop of up to 0.4 m happened within the autumn and/or winter season, despite the presence of snow cover in April. It is important to consider that positive air temperatures persisted until the end of October 2022 (Fig. 2), which suggests that the subsidence likely continued into the late autumn 2022 period, influenced by prolonged thawing conditions. Whether this entire drop in palsa height occurred solely between the September 2022 campaign and the freeze-up of the entire active layer or if gravitational processes also contributed after the complete freeze-up remains uncertain. Regarding the initiation of the degradation at this location, it is likely that it was ongoing earlier in the summer of 2022. Both the air temperatures (> 20 °C) and precipitation (158 mm) (both measured at Saarikoski weather station) peaked in July of that year, which could have resulted in a deeply thawed, saturated upper layer of the palsa and initiated a progressive lateral degradation event. Additionally, the precipitation in this winter was greater than the previous winter, which may have caused additional warming of the ground, either via a thicker snowpack (Zhang, 2005) or latent heat brought by rainfall (Putkonen and Roe, 2003). This falls in line with Olvmo et al. (2020), who conclude that increased winter precipitation is one of the main causes of rapid palsa degradation in the study region.
The characteristic of this degradation hotspot is similar to that described in Martin et al. (2021) as “constant edge degradation”, which they found to be the second phase of lateral degradation on peat plateaus following “initial slope adjustment” and preceding “plateau collapse” phases. While both the spatial and temporal scales differ between their study and our study, this could indicate that a more widespread collapse or subsidence can follow on the Dome palsa. As described in Valman et al. (2024), approaches that identify initial signs of permafrost degradation with the use of repeated measurements are needed, to which our study adds. In order to make more conclusive statements about the reason for this rapid degradation, the monitoring of ground temperatures and knowledge of the internal structure of this palsa are required. The degradation hotspot could be just an isolated event or a precursor to rapid degradation in the following years.
Olvmo et al. (2020) found an average annual decay rate (loss of palsa area) of −0.74 % yr−1 and −2.45 % yr−1 for the Dome and Ridge palsas, respectively, for the period 2010–2016. Using the palsa area from Olvmo et al. (2020) in 2016 and the extent in 2023 from our study, we can calculate a new annual decay rate. For the period 2016–2023, we found respective rates of −3.27 % yr−1 and −1.55 % yr−1. The −2.53 % yr−1 change in decay rate on the Dome palsa can be largely explained by the degradation hotspot, which covered ca. 2.6 % of the total palsa area. The slight decrease in annual decay rate on the Ridge palsa could be explained by a stabilization of degraded areas. When excluding the degradation hotspot on the Dome palsa, the Ridge palsa lost a larger percentage of its extent, similar to findings in Olvmo et al. (2020). Again, lateral water fluxes greatly affect ground temperatures and permafrost degradation (Martin et al., 2021; Sjöberg et al., 2016; Walvoord and Kurylyk, 2016). Therefore, smaller palsas are relatively more susceptible to lateral erosion through heat and water fluxes, provided by surrounding thermokarst ponds, compared to larger palsas (e.g., Borge et al., 2017).
5.3 Using UAV lidar to monitor permafrost landscapes
The use of UAVs in assessing permafrost landscapes has increased in recent years (e.g., de la Barreda-Bautista et al., 2022; Krutskikh et al., 2023; Martin et al., 2021; Siewert and Olofsson, 2020; Sjögersten et al., 2023; Verdonen et al., 2023), although primarily with the use of photogrammetry. Changes in the exterior of permafrost peatlands can be subtle and therefore require the use of highly accurate methods of measuring ground elevation, particularly for vertical subsidence, and when the study has a relatively short timescale.
A challenge in permafrost environments, especially palsa mires, is the lack of stable elevation points to be used for ground control points (GCPs). In this study, GCPs were not used; however, all point clouds were obtained using GNSS, post-processed as described in Sect. 3.2, and visually checked over the whole scanned area for consistency. The elevation profiles (Fig. 7) from the five campaigns are well-aligned and thereby confirm that the positional data are highly accurate. As mentioned by Harder et al. (2020), the use of GCPs is not strictly necessary for UAV lidar applications, which significantly contributes to efficient field visits in harsh Arctic conditions.
In this study, we employed the YellowScan Mapper (YSM) system in September 2022 and the YellowScan Mapper+ (YSM+) in the four campaigns in 2023. The use of an upgraded lidar system after the first scanning introduces a potential source of uncertainty in our measurements. However, both systems achieved high point densities (> 1000 points m−2), ensuring detailed surface representation in both datasets despite the difference in the number of recorded returns per pulse. Furthermore, the alignment and positioning of the data were visually verified, showing that the impact of using different systems on our results is minimal. The vertical accuracy of the YSM and YSM+ systems used here has an RMSE of 2.8 and 2.1 cm, respectively. This is a potential error source in the data, and changes less than the propagated error (see Fig. 6a–h) are within the margin of error. The main findings of the study, which include the observed 0.15 m mean heave in winter and associated subsidence over summer and the identification of a degradation hotspot, are larger than the described error. Both YellowScan lidar systems have a minimum distance of 1 m between registered returns at a flying height of 60 m. This means that all objects on the surface shorter than 1 m in height will be measured by a single return. In this case, measuring the ground elevation underneath vegetation cover requires high point density, which was acquired in this study. By using the minimum elevation per grid cell, the resulting DTM should exclude vegetation heights. In our study, the diffuse cover of Betula nana ranged from 0 % m−2–100 % m−2 over both palsas, yet the ground could almost always be seen between the sparse branches. Careful consideration of acquisition parameters and algorithms is needed when UAV lidar is to be used to create DTMs in areas of extremely dense vegetation cover or when small grid cell sizes are needed to allow determination of the ground elevation (Kucharczyk et al., 2018).
The ability of lidar instruments to measure ground elevation below the vegetation canopy is one of the major advantages that lidar has over photogrammetry. Figure 3 shows, for example, the Ridge palsa with several large birch trees, where terrain analysis can still be done below the canopy. Photogrammetry creates surface models that consist of vegetation height, which is likely to increase over the vegetation season, adding bias to the models. The observed frost heave and subsidence in our study would not have been soundly established with just the use of photogrammetrically derived surface models due to the potential confusion between vegetation and ground height. A disadvantage when comparing lidar and photogrammetric methods is the higher costs of UAV lidar scanners at the present time. For that reason alone, when one's objective is to merely compare the perimeter of palsas (e.g, lateral degradation) or other landforms with low-growing vegetation, photogrammetry might still be preferred. While some UAV lidar systems can also be integrated with an RGB camera, due to the additional costs, this was not done in this study. The main advantage that this would give is improved visualization through the use of colorized point clouds, and it could thereby improve the delineation of, for example, snow-covered (or snow-free) areas. UAVs present several advantages over “classic” airborne lidar surveys, including higher-spatial-resolution DTMs, simpler planning, and reduced costs, particularly for smaller spatial extents. Additionally, the increased temporal frequency achievable with UAVs enables more frequent data acquisition, which is essential for monitoring intra-annual dynamics in permafrost landscapes.
This study has provided insights into the intra-annual dynamics of palsas through the use of repeat UAV lidar measurements, which we highlight as an effective tool for detailed change detection in permafrost landscapes. We present a unique time series of five UAV lidar campaigns during a 1-year time span on two large palsas in Sweden's largest coherent palsa mire complex. The study revealed seasonal variations in the palsas' topography, with an average frost heave and thaw subsidence of 0.15 m (and up to 0.30 m), with the highest rate of subsidence on the palsas between June and July. The time series also shows a considerable lateral degradation hotspot in a 225 m2 section of one of the palsas, with subsidence of up to 1.9 m over the 1-year study period. This substantial permafrost degradation occurred between September 2022 and April 2023, which suggests that the degradation of palsas is not limited to the summer months. To conclude, repeat UAV lidar scanning has proven to be a highly effective tool for capturing detailed seasonal measurements of permafrost dynamics, which would not have been observed if only annual measurements had been taken.
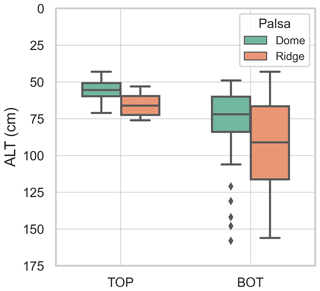
The thickness of the active layer (ALT) was measured in September 2023 at both the Dome and the Ridge palsas by inserting a 1.80 m steel rod until the top of the frozen ground was met. The points (Fig. A1) are either within the polygons of the parts that were snow-free in April 2023 (see Fig. 6a, b, d, and e) or in a lower part of the palsa. The former points are assigned TOP, while the latter are assigned BOT. The points in the TOP class have a thinner and more narrowly spread ALT compared to the points in the BOT class (Fig. A2).
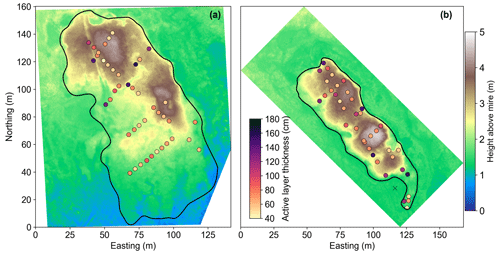
Figure A1Active layer thickness (ALT) on the Dome palsa (a) and Ridge palsa (b) in September 2023 with their corresponding DTMs.
The data presented in this article are stored at https://doi.org/10.5281/zenodo.10497094 (Renette, 2024).
CR and HR designed the study and performed the UAV surveys. HR, ST, and MO acquired funding. CR handled data processing, analysis, and figure creation. ST and BH assisted in the setup of the weather station. MO and BH contributed expertise and advice. The manuscript was initially prepared by CR, assisted by HR. All authors reviewed and edited the manuscript draft. All authors approved the final version for submission.
The contact author has declared that none of the authors has any competing interests.
Publisher's note: Copernicus Publications remains neutral with regard to jurisdictional claims made in the text, published maps, institutional affiliations, or any other geographical representation in this paper. While Copernicus Publications makes every effort to include appropriate place names, the final responsibility lies with the authors.
We thank all those that helped with fieldwork and logistics. Finally, we would like to thank reviewers Jan Henrik Blöthe and Martha Ledger for their valuable comments and suggestions, which significantly improved the quality of the manuscript.
This research was supported by Formas – a Swedish Research Council for Sustainable Development (grant no. 2022-00959) under the project “Threatened subarctic palsa mires: a new integrated approach to map and understand permafrost degradation”.
The publication of this article was funded by the Swedish Research Council, Forte, Formas, and Vinnova.
This paper was edited by Tobias Bolch and reviewed by Jan Henrik Blöthe and Martha Ledger.
Anders, K., Marx, S., Boike, J., Herfort, B., Wilcox, E. J., Langer, M., Marsh, P., and Höfle, B.: Multitemporal terrestrial laser scanning point clouds for thaw subsidence observation at Arctic permafrost monitoring sites, Earth Surf. Proc. Land., 45, 1589–1600, https://doi.org/10.1002/esp.4833, 2020.
Andersson, L., Rafstedt, T., and von Sydow, U.: FJALLENS VEGETATION Norrbottens län: En översikt av Norrbottenfjällens vegetation baserad på vegetationskartering och naturvärdering, Naturvårdsverket, Solna, ISBN 91-7590-202-8, 1985.
Backe, S.: Kartering av Sveriges palsmyrar, County Administrative Board of Norrbotten, Luleå, Sweden, https://www.lansstyrelsen.se/norrbotten/om-oss/vara-tjanster/publikationer/2014/kartering-av-sveriges-palsmyrar.html (last access: 10 November 2023), 1–54, 2014.
Biskaborn, B. K., Smith, S. L., Noetzli, J., Matthes, H., Vieira, G., Streletskiy, D. A., Schoeneich, P., Romanovsky, V. E., Lewkowicz, A. G., Abramov, A., Allard, M., Boike, J., Cable, W. L., Christiansen, H. H., Delaloye, R., Diekmann, B., Drozdov, D., Etzelmüller, B., Grosse, G., Guglielmin, M., Ingeman-Nielsen, T., Isaksen, K., Ishikawa, M., Johansson, M., Johannsson, H., Joo, A., Kaverin, D., Kholodov, A., Konstantinov, P., Kröger, T., Lambiel, C., Lanckman, J.-P., Luo, D., Malkova, G., Meiklejohn, I., Moskalenko, N., Oliva, M., Phillips, M., Ramos, M., Sannel, A. B. K., Sergeev, D., Seybold, C., Skryabin, P., Vasiliev, A., Wu, Q., Yoshikawa, K., Zheleznyak, M., and Lantuit, H.: Permafrost is warming at a global scale, Nat. Commun., 10, 264, https://doi.org/10.1038/s41467-018-08240-4, 2019.
Borge, A. F., Westermann, S., Solheim, I., and Etzelmüller, B.: Strong degradation of palsas and peat plateaus in northern Norway during the last 60 years, The Cryosphere, 11, 1–16, https://doi.org/10.5194/tc-11-1-2017, 2017.
Curcio, A. C., Peralta, G., Aranda, M., and Barbero, L.: Evaluating the Performance of High Spatial Resolution UAV-Photogrammetry and UAV-LiDAR for Salt Marshes: The Cádiz Bay Study Case, Remote Sens.-Basel, 14, 3582, https://doi.org/10.3390/rs14153582, 2022.
de la Barreda-Bautista, B., Boyd, D. S., Ledger, M., Siewert, M. B., Chandler, C., Bradley, A. V., Gee, D., Large, D. J., Olofsson, J., Sowter, A., and Sjögersten, S.: Towards a Monitoring Approach for Understanding Permafrost Degradation and Linked Subsidence in Arctic Peatlands, Remote Sens.-Basel, 14, 444, https://doi.org/10.3390/rs14030444, 2022.
Douglas, T. A., Hiemstra, C. A., Anderson, J. E., Barbato, R. A., Bjella, K. L., Deeb, E. J., Gelvin, A. B., Nelsen, P. E., Newman, S. D., Saari, S. P., and Wagner, A. M.: Recent degradation of interior Alaska permafrost mapped with ground surveys, geophysics, deep drilling, and repeat airborne lidar, The Cryosphere, 15, 3555–3575, https://doi.org/10.5194/tc-15-3555-2021, 2021.
EUNIS: Factsheet for Palsa mires, European Commission, DG-ENV, https://eunis.eea.europa.eu/habitats/10155 (last access: 10 November 2023), 2013.
Fewster, R. E., Morris, P. J., Ivanovic, R. F., Swindles, G. T., Peregon, A. M., and Smith, C. J.: Imminent loss of climate space for permafrost peatlands in Europe and Western Siberia, Nat. Clim. Change, 12, 373–379, https://doi.org/10.1038/s41558-022-01296-7, 2022.
Fu, Z., Wu, Q., Zhang, W., He, H., and Wang, L.: Water Migration and Segregated Ice Formation in Frozen Ground: Current Advances and Future Perspectives, Front. Earth Sci., 10, 82696, https://doi.org/10.3389/feart.2022.826961, 2022.
Girardeau-Montaut, D.: CloudCompare – 3D point cloud and mesh processing software, GPL sofrware, https://www.danielgm.net/cc/ (last access: 10 November 2023), 2023
Gruber, S.: Ground subsidence and heave over permafrost: hourly time series reveal interannual, seasonal and shorter-term movement caused by freezing, thawing and water movement, The Cryosphere, 14, 1437–1447, https://doi.org/10.5194/tc-14-1437-2020, 2020.
Harder, P., Pomeroy, J. W., and Helgason, W. D.: Improving sub-canopy snow depth mapping with unmanned aerial vehicles: lidar versus structure-from-motion techniques, The Cryosphere, 14, 1919–1935, https://doi.org/10.5194/tc-14-1919-2020, 2020.
Harris, S., French, H., Heginbottom, J., Johnston, G., Ladanyi, B., Sego, D., and Everdingen, R.: Glossary of Permafrost and Related Ground-Ice Terms, National Research Council of Canada, Associate Committee on Geotechnical Research, https://doi.org/10.4224/20386561, 1988.
Hu, Y., Wang, J., Li, Z., and Peng, J.: Ground surface elevation changes over permafrost areas revealed by multiple GNSS interferometric reflectometry, J. Geod., 96, 56, https://doi.org/10.1007/s00190-022-01646-5, 2022.
Hugelius, G., Loisel, J., Chadburn, S., Jackson, R. B., Jones, M., MacDonald, G., Marushchak, M., Olefeldt, D., Packalen, M., Siewert, M. B., Treat, C., Turetsky, M., Voigt, C., and Yu, Z.: Large stocks of peatland carbon and nitrogen are vulnerable to permafrost thaw, P. Natl. Acad. Sci. USA, 117, 20438–20446, https://doi.org/10.1073/pnas.1916387117, 2020.
Iwahana, G., Busey, R. C., and Saito, K.: Seasonal and Interannual Ground-Surface Displacement in Intact and Disturbed Tundra along the Dalton Highway on the North Slope, Alaska, Land, 10, 22, https://doi.org/10.3390/land10010022, 2021.
Jacobs, J. M., Hunsaker, A. G., Sullivan, F. B., Palace, M., Burakowski, E. A., Herrick, C., and Cho, E.: Snow depth mapping with unpiloted aerial system lidar observations: a case study in Durham, New Hampshire, United States, The Cryosphere, 15, 1485–1500, https://doi.org/10.5194/tc-15-1485-2021, 2021.
Jones, B. M., Grosse, G., Arp, C. D., Miller, E., Liu, L., Hayes, D. J., and Larsen, C. F.: Recent Arctic tundra fire initiates widespread thermokarst development, Sci. Rep., 5, 15865, https://doi.org/10.1038/srep15865, 2015.
Kellner, E. and Halldin, S.: Water budget and surface-layer water storage in a Sphagnum bog in central Sweden, Hydrol. Process., 16, 87–103, https://doi.org/10.1002/hyp.286, 2002.
Kou, X., Liu, X., Zhang, Y., Zhang, Y., Wang, T., and Yan, S.: A Study on the Detection of Deformation of Tuotuohe Area on the Qinghai-Tibet Plateau, in: 2021 IEEE International Geoscience and Remote Sensing Symposium IGARSS, 12–14 July 2021, Brussels, Belgium, 5362–5365, https://doi.org/10.1109/IGARSS47720.2021.9555061, 2021.
Krutskikh, N., Ryazantsev, P., Ignashov, P., and Kabonen, A.: The Spatial Analysis of Vegetation Cover and Permafrost Degradation for a Subarctic Palsa Mire Based on UAS Photogrammetry and GPR Data in the Kola Peninsula, Remote Sens.-Basel, 15, 1896, https://doi.org/10.3390/rs15071896, 2023.
Kucharczyk, M., Hugenholtz, C. H., and Zou, X.: UAV–LiDAR accuracy in vegetated terrain, J. Unmanned Veh. Syst., 6, 212–234, https://doi.org/10.1139/juvs-2017-0030, 2018.
Lantmäteriet: GSD-Orthophoto, Lantmäteriet, https://www.lantmateriet.se/sv/geodata/vara-produkter/produktlista/flygbilder-nedladdning/ (last access: 1 November 2023), 2021.
Łakomiec, P., Holst, J., Friborg, T., Crill, P., Rakos, N., Kljun, N., Olsson, P.-O., Eklundh, L., Persson, A., and Rinne, J.: Field-scale CH4 emission at a subarctic mire with heterogeneous permafrost thaw status, Biogeosciences, 18, 5811–5830, https://doi.org/10.5194/bg-18-5811-2021, 2021.
Lin, Y.-C., Cheng, Y.-T., Zhou, T., Ravi, R., Hasheminasab, S. M., Flatt, J. E., Troy, C., and Habib, A.: Evaluation of UAV LiDAR for Mapping Coastal Environments, Remote Sens.-Basel, 11, 2893, https://doi.org/10.3390/rs11242893, 2019.
Luoto, M., Heikkinen, R. K., and Carter, T. R.: Loss of palsa mires in Europe and biological consequences, Environ. Conserv., 31, 30–37, https://doi.org/10.1017/S0376892904001018, 2004a.
Luoto, M., Fronzek, S., and Zuidhoff, F. S.: Spatial modelling of palsa mires in relation to climate in northern Europe, Earth Surf. Proc. Land., 29, 1373–1387, https://doi.org/10.1002/esp.1099, 2004b.
Mamet, S. D., Chun, K. P., Kershaw, G. G. L., Loranty, M. M., and Peter Kershaw, G.: Recent Increases in Permafrost Thaw Rates and Areal Loss of Palsas in the Western Northwest Territories, Canada: Non-linear Palsa Degradation, Permafrost. Periglac., 28, 619–633, https://doi.org/10.1002/ppp.1951, 2017.
Martin, L. C. P., Nitzbon, J., Scheer, J., Aas, K. S., Eiken, T., Langer, M., Filhol, S., Etzelmüller, B., and Westermann, S.: Lateral thermokarst patterns in permafrost peat plateaus in northern Norway, The Cryosphere, 15, 3423–3442, https://doi.org/10.5194/tc-15-3423-2021, 2021.
Olvmo, M., Holmer, B., Thorsson, S., Reese, H., and Lindberg, F.: Sub-arctic palsa degradation and the role of climatic drivers in the largest coherent palsa mire complex in Sweden (Vissátvuopmi), 1955–2016, Sci. Rep., 10, 8937, https://doi.org/10.1038/s41598-020-65719-1, 2020.
Ostrowski, W., Górski, K., Pilarska, M., Salach, A., and Bakuła, K.: Comparison of the laser scanning solutions for the unmanned aerial vehicles, Arch. Fotogram. Kartogr. Teledetekcji, 101–123, https://doi.org/10.14681/afkit.2017.008, 2017.
Pirk, N., Aalstad, K., Mannerfelt, E. S., Clayer, F., de Wit, H., Christiansen, C. T., Althuizen, I., Lee, H., and Westermann, S.: Disaggregating the Carbon Exchange of Degrading Permafrost Peatlands Using Bayesian Deep Learning, Geophys. Res. Lett., 51, e2024GL109283, https://doi.org/10.1029/2024GL109283, 2024.
Putkonen, J. and Roe, G.: Rain-on-snow events impact soil temperatures and affect ungulate survival, Geophys. Res. Lett., 30, 37–1, https://doi.org/10.1029/2002GL016326, 2003.
Renette, C.: Dataset for: “Multitemporal UAV LiDAR detects seasonal heave and subsidence on palsas” V1.0 (V1.0), Zenodo [data set], https://doi.org/10.5281/zenodo.10497094, 2024.
Roulet, N. T.: Surface Level and Water Table Fluctuations in a Subarctic Fen, Arctic Alppine Res., 23, 303–310, https://doi.org/10.2307/1551608, 1991.
Seppälä, M.: The Origin of Palsas, Geogr. Ann. A, 68, 141–147, https://doi.org/10.1080/04353676.1986.11880167, 1986.
Siewert, M. B. and Olofsson, J.: Scale-dependency of Arctic ecosystem properties revealed by UAV, Environ. Res. Lett., 15, 094030, https://doi.org/10.1088/1748-9326/aba20b, 2020.
Sjöberg, Y., Coon, E., K. Sannel, A. B., Pannetier, R., Harp, D., Frampton, A., Painter, S. L., and Lyon, S. W.: Thermal effects of groundwater flow through subarctic fens: A case study based on field observations and numerical modeling, Water Resour. Res., 52, 1591–1606, https://doi.org/10.1002/2015WR017571, 2016.
Sjögersten, S., Ledger, M., Siewert, M., de la Barreda-Bautista, B., Sowter, A., Gee, D., Foody, G., and Boyd, D. S.: Optical and radar Earth observation data for upscaling methane emissions linked to permafrost degradation in sub-Arctic peatlands in northern Sweden, Biogeosciences, 20, 4221–4239, https://doi.org/10.5194/bg-20-4221-2023, 2023.
Swindles, G. T., Morris, P. J., Mullan, D., Watson, E. J., Turner, T. E., Roland, T. P., Amesbury, M. J., Kokfelt, U., Schoning, K., Pratte, S., Gallego-Sala, A., Charman, D. J., Sanderson, N., Garneau, M., Carrivick, J. L., Woulds, C., Holden, J., Parry, L., and Galloway, J. M.: The long-term fate of permafrost peatlands under rapid climate warming, Sci. Rep., 5, 17951, https://doi.org/10.1038/srep17951, 2015.
Taylor, J. R.: Introduction to Error Analysis: The Study of Uncertainties in Physical Measurements, 2nd edn., University Science Books, Sausalito, CA, ISBN 978-0935702750, 1997.
Trimble Applanix: POSPac UAV (version 8.2), Trimble Applanix [software], https://www.applanix.com/products/pospac-uav.html (last access: 15 November 2023), 2023.
Valman, S., Siewert, M. B., Boyd, D., Ledger, M., Gee, D., de la Barreda-Bautista, B., Sowter, A., and Sjögersten, S.: InSAR-measured permafrost degradation of palsa peatlands in northern Sweden, The Cryosphere, 18, 1773–1790, https://doi.org/10.5194/tc-18-1773-2024, 2024.
Verdonen, M., Störmer, A., Lotsari, E., Korpelainen, P., Burkhard, B., Colpaert, A., and Kumpula, T.: Permafrost degradation at two monitored palsa mires in north-west Finland, The Cryosphere, 17, 1803–1819, https://doi.org/10.5194/tc-17-1803-2023, 2023.
Voigt, C., Marushchak, M. E., Mastepanov, M., Lamprecht, R. E., Christensen, T. R., Dorodnikov, M., Jackowicz-Korczyński, M., Lindgren, A., Lohila, A., Nykänen, H., Oinonen, M., Oksanen, T., Palonen, V., Treat, C. C., Martikainen, P. J., and Biasi, C.: Ecosystem carbon response of an Arctic peatland to simulated permafrost thaw, Glob. Change Biol., 25, 1746–1764, https://doi.org/10.1111/gcb.14574, 2019.
Walvoord, M. A. and Kurylyk, B. L.: Hydraulic impacts of permafrost thawing and implications for groundwater fluxes in the Arctic, Water Resour. Res., 52, 1236–1255, https://doi.org/10.1002/2015WR018299, 2016.
Yanagiya, K., Furuya, M., Danilov, P., and Iwahana, G.: Transient Freeze-Thaw Deformation Responses to the 2018 and 2019 Fires Near Batagaika Megaslump, Northeast Siberia, J. Geophys. Res.-Earth, 128, e2022JF006817, https://doi.org/10.1029/2022JF006817, 2023.
YellowScan: CloudStation (version 2309.0.0), YellowScan, https://www.yellowscan.com/products/cloudstation/ (last access: 10 November 2023), 2023.
Zhang, T.: Influence of the seasonal snow cover on the ground thermal regime: An overview, Rev. Geophys., 43, 2004RG000157, https://doi.org/10.1029/2004RG000157, 2005.
Zhang, W., Qi, J., Wan, P., Wang, H., Xie, D., Wang, X., and Yan, G.: An Easy-to-Use Airborne LiDAR Data Filtering Method Based on Cloth Simulation, Remote Sens.-Basel, 8, 501, https://doi.org/10.3390/rs8060501, 2016.
Zwieback, S. and Meyer, F. J.: Top-of-permafrost ground ice indicated by remotely sensed late-season subsidence, The Cryosphere, 15, 2041–2055, https://doi.org/10.5194/tc-15-2041-2021, 2021.


