the Creative Commons Attribution 4.0 License.
the Creative Commons Attribution 4.0 License.
 | 08 Feb 2024
Seasonal to decadal dynamics of supraglacial lakes on debris-covered glaciers in the Khumbu region, Nepal
Lucas Zeller
Daniel McGrath
Scott W. McCoy
Jonathan Jacquet
Supraglacial lakes (SGLs) play an important role in debris-covered glacier (DCG) systems by enabling efficient interactions between the supraglacial, englacial, and subglacial environments. Developing a better understanding of the short-term and long-term development of these features is needed to constrain DCG evolution and the hazards posed to downstream communities, ecosystems, and infrastructure from rapid drainage. In this study, we present an analysis of supraglacial lakes on eight DCGs in the Khumbu region of Nepal by automating SGL identification in PlanetScope, Sentinel-2, and Landsat 5–9 images. We identify a regular annual cycle in SGL area, with lakes covering approximately twice as much area during their maximum annual extent (in the pre-monsoon season) than their minimum annual extent (in the post-monsoon season). The high spatiotemporal resolution of PlanetScope imagery (∼ daily, 3 m) shows that this cycle is driven by the appearance and expansion of small lakes in the upper debris-covered regions of these glaciers throughout the winter. Decadal-scale expansion of large, near-terminus lakes was identified on four of the glaciers (Khumbu, Lhotse, Nuptse, and Ambulapcha), while the remaining four showed no significant increases over the study period. The seasonal variation in SGL area is of comparable or greater magnitude as decadal-scale changes, highlighting the importance of accounting for this seasonality when interpreting long-term records of SGL changes from sparse observations. The complex spatiotemporal patterns revealed in our analysis are not captured in existing regional-scale glacial lake databases, suggesting that more targeted efforts are needed to capture the true variability of SGLs on large scales.
- Article
(8758 KB) - Full-text XML
-
Supplement
(21114 KB) - BibTeX
- EndNote


The processes controlling the response of debris-covered glaciers (DCGs) to changing climatic conditions are distinct from those of clean-ice glaciers and tend to be less well studied and understood (Brun et al., 2019; Miles et al., 2020). Supraglacial lakes (SGLs) on DCGs can increase ablation rates through increased radiation absorption, ice cliff calving, and efficient transfer of heat to the englacial and subglacial environments (Miles et al., 2022). Further, rapid drainage of these lakes presents a potential hazard to downstream communities and infrastructure (Miles et al., 2018; Rounce et al., 2017), particularly in cases where smaller ponds coalesce into large terminal lakes capable of causing catastrophic glacier lake outburst floods (Watanabe et al., 2009).
Understanding the evolution of SGLs on DCGs has been limited by difficulties associated with directly observing these features (Racoviteanu et al., 2022). The rugged topography of DCGs generally limits the scope of in situ investigations to single lakes and/or individual glaciers. Remote-sensing approaches to studying the glacier-wide spatial and temporal patterns in lake evolution have been limited by (1) the spatial resolution of freely available satellite imagery (e.g., Landsat and Sentinel-2) being large relative to the size of many SGLs and (2) the infrequent revisit period of satellites acquiring higher-spatial-resolution imagery preventing detailed assessment of the rapid temporal evolution of these lakes.
Previous studies have found that SGLs tend to form in areas with low surface gradients and low glacier flow velocities (Reynolds, 2000). The temporal stability of individual lakes can vary widely, with some appearing stable on decadal scales, while others fill and drain annually, semi-annually, or seemingly randomly (Narama et al., 2017; Steiner et al., 2019). Seasonal to annual patterns in lake development have been observed, with links to ice velocity variations, water availability from precipitation and snow/ice melt, and the opening or collapsing of englacial conduits (Benn et al., 2001; Mertes et al., 2017; Watson et al., 2018b).
There are few existing studies which have investigated the seasonal variations in SGL lake areas on DCGs on glacier-wide scales. These studies have generally relied on coarser-resolution Landsat imagery aggregated over decadal time periods (Miles et al., 2017; Narama et al., 2017) or have used a sensor integration approach with both optical and synthetic aperture radar (SAR) datasets (Wendleder et al., 2021). Further, the majority of these studies (including ours) have focused on DCGs in High Mountain Asia and particularly in regions of the Himalayas and the Karakoram which are impacted by the Indian summer monsoon.
These studies find that SGLs generally form in the early spring from the accumulation of rain and meltwater, grow in size through the pre-monsoon season (1 March–15 June), and then drain during the monsoon season (15 June–30 September). The frequent snow cover and frozen surfaces tend to make lake identification difficult during the winter, but SGLs are generally assumed to be stable or very slowly drain throughout the post-monsoon (1 October–30 November) and winter (1 December–28 February) months (Watson et al., 2018b; Miles et al., 2017).
Despite these patterns in SGL area and drainage that have been observed over seasonal timescales, the majority of studies investigating SGL development on decadal timescales have not explicitly accounted for seasonality in lake areas (e.g., Mohanty and Maiti, 2021; Watson et al., 2016; Steiner et al., 2019). Rather, these studies tend to utilize a series of individual higher-resolution images that cover a wide range of years but are captured at irregular seasonal timing. Improving our understanding of the dynamics of short-term SGL variability would allow us to differentiate between the confounding effects of seasonal and long-term trends in SGL area. Therefore, the goal of this study is to develop consistent observations of SGL evolution over daily to decadal timescales on eight glaciers in the Khumbu region of Nepal through the integration of PlanetScope satellite imagery (Planet Labs PBC, 2018), Sentinel-2 and Landsat 5–9 imagery, and in situ field observations.
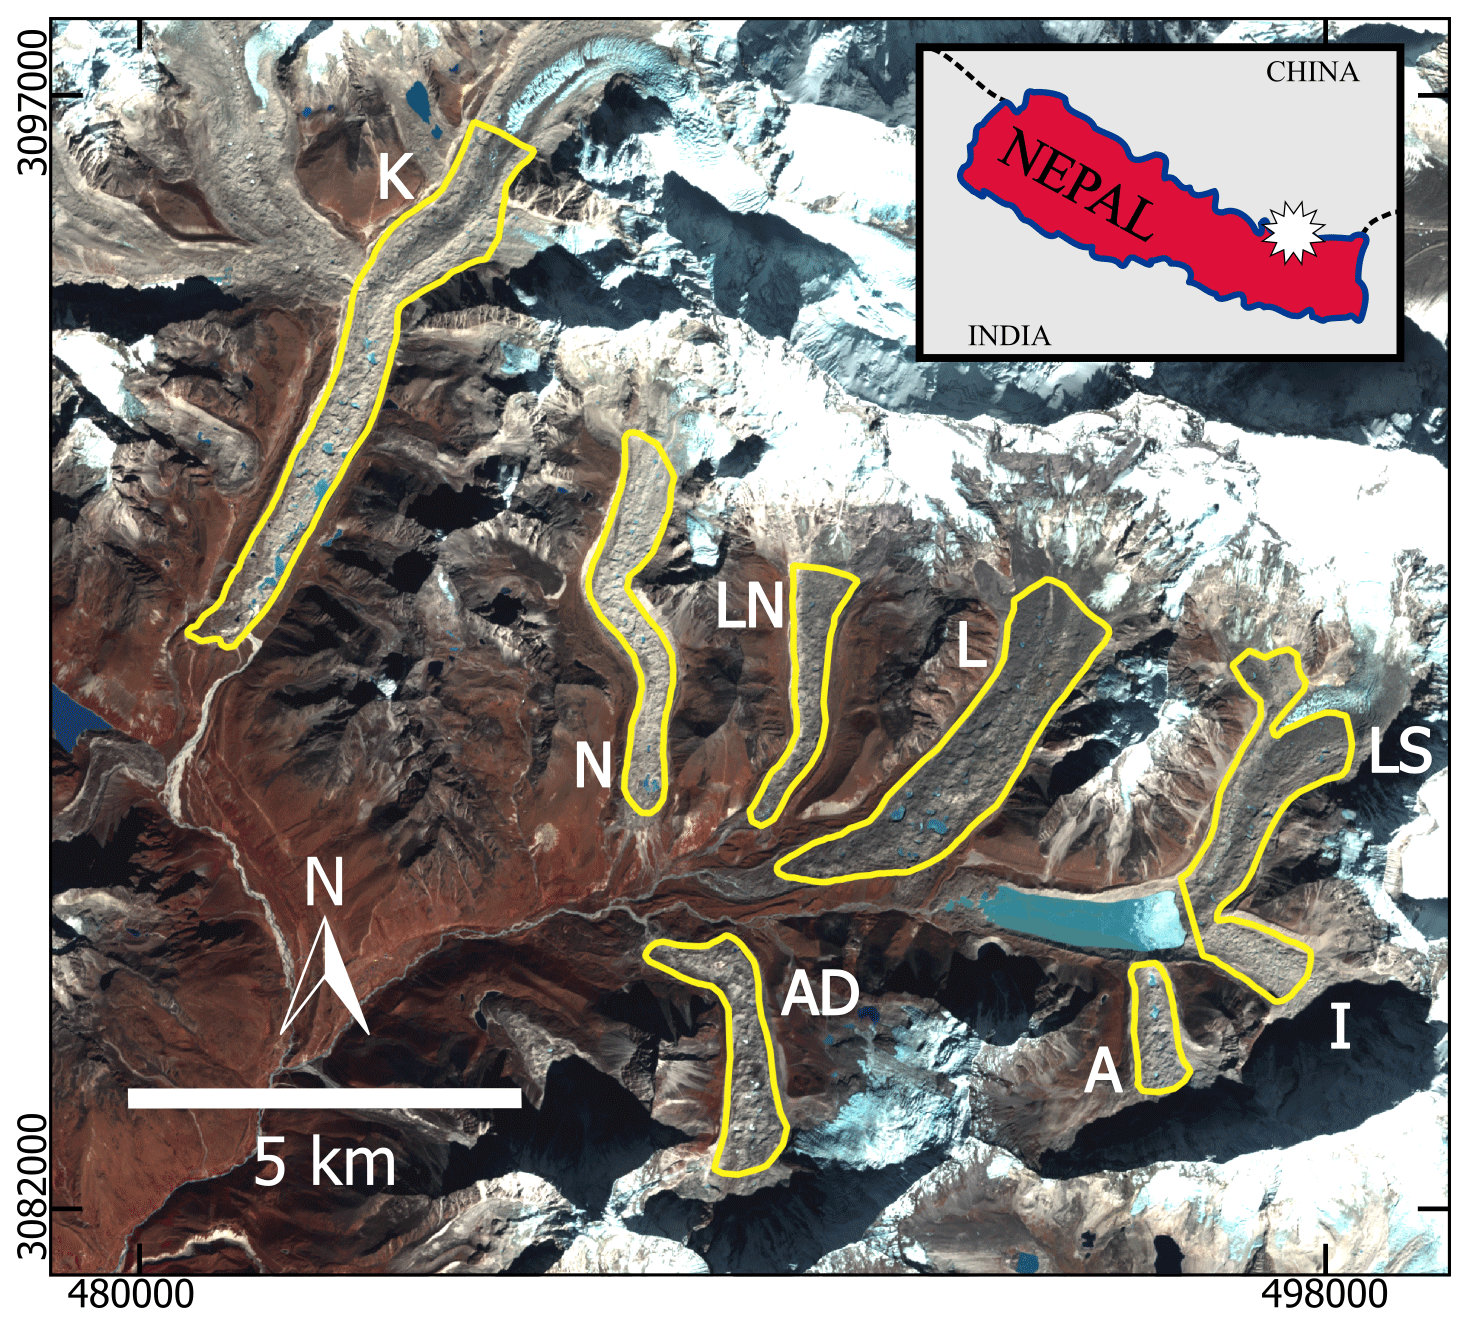
Figure 1Sentinel-2 satellite image (13 November 2020) of the study area. The debris-covered areas of the eight glaciers are outlined in yellow. Letters adjacent to each glacier are shortened names (K: Khumbu, N: Nuptse, LN: Lhotse Nup, L: Lhotse, LS: Lhotse Shar, I: Imja, A: Ambulapcha, and AD: Ama Dablam). Inset map shows the region's location within Nepal (indicated by the white star). The coordinate frame indicates the easting and northing range of the figure within UTM Zone 45N.
We investigated SGL dynamics on eight glaciers in the Khumbu region of Nepal (Fig. 1; Table S1 in the Supplement). The glaciers in this region are characterized by ablation zones which have nearly continuous debris cover, slow ice flow velocities (< 10 m yr−1) (Gardner et al., 2019), and low-gradient surface slopes (< 5∘). Debris-covered areas range in elevation from 4800–5300 m, with debris thickness tending to increase towards the glacier termini (Rounce et al., 2021). Five of the glaciers in this study have a southerly aspect and flow direction, two (Ambulapcha and Ama Dablam) flow north, and one (Imja) flows predominantly westward (Fig. 1). Lhotse Shar and Imja flow into the rapidly expanding Imja Tsho, resulting in increased ice flow velocities compared to the other glaciers in this study (Watanabe et al., 2009).
The climate in the Khumbu region is characterized by monsoonal summer seasons, during which the majority of the 587 ± 34 mm of annual precipitation falls, and cold and dry winter seasons (Perry et al., 2020). The limited winter precipitation leads to non-continuous snow cover on the study glaciers' surfaces throughout the winter; however, cold air temperatures regularly result in frozen lake surfaces, particularly in the February–April time period.
In this study, we investigated the patterns of SGL development on timescales ranging from subseasonal to decadal. We achieved this by integrating multiple satellite remote-sensing imagery sources. Each source provides unique observations, while together they build upon each other to inform us on their relative strengths and limitations. Our methodology is broadly broken into a two-step process built around identifying SGLs in PlanetScope, Landsat, and Sentinel-2 imagery. We first developed a robust approach to delineating SGLs in high-temporal-resolution time series of PlanetScope imagery. From this dataset, we investigated the seasonal patterns in SGL variations over the 2017–2022 time period. We then used these high-spatial-resolution observations (3 m spatial resolution) as a validation dataset to optimize SGL identification in coarser-resolution Landsat and Sentinel-2 imagery, allowing us to investigate the decadal-scale trends in SGL evolution at coarser spatial scale (10 and 30 m). Direct field observations and uncrewed aerial system (UAS) surveys from May 2023 provided additional insight into the local-scale topography of these glaciers.
The use of high-resolution PlanetScope imagery allowed us to identify supraglacial streams and very small lakes which may be more appropriately referred to as “ponds”. There is no clear consensus in previous literature on the differentiation between terming a supraglacial feature a “lake” versus a “pond”, and without in situ observations it is difficult to differentiate between a supraglacial “stream” which is flowing and stagnant ponded water. Therefore, in this paper we use the term “supraglacial lake” (SGL) to refer to any supraglacial hydrologic feature which we identify from satellite imagery.
The area of investigation (AOI) was limited to the debris-covered tongue of each glacier. These outlines were created by manually adjusting the glacier extents from the Randolph Glacier Inventory Version 6.0 (RGI Consortium, 2017) to better match glacier margins in high-resolution satellite imagery in Google Earth Pro (sourced from Maxar imagery). Areas of exposed glacier ice were also manually excluded, as they were frequently misclassified as water. For this analysis, we separated Lhotse Shar and Imja into two glaciers, although they are classified as a single glacier in the Randolph Glacier Inventory Version 6.0. The outlines used for these two glaciers excluded the rapidly expanding terminal lake Imja Tsho for the entire time period, as the focus of this study was solely on SGLs.
3.1 SGL identification: Planet
We developed a semi-automated workflow to identify lakes on DCGs in PlanetScope images (Fig. S1 in the Supplement). Images of the study area from the October 2017 to April 2022 time period were searched for and downloaded using the Planet Orders API (Planet Team, 2017). Areas of cloud cover and terrain shadows were identified in each image and excluded from future analysis. See the Supplement for additional information on these steps.
SGLs were identified by separately classifying water and frozen lakes and then applying a pixel-wise temporal smoothing algorithm to ensure a consistent evolution of the glacier surface. An initial classification of water (Fig. S1b) was performed by using a spatially varying threshold on the normalized difference water index (NDWI) (Gao, 1996), calculated using the reflectances in the green and near-infrared (NIR) bands as
Each pixel was then classified as water if its NDWI was at least 0.10 greater than the mean NDWI of surrounding pixels within 150 m (not including off-glacier areas, cloud cover, and terrain shadows) and with a minimum NDWI threshold of −0.15 (these thresholds were empirically determined). A final shadow-masking step was also applied at this point, with pixels with average surface reflectance across visible (RGB) bands less than 0.02 excluded from being classified as water.
An initial classification of frozen lake surfaces (Fig. S1b) was performed using a similar spatially varying threshold on the NIR band. Each pixel was classified as frozen water (ice) if the NIR digital number was at least 1000 greater than the mean NIR of surrounding pixels within 150 m (not including off-glacier areas, cloud cover, and terrain shadows). In simple terms, areas of relatively high NDWI were initially classified as water, while areas of relatively high brightness in the NIR band were initially classified as lake ice. This initial ice classification does not differentiate between lake ice, glacier ice, and snow; however, we took precautions to avoid including glacier ice and snow in the final products. The study extent was delineated to purposefully exclude areas of the glaciers that were not completely debris-covered, reducing the possibility of glacier ice being misclassified as lake ice. Images with widespread snow cover were excluded. Additionally, in later steps we only allowed areas which were recently classified as water to be classified as frozen lakes, limiting the effects of mistakenly identifying snow drifts or exposed ice cliffs as SGLs. An ice flow correction was applied to each initial water and lake ice classification image to align them to a common date of 1 January 2020 (Fig. S1c). This removes the effects of lake advection due to ice flow and allows multi-year tracking of individual lakes. Glacier flow velocities were taken from 1985–2022 composite ITS_LIVE velocity mosaics (Gardner et al., 2019) resampled to PlanetScope resolution.
Following initial lake identification, a series of filtering and smoothing approaches were applied to ensure a consistent temporal evolution of SGLs in our products and reduce noise caused by variable image quality, occasional snow and cloud cover, and inconsistent spectral response. See the Supplement for additional information on these steps.
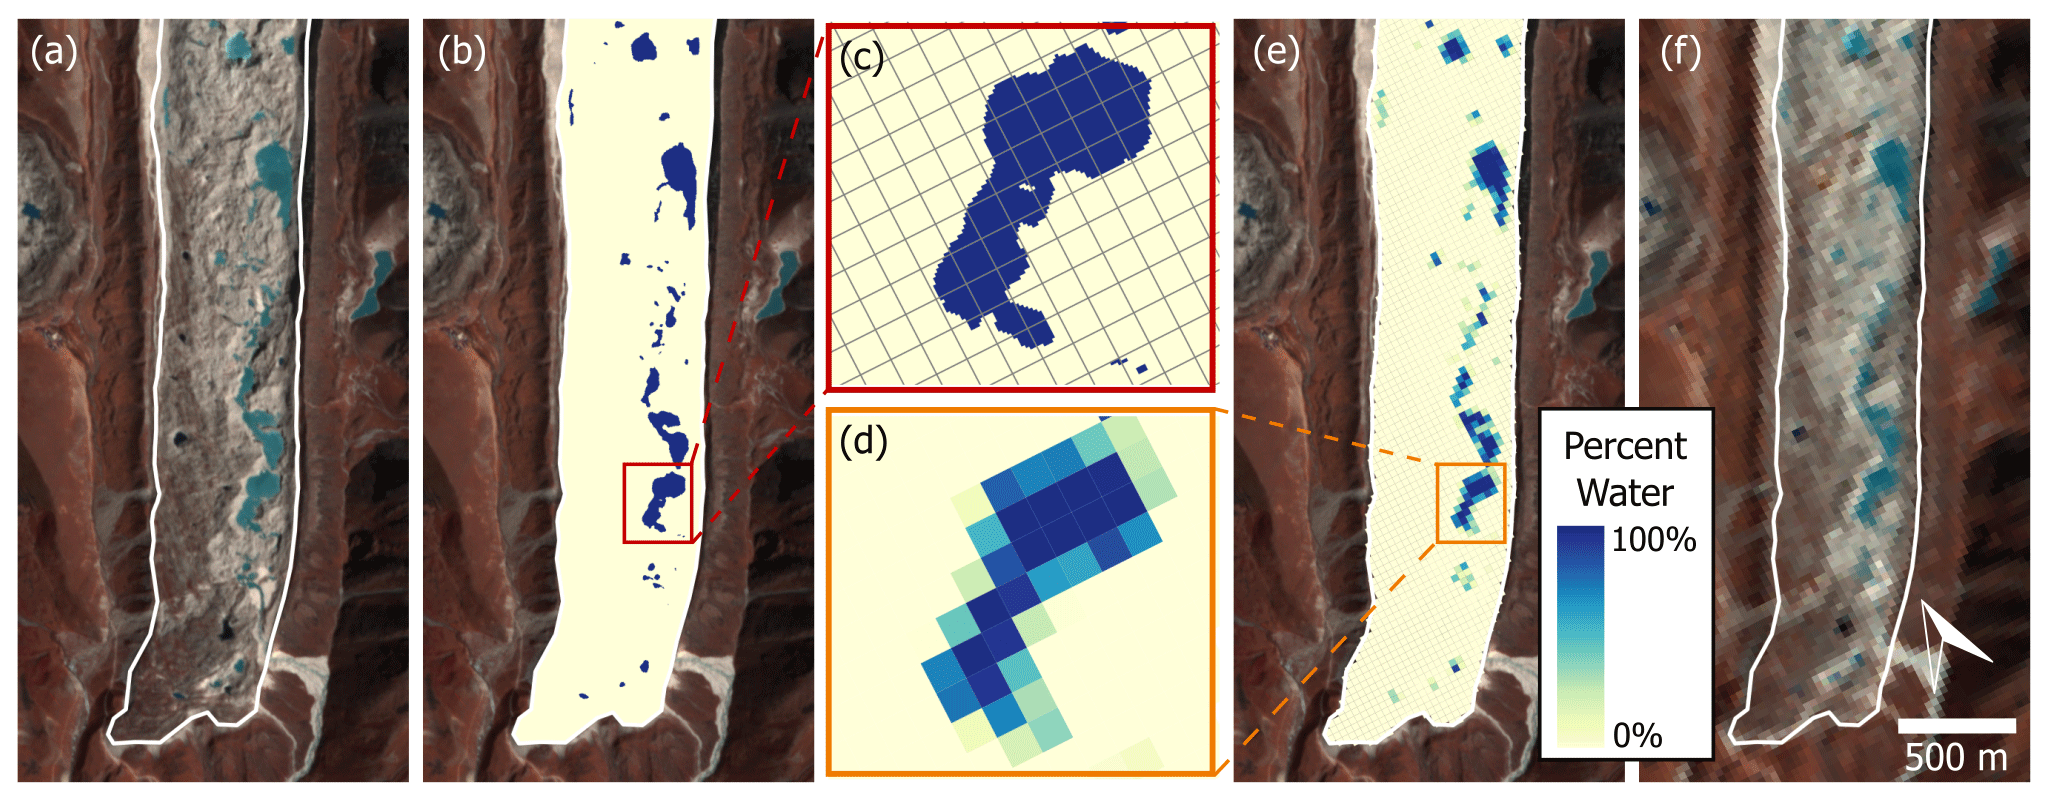
Figure 2An example of the process of creating a Landsat-scale training dataset from Planet-derived lake extents. Panel (a) shows an example PlanetScope image of the terminus of Khumbu Glacier on 24 October 2018, with the glacier extent outlined in black. Panel (b) shows the lake extents in blue from the automated PlanetScope workflow. Panel (c) shows the Landsat pixel grid overlaid on the lake extents for a subset of the glacier area. Panel (d) shows the same area, resampled to Landsat pixel size and grid, colored by the percent of water cover within each pixel. Panel (e) shows the full terminus area, resampled to the Landsat grid, colored by the percent of water cover. Panel (f) is a Landsat image from the same date (24 October 2018).
3.2 SGL identification: Landsat and Sentinel-2
The Planet-derived SGL products were used as a training dataset for developing an optimized SGL identification approach for Landsat and Sentinel-2 imagery in our study area. All Landsat 5, 7, 8, and 9 and Sentinel-2 surface reflectance imagery, spanning the years 1988–2022, was downloaded from Google Earth Engine (n = 1230 per glacier). The same debris-covered AOIs were used for all images to facilitate a direct comparison between all satellite sources and across the entire 35-year time frame. Each image of each glacier was manually checked, and images with significant cloud cover, snow cover, or shadows over the majority of the glacier were discarded, resulting in an average of 940 images remaining for each glacier (Table S2 in the Supplement). Shadowed areas in each image were masked using the Google Earth Engine ee.Terrain.hillShadow() function applied to the NASA Digital Elevation Model (NASADEM) (NASA JPL 2020) with image-specific sun azimuth and elevation as input. Additional remaining shadows were removed by thresholding on surface reflectance values in the green band (using empirically determined values of 0.08 for Landsat images and 0.11 for Sentinel-2). Persistent exposed glacier ice, which was frequently present in older Landsat imagery and misidentified as water, was masked as described in the Supplement.
3.2.1 Validation dataset creation
All Landsat 7, Landsat 8, and Sentinel-2 images with coincident Planet-derived lake extents were identified to be used as a training dataset. We defined suitable images as those which had at least three Planet-derived observations within the 9 d period centered on the Landsat/Sentinel-2 image date. For each of these training images, we resampled the corresponding Planet-derived lake extents to give a 30 m (Landsat) or 10 m (Sentinel-2) resolution product that indicated the percent of water cover within each Sentinel-2/Landsat pixel (Fig. 2). For lake identification in Landsat and Sentinel-2 imagery, we focused on only unfrozen lakes, rather than also attempting to identify frozen lake surfaces as we did in PlanetScope imagery. Thus, the Planet-derived products used for the training dataset include only the lakes identified without employing the frozen lake identification (i.e., we used the temporally smoothed water product in Fig. S1d).
3.2.2 NDWI optimization and lake identification
Using the Planet-derived training dataset, we identified the optimal NDWI threshold (calculated after scaling images to surface reflectance) to use for binary classification of SGLs in Landsat and Sentinel-2 imagery (Watson et al., 2018a). For each sensor (Landsat 7, Landsat 8, and Sentinel-2) a single NDWI threshold was identified that minimized the difference between Planet-derived and Landsat/Sentinel-derived total lake area across the entire training dataset. There were no Landsat 5 images in the training dataset because the Landsat 5 mission ended in 2012. Landsat 9 images were included in our analysis, but there were insufficient images overlapping the PlanetScope validation dataset to reliably constrain an optimized NDWI threshold. Thus, the same NDWI threshold for Landsat 7 was used for Landsat 5 images, and the same threshold for Landsat 8 and 9, because the sensor band wavelength ranges are identical.
These optimized NDWI thresholds (Table 1) were then used to identify SGLs on the glacier surfaces across all available imagery after removing shadowed areas and exposed glacier ice. No additional smoothing was applied to these products, due to the limited temporal resolution compared to PlanetScope imagery.
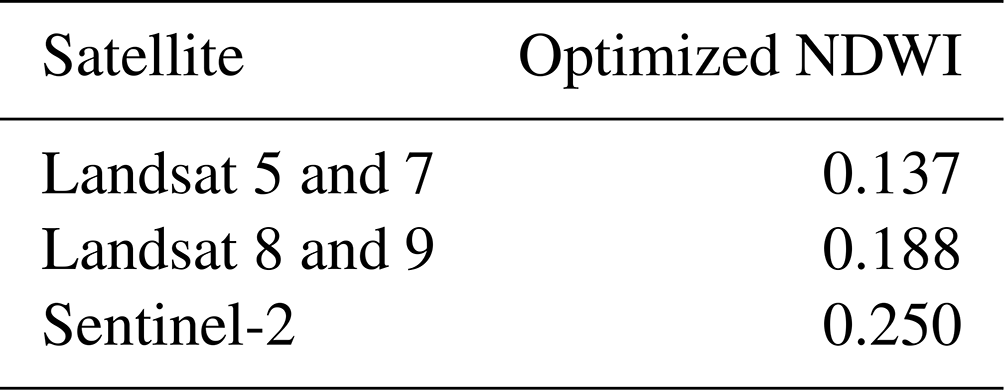
Table 1The optimized NDWI threshold that was found for each Landsat and Sentinel-2 sensor.
3.3 Field observations
A field campaign was undertaken in May 2023 to collect in situ and drone-based observations of the study area. Perspective drone flights were flown on five glaciers (Lhotse Shar, Imja, Ambulapcha, Lhotse, and Lhotse Nup) to capture high-resolution videos and photos of the debris-covered surfaces using a DJI Mavic 2 Pro and DJI Mavic Air 2S. Additionally, grid surveys were flown near the termini of the Ambulapcha, Lhotse Nup, and Khumbu glaciers to create high-resolution structure from motion (SfM) and multi-view stereo (MVS) digital elevation models (DEMs) and orthomosaics. Grid surveys were flown ∼ 60–90 m above ground level, with nadir camera positioning and at least 70 % overlap between images. SfM processing was completed in Agisoft Metashape. Ground control points (GCPs) were placed and surveyed for all three grid surveys; however, there were no nearby operational base stations to use for post-processing of these points, so they were not used in model creation. Thus, model generation was based on UAV GPS locations. The model creation resulted in DEMs with 0.08 m pixel spacing and orthomosaics with 0.04 m pixel spacing.
A validation set for the Planet-derived lake extents was created by manually delineating SGLs in a total of 28 PlanetScope images of the Lhotse, Nuptse, and Ambulapcha glaciers (Fig. S3 in the Supplement). For each glacier, a series of cloud-free images spanning a range of approximately 1 year were selected, in order to capture the full annual cycle of SGL expansion and drainage. We used a ± 1 pixel (3 m) buffer for error estimation of these manual delineations (Gardelle et al., 2011). Further, the total SGL area on seven glaciers which were manually mapped by Watson et al. (2016) was compared to our results from concurrent months. While there is no overlap in the years investigated between our study and theirs (the latest imagery used in Watson et al., 2016, was from 2015), it provides a valuable constraint on the expected magnitude of SGL area.
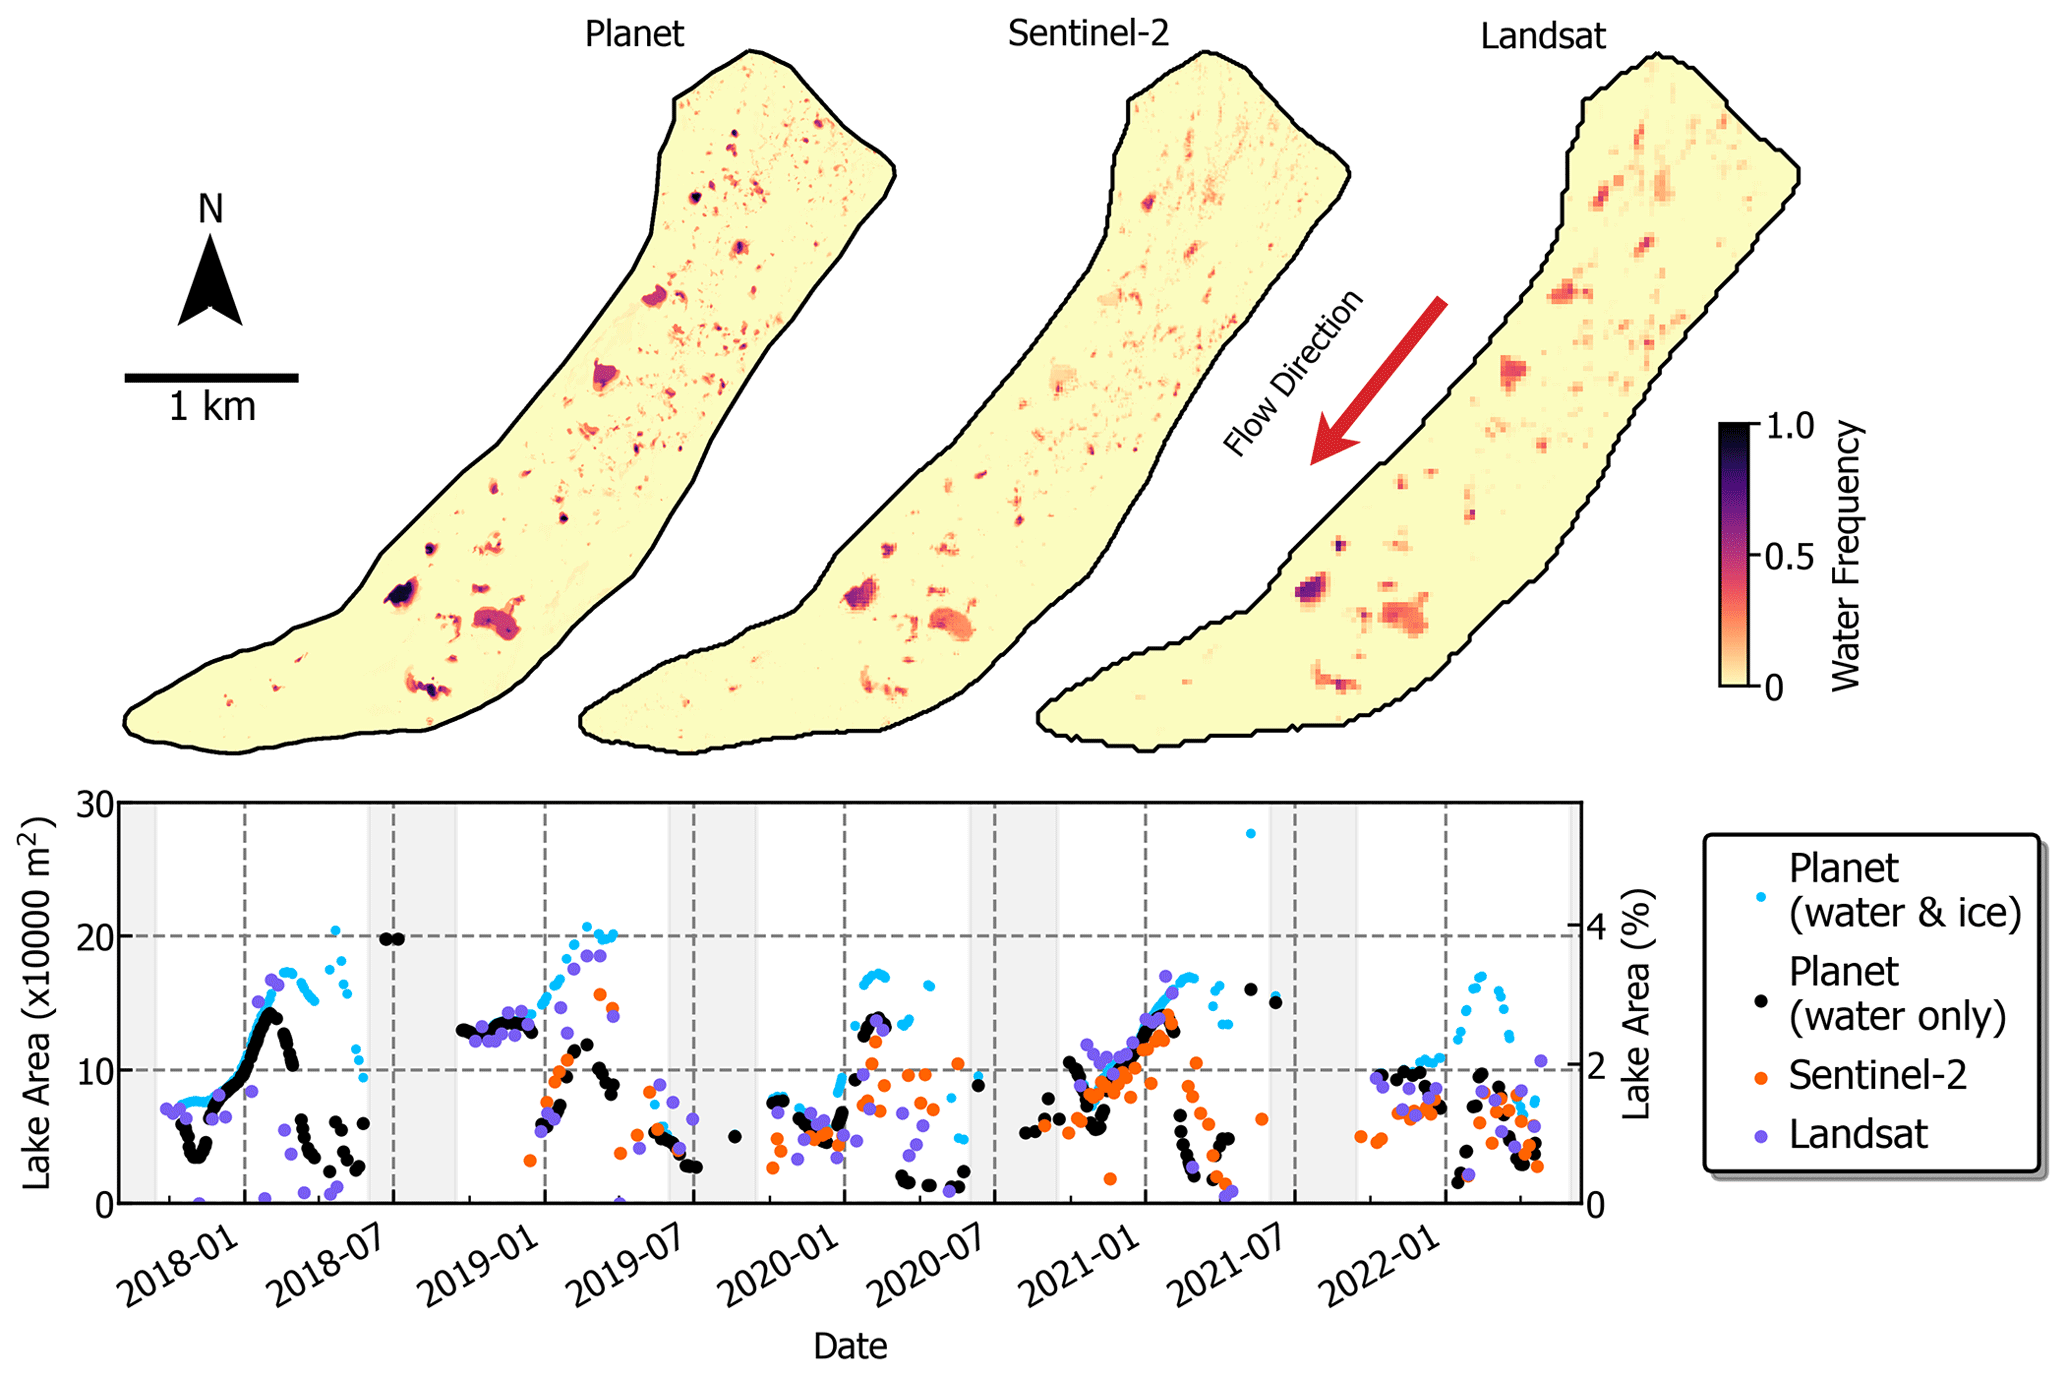
Figure 3A comparison between the SGL extents and frequency in Planet, Sentinel-2, and Landsat imagery on Lhotse Glacier. The color scale corresponds to the frequency at which each pixel was classified as water, with darker colors being more frequent. Only Landsat images from the 2018–2022 time period were used to provide a more direct comparison with Planet and Sentinel-2. The time series plot shows the trend in total lake area for each sensor. Each point represents water identified in a single image. Planet-derived lake areas are shown for both the full methodology, which includes frozen lake area (cyan), and the area if frozen lake area is excluded (black).
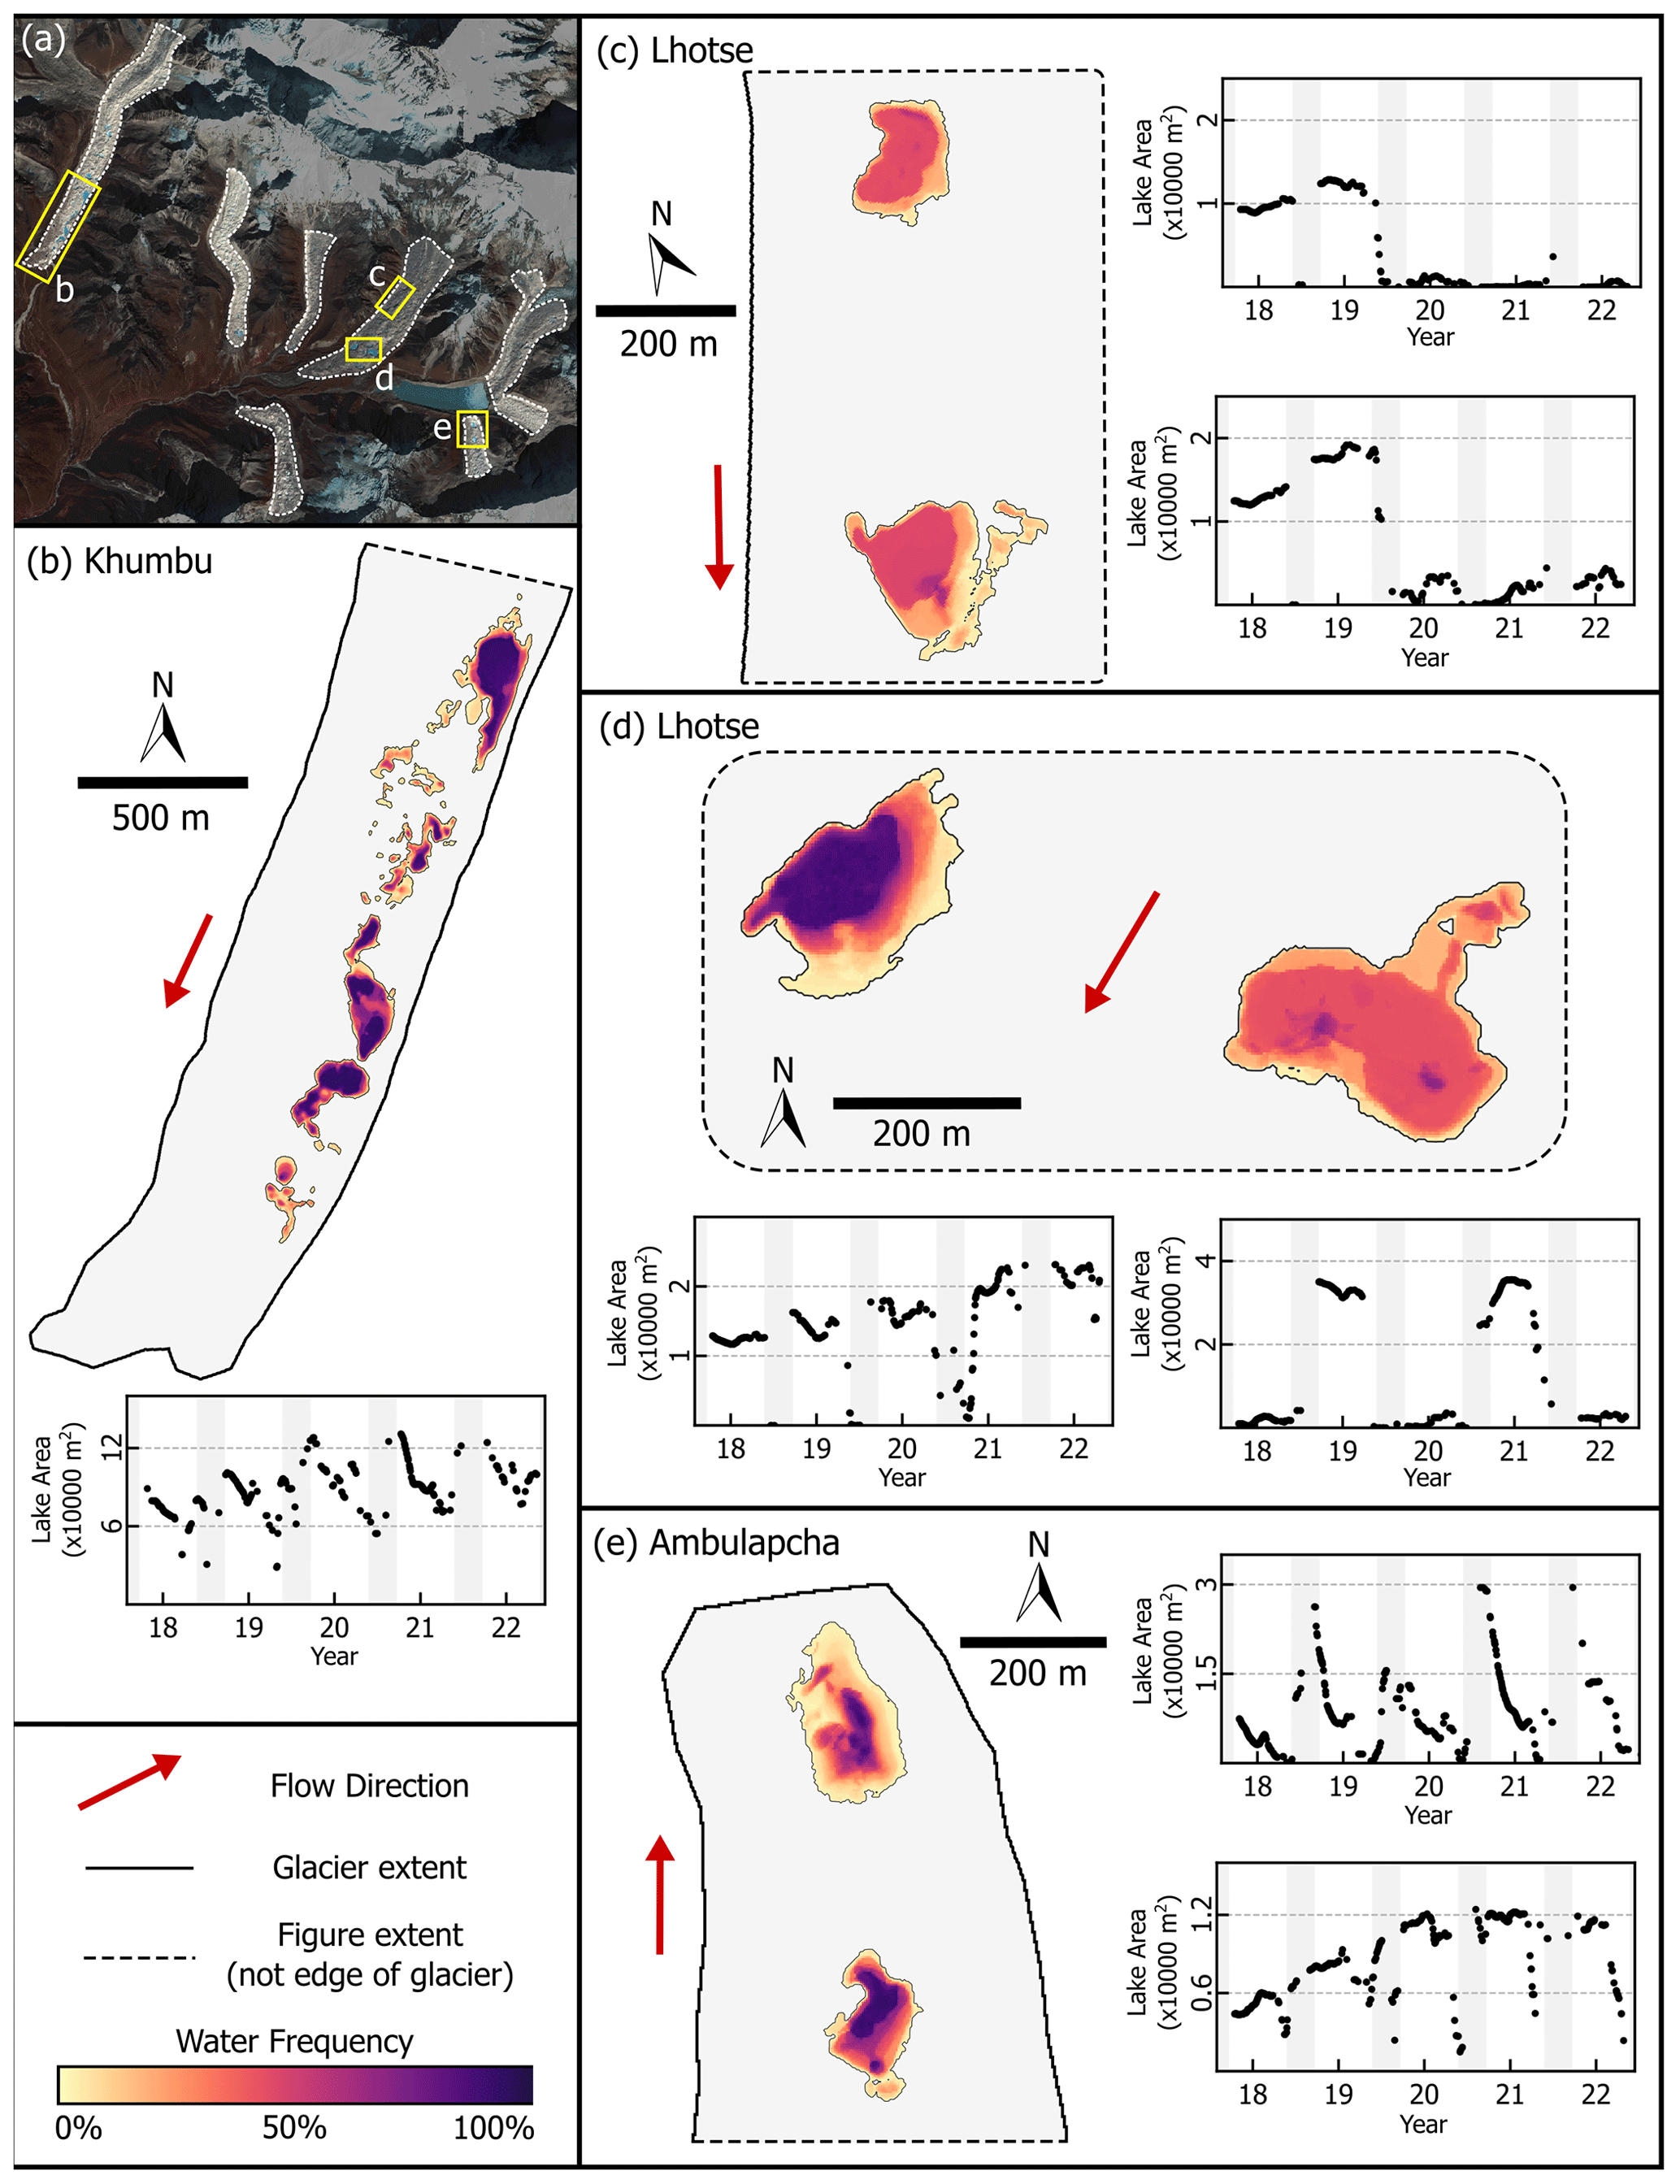
Figure 4Water frequency maps and time series of select individual lakes or groups of lakes. Locations of each (b–e) are indicated in the overview map (a). Lake maps are colored by water frequency (darker colors indicating more frequent water). The time series show the total area in individual Planet images. Shaded gray areas indicate monsoon season (15 June–30 September). Year tick marks indicate the start of each year. Red arrows indicate the glacier flow direction.
5.1 Lake delineation accuracy
5.1.1 Planet
The Planet-derived SGL extents resulted in physically realistic, accurate delineations of SGLs at high spatiotemporal resolution (Figs. 3 and 4). The mean absolute error in total SGL area was 0.039 km2 for Lhotse Glacier, 0.018 km2 for Nuptse Glacier, and 0.004 km2 for Ambulapcha Glacier. These are equal to errors of 0.8 %, 0.7 %, and 0.4 % of the total debris-covered area (from our AOIs) of each glacier, respectively (25 %, 33 %, and 13 % of the total lake-covered area). During the months with highest temporal density of suitable imagery (September–February), these errors are significantly lower (0.2 %, 0.4 %, and 0.3 % of the debris-covered area and 7.6 %, 19.1 %, and 8.3 % of the lake-covered area, respectively). A direct comparison between our products and those from Watson et al. (2016), who derived SGL areas on these glaciers from high-resolution imagery over the 2000–2015 time period, is not possible, because there is no overlap in the observational years. However, our automated SGL areas from similar annual timing showed good agreement with theirs (Fig. S3), with the majority of their results falling within our inter-annual range of values (average difference of 17.3 % when discounting Imja and Lhotse Shar). The differences on Imja Glacier and Lhotse Shar Glacier (where we found smaller lake areas compared to Watson et al., 2016) may be attributed to changes in subglacial hydrology as the proglacial lake Imja Tsho expands (Bolch et al., 2008).
5.1.2 Landsat and Sentinel-2
The optimized NDWI thresholds for lake identification were found to be 0.137 for Landsat 5 and 7, 0.188 for Landsat 8 and 9, and 0.250 for Sentinel-2 images (Table 1, Fig. S2 in the Supplement). The optimized value for Sentinel-2 is similar to the value found by Watson et al. (2018a) of 0.22. The optimized value they found for Landsat 8 is not directly comparable to our results because they used the modified NDWI (Xu, 2006) which uses a short wave infrared band in place of the near-infrared band when calculating NDWI.
The median per-image glacier-wide error in SGL area, compared to the coincident Planet-derived lake area, was 37 % for Landsat and 34 % for Sentinel-2 (presented as a percentage of Planet-derived lake area), with values for individual glaciers ranging from 19 % (Lhotse) to 100 % (Imja) and 13 % (Ambulapcha) to 60 % (Imja), respectively (Table S3 in the Supplement).
5.2 Short-term dynamics
5.2.1 Seasonality in glacier-wide lake area
A pronounced seasonal cycle in total SGL area was found in the Planet-derived lake datasets (Figs. 5 and S3). On most glaciers, the maximum glacier-wide SGL area (both frozen and open water) occurred in March (during the pre-monsoon season), decreased throughout the monsoon with a minimum area occurring in September, and then increased steadily throughout the post-monsoon and winter months (October–February) (Fig. 5). For each glacier, the annual maximum SGL area is approximately twice the annual minimum (Table S4–S8 in the Supplement), highlighting the magnitude of short-term variability these features can exhibit. While this cycle is most clearly seen in the high-temporal-resolution Planet-derived dataset, it is also apparent in Sentinel-2 and Landsat-derived time series, although frequent lake surface freezing in winter months (which was not classified in Landsat/Sentinel-2) obscures this trend in many years (Fig. 3).
The wintertime increase in SGL area is not caused by an increase in the frozen SGL area (Fig. S4). We find that the maximum frozen lake surface extent occurs in April, and minimal lake surface freezing occurs in the September–December time period during which unfrozen lake area is steadily increasing (Fig. S4).
A detailed investigation of the 5-year Planet-derived SGL inventory shows that the seasonal cycle in total SGL area (both frozen and unfrozen) is driven by the regular appearance and expansion of small lakes and supraglacial streams throughout the post-monsoon and winter months in the upper debris-covered regions further from the glacier termini (Figs. 6, S5, and S6), rather than seasonal growth and/or shrinking of the larger lakes in the study region. Between October and February in each of the 5 years on Lhotse Glacier, lake area increase was greater in regions further from the terminus (Fig. 6a). Similarly, the total number of lakes increases throughout these months each year, with this driven predominantly by the increasing number of small lakes (lakes between 45 and 450 m2, or less than half of a single Landsat pixel) (Fig. 6c). Lastly, the relative contribution of smaller lakes to the total lake area increases between October and February each year (Fig. 6b). For example, lakes which are smaller in size than a single Landsat pixel (900 m2) account for an average of 18 % of total lake area on Lhotse Glacier in October but account for 34 % of total lake area on average in February (Fig. 6b). These same patterns are observed (to varying degrees) on most glaciers in our study area, particularly on the four glaciers with the greatest lake area (Khumbu, Nuptse, Lhotse, and Lhotse Shar) (Figs. 6 and S7–S14 in the Supplement).
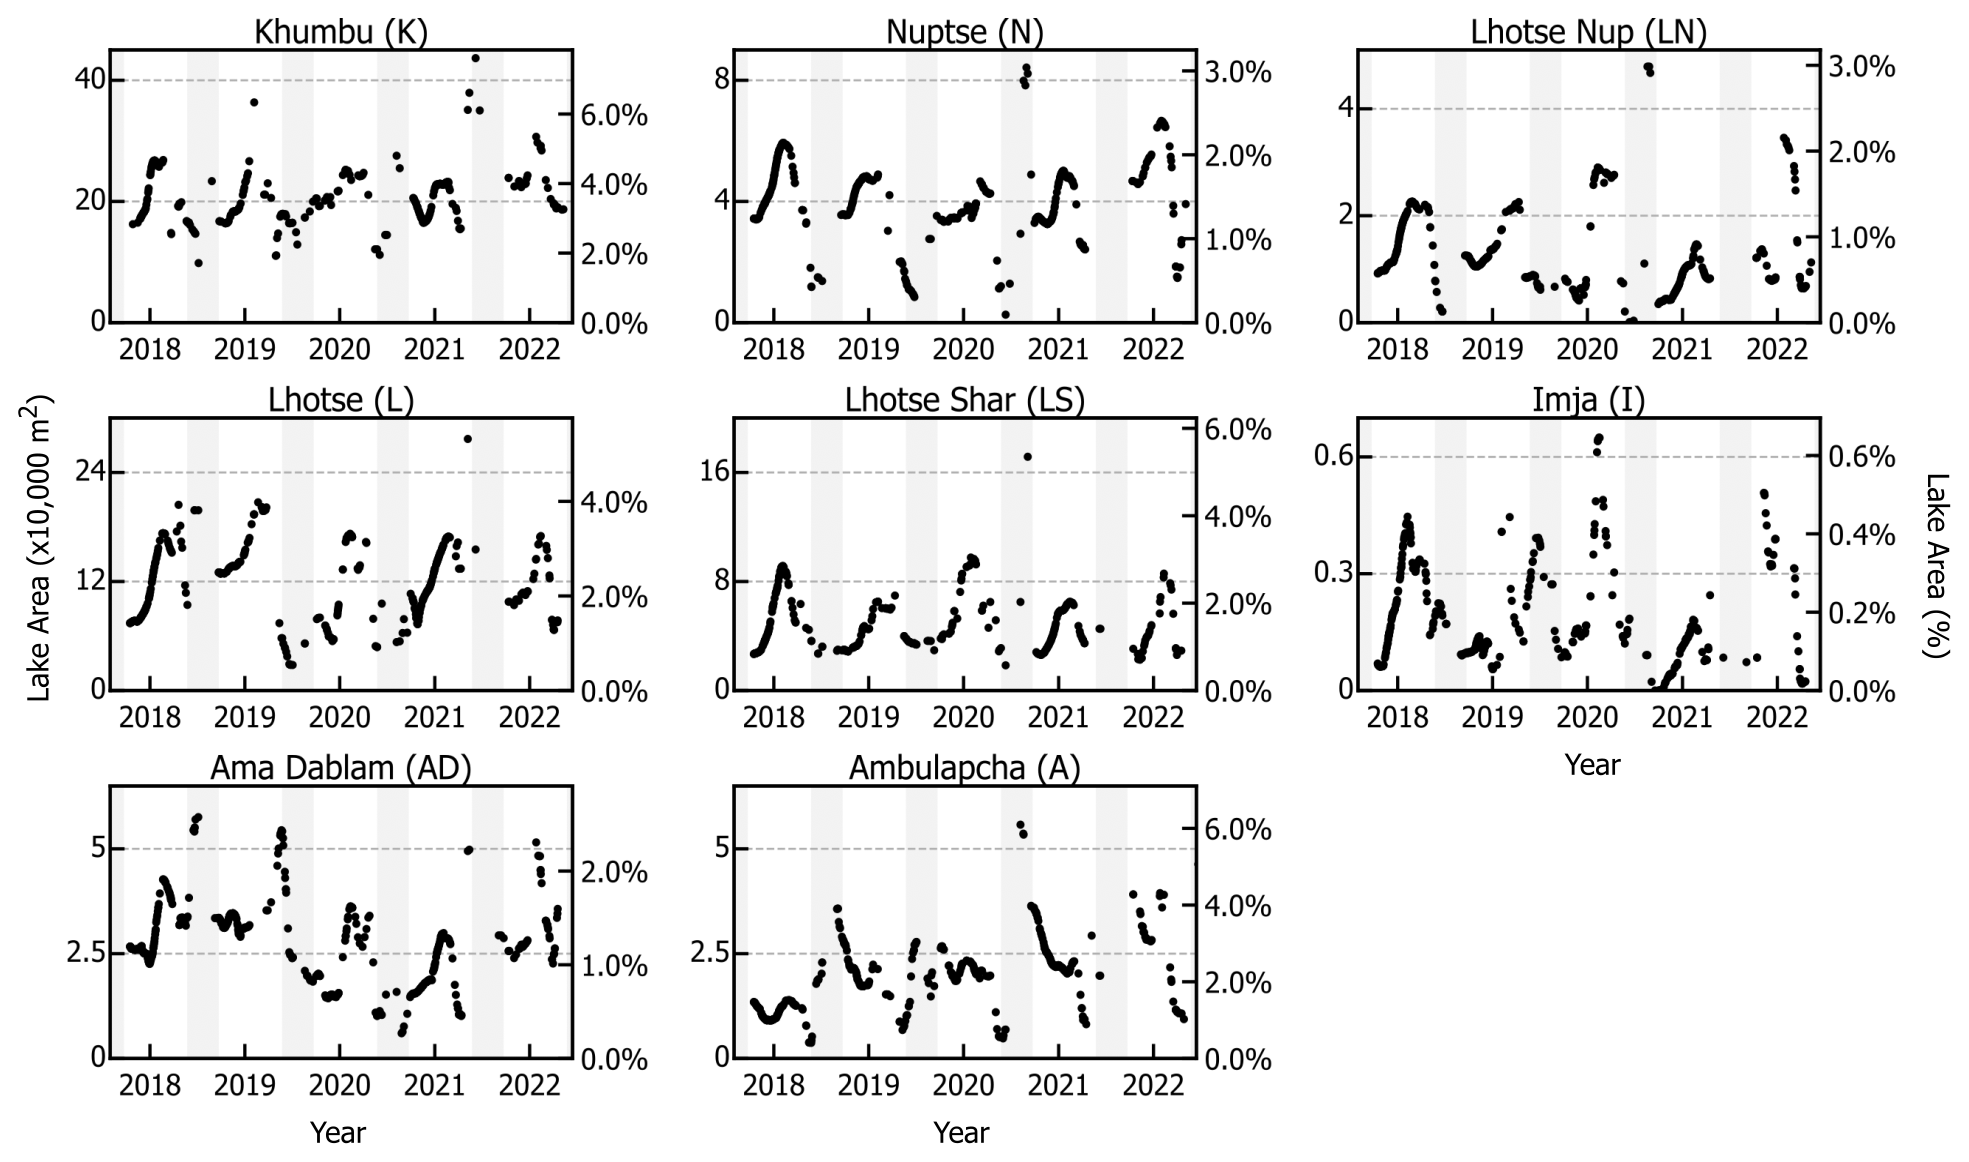
Figure 5Time series of total SGL area on each glacier from PlanetScope imagery. Each point indicates the total lake area identified from the automated methodology. Shaded gray areas indicate the monsoon season (15 June–30 September). The left axis of each plot shows lake area, while the right axis shows the values scaled to a percent of the total debris-covered area.
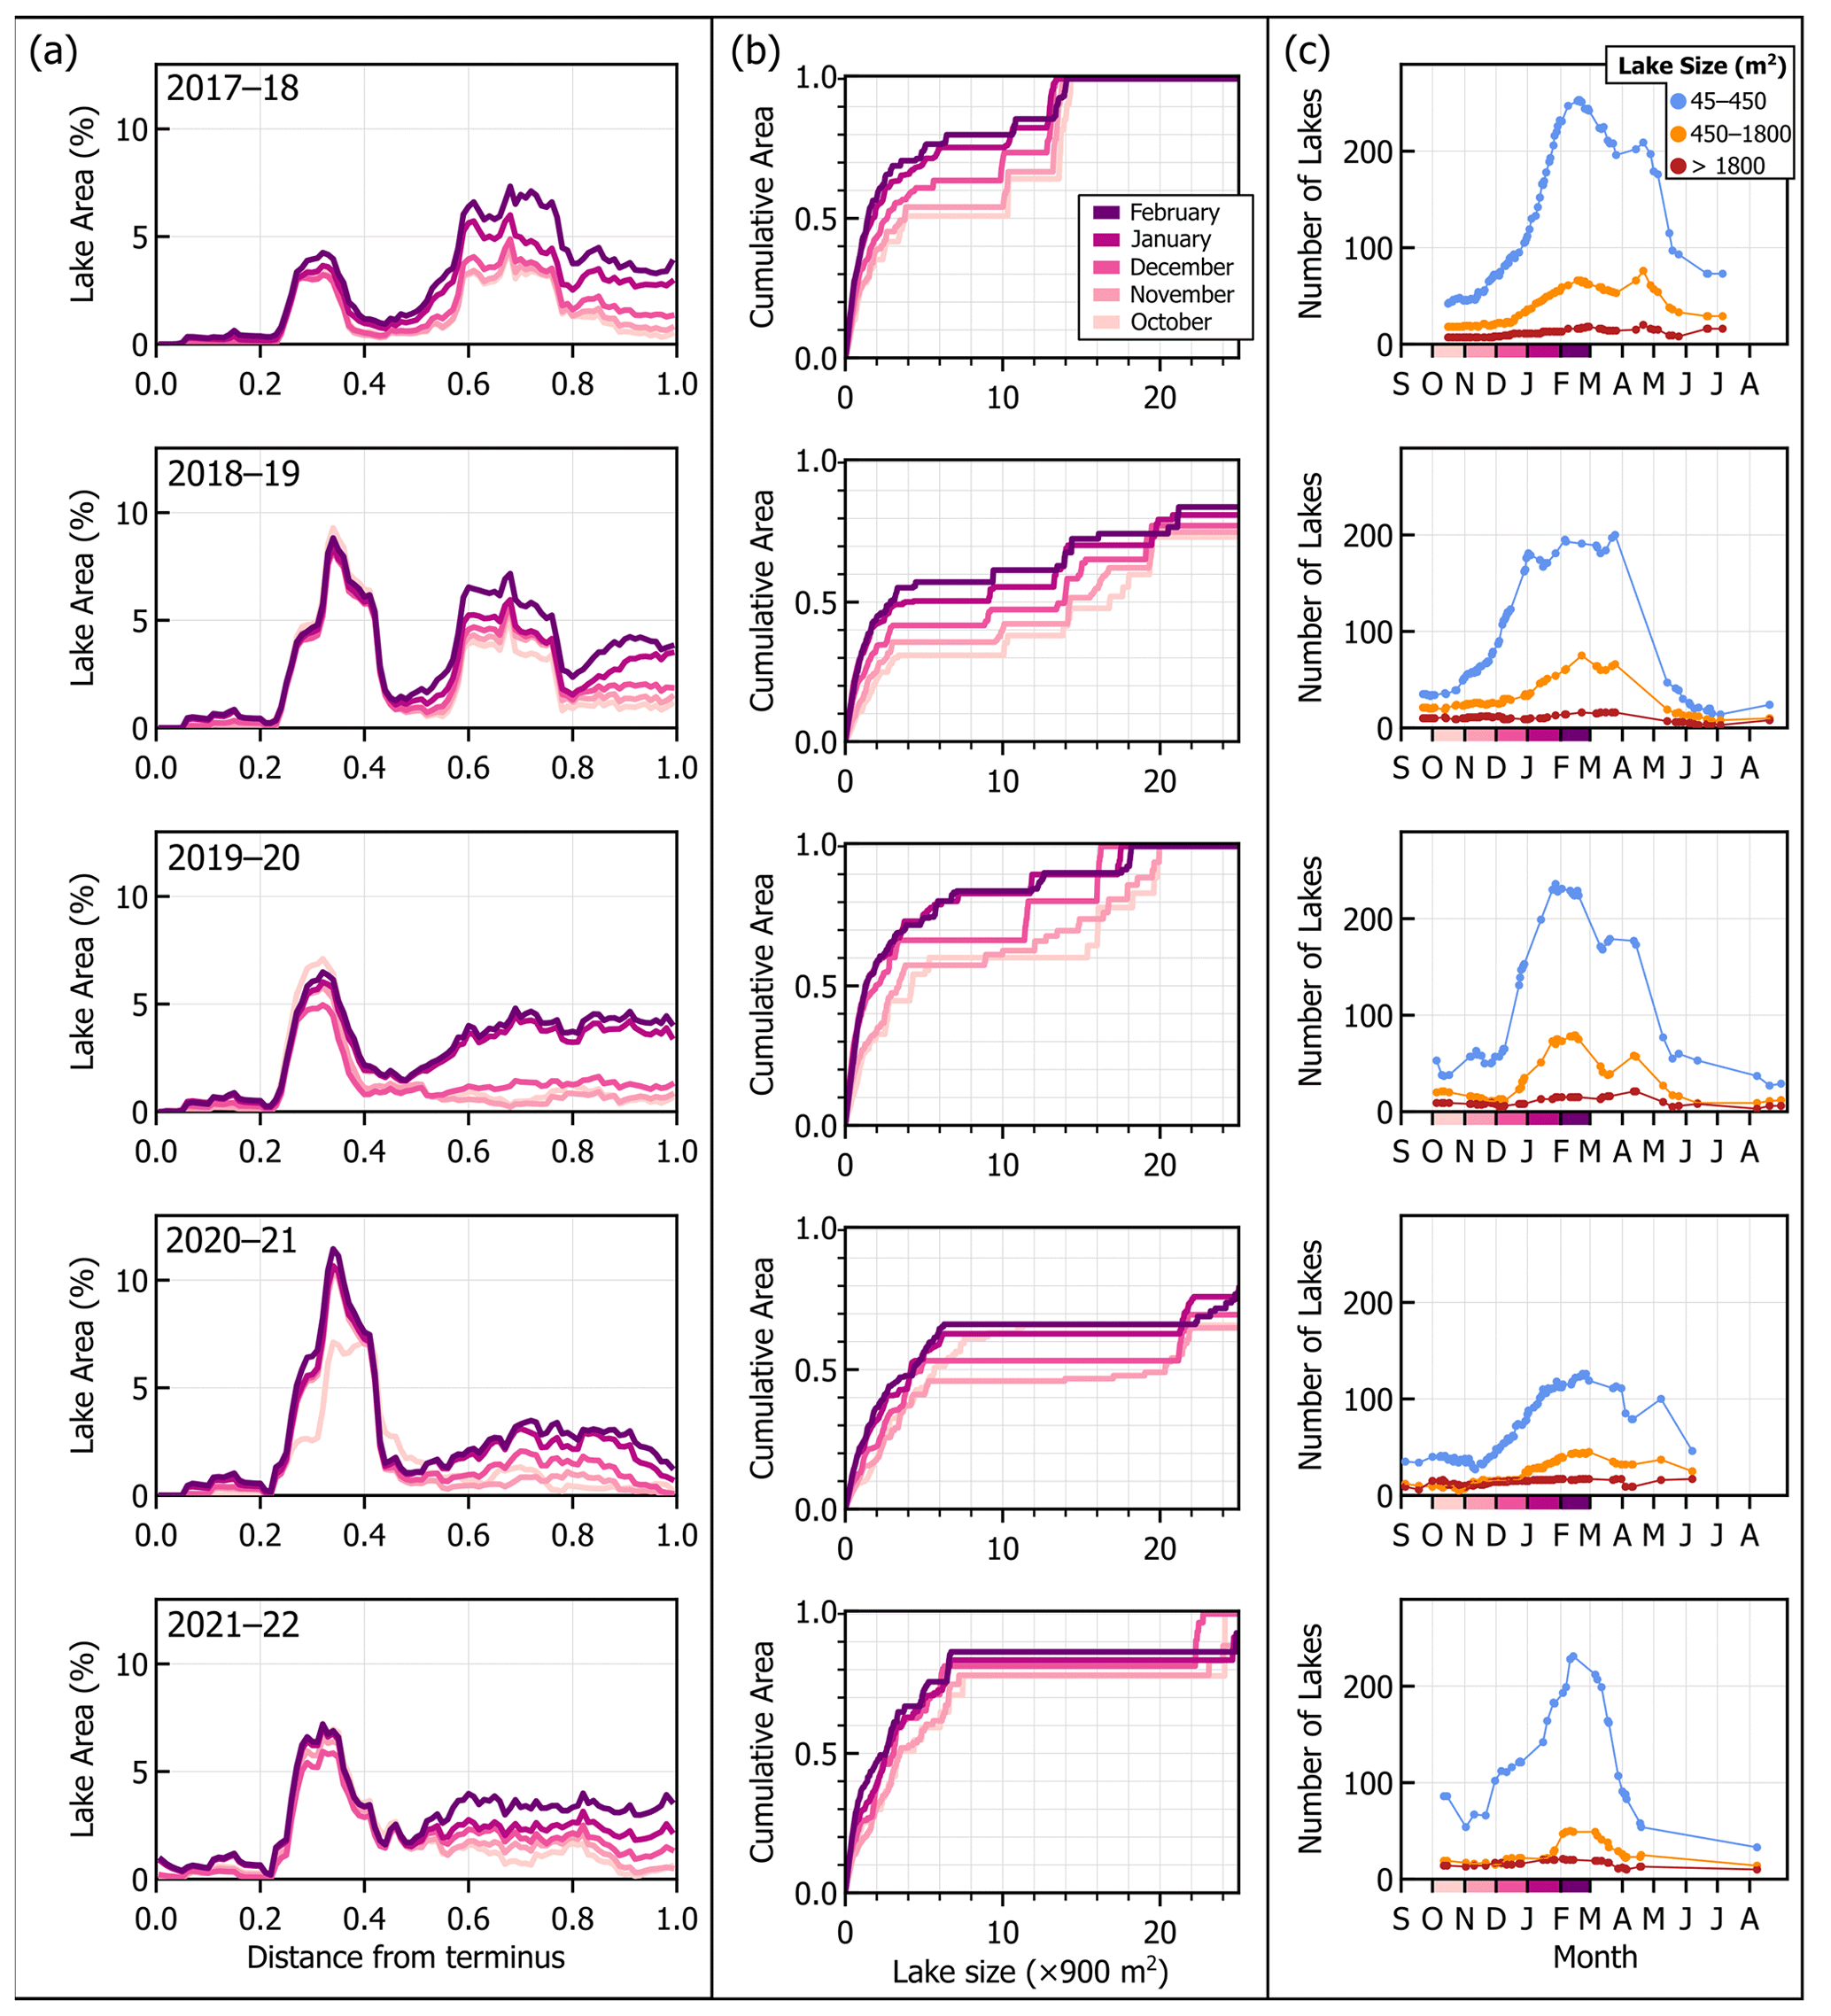
Figure 6The October–February seasonality of SGLs on Lhotse Glacier, with each row showing a unique year. Panel (a) shows the percent of the glacier area with SGL coverage (y axis) as a function of the normalized distance form the terminus (x axis), with each line showing the area in a single month. Panel (b) shows the cumulative SGL area (y axis) with increasing lake size (x axis) in each month. The x-axis ticks are shown in 900 m2 increments (the size of a single Landsat pixel). Areas are normalized to a 0–1 scale to allow direct comparison between months and years. Panel (c) shows the changes in the number of individual lakes within each image, binned into three different sizes. Blue dots represent lakes smaller in size than half of a Landsat pixel, orange dots represent lakes between one-half and two Landsat pixels, and red dots represent lakes greater than two Landsat pixels.
5.2.2 Individual lake dynamics
The high spatial and temporal resolution of PlanetScope imagery allows investigation of the pattern of individual lake filling and drainage events (Fig. 4). Analysis of the pattern of individual lake dynamics reveals a complex system, where individual lakes may exhibit seasonal to multiannual patterns of surface area variations that greatly differ from the glacier-wide trends and even nearby lakes.
Table 2Observations of lake count and area on individual glaciers over the 2017–2022 Planet observational period. Note that the number of lakes on a glacier at a single point in time (i.e., Max. no.) may be greater than the total number of lakes identified on the glacier over the entire time period (Lake no.) if individual lakes merge together to create a single larger lake. Total lake area, minimum lake area, and maximum lake area are provided in absolute area (m2) and as a percentage of the glacier's debris-covered area. Minimum and maximum lake area and count for each glacier are provided in the Supplement.
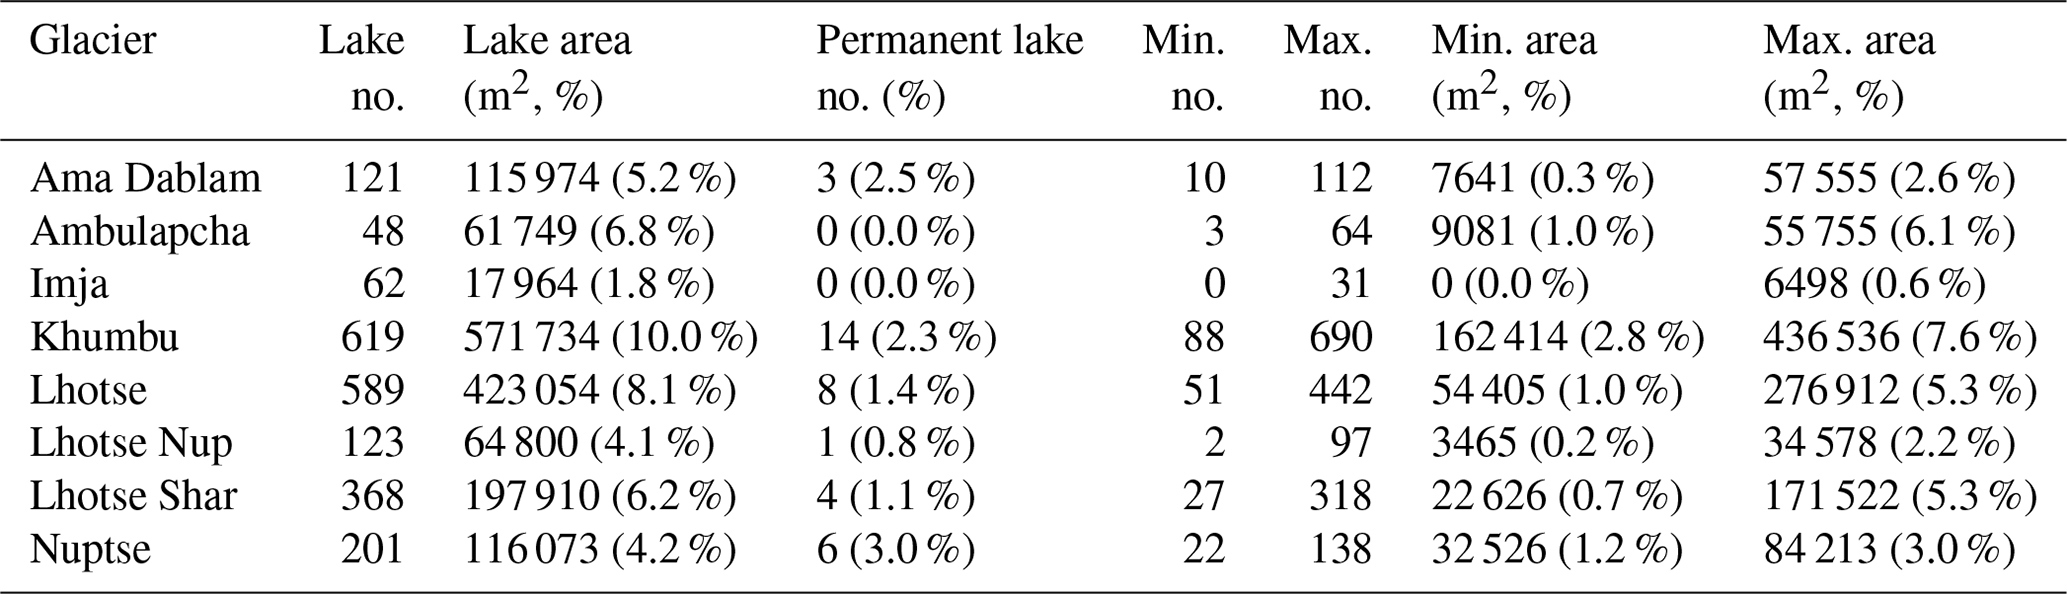
A total of 2131 unique lakes greater than or equal to 45 m2 in area were identified in the Planet-derived lake inventory across the 5-year period, ranging in number from 48 to 619 across the eight glaciers (Table 2), with a total area of 1.57 km2. Of these lakes, only 36 were permanent (never completely draining across the entire study period), representing 1.7 % of the lakes by count and 23.9 % by area (at their maximum extents). These permanent lakes tend to be closer to the terminus of their respective glaciers, with an average normalized distance of 0.47 (47 % of the distance from the terminus to the upper debris-covered area) compared to 0.66 for all other lakes.
The recurrence frequency of the ephemeral (non-permanent) lakes varied substantially based on their size, with larger lakes reappearing more frequently. Lakes smaller than a single Landsat pixel (900 m2) appeared on average in 2.0 years out of the 5 years of Planet observations, while lakes larger than this threshold appeared in 4.5 years on average (calculated by separating years on 1 September). Only 355 (16.7 %) of all lakes appeared in all 5 years, and the average size of these lakes was 3034 m2 compared to an average size of 277 m2 for all others.
In some instances (on the Khumbu and Ambulapcha glaciers) the number of lakes identified at a single point in time was greater than the total number of lakes identified on the glacier across the entire study period (Table 2). This may happen if unconnected lakes expand and eventually coalesce into a single lake, resulting in a greater lake area but smaller number of lakes.
We identified multiple lakes greater than 10 000 m2 which experienced rapid drainage events (e.g., Fig. 4), which all occur near the onset of the monsoon season (May–June). Drainage events similar to these have been previously documented in this region and can cause significant impacts and damage to downstream communities and infrastructure (Rounce et al., 2017; Miles et al., 2018). In fact, the lake which we observed to rapidly drain twice (in 2019 and 2021) was also noted to be involved in the 2015 flood event documented by Rounce et al. (2017). Further analysis of the Landsat archive reveals six additional instances of this lake filling and draining within the 2008–2016 time period (and none prior to 2008), and the lake area increased each time that it refilled.
The total SGL area on Ambulapcha Glacier is dominated by two large lakes near the terminus that have distinct and contrasting seasonal patterns (Fig. 4). The lake nearest to the terminus rapidly fills during the monsoon season each year and slowly drains throughout the post-monsoon, winter, and pre-monsoon seasons (Fig. 4). In contrast, the second lake further from the terminus was consistently present over the duration of the PlanetScope observations, expanded throughout the 5-year period, and completely drained during the onset of the monsoon season in 2022 (Fig. 4).
These lakes were empty during the May 2023 field campaign, allowing detailed topographic mapping of the lake basins (Fig. S15 in the Supplement). Both lakes appeared to have drained englacially, as evidenced by the presence of small ponds and exposed ice at the bottom of each basin. We used UAV-derived DEMs of the basins to construct an area–volume scaling relationship for each by calculating the total surface area and volume with incrementally increasing water depths (0.2 m increments) to a maximum depth of 40 and 24 m (for the lower and upper lake, respectively). The volume of the pre-existing ponded areas in each basin was estimated according to the relationship presented by Watson et al. (2018b), which built on the findings of Cook and Quincey (2015). The results from our artificial filling of the two basins found that the area–volume relationships of each fall within the range of existing SGL observations (Watson et al., 2018b) (Fig. S15).
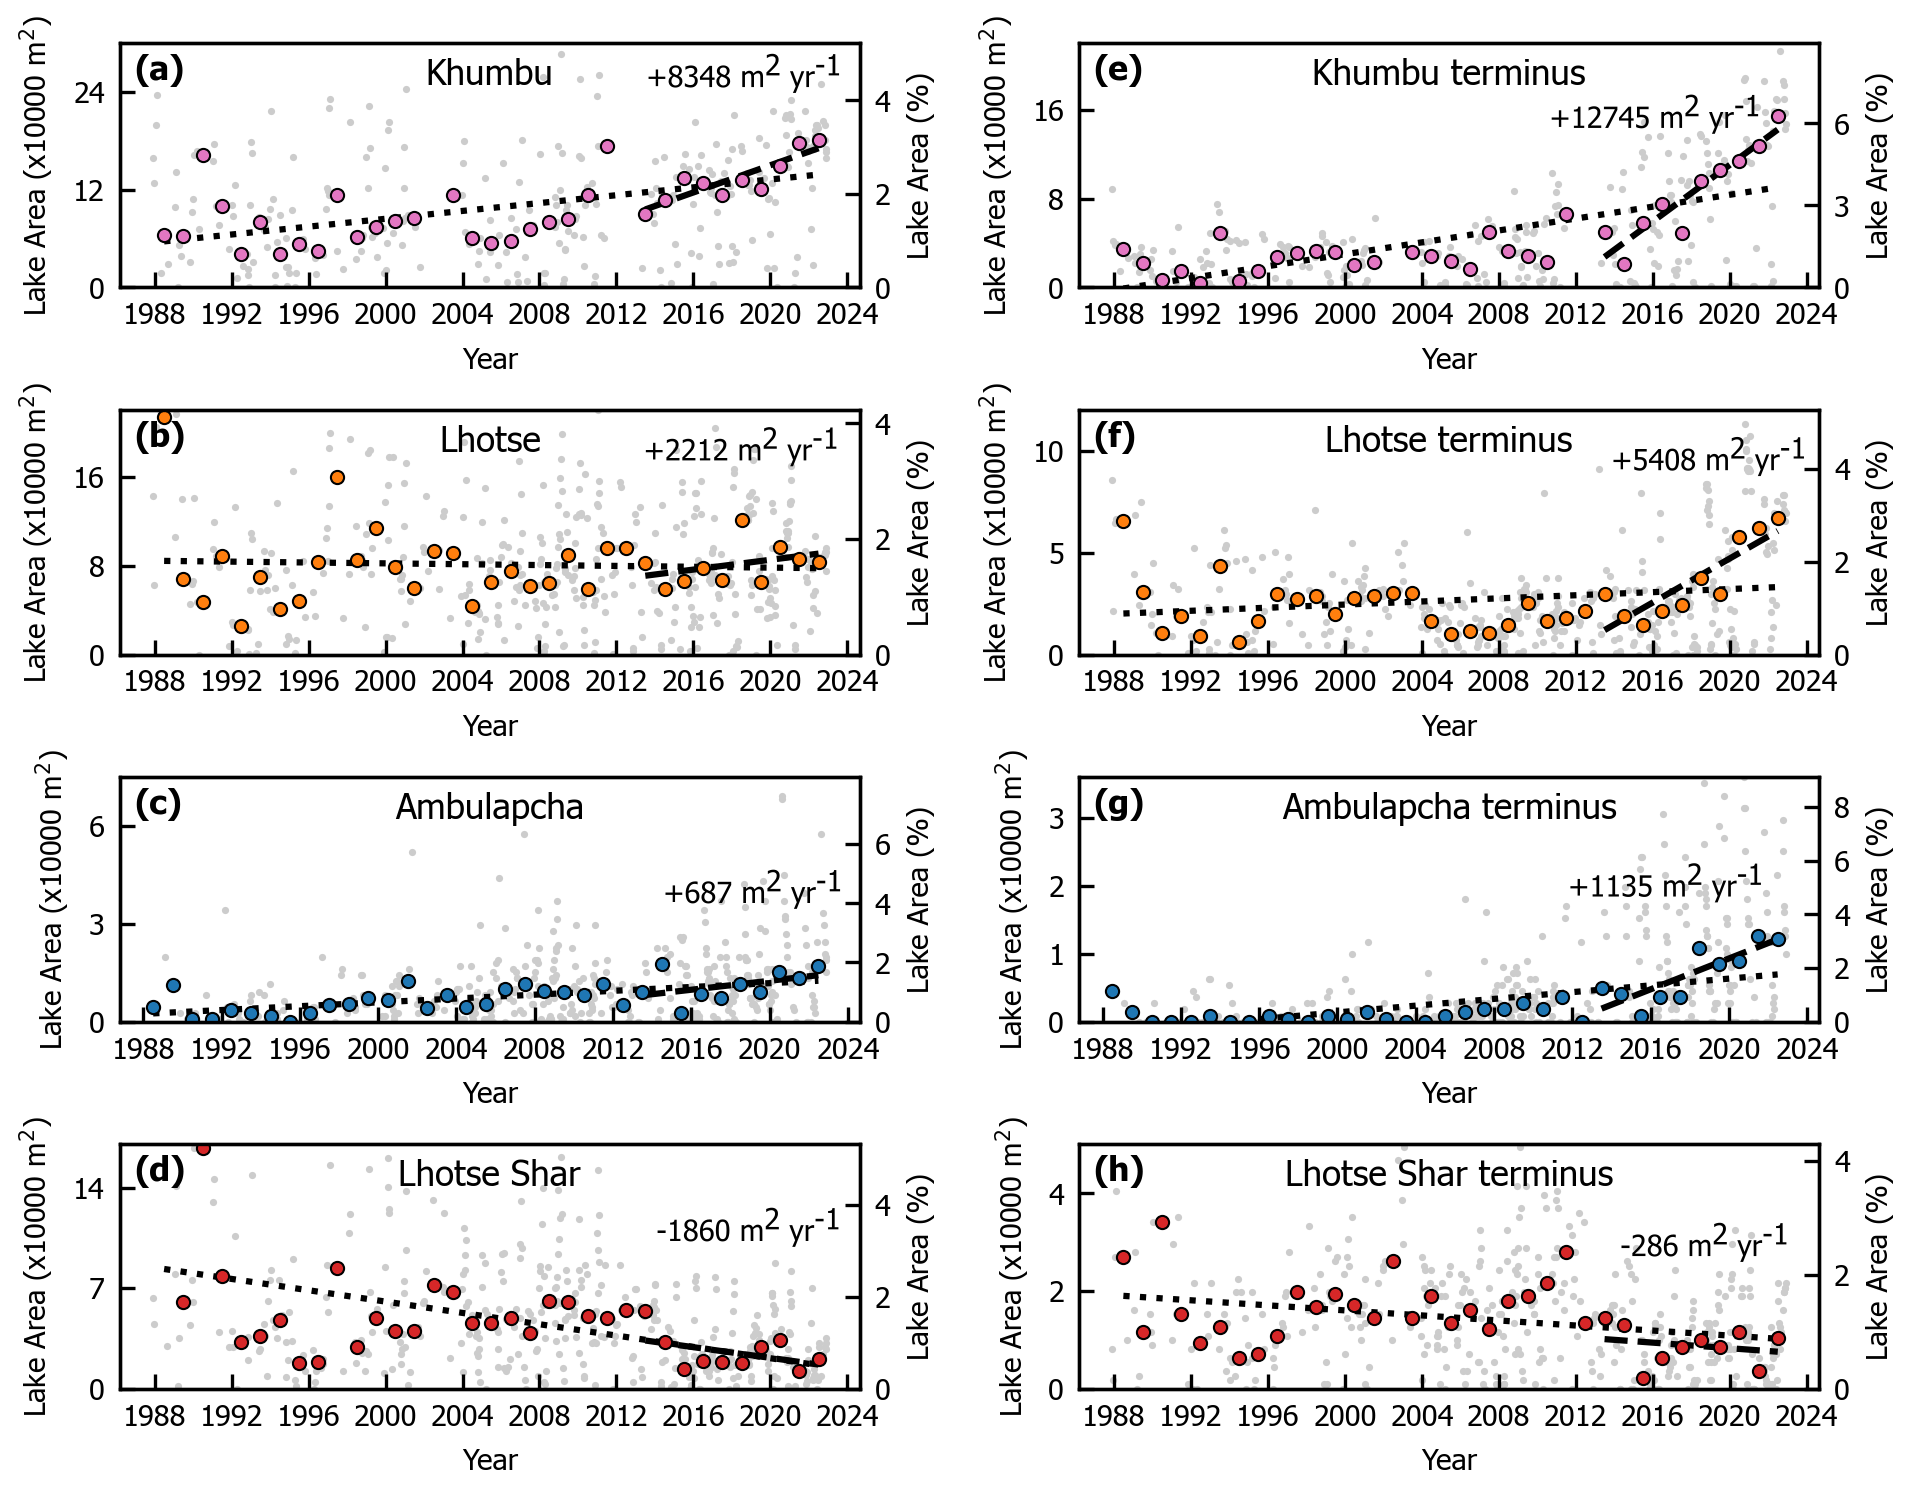
Figure 7Long-term trends in SGL area on four glaciers as derived from Landsat imagery. Light-gray dots show the lake area in individual Landsat images, while larger colored dots show the mean SGL area within each calendar year. Panels (a–d) show the SGL area over the entire glacier surface, while panels (e–h) show the lake area only on the near-terminus area (defined as the lower 50 % of the glacier). Dotted and dashed lines show the linear regression of the annual averages for the entire time period (dotted) and only the 2013–2022 time period (dashed). Labeled slopes correspond to the 2013–2022 linear regression. All slopes and P values are provided in Table S9.
5.3 Long-term trends
Complex patterns and trends in SGL evolution over decadal timescales are revealed by the Landsat-derived products, with notable differences being observed between different glaciers, between different parts of individual glaciers, and through time. Over the 1988–2022 period, two of the eight glaciers (Khumbu and Ambulapcha) showed a statistically significant (P < 0.05) positive trend in glacier-wide SGL area in Landsat-derived observations, based on a linear regression of the average annual lake area (Figs. 7 and S16, Table S9). Two glaciers (Imja and Lhotse Shar) showed a statistically significant negative trend, while the remaining four did not have a statistically significant trend. Limiting the time period to only 2013–2022 (after the launch of Landsat 8), we find that only Khumbu has a statistically significant positive trend in SGL area, while the seven other glaciers have no statistically significant trend (Figs. 7 and S16).
If we limit the area of investigation of each glacier to include only the lower half of the debris-covered area, where lake area shows less seasonal variation, then we find similar temporal trends. Three glaciers (Khumbu, Nuptse, and Ambulapcha) show an increasing trend over the 1988–2022 period, two (Imja and Lhotse Shar) show a decreasing trend, and the remaining three show no significant trend. In the more recent (2013–2022) period, three glaciers show a statistically significant increasing trend (Khumbu, Lhotse, and Ambulapcha), and one (Ama Dablam) shows a decreasing trend (Figs. 7 and S16, Table S9). The remaining glaciers show no statistically significant trend over the 2013–22 period, although increasing lake area on Nuptse is significant at the P < 0.1 level.
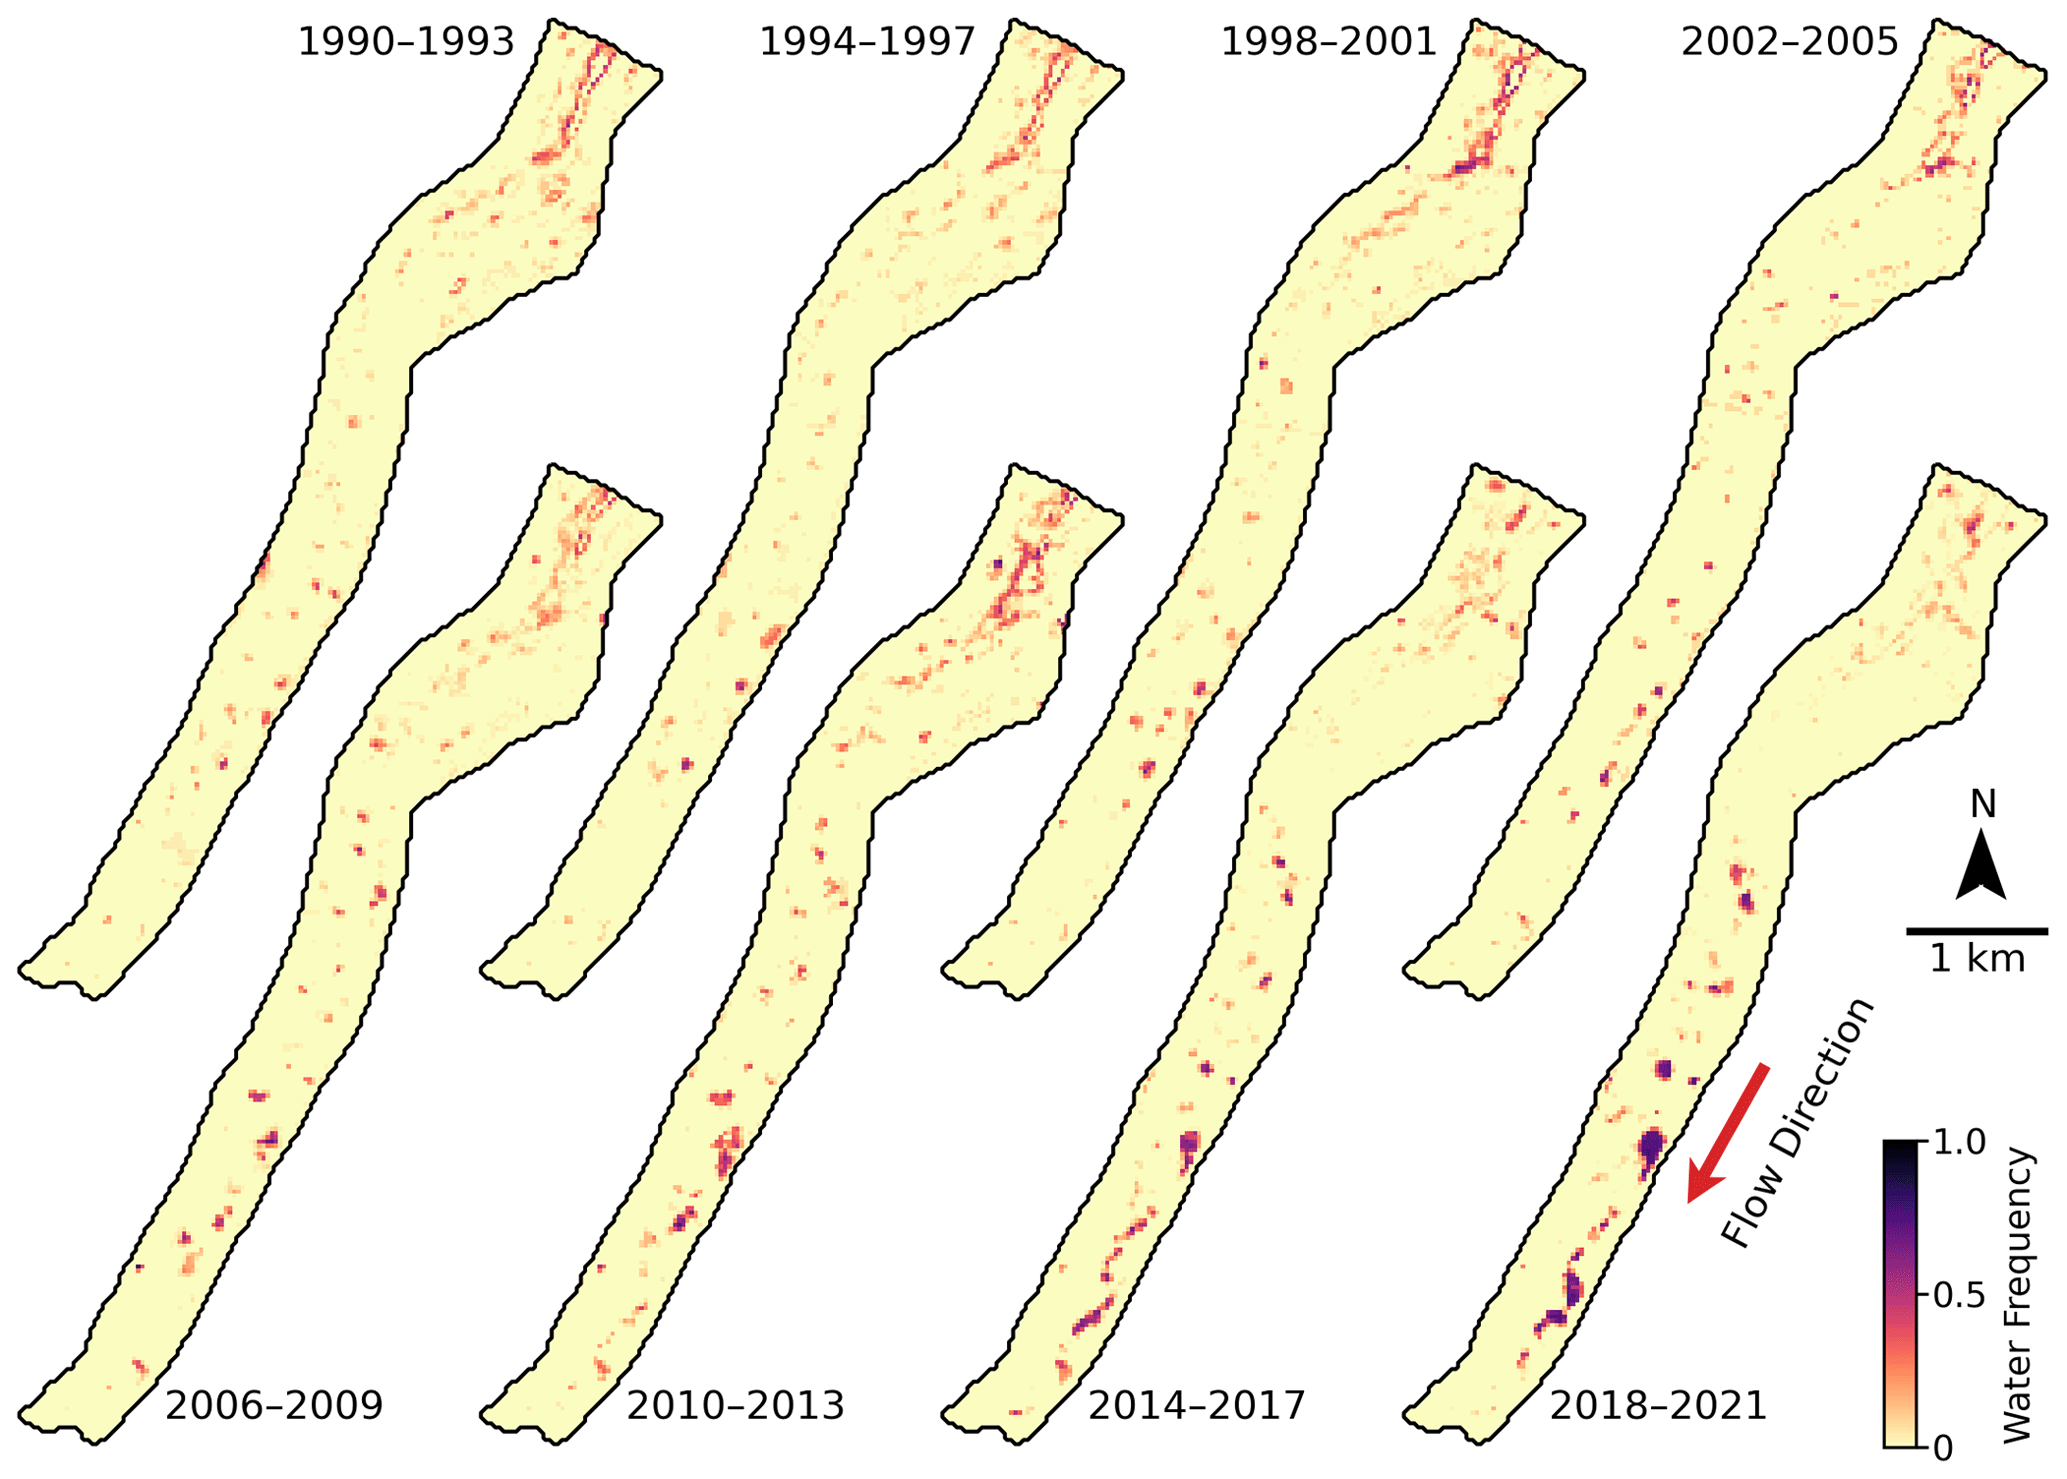
Figure 8SGL frequency maps of Khumbu Glacier as derived from Landsat imagery. Each figure shows the water distribution aggregated within 4-year intervals. Colors show the frequency with which each pixel was identified as water, with darker colors indicating more frequent water.
Looking at the decadal-scale changes in spatial distribution of SGLs better illustrates the contrasting patterns among the studied glaciers. The development and expansion of SGLs near the terminus of Khumbu Glacier is clearly visible, while at the same time there is a decrease in the frequency of lakes further up-glacier (Fig. 8). Similarly complex patterns of SGL changes are apparent on all glaciers (Figs. S17–S23 in the Supplement) and offer complementary data to the time series investigation.
6.1 Comparison with previous SGL studies
The results of this study highlight how the high temporal resolution of PlanetScope imagery can be leveraged to advance our understanding of supraglacial lake dynamics. Prior analyses of the seasonal cycle of SGLs (Miles et al., 2017; Narama et al., 2017) have largely relied on coarser-resolution Landsat imagery aggregated over decadal time periods in order to identify seasonal trends. While our results show a gradual increase in total lake areas throughout the winter leading up to the onset of the monsoon season, these analyses (neither of which focus on the Khumbu region) have found that SGLs initially appear and fill in the pre-monsoon months (March to April) and then drain throughout the monsoon. A study by Wendleder et al. (2021) synthesized Sentinel-2, PlanetScope, and SAR datasets to construct a time series of SGL area over the summer months (April–September) on Baltoro Glacier (Pakistan). Similarly to the previous studies, Wendleder et al. (2021) also found that lakes appeared and expanded rapidly in the spring months and drained throughout the summer.
The differences between these previous studies and our findings showing wintertime lake expansion may be due to differences in regional climate causing different seasonal patterns of lake development, methodological differences (such as minimum lake size identifiable in Landsat images being 225 m2 if the image is pansharpened), or not including frozen lakes in their inventories. The debris-covered areas of the glaciers in our study region generally do not have continuous snow cover for the entire winter, making SGL identification possible during these months. A study by Taylor et al. (2022) found wintertime (December to February) increases in SGL area on two of the three debris-covered glaciers they investigated on the Bhutan–Tibet border and attributed this to variations in efficiency of supraglacial drainage systems between different glaciers and between seasons.
The seasonal variation in SGL area on individual glaciers that we find with our Planet-derived products is of higher magnitude than decadal-scale trends in lake area change from the Landsat record. Many previous studies which use higher-resolution imagery to investigate SGLs on the same glaciers as this study have used a series of images that may cover a wide range of years (up to multiple decades) but are captured at irregular seasonal timings (Mohanty and Maiti, 2021; Watson et al., 2016; Steiner et al., 2019). Our results suggest that such study designs are likely to be insufficient for differentiating between the regular annual cycle and the long-term evolution of SGLs described here without controlling for seasonality (i.e., using only images captured during the same month across all years).
Watson et al. (2016) investigated the dynamics of SGLs on seven of the eight glaciers in our study (all but Ambulapcha) by using high-resolution (0.5–2 m) imagery over the 2000–2015 time period, with approximately four images of each glacier used. There was no direct overlap between their observations our PlanetScope-derived products (which are the closest in spatial resolution), but it provides an important opportunity to compare and validate the findings of each. The total area of SGLs identified on each glacier by Watson et al. (2016) was similar in magnitude to our results when comparing images from similar times of year (Fig. S3). The limited image sample size in their study made it difficult to differentiate between the impacts of long-term SGL evolution and seasonal to annual SGL evolution, although they identified substantial inter- and intra-annual variability in SGL area. For glaciers other than Khumbu Glacier, the main findings were based on a series of three images from October 2011, December 2013, and January 2015. They found that total lake area increased on each glacier over this image series with the largest increases occurring in zones further from the terminus and a trend towards smaller lakes accounting for a larger area (Watson et al., 2016, Figs. 5 and 8). These results are identical to the annual pattern of wintertime lake development which we observed in our PlanetScope-derived dataset (Fig. 6), providing validation of our findings while confirming that the trends observed by Watson et al. (2016) on these glaciers can likely be attributed to regular seasonal variations in SGL area rather than longer-term evolution of these glaciers.
Watson et al. (2018b) presented in situ observations on SGLs near the terminus of Khumbu Glacier over the 2015–2016 year. They found that these lakes reached an annual maximum during the summer monsoon season, followed by continuous shrinkage throughout the following post-monsoon and winter months. These results largely supported the findings by Miles et al. (2017) and Narama et al. (2017) (which investigated SGLs in different basins within High Mountain Asia) of the maximum SGL area occurring during the monsoon season and shrinking in the post-monsoon and winter months. Our analysis showed a similar annual pattern of lake area in this same area of Khumbu Glacier (Fig. 4b), where the maximum lake area is observed at the end of the monsoon season (September) each year, and the area decreases throughout the post-monsoon, winter, and pre-monsoon seasons. The discrepancy between the patterns seen in these lakes and the pattern of total glacier-wide SGL area increasing throughout the post-monsoon and winter seasons (Fig. 6) shows that caution is warranted when extrapolating observations across the entire glacier, to other lakes, or to other glaciers, as individual lakes and/or portions of a glacier often have unique spatiotemporal patterns.
The limited availability of cloud-free imagery in the monsoon months limits our ability to draw conclusions about the specific timing and rate of drainage from our automated SGL identification approach. An approach focused on manual lake delineation during the monsoon and pre-monsoon time periods or approaches using SAR data (Wendleder et al., 2021) would be more capable of answering these questions.
These findings highlight how, while satellite remote-sensing platforms are capable of tracking changes in SGL area, they are not able to identify the specific processes which cause lakes to fill and drain. Detailed in situ observations such as those by Watson et al. (2018b) are needed to complement remotely sensed observations.
6.2 Winter lake expansion
Our results showing an increase in total SGL area throughout the winter months are counter-intuitive, as the cold temperatures, limited precipitation, and minimal snow and ice melt would seemingly limit the availability of liquid water and suppress lake formation (Miles et al., 2017). We hypothesize that absorption of solar radiation and conduction to underlying ice in areas with thin debris cover (Rounce et al., 2021; Miles et al., 2022) may lead to meltwater production during winter months, while inefficient drainage systems result in this water pooling at the surface (Miles et al., 2020). This hypothesis is supported by the observation that wintertime lake appearance and expansion are most prominent in the upper debris-covered regions of the glaciers (Fig. 6), where debris cover is thinnest, rather than at lower regions where thicker debris cover provides an insulating effect (Rounce et al., 2021). The inconsistent snow cover on the debris-covered tongues of these glaciers (particularly during the early winter months) would increase the potential solar radiation reaching their surface, particularly on the glaciers with more southerly aspects which also show the most consistent wintertime lake expansion (Fig. 5). This phenomenon may not be observed on glaciers in other regions with more consistent wintertime snow cover or in regions with climates that are not dominated by the summer monsoon season.
6.3 Long-term trends
Our findings highlight many of the difficulties associated with monitoring the long-term evolution of SGLs. The seasonal variations in glacier-wide lake area are of a magnitude similar to or greater than the long-term changes (Figs. 5, 7, and S16). The long-term trends in lake area are variable depending on the time period and the specific area of the glacier investigated. We found that SGL area increased near the terminus on four of the glaciers investigated (Khumbu, Lhotse, Ambulapcha, and Nuptse) over the 2013–2022 time period (Fig. 7, Table S9). This observed expansion and possible future coalescing of near-terminus lakes on these glaciers suggest that they should be closely monitored for future outburst flood risk (Benn et al., 2012).
An efficient supraglacial stream network on the surface of Lhotse Shar, combined with a highly incised notch in the terminal moraine, as observed from field observations, has likely prevented large lakes from persisting on its surface. In contrast, Khumbu Glacier has a similarly efficient supraglacial stream network near its terminus, which also flows off the glacier through a deep notch in the terminal moraine, but has nevertheless developed many large SGLs that have been continuously expanding and coalescing in recent years (Naito et al., 2000). This contrasting behavior, compared to Lhotse Shar, may be due to a slightly lower surface gradient and greater number of ice cliffs on Khumbu Glacier. However, the presence of the outlet stream deeply incised into the moraine on Khumbu Glacier may help to limit future SGL expansion.
The recent SGL expansion on Lhotse Glacier is unique within this study region. The lower section of the glacier, downstream from the area of lake expansion, is relatively steep (up to 5∘ near the terminus), has a well-established stream drainage network, and has little to no terminal moraine. The lake expansion has occurred predominantly in an area ∼ 2 km from the terminus (Fig. S22), at a point where the surface gradient lowers to 2∘ and maintains that slope for ∼ 3 km up-glacier. The steep slope and lack of a well-defined terminal moraine suggests that Lhotse Glacier may not follow the same evolutionary trajectory of terminal lake development as the nearby Imja Tsho. However, sudden drainage of the large SGLs englacially and through the existing supraglacial stream network remains possible (Rounce et al., 2017).
Our long-term time series of SGLs on the Imja and Lhotse Shar glaciers show only a portion of the lakes that are present throughout the time period because a static glacier outline was used. These glaciers were significantly larger in the late 1980s and have been retreating rapidly due to the expansion of their proglacial lake (Imja Tsho). Their transition to lake-terminating glaciers has likely inhibited the growth of supraglacial lakes due to increasing surface velocities. The expansion of Imja Tsho is certain to have further significant effects and feedback on the subglacial, englacial, and supraglacial hydrologic systems of the glacier (Watanabe et al., 2009), but those are not investigated in this paper.
6.4 Methodological limitations
The semi-automated approaches used for SGL delineation in Landsat, Sentinel, and PlanetScope imagery substantially increase the amount of data which can be efficiently analyzed relative to manual identification methods. However, it is important to understand the limitations of these automated methods in order to appropriately use the derived products.
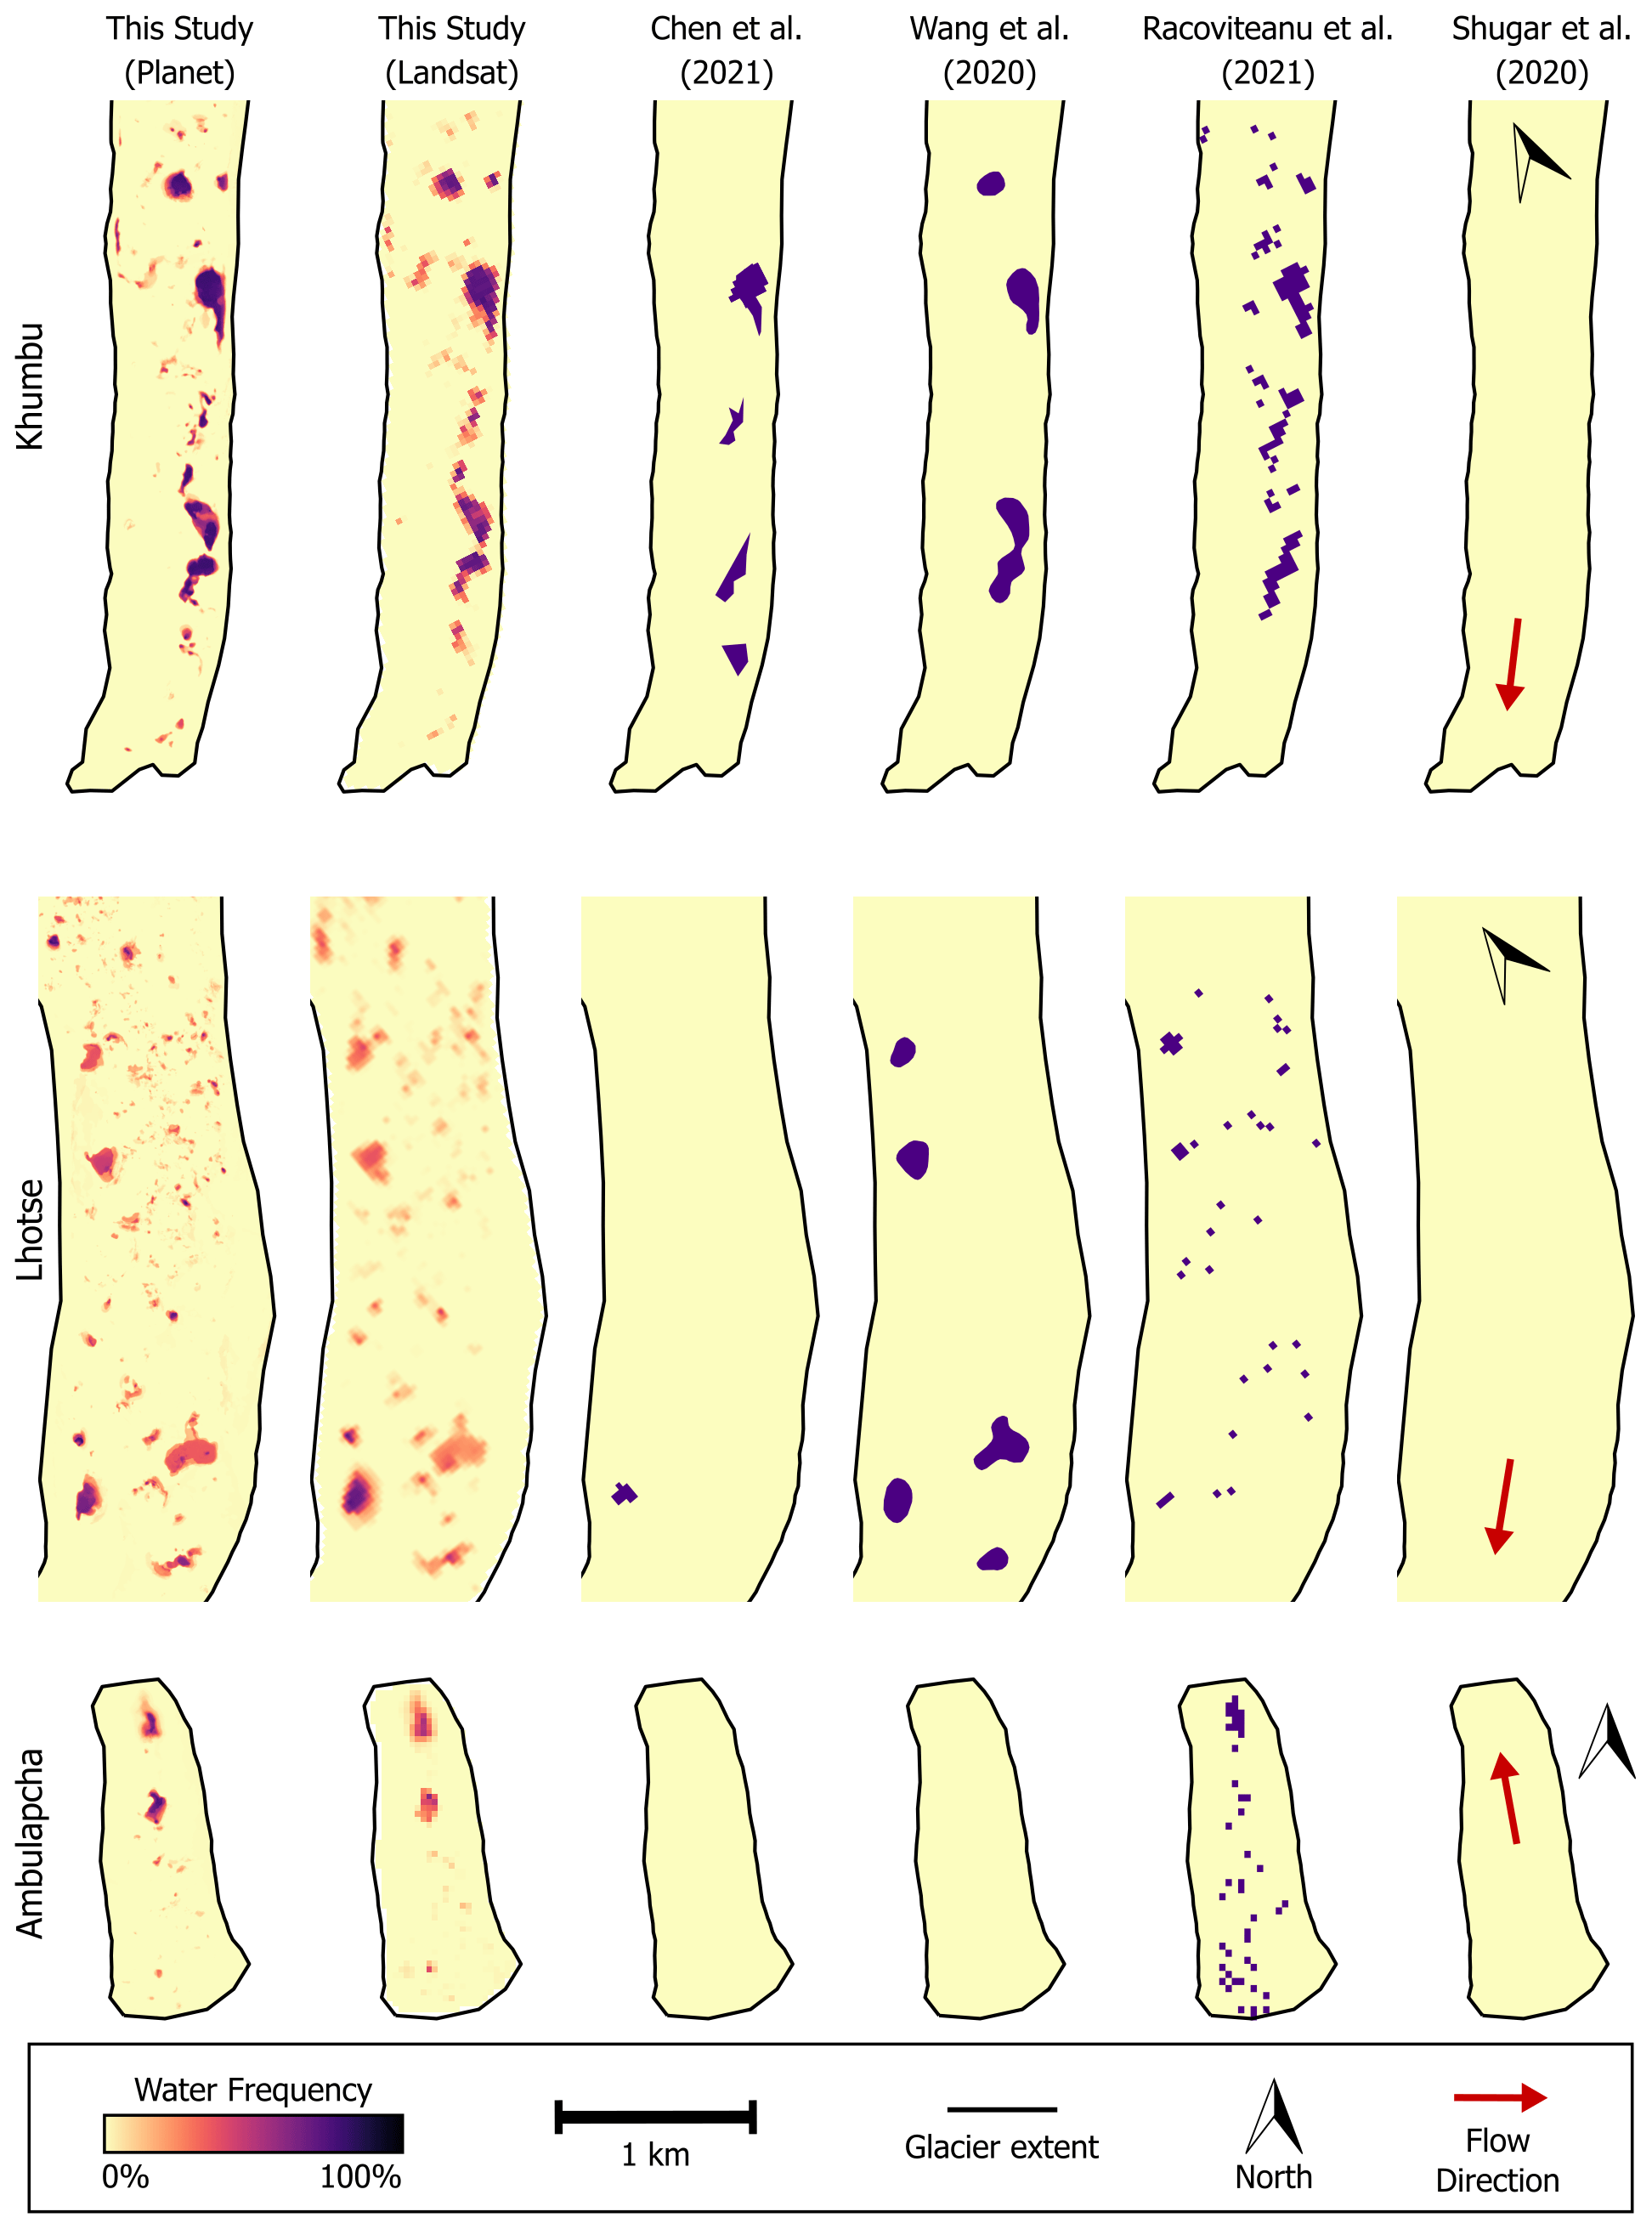
Figure 9A comparison between our Planet-derived and Landsat-derived lake extents and publicly available regional-scale inventories (Chen et al., 2021; Wang et al., 2020; Racoviteanu et al., 2021; Shugar et al., 2020).
The geolocation accuracy of PlanetScope imagery can be poor (up to 10 m RMSE at the 90th percentile) (Planet Team, 2022), particularly in complex and steep terrain such as the Himalayas, resulting in multi-pixel misalignment between images or between individual bands within the same image. This can inhibit the ability to track spatial and temporal evolution of features as small as SGLs and introduce substantial noise into the data. Differences in the sensors on individual satellites can further add noise. Taking advantage of the high temporal resolution of PlanetScope imagery allows the filtering out of much of the noise and increased confidence in the results. However, significant cloud cover during the pre-monsoon and monsoon seasons, in addition to consistently frozen lake surfaces in the February–April months, lowers the confidence of the results during those times (Figs. S3 and S4). The decrease in total SGL area that we see on many glaciers between March and June each year is likely due to these cloud and ice limitations, rather than a true decrease in lake area.
Higher geolocation accuracy of Landsat and Sentinel-2 images was observed compared to PlanetScope images relative to their spatial resolution, both between images and between bands in single images. This accuracy, combined with a high degree of consistency in the spectral quality of images, allows Landsat and Sentinel-2 to overcome many of the limitations inherent to using PlanetScope imagery. However, the lower spatial and temporal resolution (particularly for Landsat) means that smaller SGLs and short-term variations are difficult or impossible to identify. Additionally, identifying lakes with frozen surfaces is more difficult without the dense temporal resolution that was used for the Planet-derived dataset, further obscuring wintertime changes in lake area.
6.5 Comparison with regional-scale databases
A comparison between the SGL extents produced in this study with regional- or global-scale glacier lake inventories (Chen et al., 2021; Wang et al., 2020; Racoviteanu et al., 2021; Shugar et al., 2020) suggests that existing datasets do not capture the full behavior of SGLs through space and time (Fig. 9). We found that three time-varying inventories (Chen et al., 2021; Wang et al., 2020; Shugar et al., 2020) considerably underestimated the extent of modern SGLs on these eight glaciers. The Shugar et al. (2020) dataset, which used the full Landsat archive to map glacial lakes across the entire globe in 5-year time intervals, does not include any SGLs on these glaciers due to the minimum size threshold of 50 000 m2 that was used. Additionally, two areas of glacial ice were misclassified as lakes in the 2020 product (not shown in Fig. 9 because they are up-glacier from the study region). The Chen et al. (2021) Hi-MAG dataset provides annual glacial lake outlines in the High Mountain Asia region for the 2008–2017 time period derived from Landsat imagery and using a 8100 m2 minimum size threshold. On these glaciers a single lake was identified on Lhotse Glacier in 1 year, seven total lakes on Khumbu Glacier across 4 years, and no lakes on the other glaciers in our study area. The Wang et al. (2020) dataset provides glacial lake outlines in the High Mountain Asia region for two time steps (1990 and 2018) using manual delineation of Landsat imagery and a 5400 m2 minimum size threshold. Their 2018 data found five SGLs on Lhotse Glacier, two on Ama Dablam Glacier, and five on Khumbu Glacier (and no lakes on the others).
In contrast, Racoviteanu et al. (2021) used a spectral unmixing model on Landsat 8 imagery to identify supraglacial ponds on debris-covered glaciers in the Himalayas during the post-monsoon season (September–November) in 2015. Their spectral unmixing approach allowed for identification of ponds that were smaller than a single Landsat pixel. The derived dataset shows a comparable magnitude (falling within the range of our PlanetScope-derived products) and spatial distribution of SGLs to our findings but only provides data for a single time step.
While the differences in SGL number and area of these datasets (Chen et al., 2021; Wang et al., 2020; Shugar et al., 2020) relative to our findings are due primarily to the minimum size threshold used (and the overall aims of their studies), these comparisons highlight how our current understanding of SGL dynamics over regional or global scales is very limited. Studies which focus primarily on the unique spatial and temporal characteristics of SGLs (e.g., Racoviteanu et al., 2021) are needed to better characterize these features.
In this paper, we presented an automated approach to identifying SGLs on debris-covered glaciers from PlanetScope, Sentinel-2, and Landsat imagery. Lake identification in Landsat and Sentinel-2 was optimized using coincident Planet observations. These methods were used to map lake extents on eight glaciers in the Khumbu region of Nepal over the 1988–2022 time period.
A regular annual cycle in SGL development was found, with the annual minimum in glacier-wide lake area occurring at the end of the monsoon season followed by a gradual increase throughout the winter season and a maximum in February and March, followed by drainage throughout the monsoon season. The magnitude of seasonal variations was considerable, with the annual maximum being approximately double the annual minimum. This annual cycle is driven by the appearance and gradual expansion of small lakes in the upper debris-covered regions of these glaciers throughout the winter months, while larger lakes near the glacier termini tended to be more stable or slowly drain during the winter. Over decadal timescales, near-terminus lakes were observed to be expanding and coalescing on four of the glaciers (Khumbu, Lhotse, Ambulapcha, and Nuptse), highlighting the need for continued observation to evaluate the evolving glacier lake outburst flood hazards they present.
The annual cycle in SGL area which we identified has important implications for interpreting prior observations of SGLs. The intra-annual timing of observations must be considered in order to differentiate long-term trends from seasonal variability. A comparison between our results and existing regional-scale glacier lake inventories showed that the complex spatiotemporal patterns are not fully captured in these datasets. Our findings highlight the unique capabilities of satellite remote-sensing platforms to track changes in SGL area over time. However, detailed in situ observations are needed to complement these remotely sensed observations to better understand the processes controlling SGL evolution.
All Sentinel-2 and Landsat imagery are available and were accessed via the Google Earth Engine Data Catalogue at https://developers.google.com/earth-engine/datasets/catalog (Google Earth Engine, 2024). Derived products (image-specific lake extents, DEMs, and orthomosaics) and analytical scripts are available via Zenodo (https://doi.org/10.5281/zenodo.10463250; Zeller et al., 2024).
The supplement related to this article is available online at: https://doi.org/10.5194/tc-18-525-2024-supplement.
Concept and design were done by LZ and DM; programming by LZ; formal analyses by LZ; fieldwork by LZ, DM, SWM, and JJ; DEM generation by JJ and DM; writing by LZ; edit and review by LZ, DM, SWM, and JJ; visualization by LZ; and funding acquisition and project administration by DM and SWM.
The contact author has declared that none of the authors has any competing interests.
Publisher's note: Copernicus Publications remains neutral with regard to jurisdictional claims made in the text, published maps, institutional affiliations, or any other geographical representation in this paper. While Copernicus Publications makes every effort to include appropriate place names, the final responsibility lies with the authors.
The authors thank the Himalayan Research Expedition for important logistical support during fieldwork. We thank Anna Wendleder and Duncan J. Quincey for their constructive reviews which improved the quality of the paper.
This research has been supported by the National Aeronautics and Space Administration (NASA) High Mountain Asia Research Program (grant no. NNH15ZDA001N-HMA; award no. 80NSSC20K1343).
This paper was edited by Etienne Berthier and reviewed by Anna Wendleder and Duncan J. Quincey.
Benn, D., Bolch, T., Hands, K., Gulley, J., Luckman, A., Nicholson, L., Quincey, D., Thompson, S., Toumi, R., and Wiseman, S.: Response of debris-covered glaciers in the Mount Everest region to recent warming, and implications for outburst flood hazards, Earth-Sci. Rev., 114, 156–174, https://doi.org/10.1016/j.earscirev.2012.03.008, 2012. a
Benn, D. I., Wiseman, S., and Hands, K. A.: Growth and drainage of supraglacial lakes on debris-mantled Ngozumpa Glacier, Khumbu Himal, Nepal, J. Glaciol., 47, 626–638, https://doi.org/10.3189/172756501781831729, 2001. a
Bolch, T., Buchroithner, M. F., Peters, J., Baessler, M., and Bajracharya, S.: Identification of glacier motion and potentially dangerous glacial lakes in the Mt. Everest region/Nepal using spaceborne imagery, Nat. Hazards Earth Syst. Sci., 8, 1329–1340, https://doi.org/10.5194/nhess-8-1329-2008, 2008. a
Brun, F., Wagnon, P., Berthier, E., Jomelli, V., Maharjan, S. B., Shrestha, F., and Kraaijenbrink, P. D. A.: Heterogeneous Influence of Glacier Morphology on the Mass Balance Variability in High Mountain Asia, J. Geophys. Res.-Earth, 124, 1331–1345, https://doi.org/10.1029/2018JF004838, 2019. a
Chen, F., Zhang, M., Guo, H., Allen, S., Kargel, J. S., Haritashya, U. K., and Watson, C. S.: Annual 30 m dataset for glacial lakes in High Mountain Asia from 2008 to 2017, Earth Syst. Sci. Data, 13, 741–766, https://doi.org/10.5194/essd-13-741-2021, 2021. a, b, c, d, e
Cook, S. J. and Quincey, D. J.: Estimating the volume of Alpine glacial lakes, Earth Surf. Dynam., 3, 559–575, https://doi.org/10.5194/esurf-3-559-2015, 2015. a
Gao, B.-C.: NDWI–A normalized difference water index for remote sensing of vegetation liquid water from space, Remote Sens. Environ., 58, 257–266, https://doi.org/10.1016/S0034-4257(96)00067-3, 1996. a
Gardelle, J., Arnaud, Y., and Berthier, E.: Contrasted evolution of glacial lakes along the Hindu Kush Himalaya mountain range between 1990 and 2009, Global Planet. Change, 75, 47–55, https://doi.org/10.1016/j.gloplacha.2010.10.003, 2011. a
Gardner, A. S., Fahnestock, M. A., and Scambos, T. A.: ITS_LIVE Regional Glacier and Ice Sheet Surface Velocities, National Snow and Ice Data Center [data set], CO, https://doi.org/10.5067/6II6VW8LLWJ7, 2019. a, b
Google Earth Engine: Earth Engine Data Catalog, Google Earth Engine [data set], https://developers.google.com/earth-engine/datasets/catalog, last access: 1 February 2024. a
Mertes, J. R., Thompson, S. S., Booth, A. D., Gulley, J. D., and Benn, D. I.: A conceptual model of supra-glacial lake formation on debris-covered glaciers based on GPR facies analysis: GPR Facies Analysis of Spillway Lake, Ngozumpa Glacier, Nepal, Earth Surf. Proc. Land., 42, 903–914, https://doi.org/10.1002/esp.4068, 2017. a
Miles, E. S., Willis, I. C., Arnold, N. S., Steiner, J., and Pellicciotti, F.: Spatial, seasonal and interannual variability of supraglacial ponds in the Langtang Valley of Nepal, 1999–2013, J. Glaciol., 63, 88–105, https://doi.org/10.1017/jog.2016.120, 2017. a, b, c, d, e
Miles, E. S., Watson, C. S., Brun, F., Berthier, E., Esteves, M., Quincey, D. J., Miles, K. E., Hubbard, B., and Wagnon, P.: Glacial and geomorphic effects of a supraglacial lake drainage and outburst event, Everest region, Nepal Himalaya, The Cryosphere, 12, 3891–3905, https://doi.org/10.5194/tc-12-3891-2018, 2018. a, b
Miles, E. S., Steiner, J. F., Buri, P., Immerzeel, W. W., and Pellicciotti, F.: Controls on the relative melt rates of debris-covered glacier surfaces, Environ. Res. Lett., 17, 064004, https://doi.org/10.1088/1748-9326/ac6966, 2022. a, b
Miles, K. E., Hubbard, B., Irvine-Fynn, T. D., Miles, E. S., Quincey, D. J., and Rowan, A. V.: Hydrology of debris-covered glaciers in High Mountain Asia, Earth-Sci. Rev., 207, 103212, https://doi.org/10.1016/j.earscirev.2020.103212, 2020. a, b
Mohanty, L. K. and Maiti, S.: Regional morphodynamics of supraglacial lakes in the Everest Himalaya, Sci. Total Environ., 751, 141586, https://doi.org/10.1016/j.scitotenv.2020.141586, 2021. a, b
Naito, N., Nakawo, M., Kadota, T., and Raymond, C. F.: Numerical simulation of recent shrinkage of Khumbu Glacier, Nepal Himalayas, IAHS-AISH Publication Issue 264, 2000, 153–161, 13 September 2000–15 September 2000, Debris-Covered Glaciers, Seattle, WA, USA, 2000. a
Narama, C., Daiyrov, M., Tadono, T., Yamamoto, M., Kääb, A., Morita, R., and Ukita, J.: Seasonal drainage of supraglacial lakes on debris-covered glaciers in the Tien Shan Mountains, Central Asia, Geomorphology, 286, 133–142, https://doi.org/10.1016/j.geomorph.2017.03.002, 2017. a, b, c, d
Perry, L. B., Matthews, T., Guy, H., Koch, I., Khadka, A., Elmore, A. C., Shrestha, D., Tuladhar, S., Baidya, S. K., Maharjan, S., Wagnon, P., Aryal, D., Seimon, A., Gajurel, A., and Mayewski, P. A.: Precipitation Characteristics and Moisture Source Regions on Mt. Everest in the Khumbu, Nepal, One Earth, 3, 594–607, https://doi.org/10.1016/j.oneear.2020.10.011, 2020. a
Planet Labs PBC: Planet Application Program Interface: In Space for Life on Earth, Planet, https://api.planet.com (last access: 1 February 2024), 2018. a
Planet Team: PlanetScope Product Specifications, Planet, https://www.planet.com/explorer (last access: 1 February 2024), 2022. a
Racoviteanu, A., Nicholson, L., Glasser, N., Miles, E., Harrison, S., and Reynolds, J.: Debris-covered glacier systems and associated glacial lake outburst flood hazards: challenges and prospects, J. Geol. Soc., 179, jgs2021–084, https://doi.org/10.1144/jgs2021-084, 2022. a
Racoviteanu, A. E., Nicholson, L., and Glasser, N. F.: Surface composition of debris-covered glaciers across the Himalaya using linear spectral unmixing of Landsat 8 OLI imagery, The Cryosphere, 15, 4557–4588, https://doi.org/10.5194/tc-15-4557-2021, 2021. a, b, c, d
Reynolds, J. M.: On the formation of supraglacial lakes on debris-covered glaciers, ISSN 01447815, IAHS-AISH Publication, Issue 264, 2000, 153–161, Debris-Covered Glaciers, 13 September 2000–15 September 2000, Seattle, WA, USA, 2000. a
RGI Consortium: Randolph Glacier Inventory – A Dataset of Global Glacier Outlines, Version 6, Boulder, Colorado USA, NSIDC: National Snow and Ice Data Center [data set], https://doi.org/10.7265/4m1f-gd79, 2017. a
Rounce, D. R., Byers, A. C., Byers, E. A., and McKinney, D. C.: Brief communication: Observations of a glacier outburst flood from Lhotse Glacier, Everest area, Nepal, The Cryosphere, 11, 443–449, https://doi.org/10.5194/tc-11-443-2017, 2017. a, b, c, d
Rounce, D. R., Hock, R., McNabb, R. W., Millan, R., Sommer, C., Braun, M. H., Malz, P., Maussion, F., Mouginot, J., Seehaus, T. C., and Shean, D. E.: Distributed Global Debris Thickness Estimates Reveal Debris Significantly Impacts Glacier Mass Balance, Geophys. Res. Lett., 48, e2020GL091311, https://doi.org/10.1029/2020GL091311, 2021. a, b, c
Shugar, D. H., Burr, A., Haritashya, U. K., Kargel, J. S., Watson, C. S., Kennedy, M. C., Bevington, A. R., Betts, R. A., Harrison, S., and Strattman, K.: Rapid worldwide growth of glacial lakes since 1990, Nat. Clim. Change, 10, 939–945, https://doi.org/10.1038/s41558-020-0855-4, 2020. a, b, c, d, e
Steiner, J. F., Buri, P., Miles, E. S., Ragettli, S., and Pellicciotti, F.: Supraglacial ice cliffs and ponds on debris-covered glaciers: spatio-temporal distribution and characteristics, J. Glaciol., 65, 617–632, https://doi.org/10.1017/jog.2019.40, 2019. a, b, c
Taylor, C. J., Carr, J. R., and Rounce, D. R.: Spatiotemporal supraglacial pond and ice cliff changes in the Bhutan–Tibet border region from 2016 to 2018, J. Glaciol., 68, 101–113, https://doi.org/10.1017/jog.2021.76, 2022. a
Wang, X., Guo, X., Yang, C., Liu, Q., Wei, J., Zhang, Y., Liu, S., Zhang, Y., Jiang, Z., and Tang, Z.: Glacial lake inventory of high-mountain Asia in 1990 and 2018 derived from Landsat images, Earth Syst. Sci. Data, 12, 2169–2182, https://doi.org/10.5194/essd-12-2169-2020, 2020. a, b, c, d, e
Watanabe, T., Lamsal, D., and Ives, J. D.: Evaluating the growth characteristics of a glacial lake and its degree of danger of outburst flooding: Imja Glacier, Khumbu Himal, Nepal, Norsk Geogr. Tidsskr., 63, 255–267, https://doi.org/10.1080/00291950903368367, 2009. a, b, c
Watson, C. S., Quincey, D. J., Carrivick, J. L., and Smith, M. W.: The dynamics of supraglacial ponds in the Everest region, central Himalaya, Global Planet. Change, 142, 14–27, https://doi.org/10.1016/j.gloplacha.2016.04.008, 2016. a, b, c, d, e, f, g, h, i
Watson, C. S., King, O., Miles, E. S., and Quincey, D. J.: Optimising NDWI supraglacial pond classification on Himalayan debris-covered glaciers, Remote Sens. Environ., 217, 414–425, https://doi.org/10.1016/j.rse.2018.08.020, 2018a. a, b
Watson, C. S., Quincey, D. J., Carrivick, J. L., Smith, M. W., Rowan, A. V., and Richardson, R.: Heterogeneous water storage and thermal regime of supraglacial ponds on debris-covered glaciers: Water storage and thermal regime of supraglacial ponds, Earth Surf. Proc. Land., 43, 229–241, https://doi.org/10.1002/esp.4236, 2018b. a, b, c, d, e, f
Wendleder, A., Schmitt, A., Erbertseder, T., D'Angelo, P., Mayer, C., and Braun, M. H.: Seasonal Evolution of Supraglacial Lakes on Baltoro Glacier From 2016 to 2020, Front. Earth Sci., 9, 725394, https://doi.org/10.3389/feart.2021.725394, 2021. a, b, c, d
Xu, H.: Modification of normalised difference water index (NDWI) to enhance open water features in remotely sensed imagery, Int. J. Remote Sens., 27, 3025–3033, https://doi.org/10.1080/01431160600589179, 2006. a
Zeller, L., McGrath, D., McCoy, S. W., and Jacquet, J.: Derived products and analytical scripts for “Seasonal to decadal dynamics of supraglacial lakes on debris-covered glaciers in the Khumbu Region, Nepal”, Zenodo [data set], https://doi.org/10.5281/zenodo.10463250, 2024. a