the Creative Commons Attribution 4.0 License.
the Creative Commons Attribution 4.0 License.
Extending the Center for Western Weather and Water Extremes (CW3E) atmospheric river scale to the polar regions
F. Martin Ralph
Brian Kawzenuk
Minghua Zheng
Irina V. Gorodetskaya
Penny M. Rowe
David H. Bromwich
Atmospheric rivers (ARs) are the primary mechanism for transporting water vapor from low latitudes to polar regions, playing a significant role in extreme weather in both the Arctic and Antarctica. With the rapidly growing interest in polar ARs during the past decade, it is imperative to establish an objective framework quantifying the strength and impact of these ARs for both scientific research and practical applications. The AR scale introduced by Ralph et al. (2019) ranks ARs based on the duration of AR conditions and the intensity of integrated water vapor transport (IVT). However, the thresholds of IVT used to rank ARs are selected based on the IVT climatology at middle latitudes. These thresholds are insufficient for polar regions due to the substantially lower temperature and moisture content. In this study, we analyze the IVT climatology in polar regions, focusing on the coasts of Antarctica and Greenland. Then we introduce an extended version of the AR scale tuned to polar regions by adding lower IVT thresholds of 100, 150, and 200 kg m−1 s−1 to the standard AR scale, which starts at 250 kg m−1 s−1. The polar AR scale is utilized to examine AR frequency, seasonality, trends, and associated precipitation and surface melt over Antarctica and Greenland. Our results show that the polar AR scale better characterizes the strength and impacts of ARs in the Antarctic and Arctic regions than the original AR scale and has the potential to enhance communication across observational, research, and forecasting communities in polar regions.
- Article
(13888 KB) - Full-text XML
-
Supplement
(1479 KB) - BibTeX
- EndNote
An atmospheric river (AR) is a “long, narrow, and transient corridor of strong horizontal water vapor transport in the lower troposphere” (Ralph et al., 2018), and it is usually associated with a low-level jet ahead of the cold front of an extratropical cyclone. ARs are the main mechanism for transporting water vapor from the tropics and subtropics to the middle and high latitudes (Zhu and Newell, 1998; Ralph et al., 2004; Newmann et al., 2012). At the same time, ARs play a critical role in regional precipitation and flooding in coastal regions worldwide, including the United States (Guan et al., 2010; Dettinger, 2011; Ralph et al., 2013; Debbage et al., 2017; DeFlorio et al., 2024), Europe (Lavers and Villarini, 2013; Ionita et al., 2020), Aotearoa / New Zealand, (Shu et al., 2021; Prince et al., 2021), and South America (Viale et al., 2018). ARs also contribute to other extreme weather events. They are directly linked to extreme winds over most coastal regions in the world (Waliser and Guan, 2017). ARs are closely associated with extratropical cyclones, and antecedent AR conditions can provide extra water vapor inflow to significantly enhance diabatic heating and intensify cyclone deepening, especially for explosive extratropical cyclones (Zhang and Ralph, 2021; Zhang et al., 2019; Eiras-Barca et al., 2018).
Recent studies have found that ARs have large impacts on regional climate and extreme weather events in polar regions and exert an important influence on the polar cryosphere. As a prominent supplier of moisture and heat, ARs often couple with low-level jets, having the potential to induce intense snow accumulation over the ice sheets (Gorodetskaya et al., 2014; Adusumilli et al., 2021; Wille et al., 2024a, b); extreme hot spells and heat waves (Bonne et al., 2015; González-Herrero et al., 2022; Gorodetskaya et al., 2023; Wille et al., 2024a, b); extensive surface melting through foehn warming, cloud radiative impacts, or rain-on-snow processes (Bozkurt et al., 2018; Gorodetskaya et al., 2023; Zou et al., 2023; Mattingly et al., 2020, 2023); and sea ice decline (Zhang et al., 2023; Liang et al., 2023; Francis et al., 2020; Li et al., 2024) in both Antarctica and the Arctic. These impacts may be enhanced under climate change. In regions characterized by intricate topography, like the Antarctic Peninsula, ARs may strike the mountain range, leading to substantial rainfall and snowfall on the upwind side owing to orographic lifting (Gorodetskaya et al., 2023). Meanwhile, foehn warming on the leeward side can intensify surface melting and downslope winds, contributing to ice shelf and sea ice weakening and potential disintegration (Bozkurt et al., 2018; Wille et al., 2022; Zou et al., 2023).
In polar areas, ARs can also compound other weather systems, making an interconnected and multi-scale impact on extreme weather events. For instance, in March 2022, tropical-convection-induced Rossby wave activities led to an extraordinary AR intrusion into the East Antarctic ice sheet, with an amplified warm conveyor belt along the coastline due to abundant latent heat release from additional moisture (Wille et al., 2024a). Consequently, the intensified coupled low-pressure and blocking high system strengthened the AR's force and its elongated characteristics, enabling robust moisture penetration deeper inland and exerting a widespread influence on the ice surface (Wille et al., 2024b). During 16–18 March, this AR had a maximum vertically integrated water vapor transport (IVT) that exceeded 1000 kg m−1 s−1 offshore before hitting the East Antarctic coast with over 1000 % of normal water vapor transport (measured as time-integrated IVT, T-IVT) penetrating into the inland area of the East Antarctica (Fig. 1a). The 3 d T-IVT is approximately 210 % of the previous maximum over this region since 1981 (Fig. 1b). In addition to extreme precipitation, this extraordinary AR caused a record-breaking heat wave. The peak of this heat wave had a temperature soaring 37 °C beyond the climatological average based on ERA5 reanalysis data and 43 °C above the climatological mean temperature in March as observed at Dome C station (Fig. 1c and d). The AR brought around 300 Gt of precipitation over the ice sheet (according to a polar-oriented regional climate model simulation and two reanalysis datasets), including more than 2 Gt of rainfall along the coast (Wille et al., 2024b). Under a warming climate, extreme ARs are expected to increase in both frequency and intensity at middle latitudes (e.g., Warner et al., 2015; Warner and Mass, 2017; Payne et al., 2020; Shields et al., 2023). These results have implied that the impacts of ARs on polar regions, which are known to be vulnerable to climate change, could be enhanced in a warmer climate.
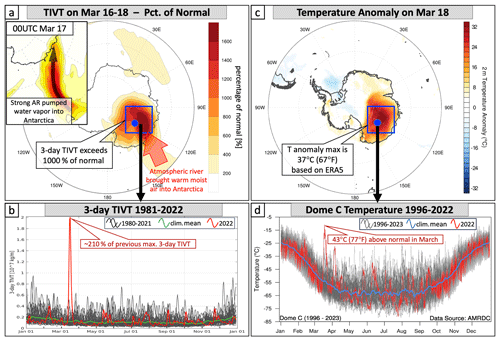
Figure 1An extreme landfalling AR over East Antarctica during 16–18 March 2022 based on ERA5 reanalysis. (a) The 3 d time-integrated IVT (T-IVT) during 16–18 March 2022 as a percentage of normal (mean 3 d T-IVT during 1980–2021); the sub-panel at the top left shows the IVT (colors start from 200 kg m−1 s−1 with an increment of 100 kg m−1 s−1) at 00:00 UTC on 17 March. (b) Time series of averaged 3 d T-IVT within the blue box in panel (a) for 2022 (red), 1980–2021 (black), and the climatological mean (1980–2021, green). (c) Temperature anomaly on 18 March 2022 based on ERA5 reanalysis. (d) Time series of 3-hourly observed temperatures at Dome C station (blue dot in panel a and c) for 2022 (red), 1996–2021 and 2023 (gray), and the climatological mean (1996–2023 mean, blue).
Recent studies have made important progress in tracking ARs using polar-specific algorithms (Wille et al., 2019, 2021; Gorodetskaya et al., 2014, 2020; Viceto et al., 2022; Mattingly et al., 2023) and global algorithms (Guan and Waliser, 2019; Rutz et al., 2019; Guan et al., 2023). These polar AR algorithms identify ARs as objects in space with AR features using flexible thresholds (e.g., using different percentiles of IVT, using meridional IVT or water vapor content to identify ARs). For example, Guan and Waliser (2019) used 85th–95th percentiles (with an increment of 2.5 in the percentile) and 100 kg m−1 s−1 as the IVT minimum thresholds to better capture ARs that are less well-structured. However, Ralph et al. (2019) suggested that it is also useful to identify ARs from an Eulerian perspective (defining an AR as a sequence of relevant meteorological conditions at a specific location of interest), especially for many practical, on-the-ground applications and communications across research, forecasts, and public media reports. With the increasing interest in ARs in both the Arctic and Antarctica, it is imperative to establish an objective and consistent framework for quantifying their strength and impacts, which is usually determined by both the intensity and duration of the AR event. Ralph et al. (2019) introduced an AR scale (hereafter the Ralph 2019 AR Scale) to characterize their strength and impacts based on the duration of the AR condition (defined as IVT >250 kg m−1 s−1) and the maximum IVT during the AR at a specific location from an Eulerian perspective. The Ralph 2019 AR Scale has been widely used in scientific research, weather forecasts, and media reports. However, this scale was primarily developed based on the climatology of IVT at middle latitudes. The standard scale can miss ARs in polar regions that have a profound effect but nevertheless fail to meet the minimum IVT threshold of 250 kg m−1 s−1 due to the extremely low temperature and thus moisture content characterizing polar regions. For example, Fig. 2a–b show a well-defined landfalling AR and the corresponding precipitation at the Ross Ice Shelf on 3 December 2022, and Fig. 2c–d show a landfalling AR at northeastern Greenland with a maximum precipitation rate over 10 mm per 6 h on 15 November 2021. However, both cases are not identified as ARs at the coast according to the Ralph 2019 AR Scale due to low IVT: in the first case the duration of time when the IVT exceeds 250 kg m−1 s−1 is shorter than 24 h, and in the second case the IVT never meets the minimum threshold for AR conditions at the coasts. Obviously, the Ralph 2019 AR Scale developed based on the climatology of IVT at middle latitudes is insufficient for polar regions.
This study aims to introduce an extended AR scale for polar regions based on the Ralph 2019 AR Scale and examine the characteristics of polar ARs by utilizing the extended scale. We first examine the climatology of IVT in polar regions with a focus on the Antarctic and Greenland coastlines. Based on the IVT climatology and many AR cases in polar regions, we introduce an extended version of the AR scale tuned to polar regions. Additional IVT thresholds for defining AR conditions are included to capture low-IVT ARs in both the Arctic and Antarctic. The extended AR scale is then used to examine AR frequency, seasonality, historical trends, and associated impacts (precipitation and surface melt) in the Antarctic and Greenland coastal regions. Finally, the AR scale forecast products for the Antarctic coast developed by the Center for Western Weather and Water Extremes (CW3E) and their application are introduced.
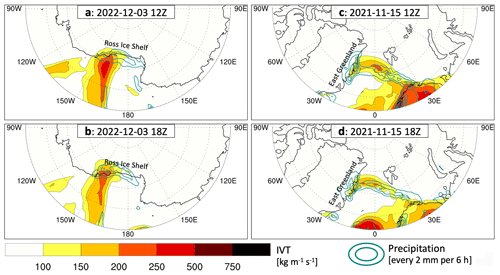
Figure 2A landfalling AR near the Ross Ice Shelf in Antarctica at 12:00 UTC (a) and 18:00 UTC (b) on 3 December 2022. The colors are IVT (kg m−1 s−1), and the cyan contours show the 6 h precipitation amount (every 2 mm) based on ERA5. Panels (c) and (d) are the same as (a) and (b) but for a landfalling AR case over the East Greenland coast at 12:00 and 18:00 Z on 15 November 2021.
2.1 Data
The IVT and precipitation data used in this study are from the fifth-generation reanalysis dataset from the European Centre for Medium-Range Weather Forecasts (ERA5; Hersbach et al., 2020). The ERA5 data were obtained on a regular latitude–longitude grid with a spatial resolution of 1.0° × 1.0° and a 6-hourly temporal resolution from January 1979 to December 2022. The ERA5 IVT was vertically integrated from the surface to the atmosphere top in the reanalysis model. In this study, a common resolution of 1.0° × 1.0° was used since ARs are relatively large objects, which are usually a few hundred to a couple thousand kilometers in size. A sensitivity test using a 0.25° IVT did not show significant impacts on the climatological mean AR frequency, historical trend, or seasonality compared to the 1° IVT in this study.
The 3-hourly automatic weather station (AWS) observations at Dome C station (Antarctic Meteorological Research and Data Center, 2022) served as a valuable illustration of the March 2022 heat wave in East Antarctica triggered by an AR (Fig. 1d). The dataset, spanning from 1996 to 2022, has undergone quality control and is archived at the Antarctic Meteorological Research and Data Center (AMRDC).
The daily surface melt data from 1980 to 2020 were retrieved from passive microwave radiometer data from the Scanning Multichannel Microwave Radiometer (SMMR) and the Special Sensor Microwave/Imager (SSM/I), as documented in previous studies by Torinesi et al. (2003) and Picard and Fily (2006). In Antarctica, this surface melt dataset does not include the area higher than 1700 m of altitude, where melting is unlikely. Similar SMMR and SSM/I data and methods were used to examine the surface melt over the Greenland ice sheet (Colosio et al., 2021). The data were obtained at a 25 km spatial resolution and were interpolated to the same 1.0° × 1.0° latitude–longitude grid as the ERA5 data using a nearest-neighbor interpolation. When the melt data value is 0, it indicates a no-melt day; when the value is 1, it indicates a melt day. The missing data are labeled with −10. Thus, the surface melt data used in this study only include the melt frequency (melt or not).
2.2 Climatology of IVT in polar regions
As a first step in developing an appropriate extended AR scale for polar regions, we examine the variations in climatological mean IVT between polar regions and low to middle latitudes. In general, the climatological mean IVT, calculated over the investigated period from 1979 to 2022, is notably lower along the Antarctic and Greenland coasts compared to the IVT at the middle latitudes (Fig. 3). In the Southern Hemisphere (Fig. 3a), the mean IVT typically exceeds 100 kg m−1 s−1 at the middle latitudes, with a maximum (>250 kg m−1 s−1) over the central South Atlantic Ocean and Indian Ocean, respectively. However, there is a rapid decrease in IVT as the latitude increases (Fig. 3a). Along the Antarctic coast, the mean IVT is around only 25 kg m−1 s−1 and falls below 25 kg m−1 s−1 over most of the interior due to the extremely low temperature and moisture. Meanwhile, the Northern Hemisphere exhibits a peak in mean IVT over the North Atlantic Ocean and another maximum (>250 kg m−1 s−1) over the North Pacific Ocean, aligning with the locations of storm tracks in the two ocean basins (Fig. 3b). Along the Greenland coast, the mean IVT ranges from 25 to 50 kg m−1 s−1 (Fig. 3b). The substantial difference in IVT between polar regions and middle latitudes suggests that the IVT minimum threshold based on midlatitude IVT in the Ralph 2019 AR Scale is insufficient for polar regions.
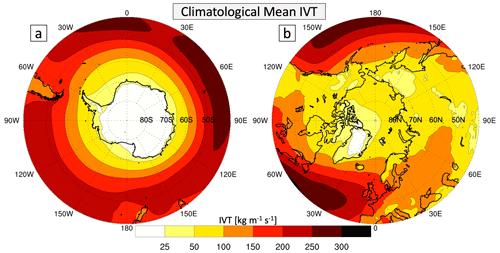
Figure 3Climatological mean IVT (kg m−1 s−1) over the middle and high latitudes of the Southern Hemisphere (a) and Northern Hemisphere (b) in 1979–2022 based on the ERA5 reanalysis data.
To further understand the climatology of IVT along the Antarctic and Greenland coasts, the IVT frequency distribution was calculated (Fig. 4) using 6-hourly IVT values along the Antarctic (including Antarctic ice shelves) and Greenland coastlines (bold black line in Fig. 4b and c) from 44 years of ERA5 data (1979–2022; Fig. 4a). For the Antarctic and Greenland coasts 77 % and 79 % of the IVT values, respectively, are concentrated in bins lower than 50 kg m−1 s−1, with only 7.4 % and 6.6 % of IVT values higher than 100 kg m−1 s−1. The percentages of IVT samples decrease with the thresholds (100, 150, 200, and 250 kg m−1 s−1) quickly and only 0.3 % and 0.4 % of IVT exceed 250 kg m−1 s−1 (sub-panel at the top right of Fig. 4a). The variability of the percentages for each bin (vertical bars) is larger along the Greenland coast than along the Antarctic coast, indicating that the water vapor transport around Greenland has a larger variability, which might be related to the variability of the North Atlantic storm track.
Because this study focuses on polar ARs, the southern part of Greenland with latitude south of the polar circle (∼ 67° N) was excluded from our analysis, including the calculation of IVT distribution (Fig. 4c). This narrow part, including 15 % of the coastal grids, extends to 60° N and is surrounded by a relatively warm ocean, so the temperature, moisture, and therefore the IVT are significantly higher than the coast within the polar circle. Excluding this region has a small impact on the IVT distribution; the percentage of IVT samples higher than 100 kg m−1 s−1 would increase from 6.6 % to 8.9 % if it was included. Similar analysis and results for the entire Greenland ice sheet are given in the Supplement (Figs. S1 and S2). It is worth noting that the northern tip of the Antarctic Peninsula also extends northward beyond the polar circle (∼ 67° S). However, the coastal grids out of the polar circle are only 3 % of the total coastal grids of Antarctica. Therefore, those grids are not excluded since their impact on the results is negligible.
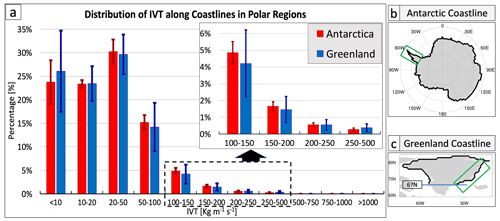
Figure 4(a) Averaged distribution of IVT values based on 6-hourly samples along the coastlines of Antarctica and Greenland in polar regions from 1979 to 2022 using ERA5 reanalysis data. The vertical bars denote the spread (1 standard deviation) of the frequency over the 44 years. Panels (b) and (c) depict the coastlines of Antarctica and Greenland in polar regions (thick black lines), respectively. The green boxes in (b) and (c) highlight the coastlines of the Antarctic Peninsula and East Greenland used for the analysis of the AR frequency trend in Fig. 13.
2.3 Extended AR scale for polar regions
In addition to the analysis of IVT climatology along the Antarctic and Greenland coast, we also examined many AR cases in the polar regions, such as the two AR cases in Fig. 2. Based on the IVT climatology and the polar AR case studies, 100 kg m−1 s−1 is selected as the IVT minimum threshold to define AR conditions for both polar regions. This new threshold is roughly the 93rd percentile of the IVT values along both the Antarctic and Greenland coasts. In addition, 150 and 200 kg m−1 s−1 are also selected as the thresholds for the AR scales in polar regions based on the IVT distribution in Fig. 4.
Therefore, we extend the Ralph 2019 AR Scale to include three additional ranks specifically for polar regions as shown in Fig. 5. The extended minimum IVT thresholds are as follows: 100 kg m−1 s−1 for AR Polar 1 (AR P1), 150 kg m−1 s−1 for AR P2, and 200 kg m−1 s−1 for AR P3. Meanwhile, the thresholds for the other ranks (AR1–AR5) remain the same as the Ralph 2019 AR Scale. Following the Ralph 2019 AR Scale, the extended version of the AR scale is also defined based on an Eulerian perspective. In other words, the AR scale is defined for a specific location, so an AR event is a sequence of high-moisture-transport conditions, which are closely associated with different meteorological conditions, such as the precipitation amount and rate (e.g., Ralph et al., 2013; Martin et al., 2018). The AR scale of an event is based on its duration and maximum intensity of IVT at a given location. For a given location, the duration of an AR matters since, with the same IVT, when an AR lasts for a longer time, it has a higher impact (e.g., more precipitation), and vice versa. Two duration thresholds, 24 and 48 h, are used to adjust the rank of an AR. In the polar AR scale, they are the same as the Ralph 2019 AR Scale because the difference in AR durations is substantially smaller than the difference in IVT magnitude between polar regions and the middle latitudes. Following the Ralph 2019 AR Scale, “weak” polar ARs (maximum IVT >100 kg m−1 s−1 and <150 kg m−1 s−1, but with a duration <24 h) will not receive a ranking on the polar AR scale, as represented by the gray part in Fig. 5. A lower duration threshold (e.g., 12 h) is not added since it may introduce many weak IVT cases that are not real ARs. To determine the AR scale, there are four steps as described below.
-
Step 1: pick a location of interest.
-
Step 2: identify the time when IVT exceeds 100 kg m−1 s−1 at that location. The period when IVT continuously exceeds 100 kg m−1 s−1 is defined as the duration of an AR event.
-
Step 3: identify the maximum IVT during the AR event at that location, and then use the chart (y axis) in Fig. 5 to initially assign a preliminary AR scale based on maximum IVT.
-
Step 4: adjust the rank based on the duration to determine the final AR scale: (1) if the AR duration exceeds 48 h, promote the scale by 1 rank; (2) if the AR duration is less than 24 h, demote the scale by 1 rank.
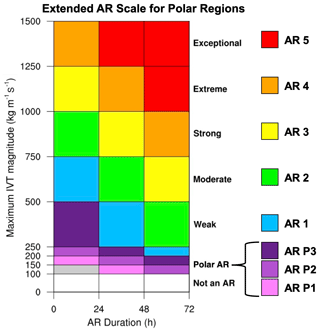
Figure 5An extended AR scale for polar regions that categorizes AR events based on the duration of AR conditions (IVT ≥100 kg m−1 s−1) and the maximum IVT in the duration at a specific location. This scale includes ranks (AR P1, AR P2, and AR P3) designed specifically for ARs in polar regions.
In Fig. 6, a landfalling AR over Antarctica in early December 2022 (same AR case as shown in Fig. 2a and b) is used as an illustrative example for determining the AR scale in the polar regions. Figure 6a–c show three snapshots of IVT and precipitation for this case from 00:00 UTC on 3 December 2022 to 00:00 UTC on 4 December 2022. The landfall of this AR occurred mainly along the coast between 140–170° W, with a peak IVT of 212 kg m−1 s−1 at 150° W. To determine the AR scale, we begin by selecting a location, such as a dot at 150° W on the coastline (dot with a black arrow in Fig. 6d). From the time series of IVT at that location, identify the time with AR conditions (IVT >100 kg m−1 s−1), which is 30 h (depicted in purple in Fig. 6e). Subsequently, find the maximum IVT during this AR event at that location (212 kg m−1 s−1), which indicates that the preliminary AR scale is AR P3 according to the chart in Fig. 5. Finally, there is no adjustment of the preliminary rank since the duration is 30 h (between 24–48 h). Therefore, the final AR scale of this event at 150° W on the coastline is determined to be AR P3. Figure 6d shows an example of the maximum AR scale during 2–8 December 2022 along the Antarctic coast, with small dots denoting locations along the coastline. Different colors of the dots along the coast represent various AR scales or the absence of an AR (white) at the respective locations.
The extended AR scale for polar regions proves effective in capturing both weak and strong AR events. For example, the Greenland AR case in Fig. 2c and d is classified as AR P2 and the extreme AR case over East Antarctica in Fig. 1 is categorized as AR4, employing the same procedure as described earlier. Additionally, Fig. S3 in the Supplement provides another example of an AR4 (case in Fig. 1), illustrating the application of the polar AR scale.
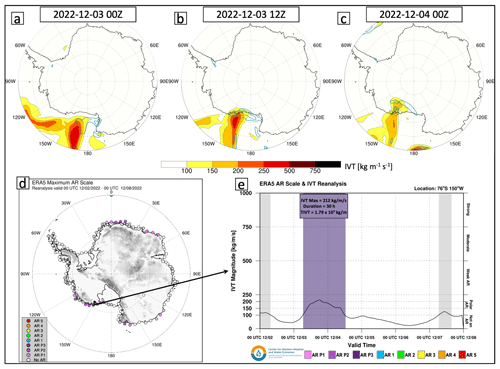
Figure 6Panels (a)-(c) show three snapshots of a landfalling AR over Antarctica on 3–4 December 2022; the colors are IVT (kg m−1 s−1), and the contours are the 6 h precipitation amount (every 2 mm) from the ERA5 reanalysis at 00:00 and 12:00 UTC on 3 December 2022 and 00:00 UTC on 4 December 2022, respectively. Panel (d) shows the maximum AR scale along the coastline of Antarctica during 2–8 December 2022. Panel (e) shows the time series of IVT at the AR landfalling location (76° S, 150° W) and the corresponding AR scale.
3.1 Frequency of polar ARs
Using the extended AR scale for polar regions, we examine the climatology of the polar ARs along the coastlines of Antarctica and Greenland. The frequency of AR P1 is around four events per year per location along most of the East Antarctic coast (e.g., the coasts of Enderby Land, Queen Mary Land, and George V Land), and the frequency decreases rapidly towards the inland area (Fig. 7a), which is mainly due to the extremely low temperature and thus low moisture over the interior of Antarctica. The frequency of AR P1 is slightly higher over the West Antarctic coast, and the AR P1 events penetrate more inland over the Ross Ice Shelf and Ronne Ice Shelf compared to the other regions in Antarctica (Fig. 7a). It is easier for the warm and moist air to penetrate those ice shelves in West Antarctica as the elevation there is relatively low (e.g., over the Ross Ice Shelf; Nicolas and Bromwich, 2011). The frequency of AR P1 at the Antarctic Peninsula (5–10 ARs per year per location) is the highest along the Antarctic coast since the peninsula extends into the ocean at a relatively lower latitude with more moisture and propagating ARs. The frequency of ARs decreases with higher AR scales (Fig. 7). The frequency of AR P2 and AR P3 exhibits a spatial pattern similar to that of AR P1, although at a lower frequency. There are only one to two AR1 events (Fig. 7d) and fewer than one AR2 event (Fig. 7e) per year per location over most of the Antarctic coast. Due to the high IVT threshold, only one AR4 (the AR case in March 2022 shown in Figs. 1 and S3) and no AR5 cases were identified during 1979–2022 in Antarctica based on 6-hourly and 1° ERA5 IVT.
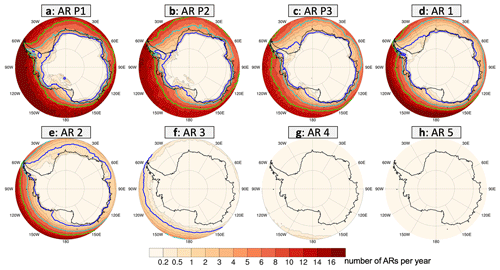
Figure 7Averaged AR frequency (number of events per year per location; colors) over the south polar region in 1979–2022 based on ERA5 according to the new polar AR scale: (a) AR P1, (b) AR P2, (c) AR P3, (d) AR1, (e) AR2, (f) AR3, (g) AR4, and (h) AR5. The blue, cyan, and green contours are the frequencies of 1, 5, and 10 ARs per year, respectively.
The AR scale frequency over the Arctic (Fig. 8) is generally higher compared to Antarctica. ARs intruding into the Arctic mainly originate from the North Atlantic Ocean, making their way through the Atlantic gateway to the Arctic (the gap between Greenland and northern Europe). As a result, the AR frequency reaches its peak within that gap, amounting to approximately 12 ARs per year per location for AR P1 and P2, around 10 ARs for AR P3, and approximately 12 for AR1 and AR2 within the polar circle. This is the only wide and open-ocean area along the north polar circle, and extratropical cyclones (usually acting as a dynamical driver of ARs) are very active and relatively strong in this region along the Atlantic storm track. As a result, the ARs over that region usually have a stronger IVT and a longer duration. Therefore, there are more AR1 and AR2 cases than the relatively weaker ARs (e.g., AR P2 and AR P3). A second gap with AR intrusions is over the Bering Strait, where ARs originate from the North Pacific Ocean. However, the AR frequency is considerably lower over that narrow strait compared to the North Atlantic gap. The relatively strong ARs (AR3, AR4, and AR5) are mainly over the ocean, and the frequency decreases rapidly with the higher AR scales, similar to the Antarctic.
In this study, for the Arctic region we focus on the ARs over Greenland as the ice sheet there and its melt are critical components of global climate change (Alley et al., 2005; Dutton et al., 2015). Similar to Antarctica, the AR frequency decreases rapidly from the Greenland coastal area towards the interior. The AR frequency maximum along the Greenland coast is situated from southern Greenland to the southeast coast, characterized by not only relatively high temperature and moisture but also enhanced AR activities associated with the North Atlantic storm track. Over the Greenland interior, the frequency of relatively strong ARs (e.g., AR3 and AR4) is extremely low, and no AR5 is identified.
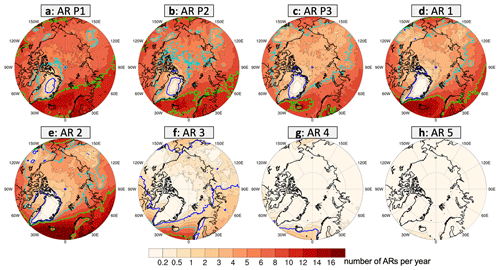
Figure 8Averaged AR frequency (number of events per year per location; colors) over the north polar region in 1979–2022 based on ERA5 according to the new polar AR scale: (a) AR P1, (b) AR P2, (c) AR P3, (d) AR1, (e) AR2, (f) AR3, (g) AR4, and (h) AR5. The blue, cyan, and green contours are the frequencies of 1, 5, and 10 ARs per year, respectively.
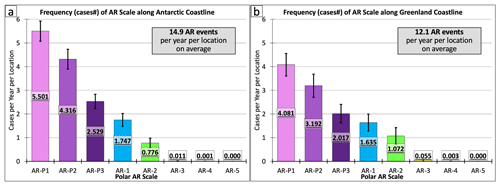
As described above, the ARs are mainly concentrated along the coastal areas of Antarctica and Greenland; thus the AR frequency along these coastlines is further analyzed. Figure 9 shows the distribution of AR scale frequency along the Antarctic and Greenland coastlines. For the Antarctic coast, there are 5.501 AR P1 events per year per location, and the number decreases rapidly from AR P1 to AR5. There are only 1.747 and 0.776 ARs per year per location classified as AR1 and AR2, respectively. The average annual number is only 0.011 events for AR3 and 0.001 for AR4, which suggests that AR3 cases or stronger AR events are rare along the Antarctic coast, although they are common at the middle latitudes, like the US West Coast. Most of these relatively strong ARs are located over the Antarctic Peninsula (Fig. 7). The AR4 landfalling event over East Antarctica in March 2022 is a record-breaking case, as described in Sect. 1. In summary, an average of 14.9 ARs per year per location is identified along the Antarctic coastline.
The distribution of AR frequency along the Greenland coastline is similar to the frequency along the Antarctic coastline, with a rapid decrease from AR P1 to AR5. Although the average annual number of ARs along the Greenland coast (12.1 ARs per year per location) is lower than that along the Antarctic coast, the frequency of relatively stronger ARs (AR2–AR4) is higher along the Greenland coast (Fig. 9b). The AR frequency along the entire Greenland coast (bold black line in Fig. S1c) is also calculated. The average annual number of ARs increases to 17.0 yr−1 per location when including the coast of southern Greenland (latitude >67° N). This increase is attributed to the significantly stronger IVT around the coast outside of the polar circle.
3.2 Seasonality of polar ARs
To understand the seasonal variations in AR frequency in the polar regions, a detailed analysis of the seasonality of AR occurrence along the Antarctic and Greenland coastlines is conducted (Fig. 10). Overall, the AR frequency over the Antarctic coast (Fig. 10a) is low in the cold season, with a minimum in August (3.2 % of the time under AR conditions), and high in the warm season, with a maximum in January (8.9 % of the time under AR conditions). The relatively weak ARs (e.g., AR P1 and AR P2) have a weak seasonality, while the stronger ARs (e.g., AR1 and AR2) have a stronger seasonality. For example, AR P1 frequency has a maximum of 1.6 % in February and a minimum of 0.9 % in September; meanwhile, AR2 has the same maximum of 1.6 % in January but a minimum of only 0.2 % in August. Along the Greenland coast, the AR frequency is also relatively high in the warm season, with a maximum of 16.0 % in July (Fig. 10b). In contrast to the Antarctic coastline, the Greenland coast has a strong seasonality for all AR scales. ARs along the Greenland coast primarily occur during the boreal summer, likely influenced by increased moisture availability during this season and the poleward shift of the North Atlantic storm track in summer.
The seasonality of AR frequency over the Antarctic coast in this study is different from the findings of Wille et al. (2021). Their study indicated a greater AR frequency in June, July, and August (JJA) over Antarctica. This disparity is not unexpected, as our study employs a fixed minimum threshold (100 kg m−1 s−1) for the total IVT, but Wille et al. (2021) defined ARs using the meridional component of IVT (vIVT) and a relatively high threshold of IVT (the 98th percentile), which accounts for the seasonality of vIVT. Their vIVT threshold is higher in summer due to the increased temperature and moisture and lower in winter because of the decreased temperature and moisture. In contrast, the polar AR scale introduced in this paper uses a fixed IVT minimum threshold. As a result, it identifies more ARs in summer due to the higher temperature and moisture, and vice versa in winter.
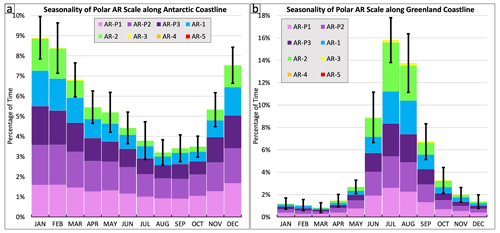
Figure 10Seasonality of AR frequency along the coastline of Antarctica (a) and Greenland (b) according to the new polar AR scale for 1979–2022 based on the ERA5 reanalysis data. Different colors denote the ARs at different scales. Vertical bars represent 1 standard deviation of total AR frequency in each month during 1979–2022.
3.3 Interannual variability of polar ARs
This section focuses on the interannual variabilities of AR frequency along the Antarctic and Greenland coasts. Along the entire Antarctic coast, the interannual variability is minimal, with no significant trend observed in the frequencies of all ARs (Fig. 11a). While the AR frequency along the Greenland coast exhibits a slightly increasing trend, it is not statistically significant (Fig. 11b). As the AR frequency has large regional variability, the interannual variabilities of AR frequency in specific subdomains of Antarctica and Greenland are also examined. The AR frequency along the coast of the Antarctic Peninsula (green box in Fig. 4b) has a larger interannual variability and a statistically significant increasing trend (+0.89 ARs per decade, 90 % confidence interval), especially during the recent decade (Fig. 11c). This aligns with findings from previous studies, which show that there is an increasing trend in AR frequency over West Antarctica (e.g., Maclennan et al., 2023). This increasing trend may be related to the poleward shift of extratropical cyclones (Chang et al., 2012; Yin, 2005). Along with the location and strength of the Amundsen Sea Low, cyclone activities significantly affect regional circulation, thereby impacting AR characteristics in West Antarctica and the Antarctic Peninsula (Coggins and McDonald, 2015; Wille et al., 2021). It might also be related to the decrease in sea ice and thus increased open water offshore, which can enhance the availability and delivery of water vapor in ARs (Kromer and Trusel, 2023).
The increasing trend of AR frequency is also found along the Greenland coast (Fig. 11b), with most of the increase attributed to relatively stronger ARs (AR P2 or stronger ARs). Along the central–northern East Greenland coast (green box in Fig. 4c), it exhibits a statistically significant increasing trend (+1.21 ARs per decade, 95 % confidence interval), and most of the increase in AR frequency comes from relatively stronger ARs (Fig. 11d). Similar to the increasing trend in the Antarctic Peninsula, the increasing trend in the recent decade is the strongest along the coast of East Greenland.
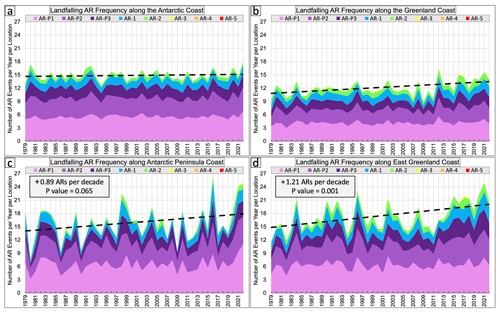
Figure 11(a) The time series of the averaged frequency of landfalling ARs along the Antarctic coastline according to the new polar AR scale in 1979–2022 based on ERA5. Different colors denote the ARs at different scales, and the dashed black line is the linear trend for the frequency of all ARs. Panels (b), (c), and (d) are the same as (a) but for the coastline of Greenland in the polar region, the Antarctic Peninsula (highlighted in the green box in Fig. 4b), and East Greenland (highlighted in the green box in Fig. 4c), respectively. The P values in panels (c) and (d) are calculated from a T test.
4.1 Precipitation and polar ARs
ARs are always closely associated with precipitation. Recent studies have explored the impacts of ARs on precipitation in polar regions (Wille et al., 2021; Maclennan et al., 2022; Box et al., 2023). In this section, the contributions of ARs to the annual precipitation along the Antarctic and Greenland coasts are investigated and categorized based on the AR scale. Following Wille et al. (2021) and Maclennan et al. (2022), precipitation that occurs during an AR event and 24 h after the AR event is classified as AR-related precipitation at a given location.
Along the Antarctic coast, ARs contribute 32.0 % of annual precipitation on average based on ERA5 (Fig. 12a). On average, AR P1 and P2 events each contribute approximately 8.4 % of the annual total precipitation amount, and their contributions decrease with higher AR scales due to their lower frequency of occurrence. AR3 and AR4 events contribute less than 0.1 % of the annual precipitation on average due to their extremely low occurrence frequency. However, if a relatively strong AR (e.g., AR4) event does occur, it usually has a remarkable impact on the precipitation amount. For instance, an AR4 event at a given location along the Antarctic coast can contribute 8.8 % of the annual precipitation there on average (Fig. 12c). The contribution of each AR event is usually proportional to the AR scale, and it decreases from 4.6 % for an AR3 to 1.5 % for an AR P1 (Fig. 12c). There are no data for AR5 along the Antarctic coast because no AR5 case has been identified along the Antarctica coast from 1979 to 2022 based on ERA5.
Along the Greenland coast, the total contribution of ARs to the annual precipitation is 32.2 % (Fig.12b), which is close to the result for Antarctica (32.0 %). However, the contributions to annual precipitation from AR P1–AR2 are comparable, ranging from 5.8 % to 7.1 %. That is because the mean contribution of each AR event increases quickly from 1.7 % for AR P1 to 6.4 % for AR2 (Fig. 12d). This increase compensates for the decrease in AR frequency. While the contribution of each AR event increases to 7.2 % and 7.7 % for AR3 and AR4, the frequencies of these two scales are below 0.1 event per year per location, so their total contribution to the annual precipitation amount is below 1.0 %.
Overall, weak and moderate ARs (AR P1–AR2) are responsible for the majority of the AR-related precipitation amount along the Antarctic and Greenland coasts due to their relatively high frequency. Meanwhile, strong and extreme ARs (e.g., AR3 and AR4) are usually associated with extreme precipitation in these regions, although their frequency is relatively low.
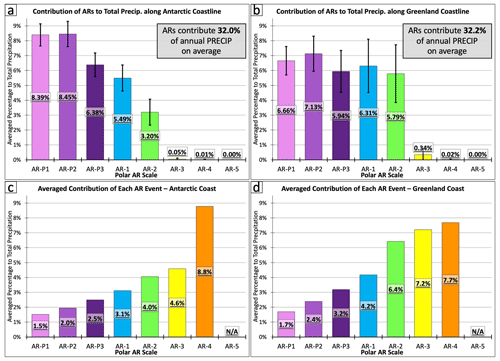
Figure 12Averaged contribution of ARs to the annual precipitation amount along the coastlines of Antarctica (a) and Greenland (b) in 1979–2022 based on the ERA5 precipitation. Panels (c)–(d) are the same as panels (a)–(b) but for the averaged contribution of each AR event in these regions. The vertical bars in panels (a)–(b) denote 1 standard deviation of the annual AR precipitation contribution.
4.2 Surface melt and polar ARs
In addition to precipitation, ARs are also related to surface melt in polar regions (e.g., Mattingly et al., 2018; Wille et al., 2022). Surface melting in polar regions is highly correlated with near-surface air temperature (Trusel et al., 2015). ARs can potentially trigger widespread melting or intense snow accumulation, depending on temperature conditions. This section explores the contribution of ARs to surface melt over Antarctica and Greenland based on the AR scale. Since the melt data are daily, we first identify the AR days at a given location. These AR days are defined as the ones exhibiting AR conditions at any time points (00:00, 06:00, 12:00, or 18:00 UTC) at the given location. Mattingly et al. (2023) found that the surface melt associated with ARs occurs mainly from 24 h before to 48 h after AR in some regions of Greenland, and there is a delay of 18–24 h between AR landfall in northwestern Greenland and maximum foehn-induced melt in northeastern Greenland. Therefore, if the melt occurs on the identified AR days or within 1 d before or 2 d after the AR days, it is classified as AR-related surface melt.
For the Antarctic, Fig. 13a shows the mean number of days with surface melt in austral summer (DJF) from 1980 to 2020. The AR-related surface melt days are categorized based on the extended AR scale (different colors), and the melt days not associated with ARs are labeled in gray. Both the numbers of total melt days and AR-related melt days in Antarctica have a slight decreasing trend but are not statistically significant. Over the Antarctic Peninsula and West Antarctica, where surface melting is most prevalent, there has been a cooling trend since the 1990s and 2000s (Jones et al., 2019; Zhang et al., 2023), which may contribute to the slight decreasing trend of melt days. On average, ARs contribute to 23 % of the surface melt days, with a relatively large interannual variability (Fig. 13c). The percentage of AR-related melt days to total melt days ranges from around 10 % to over 40 %. Meanwhile, AR contributions to surface melt are substantially higher over the coastal region (over 35 % on average) of Antarctica due to the relatively high frequency of ARs there (not shown).
In contrast, over Greenland there is a significant increasing trend in the numbers of both total and AR-related surface melt days (statistically significant at 95 % confidence level) in boreal summer (JJA) during 1980–2020 (Fig. 13b). The AR contribution to the total melt days is 26 % on average over the whole of Greenland, and it is substantially higher over the coastal region. Although the percentage of AR-related surface melt does not have a significant trend over Greenland (Fig. 13d), the more frequent AR conditions (Fig. 11b and d) contribute to the increasing trend of surface melt during the last few decades over Greenland.
Overall, ARs are associated with approximately one-quarter of the surface melt days in summer on average over Antarctica and Greenland and over one-third of the melt days along the coastal regions. There are other factors (e.g., surface temperature) that have large impacts on surface melting. More studies are needed to better understand the details of trends of the melt days and the contribution of ARs.
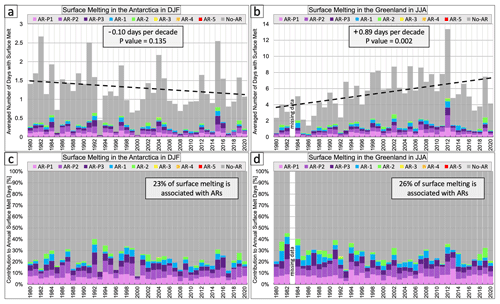
Figure 13(a) Stacked number of days with surface melting over Antarctica in DJF during 1980–2020; gray indicates surface melting not associated with ARs, and the other colors indicate surface melting associated with different AR scales. The dashed line is the linear trend of total melt days. (b) Same as (a) but for Greenland and in JJA. (c) Same as (a) but the y axis is the percentage of surface melting days not associated with ARs (gray) and associated with different AR scales (other colors). (d) Same as (c) but for the coast of Greenland in JJA.
The extended AR scale for polar regions serves as an objective framework to quantify the strength and impact of polar ARs for both scientific research and practical applications. It has already been utilized in forecast products for Antarctica.
Following a highly successful summer campaign, the Year of Polar Prediction in the Southern Hemisphere (YOPP-SH; Bromwich et al., 2024) project initiated targeted observing periods (TOPs), aiming to enhance forecasting skills during non-summer months. The polar AR scale was developed collaboratively during the YOPP-SH winter TOPs, featuring cooperation between CW3E at the Scripps Institution of Oceanography and the Byrd Polar and Climate Research Center at The Ohio State University. Existing AR scale forecast tools were then adapted to the new scale using the Global Ensemble Forecast System (GEFS) to display forecasts of the newly developed polar AR scale along the Antarctic coast (https://cw3e.ucsd.edu/arscale_antarctica/, last access: 10 November 2024). This suite of tools demonstrated reliability in guiding radiosonde launches from 24 stations during TOPs. Moreover, this scale has proven valuable for research on AR-associated extreme weather events (Bromwich et al., 2024), as well as their impacts on the Antarctic ice surface (Wille et al., 2024a, b; Gorodetskaya et al., 2023; Zou et al., 2023). A forecast skill evaluation for AR prediction along the Antarctic coast could be an important follow-up study.
The AR scale ensemble diagnostics tool displays the forecasted timing and probability of ARs making landfall at a given point and the associated polar AR scale ranking for the next 7 d (Fig. 14). This product is available for all locations shown on the map in Fig. 14a; colored dots represent the maximum polar AR scale forecasted over the next 7 d, with the enlarged dot representative of the selected location for the other panels. For the selected location a 7 d forecast of IVT magnitude from each ensemble member as well as the ensemble mean and ±1 standard deviation are displayed in the top left, along with color shading representing the polar AR scale based on the ensemble control member (Fig. 14b). The probability of all polar AR scale rankings as a function of lead time is displayed in the bottom left based on the number of ensemble members forecasting a given ranking at a given lead time (Fig. 14c). Lastly, the timing and magnitude of the polar AR scale are displayed for each ensemble member in the bottom right, with text within each colored bar representing the timing and magnitude of maximum IVT (Fig. 14d). Such detailed insights enable improved situational awareness, contributing to timely preparedness and effective decision-making for high-impact events over polar regions. Currently, the locations (dots) of the CW3E Antarctic AR forecasts (Fig. 14a) are generally located every 5° in longitude along the Antarctic coastline. More locations (such as the Antarctic weather observation stations) will be added according to research interests and application needs. In addition, we will also develop similar AR forecast products for Greenland in the future.
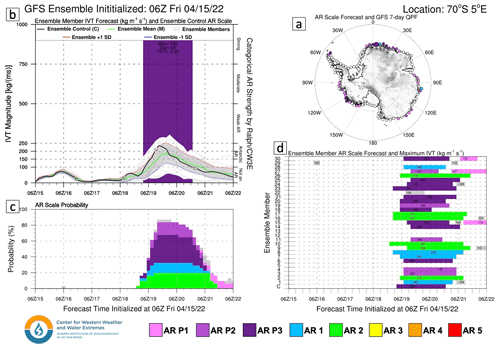
Figure 14CW3E AR scale ensemble diagnostic forecast tool for 70° S, 5° E from the GEFS initialized at 06:00 UTC on 15 April 2022. Dots along the Antarctic coast indicate locations where information such as that shown in other panels can be provided; here other panels refer to the larger point at 70° S, 5° E). (a) Maximum polar AR scale forecast over the next 7 d along the Antarctic coast (colored dots); the enlarged dot represents the location shown in panels (b)–(d). (b) The 7 d forecast of IVT from each ensemble member (thin gray lines), the ensemble mean (green line), the control member (black line), and ±1 standard deviation from the ensemble mean (red and blue lines; gray shading). Color shading represents the timing of the polar AR scale from the control member. (c) Forecasted probability of each polar AR scale ranking as a function of lead time based on the number of ensemble members predicting an AR. (d) Forecasted polar AR scale timing and ranking from each ensemble member; text values represent the maximum IVT magnitude and timing during a forecasted AR.
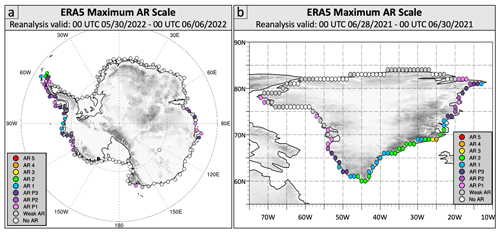
Figure 15(a) Maximum polar AR scale identified along the Antarctic coast during the period 00:00 UTC on 30 May 2022 to 00:00 UTC on 6 June 2022 based on ERA5. (b) Maximum polar AR scale identified along the Greenland coast during the period 00:00 UTC on 28 June 2021 to 00:00 UTC on 30 June 2021 based on ERA5.
Following the AR scale developed by Ralph et al. (2019; Ralph 2019 AR Scale), this study introduces an extended AR scale for the polar regions with a focus on the Antarctic and Greenland coasts. The Ralph 2019 AR Scale was developed based on the IVT climatology at the middle latitudes and is insufficient for the polar regions, where the temperature and moisture are extremely low. Based on the climatology of IVT in polar regions, this study introduces an extended AR scale. This updated scale includes three low IVT minimum thresholds, corresponding to three new ranks, specifically tailored to ARs affecting the polar regions. The scale of an AR event is determined based on its duration (the period when IVT exceeds 100 kg m−1 s−1) and intensity (maximum IVT) at a specific location. Using the extended AR scale, this study investigates the climatology of AR events in polar regions and categorizes them based on their strength. In addition, the impacts of ARs on the precipitation and surface melt are explored. Finally, an AR scale forecast tool developed by CW3E is introduced as an example of the application of the new extended AR scale for polar regions.
Unlike many previous AR detection methods (Wille et al., 2019, 2021; Shields et al., 2018; O'Brien et al., 2020), the extended AR scale framework in this study is designed to objectively quantify the strength and impact of individual AR events from an Eulerian perspective based on IVT for a specific location. Wille et al. (2019, 2021) used vIVT and the 98th percentile as the thresholds to identify ARs in Antarctica since meridional IVT plays a dominant role in water vapor intrusion in Antarctica. Their method can capture more ARs in the Antarctica interior than some regular global AR detection methods that use IVT to identify ARs (Shields et al., 2022). In the polar AR scale introduced in this study, we use IVT rather than vIVT. If only vIVT is used, it may miss many important zonal ARs in Greenland (e.g., the AR case in Fig. 2c and d) and some parts of Antarctica (e.g., landfalling ARs over the Antarctica Peninsula). Meanwhile, different from the previous AR detection methods, which are designed only to detect ARs, the polar AR scale aims to quantify the strength and impact of ARs. Both meridional and zonal IVT can contribute to the strength and impact of ARs. The polar AR scale can also be used together with other AR detection methods, detecting ARs first and then using the polar AR scale to rank those detected ARs at specific locations. Regarding IVT thresholds, the fixed thresholds in the polar AR scale can provide a consistent metric to quantify the strength and impact of ARs in polar regions, not only in the historical and current climate but also in the future climate (e.g., estimating the influence of climate change on polar ARs in different future projections). Overall, the extended AR scale provides an objective and concise description of the strength of AR events at the locations of interest, aiming to enhance communications across observation, research, and forecasts for polar regions.
This study explores the impacts of ARs on precipitation and surface melt over Antarctica and Greenland based on the extended AR scale. ARs contribute over 30 % of the annual precipitation amount along the coasts on average. The majority of the AR-related precipitation amount is from relatively weak and moderate ARs (AR P1–AR2), while strong and extreme ARs (e.g., AR3 and AR4) are usually associated with extreme precipitation. During summer, ARs are associated with 23 % and 26 % of the surface melt over Antarctica and Greenland, respectively, and over one-third of the surface melt along the coastal regions. More research is needed to further investigate the details regarding the impacts of ARs in polar regions, like the AR contributions to rainfall and snow in polar regions, the mechanism underlying the impacts of ARs on surface melt, the lift mechanism of an air mass in AR-related precipitation, and the interactions between ARs and other weather systems. Many previous studies have investigated those topics (Wille et al., 2019, 2021; Gorodetskaya et al., 2023; Zou et al., 2023; Baiman et al., 2023; Zhang et al., 2023; Mattingly et al., 2018, 2023), but including an objective description of AR strength (the polar AR scale) can improve the understanding of ARs' impacts on polar regions. For example, precipitation is usually determined by the water vapor transport (IVT) and the lift of the air mass (so condensation). The polar AR scale can objectively quantify the water vapor transport during an AR event in addition to the occurrence of AR. Meanwhile, it is worth noting that the lift mechanism that may be related to some dynamic weather systems (e.g., warm conveyor belts of extratropical cyclones) or topography (topographic lifting) could also have a great impact on precipitation.
As described in Sect. 5, the extended AR scale for polar regions has already been used in the CW3E polar AR scale forecast tools, which were intensively used in the YOPP-SH winter TOPs. The extended AR scale successfully identifies polar AR conditions that would have been missed by the standard AR scale (e.g., AR P1–AR P3 in Fig. 15). For instance, a landfalling AR was ranked as AR P3 over the East Antarctic coast (Fig. 15a) and passed over the region around Davis Station on 3–4 June 2022 during the YOPP-SH winter TOPs (Bromwich et al., 2024). Another illustrative example is an extreme AR influencing Greenland during 28–30 June 2021 (Fig. 15b). In addition to the main landfalling area ranked as AR1–AR4, the extended AR scale captures the AR traveling from the southwest to the east of Greenland over the 3 d. The main goal of this extended AR scale for polar regions is to enhance communication across observation, research, and forecast communities in polar regions. The polar AR scale, along with the newly developed forecast tool at CW3E, has great potential to enhance situational awareness, contributing to timely preparedness and effective decision-making for high-impact events over the polar regions, which are acknowledged to be vulnerable to a changing climate.
The ERA5 data can be accessed at https://doi.org/10.24381/cds.143582cf (Hersbach et al., 2017). The 3-hourly automatic weather station observations at Dome C station can be accessed at https://doi.org/10.48567/x7a9-cx26 (Antarctic Meteorological Research and Data Center, 2022). The daily surface melt data retrieved from SMMR and SSM/I were downloaded from Ghislain Picard's website at https://snow.univ-grenoble-alpes.fr/melting/ (last access: 10 November 2024; Torinesi et al., 2003; Picard and Fily, 2006).
The supplement related to this article is available online at: https://doi.org/10.5194/tc-18-5239-2024-supplement.
ZZ conducted the analysis of AR scale, IVT, precipitation, and surface melt. XZ analyzed the temperature data for the extreme AR case in March 2022. MZ performed the analysis for the interannual variability and historical trend of ARs. BK developed the AR scale forecast tool. IVG and PMR contributed to the result interpretation for polar regions. FMR and DHB contributed to the conceptualization of the polar AR scale. ZZ prepared the manuscript with contributions from all co-authors.
The contact author has declared that none of the authors has any competing interests.
Publisher’s note: Copernicus Publications remains neutral with regard to jurisdictional claims made in the text, published maps, institutional affiliations, or any other geographical representation in this paper. While Copernicus Publications makes every effort to include appropriate place names, the final responsibility lies with the authors.
ARs play an important role in the surface ice melt in Antarctica and Greenland, leading to sea level rise in the highly populated California coastal region. This study extends the original AR scale to polar regions and aims to enhance communications across observation, research, and forecasts, which is favorable for California to address the risk associated with sea level rise under climate change. We would like to acknowledge the California Department of Water Resources Atmospheric Rivers Program Phase IV for support for the development of the original AR scale and associated products (contract no. 4600014942). This paper is a contribution to the Year of Polar Prediction (YOPP) international initiative and to the SCAR scientific research program AntClimNow. This is contribution 1629 of the Byrd Polar and Climate Research Center. We are thankful for the AWS observations collected at Dome C by the Antarctic Meteorological Research and Data Center (AMRDC). We extend our thanks to Ghislain Picard for sharing the daily surface melt data retrieved from SMMR and SSM/I.
This research has been supported by the California Department of Water Resources Atmospheric Rivers Program Phase IV (grant no. 4600014942). Irina V. Gorodetskaya is grateful for the support provided by the strategic funding to CIIMAR (UIDB/04423/2020, UIDP/04423/2020), 2021.03140.CEECIND, and projects ATLACE (CIRCNA/CAC/0273/2019) and MAPS (2022.09201.PTDC) through national funds provided by FCT – Fundação para a Ciência e a Tecnologia. Penny M. Rowe and Xun Zou are grateful to the National Science Foundation (NSF) for support under awards 2127632 and 2229392. David H. Bromwich is supported by NSF grant 2205398.
This paper was edited by Thomas Mölg and reviewed by two anonymous referees.
Adusumilli, S., Fish, A. M., Fricker, H. A., and Medley, B.: Atmospheric river precipitation contributed to rapid increases in surface height of the west Antarctic ice sheet in 2019, Geophys. Res. Lett., 48, e2020GL091076, https://doi.org/10.1029/2020GL091076, 2021.
Alley, R. B., Clark, P. U., Huybrechts, P., and Joughin, I.: Ice-sheet and sea-level changes, Science, 310, 456–460, https://doi.org/10.1126/science.1114613, 2005.
Antarctic Meteorological Research and Data Center: Dome C II Automatic Weather Station, 2022 quality-controlled observational data, AMRDC Data Repository [data set], https://doi.org/10.48567/x7a9-cx26, 2022.
Baiman, R., Winters, A. C., Lenaerts, J., and Shields, C. A.: Synoptic drivers of atmospheric river induced precipitation near Dronning Maud Land, Antarctica, J. Geophys. Res.-Atmos., 128, e2022JD037859, https://doi.org/10.1029/2022JD037859, 2023.
Bonne, J. L., Steen-Larsen, H. C., Risi, C., Werner, M., Sodemann, H., Lacour, J. L., Fettweis, X., Cesana, G., Delmotte, M., Cattani, O., and Vallelonga, P.: The summer 2012 Greenland heat wave: In situ and remote sensing observations of water vapor isotopic composition during an atmospheric river event, J. Geophys. Res.-Atmos., 120, 2970–2989, https://doi.org/10.1002/2014JD022602, 2015.
Box, J. E., Nielsen, K. P., Yang, X., Niwano, M., Wehrlé, A., van As, D., Fettweis, X., Køltzow, M. A., Palmason, B., Fausto, R. S., and van den Broeke, M. R.: Greenland ice sheet rainfall climatology, extremes and atmospheric river rapids, Meteorol. Appl., 30, e2134, https://doi.org/10.1002/met.2134, 2023.
Bozkurt, D., Rondanelli, R., Marín, J. C., and Garreaud, R.: Foehn event triggered by an atmospheric river underlies record-setting temperature along continental Antarctica, J. Geophys. Res.-Atmos., 123, 3871–3892, https://doi.org/10.1002/2017JD027796, 2018.
Bromwich, D. H., Gorodetskaya, I. V., Carpentier, S., et al.: Winter Targeted Observing Periods during the Year of Polar Prediction in the Southern Hemisphere (YOPP-SH), B. Am. Meteorol. Soc., 105, E1662–E1684, https://doi.org/10.1175/BAMS-D-22-0249.1, 2024.
Chang, E. K., Guo, Y., and Xia, X.: CMIP5 multimodel ensemble projection of storm track change under global warming, J. Geophys. Res.-Atmos., 117, D23118, https://doi.org/10.1029/2012JD018578, 2012.
Coggins, J. H. and McDonald, A. J.: The influence of the Amundsen Sea Low on the winds in the Ross Sea and surroundings: Insights from a synoptic climatology, J. Geophys. Res.-Atmos., 120, 2167–2189, https://doi.org/10.1002/2014JD022830, 2015.
Colosio, P., Tedesco, M., Ranzi, R., and Fettweis, X.: Surface melting over the Greenland ice sheet derived from enhanced resolution passive microwave brightness temperatures (1979–2019), The Cryosphere, 15, 2623–2646, https://doi.org/10.5194/tc-15-2623-2021, 2021.
Debbage, N., Miller, P., Poore, S., Morano, K., Mote, T., and Marshall Shepherd, J.: A climatology of atmospheric river interactions with the southeastern United States coastline, Int. J. Climatol., 37, 4077–4091, https://doi.org/10.1002/joc.5000, 2017.
DeFlorio, M. J., Sengupta, A., Castellano, C. M., Wang, J., Zhang, Z., Gershunov, A., Guirguis, K., and Luna Niño, R.: From California's Extreme Drought to Major Flooding: Evaluating and Synthesizing Experimental Seasonal and Subseasonal Forecasts of Landfalling Atmospheric Rivers and Extreme Precipitation during Winter 2022/23, B. Am. Meteorol. Soc., 105, E84–E104, https://doi.org/10.1175/BAMS-D-22-0208.1, 2024.
Dettinger, M. D., Ralph, F. M., Das, T., Neiman, P. J., and Cayan, D. R.: Atmospheric rivers, floods and the water resources of California, Water, 3, 445–478, https://doi.org/10.3390/w3020445, 2011.
Dutton, A., Carlson, A. E., Long, A. J., Milne, G. A., Clark, P. U., DeConto, R., Horton, D. P., and Rahmstorf, S.: Sea-level rise due to polar ice-sheet mass loss during past warm periods, Science, 349, aaa4019, https://doi.org/10.1126/science.aaa4019, 2015.
Eiras-Barca, J., Ramos, A. M., Pinto, J. G., Trigo, R. M., Liberato, M. L. R., and Miguez-Macho, G.: The concurrence of atmospheric rivers and explosive cyclogenesis in the North Atlantic and North Pacific basins, Earth Syst. Dynam., 9, 91–102, https://doi.org/10.5194/esd-9-91-2018, 2018.
Francis, D., Mattingly, K. S., Temimi, M., Massom, R., and Heil, P.: On the crucial role of atmospheric rivers in the two major Weddell Polynya events in 1973 and 2017 in Antarctica, Sci. Adv., 6, eabc2695, https://doi.org/10.1126/sciadv.abc2695, 2020.
González-Herrero, S., Barriopedro, D., Trigo, R. M., López-Bustins, J. A., and Oliva, M.: Climate warming amplified the 2020 record-breaking heatwave in the Antarctic Peninsula, Commun. Earth Environ., 3, 122, https://doi.org/10.1038/s43247-022-00450-5, 2022.
Gorodetskaya, I. V., Tsukernik, M., Claes, K., Ralph, M. F., Neff, W. D., and Van Lipzig, N. P.: The role of atmospheric rivers in anomalous snow accumulation in East Antarctica, Geophys. Res. Lett., 41, 6199–6206, https://doi.org/10.1002/2014GL060881, 2014.
Gorodetskaya, I. V., Silva, T., Schmithüsen, H., and Hirasawa, N.: Atmospheric river signatures in radiosonde profiles and reanalyses at the Dronning Maud Land coast, East Antarctica, Adv. Atmos. Sci., 37, 455–476, https://doi.org/10.1007/s00376-020-9221-8, 2020.
Gorodetskaya, I. V., Durán-Alarcón, C., González-Herrero, S., Clem, K. R., Zou, X., Rowe, P., Rodriguez Imazio, P., and Campos, D., Leroy-Dos Santos, C., Dutrievoz, N., and Wille, J. D.: Record-high Antarctic Peninsula temperatures and surface melt in February 2022: a compound event with an intense atmospheric river, NPJ Clim. Atmos. Sci., 6, 202, https://doi.org/10.1038/s41612-023-00529-6, 2023.
Guan, B. and Waliser, D. E.: Tracking atmospheric rivers globally: Spatial distributions and temporal evolution of life cycle characteristics, J. Geophys. Res.-Atmos., 124, 12523–12552, https://doi.org/10.1029/2019JD031205, 2019.
Guan, B., Molotch, N. P., Waliser, D. E., Fetzer, E. J., and Neiman, P. J.: Extreme snowfall events linked to atmospheric rivers and surface air temperature via satellite measurements, Geophys. Res. Lett., 37, L20401, https://doi.org/10.1029/2010GL044696, 2010.
Guan, B., Waliser, D. E., and Ralph, F. M.: Global Application of the Atmospheric River Scale, J. Geophys. Res.-Atmos., 128, e2022JD037180, https://doi.org/10.1029/2022JD037180, 2023.
Hersbach, H., Bell, B., Berrisford, P., Hirahara, S., Horányi, A., Muñoz‐Sabater, J., Nicolas, J., Peubey, C., Radu, R., Schepers, D., Simmons, A., Soci, C., Abdalla, S., Abellan, X., Balsamo, G., Bechtold, P., Biavati, G., Bidlot, J., Bonavita, M., De Chiara, G., Dahlgren, P., Dee, D., Diamantakis, M., Dragani, R., Flemming, J., Forbes, R., Fuentes, M., Geer, A., Haimberger, L., Healy, S., Hogan, R.J., Hólm, E., Janisková, M., Keeley, S., Laloyaux, P., Lopez, P., Lupu, C., Radnoti, G., de Rosnay, P., Rozum, I., Vamborg, F., Villaume, S., and Thépaut, J.-N.: Complete ERA5 from 1940: Fifth generation of ECMWF atmospheric reanalyses of the global climate, Copernicus Climate Change Service (C3S) Data Store (CDS) [data set], https://doi.org/10.24381/cds.143582cf, 2017.
Hersbach, H., Bell, B., Berrisford, P., Hirahara, S., Horányi, A., Muñoz-Sabater, J., Nicolas, J., Peubey, C., Radu, R., Schepers, D., and Simmons, A.: The ERA5 global reanalysis, Q. J. Roy. Meteorol. Soc., 146, 1999–2049, https://doi.org/10.1002/qj.3803, 2020.
Ionita, M., Nagavciuc, V., and Guan, B.: Rivers in the sky, flooding on the ground: the role of atmospheric rivers in inland flooding in central Europe, Hydrol. Earth Syst. Sci., 24, 5125–5147, https://doi.org/10.5194/hess-24-5125-2020, 2020.
Jones, M. E., Bromwich, D. H., Nicolas, J. P., Carrasco, J., Plavcová, E., Zou, X., and Wang, S. H.: Sixty years of widespread warming in the southern middle and high latitudes (1957–2016), J. Climate, 32, 6875–6898, https://doi.org/10.1175/JCLI-D-18-0565.1, 2019.
Kromer, J. D. and Trusel, L. D.: Identifying the impacts of sea ice variability on the climate and surface mass balance of West Antarctica, Geophys. Res. Lett., 50, e2023GL104436, https://doi.org/10.1029/2023GL104436, 2023.
Lavers, D. A. and Villarini, G.: The nexus between atmospheric rivers and extreme precipitation across Europe, Geophys. Res. Lett., 40, 3259–3264, https://doi.org/10.1002/grl.50636, 2013.
Li, L., Cannon, F., Mazloff, M. R., Subramanian, A. C., Wilson, A. M., and Ralph, F. M.: Impact of atmospheric rivers on Arctic sea ice variations, The Cryosphere, 18, 121–137, https://doi.org/10.5194/tc-18-121-2024, 2024.
Liang, K., Wang, J., Luo, H., and Yang, Q.: The Role of Atmospheric Rivers in Antarctic Sea Ice Variations, Geophys. Res. Lett., 50, e2022GL102588, https://doi.org/10.1029/2022GL102588, 2023.
Maclennan, M. L., Lenaerts, J. T., Shields, C., and Wille, J. D.: Contribution of atmospheric rivers to antarctic precipitation, Geophys. Res. Lett., 49, e2022GL100585, https://doi.org/10.1029/2022GL100585, 2022.
Maclennan, M. L., Lenaerts, J. T. M., Shields, C. A., Hoffman, A. O., Wever, N., Thompson-Munson, M., Winters, A. C., Pettit, E. C., Scambos, T. A., and Wille, J. D.: Climatology and surface impacts of atmospheric rivers on West Antarctica, The Cryosphere, 17, 865–881, https://doi.org/10.5194/tc-17-865-2023, 2023.
Martin, A., Ralph, F. M., Demirdjian, R., DeHaan, L., Weihs, R., Helly, J., Reynolds, D., and Iacobellis, S.: Evaluation of atmospheric river predictions by the WRF model using aircraft and regional mesonet observations of orographic precipitation and its forcing, J. Hydrometeorol., 19, 1097–1113, https://doi.org/10.1175/JHM-D-17-0098.1, 2018.
Mattingly, K. S., Mote, T. L., and Fettweis, X.: Atmospheric river impacts on Greenland Ice Sheet surface mass balance, J. Geophys. Res.-Atmos., 123, 8538–8560, https://doi.org/10.1029/2018JD028714, 2018.
Mattingly, K. S., Mote, T. L., Fettweis, X., Van As, D., Van Tricht, K., Lhermitte, S., Pettersen, C., and Fausto, R. S.: Strong summer atmospheric rivers trigger Greenland Ice Sheet melt through spatially varying surface energy balance and cloud regimes, J. Climate, 33, 6809–6832, https://doi.org/10.1175/JCLI-D-19-0835.1, 2020.
Mattingly, K. S., Turton, J. V., Wille, J. D., Noël, B., Fettweis, X., Rennermalm, Å. K., and Mote, T. L.: Increasing extreme melt in northeast Greenland linked to foehn winds and atmospheric rivers, Nat. Commun., 14, 1743, https://doi.org/10.1038/s41467-023-37434-8, 2023.
Newman, M., Kiladis, G. N., Weickmann, K. M., Ralph, F. M., and Sardeshmukh, P. D.: Relative contributions of synoptic and low-frequency eddies to time-mean atmospheric moisture transport, including the role of atmospheric rivers, J. Climate, 25, 7341–7361, https://doi.org/10.1175/JCLI-D-11-00665.1, 2012.
Nicolas, J. P. and Bromwich, D. H.: Climate of West Antarctica and influence of marine air intrusions, J. Climate, 24, 49–67, https://doi.org/10.1175/2010JCLI3522.1, 2011.
O'Brien, T. A., Payne, A. E., Shields, C. A., Rutz, J., Brands, S., Castellano, C., Chen, J., Cleveland, W., DeFlorio, M. J., Goldenson, N., and Gorodetskaya, I. V.: Detection uncertainty matters for understanding atmospheric rivers, B. Am. Meteorol. Soc., 101, E790–E796, https://doi.org/10.1175/BAMS-D-19-0348.1, 2020.
Payne, A. E., Demory, M. E., Leung, L. R., Ramos, A. M., Shields, C. A., Rutz, J. J., Siler, N., Villarini, G., Hall, A., and Ralph, F. M.: Responses and impacts of atmospheric rivers to climate change, Nat. Rev. Earth Environ., 1, 143–157, https://doi.org/10.1038/ s43017-020-0030-5, 2020.
Picard, G. and Fily, M.: Surface melting observations in Antarctica by microwave radiometers: Correcting 26-year time series from changes in acquisition hours,Remote Sens. Environ., 104, 325–336, https://doi.org/10.1016/j.rse.2006.05.010, 2006.
Prince, H. D., Cullen, N. J., Gibson, P. B., Conway, J., and Kingston, D. G.: A climatology of atmospheric rivers in New Zealand, J. Climate, 34, 4383–4402, https://doi.org/10.1175/JCLI-D-20-0664.1, 2021.
Ralph, F. M., Neiman, P. J., and Wick, G. A.: Satellite and CALJET aircraft observations of atmospheric rivers over the eastern North Pacific Ocean during the winter of 1997/98, Mon. Weather Rev., 132, 1721–1745, https://doi.org/10.1175/1520-0493(2004)132<1721:SACAOO>2.0.CO;2, 2004.
Ralph, F. M., Coleman, T., Neiman, P. J., Zamora, R. J., and Dettinger, M. D.: Observed impacts of duration and seasonality of atmospheric-river landfalls on soil moisture and runoff in coastal northern California, J. Hydrometeorol., 14, 443–459, https://doi.org/10.1175/JHM-D-12-076.1, 2013.
Ralph, F. M., Dettinger, M. D., Cairns, M. M., Galarneau, T. J., and Eylander, J.: Defining “atmospheric river”: How the Glossary of Meteorology helped resolve a debate, B. Am. Meteorol. Soc., 99, 837–839, https://doi.org/10.1175/BAMS-D-17-0157.1, 2018.
Ralph, F. M., Rutz, J. J., Cordeira, J. M., Dettinger, M., Anderson, M., Reynolds, D., Schick, L. J., and Smallcomb, C.: A scale to characterize the strength and impacts of atmospheric rivers, B. Am. Meteorol. Soc., 100, 269–289, https://doi.org/10.1175/BAMS-D-18-0023.1, 2019.
Rutz, J. J., Shields, C. A., Lora, J. M., Payne, A. E., Guan, B., Ullrich, P., O'Brien, T., Leung, L. R., Ralph, F. M., Wehner, M., and Brands, S.: The atmospheric river tracking method intercomparison project (ARTMIP): quantifying uncertainties in atmospheric river climatology, J. Geophys. Res.-Atmos., 124, 13777–13802, https://doi.org/10.1029/2019JD030936, 2019.
Shields, C. A., Rutz, J. J., Leung, L.-Y., Ralph, F. M., Wehner, M., Kawzenuk, B., Lora, J. M., McClenny, E., Osborne, T., Payne, A. E., Ullrich, P., Gershunov, A., Goldenson, N., Guan, B., Qian, Y., Ramos, A. M., Sarangi, C., Sellars, S., Gorodetskaya, I., Kashinath, K., Kurlin, V., Mahoney, K., Muszynski, G., Pierce, R., Subramanian, A. C., Tome, R., Waliser, D., Walton, D., Wick, G., Wilson, A., Lavers, D., Prabhat, Collow, A., Krishnan, H., Magnusdottir, G., and Nguyen, P.: Atmospheric River Tracking Method Intercomparison Project (ARTMIP): project goals and experimental design, Geosci. Model Dev., 11, 2455–2474, https://doi.org/10.5194/gmd-11-2455-2018, 2018.
Shields, C. A., Wille, J. D., Marquardt Collow, A. B., Maclennan, M., and Gorodetskaya, I. V.: Evaluating uncertainty and modes of variability for Antarctic atmospheric rivers, Geophys. Res. Lett., 49, e2022GL099577, https://doi.org/10.1029/2022GL099577, 2022.
Shields, C. A., Payne, A. E., Shearer, E. J., Wehner, M. F., O'Brien, T. A., Rutz, J. J., Leung, L. R., Ralph, F. M., Marquardt Collow, A. B., Ullrich, P. A., and Dong, Q.: Future Atmospheric Rivers and Impacts on Precipitation: Overview of the ARTMIP Tier 2 High-Resolution Global Warming Experiment, Geophys. Res. Lett., 50, e2022GL102091, https://doi.org/10.1029/2022GL102091, 2023.
Shu, J., Shamseldin, A. Y., and Weller, E.: The impact of atmospheric rivers on rainfall in New Zealand, Sci. Rep., 11, 5869, https://doi.org/10.1038/s41598-021-85297-0, 2021.
Torinesi, O., Fily, M., and Genthon, C.: Variability and trends of the summer melt period of Antarctic ice margins since 1980 from microwave sensors, J. Climate, 16, 1047–1060, https://doi.org/10.1175/1520-0442(2003)016<1047:VATOTS>2.0.CO;2, 2003.
Trusel, L. D., Frey, K. E., Das, S. B., Karnauskas, K. B., Kuipers Munneke, P., Van Meijgaard, E., and Van Den Broeke, M. R.: Divergent trajectories of Antarctic surface melt under two twenty-first-century climate scenarios, Nat. Geosci., 8, 927–932, https://doi.org/10.1038/NGEO2563, 2015.
Viale, M., Valenzuela, R., Garreaud, R. D., and Ralph, F. M.: Impacts of atmospheric rivers on precipitation in southern South America, J. Hydrometeorol., 19, 1671–1687, https://doi.org/10.1175/JHM-D-18-0006.1, 2018.
Viceto, C., Gorodetskaya, I. V., Rinke, A., Maturilli, M., Rocha, A., and Crewell, S.: Atmospheric rivers and associated precipitation patterns during the ACLOUD and PASCAL campaigns near Svalbard (May–June 2017): case studies using observations, reanalyses, and a regional climate model, Atmos. Chem. Phys., 22, 441–463, https://doi.org/10.5194/acp-22-441-2022, 2022.
Waliser, D. and Guan, B.: Extreme winds and precipitation during landfall of atmospheric rivers, Nat. Geosci., 10, 179–183, https://doi.org/10.1038/NGEO2894, 2017.
Warner, M. D. and Mass, C. F.: Changes in the climatology, structure, and seasonality of northeast Pacific atmospheric rivers in CMIP5 climate simulations, J. Hydrometeorol., 18, 2131–2141, https://doi.org/10.1175/JHM-D-16-0200.1, 2017.
Warner, M. D., Mass, C. F., and Salathé, E. P.: Changes in winter atmospheric rivers along the North American west coast in CMIP5 climate models, J. Hydrometeorol., 16, 118–128, https://doi.org/10.1175/JHM-D-14-0080.1, 2015.
Wille, J. D., Favier, V., Dufour, A., Gorodetskaya, I. V., Turner, J., Agosta, C., and Codron, F.: West Antarctic surface melt triggered by atmospheric rivers, Nat. Geosci., 12, 911–916, https://doi.org/10.1038/s41561-019-0460-1, 2019.
Wille, J. D., Favier, V., Gorodetskaya, I. V., Agosta, C., Kittel, C., Beeman, J. C., Jourdain, N. C., Lenaerts, J. T., and Codron, F.: Antarctic atmospheric river climatology and precipitation impacts, J. Geophys. Res.-Atmos., 126, e2020JD033788, https://doi.org/10.1029/2020JD033788, 2021.
Wille, J. D., Favier, V., Jourdain, N. C., Kittel, C., Turton, J. V., Agosta, C., Gorodetskaya, I. V., Picard, G., Codron, F., Santos, C. L. D., and Amory, C.: Intense atmospheric rivers can weaken ice shelf stability at the Antarctic Peninsula, Commun. Earth Environ., 3, 90, https://doi.org/10.1038/s43247-022-00422-9, 2022,
Wille, J. D., Alexander, S. P., Amory, C., Baiman, R., Barthélemy, L., Bergstrom, D. M., Berne, A., Binder, H., Blanchet, J., Bozkurt, D., and Bracegirdle, T. J.: The extraordinary March 2022 East Antarctica “heat” wave, Part I: observations and meteorological drivers, J. Climate, 37, 757–778, https://doi.org/10.1175/JCLI-D-23-0175.1, 2024a.
Wille, J. D., Alexander, S. P., Amory, C., Baiman, R., Barthélemy, L., Bergstrom, D. M., Berne, A., Binder, H., Blanchet, J., Bozkurt, D., and Bracegirdle, T. J.: The extraordinary March 2022 East Antarctica “heat” wave, Part II: impacts on the Antarctic ice sheet, J. Climate, 37, 779–799, https://doi.org/10.1175/JCLI-D-23-0176.1, 2024b.
Yin, J. H.: A consistent poleward shift of the storm tracks in simulations of 21st century climate, Geophys. Res. Lett., 32, L18701, https://doi.org/10.1029/2005GL023684, 2005.
Zhang, P., Chen, G., Ting, M., Ruby Leung, L., Guan, B., and Li, L.: More frequent atmospheric rivers slow the seasonal recovery of Arctic sea ice, Nat. Clim. Change, 13, 266–273, https://doi.org/10.1038/s41558-023-01599-3, 2023.
Zhang, Z. and Ralph, F. M.: The influence of antecedent atmospheric river conditions on extratropical cyclogenesis, Mon. Weather Rev., 149, 1337–1357, https://doi.org/10.1175/MWR-D-20-0212.1, 2021.
Zhang, Z., Ralph, F. M., and Zheng, M.: The relationship between extratropical cyclone strength and atmospheric river intensity and position, Geophys. Res. Lett., 46, 1814–1823, https://doi.org/10.1029/2018GL079071, 2019.
Zhu, Y. and Newell, R. E.: A proposed algorithm for moisture fluxes from atmospheric rivers, Mon. Weather Rev., 126, 725–735, https://doi.org/10.1175/1520-0493(1998)126<0725:APAFMF>2.0.CO;2, 1998.
Zou, X., Rowe, P. M., Gorodetskaya, I. V., Bromwich, D. H., Lazzara, M. A., Cordero, R. R., Zhang, Z., Kawzenuk, B., Cordeira, J. M., Wille, J. D., and Ralph, F. M.: Strong warming over the Antarctic Peninsula during combined atmospheric river and foehn events: contribution of shortwave radiation and turbulence, J. Geophys. Res.-Atmos., 128, e2022JD038138, https://doi.org/10.1029/2022JD038138, 2023.
- Abstract
- Introduction
- Extended AR scale for polar regions
- Climatology of polar ARs
- Impacts of polar ARs
- CW3E Antarctic AR forecast products
- Conclusions and discussion
- Data availability
- Author contributions
- Competing interests
- Disclaimer
- Acknowledgements
- Financial support
- Review statement
- References
- Supplement


