the Creative Commons Attribution 4.0 License.
the Creative Commons Attribution 4.0 License.
The organization of subglacial drainage during the demise of the Finnish Lake District Ice Lobe
Christine F. Dow
Antti Ojala
Joni Mäkinen
Elina Ahokangas
Jussi Hovikoski
Jukka-Pekka Palmu
Kari Kajuutti
Unknown basal characteristics limit our ability to simulate the subglacial hydrology of rapidly melting contemporary ice sheets. Sediment-based landforms generated beneath Late Pleistocene ice sheets, together with detailed digital elevation models, offer a valuable means of testing basal hydrology models, which describe the flow and dynamics of water in the subglacial system. However, to date no work has evaluated how well process-based subglacial hydrology models represent the hypothesized conditions associated with glaciofluvial landform formation in the palaeo setting. Previous work comparing model output to geomorphological evidence has typically done so using models that do not resolve subglacial processes and instead express likely subglacial water pathways. Here, we explore the ability of the Glacier Drainage System model (GlaDS), a process-based subglacial hydrology model, to represent the genesis conditions associated with a specific glaciofluvial landform termed “murtoos”. Distinctive triangular landforms found throughout Finland and Sweden, murtoos are hypothesized to form 40–60 km from the former Fennoscandian Ice Sheet margin within a “semi-distributed” system at the onset of channelized drainage in small cavities where water pressure is equal to or exceeds ice overburden pressure. Concentrating within a specific ice lobe of the former Fennoscandian Ice Sheet and using digital elevation models with a simulated former ice surface geometry, we forced GlaDS with transient surface melt and explored the sensitivity of our model outcomes to parameter decisions such as the system conductivity and bed topography. Our model outputs closely match the general spacing, direction, and complexity of eskers and mapped assemblages of features related to subglacial drainage in “meltwater routes”. Many of the predictions for murtoo formation are produced by the model, including the location of water pressure equal to ice overburden, the onset of channelized drainage, the transition in drainage modes, and importantly the seasonal sequence of drainage conditions inferred from murtoo sedimentology. These conclusions are largely robust to a range of parameter decisions, and we explore seasonal and inter-annual drainage behaviour associated with murtoo zones and meltwater pathways. Our results demonstrate that examining palaeo basal topography alongside subglacial hydrology model outputs holds promise for the mutually beneficial analyses of palaeo and contemporary ice sheets to assess the controls of hydrology on ice dynamics and subglacial landform evolution.
- Article
(23103 KB) - Full-text XML
- BibTeX
- EndNote
The changing configuration of the basal hydrological system beneath ice sheets throughout the melt season is primarily responsible for modulating the response of ice flow to meltwater input (Schoof, 2010). Subglacial water is typically conceptualized as being routed through either distributed, inefficient, and high-water-pressure systems (Weertman, 1972; Kamb, 1987; Boulton and Jones, 1979) or channelized, efficient, and lower-water-pressure systems (Nye, 1972; Röthlisberger, 1972; Hooke, 1989), transitioning between the two as a function of discharge (Schoof, 2010). The seasonal delivery of meltwater to the bed of ice sheets and transition of subglacial hydrological systems in response exerts a first-order control on ice flow by modifying the frictional resistance to ice flow (Schoof, 2010). Understanding where and when transitions between distributed and channelized drainage occur beneath ice sheets is critical if such processes are going to be faithfully represented in ice sheet models used to predict the rate and timing of ice sheet mass loss (Andrews et al., 2014; Nienow et al., 2017), particularly in response to more widespread and prolonged atmospheric warming (e.g. van den Broeke et al., 2023).
To date, most analyses of seasonal subglacial hydrological development have been applied to contemporary ice sheets and glaciers. However, these sites lack key information about basal characteristics, such as basal topography, underlying sedimentology, and the hydraulic properties of the subsurface material (Chu, 2014). Subglacial hydrology models are often used to analyse these systems at the catchment scale; however, given the absence of more detailed information, basal characteristics are often reduced to parameterizations or simplifications of what is likely a more complex reality (e.g. Schoof, 2010; Werder et al., 2013; Flowers, 2018; Kazmierczak et al., 2022).
Glaciated Late Pleistocene terrain may provide a valuable insight into the subglacial hydrological processes operating beneath ice sheets (Stokes et al., 2015; Greenwood et al., 2016). Numerical ice sheet models are already evaluated against the rich geomorphological record that Late Pleistocene ice sheets left behind, particularly landforms relating to ice flow direction or ice marginal position (e.g. Boulton and Hagdorn, 2006; Kleman et al., 2006; Tarasov et al., 2012; Gandy et al., 2019, 2021; Archer et al., 2023; García-Ruiz et al., 2023). Glaciofluvial landforms are especially common in the landform record (e.g. Clark and Walder, 1994; Cofaigh, 1996; Rampton, 2000; Utting et al., 2009; Coughlan et al., 2020; Dewald et al., 2021, 2022) and may represent ideal targets against which to evaluate subglacial hydrology models, potentially including processes variable at sub-annual scales and across the distributed–channelized transition (Kleman et al., 2006; Bingham et al., 2010; Stokes et al., 2015). However, landform genesis uncertainty arises from both fundamentally different concepts of how a landform is formed and the variable spatial and temporal scales of formation (Cofaigh, 1996; Stokes et al., 2015; Greenwood et al., 2016).
Previous work has largely used relatively simple models of subglacial hydrology to explore the spatial expression of channelized glaciofluvial landforms. These models often make assumptions about the configuration of the drainage system (Stokes et al., 2015) and do not explicitly resolve channel formation or exchanges between drainage systems. Typically, such models operate by prescribing a fixed water pressure at or near overburden everywhere, resulting in an expression of likely flow routing but not physical channel development or evolution (e.g. Livingstone et al., 2013a, b, 2015; Karlsson and Dahl-Jensen, 2015; Shackleton et al., 2018; Kirkham et al., 2022). Alternatively, in models where water pressure is allowed to vary, channels are assumed to form where water pressure is equal to ice overburden pressure but the process of channel formation is not explicitly resolved (e.g. Boulton et al., 2007a, b, 2009). These models are unable to capture dynamic drainage changes and are instead intended to represent long-term, inter-annual, “steady-state” conditions (Banwell et al., 2013). More complex models have been used to address esker formation over shorter timescales in 1D (e.g. Beaud et al., 2018; Hewitt and Creyts, 2019), while 2D models that include exchanges between a distributed system and a single channel have been used to interrogate esker length and spacing scaling relationships (e.g. Hewitt, 2011) and erosion rates associated with subglacial drainage efficiency (e.g. Beaud et al., 2014). However, these more complex models use idealized parabolic ice surfaces, often with a flat bed. In contrast, modern subglacial hydrology models (i.e. those capable of resolving transitions between distributed and channelized drainage in both space and time) are widely applied to contemporary ice sheets (e.g. Flowers, 2018; Indrigo et al., 2021; Dow et al., 2022; Sommers et al., 2022; Ehrenfeucht et al., 2023). However, despite the critical need to evaluate and improve modern subglacial hydrology models using all available sources of data (Dow, 2023), we are not aware of previous work that has evaluated the ability of such models to reproduce the subglacial conditions (e.g. water pressure, channel location) associated with glaciofluvial landform formation.
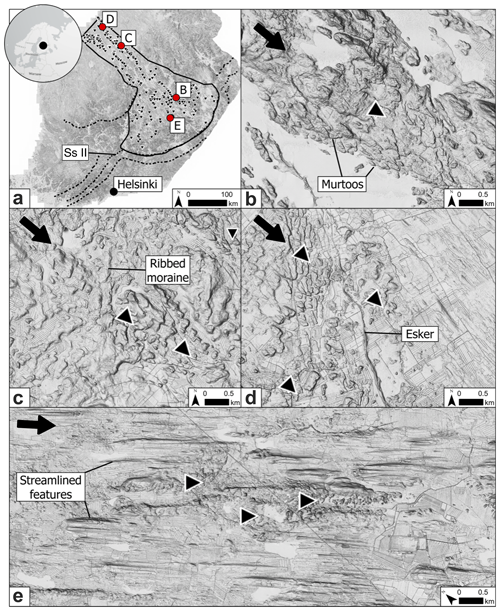
Figure 1The study area. (a) The extent of the GlaDS model domain (solid line) in the Finnish Lake District Ice Lobe (FLDIL) and the Salpausselkäs (dashed line). Salpausselkä II (Ss II) marks the 12 cal. ka ice extent. Murtoo fields identified by Ahokangas et al. (2021) within the FLDIL are shown as inverted triangles. (b) A murtoo field. Adjacent to the murtoos, a large esker is visible in the lake. (c) Murtoo fields amongst ribbed moraines in the north of the FLDIL. (d) An abrupt downstream transition from murtoo fields to a large esker. Additional murtoo fields are found directly adjacent to the esker. (e) Three murtoo fields amongst streamlined terrain at the centre of the FLDIL. All panels show a multi-directional oblique-weighted hillshade based on 2 m lidar data (see Ahokangas et al., 2021, for details). In panels (b)–(e), black arrows in the upper-left corner of each panel indicate the approximate ice flow direction, while the inverted triangles are aligned with the orientation of murtoo fields.
In this paper we apply the Glacier Drainage System model (GlaDS Werder et al., 2013) – a modern subglacial hydrology model capable of resolving the transition between channelized and distributed drainage – to a palaeo ice sheet terrain. We evaluate the ability of GlaDS to represent the conditions giving rise to specific glaciofluvial landforms by making comparisons between model output and the spatial expression and predicted generation of “murtoos” (singular: murtoo; Mäkinen et al., 2017; Ojala et al., 2019) recently identified in Fennoscandia. More widely described channelized features such as eskers (e.g. Storrar and Livingstone, 2017) and tunnel valleys (e.g. Kirkham et al., 2022, 2024) often exceed 10 km in length and likely represent time-transgressive formation over decades and millennia of ice sheet margin retreat (Mäkinen, 2003). In contrast, murtoos are small (< 100 m) glaciofluvial landforms thought to represent the spatiotemporal transition from distributed to channelized subglacial drainage over as little as one melt season (Hovikoski et al., 2023; Mäkinen et al., 2023). The size, formation rate, spatial distribution, and sedimentological architecture of murtoos provide a unique set of predictions against which a subglacial hydrology model can be tested (Hovikoski et al., 2023), including the location of a persistent area of high water pressure, the evolution of discharge through the year, and the spatial onset of channelized drainage. The aim of this paper is to explore the ability of GlaDS, a process-based subglacial hydrology model, to explain murtoo formation in both space and time.
Clearly distinguishable from other glaciofluvial landforms, murtoos are small (30–100 m in width and length), low-relief (∼ 5 m high) features orientated parallel to ice flow with a distinctive, broadly triangular morphology (see Fig. 1; Ojala et al., 2019, 2021, 2022; Ahokangas et al., 2021; Peterson Becher and Johnson, 2021; Vérité et al., 2022; Van Boeckel et al., 2022). Mapping across Finland and Sweden (Mäkinen et al., 2017; Peterson et al., 2017; Ahokangas et al., 2021) reveals a preferential clustering of murtoos in swarms or fields (e.g. Fig. 1b) along subglacial meltwater routes – integrated assemblages of multiple landforms associated with subglacial meltwater (Lewington et al., 2020; Ahokangas et al., 2021; Dewald et al., 2022). Subglacial meltwater routes containing murtoos, or “murtoo routes” (Ahokangas et al., 2021) are concentrated in faster-flowing, warm-based sectors of the Fennoscandian Ice Sheet (FIS) and are often adjacent to, or downstream of, drumlin fields or ribbed moraines (e.g. Vérité et al., 2022, and Fig. 1c). Murtoo routes are also often located upstream of, and appear to transition into, eskers (e.g. Ahokangas et al., 2021, and Fig. 1d). Crucially, murtoo routes are rarely found closer than 40–60 km to the former FIS ice margins (Mäkinen et al., 2023), aligning well with the maximum observed length of channels (∼ 50 km) in contemporary Greenland (e.g. Chandler et al., 2013, 2021; Dow et al., 2016).
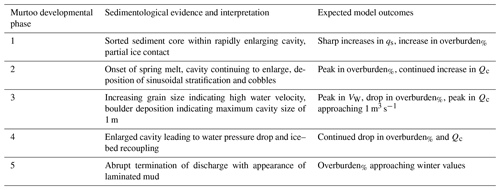
The sedimentological sequence of a murtoo (as described in Hovikoski et al., 2023, and summarized in Table 1) is characterized by abrupt changes in sedimentary structure and grain size and charts the spatiotemporal transition from distributed to increasingly channelized flow within a single melt season during deglaciation (Mäkinen et al., 2023). Murtoos typically comprise a core unit containing sorted sediments, which develops at the end of meltwater pulses within a rapidly enlarging broad subglacial conduit. This core represents the first phase of murtoo formation and evidences at least partial ice contact and periodic deformation (Hovikoski et al., 2023). Following the onset of spring melt, pulses of water deposit a main body unit (murtoo developmental phase 2 in Table 1 and referred to as Unit 2 by Mäkinen et al., 2023) that (i) distally is comprised of alternating facies of heterogeneous diamicton, with strong fabrics interbedded with sorted gravelly and sandy sediment, and (ii) proximally is comprised of alternating sequences of glaciofluvial deposits, with current ripples (formed in low-discharge, lower-flow regimes) giving way to transitional cross-bedding (transitional flow regimes) and antidunal sinusoidal lamination (formed in higher-discharge, upper flow regimes; Hovikoski et al., 2023). The proximal transition from lower to upper flow regimes represents a rapid increase in water flow velocity and depth through a melt season and transition from inefficiently distributed flow to the development of an enlarged, water-filled cavity. Boulder size distributions suggest that this cavity reached a maximum flow space of 1 m (developmental phase 3; Hovikoski et al., 2023). The development of this enlarged cavity or pond and subsequent water pressure drop encourages localized creep closure at the broadest part of the murtoo (developmental phase 4), evidenced by a disappearance of sorted sediment (interpreted as non-deposition rather than erosion), and in some murtoos this is succeeded by compacted interbedded diamicton, indicating ice–bed recoupling (Hovikoski et al., 2023). Meanwhile, closer to the margins of the murtoo body, meltwater flow continues and is routed obliquely towards the tip, forming boulder-rich proto-channels. These deposits indicate that the ice-bed recoupling at the broadest part of the murtoo coincided with intense and increasingly erosional channelized flow at the murtoo margins. The final stage of murtoo development (developmental phase 5) is commonly represented by the generation of boulder-rich marginal channels that finalize the triangular shape of the murtoos (Peterson Becher and Johnson, 2021). Murtoo deposition is abruptly terminated, and marginal channels are abandoned. The sedimentation within these marginal channels is characterized by suspension settling and laminated muds, indicating that the depositional space (0.6–0.8 m tall) remained open and filled with water but no longer hydraulically connected to the active meltwater system (Ojala et al., 2022; Hovikoski et al., 2023).
Importantly, murtoo morphometry (Mäkinen et al., 2017; Ojala et al., 2021), their sedimentological architecture (Peterson Becher and Johnson, 2021; Hovikoski et al., 2023; Mäkinen et al., 2023), and close spatial association with eskers, ribbed tracts, and putative subglacial lakes (Ojala et al., 2021; Ahokangas et al., 2021; Vérité et al., 2022; Mäkinen et al., 2023) suggests that murtoos represent a transition between distributed and channelized drainage. Their formation occurs within broad and low conduits, subject to increasing water discharge throughout a melt season, at water pressures close to or exceeding ice overburden pressure and with short sediment transport distances such as might be found at the spatial onset of channelization in a “semi-distributed” transitional drainage system (Hovikoski et al., 2023).
Our study area comprises the Finnish Lake District Ice Lobe (FLDIL; Putkinen et al., 2017; Palmu et al., 2021) in central Finland (Fig. 1a). The FLDIL is one ice lobe amongst several that comprised the eastern margin of the FIS and contains the highest density of murtoo fields in the region (Fig. 1a; Ahokangas et al., 2021). Murtoo distribution within the FLDIL is representative of their distribution across the wider FIS. In the upstream FLDIL trunk, murtoo fields occur amongst ribbed and hummocky moraines (Fig. 1c) in two longitudinal bands, each bounded by a dense assemblage of streamlined forms. In the northeastern longitudinal bands, eskers are particularly clearly associated with murtoo routes (Fig. 1d). Downstream, where the FLDIL broadens into a lobe (Fig. 1a), murtoo distribution is more fragmented with less clustering evident. Murtoos are sparse in the centre of the ice lobe where thin sediment cover (Fig. A1) may have limited the material necessary for murtoo formation, and the high density of waterbodies may act to mask existing murtoo fields (Ahokangas et al., 2021). The FLDIL geology is predominantly crystalline bedrock, dominated by Precambrian schists, gneisses, and granitoids (Lehtinen et al., 2005) with a thin Quaternary overburden (Lunkka et al., 2021).
In total, the FLDIL encompasses an area of ∼ 57 600 km2, and its distal margin is clearly defined by the first and second Salpausselkäs (Fig. 1a). These large ice-marginal complexes mark the Younger Dryas extent of the FIS (12.7 to 11.7 cal. ka; Donner, 2010; Lunkka et al., 2021). Upstream of the Salpausselkäs there is no clearly defined ice marginal complexes, suggesting the FLDIL collapsed continuously and rapidly following the Younger Dryas (Kleman et al., 1997), retreating northwest towards the Scandes mountains (Sweden and Norway), and was free of ice by 9–10 cal. ka (Hughes et al., 2016; Stroeven et al., 2016; Regnéll et al., 2019). Accordingly, to avoid arbitrarily demarcating an ice margin, we bound our model domain at the second Salpausselkä, which marks the FLDIL extent at ∼ 12 cal. ka (Putkinen et al., 2017). With a fixed domain bound at the second Salpausselkä, we are effectively representing a single time slice at ∼ 12 cal. ka. Shoreline data indicate that the second Salpausselkä terminated in a shallow waterbody ranging in depth from < 5 to ∼ 50 m (Lunkka and Erikkilä, 2012). The speed of the FLDIL retreat, together with the complex and dense assemblage of glaciofluvial landforms (see Palmu et al., 2021; Dewald et al., 2021), suggest that during deglaciation our study area was characterized by high and spatially extensive atmospheric-driven surface melting delivered to the bed, proximal to significant calving of the FIS into the Baltic Sea basin (Greenwood et al., 2017; Patton et al., 2017; Boswell et al., 2019). Conditions within the FLDIL and the FIS more broadly were likely comparable to conditions prevalent in land- or shallow-water-terminating portions of the Greenland Ice Sheet today (Greenwood et al., 2016; Ojala et al., 2019).
To explore how well a process-based model of basal hydrology can explain murtoo genesis, we applied the Glacier Drainage System Model, GlaDS (Werder et al., 2013), to our study area in the FLDIL. With a representative ice sheet surface and palaeo basal topography, together with a baseline set of GlaDS parameters derived from previous work beneath contemporary ice sheets (e.g. Dow et al., 2018a, 2020, 2022), we compared model output from GlaDS to the subglacial hydrological conditions proposed for murtoo genesis. Model output includes water pressure expressed as a percentage of ice overburden, overburden%; sheet discharge, qs; channel discharge, Qc; and water velocity, VW. We examined catchment-scale hydrology outputs and compare these to murtoo formation predictions and the distribution of channelized landforms (eskers) in the FLDIL. At individual nodes, we compared the evolution of nodes across our domain against the developmental phases recorded within murtoo sediment excavations (see Table 1; Hovikoski et al., 2023). We then explored seasonal and inter-annual model outputs in the area 40–60 km from the ice margin, at the upglacier limit of channelization, where murtoos are hypothesized to form (Ahokangas et al., 2021; Ojala et al., 2021). Finally, we go on to investigate differences in model outputs between observed murtoo and meltwater routes and terrain in which there are no glaciofluvial landforms. We sensitivity tested the robustness of all these findings to a range of input parameters. Readers interested in specific details regarding our modelling approaches are referred to Sect. 4.1–4.1.2, where we describe GlaDS, our climate forcing and ice sheet and bed topography, model parameters, and sensitivity testing in detail.
Table 1Murtoo developmental phases (see Fig. 10 in Hovikoski et al., 2023), their sedimentological signature, and anticipated model outcomes, where qs is sheet discharge (m2 s−1), Qc is channel discharge (m3 s−1), overburden% is water pressure expressed as a percentage of ice overburden pressure, and VW is water velocity (m s−1). See Sect. 4.1 and Appendix A for the model description.
4.1 Model description
We used the Ice-sheet and Sea-Level System Model (ISSM; Larour et al., 2012, Revision 27448) and the implementation of the GlaDS model (Werder et al., 2013) contained therein. The GlaDS model (described further in Appendix A and in full in Werder et al., 2013) is a 2D finite-element model, which has been widely applied to contemporary ice sheets in Greenland (e.g. Dow et al., 2018a; Cook et al., 2020, 2022; Ehrenfeucht et al., 2023) and Antarctica (e.g. Dow et al., 2018b, 2020; Indrigo et al., 2021; Dow et al., 2022; McArthur et al., 2023; Hayden and Dow, 2023) and glaciers in Svalbard (e.g. Scholzen et al., 2021). The GlaDS model operates on an unstructured mesh and includes a model of distributed flow through linked cavities (Hewitt, 2011) represented by a continuous “sheet” of water with variable thickness at mesh elements, and channelized flow – describing semi-circular Röthlisberger channels (R-channels) that are allowed to change diameter – along element edges (Schoof, 2010). Sheet elements exchange water with channels, and the cross-sectional area of these channels evolves through time due to the dissipation of potential energy, sensible heat exchange, and cavity closure rates due to viscous ice creep. Here, flow in both the sheet and channel is assumed to be fully turbulent (cf. Hill et al., 2023). Unlike in other models previously applied to the palaeo setting, GlaDS does not require a predetermined drainage system. The growth and restriction of channels are instead entirely due to drainage dynamics (Dow et al., 2020). Following Werder et al. (2013), we set a threshold discharge of Qc=1 m3 s−1, above which an element edge is classified as a “meaningful” channel for our subsequent analysis.
4.1.1 Model setup: boundary conditions and forcings
As model inputs, GlaDS requires bed elevation, zb; ice thickness, H; basal velocity, Ub; boundary conditions; and meltwater input. We anticipate that the modern topography is not representative of bed elevation ∼ 12 cal. ka. Therefore, as the baseline zb, we account for these anticipated changes, particularly in terrain associated with the second Salpausselkä ice-marginal formation, by subtracting Quaternary sediment thickness estimates (GTK, Finland, 2010) from the 25 m per pixel EU-Digital Elevation Model V1.1 (available at https://www.eea.europa.eu/data-and-maps/data/copernicus-land-monitoring-service-eu-dem, last access: 30 August 2023). Lake bathymetry was only partially available in the FLDIL, so we did not subtract this from our input DEM in the baseline model. We also did not adjust our model to account for differences in elevation due to glacial isostatic adjustment (GIA) since ∼12 cal. ka. To ensure the numerical stability of GlaDS, the input DEM was smoothed using a low-pass filter. Finally, within steep terrain, an anisotropic mesh (nnodes≈19 000) was refined based on zb such that element edges were shortest (to a minimum edge length of 400 m) in rougher terrain and longer where terrain was flatter (to a maximum edge length of 2 km).
We generated H using the 2D shallow-shelf approximation (SSA; MacAyeal, 1989) within ISSM (Larour et al., 2012). An initial estimate of H was given using a parabolic profile as a function of distance from the terminus, and initialization values for basal velocity were calculated using a stress balance solution for this ice surface. Dirichlet conditions were imposed at the mesh edges along the boundary with zero inflow. Basal motion was modelled using a viscous sliding law (Budd et al., 1979), and following Åkesson et al. (2018) we used a spatially variable basal drag coefficient, a, proportional to zb, given by the following equation:
Ice was assumed to be isothermal with a viscosity, B, equivalent to an ice temperature of −5 °C (from Cuffey and Paterson, 2010, p. 73; rate factor, A, listed in Table A1). In reality, ice temperature is both spatially and temporally variable. However, instead of using a more detailed thermomechanical ice model, we follow the previous ad hoc assumptions of Nick et al. (2013) for the Greenland Ice Sheet and Åkesson et al. (2018) for the FIS by setting our ice temperature to −5 °C. The 12 cal. ka climate for the ice sheet model was estimated using a modern (1981–2010) reanalysis dataset (see Abatzoglou et al., 2018). Precipitation was kept at the contemporary monthly value, but we depressed monthly temperature by 15 °C, approximately the temperature differential indicated by NGRIP δ18O records (Johnsen et al., 1997). To calculate surface mass balance efficiently in our long-term ice sheet model, we used a simple positive degree day (PDD) model (as in Cuzzone et al., 2019) that was allowed to vary about a fixed Gaussian distribution with standard deviation, σPDD=5.5 °C around the monthly mean and a lapse rate of 7.5 °C km−1. To reach volumetric steady state, defined for our ice sheet model as differences in ice volume between successive iterations of less than 10−6 km3, we ran the ice sheet model for 20 000 years with an adaptive time step, allowed to vary between 1 d and 1 year. The final H was stored and used as the ice sheet input to GlaDS.
As boundary conditions for GlaDS, we imposed a zero flux condition on the domain edge everywhere except at the ice terminus, where given spatial variability in water depth (Lunkka and Erikkilä, 2012), an outlet Dirichlet condition equivalent to atmospheric pressure was prescribed in the baseline model. By enforcing zero input flux, we neglect to include basal water input from beyond the model domain, and we also do not account for any exchange of water between adjacent ice lobe provinces. To promote model stability, we used an adaptive time step that was allowed to vary between 1 h and ∼ 90 s, and all of our transient models were run for 10 000 d (or ∼ 27 years). To approximate winter conditions and avoid suddenly overwhelming our initial system with sudden surface meltwater inputs, we first ran GlaDS to steady state with basal meltwater input but no surface melt. To guarantee the majority of elements were pressurized at the end of each steady-state run, we used a low, fixed basal velocity of 30 m yr−1 to limit the rate of cavity expansion (see Eq. A3). We judged the system to be in steady state once the median difference in sheet thickness between two successive steps was less than 10−6 m. This occurred within 20 000 d in all runs, and the majority of nodes reached 90 % of overburden pressure1 with no channel formation.
For the subsequent transient model runs, melt input to GlaDS was estimated using the same depressed monthly average temperature and precipitation record as with the ice sheet model. In simply depressing the climate by 15 °C we do not represent the complex seasonality (short, warm summers with extreme winters) that characterized the Younger Dryas cold reversal in Fennoscandia (Schenk et al., 2018; Amon et al., 2022). However, in fixing our domain to the second Salpausselkä our hydrology model is representative of the end of the Younger Dryas (∼ 12 cal. ka) when this complex seasonality rapidly gave way to a markedly warmer climate with similar seasonality to present-day conditions (Mangerud et al., 2023). Compared to the ice sheet model, we did use a modified PDD scheme for GlaDS to more faithfully reflect daily temperature variability over the shorter maximum time step. It is commonly assumed that the total monthly positive degree days can be represented by a fixed Gaussian distribution with σPDD≈5.5 °C (e.g. Braithwaite and Olesen, 1989). However, field measurements suggest that this does not hold for the Greenland Ice Sheet (Wake and Marshall, 2015), particularly at temperatures °C. Instead, Wake and Marshall (2015) suggest monthly variability in temperature, σM, is more accurately described by a quadratic function:
where TM is the mean monthly temperature. This function accounts for the reduction in variability with increasing temperature (Gardner et al., 2009; Marshall and Sharp, 2009; Fausto et al., 2011) due to heat buffering, which promotes a more stable boundary layer (Wake and Marshall, 2015). We used σM from Wake and Marshall (2015) but did not take into account variations in kurtosis and skewness with temperature, as these become significant where °C (see Wake and Marshall, 2015), and these are temperatures below those derived from our depressed MAT. Instead we used the calculated σM to add Gaussian noise to a daily temperature record estimated by linearly interpolating our depressed MAT record. The number of positive degree days per month, PDDM, was taken as PDD °C. Following van den Broeke et al. (2010), we used −5 °C as our threshold (rather than the more commonly used 0 °C threshold) to account for melt that may occur even for days with an average temperature of 0 °C. Finally, we used melt rate factors γice=17.22 mm per PDD and γsnow=2.65 mm per PDD following Cuzzone et al. (2019), keeping these consistent between our ice sheet model and GlaDS model. We did not prescribe any inter-annual variability in average monthly temperature. Melt varied in absolute terms between individual simulations, but the mean melt and standard distribution remained identical throughout.
The total monthly melt was routed to the bed via a series of moulins. Following Werder et al. (2013) we divided our domain using Voronoi tessellation on a randomly distributed series of points. Within each Voronoi cell, acting as a “catchment zone”, the lowest-elevation node was identified and used as the location for a moulin towards which all melt from all other catchment nodes flow. Surface melt rate was integrated over each catchment and converted to instantaneous moulin discharge, . Without a detailed record of daily melt variability, we neglect to include daily and diurnal changes in melt, which are known to drive rapid changes in hydraulic head on the Greenland Ice Sheet (Andrews et al., 2014). Smoothing melt variability reduced model size and improved the stability of GlaDS over the ∼ 27-year model runs, and we note that the inclusion of an englacial storage term in GlaDS acts to restrict the influence of diurnal variability to within 2 km of moulins, with a limited influence on the overall pattern of channelized drainage (see Werder et al., 2013).
4.1.2 Model parameters in the baseline model and sensitivity testing
The GlaDS model has been extensively sensitivity tested for contemporary ice sheets where model results can be compared with geophysical evidence to determine the most plausible model output (e.g. Werder et al., 2013; Dow et al., 2018b, 2020, 2022; Indrigo et al., 2021; Scholzen et al., 2021), and as such we do not conduct a detailed review here. We set the parameters in our baseline model (default values listed in Table A1) following the default values in these studies, which provide a reasonable approximation of contemporary ice sheet subglacial conditions. However, because several parameters in GlaDS have uncertain physical values, we did test the robustness of our findings from the baseline scenario throughout the ranges indicated in Table A1. We sensitivity tested for basal melt rate, moulin density and distribution, sheet and channel conductivity terms, basal bump height, the englacial void ratio, basal ice velocity, terminus boundary conditions, bed topography, and mesh geometry. We can assign higher confidence to our baseline model when similar model outputs (e.g. similar channel lengths or patterns of water pressure) are evident across multiple sensitivity tests (e.g. Dow, 2023).
Given uncertainty regarding the spatial variability of basal melt rates beneath current and former ice sheets, which vary as a function of geothermal heat and frictional heating, we used a spatially and temporally constant basal water input (as in Dow et al., 2018a, c, 2020; Poinar et al., 2019). Basal melt rates beneath the Greenland Ice Sheet typically range between 1– m yr−1 (see Karlsson et al., 2021), and we used m yr−1 for our baseline model configuration and the majority of the subsequent transient runs. We tested the influence of basal melt rate by running a low-basal-melt-rate ( m yr−1) and high-basal-melt-rate scenario ( m yr−1).
As default, surface meltwater was routed through ∼ 2500 moulins, a density of 0.04 moulins per square kilometre. Measured moulin density varies between 0.02 and 0.09 moulins per square kilometre in Greenland (Yang and Smith, 2016). To test the sensitivity of our system to moulin density, we also ran models with ∼ 1000 (0.02 moulins per square kilometre), ∼ 4000 (0.06 moulins per square kilometre), and two further randomly generated configurations of the default ∼ 2500 (0.04 moulins per square kilometre). We also tested an additional configuration in which melt at every node was routed directly to the bed.
Further sensitivity testing (parameters listed in bold in Table A1) was carried out for several poorly constrained parameters in GlaDS, basal geometry, and moulin density. The conductivity of both the sheet, ks, and channels, kc, are key controls on the pressure of the system; alter the relative efficiency of each system; and in turn alter the spacing, length, and upstream pressure influence of channels. The conductivity terms in GlaDS are poorly constrained, and following previous work we tested at magnitude limits up to the point at which the model failed to converge (see Dow, 2023). The baseline value for ks was 10−4 , and we tested additional setups where , 10−3, and 10−5 . For kc the baseline value was 10−1, and we tested , , and 10−3 .
The basal bump height, hr, alters how readily cavities open in the distributed system. Our default value for hr was 0.085 m, and we additionally tested hr=0.05 and 0.1 m. We tested values of englacial storage, and . For basal velocity, Ub, we tested prescribed values of between 100–200 m yr−1 that were chosen to be comparable to surface velocity across land-terminating sectors of the Greenland Ice Sheet (e.g. Tedstone et al., 2015). We tested both a temporally fixed and temporally variable Ub, with the transient Ub varying between 85 % and 140 % of the mean to approximate speed-ups at the onset of the melt season and winter slowdowns commonly observed in Greenland (e.g. Sole et al., 2013). Without a more detailed understanding of past ice dynamics, Ub was kept spatially uniform throughout.
Although the default configuration describes a terrestrial margin, we also tested the influence of a shallow body of water at the ice margin by prescribing Dirichlet conditions at the ice margin where water pressure is equivalent to that of a uniform 30 m water depth (a simplification of the variable 5–50 m water depth from Lunkka and Erikkilä, 2012). To explore the influence of our modified topography boundary condition, we ran tests with a uniformly flat bed, one representing contemporary terrain (without Quaternary sediment thickness removed), and one with the available partial lake bathymetry removed. Finally, we also explored the dependency of our results on mesh geometry, including using a coarser mesh (maximum edge length of 5 km), a mesh not refined by elevation in any way, and a mesh in which a coarse mesh (edge length between 5–8 km) was prescribed > 80 km from the ice margin and a much finer mesh (edge length ≈ 300 m) was prescribed < 80 km from the ice margin.
In total, 30 simulations were carried out, and for each model run we examined the subglacial water pressure, expressed as a percentage of the overburden pressure, overburden%; sheet discharge, qs, on element faces; channel discharge, Qc, on element edges; and water velocity, VW. In order to examine how well GlaDS is able to explain murtoo genesis, we first describe the catchment-scale hydrology across our model runs and examine the evolution of the model through time (Sect. 5.1–5.3). In Sect. 5.4 we describe the limitations of our approach and suggest possible future research.
5.1 Catchment-scale hydrology
In the baseline model (see Figs. 2, and 3), model outcomes at the catchment scale suggest that GlaDS matches several of the spatial predictions for murtoo genesis. After an initial adjustment from steady state to transient forcing over 5 years, the baseline model reached a quasi-steady-state configuration in which the system responded seasonally to summer meltwater input (Fig. A3). Following this adjustment, a clear and sharply demarcated transition in drainage modes develops 40–60 km from the ice margin during summer. Murtoos are predicted to have formed at this distance from the ice margin of the FIS, as widespread distributed drainage gave way to channelized drainage within a semi-distributed system (see Mäkinen et al., 2017, 2023; Peterson Becher and Johnson, 2021; Ojala et al., 2019, 2021, 2022; Ahokangas et al., 2021; Vérité et al., 2022; Hovikoski et al., 2023). Additionally, weak to moderate deformation of murtoo sediments suggests that water pressure remained at or close to overburden pressure for sustained periods during the melt season (Peterson Becher and Johnson, 2021; Vérité et al., 2022; Mäkinen et al., 2023; Hovikoski et al., 2023). In our results, a persistent area of overburden%> 100 % develops across the full width of the domain 40–60 km from the ice margin during summer (Figs. 2 and 3 and Movie A1). Outside this area (< 40 km of the ice margin and > 70 km from the ice margin) overburden% is 10 %–30 % lower during summer. By winter, overburden% drops by up to 30 % across the domain as melt ceases (Fig. 2a).
Approximately 35 modelled channels (edges where Qc>1 m3 s−1) extend up to 50 km perpendicular from the ice margin, into but not beyond the hypothesized zone of murtoo formation (Ojala et al., 2021), and terminate where overburden% exceeds 100 % during summer. Murtoo fields (Ahokangas et al., 2021) are evident at the head of many modelled channels, particularly in the western and eastern areas of the ice lobe (Fig. 4a). Within 40–60 km of the ice margin, the median cross-sectional area of edges is 2.8 m2 (equivalent to a semi-circle with radius of 1.3 m). Closer to the ice margin, the median summer Qc of channels reaches up to 100 m3 s−1 (Fig. 2d), and these values are comparable in both sinuosity and spacing to esker deposits in the FLDIL (Fig. 4, Palmu et al., 2021). Channel spacing and length is also comparable to the theoretical spacing of eskers derived from the modelling results of Boulton et al. (2009) and Hewitt (2011). The development of channels during summer also strongly influences qs and VW, and each are highest adjacent to active channels close to the ice margin ( m2 s−1, m s−1) and remain high until 40–60 km from the ice margin ( m2 s−1, m s−1), beyond which all values decrease upglacier ( m2 s−1, m s−1).
Without independent constraint against which to compare our results, we ran additional sensitivity tests to explore the parameter dependency of our findings, assigning higher confidence to model outcomes present across the majority of tests (see Dow, 2023, and Sect. 4.1.2). The catchment-scale hydrology described in our baseline model remains consistent across most of the additional sensitivity tests. Furthermore, sensitivity test results remain consistent with predictions for murtoo genesis. This includes all moulin density tests (Figs. A10 and A12–A14), except the highest moulin density; basal melt rate (Figs. A15 and A16); mesh geometry and bed elevation (Figs. A23–A22); the addition of lake bathymetry (Fig. A24); a shallow proglacial waterbody (Fig. A25); the englacial void ratio (Figs. A26–A27); and basal velocity (Figs. A28–A32).
While catchment-scale trends are largely robust, the exact location of channels and their exact length and local overburden% do vary between sensitivity tests. Because GlaDS operates on a fixed mesh (cf. Felden et al., 2023), the resolution of which is a balance of suitable fidelity against the increased computational cost of resolving finer details, the exact location of where channels may form does vary between sensitivity tests. These minor differences in channel location change the spatial expression of summer overburden%, with the area of overburden%≈100 % changing by up 10 km and differences of between 5 %–10 % for any given location. Channel location is particularly sensitive to mesh geometry, but differences also arise because of moulin density and location, bed topography, basal velocity, and basal bump height. However, while the absolute position of channels does vary, channel spacing remains consistent (∼ 15 km) and changes in channel length are limited to a maximum of ∼ 10 km.
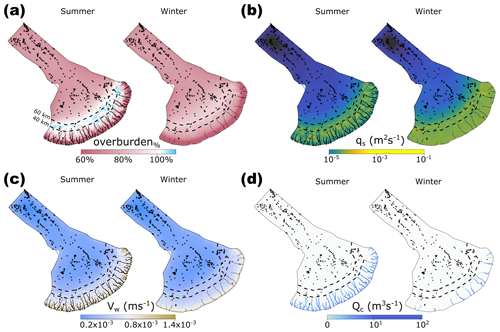
Figure 2Median summer and winter system states in the baseline model run. (a) Water pressure as a percentage of overburden pressure, overburden%, in summer and winter. (b) Sheet discharge, qs, in summer and winter. (c) Water velocity, VW, in summer and winter. (d) Channel discharge, Qc, in summer and winter. For each output, we took the median from model years 5–27 disregarding the initial period of adjustment to transient forcing. Summer extends from May to September, and all other points fall into winter. Note that the scales for panels (b) and (d) are logarithmic. Dashed lines in all panels indicate contours of 40 and 60 km from the ice margin. Murtoo fields (Ahokangas et al., 2021) are shown as inverted triangles in all plots. Channels are shown as solid black lines in panels (a)–(c).
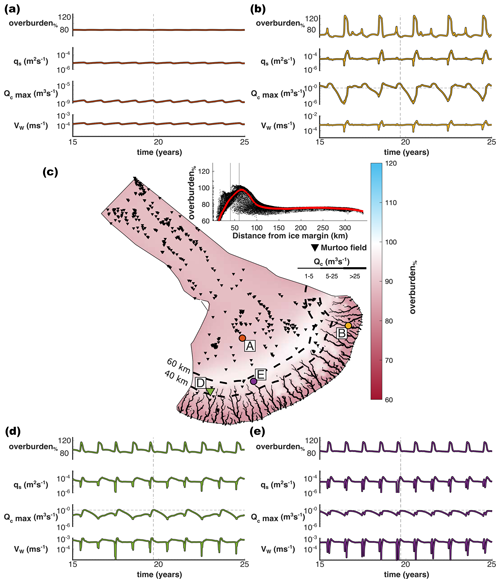
Figure 3The evolution of water pressure as a percentage of overburden pressure (overburden%), sheet discharge (qs), water velocity (VW), and maximum channel discharge (Qc max) at four nodes over model years 15–25 in the baseline model run. (a) Node no. 6277 located ∼ 120 km from the ice margin. (b) Node no. 18 517 located ∼ 17 km from the ice margin. (c) Overburden at the end of the melt season in model year 19 (arbitrarily selected). Channels are represented as black lines; murtoo fields as inverted black triangles; and the location of panels (a), (b), (d), and (e) as coloured points. The inset shows overburden at every node as a function of distance, D, from the ice margin with a smoothing function shown in red and vertical lines at 40 and 60 km from the ice margin. (d) Node no. 16 402 located 0.7 km from a murtoo field and ∼ 45 km from the ice margin. (e) Node no. 3842 located ∼ 54 km from the ice margin at the head of a channel system without an adjacent murtoo field. The time slice shown in panel (c) is represented as a vertical dashed line in panels (a), (b), (d), and (e). Note the logarithmic scale for qs and Qc max.
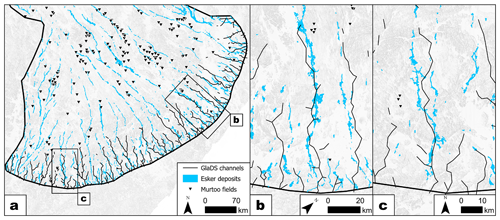
Figure 4Modelled channel location compared to esker deposits (mapped by Palmu et al., 2021) and murtoo fields (mapped by Ahokangas et al., 2021) at the ice margin of the FLDIL. (a) Modelled channels during summer in the baseline run (black lines) across the full width of the domain compared to esker deposits (blue polygons) and murtoo fields (inverted black triangles). Each channel is defined as being where the median channel discharge, Qc, exceeds 1 m3 s−1 during summer. (b, c) Detailed comparison of two large esker systems against model channels.
Although consistent across the majority of tests, channel length and overburden% do vary considerably at the tested limits of ks and kc parameters, describing the sheet and channel conductivity, respectively (Werder et al., 2013). For both the maximum tested sheet conductivity ( , Fig. A4) and the minimum tested channel conductivity ( , Fig. A9), there are major changes to the catchment hydrology. Channels are restricted to within ∼1 km of the ice boundary, and overburden% within and near to these channels is ≈ 50 % when and approaches 120 % when .
For both the minimum sheet conductivity ( , Fig. A6) and the maximum channel conductivity ( , Fig. A7) channel length increases to between 50–60 km, which is only a 10 km increase in channel length compared to the baseline scenario, but there are additional major changes in overburden%. At the minimum ks, an area of overburden%≈ 100 % extends up to 150 km from the ice margin during summer, and at the maximum kc there is no area of overburden%> 90 % during summer. When (Fig. A5) and when moulin density is highest (Fig. A11), channels are restricted to within 20 km and there is an area of high overburden%>100 % between 10–70 km of the ice margin.
Changing the channel and sheet conductivity by orders of magnitude strongly modifies the efficiency with which either the distributed or channelized system can transmit water, limiting the influence of the other system (Werder et al., 2013). At the highest tested moulin density, the reduced discharge associated with any one moulin resulted in a higher density of short channels as fewer reach the threshold discharge at which wall melt exceeds creep-driven channel closure. Excessively long (> 50 km) or short (< 10 km) channels are considered to be invalid on the basis of modern Greenland observations (e.g. Chandler et al., 2013; Dow et al., 2016), and an anomalous overburden% is considered invalid on the basis of the conceptual model for murtoo distribution and genesis (e.g. Ahokangas et al., 2021; Hovikoski et al., 2023). Therefore, our baseline conductivity terms are the considered the most plausible parameters.
Finally, given the parameters in our baseline model are set following existing work on contemporary ice sheets (Sect. 4.1.2), it is no surprise that the modelling outputs appear similar to the subglacial hydrological system evident in land-terminating sectors of the Greenland Ice Sheet at the catchment scale. Tracer transit times (e.g. Chandler et al., 2013) and basal hydrology modelling indicate efficient channelization extends up to 40–50 km from the ice margin in Greenland, transitioning between channelized and distributed drainage modes where ice is ∼ 900–1200 m thick (De Fleurian et al., 2016; Dow et al., 2016) as it does here. However, the pressure conditions within large channels close to the ice margin are notably different in our model results compared to the Greenland settings (e.g. Van de Wal et al., 2015). In Greenland, channels exist at lower water pressures than the surrounding distributed system (Davison et al., 2019), and the resultant hydraulic potential gradient forces large volumes of water from the surrounding distributed system towards channels, in turn lowering water pressure in the distributed system and increasing basal traction (Schoof, 2010). Even as meltwater delivery to the bed subsequently increases through the melt season, these channels can act to reduce ice velocity (Nienow et al., 2017) and reduce ice mass loss. In contrast, the channels modelled here remain at relatively high overburden% throughout the year (>60 %), with a lower hydraulic potential gradient between channelized and distributed systems. The FLDIL is low relief compared to the steep margins of the Greenland Ice Sheet (e.g. Wright et al., 2016), and the shallow topography may act to reduce the hydraulic gradient between distributed and channelized drainage. As a result, the influence of channelization on basal velocity would be relatively limited in the FLDIL. Lower rates of water exchange between distributed and channelized drainage would permit more of the bed to remain closer to overburden%≈100 %, sustaining higher velocities for extended periods of time (Dow et al., 2022), highlighting the sensitivity of low-relief areas of the FIS to extensive atmospheric melting.
5.2 Comparison to the murtoo developmental phases
The widespread and time-integrated distribution of murtoos throughout our model domain complicates model validation as murtoo formation conditions remain uncertain. The ability of GlaDS to reproduce the hypothesized spatial pattern of murtoo formation (i.e. summer overburden%≈100 % 40–60 km from the ice margin) alone cannot definitively confirm or refute the hypothesized formation process because murtoos are distributed across our model domain. In this context, comparing seasonal model evolution to murtoo sedimentology (e.g. Hovikoski et al., 2023; Mäkinen et al., 2023) becomes particularly important as there are multiple predictions in sequence that the model must achieve (Table 1).
Examined at individual nodes through time, the baseline model (and most sensitivity tests) agrees well, though not perfectly, with the hypothesized conditions and location of murtoo genesis. Internal murtoo sediments chart an overall increase in meltwater discharge throughout the melt season followed by an abrupt termination (Table 1), possibly within the same year (Hovikoski et al., 2023). Against this backdrop, the alternating sequences of glaciofluvial deposits in the main body of murtoos suggests that the system was also subject to repeated pulses of meltwater and rapid changes in flow regime, marking the rerouting and periodic isolation of cavities within a developing, semi-distributed drainage system (Hovikoski et al., 2023; Mäkinen et al., 2023). Figure 3 shows the evolution of the system through time at four representative nodes across the study area. At node 6277, 120 km from the ice margin and upglacier of any significant surface melt inputs, the system is effectively inert, with overburden% remaining ≈80 % and only small periodic perturbations in qs, Qc, and VW. However, the system responds annually to meltwater inputs and is more variable through time closer to the ice margin.
Figure 3d and e demonstrate the seasonal evolution of two nodes between 40–60 km from the ice margin, both of which are near channel systems. Both nodes fall within the hypothesized zone of murtoo formation, and both nodes display drainage behaviour that could accommodate murtoo formation, with a seasonal increase in overburden% up to a maximum of approximately 120 % and a more gradual decrease thereafter. However, the two nodes show different inter-annual behaviour, and only one is located close to a murtoo field. At node 3842, ∼ 54 km from the ice margin and chosen to be representative of surrounding nodes at the onset of a channel (Fig. 3e), the pattern of drainage repeats annually – every year the increase and decrease in overburden% is accompanied by peaks in qs, Qc, and VW and the nearby development of channels throughout the meltwater season. At the onset of channelization, the maximum Qc approaches but never exceeds 1 m3 s−1. However, although this evolution through time does appear consistent with each of the murtoo developmental phases (Table 1), node 3842 is not located near a murtoo field.
At node 16 402, located 0.7 km from a murtoo field and chosen to be representative of murtoo fields, a more complex signal is evident. At the maximum upglacier extent of two adjacent channels, ∼ 45 km from the ice margin, a biannual signal is evident (Fig. 3d). Every year, there is a sharp increase in overburden% at the start of the melt season to overburden%≥100 %. However, the subsequent drop in overburden% varies every other year. Either overburden% spikes and then drops rapidly over 1–2 months to the winter value (∼ 80 %) until the following melt season or the drop in overburden% is initially shallower before quickly dropping to an overburden% (∼ 90 %) that is elevated relative to the previous winter. Years with an elevated winter overburden% are also associated with lower Qc and flatter peaks in qs. In contrast, years that have a rapid drop in overburden% after the start of the melt season are associated with higher values of Qc, approaching 1 m3 s−1, and sharper peaks in qs. We consider the latter case to be more consistent with the murtoo developmental phases (Table 1) because the higher values of Qc indicate discharge approached that necessary to form channels.
A similarly biannual pattern is evident at node 18 517, 17 km from the ice margin and co-located with a channel (e.g. Fig. 3b). Here, close to the ice margin the maximum Qc associated with edges connected to the node exceeds the threshold for a meaningful channel every summer, reaching a peak of 200 m3 s−1 ∼ June each year with a maximum cross-sectional channel area of 42 m2 (equivalent to a half-circle with radius, r≈5 m). However, every other year, the maximum Qc of edges connected to node 18 517 remains ≥1 m3 s−1; i.e. the channel remains active over winter. Pre-existing channels dampen the influence of melt in the following summer by providing an already established efficient drainage pathway with only a small increase in overburden% and little change in qs (Fig. 3b). Overwinter channels form across the width of the domain in the baseline model, but an alternating spatial pattern of overwinter channel persistence is evident. In any given year, channels will persist through winter in either the central third of the lobe or in the remaining two-thirds of the lobe (Fig. A2 and Movie A1).
Finally, although individual nodes do track the overall increase in meltwater discharge throughout some melt seasons, as well as the evolution of overburden% consistent with limited cavity expansion, our modelling fails to reproduce the sharp drop in discharge at the end of the melt season or the rapidly changing flow regimes within a single melt season that have been invoked to explain murtoo sedimentology (see Sect. 2 and Mäkinen et al., 2023; Hovikoski et al., 2023). We did not include diurnal variability in our modelling on the grounds of model stability and the limited influence diurnal forcing has on catchment-scale drainage in GlaDS (Sect. 4.1.1 and Werder et al., 2013). Diurnal forcing would be critical in order to represent rapid changes in the flow regime within murtoo-forming cavities. However, as with other subglacial hydrology models, GlaDS is a model in which the subglacial system is assumed to be pervasively hydraulically connected (see Rada Giacaman and Schoof, 2023), and there is no mechanism that can lead to the hydraulic isolation of specific areas of the bed (e.g. Rada and Schoof, 2018; Hoffman et al., 2016). As a result, even if diurnal forcing were to be included, we do not expect to be able to reproduce the rapid changes in meltwater discharge necessary to form upper- and lower-flow regime deposits (see Sect. 2 and Hovikoski et al., 2023) or laminated muds in marginal murtoo channels (e.g. Ojala et al., 2022). Including spatially variable system conductivity is likely to be important in future work that seeks to evaluate the ability of process-based subglacial hydrology models to represent landform formation.
5.3 Comparing murtoo and meltwater route hydrology
Extensive geomorphological mapping has identified meltwater pathways across the FIS and within the FLDIL in particular (see Dewald et al., 2021; Ahokangas et al., 2021). We explore drainage behaviour in the area of anticipated murtoo formation by isolating and taking a spatial median of nodes in the baseline model 40–60 km from the ice margin. We grouped nodes by their relation to (i) murtoo routes (n=244), (ii) meltwater routes (n=951), and (iii) neither form of route (n=1205), using 500 m buffers to approximated the lateral extent of murtoo or meltwater routes along 2D polylines from Ahokangas et al. (2021). Thresholding by distance is necessary to exclude (i) nodes that do not respond seasonally to meltwater input (e.g. those >60 km from the ice margin, Fig. 3a) or (ii) nodes closer to the ice margin (within 0–40 km) where channelized drainage dominates in our modelling. Nodes 40–60 km were selected because this is both the hypothesized area of murtoo formation (Ahokangas et al., 2021) and the location in our modelling identified as one in which conditions for murtoo formation are met (Sect. 5.1). We note that we also include eskers within 40–60 km of the ice margin (mapped as “channelized routes” by Ahokangas et al., 2021), which likely postdate ∼ 12 cal. ka. We do not have age control on any individual landform and many channelized routes intersect or overprint murtoo and meltwater routes (Ahokangas et al., 2021), and thus we therefore classified them accordingly.
Plotting the median evolution of these groups through time (Fig. 5) and as probability density functions (Fig. 6) reveals clear differences between nodes in murtoo or meltwater routes and nodes that do not intersect any mapped glaciofluvial geomorphology. Compared to individual nodes (Sect. 5.2), the average evolution of nodes in murtoo and meltwater routes follows a regular pattern year on year (Fig. 5). At the onset of the melt season, following winter minima, overburden%, qs, Qc, and VW all begin to increase (Fig. 5). The increase in overburden, qs, and VW is sharp, with a more gradual increase in Qc through time. As cavity expansion promotes lower water pressure and more efficient discharge, overburden% peaks earliest ∼ June each year, but it remains > 100 % until ∼ August, at which point VW and qs peak. As overburden%, qs, and VW all decrease towards winter minima following peak melt, Qc peaks in September, decreasing steadily towards a minimum before the next melt season. By contrast, the pattern across all other nodes (i.e. those which do not intersect mapped glaciofluvial geomorphology) remains relatively stable through time, and overburden%, qs, Qc, and VW are lower throughout the year, suggesting there is limited evolution of the hydrological system in these nodes. In clearly distinguishing murtoo and meltwater routes from nodes that do not intersect mapped glaciofluvial geomorphology, GlaDS appears to be faithfully representing the drainage pathways active beneath the FLDIL at the end of the Younger Dryas ∼ 12 cal. ka.
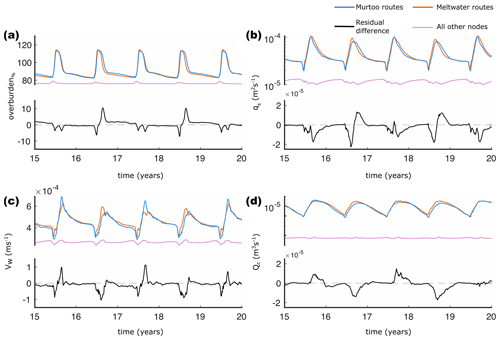
Figure 5Median output during model years 15–20 at nodes between 40–60 km from the ice margin. In all panels, nodes that fall within murtoo routes are shown in blue, those which fall within meltwater routes (without murtoos) are shown in orange, and all other nodes are shown in purple. The black line in each panel represents the residual difference between the median of murtoo routes and meltwater routes. A positive residual indicates higher median values in murtoo routes and vice versa for negative residual values. (a) Water pressure expressed as a percentage of overburden (overburden%). (b) Sheet discharge(qs). (c) Water velocity (VW). (d) Channel discharge (Qc). Note that panels (b) and (d) have logarithmic scales.
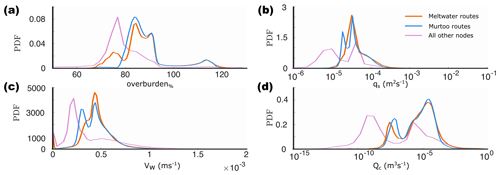
Figure 6Probability density estimates from kernel smoothing of model output during all model years at nodes between 40–60 km from the ice margin. As in Fig. 5, nodes that fall within murtoo routes are shown in blue, those which fall within meltwater routes (without murtoos) are shown in orange, and all other nodes are shown in purple. (a) Water pressure expressed as a percentage of overburden (overburden%). (b) Sheet discharge (qs). (c) Water velocity (VW). (d) Channel discharge (Qc). Note that panels (b) and (d) have logarithmic scales.
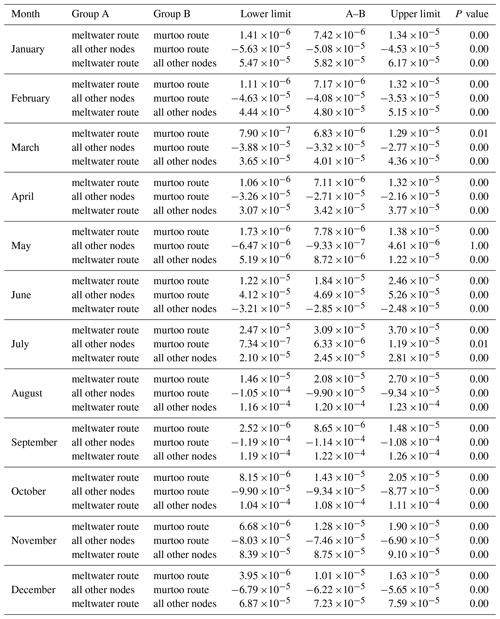
The probability density functions of murtoo routes and meltwater routes is also clearly distinct from terrain without glaciofluvial landforms (Fig. 6). However, the probability density functions of murtoo routes and meltwater routes are also different from one another, particularly at the lower tail of the distributions (Fig. 6). Murtoo routes have an overburden% distribution with a more tightly constrained lower tail than meltwater routes, with fewer nodes dropping below overburden%=80 %. There is a bimodal distribution of both qs and VW within murtoo routes that is not evident in meltwater routes at the lower tail of the distribution. Both meltwater routes and murtoo routes have a bimodal Qc distribution, but the lower murtoo route peak is offset towards higher channel discharges. One-way ANOVA testing indicates that the difference in distribution between murtoo and meltwater routes is statistically significant (p<0.05 at the 95 % confidence interval). Additional Tukey–Kramer testing indicates that the significant difference between murtoo and meltwater routes varies throughout the year (Tables A2–A5). In June and July, overburden% is significantly lower in murtoo routes than in meltwater routes by 1 %–3 %, throughout the rest of the year, while overburden% is significantly higher in murtoo routes than in meltwater routes by the same amount. Between January and May there are no significant differences in qs between murtoo routes and meltwater routes. However, between June and December, qs is significantly lower in murtoo routes than in meltwater routes by m2 s−1. There are no statistically significant differences in Qc between murtoo routes and meltwater routes throughout the year. Statistically significant differences between murtoo and meltwater routes and all other nodes is limited to between June and October when Qc is significantly higher in murtoo and meltwater routes than beyond by m3 s−1. Finally, throughout the year, VW is higher in murtoo and meltwater routes than beyond them by m s−1. In murtoo routes VW is significantly lower for each month than in murtoo-free meltwater routes by m s−1.
The differences between meltwater routes and murtoo routes are subtle, and the annual evolution of model outputs in both closely match the murtoo developmental phases (Table 1 and Hovikoski et al., 2023). We anticipate that this statistical difference has a strong spatial component linked to the overwinter channels reported in Sect. 5.2 – murtoo routes are notably absent 40–60 km from the ice margin in the centre of the FLDIL, whereas meltwater routes are more evenly distributed across the full width of the domain (see Fig. A1a). Murtoo distribution closely overlaps with the distribution of overwinter channels and when channels in the central third of the FLDIL persist over one winter, those in the outer two-thirds do not and vice versa in the following winter (Fig. A2). As a result, when overwinter channels persist near murtoo routes, the following summers are characterized by sharper peaks in overburden% and lower values of Qc, VW, and qs as melt is quickly accommodated by an established efficient drainage pathway (Sect. 5.2). In contrast, meltwater routes – distributed more evenly – are less sensitive to the spatial pattern of winter channels. We therefore anticipate that the statistically significant difference between murtoo routes and meltwater routes arises because of the repetitive expression of overwinter channels and does not necessarily indicate that GlaDS is resolving differences between the landforms themselves.
On the Greenland Ice Sheet, winter slowdowns following high-melt summers have been linked to the sustained persistence of larger and more extensive channels into winter months (Sole et al., 2013), and their existence alone in our baseline model is not necessarily surprising. Our fixed repetitive model forcing, fixed ice sheet geometry, and constant basal velocity (see Sect. 4) likely explains their repetitive inter-annual expression; however, the spatial pattern of overwinter channels is unexpected. The lobate geometry of the ice lobe is one possible explanation, and together with spatial variability in the climate input this may result in a non-uniform concentration of meltwater within the lobe that is allowed to persist because of fixed model forcing. In a more sophisticated model setup – one including sediment dynamics, coupled ice flow and subglacial hydrology, and/or more realistic meltwater variability – the repetitive pattern of overwinter channels is unlikely to persist, while overwinter channels may be absent altogether. Murtoo route distribution meanwhile appears to be a complex interplay of upstream sediment availability, meltwater input location and timing, local geology, ice velocity, and drainage characteristics (see Ahokangas et al., 2021). By predicting the apparent conditions for murtoo formation where no murtoo routes are present (e.g. in the centre of the FLDIL, 40–60 km from the ice margin; see Fig. 3b) it is clear that although GlaDS is capturing the broader patterns of meltwater drainage, it is failing to reproduce the exact spatial pattern of murtoos themselves, likely due to an incomplete description of subglacial processes in our modelling (see Sect. 5.4). Nonetheless, our results clearly demonstrate the potential for GlaDS to represent subglacial hydrology beneath former ice sheets, but further research is necessary to more accurately resolve the specific spatial distribution of murtoos.
5.4 Limitations and future work
This work represents, to the best of our knowledge, the first comparison of a process-based subglacial hydrology model to specific glaciofluvial landforms, and we view it as necessarily exploratory. To ensure models could run to completion with wall time of 1–2 d and remain numerically stable across the tested range of parameters, we make a number of simplifying assumptions. These include smoothing of the bed topography below the maximum resolution available, and using a relatively large mesh. However, sensitivity testing indicates our conclusions are largely insensitive to topography, including a total absence of relief, and that the ice surface gradient instead imposes the dominant control on basal hydrology. Similarly, changing the mesh resolution also appears to have limited impact on our conclusions. We did not account for changes in elevation due to glacial isostatic adjustment (GIA) since 12 cal. ka. Assuming this area has been uplifted by a maximum of ∼ 100 m (Ojala et al., 2013; Rosentau et al., 2021), the volume of melt delivered to the bed would have been higher during the Younger Dryas due to higher temperatures (≤ 0.75 °C) at lower altitudes. Accounting for this would result in higher discharge channels that persist further upglacier of those high-uplift areas. Additional uncertainty arises from our estimated (and constant) meltwater and basal melt inputs, lack of diurnal forcing, fixed and spatially uniform basal velocity, fixed conductivity parameters (in both space and time), fixed semi-circular channel geometry, assumed water turbulence, pervasive hydraulic connectivity, lack of water flux from abutting ice, and randomly seeded moulin inputs. Initial sensitivity testing of basal velocity being forced to change seasonally does indicate that changes in basal velocity throughout the year are important for repressurizing the system each winter to more closely match borehole records (e.g. Doyle et al., 2018, 2022). Changes in geometry are also known to be important in synthetic experiments of GlaDS (see Hayden and Dow, 2023), whereas we kept ice geometry fixed here. Finally, we note that in its uncoupled configuration, GlaDS does not account for a reduction in the frictional resistance to ice flow where overburden% exceeds 100 % or the increase in cavity closure rates that would accompany the increase in basal velocity associated with such a change in friction. In reality, sustained summer overburden%≥100 % would result in the decoupling of the ice from the underlying bed, as is suggested to be the reason for the limited observations of deformational structures within murtoo sediment exposures (e.g. Peterson Becher and Johnson, 2021; Mäkinen et al., 2023; Hovikoski et al., 2023). Future work should seek to address some of these limitations by including, for example, a more variable climate or coupled ice dynamics whereby the frictional resistance to ice flow is allowed to vary in response to changes overburden% (as in Ehrenfeucht et al., 2023).
In this paper we present the first application of a modern, process-based subglacial hydrology model to the palaeo setting. We compared model outputs from the Glacier Drainage System model (GlaDS) against the predicted conditions associated with murtoo genesis. Murtoos are a unique glaciofluvial landform, identified throughout Finland and Sweden in terrain formerly occupied by the Fennoscandian Ice Sheet (FIS). The alternating sedimentological sequence of upper- and lower-flow regimes preserved within murtoos suggest that they formed amongst a network of small channels and cavities subject to rapid changes in water discharge and where water pressure met or exceeded ice overburden pressure. Further, their spatial distribution, rarely found closer than 40 km from the ice margin and often found downstream of ribbed moraines and upstream of eskers, suggests that murtoos represent the glaciofluvial imprint of a spatial and/or temporal transition between distributed and channelized drainage. We modelled this system using a setup representative of the Finnish Lake District Ice Lobe (FLDIL) at the end of the Younger Dryas at ∼ 12 cal. ka. Our model was forced with a positive degree model representative of the palaeo climate and a modified digital elevation model and reconstructed ice surface elevation representative of the same time period.
Our model outputs reproduce many of the conditions predicted for murtoo genesis including the following features:
- i.
an extensive area of water pressure at or equal to ice overburden pressure 40–60 km from the ice margin, largely robust to the range of parameters tested here;
- ii.
an annual evolution of a semi-distributed drainage system that matches many of the anticipated conditions for murtoo genesis;
- iii.
modelled channels that extend 40–50 km from the ice margin upglacier into the hypothesized transitional drainage zone associated with murtoo formation (these channels also have a similar spacing and geometry to mapped eskers in the region);
- iv.
a statistically meaningful difference between areas of the bed without any indication of meltwater flow and areas of the bed with meltwater routes or murtoo routes.
Additionally, we find a statistically meaningful difference in water pressure, water velocity, and sheet and channel discharge between meltwater routes and murtoo routes. We interpret this as a combination of patchy murtoo distribution and the presence of overwinter channels in our model outputs. Murtoo fields are not universally present where the conditions for their formation are predicted in our model, particularly within the centre of the FLDIL lobe; this may arise from necessary simplifications in our modelling, which include a lack of sediment dynamics and/or coupling to ice flow. Nonetheless, many of our model outcomes from the baseline model, in particular the area of high water pressure 40–60 km from the ice margin, are robust across the majority of 29 sensitivity tests carried out here, in which various values for model parameters and boundary conditions were tested within a range of numerical stability. At extremely high and low values of conductivity, a parameter that controls how readily water flows through the distributed or channelized system, water was evacuated from the system too easily or slowly to form meaningful channels. Channels are also restricted when the highest moulin density was tested. However, across all other tests, including random mesh geometries, alternate bed topographies, changing basal velocity, and changing moulin density, similar patterns of modelled channels and water pressures emerge. Although our system is necessarily an idealized representation of the study area – not including adjacent and abutting ice lobes, an upstream catchment area, or a coupled representation of ice dynamics and basal hydrology – this work nonetheless demonstrates the potential application of modern process-based hydrology models to the palaeo setting, where model outputs can be directly compared to geomorphology and specific models of landform genesis.
In GlaDS (Werder et al., 2013), water flux, qs, is driven through the distributed system by the hydraulic potential gradient,∇∅, along with the sheet conductivity, ks
where the flow exponents, and , describe fully turbulent flow in the Darcy–Weisbach law and h is the sheet thickness. The sheet thickness evolves through time given by
for functions w and v, which describe the cavity opening and closing rate, respectively (Walder, 1986; Kamb, 1987). Basal sliding opens cavities at a rate given by the basal sliding speed, Ub, acting over basal bumps with a height, hr, through
where lr is the typical horizontal cavity spacing. In turn, viscous ice deformation leads to cavity closure, which is related to the effective pressure N by
where A is the rate factor, or the rheological constant of ice, multiplied by a first-order geometrical factor, and n is the Glen's flow law exponent. Sheet elements exchange water with channels and the cross-sectional area of these channels, S, evolves through time due to the dissipation of potential energy, Π; sensible heat exchange, Ξ; and cavity closure rates due to viscous ice creep, vc:
where ρi is the ice density and L is the latent heat of fusion. The default parameters used here, as well as those sensitivity tested, are listed in Table A1.
Table A1List of input values for GlaDS. Values highlighted in bold indicate those used for sensitivity testing. A range of values is provided. Note that in all instances “sheet” refers to the subglacial drainage system.
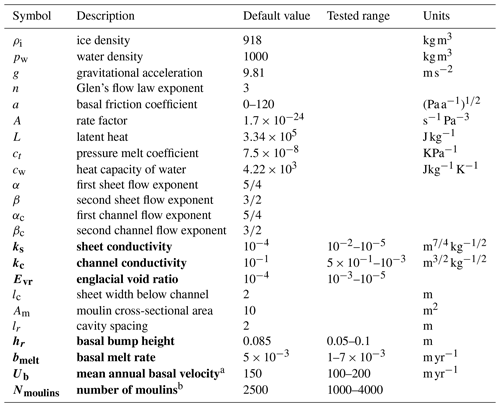
a We tested both a transient and temporally constant basal velocity within these given ranges for mean annual basal velocity. b We also ran an experiment in which melt was routed directly to the bed at each node (SHEET).
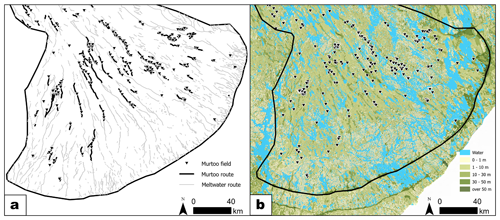
Figure A1The distribution of meltwater routes, murtoo routes, and sediment in the Finnish Lake District Ice Lobe. (a) Meltwater routes and murtoo routes are as mapped by Ahokangas et al. (2021). There is a general absence of murtoos in the centre of the lobe 40–60 km from the ice margin. (b) Sediment cover (GTK, Finland, 2010) showing thin sediment thickness in the terrain in which murtoos appear absent.

Figure A2Overwinter channels and their influence on subsequent summer drainage. (a) Modelled channels in January, model year 15 in the baseline run (black lines). Channels are present over winter in the outer two-thirds of the FLDIL. (b) Modelled channels in June of model year 15 near the start of the melt season. Note that channels in the outer two-thirds are already well established compared to those in the central third of the FLDIL. (c) Modelled channels in January of model year 2016. Note that winter channels are now visible in the central third of the FLDIL. In all panels, the background shows water pressure as a percentage of ice overburden pressure. Murtoo fields are shown as inverted black triangles. Each channel is defined as being where the median channel discharge, Qc, exceeds 1 m3 s−1.

Figure A3Median overburden%, channel discharge (Qc), and sheet discharge (qs) over the full length of the baseline model run.
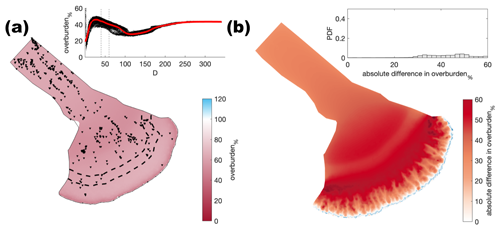
Figure A4Comparison of the median summer system for sheet conductivity ( ) against the baseline model run ( ). (a) Water pressure expressed as a percentage of overburden pressure (overburden%). Channels are shown as black lines where median discharge exceeds 1 m3 s−1. (b) Baseline median summer overburden% minus the median summer overburden%. The same figure caption applies for Figs. A4–A32.
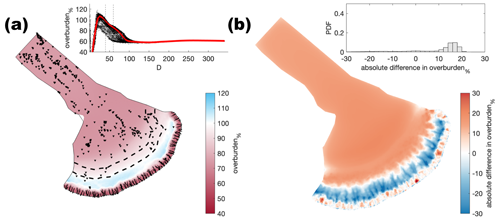
Figure A5Comparison of the median summer system for sheet conductivity ( ) against the baseline model run ( ). The same figure caption as Fig. A4 applies.
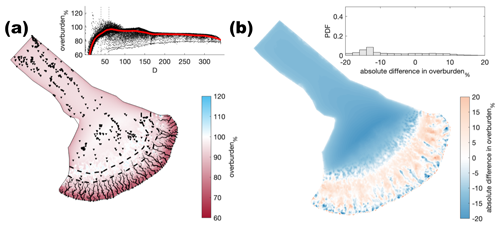
Figure A6Comparison of the median summer system for sheet conductivity ( ) against the baseline model run ( ). The same figure caption as Fig. A4 applies.
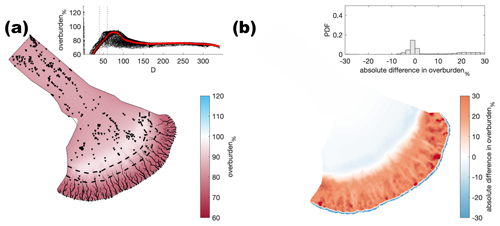
Figure A7Comparison of the median summer system for channel conductivity ( ) against the baseline model run ( ). The same figure caption as Fig. A4 applies.
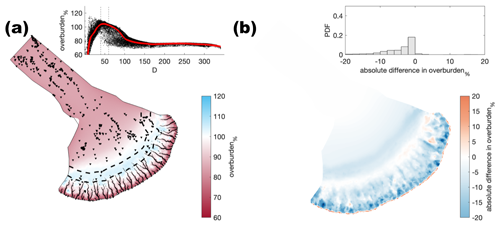
Figure A8Comparison of the median summer system for channel conductivity ( ) against the baseline model run ( ). The same figure caption as Fig. A4 applies.
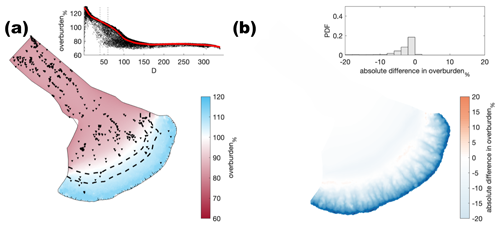
Figure A9Comparison of the median summer system for channel conductivity ( ) against the baseline model run ( ). The same figure caption as Fig. A4 applies.
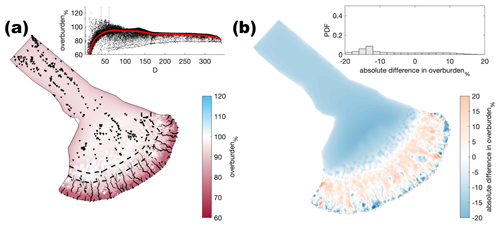
Figure A10Comparison of the median summer system for moulin frequency (Nmoulins=1000) against the baseline model run (Nmoulins=2500). The same figure caption as Fig. A4 applies.
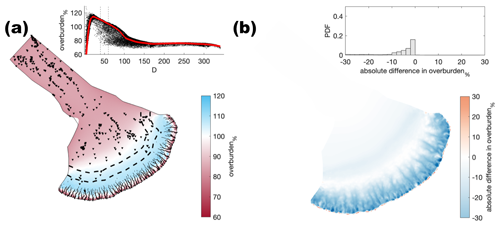
Figure A11Comparison of the median summer system for moulin frequency (Nmoulins=4000) against the baseline model run (Nmoulins=2500). The same figure caption as Fig. A4 applies.
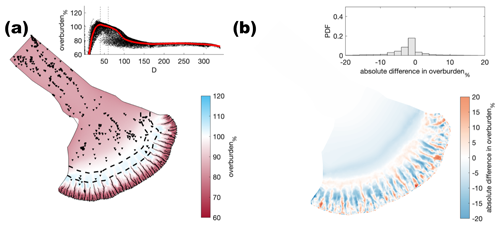
Figure A12Comparison of the median summer system where water was directly input at every node against the baseline model run (Nmoulins=2500). The same figure caption as Fig. A4 applies.
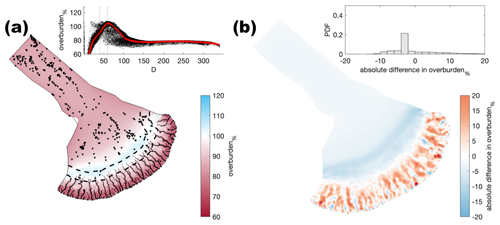
Figure A13Comparison of the median summer system for a second random distribution of moulin frequency (Nmoulins=2500) against the baseline model run (Nmoulins=2500). The same figure caption as Fig. A4 applies.
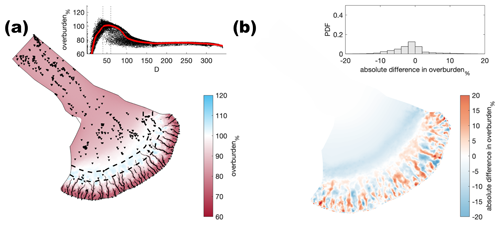
Figure A14Comparison of the median summer system for a third random distribution of moulin frequency (Nmoulins=2500) against the baseline model run (Nmoulins=2500). The same figure caption as Fig. A4 applies.
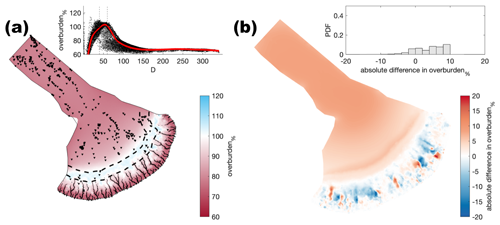
Figure A15Comparison of the median summer system for basal melt rate ( m yr−1) against the baseline model run (m yr−1). The same figure caption as Fig. A4 applies.
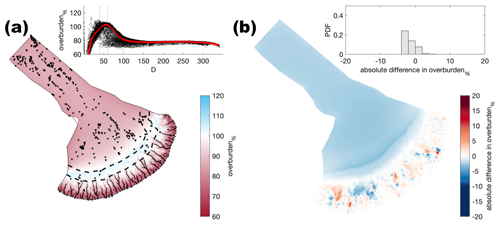
Figure A16Comparison of the median summer system for basal melt rate ( m yr−1) against the baseline model run ( m yr−1). The same figure caption as Fig. A4 applies.
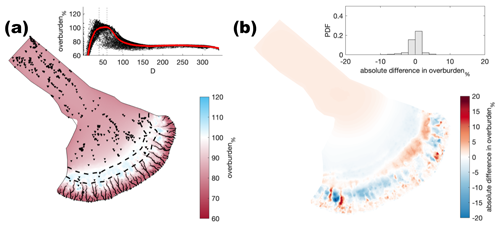
Figure A17Comparison of the median summer system for basal bump height (hr=0.1 m) against the baseline model run (hr=0.085 m). The same figure caption as Fig. A4 applies.
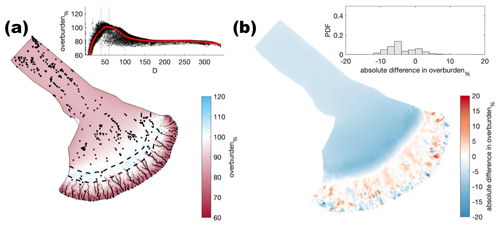
Figure A18Comparison of the median summer system for basal bump height (hr=0.05 m) against the baseline model run (hr=0.085 m). The same figure caption as Fig. A4 applies.
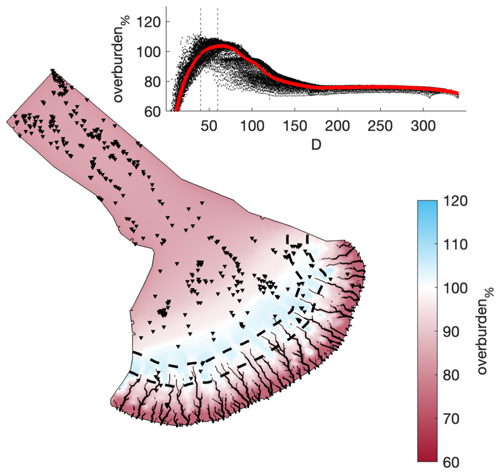
Figure A19Comparison of a mesh that is not refined with respect to elevation against the baseline model run. The same figure caption as Fig. A4 applies.
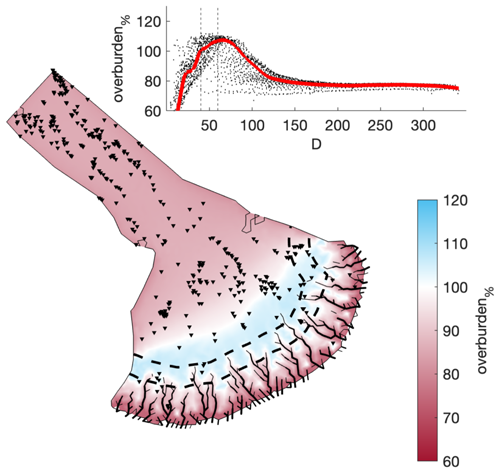
Figure A20Comparison of a coarser mesh (edge length ∼ 5 km) against the baseline model run. The same figure caption as Fig. A4 applies.
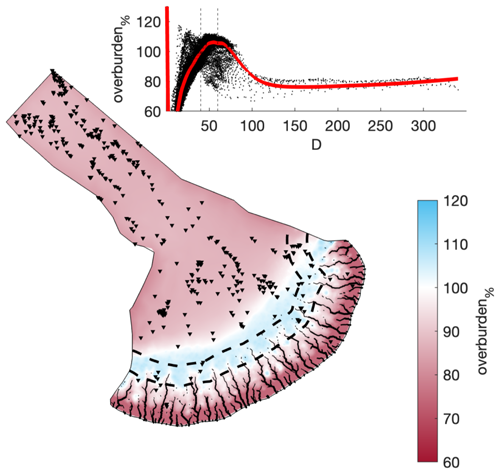
Figure A21Comparison of a refined mesh (minimum edge length ≈ 300 m) < 80 km from the ice margin against the baseline model run. The same figure caption as Fig. A4 applies.
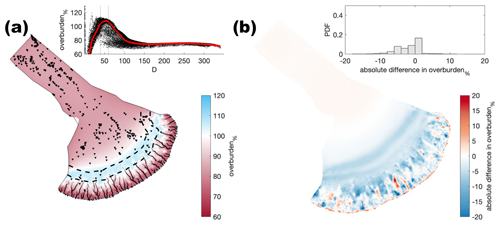
Figure A22Comparison of a flat bed against the baseline model run. The same figure caption as Fig. A4 applies.
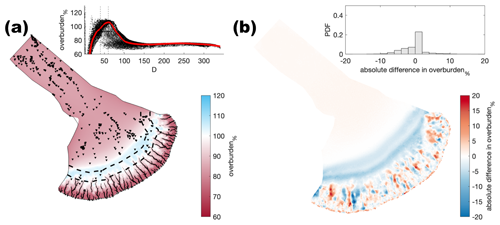
Figure A23Comparison of a modern mesh (without subtracting Quaternary sediment thickness) against the baseline model run. The same figure caption as Fig. A4 applies.
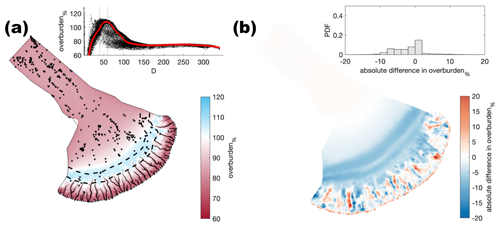
Figure A24Comparison including lake bathymetry against the baseline model run. The same figure caption as Fig. A4 applies.
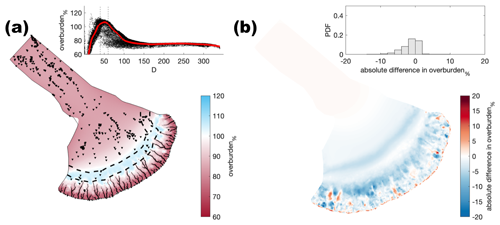
Figure A25Comparison of a 30 m deep waterbody at the ice margin boundary against the baseline model run (land-terminating). The same figure caption as Fig. A4 applies.
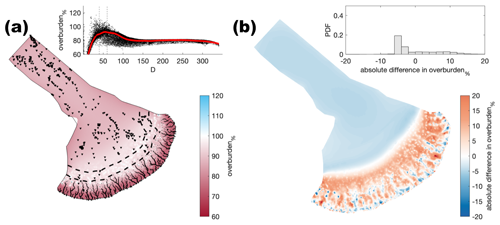
Figure A26Comparison of the median summer system for an englacial void ratio () against the baseline model run (). The same figure caption as Fig. A4 applies.
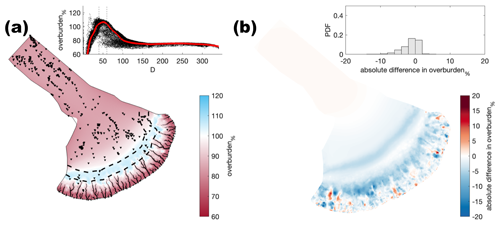
Figure A27Comparison of the median summer system for an englacial void ratio () against the baseline model run (). The same figure caption as Fig. A4 applies.
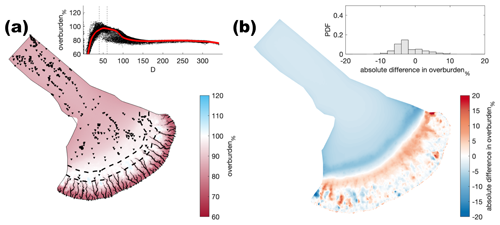
Figure A28Comparison of the median summer system for a fixed basal velocity (Ub=100 m yr−1) against the baseline model run (Ub=150 m yr−1). The same figure caption as Fig. A4 applies.
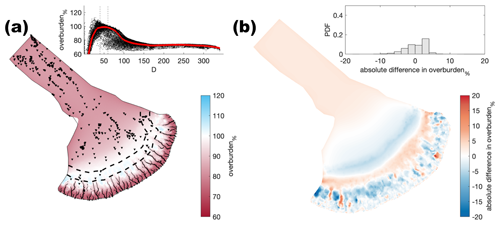
Figure A29Comparison of the median summer system for a fixed basal velocity (Ub=200 m yr−1) against the baseline model run (Ub=150 m yr−1). The same figure caption as Fig. A4 applies.
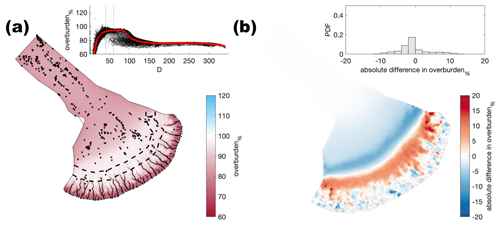
Figure A30Comparison of the median summer system for a transient basal velocity (Ub with a median Ub=150 m yr−1) against the fixed baseline model run (Ub=150 m yr−1). The same figure caption as Fig. A4 applies.
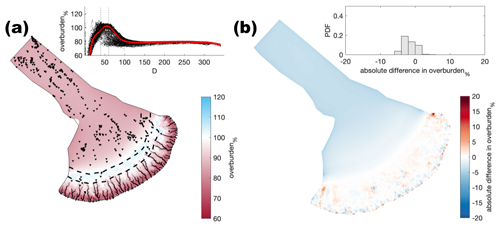
Figure A31Comparison of the median summer system for a transient basal velocity (Ub with a median Ub=100 m yr−1) against the fixed baseline model run (Ub=150 m yr−1). The same figure caption as Fig. A4 applies.
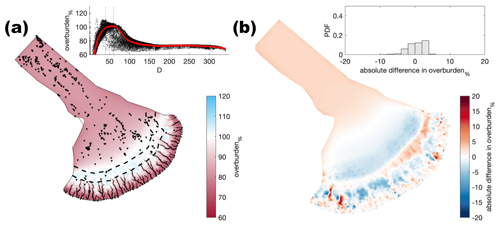
Figure A32Comparison of the median summer system for a transient basal velocity (Ub with a median Ub=200 m yr−1) against the fixed baseline model run (Ub=150 m yr−1). The same figure caption as Fig. A4 applies.
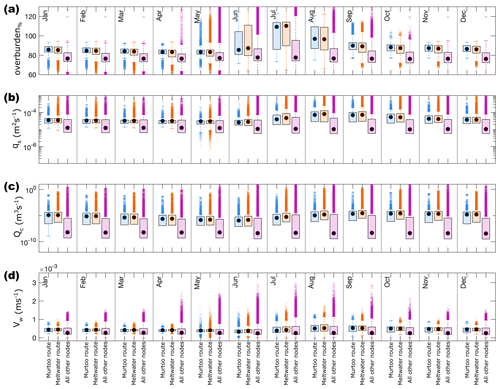
Figure A33Boxplots of model parameters grouped by month for overburden (overburden%, (a)), sheet discharge (qs, (b)), water velocity (VW, (c)), and channel discharge (Qc, (d)) during all model years at nodes between 40–60 km from the ice margin. As in Fig. 5, nodes that fall within meltwater routes (MRs) that host murtoos (murtoo-free MRs) are shown in blue, nodes which fall within mapped meltwater routes that do not contain murtoo fields (murtoo-hosting MRs) are shown in orange, and all other nodes are shown in purple. Medians for each group are shown as black circles, and “outliers” – defined as points more than 150 % of the interquartile range away from the upper and lower quartile – are shown as crosses.
Table A2Tukey–Kramer honestly significant difference (HSD) test of overburden% in meltwater routes, murtoo routes, and non-meltwater routes between 40–60 km from the ice margin. The upper and lower limits describe the 95 % confidence intervals for the true mean difference, while A–B is the difference between group means.
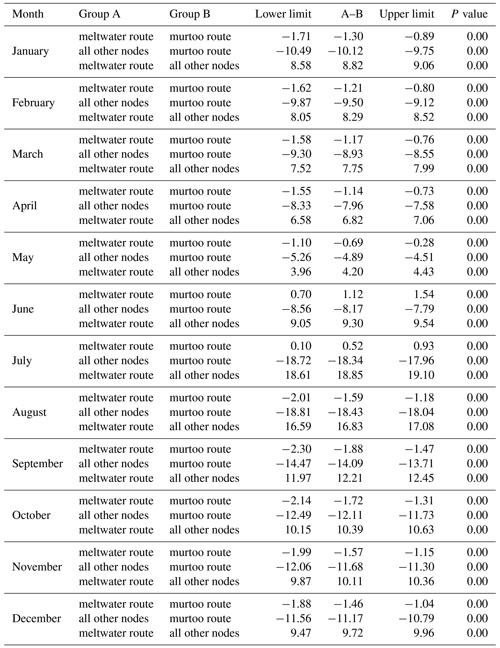
Table A3Tukey–Kramer HSD test of qs in meltwater routes, murtoo routes, and non-meltwater routes between 40–60 km from the ice margin. The upper and lower limits describe the 95 % confidence intervals for the true mean difference, while A-B is the difference between group means.
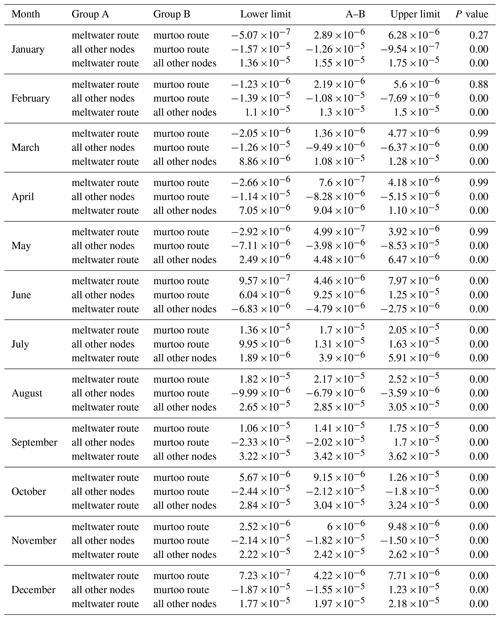
Table A4Tukey–Kramer HSD test of Qc in meltwater routes, murtoo routes, and non-meltwater routes between 40–60 km from the ice margin. The upper and lower limits describe the 95 % confidence intervals for the true mean difference, while A–B is the difference between group means.
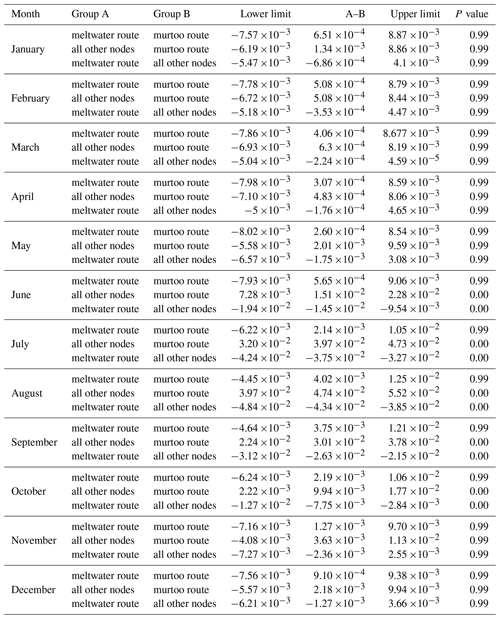
All geophysical data used to parameterize the modelling (e.g. Quaternary sediment thickness, geothermal heat flux (Veikkolainen et al., 2023), lake bathymetry (GTK, Finland, 2010), https://tupa.gtk.fi/paikkatieto/meta/maapera_200k.html#tunnistamistiedo) are available from Finnish Geological Survey's “Hakku” service (https://hakku.gtk.fi/?locale=en, last access: 9 June 2023). The Copernicus DEM used as basal elevation is available from https://doi.org/10.5270/ESA-c5d3d65 (Copernicus, 2023). For our modelling we used the Ice-sheet and Sea-level System Model (Larour et al., 2012) revision 27448 available from https://issm.jpl.nasa.gov/ (last access: 6 September 2023). Murtoo field locations from Ahokangas et al. (2021), glacial landform shapefile data from Palmu et al. (2021), model results, and the example input scripts used to produce and plot those results are available at the repository linked to this article (https://doi.org/10.5281/zenodo.8344208, Hepburn et al., 2023).
Movie A1 is available at the online repository linked to this article https://doi.org/10.5281/zenodo.8344208 (Hepburn et al., 2023).
AO, JM, and CFD conceived the study; AJH designed and carried out the study and wrote the manuscript; and all authors commented on the writing and helped with the analysis and interpretation.
The contact author has declared that none of the authors has any competing interests.
Publisher’s note: Copernicus Publications remains neutral with regard to jurisdictional claims made in the text, published maps, institutional affiliations, or any other geographical representation in this paper. While Copernicus Publications makes every effort to include appropriate place names, the final responsibility lies with the authors.
This article is part of the special issue “Icy landscapes of the past”. It is not associated with a conference.
This work forms part of the RewarD project (MUST consortium, University of Turku). All simulations were run on the Digital Research Alliance of Canada compute cluster, and we thank the European Union and the Finnish Geological Survey for enabling access to the data used to parameterize our model. We thank M. Werder for making the GlaDS model available, and we also thank Mauro Werder, Mathieu Morlighem, Justin Quinn, and Joshua Cuzzone for their help with ISSM. Finally, we thank Lev Tarasov, an anonymous reviewer, and Sarah Greenwood in particular for their comments and suggestions to improve this paper.
This research has been supported by the Research Council of Finland (grant nos. 322243 and 322252), the Canada Excellence Research Chairs, Government of Canada (grant no. 950-231237), and the European Space Agency (Internal Research Fellowship). Adam J. Hepburn is funded by a 150th anniversary Vice Chancellor's Fellowship at Aberystwyth University.
This paper was edited by Lev Tarasov and reviewed by Sarah Greenwood and one anonymous referee.
Abatzoglou, J. T., Dobrowski, S. Z., Parks, S. A., and Hegewisch, K. C.: TerraClimate, a high-resolution global dataset of monthly climate and climatic water balance from 1958–2015, Sci. Data, 5, 1–12, 2018. a
Ahokangas, E., Ojala, A. E., Tuunainen, A., Valkama, M., Palmu, J.-P., Kajuutti, K., and Mäkinen, J.: The distribution of glacial meltwater routes and associated murtoo fields in Finland, Geomorphology, 389, 107854, https://doi.org/10.1016/j.geomorph.2021.107854, 2021. a, b, c, d, e, f, g, h, i, j, k, l, m, n, o, p, q, r, s, t, u, v, w, x
Åkesson, H., Morlighem, M., Nisancioglu, K. H., Svendsen, J. I., and Mangerud, J.: Atmosphere-driven ice sheet mass loss paced by topography: Insights from modelling the south-western Scandinavian Ice Sheet, Quaternary Sci. Rev., 195, 32–47, 2018. a, b
Amon, L., Wagner-Cremer, F., Vassiljev, J., and Veski, S.: Spring onset and seasonality patterns during the Late Glacial period in the eastern Baltic region, Clim. Past, 18, 2143–2153, https://doi.org/10.5194/cp-18-2143-2022, 2022. a
Andrews, L. C., Catania, G. A., Hoffman, M. J., Gulley, J. D., Lüthi, M. P., Ryser, C., Hawley, R. L., and Neumann, T. A.: Direct observations of evolving subglacial drainage beneath the Greenland Ice Sheet, Nature, 514, 80–83, 2014. a, b
Archer, R., Ely, J. C., Heaton, T., Butcher, F. E., Hughes, A. L., and Clark, C. D.: Assessing ice sheet models against the landform record: The Likelihood of Accordant Lineations Analysis (LALA) tool, Earth Surf. Proc. Land., 48, 2754–2771, 2023. a
Banwell, A. F., Willis, I. C., and Arnold, N. S.: Modeling subglacial water routing at Paakitsoq, W Greenland, J. Geophys. Res.-Earth, 118, 1282–1295, 2013. a
Beaud, F., Flowers, G. E., and Pimentel, S.: Seasonal-scale abrasion and quarrying patterns from a two-dimensional ice-flow model coupled to distributed and channelized subglacial drainage, Geomorphology, 219, 176–191, 2014. a
Beaud, F., Flowers, G. E., and Venditti, J. G.: Modeling sediment transport in ice-walled subglacial channels and its implications for esker formation and proglacial sediment yields, J. Geophys. Res.-Earth, 123, 3206–3227, 2018. a
Bingham, R. G., King, E. C., Smith, A. M., and Pritchard, H. D.: Glacial geomorphology: towards a convergence of glaciology and geomorphology, Prog. Phys. Geogr., 34, 327–355, 2010. a
Boswell, S. M., Toucanne, S., Pitel-Roudaut, M., Creyts, T. T., Eynaud, F., and Bayon, G.: Enhanced surface melting of the Fennoscandian Ice Sheet during periods of North Atlantic cooling, Geology, 47, 664–668, 2019. a
Boulton, G. and Hagdorn, M.: Glaciology of the British Isles Ice Sheet during the last glacial cycle: form, flow, streams and lobes, Quaternary Sci. Rev., 25, 3359–3390, 2006. a
Boulton, G. and Jones, A.: Stability of temperate ice caps and ice sheets resting on beds of deformable sediment, J. Glaciol., 24, 29–43, 1979. a
Boulton, G., Lunn, R., Vidstrand, P., and Zatsepin, S.: Subglacial drainage by groundwater-channel coupling, and the origin of esker systems: part 1 – glaciological observations, Quaternary Sci. Rev., 26, 1067–1090, 2007a. a
Boulton, G., Lunn, R., Vidstrand, P., and Zatsepin, S.: Subglacial drainage by groundwater–channel coupling, and the origin of esker systems: part II – theory and simulation of a modern system, Quaternary Sci. Rev., 26, 1091–1105, 2007b. a
Boulton, G., Hagdorn, M., Maillot, P., and Zatsepin, S.: Drainage beneath ice sheets: groundwater–channel coupling, and the origin of esker systems from former ice sheets, Quaternary Sci. Rev., 28, 621–638, 2009. a, b
Braithwaite, R. J. and Olesen, O. B.: Calculation of glacier ablation from air temperature, West Greenland, in: Glacier Fluctuations and Climatic Change: Proceedings of the Symposium on Glacier Fluctuations and Climatic Change, held in Amsterdam, 1–5 June 1987, Springer, 219–233, https://doi.org/10.1007/978-94-015-7823-3_15, 1989. a
Budd, W., Keage, P., and Blundy, N.: Empirical studies of ice sliding, J. Glaciol., 23, 157–170, 1979. a
Chandler, D. M., Wadham, J. L., Lis, G. P., Cowton, T., Sole, A., Bartholomew, I., Telling, J., Nienow, P., Bagshaw, E. B., Mair, D., and Vinen, S. Evolution of the subglacial drainage system beneath the Greenland Ice Sheet revealed by tracers, Nat. Geosci., 6, 195–198, 2013. a, b, c
Chandler, D. M., Wadham, J. L., Nienow, P. W., Doyle, S. H., Tedstone, A. J., Telling, J., Hawkings, J., Alcock, J. D., Linhoff, B., and Hubbard, A.: Rapid development and persistence of efficient subglacial drainage under 900 m-thick ice in Greenland, Earth Planet. Sc. Lett., 566, 116982, https://doi.org/10.1016/j.epsl.2021.116982, 2021. a
Chu, V. W.: Greenland ice sheet hydrology: A review, Prog. Phys. Geogr., 38, 19–54, 2014. a
Clark, P. U. and Walder, J. S.: Subglacial drainage, eskers, and deforming beds beneath the Laurentide and Eurasian ice sheets, Geol. Soc. Am. Bull., 106, 304–314, 1994. a
Cofaigh, C. Ó.: Tunnel valley genesis, Prog. Phys. Geogr., 20, 1–19, 1996. a, b
Cook, S. J., Christoffersen, P., Todd, J., Slater, D., and Chauché, N.: Coupled modelling of subglacial hydrology and calving-front melting at Store Glacier, West Greenland , The Cryosphere, 14, 905–924, https://doi.org/10.5194/tc-14-905-2020, 2020. a
Cook, S. J., Christoffersen, P., and Todd, J.: A fully-coupled 3D model of a large Greenlandic outlet glacier with evolving subglacial hydrology, frontal plume melting and calving, J. Glaciol., 68, 486–502, 2022. a
Copernicus: Copernicus DEM – Global and European Digital Elevation Model, https://doi.org/10.5270/ESA-c5d3d65, 2023. a
Coughlan, M., Tóth, Z., Van Landeghem, K. J., Mccarron, S., and Wheeler, A. J.: Formational history of the Wicklow Trough: a marine-transgressed tunnel valley revealing ice flow velocity and retreat rates for the largest ice stream draining the late-Devensian British–Irish Ice Sheet, J. Quaternary Sci., 35, 907–919, 2020. a
Cuffey, K. M. and Paterson, W. S. B.: The physics of glaciers, Academic Press, https://doi.org/10.1016/C2009-0-14802-X, 2010. a
Cuzzone, J. K., Schlegel, N.-J., Morlighem, M., Larour, E., Briner, J. P., Seroussi, H., and Caron, L.: The impact of model resolution on the simulated Holocene retreat of the southwestern Greenland ice sheet using the Ice Sheet System Model (ISSM), The Cryosphere, 13, 879–893, https://doi.org/10.5194/tc-13-879-2019, 2019. a, b
Davison, B. J., Sole, A. J., Livingstone, S. J., Cowton, T. R., and Nienow, P. W.: The influence of hydrology on the dynamics of land-terminating sectors of the Greenland ice sheet, Front. Earth Sci., 7, https://doi.org/10.3389/feart.2019.00010, 2019. a
De Fleurian, B., Morlighem, M., Seroussi, H., Rignot, E., van den Broeke, M. R., Kuipers Munneke, P., Mouginot, J., Smeets, P. C., and Tedstone, A. J.: A modeling study of the effect of runoff variability on the effective pressure beneath Russell Glacier, West Greenland, J. Geophys. Res.-Earth, 121, 1834–1848, 2016. a
Dewald, N., Lewington, E. L., Livingstone, S. J., Clark, C. D., and Storrar, R. D.: Distribution, characteristics and formation of esker enlargements, Geomorphology, 392, 107919, https://doi.org/10.1016/j.geomorph.2021.107919, 2021. a, b, c
Dewald, N., Livingstone, S. J., and Clark, C. D.: Subglacial meltwater routes of the Fennoscandian Ice Sheet, J. Maps, 18, 382–396, 2022. a, b
Donner, J.: The Younger Dryas age of the Salpausselkä moraines in Finland, Bull. Geol. So. Finl., 82, 69–80, 2010. a
Dow, C. F., Werder, M. A., Nowicki, S., and Walker, R. T.: Modeling Antarctic subglacial lake filling and drainage cycles, The Cryosphere, 10, 1381–1393, https://doi.org/10.5194/tc-10-1381-2016, 2016. a, b, c
Dow, C., McCormack, F., Young, D., Greenbaum, J., Roberts, J., and Blankenship, D.: Totten Glacier subglacial hydrology determined from geophysics and modeling, Earth Planet. Sc. Lett., 531, 115961, https://doi.org/10.1016/j.epsl.2019.115961, 2020. a, b, c, d, e
Dow, C., Ross, N., Jeofry, H., Siu, K., and Siegert, M.: Antarctic basal environment shaped by high-pressure flow through a subglacial river system, Nat. Geosci., 15, 892–898, 2022. a, b, c, d, e
Dow, C. F.: The role of subglacial hydrology in Antarctic ice sheet dynamics and stability: a modelling perspective, Ann. Glaciol., 63, 49–54, https://doi.org/10.1017/aog.2023.9, 2023. a, b, c, d
Dow, C. F., Karlsson, N. B., and Werder, M. A.: Limited impact of subglacial supercooling freeze-on for Greenland ice sheet stratigraphy, Geophys. Res. Lett., 45, 1481–1489, 2018a. a, b, c
Dow, C. F., Lee, W. S., Greenbaum, J. S., Greene, C. A., Blankenship, D. D., Poinar, K., Forrest, A. L., Young, D. A., and Zappa, C. J.: Basal channels drive active surface hydrology and transverse ice shelf fracture, Sci. Adv., 4, eaao7212, https://doi.org/10.1126/sciadv.aao7212, 2018b. a, b
Dow, C. F., Werder, M., Babonis, G., Nowicki, S., Walker, R. T., Csathó, B., and Morlighem, M.: Dynamics of active subglacial lakes in Recovery Ice Stream, J. Geophys. Res.-Earth, 123, 837–850, 2018c. a
Doyle, S. H., Hubbard, B., Christoffersen, P., Young, T. J., Hofstede, C., Bougamont, M., Box, J., and Hubbard, A.: Physical conditions of fast glacier flow: 1. Measurements from boreholes drilled to the bed of Store Glacier, West Greenland, J. Geophys. Res.-Earth, 123, 324–348, 2018. a
Doyle, S. H., Hubbard, B., Christoffersen, P., Law, R., Hewitt, D. R., Neufeld, J. A., Schoonman, C. M., Chudley, T. R., and Bougamont, M.: Water flow through sediments and at the ice-sediment interface beneath Sermeq Kujalleq (Store Glacier), Greenland, J. Glaciol., 68, 665–684, 2022. a
Ehrenfeucht, S., Morlighem, M., Rignot, E., Dow, C. F., and Mouginot, J.: Seasonal acceleration of Petermann Glacier, Greenland, from changes in subglacial hydrology, Geophys. Res. Lett., 50, e2022GL098009, https://doi.org/10.1029/2022GL098009, 2023. a, b, c
Fausto, R. S., Ahlstrøm, A. P., Van As, D., and Steffen, K.: Present-day temperature standard deviation parameterization for Greenland, J. Glaciol., 57, 1181–1183, 2011. a
Felden, A. M., Martin, D. F., and Ng, E. G.: SUHMO: an adaptive mesh refinement SUbglacial Hydrology MOdel v1.0, Geosci. Model Dev., 16, 407–425, https://doi.org/10.5194/gmd-16-407-2023, 2023. a
Flowers, G. E.: Hydrology and the future of the Greenland Ice Sheet, Nat. Commun., 9, 2729, https://doi.org/10.1038/s41467-018-05002-0, 2018. a, b
Gandy, N., Gregoire, L. J., Ely, J. C., Cornford, S. L., Clark, C. D., and Hodgson, D. M.: Exploring the ingredients required to successfully model the placement, generation, and evolution of ice streams in the British-Irish Ice Sheet, Quaternary Sci. Rev., 223, 105915, https://doi.org/10.1016/j.quascirev.2019.105915, 2019. a
Gandy, N., Gregoire, L. J., Ely, J. C., Cornford, S. L., Clark, C. D., and Hodgson, D. M.: Collapse of the last Eurasian Ice Sheet in the North Sea modulated by combined processes of ice flow, surface melt, and marine ice sheet instabilities, J. Geophys. Res.-Earth, 126, e2020JF005755, https://doi.org/10.1029/2020JF005755, 2021. a
García-Ruiz, J. M., Hughes, P. D., Palacios, D., and Andrés, N.: The European glacial landscapes from the main deglaciation, in: European Glacial Landscapes, Elsevier, 243–259, https://doi.org/10.1016/B978-0-323-91899-2.00032-2, 2023. a
Gardner, A. S., Sharp, M. J., Koerner, R. M., Labine, C., Boon, S., Marshall, S. J., Burgess, D. O., and Lewis, D.: Near-surface temperature lapse rates over Arctic glaciers and their implications for temperature downscaling, J. Climate, 22, 4281–4298, 2009. a
Greenwood, S. L., Clason, C. C., Helanow, C., and Margold, M.: Theoretical, contemporary observational and palaeo-perspectives on ice sheet hydrology: processes and products, Earth-Sci. Rev., 155, 1–27, 2016. a, b, c
Greenwood, S. L., Clason, C. C., Nyberg, J., Jakobsson, M., and Holmlund, P.: The Bothnian Sea ice stream: early Holocene retreat dynamics of the south-central Fennoscandian Ice Sheet, Boreas, 46, 346–362, 2017. a
GTK, Finland: Superficial deposits of Finland 1:200 000 (sediment polygons), GTK, Finland [data set], https://tupa.gtk.fi/paikkatieto/meta/maapera_200k.html#tunnistamistiedo (last access: 9 June 2023), 2010. a, b, c
Harper, J., Meierbachtol, T., Humphrey, N., Saito, J., and Stansberry, A.: Generation and fate of basal meltwater during winter, western Greenland Ice Sheet, The Cryosphere, 15, 5409–5421, https://doi.org/10.5194/tc-15-5409-2021, 2021. a
Hayden, A.-M. and Dow, C. F.: Examining the effect of ice dynamic changes on subglacial hydrology through modelling of a synthetic Antarctic glacier, J. Glaciol., 1–14, https://doi.org/10.1017/jog.2023.65, 2023. a, b
Hepburn, A., Dow, C., Ojala, A., Mäkinen, J., Ahokangas, E., Hovikoski, J., Jukka-Pekka, P., and Kajuutti, K.: Supplementary material for Reorganisation of subglacial drainage processes during rapid melting of the Fennoscandian Ice Sheet, Zenodo [data set], https://doi.org/10.5281/zenodo.8344208, 2023. a, b
Hewitt, I. J.: Modelling distributed and channelized subglacial drainage: the spacing of channels, J. Glaciol., 57, 302–314, 2011. a, b, c
Hewitt, I. J. and Creyts, T. T.: A model for the formation of eskers, Geophys. Res. Lett., 46, 6673–6680, 2019. a
Hill, T., Flowers, G. E., Hoffman, M. J., Bingham, D., and Werder, M. A.: Improved representation of laminar and turbulent sheet flow in subglacial drainage models, J. Glaciol., 1–14, https://doi.org/10.1017/jog.2023.103, 2023. a
Hoffman, M. J., Andrews, L. C., Price, S. F., Catania, G. A., Neumann, T. A., Lüthi, M. P., Gulley, J., Ryser, C., Hawley, R. L., and Morriss, B.: Greenland subglacial drainage evolution regulated by weakly connected regions of the bed, Nat. Commun., 7, 13903, https://doi.org/10.1038/ncomms13903, 2016. a
Hooke, R. L.: Englacial and subglacial hydrology: a qualitative review, Arc. Alp. Res., 21, 221–233, 1989. a
Hovikoski, J., Mäkinen, J., Winsemann, J., Soini, S., Kajuutti, K., Hepburn, A., and Ojala, A.: Upper-flow regime bedforms in a subglacial triangular-shaped landform (murtoo), late Pleistocene, SW Finland: Implications for flow dynamics and sediment transport in (semi-) distributed subglacial meltwater drainage systems, Sediment. Geol., 454, 106448, https://doi.org/10.1016/j.sedgeo.2023.106448, 2023. a, b, c, d, e, f, g, h, i, j, k, l, m, n, o, p, q, r, s, t, u, v
Hughes, A. L., Gyllencreutz, R., Lohne, Ø. S., Mangerud, J., and Svendsen, J. I.: The last Eurasian ice sheets–a chronological database and time-slice reconstruction, DATED-1, Boreas, 45, 1–45, 2016. a
Indrigo, C., Dow, C. F., Greenbaum, J. S., and Morlighem, M.: Drygalski Ice Tongue stability influenced by rift formation and ice morphology, J. Glaciol., 67, 243–252, 2021. a, b, c
Johnsen, S. J., Clausen, H. B., Dansgaard, W., Gundestrup, N. S., Hammer, C. U., Andersen, U., Andersen, K. K., Hvidberg, C. S., Dahl‐Jensen, D., Steffensen, J. P., and Shoji, H.: The δ18O record along the Greenland Ice Core Project deep ice core and the problem of possible Eemian climatic instability, J. Geophys. Res.-Oceans, 102, 26397–26410, https://doi.org/10.1029/97JC00167, 1997. a
Kamb, B.: Glacier surge mechanism based on linked cavity configuration of the basal water conduit system, J. Geophys. Res.-Sol. Ea., 92, 9083–9100, 1987. a, b
Karlsson, N. B. and Dahl-Jensen, D.: Response of the large-scale subglacial drainage system of Northeast Greenland to surface elevation changes, The Cryosphere, 9, 1465–1479, https://doi.org/10.5194/tc-9-1465-2015, 2015. a
Karlsson, N. B., Solgaard, A. M., Mankoff, K. D., Gillet-Chaulet, F., MacGregor, J. A., Box, J. E., Citterio, M., Colgan, W. T., Larsen, S. H., Kjeldsen, K. K., and Korsgaard, N. J.: A first constraint on basal melt-water production of the Greenland ice sheet, Nat. Commun., 12, 3461, https://doi.org/10.1038/s41467-021-23739-z, 2021. a
Kazmierczak, E., Sun, S., Coulon, V., and Pattyn, F.: Subglacial hydrology modulates basal sliding response of the Antarctic ice sheet to climate forcing, The Cryosphere, 16, 4537–4552, https://doi.org/10.5194/tc-16-4537-2022, 2022. a
Kirkham, J. D., Hogan, K. A., Larter, R. D., Arnold, N. S., Ely, J. C., Clark, C. D., Self, E., Games, K., Huuse, M., Stewart, M. A., and Ottesen, D.: Tunnel valley formation beneath deglaciating mid-latitude ice sheets: Observations and modelling, Quaternary Sci. Rev., 107680, https://doi.org/10.1016/j.quascirev.2022.107680, 2022. a, b
Kirkham, J. D., Hogan, K. A., Larter, R. D., Self, E., Games, K., Huuse, M., Stewart, M. A., Ottesen, D., Le Heron, D. P., Lawrence, A., and Kane, I., Arnold, N. S., and Dowdeswell, J. A.: The infill of tunnel valleys in the central North Sea: Implications for sedimentary processes, geohazards, and ice-sheet dynamics, Mar. Geol., 467, 107185, https://doi.org/10.1016/j.margeo.2023.107185, 2024. a
Kleman, J., Hättestrand, C., Borgström, I., and Stroeven, A.: Fennoscandian palaeoglaciology reconstructed using a glacial geological inversion model, J. Glaciol., 43, 283–299, 1997. a
Kleman, J., Hättestrand, C., Stroeven, A. P., Jansson, K. N., De Angelis, H., and Borgström, I.: Reconstruction of Palaeo-Ice Sheets-Inversion of their Glacial Geomorphological Record, in: Glacier science and environmental change, 192–198, https://doi.org/10.1002/9780470750636.ch38, 2006. a, b
Larour, E., Seroussi, H., Morlighem, M., and Rignot, E.: Continental scale, high order, high spatial resolution, ice sheet modeling using the Ice Sheet System Model (ISSM), J. Geophys. Res.-Earth, 117, https://doi.org/10.1029/2011JF002140 2012 (data available at: https://issm.jpl.nasa.gov/, last access: 6 September 2023). a, b, c
Lehtinen, M., Nurmi, P. A., and Ramo, O.: Precambrian Geology of Finland, Elsevier, 117, https://doi.org/10.1029/2011JF002140, 2005. a
Lewington, E. L. M., Livingstone, S. J., Clark, C. D., Sole, A. J., and Storrar, R. D.: A model for interaction between conduits and surrounding hydraulically connected distributed drainage based on geomorphological evidence from Keewatin, Canada, The Cryosphere, 14, 2949–2976, https://doi.org/10.5194/tc-14-2949-2020, 2020. a
Livingstone, S. J., Clark, C. D., Woodward, J., and Kingslake, J.: Potential subglacial lake locations and meltwater drainage pathways beneath the Antarctic and Greenland ice sheets, The Cryosphere, 7, 1721–1740, https://doi.org/10.5194/tc-7-1721-2013, 2013a. a
Livingstone, S. J., Clark, C. D., and Tarasov, L.: Modelling North American palaeo-subglacial lakes and their meltwater drainage pathways, Earth Planet. Sc. Lett., 375, 13–33, 2013b. a
Livingstone, S. J., Storrar, R. D., Hillier, J. K., Stokes, C. R., Clark, C. D., and Tarasov, L.: An ice-sheet scale comparison of eskers with modelled subglacial drainage routes, Geomorphology, 246, 104–112, 2015. a
Lunkka, J. P. and Erikkilä, A.: Behaviour of the lake district ice lobe of the Scandinavian ice sheet during the younger dryas chronozone (ca. 12 800–11500 years ago), Tech. rep., Posiva Oy, 14, ISBN 9780080457598, 2012. a, b, c
Lunkka, J. P., Palmu, J.-P., and Seppänen, A.: Deglaciation dynamics of the Scandinavian Ice Sheet in the Salpausselkä zone, southern Finland, Boreas, 50, 404–418, 2021. a, b
MacAyeal, D. R.: Large-scale ice flow over a viscous basal sediment: Theory and application to ice stream B, Antarctica, J. Geophys. Res.-Sol. Ea., 94, 4071–4087, 1989. a
Mäkinen, J.: Time-transgressive deposits of repeated depositional sequences within interlobate glaciofluvial (esker) sediments in Köyliö, SW Finland, Sedimentology, 50, 327–360, 2003. a
Mäkinen, J., Kajuutti, K., Palmu, J.-P., Ojala, A., and Ahokangas, E.: Triangular-shaped landforms reveal subglacial drainage routes in SW Finland, Quaternary Sci. Rev., 164, 37–53, 2017. a, b, c, d
Mäkinen, J., Kajuutti, K., Ojala, A. E., Ahokangas, E., Tuunainen, A., Valkama, M., and Palmu, J.-P.: Genesis of subglacial triangular-shaped landforms (murtoos) formed by the Fennoscandian Ice Sheet, Earth Surf. Proc. Land., 48, https://doi.org/10.1002/esp.5606, 2023. a, b, c, d, e, f, g, h, i, j, k, l
Mangerud, J., Hughes, A. L., Johnson, M. D., and Lunkka, J. P.: The Fennoscandian Ice Sheet during the Younger Dryas Stadial, in: European Glacial landscapes, Elsevier, 437–452, 2023. a
Marshall, S. J. and Sharp, M. J.: Temperature and melt modeling on the Prince of Wales ice field, Canadian High Arctic, J. Climate, 22, 1454–1468, 2009. a
McArthur, K., McCormack, F. S., and Dow, C. F.: Basal conditions of Denman Glacier from glacier hydrology and ice dynamics modeling, The Cryosphere, 17, 4705–4727, https://doi.org/10.5194/tc-17-4705-2023, 2023. a
Nick, F. M., Vieli, A., Andersen, M. L., Joughin, I., Payne, A., Edwards, T. L., Pattyn, F., and van de Wal, R. S.: Future sea-level rise from Greenland’s main outlet glaciers in a warming climate, Nature, 497, 235–238, 2013. a
Nienow, P., Sole, A., Slater, D. A., and Cowton, T.: Recent advances in our understanding of the role of meltwater in the Greenland Ice Sheet system, Curr. Clim. Change Rep., 3, 330–344, 2017. a, b
Nye, J.: Water at the bed of a glacier, in: International Glaciological Society, 189–194, 1972. a
Ojala, A. E., Palmu, J.-P., Åberg, A., Åberg, S., and Virkki, H.: Development of an ancient shoreline database to reconstruct the Litorina Sea maximum extension and the highest shoreline of the Baltic Sea basin in Finland, Bull. Geol. Soc. Finl., 85, 127–144, https://doi.org/10.17741/bgsf/85.2.002, 2013. a
Ojala, A. E., Peterson Becher, G., Mäkinen, J., Johnson, M. D., Kajuutti, K., Palmu, J.-P., Ahokangas, E., and Öhrling, C.: Ice-sheet scale distribution and morphometry of triangular-shaped hummocks (murtoos): a subglacial landform produced during rapid retreat of the Scandinavian Ice Sheet, Ann. Glaciol., 60, 115–126, 2019. a, b, c, d
Ojala, A. E., Mäkinen, J., Ahokangas, E., Kajuutti, K., Valkama, M., Tuunainen, A., and Palmu, J.-P.: Diversity of murtoos and murtoo-related subglacial landforms in the Finnish area of the Fennoscandian Ice Sheet, Boreas, 50, 1095–1115, 2021. a, b, c, d, e, f
Ojala, A. E., Mäkinen, J., Kajuutti, K., Ahokangas, E., and Palmu, J.-P.: Subglacial evolution from distributed to channelized drainage: evidence from the Lake Murtoo area in SW Finland, Earth Surf. Proc. Land., 47, 2877–2896, 2022. a, b, c, d
Palmu, J.-P., Ojala, A. E., Virtasalo, J., Putkinen, N., Kohonen, J., and Sarala, P.: Classification system of superficial (quaternary) geological units in Finland, Developments in Map Data Management and Geological Unit Nomenclature in Finland, 412, 115–169, 2021. a, b, c, d, e
Patton, H., Hubbard, A., Andreassen, K., Auriac, A., Whitehouse, P. L., Stroeven, A. P., Shackleton, C., Winsborrow, M., Heyman, J., and Hall, A. M.: Deglaciation of the Eurasian ice sheet complex, Quaternary Sci. Rev., 169, 148–172, 2017. a
Peterson, G., Johnson, M. D., and Smith, C. A.: Glacial geomorphology of the south Swedish uplands–focus on the spatial distribution of hummock tracts, J. Maps, 13, 534–544, 2017. a
Peterson Becher, G. and Johnson, M. D.: Sedimentology and internal structure of murtoos-V-shaped landforms indicative of a dynamic subglacial hydrological system, Geomorphology, 380, 107644, https://doi.org/10.1016/j.geomorph.2021.107644, 2021. a, b, c, d, e, f
Poinar, K., Dow, C. F., and Andrews, L. C.: Long-term support of an active subglacial hydrologic system in Southeast Greenland by firn aquifers, Geophys. Res. Lett., 46, 4772–4781, 2019. a
Putkinen, N., Eyles, N., Putkinen, S., Ojala, A. E., Palmu, J.-P., Sarala, P., Väänänen, T., Räisänen, J., Saarelainen, J., Ahtonen, N., Rönty, H., Kiiskinen, A., Rauhaniemi T., and Tervo, T.: High-resolution LiDAR mapping of glacial landforms and ice stream lobes in Finland, Bull. Geol. Soc. Finl., 89, 64–81, https://doi.org/10.17741/bgsf/89.2.001, 2017. a, b
Rada, C. and Schoof, C.: Channelized, distributed, and disconnected: subglacial drainage under a valley glacier in the Yukon, The Cryosphere, 12, 2609–2636, https://doi.org/10.5194/tc-12-2609-2018, 2018. a
Rada Giacaman, C. A. and Schoof, C.: Channelized, distributed, and disconnected: spatial structure and temporal evolution of the subglacial drainage under a valley glacier in the Yukon, The Cryosphere, 17, 761–787, https://doi.org/10.5194/tc-17-761-2023, 2023. a
Rampton, V.: Large-scale effects of subglacial meltwater flow in the southern Slave Province, Northwest Territories, Canada, Can. J. Earth Sci., 37, 81–93, 2000. a
Regnéll, C., Mangerud, J., and Svendsen, J. I.: Tracing the last remnants of the Scandinavian Ice Sheet: Ice-dammed lakes and a catastrophic outburst flood in northern Sweden, Quaternary Sci. Rev., 221, 105862, https://doi.org/10.1016/j.quascirev.2019.105862, 2019. a
Rosentau, A., Klemann, V., Bennike, O., Steffen, H., Wehr, J., Latinović, M., Bagge, M., Ojala, A., Berglund, M., Peterson Becher, G., Schoning, K., Hansson, A., Nielsen, L., Clemmensen, L. B., Hede, M. U., Kroon, A., Pejrup, M., Sander, L., Stattegger, K., Schwarzer, K., Lampe, R., Lampe, M., Uścinowicz, S., Bitinas, A., Grudzinska, I., Vassiljev, J., Nirgi, T., Kublitskiy, Y., and Subetto, D.: A Holocene relative sea-level database for the Baltic Sea, Quaternary Sci. Rev., 266, 107071, https://doi.org/10.1016/j.quascirev.2021.107071, 2021. a
Röthlisberger, H.: Water pressure in intra-and subglacial channels, J. Glaciol., 11, 177–203, 1972. a
Schenk, F., Väliranta, M., Muschitiello, F., Tarasov, L., Heikkilä, M., Björck, S., Brandefelt, J., Johansson, A. V., Näslund, J.-O., and Wohlfarth, B.: Warm summers during the Younger Dryas cold reversal, Nat. Commun., 9, 1634, https://doi.org/10.1038/s41467-018-04071-5, 2018. a
Scholzen, C., Schuler, T. V., and Gilbert, A.: Sensitivity of subglacial drainage to water supply distribution at the Kongsfjord basin, Svalbard, The Cryosphere, 15, 2719–2738, https://doi.org/10.5194/tc-15-2719-2021, 2021. a, b
Schoof, C.: Ice-sheet acceleration driven by melt supply variability, Nature, 468, 803–806, 2010. a, b, c, d, e, f
Shackleton, C., Patton, H., Hubbard, A., Winsborrow, M., Kingslake, J., Esteves, M., Andreassen, K., and Greenwood, S. L.: Subglacial water storage and drainage beneath the Fennoscandian and Barents Sea ice sheets, Quaternary Sci. Rev., 201, 13–28, 2018. a
Sole, A., Nienow, P., Bartholomew, I., Mair, D., Cowton, T., Tedstone, A., and King, M. A.: Winter motion mediates dynamic response of the Greenland Ice Sheet to warmer summers, Geophys. Res. Lett., 40, 3940–3944, 2013. a, b
Sommers, A., Meyer, C., Morlighem, M., Rajaram, H., Poinar, K., Chu, W., and Mejia, J.: Subglacial hydrology modeling predicts high winter water pressure and spatially variable transmissivity at Helheim Glacier, Greenland, J. Glaciol., 1–13, https://doi.org/10.1017/jog.2023.39, 2022. a
Stokes, C. R., Tarasov, L., Blomdin, R., Cronin, T. M., Fisher, T. G., Gyllencreutz, R., Hättestrand, C., Heyman, J., Hindmarsh, R. C., Hughes, A. L., Jakobsson, M., Kirchner, N., Livingstone, S. J., Margold, M., Murton, J. B., Noormets, R., Peltier, W. R., Peteet, D. M., Piper, D. J. W., Preusser, F., Renssen, H., Robets, D. H., Roche, D. M., Saint-Ange, F., Stroeven, A. P., and Teller, J. T.: On the reconstruction of palaeo-ice sheets: Recent advances and future challenges, Quaternary Sci. Rev., 125, 15–49, 2015. a, b, c, d
Storrar, R. D. and Livingstone, S. J.: Glacial geomorphology of the northern Kivalliq region, Nunavut, Canada, with an emphasis on meltwater drainage systems, J. Maps, 13, 153–164, 2017. a
Stroeven, A. P., Hättestrand, C., Kleman, J., Heyman, J., Fabel, D., Fredin, O., Goodfellow, B. W., Harbor, J. M., Jansen, J. D., Olsen, L., Caffe, M. W., Fink, D., Lundqvist, J., Rosqvist, G. C., Strömberg, B., and Jannson, K. N.: Deglaciation of fennoscandia, Quaternary Sci. Rev., 147, 91–121, 2016. a
Tarasov, L., Dyke, A. S., Neal, R. M., and Peltier, W. R.: A data-calibrated distribution of deglacial chronologies for the North American ice complex from glaciological modeling, Earth Planet. Sc. Lett., 315, 30–40, 2012. a
Tedstone, A. J., Nienow, P. W., Gourmelen, N., Dehecq, A., Goldberg, D., and Hanna, E.: Decadal slowdown of a land-terminating sector of the Greenland Ice Sheet despite warming, Nature, 526, 692–695, 2015. a
Utting, D. J., Ward, B. C., and Little, E. C.: Genesis of hummocks in glaciofluvial corridors near the Keewatin Ice Divide, Canada, Boreas, 38, 471–481, 2009. a
Van Boeckel, M., Van Boeckel, T., and Hall, A. M.: Late erosion pulse triggered by rapid melt in the cold-based interior of the last Fennoscandian Ice Sheet, an example from Rogen, Earth Surf. Proc. Land, 47, 3376–3394, 2022. a
van de Wal, R. S. W., Smeets, C. J. P. P., Boot, W., Stoffelen, M., van Kampen, R., Doyle, S. H., Wilhelms, F., van den Broeke, M. R., Reijmer, C. H., Oerlemans, J., and Hubbard, A.: Self-regulation of ice flow varies across the ablation area in south-west Greenland, The Cryosphere, 9, 603–611, https://doi.org/10.5194/tc-9-603-2015, 2015. a
van den Broeke, M., Bus, C., Ettema, J., and Smeets, P.: Temperature thresholds for degree-day modelling of Greenland ice sheet melt rates, Geophys. Res. Lett., 37, https://doi.org/10.1029/2010GL044123, 2010. a
van den Broeke, M. R., Kuipers Munneke, P., Noël, B., Reijmer, C., Smeets, P., van de Berg, W. J., and van Wessem, J. M.: Contrasting current and future surface melt rates on the ice sheets of Greenland and Antarctica: Lessons from in situ observations and climate models, PLOS Climate, 2, e0000203, https://doi.org/10.1371/journal.pclm.0000203, 2023. a
Veikkolainen, T., Kukkonen, I. T., and Tiira, T.: Heat flow, seismic cut-off depth and thermal modeling of the Fennoscandian Shield, Geophys. J. Int., 211, 1414–1427, https://doi.org/10.1093/gji/ggx373, 2017 (data available at: https://hakku.gtk.fi/?locale=en, last access: 9 June 2023). a
Vérité, J., Ravier, É., Bourgeois, O., Bessin, P., Livingstone, S. J., Clark, C. D., Pochat, S., and Mourgues, R.: Formation of murtoos by repeated flooding of ribbed bedforms along subglacial meltwater corridors, Geomorphology, 408, 108248, https://doi.org/10.1016/j.geomorph.2022.108248, 2022. a, b, c, d, e
Wake, L. and Marshall, S.: Assessment of current methods of positive degree-day calculation using in situ observations from glaciated regions, J. Glaciol., 61, 329–344, 2015. a, b, c, d, e
Walder, J. S.: Hydraulics of subglacial cavities, J. Glaciol., 32, 439–445, 1986. a
Weertman, J.: General theory of water flow at the base of a glacier or ice sheet, Rev. Geophys., 10, 287–333, 1972. a
Werder, M. A., Hewitt, I. J., Schoof, C. G., and Flowers, G. E.: Modeling channelized and distributed subglacial drainage in two dimensions, J. Geophys. Res.-Earth, 118, 2140–2158, 2013. a, b, c, d, e, f, g, h, i, j, k, l, m
Wright, P. J., Harper, J. T., Humphrey, N. F., and Meierbachtol, T. W.: Measured basal water pressure variability of the western Greenland Ice Sheet: Implications for hydraulic potential, J. Geophys. Res.-Earth, 121, 1134–1147, 2016. a
Yang, K. and Smith, L. C.: Internally drained catchments dominate supraglacial hydrology of the southwest Greenland Ice Sheet, J. Geophys. Res.-Earth, 121, 1891–1910, 2016. a
Borehole measurements of overwinter water pressure in the distributed drainage system have been measured at 80 %–90 % of overburden pressure (e.g. Harper et al., 2021)
- Abstract
- Introduction
- The glaciofluvial significance of murtoos
- Study area
- Methods
- Results and discussion
- Summary and conclusions
- Appendix A: Additional model description
- Code and data availability
- Video supplement
- Author contributions
- Competing interests
- Disclaimer
- Special issue statement
- Acknowledgements
- Financial support
- Review statement
- References


