the Creative Commons Attribution 4.0 License.
the Creative Commons Attribution 4.0 License.
Characterizing southeast Greenland fjord surface ice and freshwater flux to support biological applications
Benjamin Cohen
Taryn E. Black
Kristin L. Laidre
Harry L. Stern
Ian Joughin
Southeast Greenland (SEG) is characterized by complex morphology and environmental processes that create dynamic habitats for top marine predators. Active glaciers producing solid-ice discharge, freshwater flux, offshore sea ice transport, and seasonal landfast-ice formation all contribute to a variable, transient environment within SEG fjord systems. Here, we investigate a selection of physical processes in SEG to provide a regional characterization that reveals physical system processes and supports biological research. SEG fjords exhibit high fjord-to-fjord variability regarding bathymetry, size, shape, and glacial setting, influencing some processes more than others. For example, during fall, the timing of offshore sea ice formation near SEG fjords progresses temporally when moving southward across latitudes, while the timing of offshore sea ice disappearance is less dependent on latitude. The rates of annual freshwater flux into fjords, however, are highly variable across SEG, with annual average input values ranging from ∼ 1 × 10⁸ to ∼ 1.25 × 10¹⁰ m3 (∼ 0.1–12.5 Gt) for individual fjords. Similarly, the rates of solid-ice discharge in SEG fjords vary widely – partly due to the irregular distribution of active glaciers across the study area (60–70° N). Landfast sea ice, assessed for eight focus fjords, is seasonal and has a spatial distribution highly dependent on individual fjord topography. Conversely, glacial ice is deposited into fjord systems year-round, with the spatial distribution of glacier-derived ice depending on the location of glacier termini. As climate change continues to affect SEG, the evolution of these metrics will vary individually in their response, and next steps should include moving from characterization to system projection. Due to the projected regional ice sheet persistence that will continue to feed glacial ice into fjords, it is possible that SEG could remain a long-term refugium for polar bears and other ice-dependent species on a centennial to millennial scale, demonstrating a need for continued research into the SEG physical environment.
- Article
(23990 KB) - Full-text XML
- BibTeX
- EndNote
Rapid changes across the Greenland coastal environment are influencing the linked physical and biological fjord systems. The Greenland Ice Sheet, along with peripheral glaciers and ice caps, is undergoing substantial retreat along marine- and land-terminating boundaries, revealing new oceanic and terrestrial zones (Moon et al., 2020; Kochtitzky and Copland, 2022; Bosson et al., 2023). For some marine-terminating glaciers, changing ice dynamics and terminus locations are altering iceberg calving styles or rates (e.g., van Dongen et al., 2021), which may influence glacier-derived fjord ice, which forms an important habitat for polar bears (Ursus maritimus), seals, and many other marine species (e.g., Laidre et al., 2022). Increases in ice sheet surface melt are also changing the timing and quantity of subglacial meltwater discharge and terrestrial riverine-freshwater input into the coastal fjords (e.g., van As et al., 2018). Depending on the fjord bathymetry and grounding-line depth of the glacier, this subglacial discharge may entrain deeper nutrient-rich ocean water and help redistribute it to the surface photic zone to support enhanced primary productivity (Hopwood et al., 2018; Meire et al., 2023), or it may alter the ecosystem in other potentially significant ways (e.g., Murray et al., 2015; Holding et al., 2019; Sejr et al., 2022; Hopwood et al., 2020). Additional terrestrial runoff contributes to coastal-zone freshwater (e.g., from Norway; McGovern et al., 2020), although the impacts are less well documented for Greenland (Meire et al., 2023). Despite the rapid physical changes underway, further progress is needed on the fundamental physical characterization of the Greenland coastal zone, including the remote southeast Greenland (SEG) region (Fig. 1).
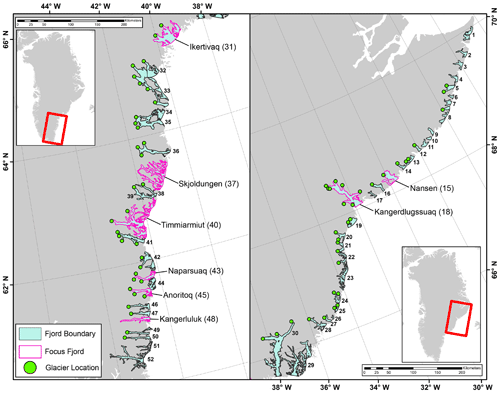
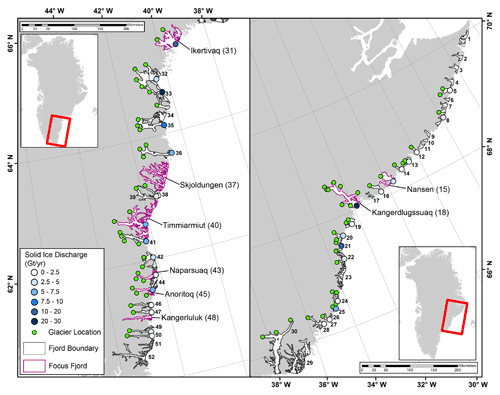
Figure 1Southeast Greenland region of study, showing the 52 fjord systems across the entire region (blue shading) and the eight focus fjords used for analyzing fast ice and glacier-derived ice (pink outlines). Locations of outlet glaciers considered in the analysis of solid-ice discharge are shown (green points).
Earlier work characterized landfast sea ice (also referred to as fast ice) and glacier-derived fjord surface ice for five SEG fjords that are biologically relevant to polar bears (Laidre et al., 2022). This research revealed that glacier-derived fjord surface ice exists during time periods outside of the landfast-sea-ice season and that this glacier-derived ice can act as an alternative habitat platform for marine species, allowing small populations to persist in areas where they may otherwise not be able to. Surface ice presence may also alter other factors, such as light availability in the water column, salinity, or ocean water mixing, which may be of interest to other biological researchers. Motivated by the biological insights enabled via enhanced physical-system knowledge, we extend our characterization of the SEG fjord physical environment. Examining the full SEG region of interest (Fig. 1), we describe the behavior of freshwater flux, offshore sea ice, and solid-glacier-ice discharge across the region from 2015 through 2019. We also expand on the five fjords used in Laidre et al. (2022) to include eight focus fjords across SEG (Fig. 1; Table 1). For these focus fjords, we analyze the presence of landfast sea ice and glacier-derived ice in time and space and compare the results with offshore sea ice from satellite observations, as well as freshwater flux, sea surface temperature, and sea ice cover from a regional climate model. Our results are designed to expand the knowledge of SEG fjord environments and complement ongoing and future research into the linked physical and biological systems of the region.
While some fjords, such as Sermilik on the east coast and Nuup Kangerlua (previously also known as Godthåbsfjord) on the west coast, have been studied more extensively, many Greenland fjords, including those in southeast Greenland (SEG), have proven difficult to study. Here, we define the SEG region of interest as extending from 60 to 70° N (Fig. 1). This region is of particular interest for a variety of reasons. First, it provides a habitat for a genetically distinct polar bear subpopulation that was only recently identified (Laidre et al., 2022). Second, it contains particularly remote regions of the Greenland coastline that are far from any human settlements and difficult to access for research. Third, it is an area of very high levels of winter precipitation (Gallagher et al., 2022), and modeling work indicates that it may be one of the last regions in Greenland to retain substantial coastal land ice (Aschwanden et al., 2019; Bochow et al., 2023). Fourth, it is a region of rapid change, not only with respect to documented changes in coastal glaciers and ice sheets (Moon et al., 2020) but also regarding notable declines in offshore sea ice and the warming of coastal ocean currents (Heide-Jørgensen et al., 2022).
In this study, the fjords in SEG are numbered from 1–52 from north to south (Fig. 1). We also use our own digitized fjord boundaries, created based on synthetic-aperture-radar (SAR) image mosaics (Cohen et al., 2024; see the “Code and data availability” section). Our analysis focuses on 1 January 2015 through 31 December 2019 to align with SEG polar bear data collection and the time period of interest established by Laidre et al. (2022).
To characterize a range of environmental metrics, we take advantage of existing data products, such as those for freshwater flux, solid-ice discharge, and regional-climate-model output, to create new datasets that support SEG-wide analysis. While remote sensing is necessary to characterize a region of this scale, the spatial resolution needed (tens to hundreds of meters) for some data types is difficult to achieve with many standard remote sensing products, such as sea ice cover data products (which often have a multikilometer resolution). Though researchers are working toward automated classification schemes at the spatial scales needed for this type of analysis (e.g., Scheick et al., 2019; Soldal et al., 2019), we are unaware of any that can support our specific study needs. We therefore conducted extensive manual digitization to create data records for landfast sea ice and glacier-derived fjord ice. Along with supporting our analysis, these data (Cohen et al., 2024) should be helpful for ongoing work aiming to improve machine learning techniques for classifying fjord environments.
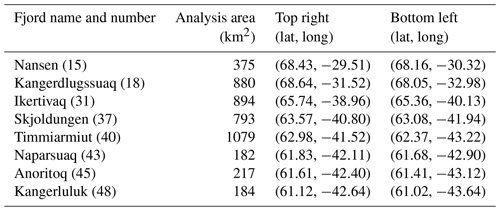
Due to the effort required to create manually digitized datasets, we selected eight focus fjords for our analysis of landfast sea ice and glacier-derived fjord ice (Fig. 1; Table 1). Our focus fjords include five that were selected by Laidre et al. (2022): Skjoldungen (63.3° N), Timmiarmiut (62.6° N), Naparsuaq (“Napasorsuaq” in the literature; 61.7° N), Anoritoq (61.5° N), and Kangerluluk (61.1° N). These fjords have been occupied by polar bears for multiple years, according to telemetry data collected since 2015, and comprise the core range of the SEG polar bear population. Here, we expand the fjord selection to include three more northerly fjords: Ikertivaq (65.4° N), Kangerdlugssuaq (68.1° N), and Nansen (68.2° N). Ikertivaq and Kangerdlugssuaq are heavily used by polar bears that inhabit northeast Greenland, while their presence was scarcer in Nansen during 2015–2019. No data on glacier-based solid-ice discharge are included in our source dataset for Skjoldungen (fjord 37) and Kangerluluk (fjord 48) (see Sect. 3.1), but we include these fjords to be able to analyze a wide range of fjord environments with varying levels of glacier-derived-ice input and polar bear use (which informed this research design), and we also digitize some data on glacier-derived ice from these two fjords (see Sect. 3.5). The map view geometries of our focus fjords (Fig. 1) cover a wide range, from relatively simply shaped, long, narrow fjords (e.g., fjords 43 and 48) to complex interconnected channel systems (e.g., fjords 37 and 40).
Table 1Spatial information for the focus fjords, including fjord reference names and numbers, areas (km2), and bounding coordinates used for analysis.
3.1 Solid-ice discharge across SEG
To compute solid-ice discharge from 2015 through 2019, we used data derived from glacier gates (Mankoff et al., 2020b, c). These data were used to create individual glacier discharge time series as well as discharge records categorized by fjord, including daily, monthly, annual, and seasonal records for mean and cumulative 2015–2019 discharge (Black, 2024; Cohen et al., 2024). Beginning with a glacier dataset evolved from Moon et al. (2020), we manually associated each of these glaciers (shown in Fig. 1) with a glacier gate from the Mankoff et al. (2020b) solid-ice-discharge dataset; in some cases, multiple gates corresponded to a single glacier, and we summed the discharge from these gates accordingly. We filtered out data at points when the dataset coverage attribute was less than 50 % (Mankoff et al., 2020b). We also note that some glaciers visible in satellite imagery are not included in either the Moon et al. (2020) dataset or the Mankoff et al. (2020b) dataset (usually because they are narrow and/or slow-moving) and are therefore not included in our solid-ice-discharge results, even though glacier-derived ice in fjords is recorded in a separate dataset (Sect. 3.5). The availability of solid-ice-discharge observations is visualized in Fig. A1.
Solid-ice discharge is interpolated for individual glaciers to create daily time series. We linearly interpolate between observed discharge values to fill data gaps and use the observed discharge and error to calculate the interpolation error (Eq. 15; White, 2017). At the fjord level, the interpolated daily discharge time series for each glacier are summed together, and the fjord discharge error is the root of the sum of the squares of the glacier discharge errors. The daily time series are then used to construct other solid-ice-discharge metrics, including a monthly time series, as displayed in Fig. 9d.
To construct the daily time series, the ice discharge interpolation uses data from 180 d before and after our time period of interest to ensure a complete daily record for our time period of interest. Two glaciers provide no data for these pre- and post-study periods (as well as for several years prior), leading to a small discrepancy at the record edges since we are not able to interpolate the records for periods without sufficient input data. In other words, the two glaciers were likely discharging, but discharge observations were either absent or filtered out for quality, meaning the first or last several days in the interpolated time series for these glaciers are empty. The resulting discrepancy between the cumulative discharge from all glaciers and the cumulative discharge from all fjords is 3.8 Gt (or 0.39 %).
3.2 Freshwater flux across SEG
To compute daily time series for freshwater discharge into each fjord from 2015 through 2019, we used freshwater discharge data, including surface runoff and subglacial discharge, from Greenland land and ice basins (Mankoff, 2020a; Mankoff et al., 2020a). We discuss freshwater as defined by these data, which allocate regional-climate-model runoff estimates to ice and coastal outlets. These freshwater flux data exclude contributions from evaporation, condensation, sea ice formation and melt, subglacial basal melt, and precipitation directly onto the ocean surface. Small peripheral glaciers may also be excluded from the regional-climate-model domain, although such glaciers are scarce in our region of interest. Our freshwater flux analysis also excludes “in-fjord” glacier-derived ice melt, which, in some fjords, may be a meaningful year-round source of freshwater, particularly at the surface and within the ocean mixed layer (Enderlin et al., 2018; Moon et al., 2017). The importance of in-fjord glacier-derived ice melt is highly variable across SEG due to large variation in the presence of glacier-derived ice. For subglacial basal melt, omitted fluxes are dependent on the features of the glacier basins that contribute to each fjord (e.g., basin size, ice motion, and subglacial hydrology). While the dataset presented here represents a step forward from recently published freshwater flux values for marine-terminating glaciers (Karlsson et al., 2023) by providing an integrated fjord perspective and including fluxes from all ice sheets and terrestrial basins, it does not include subglacial basal melt, which is available in Karlsson et al. (2023). Future work could create a regional or pan-Greenland dataset that includes more freshwater flux sources and thus advances the provision of a freshwater dataset without exclusions – for example, by including additions from subglacial melt analyzed across the ice sheet (Karlsson et al., 2021) or marine-terminating glaciers (Karlsson et al., 2023). Previous research suggests that pan-Greenland basal melt, driven by geothermal heat flux, basal friction, and heat from transported surface meltwater, corresponds to 4.5 % of annual solid-ice discharge but can be a much larger contributor in marine-terminating glacier basins, where these drivers are enhanced (Karlsson et al., 2021).
The freshwater discharge data products used and presented here were created by applying a flow-routing algorithm to digital elevation models of the land and ice sheet surfaces and the ice sheet bed to identify land surface and subglacial streams, stream outlets, and basins upstream of these outlets. Subsequently, daily runoff from a regional climate model was summed over each of the identified basins and instantaneously routed to the appropriate basin outlets. We calculated the freshwater discharge into our fjords using a command line tool provided by Mankoff et al. (2020a) to identify all outlets within a 500 m buffer of each fjord boundary; we applied this buffer to account for differences in coastline data products and to ensure that we captured all freshwater discharge outlets. We then used the command line tool to compute the daily freshwater discharge that originates from the predefined land and ice basins and flows through the identified outlets into each of our fjord basins. We used discharge values from the Modèle Atmosphérique Régional (MAR; Fettweis et al., 2017) and the Regional Atmospheric Climate Model (RACMO; Noël et al., 2019), both of which were statistically downscaled to a common 1 km grid and archived for use with these freshwater discharge tools (Mankoff, 2020a); we used version 4.2 of the archival data. Due to the longer time series and to align with other sampled metrics, we relied primarily on the MAR time series, but we included the RACMO discharge output in our own archival data (Black, 2024; Cohen et al., 2024).
We also analyzed freshwater discharge variations with depth, including terrestrial runoff and subglacial discharge. We used the same command line interface and source data (Mankoff et al., 2020a) to identify all freshwater discharge outlets within each buffered fjord boundary. These outlet output data include data on outlet elevation above or below sea level. For outlets above sea level, we clipped the elevation values to 0 m under the assumption that water flowing from these outlets enters the fjords at sea level (i.e., surface runoff). Using these data, we calculated daily time series of total freshwater discharge, binned by discharge depth, for each fjord (for example, Fig. 9c).
3.3 Sea ice and sea surface temperature
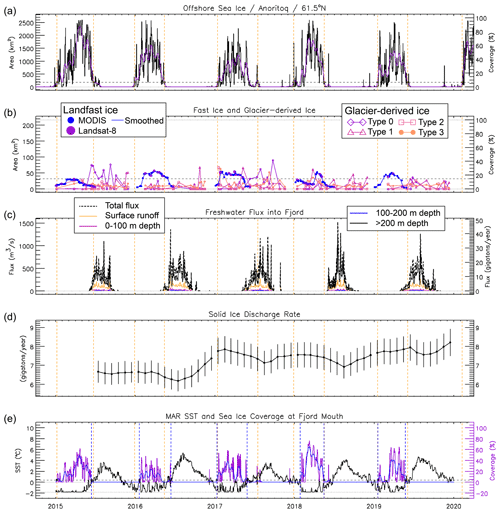
To characterize the offshore sea ice at the mouths of the fjords, we used sea ice concentration data derived from the passive microwave instrument (AMSR2; Advanced Microwave Scanning Radiometer 2) aboard the GCOM-W (Global Change Observation Mission – Water) satellite, operated by the Japan Aerospace Exploration Agency (Kaleschke and Tian-Kunze, 2016). The brightness temperature data were processed at the University of Hamburg using the ARTIST Sea Ice (ASI) algorithm (Beitsch et al., 2014) to create daily gridded fields of sea ice concentration with a nominal grid cell size of 3.125 × 3.125 km. We defined circles with a radius of 50 km, centered at the mouths of the fjords (Fig. 2a). Within each circle, we identified the offshore grid cells, excluding a buffer zone of three grid cells from land because the sea ice signal in such cells may be contaminated by the signal from land (Fig. 2b). We then calculated the daily sea ice area for the valid grid cells within each circle during 2015–2019. Figure 9a shows an example in which the black curve represents the daily sea ice area and the purple curve represents the 31 d running mean. We defined a threshold equal to 15 % of the mean March–April sea ice area (horizontal dotted black line) and found the dates for each year when the 31 d running mean crossed the threshold (vertical dashed yellow lines). The date in the spring marking when the sea ice area drops below the threshold before reaching the summer minimum is called the spring transition date; the date in fall marking when the sea ice area climbs above the threshold before reaching the winter maximum is called the fall transition date. The transition dates for all fjords and years are shown in Fig. 6.
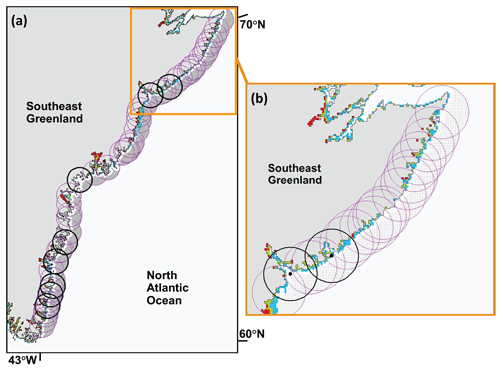
Figure 2Regions at the mouths of (a) fjords 1–52 and (b) fjords 1–19 (indicated by circles with a radius of 50 km) used to analyze offshore sea ice. The small black dots indicate the locations of gridded sea ice concentration data from AMSR2. The grid cell size is approximately 3.125 × 3.125 km. A buffer zone of three grid cells from land is excluded from the analysis due to land contamination of the ocean data. This contamination can be seen in the form of spurious sea ice (red, green, and blue cells) for 2 October 2013, when sea ice is almost certainly not present along this portion of the coast. The black circles are associated with the focus fjords of this study.
To include further comparison metrics for sea ice coverage and sea surface temperatures at the fjord mouth, we sampled outputs from MAR v3.12 (Fettweis et al., 2017). MAR results have a grid resolution of 6.5 km, and we sampled a single grid cell centered at the fjord mouth, which we extracted based on fjord mouth outlines created as part of developing the SEG fjord boundaries (e.g., Fig. 1; Cohen et al., 2024). The MAR FRA variable identifies open-water and sea ice cover percentages, while the ST2 variable provides the sea surface temperature (SST) for open-water and sea ice surfaces. These variables are used together to determine the percentage sea ice cover and the SST for the open-water fraction. MAR has a hard-coded maximum sea ice cover of 95 %, which we retain in our plotted results (e.g., Fig. 9e). Note that MAR assimilates SST and sea ice cover data from ERA5, available at a resolution of 0.3 × 0.3° (Hersbach et al., 2020).
3.4 Landfast sea ice for the eight focus fjords
To analyze landfast sea ice, we combined data extracted from imagery from the Operational Land Imager (OLI) aboard the USGS Landsat-8 satellite with data extracted from images captured by the Moderate Resolution Imaging Spectroradiometer (MODIS) instruments aboard the NASA Aqua and Terra satellites. There are notable differences between the two datasets: Landsat-8 imagery provides a higher spatial resolution (30 m) but a lower temporal resolution (16 d repeat cycle for each image footprint), while MODIS imagery has a lower spatial resolution (250 m) but a higher temporal resolution (daily). Clouds and polar night limit the functional temporal resolution of both Landsat-8 and MODIS imagery as the two satellites operate using optical sensors.
The suitability of each image obtained from 1 January 2015 through 31 December 2019 in the region of interest was manually inspected for use in our analysis. MODIS imagery was obtained from the NASA Worldview website (https://worldview.earthdata.nasa.gov, last access: January 2022), and we downloaded “Corrected Reflectance (True Color)” images that were determined to be cloud-free (Fig. 3a). We used the USGS EarthExplorer web tool (https://earthexplorer.usgs.gov, last access: March 2022) to preview all available Landsat-8 imagery and evaluate cloud cover (using a starting filter with 90 % cloud cover). We downloaded cloud-free Collection-1 Level-1 data (Fig. 3a), and we created multiband natural-color images using bands 4, 3, and 2. We used the R “stack” tool included in the “raster” package (https://cran.r-project.org/web/packages/raster/raster.pdf, last access: March 2022) and the “Composite Bands (Data Management)” tool in ArcGIS to produce these composites. These composite imagery datasets were catalogued and served as the foundation for further analysis.
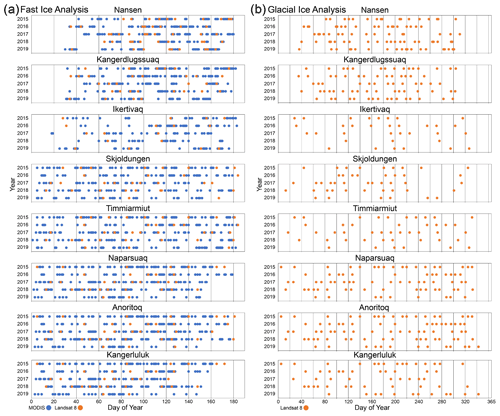
Figure 3Availability of quality imagery data used for analysis during 2015–2019 for (a) landfast-ice analysis from MODIS and Landsat-8 covering days 0–180 and (b) glacial-ice analysis from Landsat-8 images covering the full year.
Glacial ice, landfast ice, and pack ice share similar visual characteristics and are often adjacent to or intermixed with one another within SEG fjords. Larger fjord systems, where active glaciers introduce glacial ice and large fjord mouths facilitate the accretion of pack ice inside fjords during the frozen season, are especially likely to contain a mixture of ice types. This is compounded by the intricate geometry of these fjord systems, in which narrow corridors or tortuous coastlines entrap ice of various types. Thus, we worked to distinguish landfast ice from glacier-derived ice, open water, and pack ice floes (Fig. 4). By having one person complete the entirety of the visual digitization process, we attempted to reduce the potential sensitivity of our manual analysis procedure.
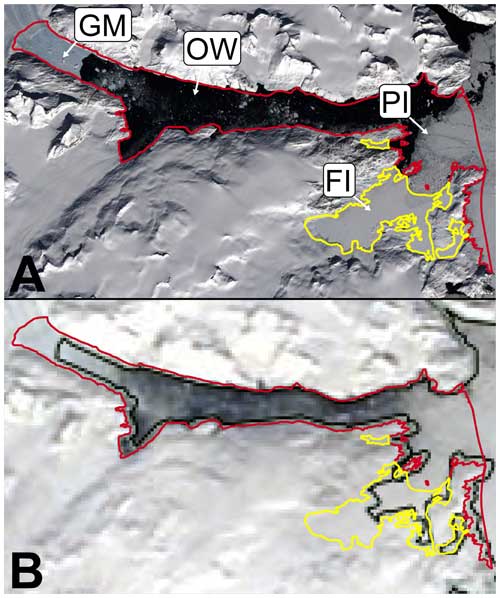
Figure 4Example of landfast-ice digitization. (a) Landsat-8 and (b) MODIS image examples for Anoritoq (both from 7 April 2017). Yellow outlines indicate the fast-ice areas, and red lines indicate the rest of the fjord boundary. Note the distinct visual characteristics of the glacial mélange (GM), open water (OW), fast ice (FI), and pack ice (PI), as indicated in panel (a). The misplacement of the coastline in the standard MODIS product is also apparent and is shown in panel (b). We use our own fjord boundary product for analysis. The figure was reproduced from Laidre et al. (2022).
Several visible characteristics in Landsat-8 imagery facilitated the identification of landfast ice: a smooth surface texture (especially relative to glacier-derived ice), a bright surface character, image-to-image persistence, and adhesion to coastal boundaries. Landfast ice is more challenging to distinguish in lower-resolution MODIS imagery, where pixel color was the most useful identifier along with image-to-image persistence. Several smaller regions in our study area were poorly resolved by MODIS imagery, resulting in varying optical properties (e.g., color, saturation, and brightness) for otherwise consistent ice surface characteristics. To address this issue, the higher-resolution Landsat-8 imagery was analyzed first, providing landfast-ice boundaries with a higher level of accuracy on the dates when those images were available. The MODIS imagery was processed afterward using the results of the Landsat-8 analysis as a guide for the characterization of the MODIS imagery. This facilitated increased accuracy of digitization within areas of ambiguous interpretation (as described below).
To quantify the degree of error introduced using MODIS imagery when Landsat-8 imagery was unavailable, we digitized 25 MODIS images (one image from 2015–2019 for Skjoldungen, Timmiarmiut, Naparsuaq, Anoritoq, and Kangerluluk) that were captured on the same dates as the Landsat-8 images already analyzed. We found a mean difference of 1.2 km2 in the fast-ice area when comparing the results of the MODIS and Landsat-8 digitizations, along with a standard deviation of 12.6 km2. These levels of disagreement have no significant impact on our conclusions.
Based on early results, landfast-sea-ice boundaries were analyzed from 1 January until either 1 July or the point when ice-free conditions were reached (whichever came first) from 2015 through 2019. We digitized one Landsat-8 image from 2 July 2016 for fjords 37 and 40 as it showed end-of-season landfast-ice-melt conditions at a high resolution and allowed us to establish the existence of ice-free conditions within 24 h of our primary target period. We manually delineated the landfast-ice boundaries for each available image. Based on visual analysis, we traced the landfast-ice boundaries (without regard to the fjord edge boundary) and recorded the date and source of the image. Any portions of the resulting polygons outside the fjord boundaries were erased using the “Clip (Analysis)” tool in ArcGIS, which resulted in fjord surface measurements of landfast-ice area and percentage coverage. This method precluded repetitive and time-consuming fjord boundary tracing, allowing for more rapid digitization of landfast ice.
After calculating the landfast-ice area in a fjord system from all available imagery within a single year, we applied a moving average to obtain a smooth representation of the formation and breakup of landfast ice. The moving average on day t is calculated using weights proportional to , where Δt is the number of days from t to other data points and T is a timescale equal to 7 d. To demonstrate the likelihood of landfast-ice presence in any given spatial region across all observations, we also produced heatmaps of landfast-sea-ice presence (panels a and c in Figs. 10–13) by overlaying all individual spatial-occurrence maps and applying a gradient of shading (with a grid cell size of 50 m × 50 m).
3.5 Glacier-derived ice for the eight focus fjords
To analyze glacier-derived ice, we again used USGS Landsat-8 data imagery (following the methods outlined in Sect. 3.4). The low spatial resolution of MODIS imagery made it unsuitable for this analysis. Because glacial ice has a year-round presence, we analyzed glacial-ice presence from 1 January to 31 December for each year (Fig. 3b).
We characterized glacier-derived ice using four primary categories (Fig. 5; Table 2): a spatially dense glacial-ice mélange (type 3); moderately high-spatial-density, mixed-size glacier-derived ice with large icebergs (type 2); low-spatial-density glacier-derived ice with large icebergs (type 1); and consistently small ice surfaces without large icebergs (type 0) – we also used a “type-99” classification for glacier ice that had not yet been calved. To measure the temporal and spatial distribution of glacier-derived ice in SEG, we analyzed the optical satellite imagery from Landsat-8 using the same ArcGIS 10.8 method as that described for landfast sea ice, applying it to each glacier-derived ice type (Table 2). For the heatmaps of glacial-ice presence (panels b and d in Figs. 10–13), we combined the spatial extents for type-2 and type-3 glacier-derived ice. This approach was motivated by the assessment that type-2 and type-3 glacier-derived surface ice can be more feasibly used as polar bear habitat platforms (e.g., Laidre et al., 2022).
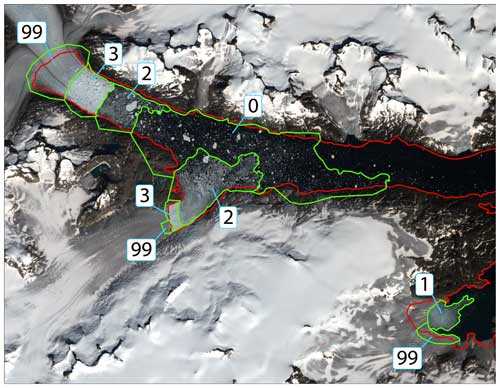
Figure 5Example of glacial-ice digitization for Anoritoq (fjord 45). Landsat-8 background image (1 August 2015) showing the fjord boundary (red outline) and the digitized zones of different glacier-derived ice types on the fjord surface (green outlines with the type indicated). The ice types comprise type 3 (a dense glacial mélange), type 2 (mixed glacier-derived ice), type 1 (small glacier-derived ice), type 0 (highly dispersed glacier-derived ice), and type 99 (glacier surfaces) (see Table 2). The boundaries are combined to determine the final values for the glacier-derived ice area.
This study includes datasets that cover southeast Greenland and metrics assessed only for the eight focus fjords. This supports some SEG region-wide analyses and further analysis to include more ocean surface ice metrics for the eight focus fjords. Along with providing a more complete picture of the SEG environment, these results can support ongoing research into the current and future biological uses of SEG coastal fjords.
4.1 Regional-scale observations
Datasets for offshore sea ice, freshwater flux, and solid-ice discharge support an examination of conditions across the full SEG region of interest.
4.1.1 Offshore sea ice
Figure 6 shows the spring and fall transition dates for offshore sea ice at each fjord. First, while there is substantial year-to-year variability in the spring transition dates, which range from May to early August, there is little variability with latitude for a given year. In other words, offshore sea ice tends to disappear from the coast of SEG in spring over a relatively short time interval across all latitudes, but the timing of this disappearance varies from year to year. Second, the arrival of offshore sea ice in fall has a narrower range of interannual variability, but there is a distinct dependence on latitude, with sea ice arriving in October at the more northerly fjords and in January or early February at the more southerly fjords. The different nature of the spring and fall transition dates may be due to the relative influence of thermodynamics vs. dynamics. In spring, rising temperatures along the coast may melt the sea ice at more or less the same time across all latitudes. But in fall, the arrival of sea ice is caused by transport from the north (via the East Greenland Coastal Current) rather than by freezing in place. A sea ice “front” progresses from north to south every fall at a speed of roughly 10 km d−1 (Fig. 6). Note that previous research identified that sea ice along the SEG coast had a mean wintertime (January–April) south-moving speed of about 15 cm s−1 (13 km d−1) from 2010 to 2018 (Laidre et al., 2022). In spring, sea ice does not retreat along a well-defined front. Though the seasonal coverage and concentration of offshore sea ice during our study period are reduced compared to earlier decades (Heide-Jørgensen et al., 2022) and are expected to continue to shorten and decline, respectively (Kim et al., 2023), we suggest that differences in spring and fall transitions may largely persist (while sea ice continues to form).
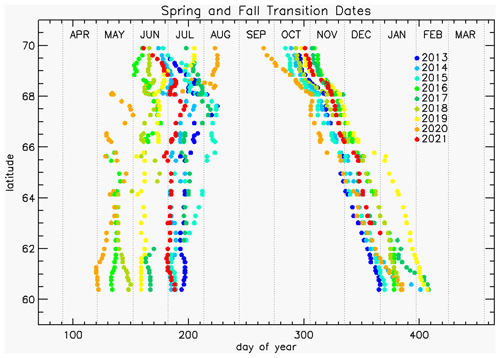
Figure 6Spring and fall transition dates for offshore sea ice with respect to all fjords (organized by latitude) and years (indicated by color), based on a 15 % coverage threshold.
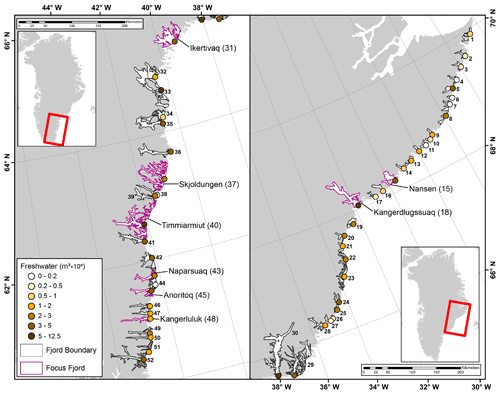
Figure 7Mean total annual freshwater flux (measured in m3 × 109 m3) from 2015 through 2019. The freshwater discharge is summed for the entire fjord, including meltwater originating from ice-covered and terrestrial areas (sourced from Mankoff (2020a) and Mankoff et al. (2020a)). Note that for freshwater, a volume of 1 m3 × 109 is equivalent to a weight of 1 Gt.
4.1.2 Freshwater flux
Figure 7 shows freshwater flux at the fjord scale across SEG. The results show significant variability, ranging from a low total annual discharge of ∼ 1 × 10⁸ m3 (∼ 0.1 Gt) at fjords 6 and 44 to a higher total annual discharge of ∼ 1.25 × 10¹⁰ m3 (∼ 12.5 Gt) at Sermilik (fjord 30); however, notably, the next largest fjord freshwater fluxes only amount to 8.48 × 10⁹ m3 (8.48 Gt) at Kangerdlugssuaq (fjord 18) and 7.12 × 10⁹ m3 (7.12 Gt) at Jens Munk (fjord 33). In the northern region of SEG, the catchment geography feeds much of the freshwater to fjord 5, while other fjords in this zone receive minimal freshwater flux, which remains the case until the southern fjords, i.e., fjord 15 and subsequently fjord 18 (Kangerdlugssuaq), are reached. There is low to moderate flux for most fjords numbered between 18 and 30 (Sermilik), with a notable increase in mean annual freshwater flux for a number of fjords south of Sermilik.
Using discharge elevation/depth, we were also able to assess how much freshwater was entering fjords at the ocean surface or at depth, discharging from under marine-terminating glaciers. Across the SEG study region, ocean surface input and 0–20 m depth bins receive the most input when considering flux from sea level to 1000 m depth (Fig. A2). Across the region, flux totals are highest within the top 100 m. While flux is measured as deep as 900 m (fjord 31, i.e., Ikertivaq), most flux occurs at depths shallower than 600 m. Strong seasonal variability in freshwater flux is also apparent (e.g., Fig. 9c). Detailed individual fjord plots are available via our research code (see the “Code and data availability” section).
4.1.3 Solid-ice discharge
Figure 8 shows annual solid-ice-discharge estimates. We used a fjord-scale perspective to examine solid-ice discharge and relied on the availability of glacier-based solid-ice-discharge data from Mankoff et al. (2020b, c). Because of this, our solid-ice-discharge values may underestimate discharge or provide no data for fjords in which some glacier-derived ice is variably present. For example, the source dataset contains no glacier discharge data for Skjoldungen despite the fact that glacier ice inputs are apparent in our satellite image analysis (Figs. A5 and 11d). Within the fjord dataset that we were able to create (Fig. 8), fjords north of Sermilik have relatively small annual contributions of glacier-derived ice, with the exception of Kangerdlugssuaq (fjord 18) and, to a lesser extent, fjord 21. Slow flow rates and often relatively thin glacier termini in this region are the cause of the low glacier-derived concentrations in many fjords, especially with respect to the Geikie Plateau, where most glaciers are considered part of a peripheral ice cap (Rastner et al., 2012). In contrast, Ikertivaq and a number of fjords south of Sermilik are fed by several glaciers, many of which receive moderate to high levels of solid-ice discharge.
4.2 Focus fjord observations
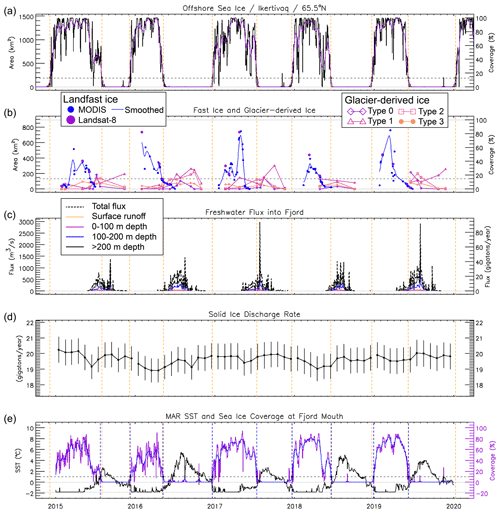
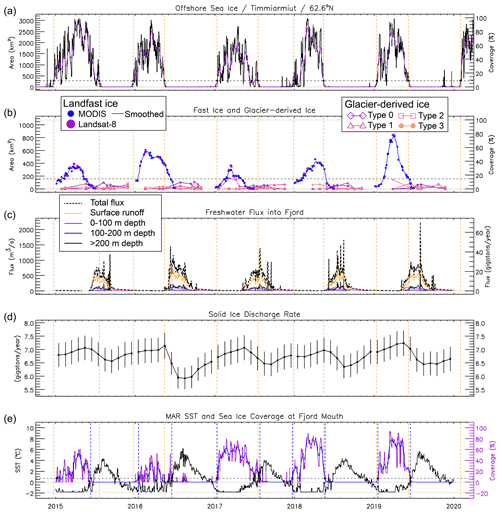
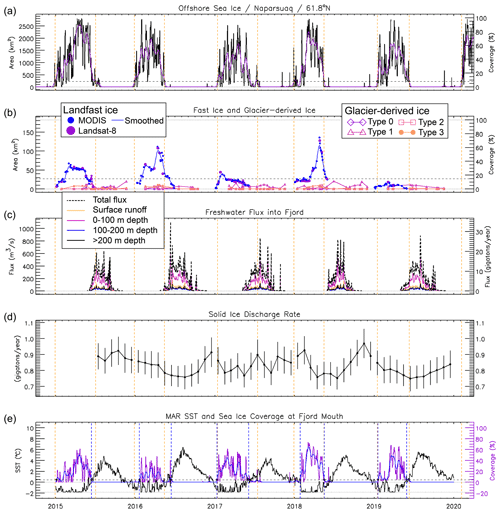
Manual analysis of landfast sea ice and glacier-derived ice allows us to integrate these observations and compare them across metrics. Figures 9 and A3–A9 provide stacked time series (2015–2019) for offshore sea ice area and percentage coverage; landfast-ice area, glacier-derived-ice area, and percentage coverage; freshwater flux binned into sea surface input and input at depths of 0–100, 100–200, and >200 m; cumulative fjord-based solid-ice discharge; and fjord mouth SST and sea ice coverage from MAR v3.12. These figures give us a sense of temporal evolution across a range of latitudes. In contrast, Figs. 10–13 focus on the results of the landfast-ice and glacier-derived-ice analysis to provide a spatial map view of the presence of landfast ice and type-2 and type-3 glacier-derived ice.
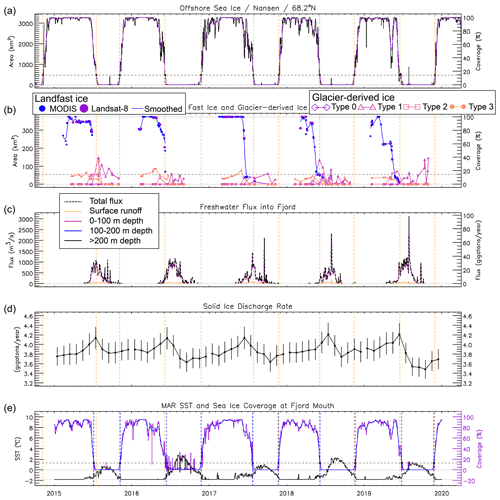
Figure 9Time series for fjord 15 (Nansen) showing (a) daily sea ice area (km2) and percentage coverage (black line) based on AMSR2 sea ice concentrations, along with a 31 d running mean (purple line); (b) area (km2) and percentage coverage for landfast ice from single MODIS and Landsat-8 image sources (blue and purple dots, respectively), including a smoothed record (blue lines) and all four surface character types (0–3) for glacier-derived ice; (c) total freshwater flux (m3 s−1; dashed black lines) and depth-binned freshwater flux (solid lines); (d) cumulative fjord-based solid-ice discharge (Gt yr−1); and (e) sea surface temperature (black line) and sea ice coverage (purple line) measured at the fjord mouth, taken from MAR climate data. Vertical dashed orange lines in all panels indicate the freeze-up and breakup dates, which are specified for offshore sea ice in panel (a), measured using a threshold of 15 % of the mean March–April sea ice area. A similar threshold (horizontal dashed line) is indicated in panel (e), while panel (b) shows a simple 15 % threshold (horizontal dashed line). Similar figures for other focus fjords are provided in Appendix A.
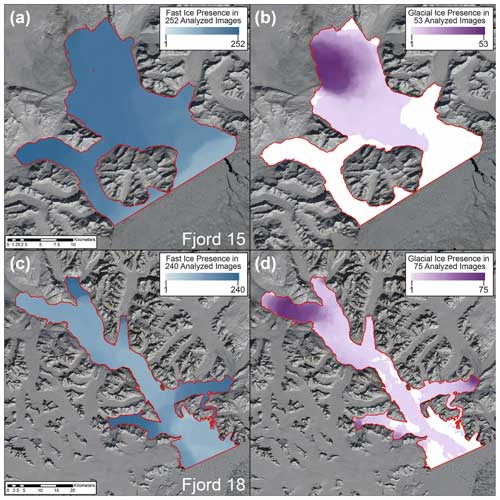
Figure 10Maps illustrating fast-ice presence (a, c) and the presence of type-2 and type-3 glacial ice (b, d) with respect to fjord 15 (Nansen; a, b) and fjord 18 (Kangerdlugssuaq; c, d). Map symbology corresponds to the number of images analyzed (noted in the panel legends). Landsat-8 background images are from 8 May 2015.
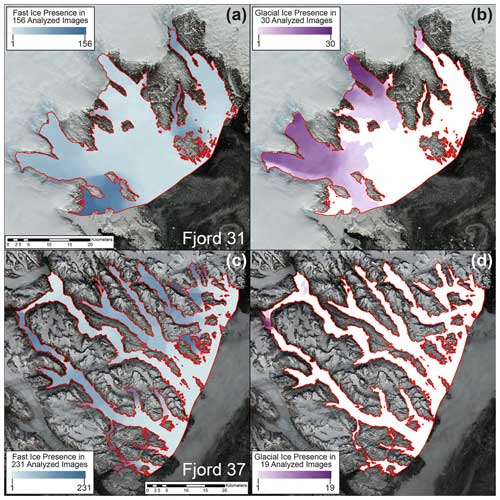
Figure 11Same as Fig. 10 but for fjord 31 (Ikertivaq; a, b) and fjord 37 (Skjoldungen; c, d). Landsat-8 background images are from 21 June 2015 (a, b) and 14 June 2015 (c, d).
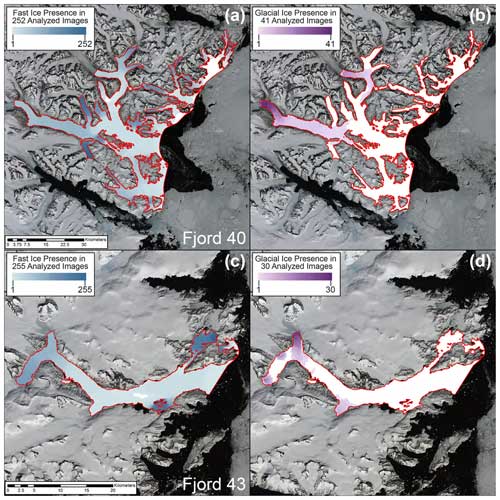
Figure 12Same as Fig. 10 but for fjord 40 (Timmiarmiut; a, b) and fjord 43 (Naparsuaq; c, d). Landsat-8 background images are from 20 May 2015.
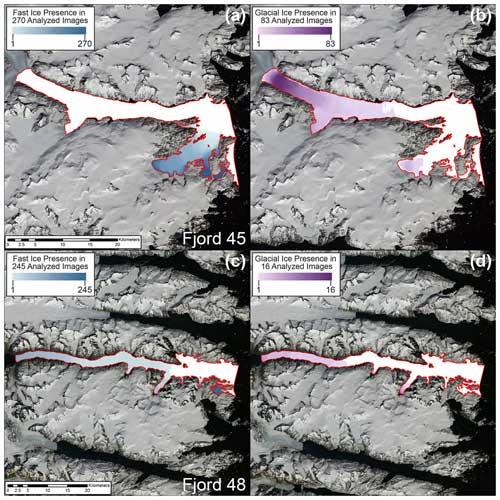
Figure 13Same as Fig. 10 but for fjord 45 (Anoritoq; a, b) and fjord 48 (Kangerluluk; c, d). Landsat-8 background images are from 20 May 2015.
Across all eight focus fjords, landfast ice regularly accumulates in particularly narrow fjord “corridors” (narrow areas of the fjord with entrances and exits for ice flux on either end; e.g., Fig. 11a and c) and/or in the “corners” of fjords (areas with a single entrance and exit for ice flux and a confined coastal topography; e.g., Fig. 12a and c). Nansen (fjord 15) and Kangerdlugssuaq (fjord 18) exhibit periods when they are fully covered by landfast ice in certain years, while the more southerly fjords do not achieve full landfast-ice coverage in any study years.
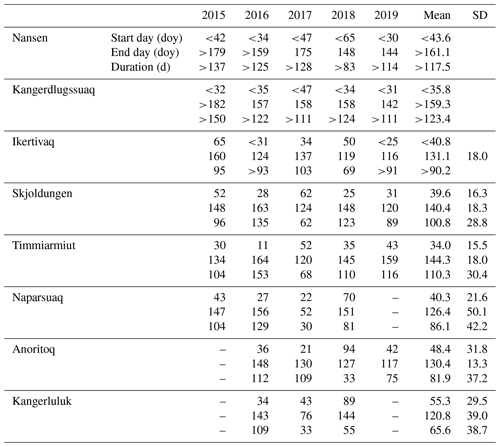
Despite the broad seasonality and spatial consistency in landfast-ice development, there is substantial year-to-year variability in landfast-ice development within each fjord (panel b in Figs. 9 and A3–A9). When considering a 15 % landfast-ice-coverage threshold, the five more northern focus fjords in our study show lower variability in the timing of landfast-ice development and breakup, although the timing of fast-ice peaks shows substantial variability (Table A1). For example, in 2017, landfast ice in Ikertivaq formed more slowly, with some expansion and decline, before peaking at an area coverage close to 80 % in late April, while in 2019, Ikertivaq experienced a relatively rapid development of landfast ice as well as a similar area coverage peak in early March (Fig. A4). For the three southernmost fjords, there is larger variability in the timing of the formation and breakup of landfast ice. Landfast ice did not exceed a 15 % ice coverage threshold for Naparsuaq in 2019, Anoritoq in 2015, and Kangerluluk in both 2015 and 2019 (Figs. A7–A9). Yet, we observe clear instances of landfast ice remaining in place well after offshore sea ice has fully disappeared, with many of the fjord declines in landfast sea ice lagging behind offshore-sea-ice declines by more than a month in 2016 and by ∼ 2 weeks in 2018 (panel b in Figs. 9 and A3–A9).
The presence of type-2 and type-3 glacier-derived ice (panels b and d in Figs. 10–13) is dependent on the locations of marine-terminating glaciers, with a greater presence observed near the glacier termini. As expected, the manually digitized imagery highlights glacier ice inputs that may be absent in other datasets (such as the regional solid-ice-discharge datasets from SEG that we use). Due to the intermixing of landfast ice and glacier-derived ice (or, at least, the inability to distinguish boundaries from satellite imagery), our results highlight glacier-derived-ice-dominant or landfast-ice-dominant fjord regions rather than consistent or clear delineations within most fjord regions. The time series of glacier-derived ice (Figs. 9 and A3–A9) indicate that only Kangerdlugssuaq, Ikertivaq, and Anoritoq more regularly contain type-2 and type-3 glacier-derived ice outside of the fjord's landfast-ice season.
Finally, we compared the spring and fall sea ice transition dates calculated from AMSR2 sea ice coverage data (vertical dashed orange lines in Fig. 9a (repeated in all panels)) with those calculated from MAR sea ice coverage data (vertical dashed blue lines in Fig. 9e) for the eight focus fjords. For the three northern fjords (fjords 15, 18, and 31), which are all north of 64° N, the agreement is quite good: the mean dates (across 5 years) are within 3 d of each other. These fjords have relatively well-defined annual cycles of sea ice coverage, meaning there is little ambiguity in identifying the transition dates. For the five southern fjords, which are all south of 64° N, the agreement is less good: mean differences can be as high as ±16 d, with a larger variability than the northern fjords. These fjords experience relatively large swings in wintertime sea ice coverage, including lots of spikes, meaning the detection of the transition dates is noisier. For the four most southerly fjords (fjords 40, 43, 45, and 48), there are instances where MAR dates are both earlier and later than AMSR2 dates for spring and fall transitions. In contrast, the MAR-based threshold is consistently earlier (or the same) for the spring transition and later for the fall transition at Skjoldungen (fjord 37). For cases with high sea ice coverage variability, we suggest using other metrics (e.g., mean wintertime sea ice coverage) to compare the accuracy and agreement of MAR and AMSR2.
Factors affecting ice in SEG fjords can be broadly divided into two categories: (1) relatively fixed factors, such as fjord width and length, bathymetry, orientation, latitude, and the locations of glaciers feeding into the fjord, and (2) variable factors, such as katabatic winds coming from the ice sheet, alongshore winds driven by cyclones, ocean currents, ocean stratification, ocean heat content, air temperature, the formation of sea ice, and the discharge of freshwater and glacial ice into the fjord. The formation of landfast ice and the accumulation of glacier-derived ice in SEG fjords tends to follow a semi-consistent spatial pattern: landfast ice and glacial ice can be found in similar areas within each individual fjord from year to year (Figs. 10–13). This distribution is likely influenced by a combination of fixed and variable factors. For example, the morphology of each fjord system is likely a first-order control. Variable factors, such as ocean currents, may also produce relatively consistent ice conditions, but both current and future potential for ocean variations need to be considered. For example, as the East Greenland Coastal Current flows past the mouth of a fjord, it turns right (due to Coriolis forces) and enters the fjord, keeping the shoreline on the right. The current flows into the fjord along the north or east side of the fjord and then exits along the south or west side of the fjord, influencing ice-forming surface conditions and iceberg motion in the process. However, this flow is not steady over time. Recent examinations of four East Greenland fjords, including two in SEG (Kangerdlugssuaq and Sermilik), found periodicity in current patterns ranging from 2–4 d for Kangerdlugssuaq, with a broad peak around 10 d (Gelderloos et al., 2022). Thus, factors not included in this study still warrant examination and future synthesis.
Temporally, landfast ice and glacial ice follow different patterns. Landfast ice forms seasonally from roughly February to late May, with significant interannual variability in cover duration (Table A1), while glacier-derived ice can be found in various fjords year-round. However, the characteristics (e.g., type 0, 1, 2, or 3), timing, and area coverage of glacier-derived ice are strongly dependent on the fjord, with some glacier-fed fjords appearing to provide little potential for substantial glacier-derived ice habitats outside the landfast-ice season.
Regarding our mapping of landfast-ice locations, these locations commonly appear in areas that remain poorly mapped for bathymetry. Comparing landfast-ice locations with bathymetric data from BedMachine v5 (Morlighem et al., 2017, 2022), for example, shows that landfast ice often occurs in regions that are presumably shallow and lack bathymetric detail. In Greenland, sea-level responses to climate change include the possibility for local regions to experience falling sea levels (Fox-Kemper et al., 2021). This suggests that understanding shallow-region bathymetry will become more important, although sea-level changes may occur more slowly here than along some other global coasts. For example, changes in ocean depth have the potential to influence wave characteristics, contributing to mechanical landfast-ice breakup (Petrich et al., 2012), and the prevalence of possible grounding points, which may influence landfast-ice formation (Mahoney et al., 2014). These shallow regions, which we speculate are mostly at depths of ∼ 0–50 m, may also experience substantially different heat budget processes as they are shallower than potential inflows of warm Atlantic water and may also be less involved in large-scale fjord water circulation systems.
Glacier-derived ice, produced from marine-terminating glaciers in SEG fjords, is initially deposited at the glacier terminus and then drifts into the fjord as it melts, fractures, and disperses. As glacial ice travels through the fjord system, it can become trapped among forming landfast ice, effectively adding to the landfast ice itself. This is especially frequent in long, narrow fjords, where landfast ice can clog passageways and prevent glacial ice from exiting the fjord at the mouth. This heterogeneous mixture of frozen landfast ice and glacial ice provides a stable, optimal springtime habitat for ice-breeding seals and foraging polar bears (Laidre et al., 2022). The distribution of glaciers across SEG (e.g., Fig. 1) is heterogeneous, with some fjord systems having multiple productive glaciers (e.g., fjords 18 and 31), while others have either minor or no glacier-derived flux (e.g., fjord 37). It is unclear from our observations to what extent glacier-derived ice enhances or diminishes landfast-ice persistence. For example, the production of glacial ice in fjord 15 may help to compress and possibly thicken landfast ice (Fig. 10a and b), especially if this glacial ice is paired with sea ice circulating into the fjord from offshore. On the other hand, glacial ice traveling from a glacier terminus toward the fjord mouth might shear against the landfast-ice edges, particularly if it is subjected to different wind or current forces due to different surface heights and bottom-ice depths.
Differences in offshore sea ice and landfast-ice development across SEG suggest that glacier-derived ice may be especially important as a fjord surface ice environment, although there is substantial interannual variability (panels a, b, and e in Figs. 9 and A3–A9). Earlier research demonstrated that the 1999–2018 mean width of the band corresponding to offshore wintertime sea ice for 60–65° N was 19 km, while for 65–70° N, it was 149 km (Laidre et al., 2022). The four most southerly focus fjords functionally experienced no full coverage of offshore sea ice throughout 2015–2019 (panel a in Figs. 9 and A3–A9). Combined with low landfast-ice coverage, animals may have limited options for sea ice platforms, while glacier-derived ice is present to some extent in all of these fjords. The extent to which limited and sporadic coverage of glacier-derived ice (panel b in Figs. 9 and A3–A9) provides a year-round ice habitat is unknown, but observations and tracking data of top predators suggest that animals use this habitat year-round for hauling out (e.g., resting) or foraging (Laidre et al., 2022).
Fjords across southeast Greenland exhibit high fjord-to-fjord variability with regard to bathymetry, size, shape, and glacial setting. As a result, some fjords receive substantially higher annual freshwater flux from ice sheet, glacier, and terrestrial runoff, and some fjords experience a much higher presence of glacier-derived ice. These inputs mix with in-fjord sea ice, landfast ice, and offshore sea ice to create a dynamic fjord surface environment.
From 2015 through 2019, SEG fjords demonstrated substantial year-to-year variability. While the impacts of climate change may be expected to push long-term trends in one general direction, the variability in separate metrics will likely be different. For example, the sensitivity of freshwater flux to ice sheet surface melt introduces a high dependency on atmospheric conditions, which change rapidly and exhibit high interannual variability (Lenaerts et al., 2019). On the other hand, solid-ice discharge depends on ice sheet and glacier dynamics, which generally respond more slowly to climate change and exhibit lower interannual variability (Moon et al., 2022), and ocean conditions. Landfast-sea-ice variability introduces further dependence on ocean surface conditions, which are also a major factor in the formation of mobile sea ice.
With ongoing sea ice loss along the east coast of Greenland (Stern and Laidre, 2016) and projections for summer sea-ice-free conditions to occur within 1 to 2 decades (Kim et al., 2023), the importance of glacier-derived ice as a habitat for top predators may increase. Projections for the spatial patterns of Greenland Ice Sheet retreat under a range of future scenarios point toward a longer-term presence of glacier ice in SEG than in other coastal areas (Aschwanden et al., 2019; Bochow et al., 2023). High winter precipitation in SEG compared to other regions (Gallagher et al., 2022) is an important factor in sustaining glacier ice in the region. This higher regional winter snowfall may also provide a longer-term habitat suitable for ringed-seal birth lairs, which are created as snow caves on sea ice, with sufficient snow cover associated with lower predation rates (Kelly et al., 2010). Further, the heterogeneous mix of glacial ice frozen into fast ice can provide suitable drifts for ice seal birth lairs, which can form quickly on any side of an iceberg due to their complex geometry. This has also been observed in the case of polar bear maternity dens in northeast Greenland (Laidre and Stirling 2020). As a result, there is the potential for SEG to remain a long-term refugium for polar bears and other ice-dependent wildlife on a centennial to millennial scale (depending on future climate change pathways), but further investigation is required to quantitatively assess this potential.
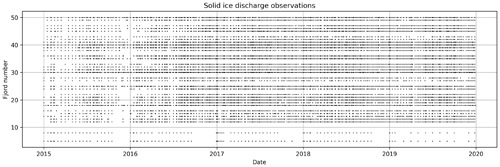
Figure A1Distribution of solid-ice-discharge observations from 2015 through 2019 for all southeast Greenland fjords, categorized according to the fjord number (see Fig. 1).
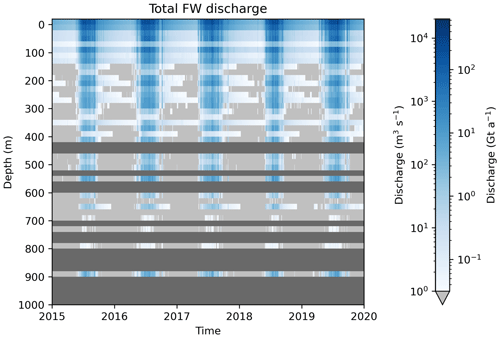
Figure A2Total freshwater (FW) discharge within SEG fjords from 2015 through 2019, based on data from Mankoff (2020a) and Mankoff et al. (2020a). Freshwater discharge is binned into 20 m segments, ranging from +20–0 m a.s.l. (above sea level) to 980–1000 m depth, with all discharge from elevations above 0 m a.s.l. included in the +20–0 m a.s.l. bin. Light-gray areas indicate times when the discharge in the corresponding bin was below a discharge threshold of 1 m3 s−1, while dark-gray areas indicate depths without subglacial discharge outlets.
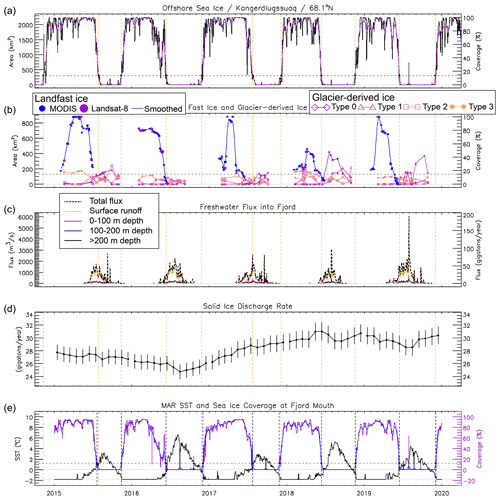
Figure A3Time series for fjord 18 (Kangerdlugssuaq) showing (a) daily sea ice area (km2) and percentage coverage (black line) based on AMSR2 sea ice concentrations, along with a 31 d running mean (purple line); (b) area (km2) and percentage coverage for fast ice from single MODIS and Landsat-8 image sources (blue and purple dots, respectively), including a smoothed record (blue lines) and all four surface character types (0–3) for glacier-derived ice; (c) total freshwater flux (m3 s−1; dashed black lines) and depth-binned freshwater flux (solid lines); (d) cumulative fjord-based solid-ice discharge (Gt yr−1); and (e) sea surface temperature (black line) and sea ice coverage (purple line) measured at the fjord mouth, taken from MAR climate data. Vertical dashed orange lines in all panels indicate the freeze-up and breakup dates, which are specified for offshore sea ice in panel (a), measured using a threshold of 15 % of the mean March–April sea ice area. A similar threshold (horizontal dashed line) is indicated in panel (e), while panel (b) shows a simple 15 % threshold (horizontal dashed line).
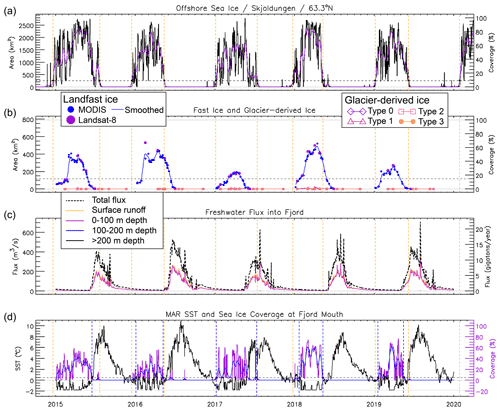
Figure A5Same as Fig. A3 but for fjord 37 (Skjoldungen), without solid-ice-discharge data, and with panel (e) presented as panel (d).
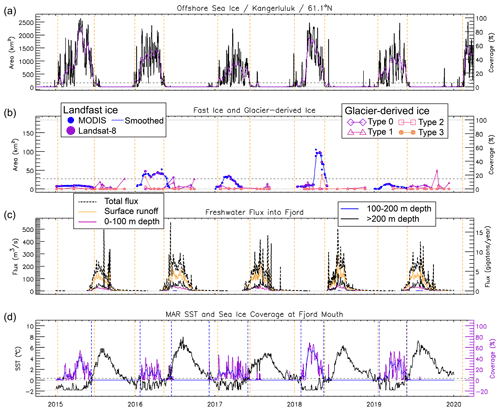
Figure A9Same as Fig. A3 but for fjord 48 (Kangerluluk), without solid-ice-discharge data, and with panel (e) presented as panel (d).
Table A1Statistics for landfast ice with respect to the SEG focus fjords. Using a threshold of 15 % areal coverage to define the landfast-ice season, each table entry contains the start day (day of the year – doy), end day (doy), and duration (days) of the landfast-ice season. The landfast-ice analysis did not cover the full 12-month year. The “<” symbol indicates a probable earlier onset, while the “>” symbol indicates a probable later presence. Years when landfast-ice coverage never exceeded the 15 % threshold are marked with “–”. The last two columns give the mean and standard deviation of the start day (doy), end day (doy), and duration (days). Standard deviation is not calculated for records indicating a probable longer duration (“>” or “<” included). Dates are based on the use of smoothed data (see Sect. 3.3).
Data created to support this research are archived at the National Snow and Ice Data Center (https://doi.org/10.5067/GWJ0PLI2UF6E, Cohen et al., 2024). The code for freshwater and solid-ice-discharge data analysis and visualization is available on GitHub (https://doi.org/10.5281/zenodo.12702462, Black, 2024). Solid-ice-discharge data (v79) were published on 5 May 2023 and are available at https://doi.org/10.22008/promice/data/ice_discharge/d/v02 (Mankoff et al., 2020b). Freshwater discharge data (v4.2) were published on 28 August 2022 and are available at https://doi.org/10.22008/FK2/XKQVL7 (Mankoff, 2020b).
We used the CRediT (Contributor Roles Taxonomy) framework (https://casrai.org/credit/, last access: April 2022) to evaluate individual contributions and determine authorship. All authors designed the study and contributed to the writing and editing of the paper. TAM and KLL administrated the project, with TAM supervising this research component. BC, TEB, and HLS were responsible for data collection and formal analyses. TAM, BC, TEB, and HLS validated data and produced data visualizations. IJ advised on early research methods.
The contact author has declared that none of the authors has any competing interests.
Publisher's note: Copernicus Publications remains neutral with regard to jurisdictional claims made in the text, published maps, institutional affiliations, or any other geographical representation in this paper. While Copernicus Publications makes every effort to include appropriate place names, the final responsibility lies with the authors.
This research was supported by NASA's Biological Diversity and Ecological Forecasting Program and Cryospheric Sciences Program (grant nos. NNX11AO63G, NNX13AN28G, 80NSSC18K1229, and 80NSSC20K1361). We acknowledge Xavier Fettweis for assisting with MAR regional-climate-model data and Brice Noël for assisting with RACMO regional-climate-model data (included in some archived code and data but not within the paper results). We also acknowledge Ken Mankoff for assisting with and consulting on the use and interpretation of solid-ice-discharge and freshwater flux datasets.
This research has been supported by the National Aeronautics and Space Administration (grant nos. NNX11AO63G, NNX13AN28G, 80NSSC18K1229, and 80NSSC20K1361).
This paper was edited by Bert Wouters and reviewed by two anonymous referees.
Aschwanden, A., Fahnestock, M. A., Truffer, M., Brinkerhoff, D. J., Hock, R., Khroulev, C., Mottram, R., and Khan, S. A.: Contribution of the Greenland Ice Sheet to sea level over the next millennium, Sci. Adv., 5, eaav9396, https://doi.org/10.1126/sciadv.aav9396, 2019.
Beitsch, A., Kaleschke, L., and Kern, S.: Investigating High-Resolution AMSR2 Sea Ice Concentrations during the February 2013 Fracture Event in the Beaufort Sea, Rem. Sens., 6, 3841–3856, https://doi.org/10.3390/rs6053841, 2014.
Black, T.: tarynblack/southeast_ greenland_fjords: manuscript acceptance (v1.0.0), Zenodo [code], https://doi.org/10.5281/zenodo.12702462, 2024.
Bochow, N., Poltronieri, A., Robinson, A., Montoya, M., Rypdal, M., and Boers, N.: Overshooting the critical threshold for the Greenland ice sheet, Nature, 622, 528–536, https://doi.org/10.1038/s41586-023-06503-9, 2023.
Bosson, J. B., Huss, M., Cauvy-Fraunié, S., Clément, J. C., Costes, G., Fischer, M., Poulenard, J., and Arthaud, F.: Future emergence of new ecosystems caused by glacial retreat, Nature, 620, 562–569, https://doi.org/10.1038/s41586-023-06302-2, 2023.
Cohen, B., Moon, T., and Black, T.: Glacial and fast ice distributions in southeast Greenland fjords, version 1, NASA National Snow and Ice Data Center Distributed Active Archive Center, Boulder, Colorado USA [data set], https://doi.org/10.5067/GWJ0PLI2UF6E, 2024.
Enderlin, E. M., Carrigan, C. J., Kochtitzky, W. H., Cuadros, A., Moon, T., and Hamilton, G. S.: Greenland iceberg melt variability from high-resolution satellite observations, The Cryosphere, 12, 565–575, https://doi.org/10.5194/tc-12-565-2018, 2018.
Fettweis, X., Box, J. E., Agosta, C., Amory, C., Kittel, C., Lang, C., van As, D., Machguth, H., and Gallée, H.: Reconstructions of the 1900–2015 Greenland ice sheet surface mass balance using the regional climate MAR model, The Cryosphere, 11, 1015–1033, https://doi.org/10.5194/tc-11-1015-2017, 2017.
Fox-Kemper, B., Hewitt, H. T., Xiao, C., Aðalgeirsdóttir, G., Drijfhout, S. S., Edwards, T. L., Golledge, N. R., Hemer, M., Kopp, R. E., Krinner, G., Mix, A., Notz, D., Nowicki, S., Nurhati, I. S., Ruiz, L., Sallée, J.-B., Slangen, A. B. A., and Yu, Y.: Ocean, Cryosphere and Sea Level Change, in: Climate Change 2021: The Physical Science Basis. Contribution of Working Group I to the Sixth Assessment Report of the Intergovernmental Panel on Climate Change, edited by: Masson-Delmotte, V., Zhai, P., Pirani, A., Connors, S. L., Péan, C., Berger, S., Caud, N., Chen, Y., Goldfarb, L., Gomis, M. I., Huang, M., Leitzell, K., Lonnoy, E., Matthews, J. B. R., Maycock, T. K., Waterfield, T., Yelekçi, O., Yu, R., and Zhou, B., Cambridge University Press, Cambridge, United Kingdom and New York, NY, USA, 1211–1362, https://doi.org/10.1017/9781009157896.011, 2021.
Gallagher, M. R., Shupe, M. D., Chepfer, H., and L'Ecuyer, T.: Relating snowfall observations to Greenland ice sheet mass changes: an atmospheric circulation perspective, The Cryosphere, 16, 435–450, https://doi.org/10.5194/tc-16-435-2022, 2022.
Gelderloos, R., Haine, T. W. N., and Almansi, M.: Subinertial Variability in Four Southeast Greenland Fjords in Realistic Numerical Simulations, J. Geophys. Res.-Oceans, 127, e2022JC018820, https://doi.org/10.1029/2022jc018820, 2022.
Heide-Jørgensen, M. P., Chambault, P., Jansen, T., Gjelstrup, C. V. B., Rosing-Asvid, A., Macrander, A., Víkingsson, G., Zhang, X., Andresen, C. S., and MacKenzie, B. R.: A regime shift in the Southeast Greenland marine ecosystem, Glob. Change Biol., 29, 668–685, https://doi.org/10.1111/gcb.16494, 2022.
Hersbach, H., Bell, B., Berrisford, P., Hirahara, S., Horányi, A., Muñoz-Sabater, J., Nicolas, J., Peubey, C., Radu, R., Schepers, D., Simmons, A., Soci, C., Abdalla, S., Abellan, X., Balsamo, G., Bechtold, P., Biavati, G., Bidlot, J., Bonavita, M., Chiara, G., Dahlgren, P., Dee, D., Diamantakis, M., Dragani, R., Flemming, J., Forbes, R., Fuentes, M., Geer, A., Haimberger, L., Healy, S., Hogan, R. J., Hólm, E., Janisková, M., Keeley, S., Laloyaux, P., Lopez, P., Lupu, C., Radnoti, G., Rosnay, P., Rozum, I., Vamborg, F., Villaume, S., and Thépaut, J.-N.: The ERA5 global reanalysis, Q. J. Roy. Meteor. Soc., 146, 1999–2049, https://doi.org/10.1002/qj.3803, 2020.
Holding, J. M., Markager, S., Juul-Pedersen, T., Paulsen, M. L., Møller, E. F., Meire, L., and Sejr, M. K.: Seasonal and spatial patterns of primary production in a high-latitude fjord affected by Greenland Ice Sheet run-off, Biogeosciences, 16, 3777–3792, https://doi.org/10.5194/bg-16-3777-2019, 2019.
Hopwood, M. J., Carroll, D., Browning, T. J., Meire, L., Mortensen, J., Krisch, S., and Achterberg, E. P.: Non-linear response of summertime marine productivity to increased meltwater discharge around Greenland, Nat. Commun., 9, 3256, https://doi.org/10.1038/s41467-018-05488-8, 2018.
Hopwood, M. J., Carroll, D., Dunse, T., Hodson, A., Holding, J. M., Iriarte, J. L., Ribeiro, S., Achterberg, E. P., Cantoni, C., Carlson, D. F., Chierici, M., Clarke, J. S., Cozzi, S., Fransson, A., Juul-Pedersen, T., Winding, M. H. S., and Meire, L.: Review article: How does glacier discharge affect marine biogeochemistry and primary production in the Arctic?, The Cryosphere, 14, 1347–1383, https://doi.org/10.5194/tc-14-1347-2020, 2020.
Kaleschke, L. and Tian-Kunze, X.: AMSR2 ASI 3.125 km Sea Ice Concentration Data, V0.1, Institute of Oceanography, University of Hamburg, Germany [data set], ftp://projects.zmaw.de/seaice/ (last access: October 2021), 2016.
Karlsson, N. B., Solgaard, A. M., Mankoff, K. D., Gillet-Chaulet, F., MacGregor, J. A., Box, J. E., Citterio, M., Colgan, W. T., Larsen, S. H., Kjeldsen, K. K., Korsgaard, N. J., Benn, D. I., Hewitt, I. J., and Fausto, R. S.: A first constraint on basal melt-water production of the Greenland ice sheet, Nat. Commun., 12, 3461, https://doi.org/10.1038/s41467-021-23739-z, 2021.
Karlsson, N. B., Mankoff, K. D., Solgaard, A. M., Larsen, S. H., How, P. R., Fausto, R. S., and Sørensen, L. S.: A data set of monthly freshwater fluxes from the Greenland ice sheet's marine-terminating glaciers on a glacier–basin scale 2010–2020, GEUS Bulletin, 53, https://doi.org/10.34194/geusb.v53.8338, 2023.
Kelly, B. P., Bengtson, J. L., Boveng, P. L., Cameron, M. F., Dahle, S. P., Jansen, J. K., Logerwell, E. A., Overland, J. E., Sabine, C. L., Waring, G. T., and Wilder, J. M.: Status review of the ringed seal (Phoca hispida), U.S. Dep. Commer., NOAA Tech. Memo. NMFS-AFSC-212, 250 pp., https://repository.library.noaa.gov/view/noaa/3762 (last access: November 2023), 2010.
Kim, Y.-H., Min, S.-K., Gillett, N. P., Notz, D., and Malinina, E.: Observationally-constrained projections of an ice-free Arctic even under a low emission scenario, Nat. Commun., 14, 3139, https://doi.org/10.1038/s41467-023-38511-8, 2023.
Kochtitzky, W. and Copland, L.: Retreat of Northern Hemisphere Marine-Terminating Glaciers, 2000–2020, Geophys. Res. Lett., 49, e2021GL096501, https://doi.org/10.1029/2021GL096501, 2022.
Laidre, K. L. and Stirling, I.: Grounded icebergs as maternity denning habitat for polar bears (Ursus maritimus) in North and Northeast Greenland, Polar Biology, 43, 937–943, https://doi.org/10.1007/s00300-020-02695-2, 2020.
Laidre, K. L., Supple, M. A., Born, E. W., Regehr, E. V., Wiig, Ø., Ugarte, F., Aars, J., Dietz, R., Sonne, C., Hegelund, P., Isaksen, C., Akse, G. B., Cohen, B., Stern, H. L., Moon, T., Vollmers, C., Corbett-Detig, R., Paetkau, D., and Shapiro, B.: Glacial ice supports a distinct and undocumented polar bear subpopulation persisting in late 21st-century sea-ice conditions, Science, 376, 1333–1338, https://doi.org/10.1126/science.abk2793, 2022.
Lenaerts, J. T. M., Medley, B., Broeke, M. R., and Wouters, B.: Observing and Modeling Ice Sheet Surface Mass Balance, Rev. Geophys., 57, 376–420, https://doi.org/10.1029/2018rg000622, 2019.
Mahoney, A. R., Eicken, H., Gaylord, A. G., and Gens, R.: Landfast sea ice extent in the Chukchi and Beaufort Seas: The annual cycle and decadal variability, Cold Reg. Sci. Technol., 103, 41–56, https://doi.org/10.1016/j.coldregions.2014.03.003, 2014.
Mankoff, K.: Greenland freshwater runoff, V2, GEUS Dataverse [data set], https://doi.org/10.22008/FK2/AA6MTB, 2020a.
Mankoff, K.: Streams, Outlets, Basins, and Discharge [k=1.0], V5, GEUS Dataverse [data set], https://doi.org/10.22008/FK2/XKQVL7, 2020b.
Mankoff, K. D., Noël, B., Fettweis, X., Ahlstrøm, A. P., Colgan, W., Kondo, K., Langley, K., Sugiyama, S., van As, D., and Fausto, R. S.: Greenland liquid water discharge from 1958 through 2019, Earth Syst. Sci. Data, 12, 2811–2841, https://doi.org/10.5194/essd-12-2811-2020, 2020a.
Mankoff, K. D., Solgaard, A., and Larsen, S.: Greenland Ice Sheet solid ice discharge from 1986 through last month: Discharge, V54, GEUS Dataverse [data set], https://doi.org/10.22008/promice/data/ice_discharge/d/v02, 2020b.
Mankoff, K. D., Solgaard, A., Colgan, W., Ahlstrøm, A. P., Khan, S. A., and Fausto, R. S.: Greenland Ice Sheet solid ice discharge from 1986 through March 2020, Earth Syst. Sci. Data, 12, 1367–1383, https://doi.org/10.5194/essd-12-1367-2020, 2020c.
McGovern, M., Poste, A. E., Oug, E., Renaud, P. E., and Trannum, H. C.: Riverine impacts on benthic biodiversity and functional traits: A comparison of two sub-Arctic fjords, Estuar., Coast. and Shelf Sci., 240, 106774, https://doi.org/10.1016/j.ecss.2020.106774, 2020.
Meire, L., Paulsen, M. L., Meire, P., Rysgaard, S., Hopwood, M. J., Sejr, M. K., Stuart-Lee, A., Sabbe, K., Stock, W., and Mortensen, J.: Glacier retreat alters downstream fjord ecosystem structure and function in Greenland, Nat. Geosci., 16, 671–674, https://doi.org/10.1038/s41561-023-01218-y, 2023.
Moon, T., Sutherland, D. A., Carroll, D., Felikson, D., Kehrl, L., and Straneo, F.: Subsurface iceberg melt key to Greenland fjord freshwater budget, Nat. Geosci., 11, 49–54, https://doi.org/10.1038/s41561-017-0018-z, 2017.
Moon, T. A., Gardner, A. S., Csatho, B., Parmuzin, I., and Fahnestock, M. A.: Rapid reconfiguration of the Greenland Ice Sheet coastal margin, J. Geophys. Res.-Earth, 125, e2020JF005585, https://doi.org/10.1029/2020jf005585, 2020.
Moon, T. A., Mankoff, K. D., Fausto, R. S., Fettweis, X., Loomis, B. D., Mote, T. L., Poinar, K., Tedesco, M., Wehrlé, A., and Jensen, C. D.: Greenland Ice Sheet, in: Arctic Report Card 2022, edited by: Druckenmiller, M. L., Thoman, R. L., and Moon, T. A., https://doi.org/10.25923/c430-hb50, 2022.
Morlighem, M., Williams, C. N., Rignot, E., An, L., Arndt, J. E., Bamber, J. L., Catania, G., Chauché, N., Dowdeswell, J. A., Dorschel, B., Fenty, I., Hogan, K., Howat, I., Hubbard, A., Jakobsson, M., Jordan, T. M., Kjeldsen, K. K., Millan, R., Mayer, L., Mouginot, J., Noël, B. P. Y., O'Cofaigh, C., Palmer, S., Rysgaard, S., Seroussi, H., Siegert, M. J., Slabon, P., Straneo, F., Broeke, M. R. V. D., Weinrebe, W., Wood, M., and Zinglersen, K. B.: BedMachine v3: Complete bed topography and ocean bathymetry mapping of Greenland from multibeam echo sounding combined with mass conservation, Geophys. Res. Lett., 44, 11051–11061, https://doi.org/10.1002/2017gl074954, 2017.
Morlighem, M., Williams, C., Rignot, E., An, L., Arndt, J. E., Bamber, J., Catania, G., Chauché, N., Dowdeswell, J. A., Dorschel, B., Fenty, I., Hogan, K., Howat, I., Hubbard, A., Jakobsson, M., Jordan, T. M., Kjeldsen, K. K., Millan, R., Mayer, L., Mouginot, J., Noël, B., O'Cofaigh, C., Palmer, S. J., Rysgaard, S., Seroussi, H., Siegert, M. J., Slabon, P., Straneo, F., van den Broeke, M. R., Weinrebe, W., Wood, M., and Zinglersen, K.: IceBridge BedMachine Greenland, Version 5, NASA National Snow and Ice Data Center Distributed Active Archive Center, Boulder, Colorado USA [data set], https://doi.org/10.5067/GMEVBWFLWA7X, 2022.
Murray, C., Markager, S., Stedmon, C. A., Juul-Pedersen, T., Sejr, M. K., and Bruhn, A.: The influence of glacial melt water on bio-optical properties in two contrasting Greenlandic fjords, Estuar. Coast. Shelf S., 163, 72–83, https://doi.org/10.1016/j.ecss.2015.05.041, 2015.
Noël, B., Berg, W. J. van de, Lhermitte, S., and van den Broeke, M. R.: Rapid ablation zone expansion amplifies north Greenland mass loss, Sci. Adv., 5, eaaw0123, https://doi.org/10.1126/sciadv.aaw0123, 2019.
Petrich, C., Eicken, H., Zhang, J., Krieger, J., Fukamachi, Y., and Ohshima, K. I.: Coastal landfast sea ice decay and breakup in northern Alaska: Key processes and seasonal prediction, J. Geophys. Res., 117, C02003, https://doi.org/10.1029/2011jc007339, 2012.
Rastner, P., Bolch, T., Mölg, N., Machguth, H., Le Bris, R., and Paul, F.: The first complete inventory of the local glaciers and ice caps on Greenland, The Cryosphere, 6, 1483–1495, https://doi.org/10.5194/tc-6-1483-2012, 2012.
Scheick, J., Enderlin, E. M., and Hamilton, G.: Semi-automated open water iceberg detection from Landsat applied to Disko Bay, West Greenland, J. Glaciology, 65, 468–480, https://doi.org/10.1017/jog.2019.23, 2019.
Sejr, M. K., Bruhn, A., Dalsgaard, T., Juul-Pedersen, T., Stedmon, C. A., Blicher, M., Meire, L., Mankoff, K. D., and Thyrring, J.: Glacial meltwater determines the balance between autotrophic and heterotrophic processes in a Greenland fjord, P. Natl. Acad. Sci. USA, 119, e2207024119, https://doi.org/10.1073/pnas.2207024119, 2022.
Soldal, I., Dierking, W., Korosov, A., and Marino, A.: Automatic Detection of Small Icebergs in Fast Ice Using Satellite Wide-Swath SAR Images, Remote Sensing, 11, 806, https://doi.org/10.3390/rs11070806, 2019.
Stern, H. L. and Laidre, K. L.: Sea-ice indicators of polar bear habitat, The Cryosphere, 10, 2027–2041, https://doi.org/10.5194/tc-10-2027-2016, 2016.
van As, D., Hasholt, B., Ahlstrøm, A. P., Box, J. E., Cappelen, J., Colgan, W., Fausto, R. S., Mernild, S. H., Mikkelsen, A. B., Noël, B. P. Y., Petersen, D., and van den Broeke, M. R.: Reconstructing Greenland Ice Sheet meltwater discharge through the Watson River (1949–2017), Arc., Ant., and Alpine Res., 50, S100010, https://doi.org/10.1080/15230430.2018.1433799, 2018.
van Dongen, E. C. H., Jouvet, G., Sugiyama, S., Podolskiy, E. A., Funk, M., Benn, D. I., Lindner, F., Bauder, A., Seguinot, J., Leinss, S., and Walter, F.: Thinning leads to calving-style changes at Bowdoin Glacier, Greenland, The Cryosphere, 15, 485–500, https://doi.org/10.5194/tc-15-485-2021, 2021.
White, D. R.: Propagation of Uncertainty and Comparison of Interpolation Schemes, Int. J. Thermophys., 38, 39, https://doi.org/10.1007/s10765-016-2174-6, 2017.


