the Creative Commons Attribution 4.0 License.
the Creative Commons Attribution 4.0 License.
 | 03 Sep 2024
A decade (2008–2017) of water stable isotope composition of precipitation at Concordia Station, East Antarctica
Giuliano Dreossi
Daniele Zannoni
Claudio Scarchilli
Virginia Ciardini
Mathieu Casado
Amaëlle Landais
Martin Werner
Alexandre Cauquoin
Giampietro Casasanta
Massimo Del Guasta
Vittoria Posocco
Carlo Barbante
A 10-year record of oxygen and hydrogen isotopic composition of precipitation is presented here: from 2008 to 2017, 1483 daily precipitation samples were collected year-round on a raised platform at Concordia Station, East Antarctica. Weather data were retrieved from the Italian Antarctic Meteo-Climatological Observatory automatic weather station (AWS), while ERA5 was used to estimate total precipitation. The δ–temperature relationships were moderately high for daily data (r2=0.63 and 0.64 for δ18O and δ2H, respectively) and stronger using monthly data (r2=0.82 for both δ18O and δ2H), with a slope of about 0.5 ‰ °C−1 for (3.5 ‰ °C−1 for ), which remains consistent also using annual averages. The isotopic composition of precipitation is the input signal of the snow–ice system, and this dataset will be useful to improve the interpretation of paleoclimate records and promote a better understanding of the post-depositional processes affecting the isotopic signal in ice cores. This dataset represents a benchmark for the evaluation of isotope-enabled general circulation models. Here, the ECHAM6-wiso output was compared to experimental data, showing moderately good relationships for δ18O and δ2H but not for d-excess, nonetheless marking a substantial improvement from the previous release of the model.
- Article
(3671 KB) - Full-text XML
-
Supplement
(4452 KB) - BibTeX
- EndNote


Throughout the hydrological cycle, air masses undergo evaporation, condensation, and successive precipitation events, during which temperature-dependent exchanges of heavy and light isotopes happen due to their slightly different microphysical properties. These processes drive the variation of the isotopic composition of water through all stages of the hydrological cycle and among different reservoirs, e.g., the atmosphere, oceans, superficial waters, groundwater, and the cryosphere (e.g., Dansgaard, 1964; Rozanski et al., 1993; Jouzel, 2014). Consequently, ratios among the three stable isotopes of oxygen (16O, 17O, 18O) and the two of hydrogen (1H, 2H) have been extensively used as proxies for hydrological, ecohydrological, climatological, paleoclimatological, environmental, and agricultural studies from local to global scales (Yoshimura, 2015). Oxygen and hydrogen isotope ratios are commonly reported as deviations relative to an international standard and are expressed in per mil (‰):
where RX is either the or ratio in the sample, and Rstd is the same ratio in the VSMOW standard (Vienna Standard Mean Ocean Water).
The local temperature at the precipitation site is recognized as the main factor driving the isotopic composition of precipitation. Since the 1950s, a robust relationship between the annual values of the isotopic composition of precipitation and the average annual local air temperature has been reported in middle and high latitudes (Dansgaard, 1953; Epstein and Mayeda, 1953; Craig, 1961; Dansgaard, 1964; Jouzel et al., 1997, 2003). In polar regions, this relationship was further supported by theoretical distillation models (Jouzel and Merlivat, 1984) and atmospheric general circulation models (GCMs) (e.g., Risi et al., 2010; Werner et al., 2011).
Besides delta values, the second-order parameter deuterium excess (d=δ2H-8 ⋅ δ18O; Dansgaard, 1964) provides additional information on the evaporation conditions at precipitation source regions, i.e., the humidity relative to saturation during evaporation, the sea surface temperature, and, to a limited extent, the wind speed (Merlivat and Jouzel, 1979; Uemura et al., 2008; Pfahl and Sodemann, 2014; Zannoni et al., 2022). A positive (> 0) d-excess is driven by the higher diffusivity of 2H1H16O related to 1H1H18O; the result is a relative enrichment of 2H1H16O in the vapor phase during the evaporation process if there is not sufficient time for achieving the isotopic equilibrium between the two phases.
The isotopic composition of surface snow was extensively analyzed in Antarctica, mostly along traverses or close to inland stations. Masson-Delmotte et al. (2008) summarized the available data on the isotopic composition of surface snow across the Antarctic continent. Firn temperature is also usually measured together with snow sample collection as an indicator of mean annual surface temperature (Epstein et al., 1963). These data are extremely important for paleoclimatology: assuming the empirical δ–T relationship is valid over time at a specific location, the isotope–temperature slope can be used as an “isotopic thermometer”, i.e., to quantify past temperature changes based on the stable isotopic composition. Following this approach, water stable isotope geochemistry has been widely applied to polar paleoclimate research. The past Earth's climate was reconstructed for over half a century using this approach applied to stratigraphic records of water in ice and firn cores (e.g., Langway, 1958; Gonfiantini and Picciotto, 1959; Dansgaard et al., 1969, 1993; EPICA Community Members, 2004; Jouzel et al., 2007; Jouzel, 2014; Stenni et al., 2017).
In East Antarctica, where snow accumulation rates are sufficiently low, several deep ice cores recovered over the last decades have provided the reconstructions of past climatic cycles, e.g., 343 kyr (thousands of years) at Talos Dome (Crotti et al., 2021), 420 kyr at Vostok (Petit et al., 1999), 720 kyr at Dome Fuji (Kawamura et al., 2017), and 800 kyr at EPICA Dome C (EPICA community members, 2004; Jouzel et al., 2007). Currently, the European project “Beyond EPICA oldest ice” is underway in the location known as Little Dome C (approx. 35 km from Dome C), aiming to obtain quantitative and high-resolution ice-core information on climate and environmental changes up to 1.5 Myr (Parrenin et al., 2017).
Major limitations undermine the use of water isotopes for the reconstruction of past temperatures and may bias the interpretation of the paleoclimate records. First, the low snow accumulation rates in inland Antarctica, in combination with wind redistribution effects and stratigraphic noise not related to climate, allow only lower temporal resolutions of ice-core reconstructions compared to high accumulations of coastal regions, generally not finer than decadal or even multidecadal timescales (Petit et al., 1982; Ekaykin et al., 2002, 2004; Frezzotti et al., 2007; Münch et al., 2016; Casado et al., 2018). Another major challenge is linked to the ways the isotopic signal is imprinted and preserved in ice and firn, which is not only shaped by the sensitivity to condensation temperature but also includes further signals of various processes with potentially significant effects on the isotopic fractionation (Casado et al., 2020, 2021). The processes recognized to affect the fractionation processes and mixing during and after the deposition of precipitation were reviewed by Casado et al. (2018) and Ma et al. (2020) and include the following: (i) processes within the local boundary layer leading to non-constant relationships between the isotopic composition of snow and surface temperature over time and space (Krinner et al., 1997); (ii) variations in air mass transport trajectories through time (Delaygue et al., 2000; Schlosser et al., 2004); (iii) evaporation conditions at the source of moisture (Vimeux et al., 1999); (iv) sea surface boundary conditions (Cauquoin et al., 2023); (v) seasonal variations and intermittency of precipitation and accumulation (Touzeau et al., 2016; Casado et al., 2020); (vi) redistribution of snow by surface winds (Groot Zwaaftink et al., 2013; Picard et al., 2019); (vii) water vapor exchanges between surface snow and the atmosphere due to sublimation and solid condensation (Ritter et al., 2016; Genthon et al., 2017); (viii) surface snow metamorphism (Picard et al., 2012; Casado et al., 2021); and (ix) isotopic diffusion within the firn (Laepple et al., 2018).
These post-depositional processes are expected to account for large uncertainties in low-accumulation areas, such as East Antarctica, where (i) there is a low precipitation rate (Bromwich et al., 2004; Palerme et al., 2017; Scarchilli et al., 2011; Casado et al., 2018, 2020); (ii) the atmospheric dynamics and pathways and surface mass balance (SMB) are yet to be fully understood (Frezzotti et al., 2004, 2007; Urbini et al., 2008; Scarchilli et al., 2010, 2011); and (iii) the snow surface remains exposed to the atmosphere for a long time, allowing prolonged interactions and exchanges at the snow–atmosphere interface, longer mixing, and potential horizontal transports by winds. Although all these processes are potentially able to bias the pristine isotopic signal of precipitation, their effects on driving the isotopic composition of Antarctic precipitation are still unclear and have not yet been fully quantified. Consequently, the different sensitivity of the empirical δ–T relationship in East Antarctic ice is generally poorly constrained (Sime et al., 2009; Stenni et al., 2017; Münch et al., 2016). Because of these limitations, a nonconstant relationship between the snow isotopic composition and air temperature through time and space is expected, as already evidenced by Masson-Delmotte et al. (2008). Other studies further suggest that the δ–T in East Antarctica may vary among ice core sites, with the climatic signal expected to account for only 10 %–50 % of the variance in δ18O (Münch and Laepple, 2018; Laepple et al., 2018; Casado et al., 2020, 2021). The 3-year monitoring (January 2008–December 2010) of daily precipitation collected at the Concordia Station in the East Antarctic plateau showed clear relationships between the isotopic composition and local air temperature at daily (R2=0.63) and monthly (R2=0.82) scales (Stenni et al., 2016). However, the temporal relationship between daily δ18O and air temperature was approximately 2-fold smaller than the average Antarctic spatial relationship obtained by Masson-Delmotte et al. (2008), i.e., the one used for the interpretation of the EPICA Dome C record (0.49 ‰ °C−1 vs. 0.8 ‰ °C−1). Hence, the slopes between the delta values and temperature have been shown to be highly variable considering different time intervals and locations (Casado et al., 2017). On the contrary, by reconstructing the magnitude of the last glacial maximum cooling using borehole thermometry, Buizert et al. (2021) showed a large variability of the δ–temperature slope considering different ice core locations. Generally, this latter study reported quite higher δ–T slopes (range 0.82–1.45 ‰ °C−1) than studies using water isotope composition. This represents a long-lasting, controversial, and still unsolved question in paleoclimate reconstructions from Antarctic ice cores.
Under this view, there is a need for a better understanding of how the isotopic composition of water is imprinted in the fresh snow and firn and how it evolves to obtain robust and unbiased empirical relationships between climate and stable water isotope signatures. Since the preliminary study by Stenni et al. (2016), the precipitation collection at Concordia Station for analyzing the isotopic composition has continued until the present day and it is still ongoing. Here, results spanning over 10 years (2008–2017) are reported and discussed. This dataset represents an unprecedentedly long record of precipitation experimentally measured in East Antarctica with several potential advantages for glaciological and paleoclimatological studies:
-
There is a better framing of the inter-annual variability of the isotopic composition of precipitation with respect to previous works. Indeed, 10 years of observations more likely includes atmospheric processes acting on scales larger than 3 years.
-
There is a more robust evaluation of the state-of-the-art isotope-enabled general circulation models (iGCMs) performances thanks to comparisons of 10-year-long experimental data with outputs from different iGCMs. For instance, the data provided in the present study may help to improve cloud parameterization through d-excess model–data comparisons (e.g., microphysics scheme, ice nucleation rates).
-
Experimentally collected precipitation data can be used as input of isotopic models investigating post-depositional processes of surface snow, firn, and ice core records, since the precipitation isotopic composition is the input signal of the atmosphere–snow surface and subsurface systems.
-
The basic statistical results (e.g., meteoric water lines, seasonal patterns, weighted values) presented in this study are scaled over different periods, such as daily, monthly, and inter-annual scales. These data may therefore be useful to researchers working on different scientific areas, such as the atmosphere, climate, and weather. For instance, the data provided in this study may be useful to better constrain the δ–T thermometer. To this end, the data used in this study are presented as both weighted and unweighted for precipitation amounts. For example, such temporally highly resolved data are necessary to better understand and evaluate the impact of extreme snowfall events on the precipitation-weighted δ18O–temperature relationship in both observed and modeled isotope data.
2.1 Precipitation collection
Concordia Station (75°06′ S, 123°21′ E; elevation 3233 m a.s.l.) is a French–Italian research facility located at Dome C on the East Antarctic Plateau (Fig. S1 in the Supplement, http://www.concordiastation.aq, last access: 19 August 2024), which has been open year-round since 2005. The sampling site is located in a clean area, approx. 800 m from the station, to avoid contamination from the anthropogenic operations. Precipitation accumulates over an 80×120 cm wooden platform standing 1 m above the snow surface. The platform is covered by a polystyrene–polytetrafluoroethylene surface and is shielded by an 8 cm rail to prevent snow from being blown off from the surface. Samples were manually collected with daily frequency by removing all the accumulated material, which was immediately sealed into labeled plastic bags. Bags were preserved in a frozen state until the analysis. If no snow or a too low amount of snow was found on the plate, no sample was collected, and the plate was cleaned. The amount of deposited snow varied depending on the amount of precipitation from 0 to ∼ 10 mm, with isolated cases of 30–50 mm deposition possibly related to blowing snow events. The sample is therefore representative of a fresh snowfall, but it may also include snow blown onto or off the platform by winds. Every day, the collection of the samples was recorded in a logbook reporting the timing and some weather variables. Generally, the sample collection occurred in the morning between 09:00 and 12:00 local time (UTC+8) and when meteorological conditions did not put the personnel's safety at risk.
2.2 Water stable isotope analysis of precipitation samples
Once in the lab, samples were melted at room temperature, transferred into 25 mL high-density polyethylene capped bottles, and then stored at −20 °C until analysis. The isotopic composition (δ18O and δ2H) of the samples was determined by the well-established CO2–H2 water equilibration method adapted from Epstein and Mayeda (1953) and Horita (1988), followed by isotope ratio mass spectrometry (IRMS) analysis. IRMS was composed of a Thermo-Fisher Delta Plus Advantage mass spectrometer coupled with an automatic equilibration device (Finnigan MAT HDO 1086).
Since IRMS requires at least 4 mL of water volume, smaller samples of melted snow were directly analyzed without any pre-processing by cavity ring-down spectroscopy (CRDS). CRDS analysis was performed with PICARRO model L1102-i and model L2130-i equipped with an A1102 vaporizer device. Between-sample memory effects may bias CRDS analyses (Penna et al., 2012). Therefore, samples were injected eight times, and results were filtered using an outlier test, i.e., discarding all the results falling outside of the interval described by the average of the eight repetitions ± standard deviation.
All data were expressed as relative to the international standard VSMOW. Two working standards were used during each run to build the calibration line, and a third working standard was used for quality control. All the working standards are in the range of very negative values as found in Antarctic snow and were regularly calibrated against VSMOW–SLAP. Internal laboratory tests have shown the linearity of the instrumental response outside of the calibration interval. Data consistency between analytical methods was assured by several laboratory tests carried out to detect possible biases due to the use of IRMS or CRDS. Average differences were on the order of analytical precision of IRMS (better than or equal to ±0.05 ‰ for δ18O and ±0.7 ‰ for δ2H) and the analytical precision for CRDS (±0.10 ‰ for δ18O and ±0.5 ‰ for δ2H).
2.3 Weather observations and reanalysis data
Weather data measured at Concordia Station were retrieved from the automatic weather station (AWS) Concordia (WMO ID: 89625), managed by the Italian Antarctic Meteo-Climatological Observatory (Grigioni et al., 2022a) and in operation since 2005. AWS data include air temperature (TAWS, °C), pressure (PressAWS, hPa), relative humidity (RHAWS, %), wind speed (wsAWS, m s−1), and direction (wdAWS, degrees). Missing hourly AWS data (8.5 %) were reconstructed through linear regression using data measured at the nearby AWS “Dome C II” (WMO ID: 89828), an American station installed in 1995 by the Antarctic Meteorological Research Center (AMRC). The coefficient of determination between AWSs was r2=0.99 for air temperature and surface pressure and r2=0.70 for wind speed. Surface-based temperature inversions (SBTIs) frequently occur within the atmospheric boundary layer across continental Antarctica (Connolley, 1996; Pietroni et al., 2014). At Concordia, strong and long-lived SBTIs are generally observed, reaching up to 40 °C in winter and mostly extending within the lowest 100 m of height, while they may disappear only in the early afternoon during summer due to maximum insolation and convective mixing (Genthon et al., 2010; Argentini et al., 2014; Petenko et al., 2019). Since the condensation temperature can be approximated to the temperature at the upper limit of the inversion layer (Masson-Delmotte et al., 2008), data from daily radiosounding profiles were processed to determine the temperature at the bottom of the first layer where temperature decreases with altitude (TINV). The inversion strength (I) was calculated as the difference between TINV and TAWS (Connolley, 1996). Data of solar direct radiation (direct radBSRN, W m−2) measured at Concordia Station were retrieved from the Baseline Surface Radiation Network (BSRN), a network of the Work Climate Research Program (WCRP) (Ohmura et al., 1998; Driemel et al., 2018; Lupi et al., 2021; Bai et al., 2022).
Reanalysis meteorological data were retrieved from the European Centre for Medium-Range Weather Forecasts (ECMWF) ERA5 (Hersbach et al., 2023); data of 2 m temperature (T2 m ERA5), surface pressure (PressERA5), total precipitation (tpERA5), evaporation (eERA5), and cloud base height (cbhERA5) were downloaded from the Copernicus Climate Change Service (C3S) Climate Data Store (CDS). Relative humidity (RHERA5) was computed from vapor pressure and saturation vapor pressure according to the Murphy and Koop (2005) formulae and using hourly ERA5 data.
The AWSs, BSRN, and ERA5 provide meteorological variables with different frequencies (minutes to hours); daily averages were calculated either relative to the local time for investigating the daily patterns or relative to the exact extension of the sampling time for the fine match with the isotopic composition of precipitation, i.e., referring to the information in the logbook. Since missing data can affect the analysis, daily averages were computed only for days having at least 75 % of the available hourly records and monthly averages/medians for months having at least 75 % of the available days. When used along with the isotopic composition of snow, monthly and annually averaged weather data were computed only over days with available samples. Given the qualitative nature of the observed accumulation, the tpERA5 parameter has been used in this study as representative of the precipitation amount of the observed daily snow samples.
The Southern Annular Mode (SAM, a.k.a. Antarctic Oscillation, AAO) depicts changes in the position and strength of the westerly wind belt over the Southern Ocean and is defined as the zonal mean atmospheric pressure difference between the mid-latitudes (∼ 40° S) and Antarctica (∼ 65° S) (Thompson and Wallace, 2000; Marshall, 2003). SAM is the predominant atmospheric variability mode in the Southern Hemisphere having important impacts on temperature and precipitation, including in Antarctica (Fogt and Marshall, 2020). Positive SAM phases lead to cool and dry conditions across the Antarctic continent and warm and wet conditions over the Antarctic Peninsula. Daily and monthly SAM indexes were retrieved from the Climate Prediction Center, National Centers for Environmental Prediction of NOAA.
In this study, four meteorological seasons are used: austral summer (December, January, and February (DJF)), autumn (March, April, and May (MAM)), winter (June, July, August (JJA)), and spring (September, October, November (SON)).
2.4 Isotope-enabled general circulation models (ECHAM5-wiso and ECHAM6-wiso)
Since the 1980s, several iGCMs have been developed with explicit diagnostics for the isotopic composition of water, e.g., NASA GISS, ECHAM-wiso, GENESIS, LMDZ-iso, iCAM5, MIROC5-iso (Joussaume et al., 1984; Jouzel et al., 1987; Hoffmann et al., 1998; Mathieu et al., 2002; Schmidt et al., 2005; Risi et al., 2010; Nusbaumer et al., 2017; Okazaki and Yoshimura, 2019). By incorporating physical processes influencing the isotopic composition of all water bodies at all stages of the water cycle, iGCMs return the isotopic composition in precipitation, water vapor, and snow/ice.
ECHAM5-wiso (Werner et al., 2011) and ECHAM6-wiso (Cauquoin et al., 2019; Cauquoin and Werner, 2021) are the isotopic versions of ECHAM5 (Roeckner et al., 2003) and ECHAM6 (Stevens et al., 2013) models, respectively. For both ECHAM-wiso model releases, a nudged simulation was performed that covers the time period of the available isotope measurements at Concordia Station. Reanalysis data from ECMWF were used as input for nudging the iGCM: ERA-Interim Reanalysis data (Dee et al., 2011) for ECHAM5-wiso and ERA5 (Hersbach et al., 2020) for ECHAM6-wiso. ECHAM-wiso data from both nudged simulations were extracted at the nearest grid cell from Concordia Station, providing modeled daily averaged values for the temperature at 2 m (T2 m ECHAM(5,6)), surface temperature (Tsurf ECHAM(5,6)), the amount of precipitation, δ18O, δ2H, and d-excess values.
2.5 Data processing
Statistical and geostatistical analyses were performed using R 4.2.2 (R Core Team, 2022) and a number of packages, including boot (Canty and Ripley, 2022), bootstrap (Leisch, 2019), car (Fox and Weisberg, 2018), caret (Kuhn, 2022), corrplot (Wei and Simko, 2021), DAAG (Maindonald and Braun, 2011), mgcv (Wood, 2017), ncdf4 (Pierce, 2023), rcompanion (Mangiafico, 2022), and zoo (Zeileis and Grothendieck, 2005).
Many simple and multiple linear regression analyses were performed on the data for assessing the relationships between variables. Besides the linear models, the 95th confidence intervals (CIs) in the prediction of the coefficients (slopes and intercept) were assessed by ordinary nonparametric bootstrap resampling (Davison and Hinkley, 1997) over at least R=2000 replicates (R larger than the input observations). The measures of performance and predictive ability of regression models were also estimated by k-fold cross-validation (Maindonald and Braun, 2011; James et al., 2013). This technique randomly partitions the datasets into k (k=5, in this case) equal-sized subsamples and recursively uses k−1 subsets of the observations to refit the regression while using the remaining part as a testing set. The root mean square error (RMSE) and mean absolute error (MAE) were computed from residuals of original and cross-validated models as a quantitative measure of errors associated with the estimates.
Trends and seasonal patterns of variables were quantified by adopting different approaches applied to the monthly averaged data for months having at least 75 % of the available records. The presence of statistically significant long-term (monotonic) linear trends during 2008–2017 was assessed through the Theil–Sen nonparametric estimator of slope (Theil, 1950; Sen, 1968) along with the Mann–Kendall test for trends (Mann, 1945; Kendall, 1975).
3.1 Weather and boundary layer dynamics
The time series and monthly and daily patterns of meteorological variables recorded from the AWS or modeled by ERA5 are shown in Figs. S2 and S3. The full-period (2008–2017) average TAWS was −53 °C with daily averages ranging from −82 to −19 °C and hourly values varying from −83.6 to −14.3 °C. A very high agreement between daily TAWS (blue) and T2 m ERA5 (pink) was found (r2=0.95). The East Antarctic Plateau is characterized by strong surface temperature inversions (Baas et al., 2019), which exhibited the same seasonal pattern of surface air temperature and ranged from −75 to −11 °C. The daily inversion strength, calculated between daily radiosounding profiles and TAWS, varied from −6 to 48 °C (Fig. S2), and its temporal pattern is the mirror image of the air temperature, with higher values during the austral winters. During the coldest months (April to September), the inversion strength generally exceeds 20 °C, while it is less than 10 °C in austral summer (Fig. S3) because of the erosion due to the diurnal cycle of solar radiation. Hourly relative humidity (RH) measured by the AWS varied from 6 % to 84 % (full period average 46 %) with a seasonal pattern similar to air temperature. However, Genthon et al. (2013, 2017) reported frequent supersaturation events not detected by commercially available sensors. Thus, the atmospheric moisture on the Antarctic Plateau could probably be underestimated. Under this view, the relative humidity over ice (RHi) calculated from hourly ERA5 data ranged from 42 % to 100 % (average 64 %). Figure S2 also exhibits data of RHi experimentally obtained by Genthon et al. (2017) for 2015 using hygrometry sensors modified for air sampling without artifacts. Results show hourly RHi in the 51 %–131 % range (average 89 %) with approx. 23 % of 2015 over RHi 100 %.
Wind roses calculated on a seasonal basis (Fig. S4) show prevailing winds from the fourth quadrant (SW–S) throughout the year, peaking from the south, i.e., blowing from the highest plateau and inner regions of Antarctica. Although possible instrumental issues due to frost deposition may have led to an underestimation of wind at lower speeds, the wind blew in the 0 to 20 m s−1 interval (full period average: 3 m s−1), with slightly higher values in November and around noon. These patterns are consistent with the literature for Dome C (e.g., Argentini et al., 2014).
Total precipitation and solar irradiation were not measured by AWS; in this study, values from ERA5 were used for total precipitation, while BSRN data were used for solar radiation. The annual cumulative amount of total precipitation during 2008–2017 ranged from approx. 20 to 30 mm yr−1 (average 24 mm yr−1), in accordance with previous ERA-Interim data (1979–2012, Genthon et al., 2016). Monthly (Fig. S2) precipitation was roughly constant throughout the year with slightly lower values between October and December. The daily pattern was also quite flat, with lower values around noon. During the 2008–2017 period, the hourly average solar direct radiation was in the 0–1175 W m−2 range (average 345 W m−2). The monthly and hourly cycles (Fig. S3) clearly reflect the solar elevation patterns with the highest values recorded during the austral summer and midday hours.
SAM during 2008–2017 was predominantly positive, as reported in previous studies (Fogt and Marshall, 2020). Six main negative periods counting at least 3 continuous months with a SAM index < 0 were identified (May–September 2009; June–September 2011; October 2012–January 2013; August–October 2013; August–November 2014; October 2016–January 2017). Simple cross-correlations between the SAM index against air temperature from the AWS show only statistically significant small negative correlations at negative lags only using daily data. Results indicate that a higher daily SAM index is generally related to decreasing air temperatures after 2 or 3 d (all periods, DJF, MAM, JJA) and 8 or 9 d (SON) (Fig. S5).
3.2 Water stable isotope data and their correlation with temperature
A total of 1483 daily samples were collected at Concordia Station and analyzed for the oxygen and hydrogen isotopic composition of snow. Thus, samples were collected over ∼ 41 % of days in 10 years. On a monthly basis, no precipitation was collected for 3 months (November 2009 and 2014, December 2015); approximately one-third of the months include at least 1 week of available samples, while samples were collected on at least 90 % of the days for 9 months (Figs. S6 and S7). TAWS during the days with collected samples was slightly (−1.6 °C) but significantly (Wilcoxon rank sum test with continuity correction p<0.05) lower with respect to non-sampling days; on a seasonal basis, the TAWS difference was −2.5 °C.
Figure 1 shows the time series of the stable isotope composition data along with the air temperature measured by the AWS. δ18O varied between −82.63 ‰ and −26.97 ‰ (average −56.7 ‰); δ2H varied between −595.1 ‰ and −223.0 ‰ (average −438 ‰). The minimum delta values are amongst the most isotopically depleted waters collected on the Earth so far. Violin plots in Figs. S8 and S9 show that data distributions were quite symmetrical (median −56.8 ‰ and −440 ‰ for δ18O and δ2H, respectively).
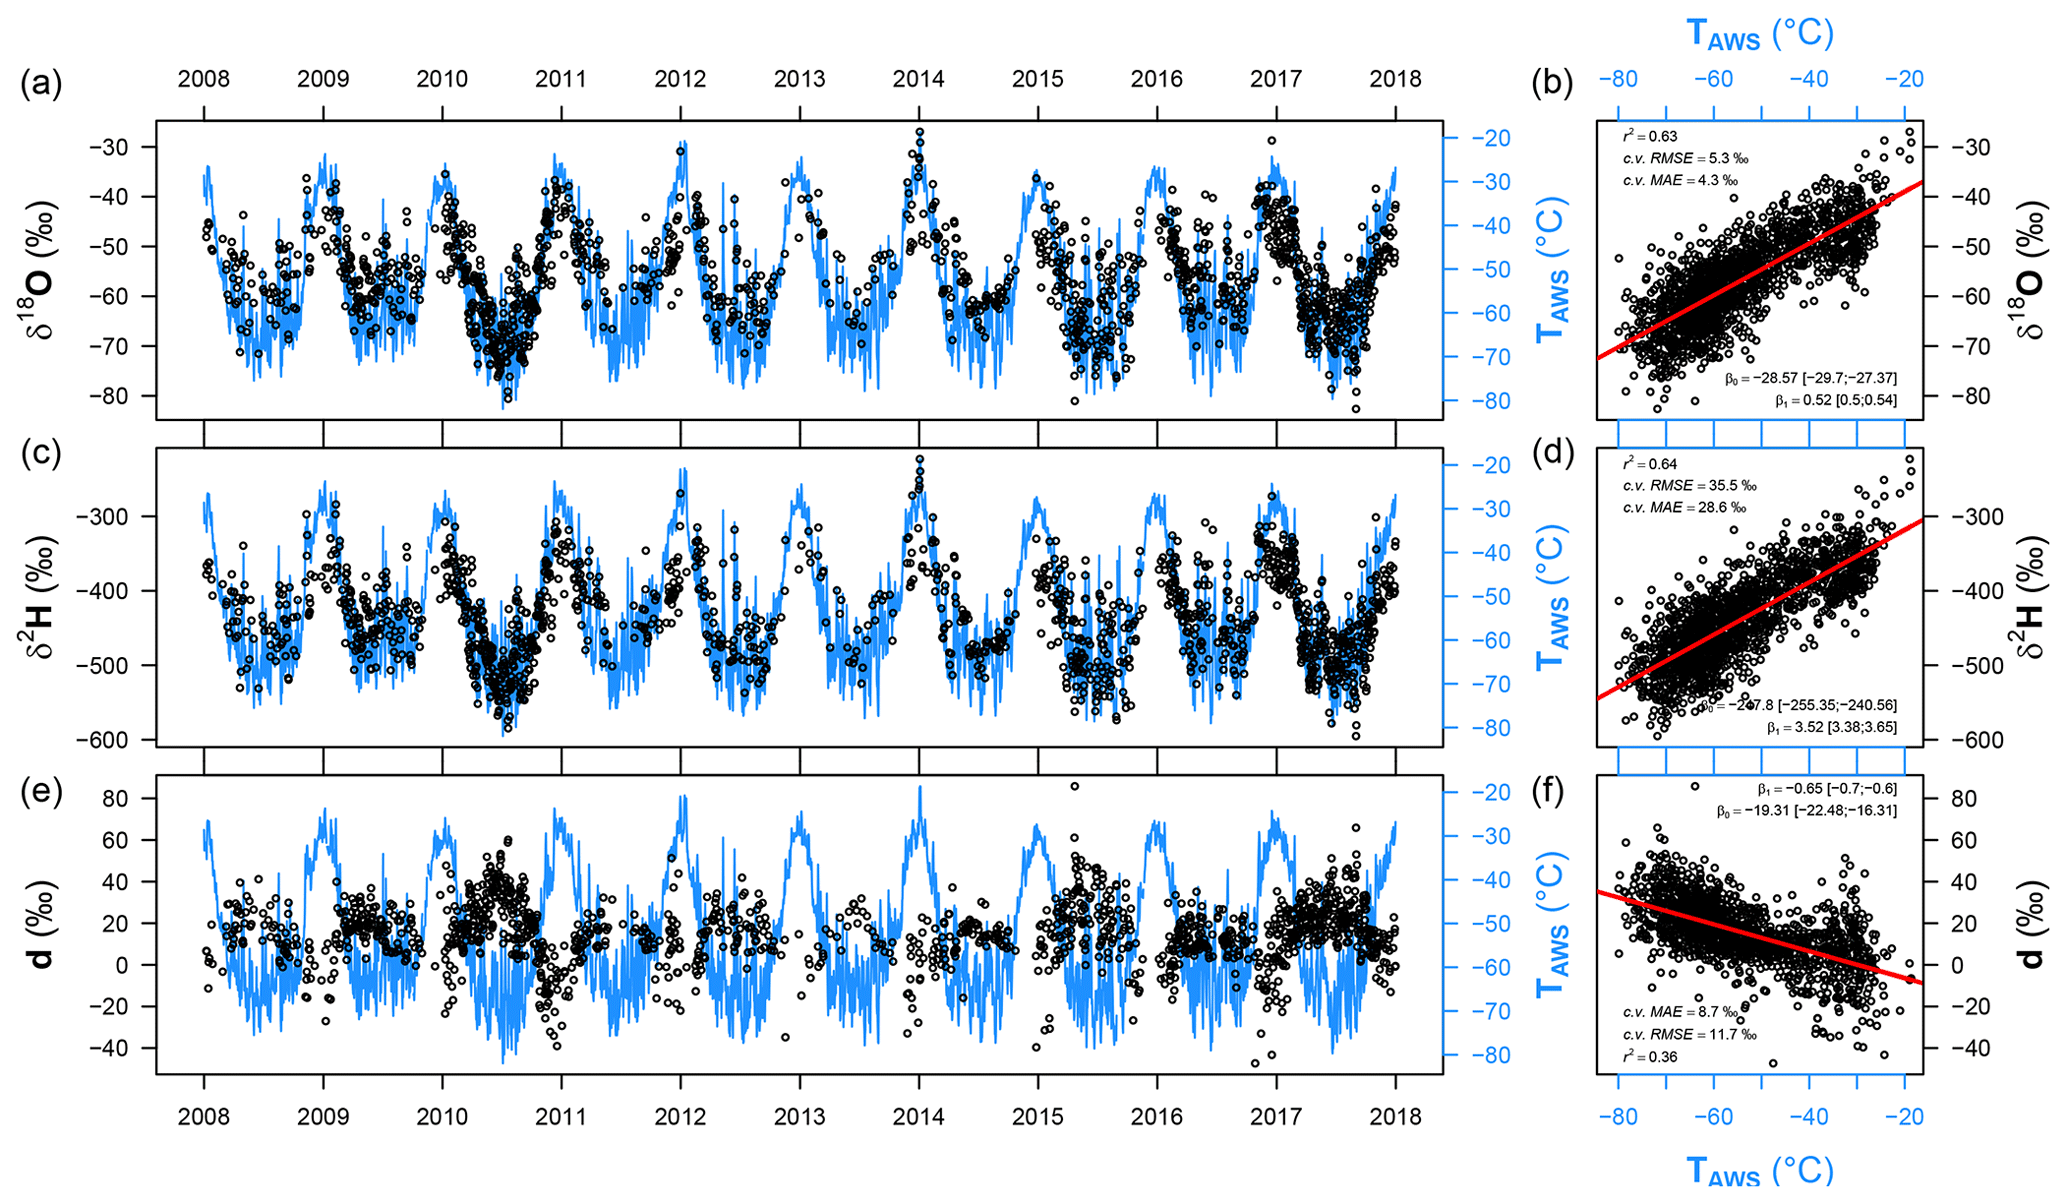
Figure 1(a, c, e) Time series of the daily averaged air temperature (blue lines) and the isotopic composition of snow (black dots) measured at Concordia during 2008–2017. (b, d, f) Linear regressions between the isotopic composition of snow and air temperature.
Besides the monthly arithmetic averages, isotope data and air temperature were also computed as precipitation-weighted averages using the total precipitation amount from ERA5 (reported as δ18Otp; δ2Htp; dtp; Ttp). The weighted and unweighted data and the temporal averaging time strongly depend on the lifetime of the atmospheric processes considered, a fact particularly important when dealing with precipitation in continental Antarctica, which is unevenly distributed throughout the year (Fujita and Abe, 2006; Turner et al., 2019). Indeed, the weighted δ18O and δ2H values are thought to be better correlated with snowfall temperature (Masson-Delmotte et al., 2008; Servettaz et al., 2023).
The monthly patterns (Fig. 2) closely followed the air temperature: the lower delta values were generally recorded during the austral winters, reflecting the “temperature effect”, i.e., the positive relationship between the isotopic composition of precipitation and air temperature mainly observed at high and middle–high latitudes (Dansgaard, 1964; Rozanski et al., 1993). Generally, the lower monthly averaged delta values were measured during June (δ18O ‰; δ2H ‰) and the higher values in January (δ18O ‰; δ2H ‰). The average seasonal amplitude of delta values between DJF and JJA spanned over approx. 16 ‰ and 111 ‰ for δ18O and δ2H, respectively.
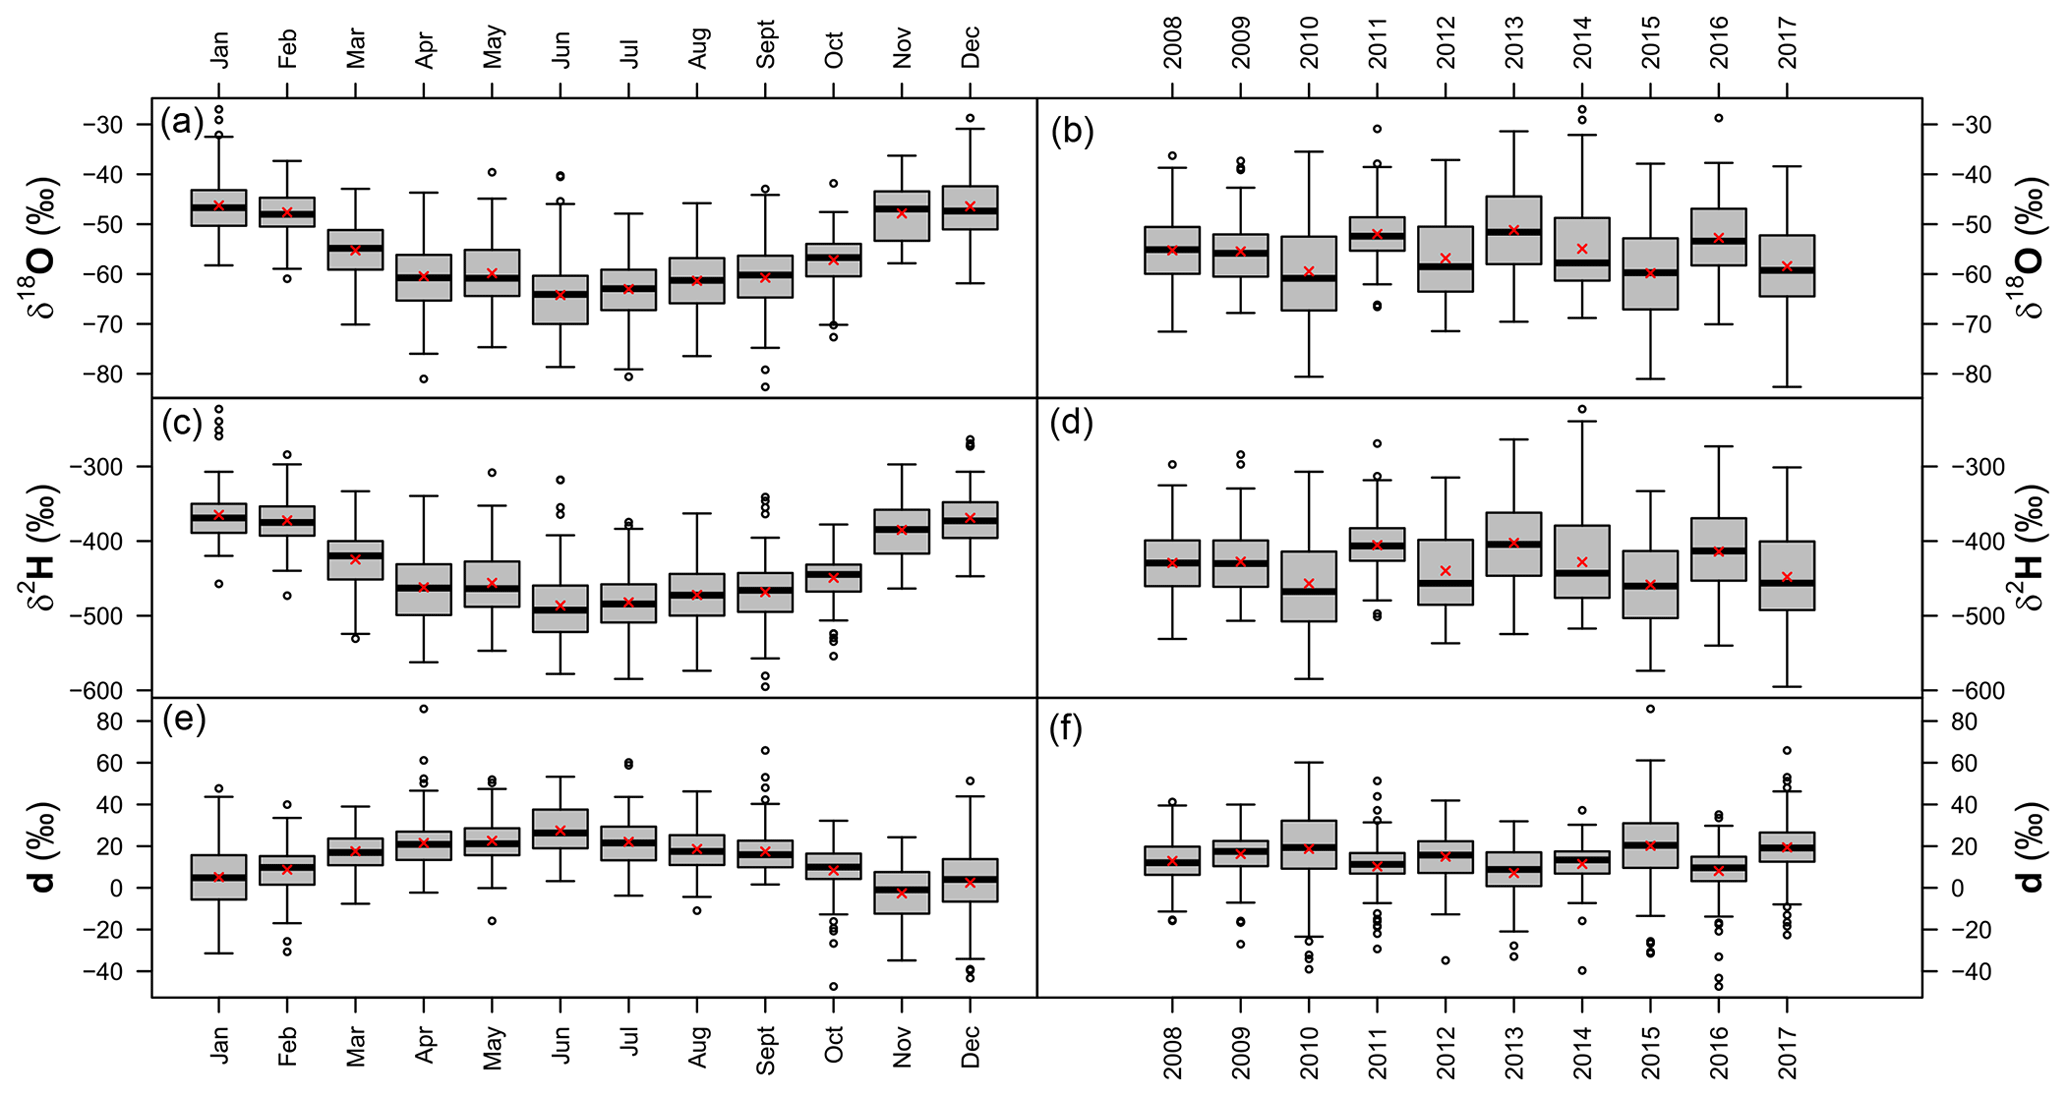
Figure 2Monthly (left) and annual (right) boxplots of the stable isotope composition of snow collected at Concordia Station (line: median, box: interquartile range, whiskers: ±1.5 interquartile range, circles: outliers and extremes, red crosses: arithmetic mean).
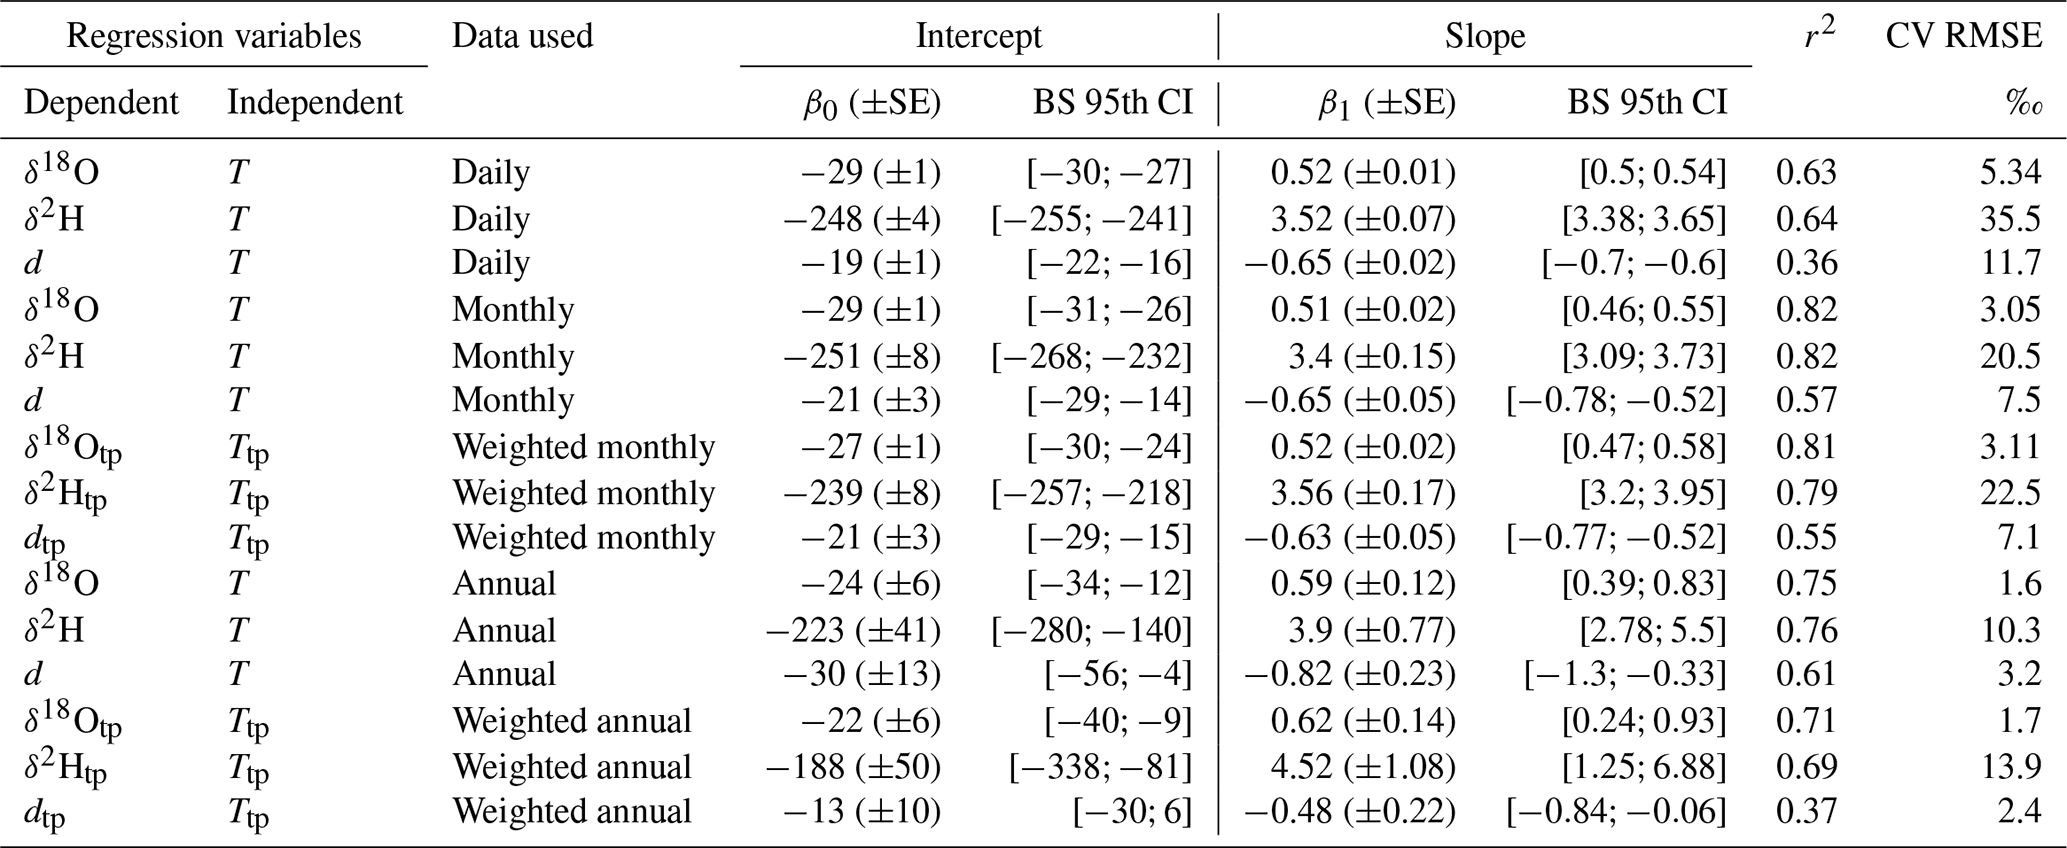
The temperature effect upon the isotopic composition of precipitation is evident. Delta values exhibited a strong seasonality (Fig. S10) with the less negative values recorded during austral summers. Under this view, the simple linear relationship of daily values of δ18O and δ2H with TAWS was moderately high (r2=0.63 and 0.64, respectively) (Fig. 1; Table 1). The regression slopes were 0.52 ‰ °C−1 [cross-validated 95 % CI: 0.50–0.54 ‰ °C−1] and 3.52 ‰ °C−1 [3.38–3.65 ‰ °C−1] for δ18O and δ2H, respectively. These positive relationships become stronger on monthly averaged data (r2=0.82 for both δ18O and δ2H) and slopes of 0.51 [CI: 0.46–0.55 ‰ °C−1] and 3.4 ‰ °C−1 [CI: 3.09–3.73 ‰ °C−1] for δ18O and δ2H, respectively (Fig. S11; Table 1). These regressions parameters show a small variability when separately computed on different years (range 0.32–0.63 ‰ °C−1). Thus, the δ18O–temperature slope was almost constant during the 2008–2017, with the exception of 2011 (0.32 ‰ °C−1); when excluding 2011, the range was 0.4–0.63 ‰ °C−1. This slope range is even smaller than the confidence interval of the interannual slope [0.39; 0.83] (Table 1). On the other hand, the slope range variation over 10 years at Concordia Station seems to be smaller than the spatial variation (0.6–0.91 ‰ °C−1), as reported in Masson-Delmotte et al. (2008).
Similar results were also obtained by regressing delta values against TAWS weighted for tpERA5: δ18Otp (0.52 ‰ °C−1) and δ2Htp (3.56 ‰ °C−1) against TAWStp (Fig. S12; Table 1). Finally, regressions computed over annually averaged data also exhibited high coefficients of determination and similar slopes (Figs. S13 and S14). On an annual basis, regression slopes were slightly higher: 0.59 ‰ °C−1 [cross-validated 95 % CI: 0.39–0.83 ‰ °C−1] and 3.9 ‰ °C−1 [2.8–5.5 ‰ °C−1] for δ18O and δ2H, respectively.
Table 1Results of the regressions of delta values against air temperature. BS: assessed by ordinary nonparametric bootstrap resampling. CV: estimated by k-fold cross-validation.
3.3 Local meteoric water lines
The local meteoric water line (LMWL) reveals the linear relationship between δ18O and δ2H (Craig, 1961; Dansgaard, 1964). LMWLs were computed by considering all single samples from the entire study period (Fig. 3) as well as using aggregated data for the entire dataset or over each season. Regression statistics are also summarized in Table 2; the regression coefficients were always statistically significant (p<0.05). The LMWL computed over daily data was as follows:
with r2=0.98 and a prediction error for δ2H of 8.4 ‰ (5-fold cross-validated RMSE); these results are very similar to the values for the 2008–2010 period (δ2H = 6.5 ⋅ δ18O – 68.8) reported by Stenni et al. (2016). The LMWL computed over monthly averaged data weighted for ERA5 total precipitation was
The intercepts (β0) and slopes (β1) of all LMWLs computed with different data and periods are summarized in Fig. 4 along with their cross-validated CI. Generally, the coefficients of the regressions for the weighted and unweighted monthly data return very similar results over the four seasons when accounting for the confidence intervals (Table 2). On the contrary, the LMWLs calculated on a seasonal basis (Fig. 4, color symbols) generally show lower slopes (6.02 [CI: 5.73;6.32]) and intercepts (−86.76 [CI: ]) in austral summers, while higher regression coefficients were recorded in autumns (slope 6.72 [6.58;6.82], intercept −54 []), clearly depicting the seasonal effect over the isotopic composition. Monthly LMWLs on weighted data show slightly higher intercepts and slope values than the daily and unweighted monthly data (Table 2). In all cases, summer LMWLs show lower r2 compared to the other seasons as well as to the entire dataset.
The slope of the LMWL exhibits lower values than the 7.75 obtained by Masson-Delmotte et al. (2008) for the whole Antarctic surface snow database, although it is in better agreement with the one obtained for the last quartile of the isotopic distribution and corresponds to 7.28, for isotopic δ18O values of surface snow below −42.8 ‰. This reflects the lower slope of the MWL when dealing with very depleted precipitation at the final stages of the isotopic distillation line. In agreement with theoretical isotopic models (Jouzel and Merlivat, 1984), the MWL slopes in surface snow of East Antarctica decrease from the coastal areas to the inland plateau (Masson-Delmotte et al., 2008). This decrease directly impacts on the d-excess values (see next section). However, when considering the MWL calculated on the annual average data weighted for ERA5 total precipitation, the slope (7.33) is in very good agreement with the one reported from Masson-Delmotte et al. (2008). Indeed, the surface snow data consider the first few meters of the snowpack, which corresponds, in theory, to the precipitation of several years already “naturally” weighted for precipitation.
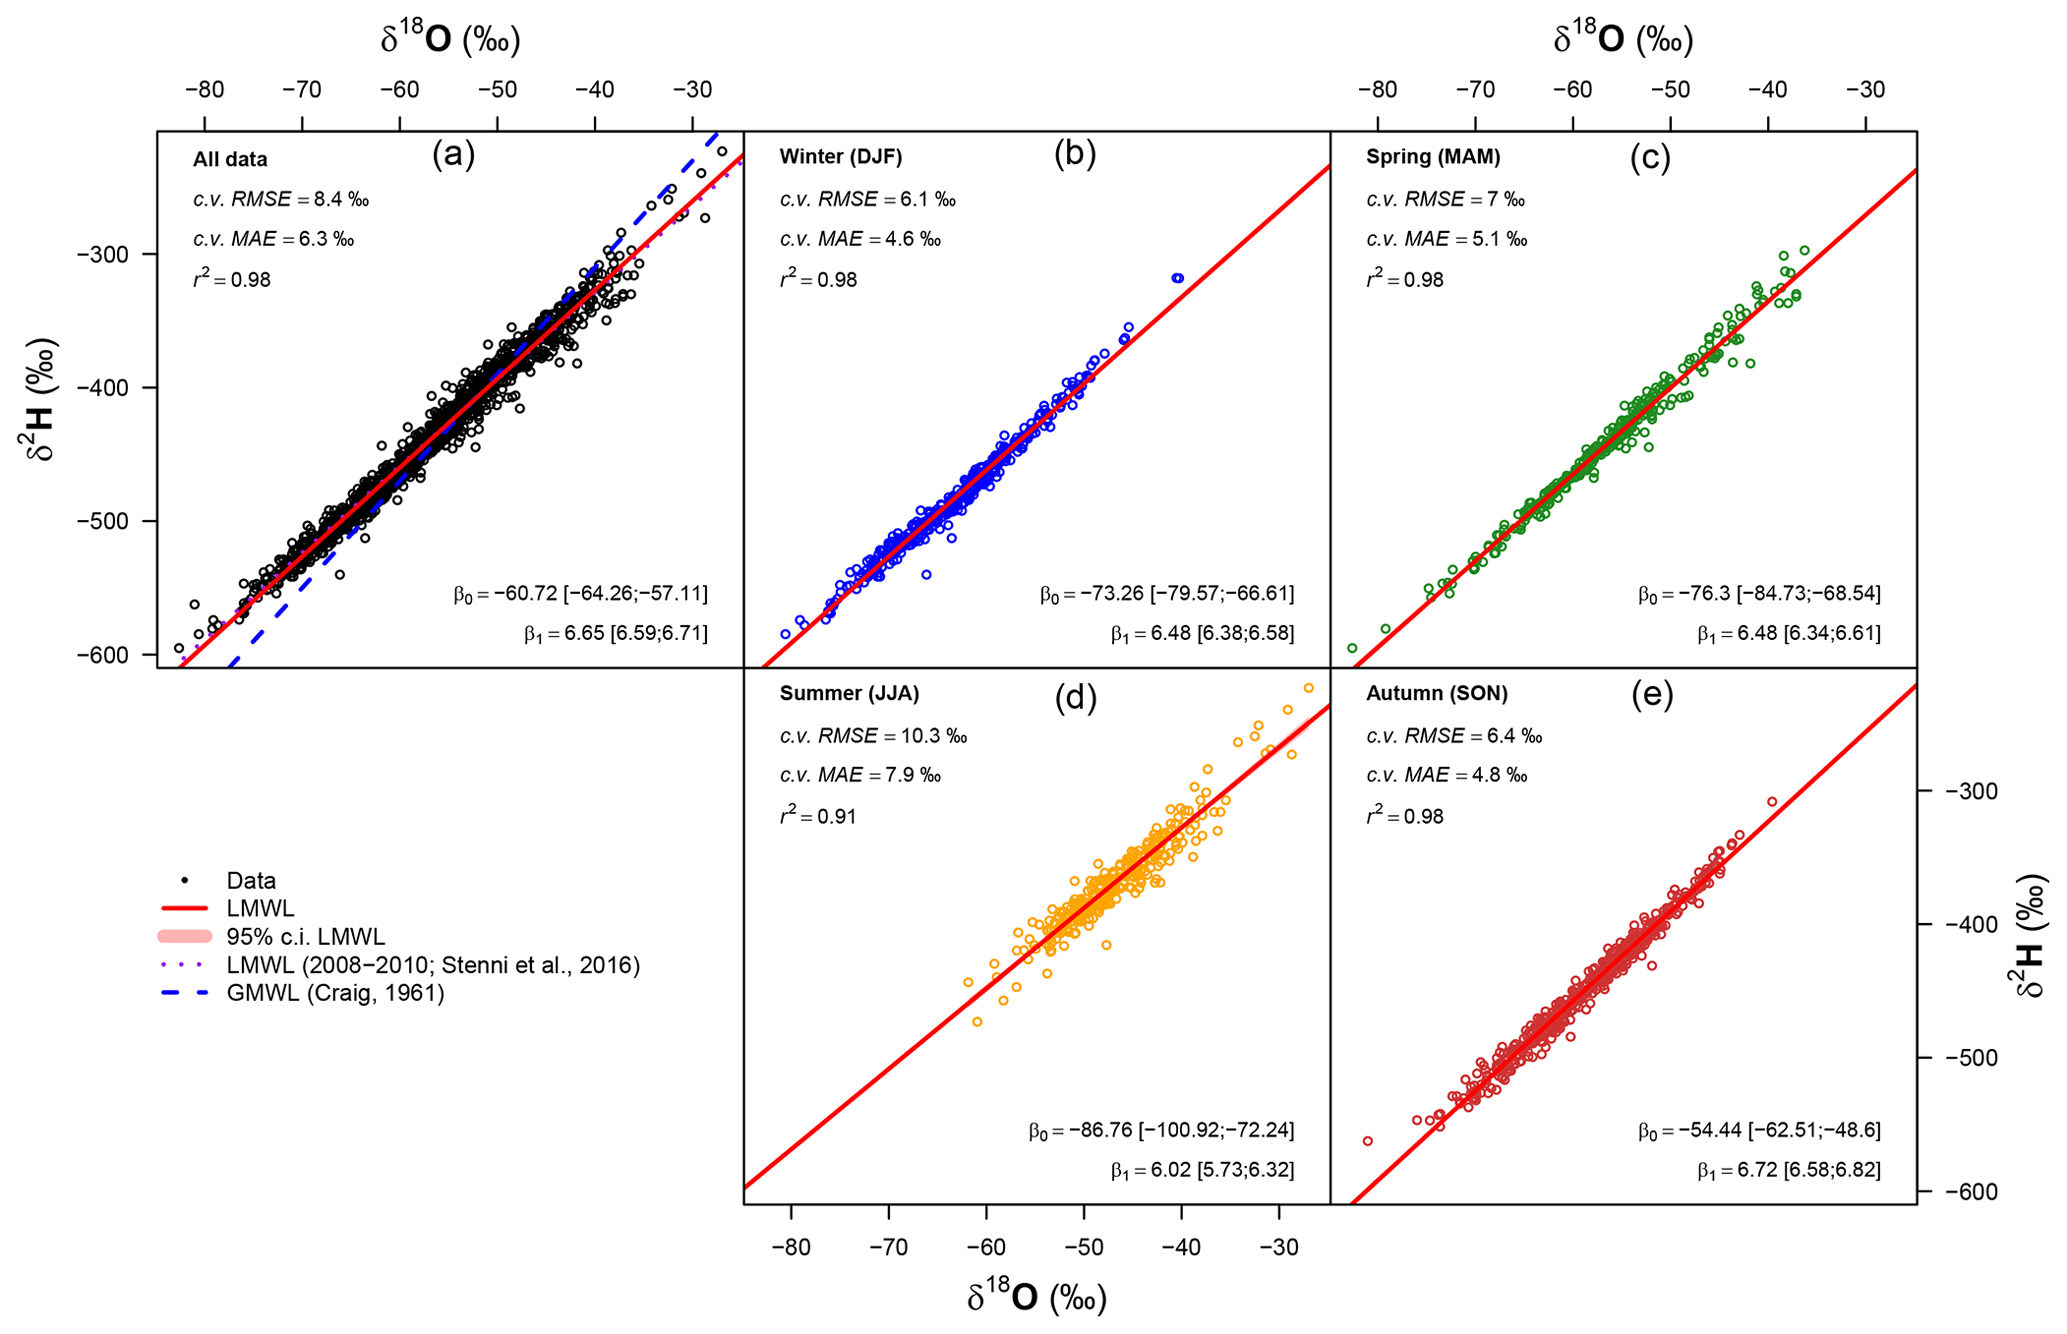
Figure 3Local meteoric water lines computed on the isotopic composition of the daily samples for the entire dataset (a) and for the single seasons. Regression parameters are also summarized in Table 2. The plot for all data also illustrates LMWLs reported by Stenni et al. (2016) and the global meteoric water line by Craig (1961).
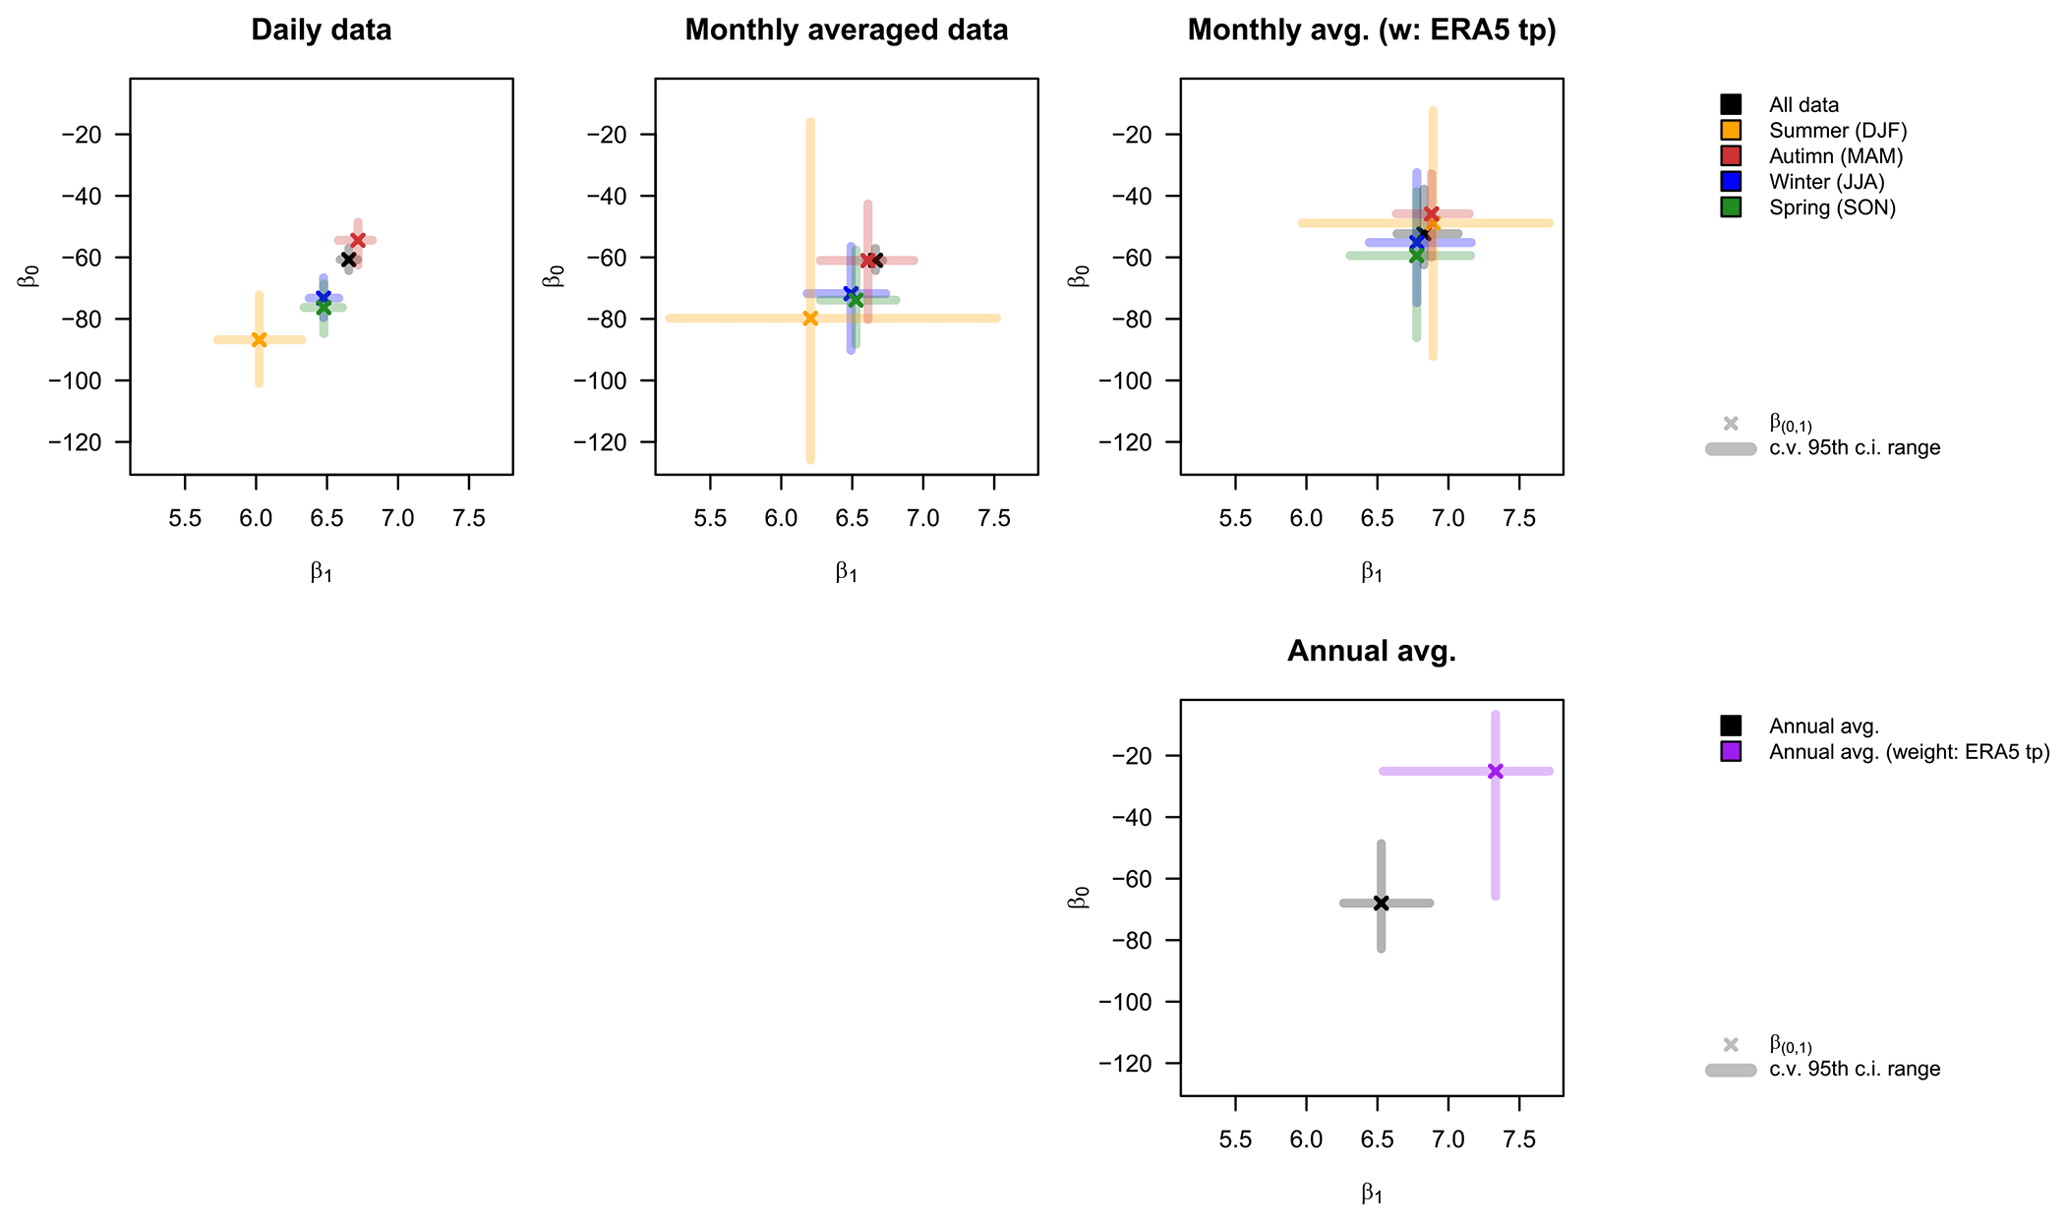
Figure 4Intercepts (β0) and slopes (β1) of all computed LMWLs along with their cross-validated confidence intervals.
Table 2Local meteoric water lines (LMWLs) computed over different time periods.
3.4 Deuterium excess
Deuterium excess varied between −47.3 ‰ and 85.8 ‰ (average 15.6 ‰); the violin plots for the whole period (Figs. S8–S9) show quite symmetrical data distributions (median 15.7 ‰). The seasonal pattern (Fig. 2) inversely followed the air temperature, with higher d-excess generally recorded during austral winters (average JJA 22.5 ‰, average DJF 5.9 ‰). The average seasonal amplitude of d-excess variations between DJF and JJA was 17 ‰. The linear relationships between d-excess and TAWS were weaker than for δ18O and δ2H (r2=0.36 to 0.61; Table 1), with regression slopes of −0.65 ‰ °C−1 for daily data. This relationship is slightly stronger using monthly averaged data (r2=0.57) with a slope of −0.65 ‰ °C−1 and −0.63 ‰ °C−1 for the monthly averaged and the monthly weighted averages, respectively. Annually averaged data show a higher slope (−0.82 ‰ °C−1) and an even stronger relationship (r2=0.61) when using unweighted values.
Deuterium excess exhibits a statistically significant (p<0.05) negative linear relationship with δ18O on daily data (r2=0.67), showing a slope of −1.35 (Fig. S16; Table S1), slightly higher than the value of −1.5 reported by Stenni et al. (2016) for 2008–2010. The linear relationship on daily data is even higher in winter and spring (r2=0.75) but lower in summer (r2=0.53) (Fig. S16). Using the monthly unweighted and weighted data, the slopes are respectively −1.34 and −1.18 for the whole dataset. These relationships are summarized in Fig. 5.
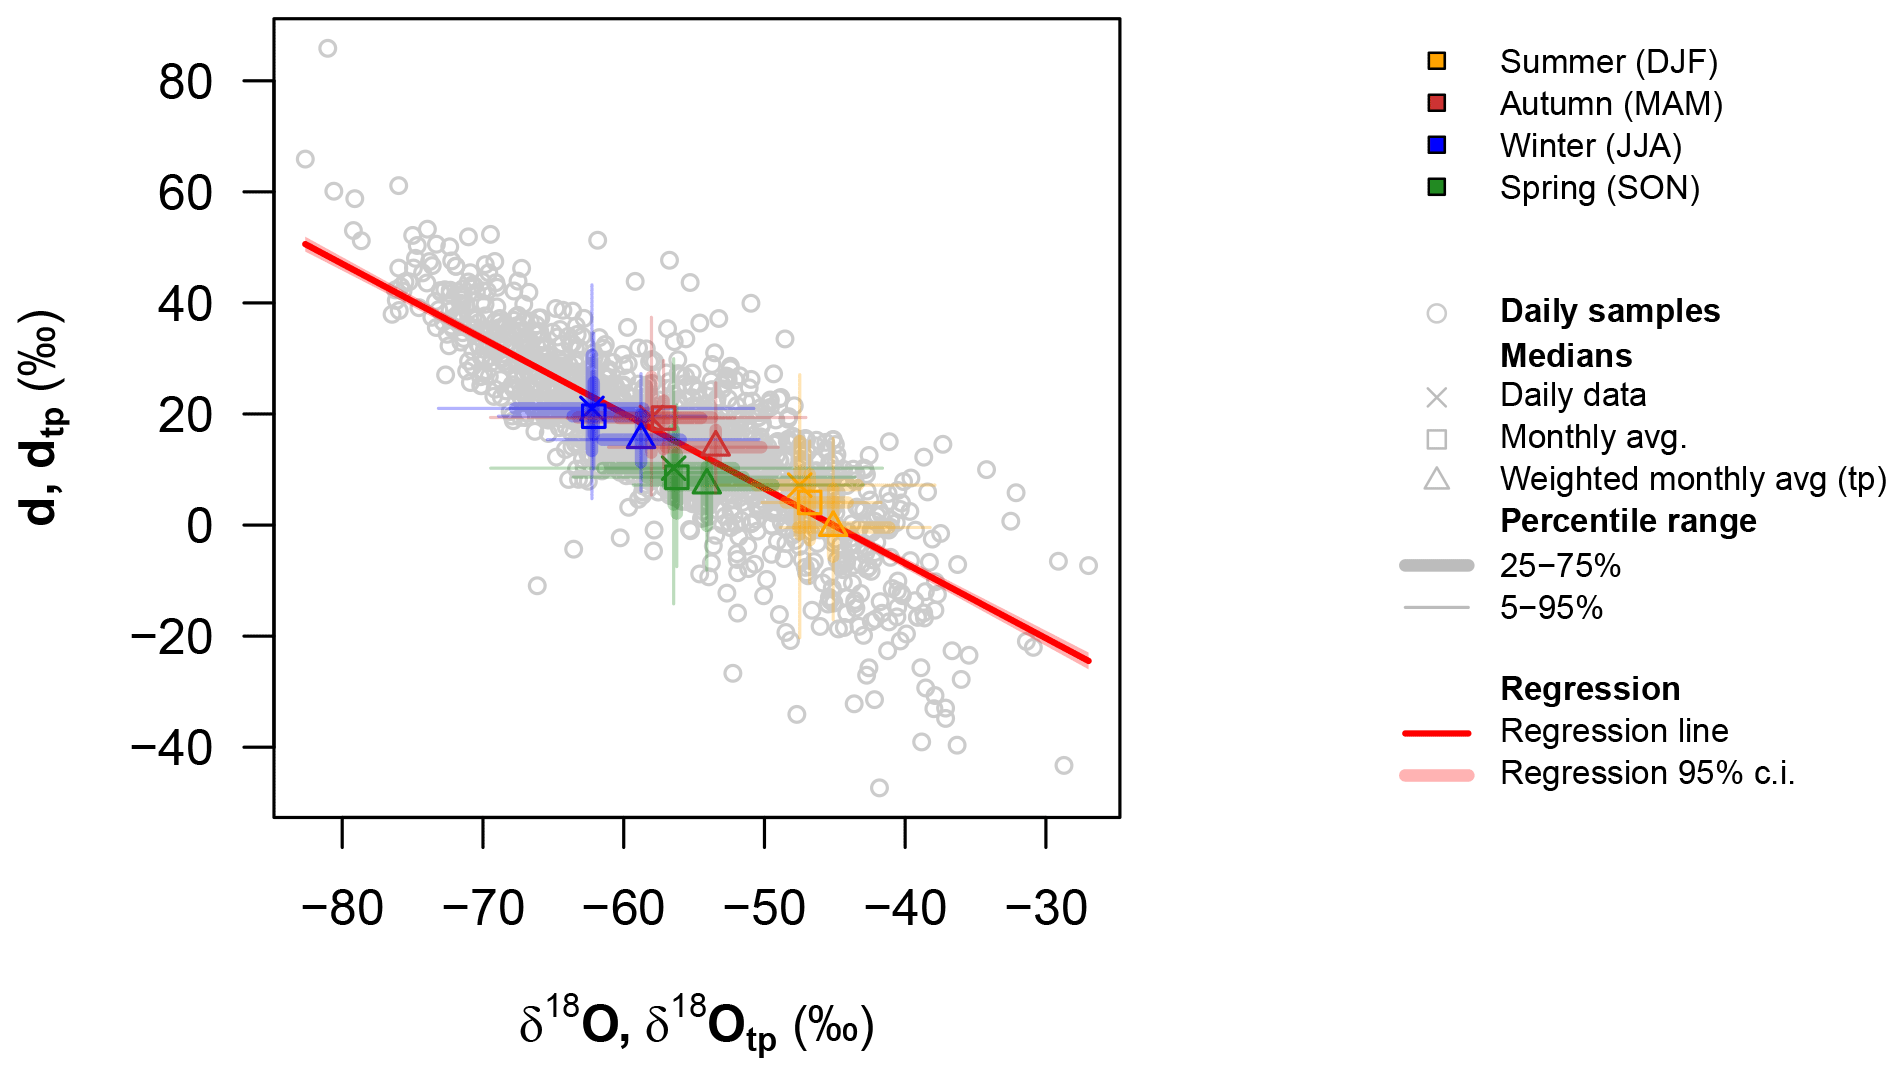
Figure 5Relationships between δ18O and d-excess. The red line represents the linear fit of the data.
The linear relationship between δ18O and d-excess computed on the annually averaged data returns a high coefficient of determination (R2=0.91). However, the one computed on weighted data exhibits a much worse fit.
An anticorrelation between delta values and d-excess has been already reported in precipitation at Dome C (Stenni et al., 2016) and across continental Antarctica, e.g., at Vostok (Ekaykin et al., 2004) and Dome F (Fujita and Abe, 2006), while it was not observed for coastal areas, e.g., Dronning Maud Land (Schlosser et al., 2008) and Law Dome (Delmotte et al., 2000).
The high d-excess values encountered in winter precipitation and the large seasonal amplitude cannot be only explained by a change in the moisture source regions, but its increase might be related to the very low condensation temperature and its effect on d-excess, as well as to the decrease in the slope of the MWL at very low temperatures (Touzeau et al., 2016). Indeed, as previously reported in Craig (1961) and Uemura et al. (2012), any process which deviates from the average δ2H–δ18O slope of 8 (GMWL) can affect the d-excess parameter. To this end, we calculated the logarithmic version of d-excess to assess whether the observed δ2H–δ18O of precipitation better fit a curve rather than a straight line (Uemura et al., 2012), as in the canonical definition of d-excess following the GMWL. The logarithmic transformation effectively reduces the sensitivity of the observed d-excess to observed δ18O (slope from −1.35 to −0.58) and almost flattened the sensitivity of the observed d-excess to observed δ2H (slope from −0.18 to −0.03). Such a smaller sensitivity between δ values and d-excess for the logarithmic transformation highlights that special attention should be paid when dealing with extremely depleted precipitation, since the linear approximation introduced by the GMWL does not hold anymore. This is especially true when attempting to extrapolate any relationship between precipitation d-excess in extremely cold regions and the evaporative conditions of warmer moisture sources. Moreover, different processes might be involved on the precipitation sample before the collection, such as mixing with wind-drifted snow and sublimation (Ritter et al., 2016), which could translate into a smaller δ18O vs. δ2H slope for precipitation samples. The d-excess δ18O ratios were analyzed to better trace the effects of possible sublimation processes (Fig. S17). Seasonally, the ratios closely follow the pattern of air temperature. While most of the ratio values generally led between 0 and −0.7, positive values are also found during austral summer and spring. Positive ratios depict negative values of d-excess; extremely positive values, 0.5 up to 1.5, are recorded in the austral summer.
The d-excess δ18O relationship was stronger during winter and spring and weaker in summer (Table S1 in the Supplement), possibly reflecting the effects of sublimation, due to 24 h summer solar irradiance, during the permanence of snow on the benches before sampling. Sublimation effects, acting preferentially during summer, explain the negative values of d-excess mostly found in the summer period (Casado et al., 2021).
3.5 Correlations between water stable isotope data and meteorological parameters
The daily and monthly averaged isotope data were analyzed to detect the pairwise correlations with other measured or modeled variables. Since the data distribution of some variables is not normal, the nonparametric Kendall rank correlation τ was computed. Delta values were significantly (p<0.05) and moderately (0.35 < τ < 0.6) to highly (τ > 0.6) correlated with air temperature, the temperature of the inversion layer (TINV), RH, surface pressure, and direct solar radiation, both using daily (Fig. S18) and monthly averaged (Fig. S19) data. On the contrary, d-excess was anticorrelated with the temperature of the inversion layer (TINV) and RH. Correlations between weather variables reveal positive relationships between air temperature, TINV, RH, surface pressure, and direct solar radiation. These relationships were generally observed during the whole 2008–2017 period and singularly during the austral autumn, winter, and spring, while correlations in summer (DJF) were generally lower. This latter result might depict the effects of the maximum insolation and possible post-depositional processes upon the isotopic composition of precipitation. Under this view, large diurnal cycles in both surface air temperature and humidity in summer may result from either boundary layer dynamics and/or air–snow sublimation and/or condensation exchanges (Casado et al., 2016). Generally, SAM was not correlated with any other variable except surface pressure.
No statistically significant (p < 0.05) long-term linear trends were identified by the Mann–Kendall test for trends during 2008–2017, either using all the monthly averaged data or analyzing each season separately.
The outputs of the ECHAM5-wiso and ECHAM6-wiso model releases are compared with experimental data. In this paper, we mainly focused on ECHAM6-wiso model results, while in the SI we also reported the comparison between observations (collected precipitation) and ECHAM5-wiso.
For these comparisons there are some limitations to consider. First, until 2010 samples had been collected when at least 5 mL of water equivalent of snow was found on the platform to allow for analysis using the IRMS-equilibration technique, while smaller samples had been collected later due to the availability of the CRDS technique in the laboratory, which requires a smaller amount of water. Thus, the initial experimental data could be representative of higher accumulation events on the bench, which could be caused by more intense precipitation events as well as by a significant amount of wind-drifted snow. The samples collected on the platform could also be affected by snow blown either in or out by winds. Finally, although the operators monitored the platform on a daily basis, post-depositional modification of the isotopic composition of the samples may have happened due to sublimation and/or condensation.
ECHAM5-wiso model simulated 2900 precipitation events in 2008–2017, while ECHAM6-wiso reports 3017; i.e., both models simulated about twice as many precipitation days compared to the experimentally collected samples. Four cases can be observed with respect to the agreement or disagreement between the models and the experimental observations, as reported in Figs. S20 and S21 (both no precipitation, both precipitation, precipitation only on experimental samples, and precipitation only simulated by models). Figures show that both model versions (ECHAM5-wiso and ECHAM6-wiso) simulated no precipitation when no sample was collected in the platform for about 13 % of the days. Conversely, model results imply that precipitation and snow samples were collected during 37 % of the period. This result indicates that for half of the period under consideration there was agreement/disagreement between models and collected snow. In particular, the greatest difference (46 % of the period) is found when the models simulate precipitation, while no sample was collected at Concordia.
The reason for this difference is not clear. Figures S20 and S21 also report the amount of precipitation estimated by ERA5 in the four cases, i.e., when the models and experimental observations agree or not. Precipitation rates from ERA5 are very small for days when both ECHAM-wiso model versions and experimental observations report no precipitation, while significantly higher values are modeled when both have snow. However, for days when there is a disagreement between models and collected samples, ERA5 predicts less precipitation when only samples have been collected. This could indicate samples affected by snowdrift; however, there are no major differences in wind speed between the four groups to support this hypothesis. Evaporation estimated by ERA5 also shows no strong variation between the four cases. Instead, there are significant differences for air temperature, RH, and direct solar irradiance, all weather variables showing strong seasonality (Fig. S3).
Figure 6 shows the time series of the delta values analyzed experimentally and modeled by the ECHAM6-wiso model (the comparison between delta values from ECHAM5-wiso and experimental data is shown in Fig. S22). Modeled δ18O varied between −105 ‰ and −25 ‰ (average −53.8 ‰), while modeled δ2H varied between −938 ‰ and −191 ‰ (average −424 ‰) in ECHAM6-wiso. Modeled d-excess spans between −97 ‰ and 86 ‰ (average 7 ‰) with a standard deviation of 10 ‰, which is 5 ‰ smaller than the one observed for precipitation. The violin plots in Figs. S8 and S9 show that data distributions were quite wider than the experimental data, especially in the case of ECHAM5-wiso. Overall, the δ18O and δ2H simulated data were less negative than the observations with a larger difference during winter and summer.
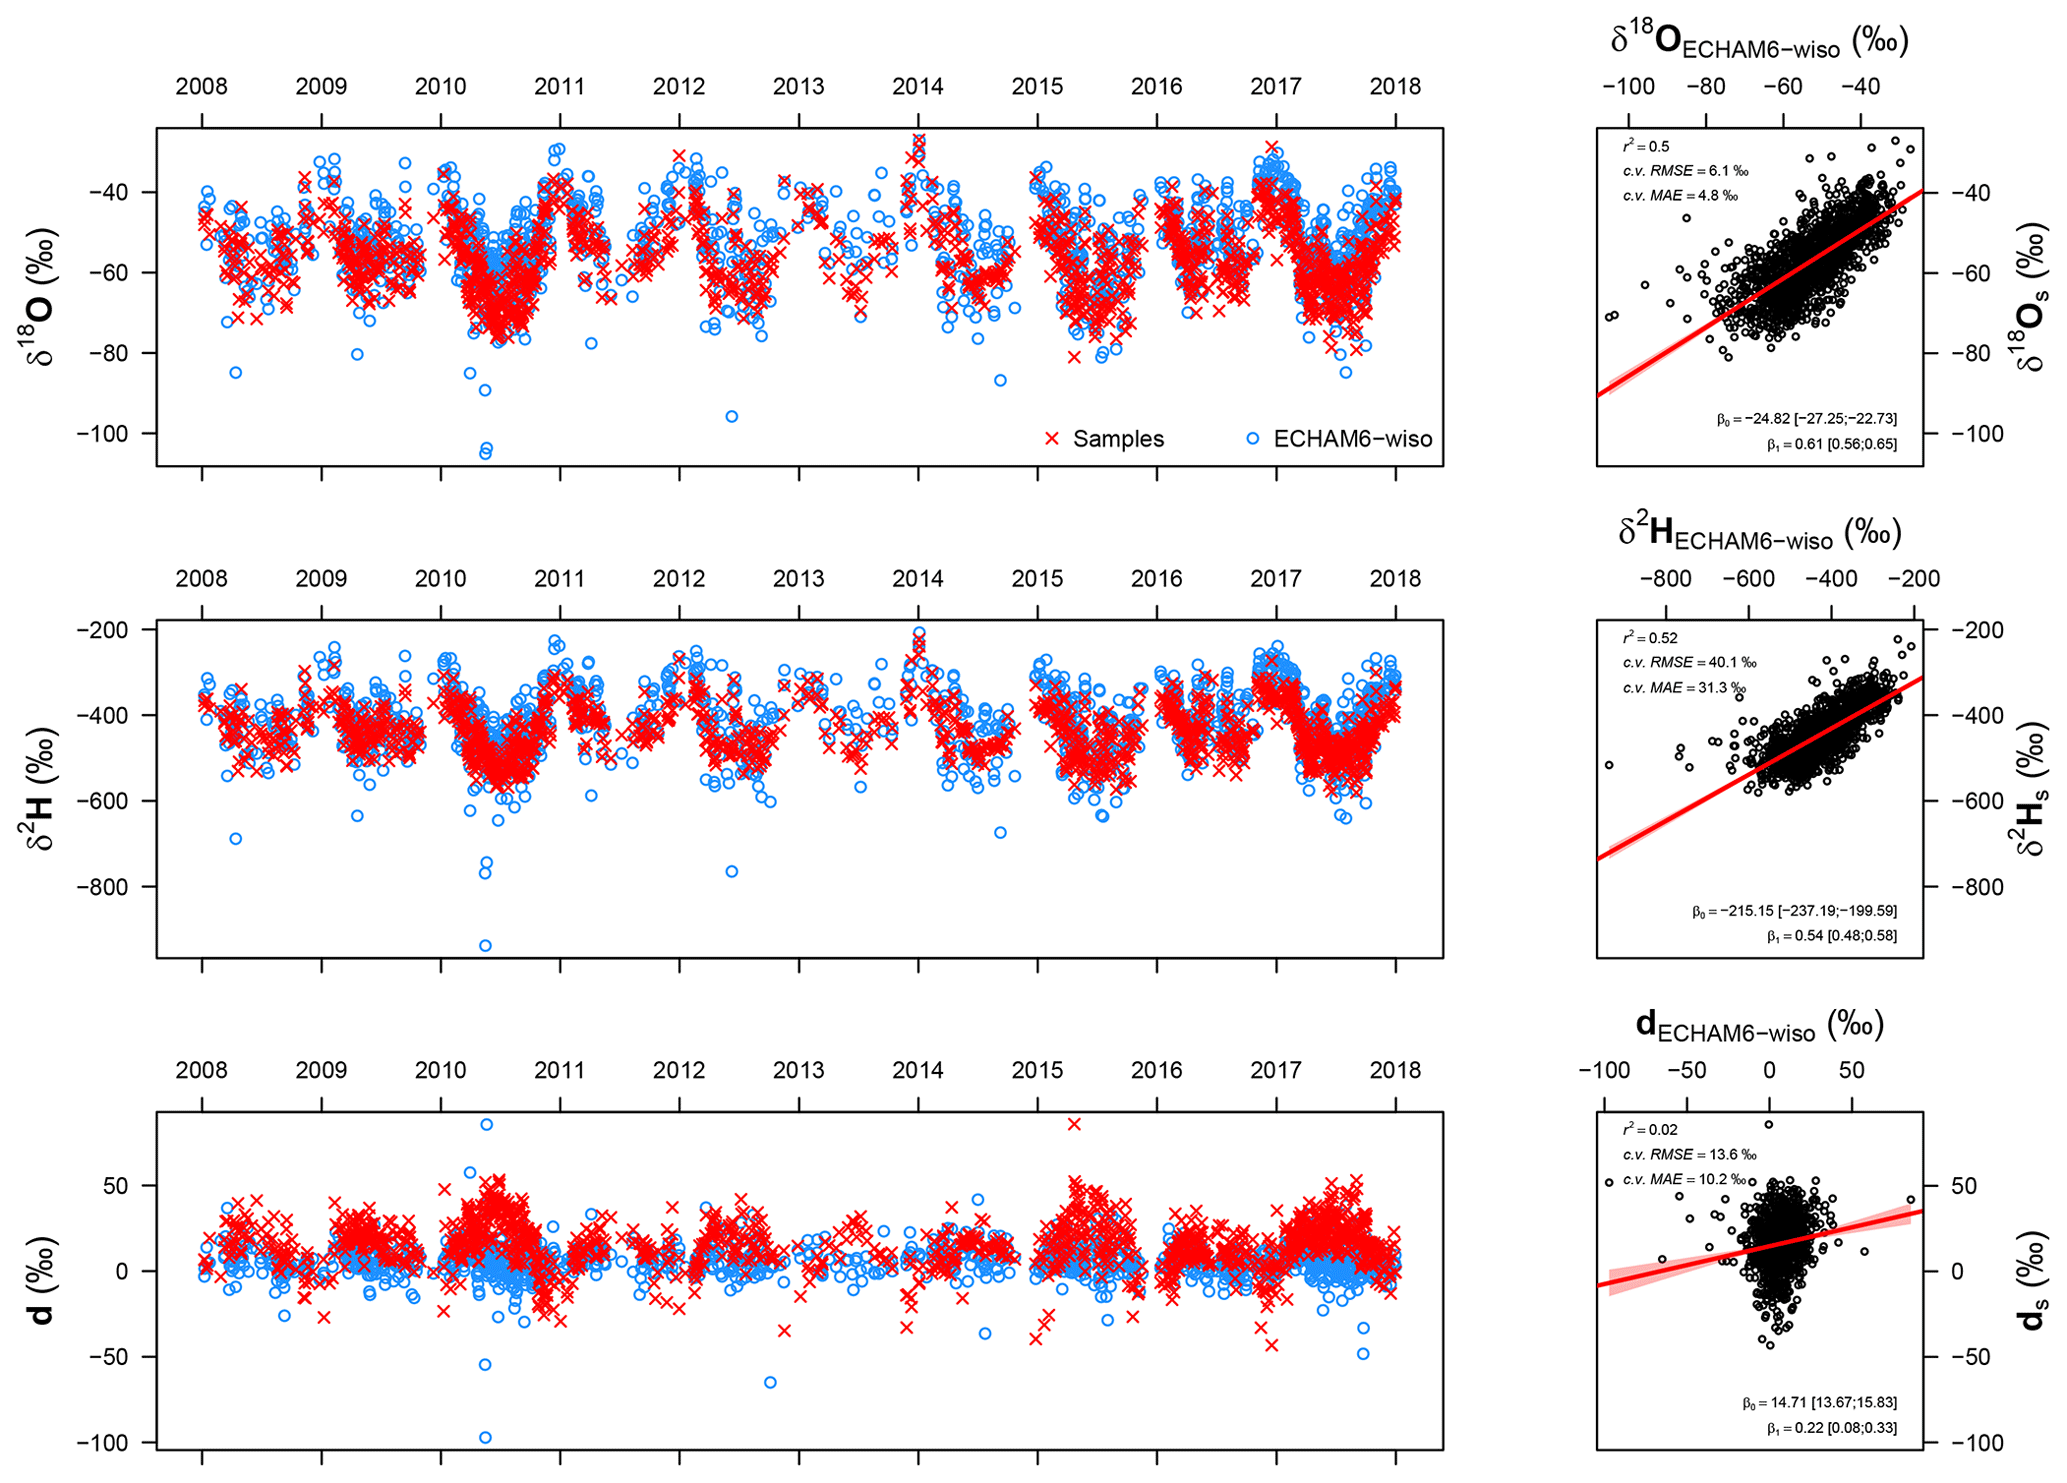
Figure 6Time series of the delta values analyzed experimentally (red crosses) and modeled by the ECHAM6-wiso model (blue circles) and their linear regressions. The scatterplots report only the days with both experimental and modeled precipitation data.
The linear relationships between observations and simulated daily data from ECHAM6-wiso are reported in Fig. 6. Moderately good relationships were found for δ18O (r2=0.5) and δ2H (r2=0.52) values, while no relationship was found for d-excess (r2=0.02) (Figs. S24 and S25).
Figure 7 reports the comparison of the seasonal variations of experimentally determined data (observations) and simulated data from ECHAM6-wiso, which confirms the overestimation (less negative values) of the model δ18O and δ2H data compared to observations. Larger overestimations are found in summer for both isotopic ratios, particularly in December and January. For δ18O alone, a larger overestimation is also found in June (winter). This overestimation was also present in the simulated T2 m compared to TAWS, which could in part explain the overestimated isotopic values, although no significant correlation exists between the difference of observed and modeled temperatures vs. the observed and modeled isotopic values.
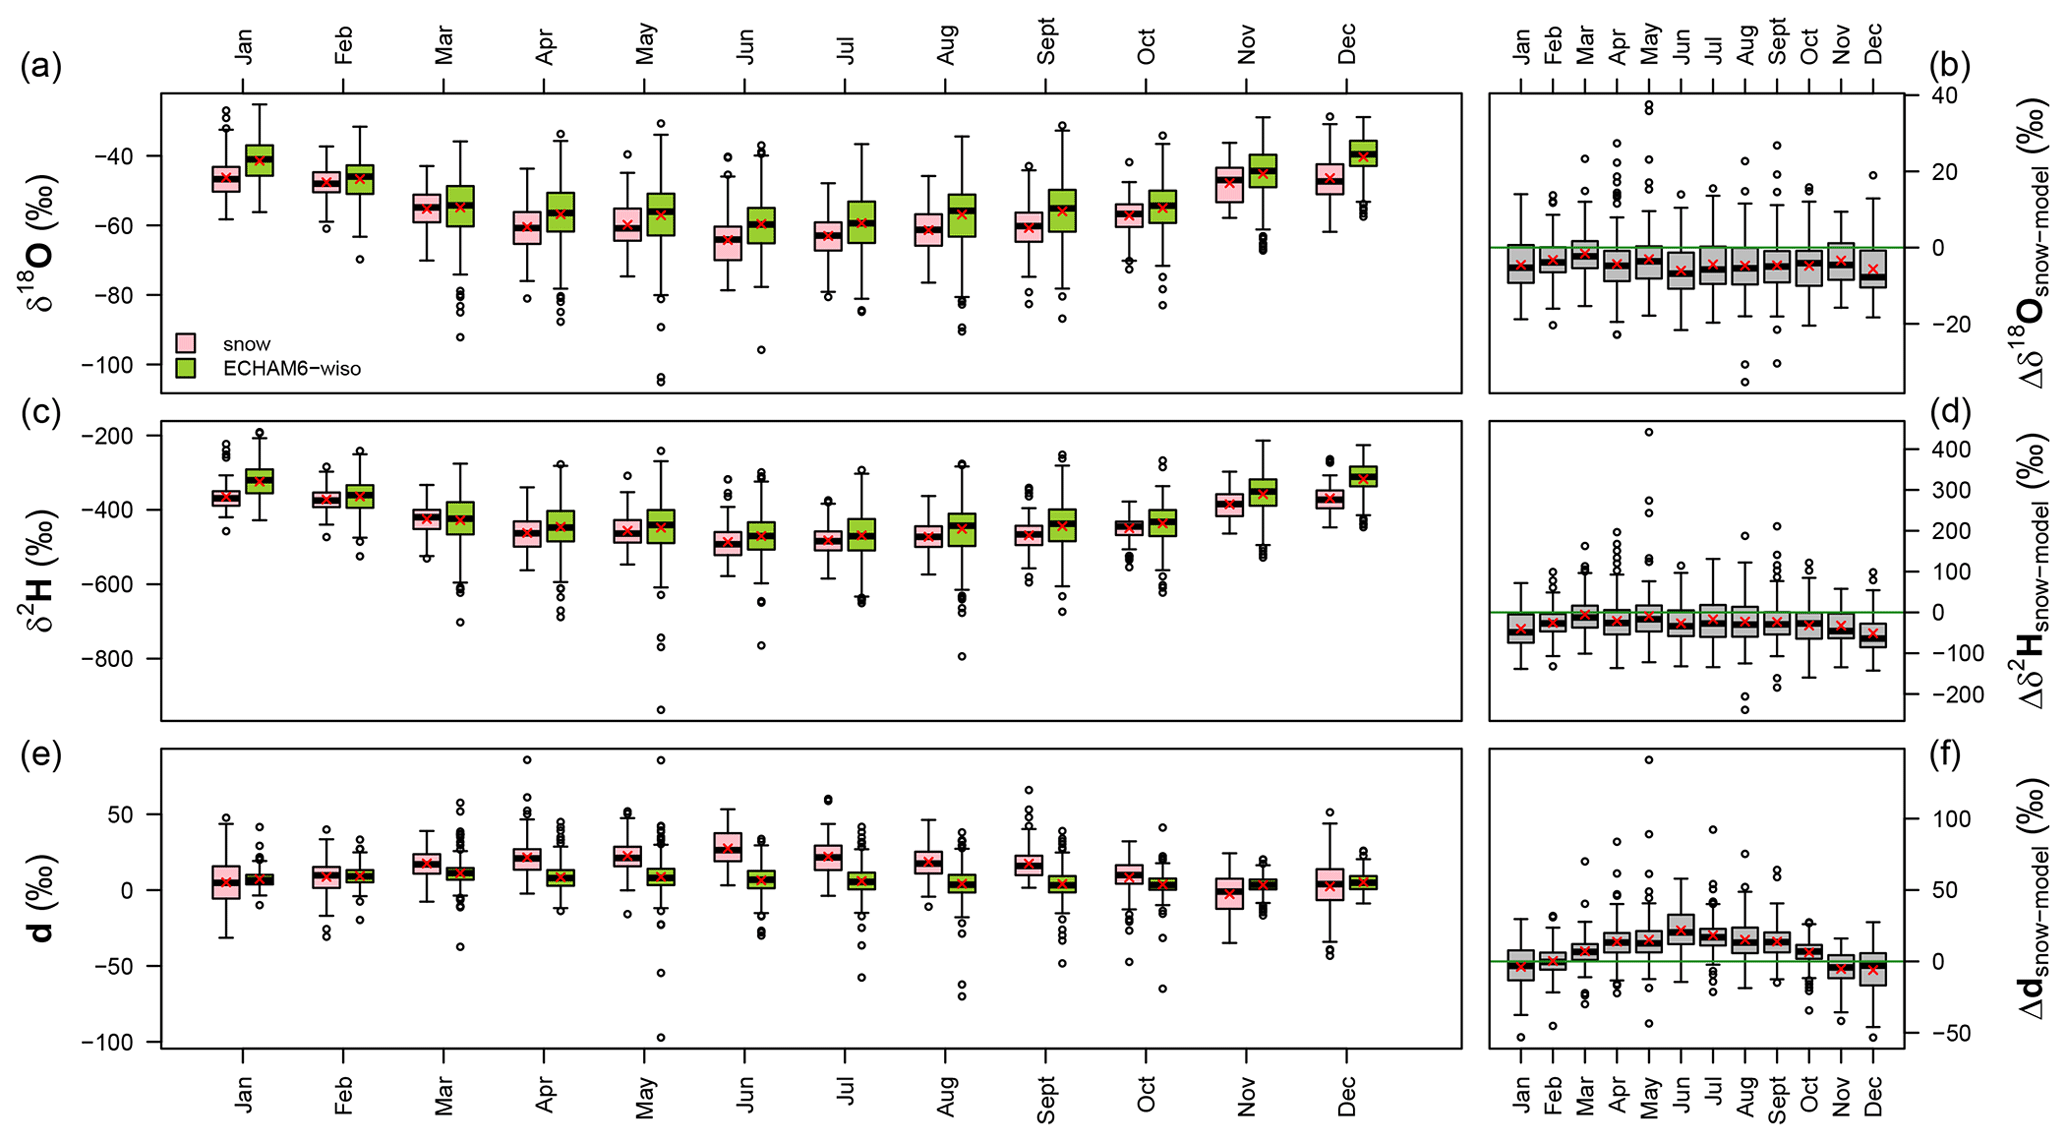
Figure 7Seasonal variation of the experimentally measured isotopic data and ECHAM6-wiso modeled data (a, c, e) and their differences (b, d, f). Line: median, box: interquartile range, whiskers: ±1.5 interquartile range, circles: outliers and extremes, red crosses: arithmetic mean.
A moderate linear relationship is found between the observed and modeled d-excess vs. temperature (r2=0.27), which might indicate the effect of seasonality in model performances simulating kinetic fractionation or non-resolved sub-grid processes. Indeed, such a relationship is more scattered during summer and winter (r2≤0.06) and more robust during spring (r2=0.30).
The local meteoric water lines (LMWLs) computed over different time periods using ECHAM6-wiso outputs are reported in Table S5. The slope (β1) obtained from all daily data is 7.66 (±0.02), in good agreement with the one obtained from Masson-Delmotte et al. (2008) for the whole Antarctic surface snow dataset (7.75) but slightly higher than the one for the more negative inland values (7.28). On the contrary, ECHAM5-wiso simulated lower slope values (Table S3; 6.22 ± 0.03), in better agreement with observations from this study (6.65 ± 0.02).
The simulated d-excess showed the largest discrepancies. Overall, a smaller seasonal amplitude was observed in the d-excess simulated data with the largest discrepancy in winter, which showed lower values than observations; however, the tuning of the supersaturation function could contribute to the d-excess discrepancy.
The relationship between isotopic ratios and temperature simulated by ECHAM6-wiso (Fig. S23 and Table S4) exhibited slightly higher slopes than the observed data. The simple linear relationship of daily values of δ18O and δ2H with T2 m was moderate (r2=0.5 and 0.53, respectively). The regression slopes were 0.67 ‰ °C−1 [cross-validated 95 % CI: 0.65–0.69 ‰ °C−1] and 5.34 ‰ °C−1 [5.17–5.51 ‰ °C−1] for δ18O and δ2H, respectively. These positive relationships become stronger on monthly averaged data (r2=0.88 and 0.9 for δ18O and δ2H, respectively) with slopes values of 0.61 ‰ °C−1 [CI: 0.57–0.65 ‰ °C−1] and 4.87 ‰ °C−1 [CI: 4.6–5.17 ‰ °C−1] for δ18O and δ2H, respectively. Finally, regressions computed over annually averaged unweighted simulated data exhibited high coefficients of determination but higher slopes (Table S4). On an annual basis, regression slopes were 0.87 ‰ °C−1 [cross-validated 95 % CI: 0.43–1.13 ‰ °C−1] and 7.36 ‰ °C−1 [4.22–9.36 ‰ °C−1] for δ18O and δ2H, respectively. Interestingly, when looking at precipitation-weighted annual data, these slopes became very low (0.28 and 2.6) but with low coefficients of determination (0.29 and 0.34), for both δ18O and δ2H, respectively.
The results of the comparison between observations and simulated data using the outputs from ECHAM6-wiso are in relatively good agreement with what was previously reported by Goursaud et al. (2018) in their comparison using model outputs from ECHAM5-wiso and field data from the whole Antarctic continent. They also found a warm model bias over central Antarctica as observed in the present study and an overall agreement in the spatial distribution of the isotopic values.
In this study, we presented a 10-year record of the isotopic composition (δ18O, δ2H and d-excess) of daily collected precipitation samples at Concordia Station, East Antarctica, from 2008 to 2017; this represents a unique dataset for inland Antarctica. Despite the difficulties related to collecting samples in such a harsh environment, especially during the Antarctic winter, the daily work of the winter-over personnel of Concordia Station has allowed the building of an unprecedented database, which will be of extreme importance for interpreting the climate record from oxygen and hydrogen stable isotopes that the Beyond EPICA 1.5-million-year ice core will soon provide, as well as other East Antarctic ice core isotopic records. To this end, a comprehensive statistical analysis was performed on our precipitation isotopic data, correlated with the instrumental meteorological records and the outputs from the isotope-enabled ECHAM5-wiso and ECHAM6-wiso model versions. The bench used to collect precipitation stands 1 m from the ground and is shielded by an 8 cm rail on three out of four sides, but wind scouring might still remove part of the accumulation, and wind-drifted snow might still contribute to the deposition collected on the bench, altering the original isotopic composition of precipitation. During summer months, the snow on the bench might also be subjected to sublimation due to the direct solar irradiation for the hours preceding the sampling; this could explain the occurrence of negative d-excess values in this season. Despite these limitations, the dataset presented in this study is the closest we could get to daily precipitation for a continuous 10-year period at Concordia.
The precipitation isotopic composition and the surface temperature showed a marked seasonal variation over the investigated period with a moderately high linear relationship at the daily scale. The relationship becomes stronger when using monthly averages. The δ18O (and δ2H) to TAWS slope of 0.52 ‰ °C−1 (and 3.52 ‰ °C−1) computed on the daily values slightly increases to 0.59 ‰ °C−1 (and 3.9 ‰ °C−1) when computed over annually averaged data, although no statistically significant (p<0.05) long-term linear trends were identified during the 2008–2017 period. The LMWL computed over the entire dataset and those calculated for each season are characterized by lower slopes compared to the 7.75 value found by Masson-Delmotte et al. (2008) for Antarctic surface snow and also lower than the 7.28 reported in the same study for δ18O values below −42.8 ‰. Even lower slopes are observed in this study when considering only summer (DJF) data, with a slightly worse determination coefficient; this seasonal bias might also be due to the effect of sublimation (Ritter et al., 2016; Casado et al., 2021). The high d-excess values found in winter, as well as their seasonal amplitude, are mostly due to the extremely low condensation temperature rather than to changes in moisture origin. The 10-year dataset of the isotopic composition of precipitation presented in this study has allowed us to perform a comparison between the observed and modeled (ECHAM5 and ECHAM6-wiso) δ18O and δ2H of precipitation. ECHAM6-wiso showed, on average, less negative simulated delta values compared to the measured samples, with larger differences during winter, spring, and summer and smaller differences observed in autumn. The different d-excess output from the two model versions could be caused by minor changes in the equation of the supersaturation function, as well as by differences in the modeled influence of the sea ice and the different treatment of wind speed influence on kinetic fractionation during evaporation processes. It is also worth mentioning that ECHAM5-wiso is nudged to ERA-interim, while ECHAM6-wiso is nudged to ERA5. ECHAM6-wiso also better captured the amplitude of seasonal variations compared to ECHAM5-wiso. The LMWL computed over ECHAM5-wiso daily data returned a slope of 6.22, while ECHAM6-wiso daily data provided a slope of 7.66, which is similar to the one found by Masson-Delmotte et al. (2008) for Antarctic surface snow (7.75) but higher than the one obtained with measured data (6.65) in this study. However, we have to consider that while ECHAM-wiso models simulate the isotopic composition of precipitation, the snow we sample on the bench is the result of precipitation combined with possible post-depositional processes such as sublimation and snow blown onto or off the platform by the wind.
To conclude, the dataset presented here represents a unique record, which, together with the meteorological data, will provide a valuable contribution for the comprehension of the mechanisms determining the isotopic composition of precipitation in inland Antarctica and will hopefully benefit the ice core record climatic interpretation in the future. The isotopic composition of the precipitation dataset could also be used as the input of isotope-enabled snowpack models.
The collection of daily precipitation samples at Dome C is still ongoing, and the data since 2018 will be presented in future publications within the ITN DEEPICE project, where the 2017–2021 dataset will also be compared to surface and sub-surface snow samples at Concordia.
Isotope data are made available in Zenodo: https://doi.org/10.5281/zenodo.10197160 (Dreossi et al., 2023). ERA5 hourly data on single levels from 1940 to present are available through the Copernicus Climate Data Store (CDS): https://doi.org/10.24381/cds.adbb2d47 (Hersbach et al., 2023). The Antarctic Meteo-Climatological Observatory AWS Concordia data are available upon request at https://doi.org/10.12910/DATASET2022-002 (Grigioni et al., 2022a). Dome C II AMRC AWSs are available at ftp://amrc.ssec.wisc.edu/pub/aws/q1h/ (Antarctic Meteorological Research Center, 2014). Radiosounding data are available upon request at https://doi.org/10.12910/DATASET2022-004 (Grigioni et al., 2022b). The Baseline Surface Radiation Network (BSRN) data are available at https://dataportals.pangaea.de/bsrn/ (Lupi, 2024). AAO (SAM) index monthly data are available at https://www.cpc.ncep.noaa.gov/products/precip/CWlink/daily_ao_index/aao/aao.shtml (NOAA, 2024). RHi experimentally obtained by Genthon et al. (2017) were retrieved from https://web.lmd.jussieu.fr/%7Ecgenthon/SiteCALVA/Datas/m30-date.dat (last access: 19 August 2024). The ECHAM5-wiso and ECHAM6-wiso used in this study are published in Zenodo (https://doi.org/10.5281/zenodo.11468043, Cauquoin and Werner, 2024). The full dataset used for the present publication is also available in Zenodo (https://doi.org/10.5281/zenodo.11613330, Dreossi et al., 2024) and includes daily data, monthly averaged data, precipitation-weighted monthly averages, annually averaged data, and precipitation-weighted annually averaged data.
The supplement related to this article is available online at: https://doi.org/10.5194/tc-18-3911-2024-supplement.
GD and BS designed the research. GD, BS, and VP performed the lab analysis. MW and AC provided the ECHAM-wiso data. MM performed the data analysis. MM, GD, and BS drafted the first version of the paper. DZ, CS, VC, MC, AL, MW, AC, GC, and MDG contributed to the writing of the paper. GC provided valuable information on precipitation sampling.
The contact author has declared that none of the authors has any competing interests.
Publisher’s note: Copernicus Publications remains neutral with regard to jurisdictional claims made in the text, published maps, institutional affiliations, or any other geographical representation in this paper. While Copernicus Publications makes every effort to include appropriate place names, the final responsibility lies with the authors.
This article is part of the special issue “Ice core science at the three poles (CP/TC inter-journal SI)”. It is a result of the IPICS 3rd Open Science Conference, Crans-Montana, Switzerland, 2–7 October 2022.
The meteorological dataset and information are archived by the Italian Antarctic Meteo-Climatological Observatory (IAMCO) https://www.climantartide.it (last access: 19 August 2024) in the framework of the PNRA/IPEV project Routine Meteorological Observation at Concordia Station. The authors appreciate the support of the University of Wisconsin-Madison Automatic Weather Station Program for the dataset, data display, and information, NSF grant number 1924730. We acknowledge using data from (i) the CALVA project and CENECLAM and GLACIOCLIM observatories and (ii) the Baseline Surface Radiation Network (BSRN, https://bsrn.awi.de/, last access: 19 August 2024). We also acknowledge Quantarctica and the Norwegian Polar Institute for providing the ETOPO1, IBCSO, and RAMP2 data for basemap usage; the US National Ice Center (USNIC) for providing a shapefile with polygons representing Antarctic ice shelves and land features; and the UK Polar Data Centre, the Natural Environment Research Council, and the UK Research and Innovation for providing the medium-resolution vector polygons of the Antarctic coastline. The precipitation measurements at Dome C as well as the isotopic analysis have been conducted in the framework of projects PNRA 2013/AC3.05 (PRE-REC) and PNRA18_00031 (WHETSTONE) of the Italian National Antarctic Research Program Programma Nazionale di Ricerche in Antartide (PNRA) funded by MIUR (now MUR). We would also like to thank the logistics staff and winter-over crews at Concordia Station for all the investigated periods.
This research has been supported by the Ministero dell'Istruzione, dell'Università e della Ricerca (grant no. PNRA18_00031 (WHETSTONE) and grant no. PNRA 2013/AC3.05 (PRE-REC)).
This paper was edited by Emilie Capron and reviewed by three anonymous referees.
Antarctic Meteorological Research Center (AMRC): Automatic Weather Research Project, https://amrc.ssec.wisc.edu/, last access: 19 August 2014.
Argentini, S., Pietroni, I., Mastrantonio, G., Viola, A. P., Dargaud, G., and Petenko, I.: Observations of near surface wind speed, temperature and radiative budget at Dome C, Antarctic Plateau during 2005, Antarct. Sci., 26, 104–112, https://doi.org/10.1017/S0954102013000382, 2014.
Baas, P., van de Wiel, B. J. H., van Meijgaard, E., Vignon, E., Genthon, C., van der Linden, S. J. A., and de Roode, S. R.: Transitions in the wintertime near-surface temperature inversion at Dome C, Antarctica, Q. J. Roy. Meteor. Soc., 145, 930–946, https://doi.org/10.1002/qj.3450, 2019.
Bai, J., Zong, X., Lanconelli, C., Lupi, A., Driemel, A., Vitale, V., Li, K., and Song, T.: Long-Term Variations of Global Solar Radiation and Its Potential Effects at Dome C (Antarctica), Int. J. Env. Res. Pub. He., 19, 3084, https://doi.org/10.3390/ijerph19053084, 2022.
Bromwich, D. H., Guo, Z. C., Bai, L. S., and Chen, Q. S.: Modeled Antarctic precipitation. Part I: Spatial and temporal variability, J. Climate, 17, 427–447, https://doi.org/10.1175/1520-0442(2004)017<0427:MAPPIS>2.0.CO;2, 2004.
Buizert, C., Fudge, T. J., Roberts, W. H. G., Steig, E. J., Sherriff-Tadano, S., Ritz, C., Lefebvre, E., Edwards, J., Kawamura, K., Oyabu, I., Motoyama, H., Kahle, E. C., Jones, T. R., Abe-Ouchi, A., Obase, T., Martin, C., Corr, H., Severinghaus, J. P., Beaudette, R., Epifanio, J. A., Brook, E. J., Martin, K., Chappellaz, J., Aoki, S., Nakazawa, T., Sowers, T. A., Alley, R. B., Ahn, J., Sigl, M., Severi, M., Dunbar, N. W., Svensson, A., Fegyveresi, J. M., He, C., Liu, Z., Zhu, J., Otto-Bliesner, B. L., Lipenkov, V. Y., Kageyama, M., and Schwander, J.: Antarctic surface temperature and elevation during the Last Glacial Maximum, Science, 372, 1097–1101, https://doi.org/10.1126/science.abd2897, 2021.
Canty, A. and Ripley, B.: boot: Bootstrap R (S-Plus) Functions. R package version 1.3-28.1, https://CRAN.R-project.org/package=boot (last access: 19 August 2024), 2022.
Casado, M., Landais, A., Masson-Delmotte, V., Genthon, C., Kerstel, E., Kassi, S., Arnaud, L., Picard, G., Prie, F., Cattani, O., Steen-Larsen, H.-C., Vignon, E., and Cermak, P.: Continuous measurements of isotopic composition of water vapour on the East Antarctic Plateau, Atmos. Chem. Phys., 16, 8521–8538, https://doi.org/10.5194/acp-16-8521-2016, 2016.
Casado, M., Orsi, A., and Landais, A.: On the limits of climate reconstruction from water stable isotopes in polar ice cores, Past Glob. Chang. Mag., 25, 146–147, https://doi.org/10.22498/pages.25.3.146, 2017.
Casado, M., Landais, A., Picard, G., Münch, T., Laepple, T., Stenni, B., Dreossi, G., Ekaykin, A., Arnaud, L., Genthon, C., Touzeau, A., Masson-Delmotte, V., and Jouzel, J.: Archival processes of the water stable isotope signal in East Antarctic ice cores, The Cryosphere, 12, 1745–1766, https://doi.org/10.5194/tc-12-1745-2018, 2018.
Casado, M., Münch, T., and Laepple, T.: Climatic information archived in ice cores: impact of intermittency and diffusion on the recorded isotopic signal in Antarctica, Clim. Past, 16, 1581–1598, https://doi.org/10.5194/cp-16-1581-2020, 2020.
Casado, M., Landais, A., Picard, G., Arnaud, L., Dreossi, G., Stenni, B., and Prié, F.: Water Isotopic Signature of Surface Snow Metamorphism in Antarctica, Geophys. Res. Lett., 48, e2021GL093382, https://doi.org/10.1029/2021GL093382, 2021.
Cauquoin, A. and Werner, M.: High-Resolution Nudged Isotope Modeling With ECHAM6-Wiso: Impacts of Updated Model Physics and ERA5 Reanalysis Data, J. Adv. Model. Earth Sy., 13, e2021MS002532, https://doi.org/10.1029/2021MS002532, 2021.
Cauquoin, A. and Werner, M.: ECHAM6-wiso and ECHAM5-wiso isotope daily data at Dome Concordia station, East Antarctica, Zenodo [data set], https://doi.org/10.5281/zenodo.11468043, 2024.
Cauquoin, A., Werner, M., and Lohmann, G.: Water isotopes – climate relationships for the mid-Holocene and preindustrial period simulated with an isotope-enabled version of MPI-ESM, Clim. Past, 15, 1913–1937, https://doi.org/10.5194/cp-15-1913-2019, 2019.
Cauquoin, A., Abe-Ouchi, A., Obase, T., Chan, W.-L., Paul, A., and Werner, M.: Effects of Last Glacial Maximum (LGM) sea surface temperature and sea ice extent on the isotope–temperature slope at polar ice core sites, Clim. Past, 19, 1275–1294, https://doi.org/10.5194/cp-19-1275-2023, 2023.
Connolley, W. M.: The Antarctic temperature inversion, Int. J. Climatol., 16, 1333–1342, https://doi.org/10.1002/(sici)1097-0088(199612)16:12<1333::aid-joc96>3.3.co;2-y, 1996.
Craig, H.: Isotopic variations in meteoric waters, Science, 133, 1702–1703, https://doi.org/10.1126/science.133.3465.1702, 1961.
Crotti, I., Landais, A., Stenni, B., Bazin, L., Parrenin, F., Frezzotti, M., Ritterbusch, F., Lu, Z. T., Jiang, W., Yang, G. M., Fourré, E., Orsi, A., Jacob, R., Minster, B., Prié, F., Dreossi, G., and Barbante, C.: An extension of the TALDICE ice core age scale reaching back to MIS 10.1, Quaternary Sci. Rev., 266, 107078, https://doi.org/10.1016/j.quascirev.2021.107078, 2021.
Dansgaard, W.: The Abundance of O18 in Atmospheric Water and Water Vapour, Tellus, 5, 461–469, https://doi.org/10.3402/tellusa.v5i4.8697, 1953.
Dansgaard, W.: Stable isotopes in precipitation, Tellus, 16, 436–468, https://doi.org/10.3402/tellusa.v16i4.8993, 1964.
Dansgaard, W., Johnsen, S. J., Møller, J., and Langway, J. R.: One thousand centuries of climatic record from Camp Century on the Greenland ice sheet, Science, 166, 377–381, https://doi.org/10.1126/science.166.3903.377, 1969.
Dansgaard, W., Johnsen, S. J., Clausen, H. B., Dahl-Jensen, D., Gundestrup, N. S., Hammer, C. U., Hvidberg, C. S., Steffensen, J. P., Sveinbjörnsdottir, A. E., Jouzel, J., and Bond, G.: Evidence for general instability of past climate from a 250-kyr ice core record, Nature, 364, 218–220, https://doi.org/10.1038/364218a0, 1993.
Davison, A. C. and Hinkley, D. V.: Bootstrap Methods and Their Applications, Cambridge University Press, Cambridge, UK, ISBN 9780511802843, 1997.
Dee, D. P., Uppala, S. M., Simmons, A. J., Berrisford, P., Poli, P., Kobayashi, S., Andrae, U., Balmaseda, M. A., Balsamo, G., Bauer, P., Bechtold, P., Beljaars, A. C. M., van de Berg, L., Bidlot, J., Bormann, N., Delsol, C., Dragani, R., Fuentes, M., Geer, A.J., Haimberger, L., Healy, S. B., Hersbach, H., Hólm, E. V., Isaksen, L., Kållberg, P., Köhler, M., Matricardi, M., Mcnally, A. P., Monge-Sanz, B. M., Morcrette, J. J., Park, B. K., Peubey, C., de Rosnay, P., Tavolato, C., Thépaut, J. N., and Vitart, F.: The ERA-Interim reanalysis: Configuration and performance of the data assimilation system, Q. J. Roy. Meteor. Soc., 137, 553–597, https://doi.org/10.1002/qj.828, 2011.
Delaygue, G., Jouzel, J., Masson, V., Koster, R. D., and Bard, E.: Validity of the isotopic thermometer in central Antarctica: Limited impact of glacial precipitation seasonality and moisture origin, Geophys. Res. Lett., 27, 2677–2680, https://doi.org/10.1029/2000GL011530, 2000.
Delmotte, M., Masson, V., Jouzel, J., and Morgan, V. I.: A seasonal deuterium excess signal at Law Dome, coastal eastern Antarctica: A Southern Ocean signature, J. Geophys. Res.-Atmos., 105, 7187–7197, https://doi.org/10.1029/1999JD901085, 2000.
Dreossi, G., Stenni, B., Masiol, M., and Zannoni, D.: A decade (2008–2017) of water stable-isotope composition of precipitation at Concordia Station, East Antarctica, Zenodo [data set], https://doi.org/10.5281/zenodo.10197160, 2023.
Driemel, A., Augustine, J., Behrens, K., Colle, S., Cox, C., Cuevas-Agulló, E., Denn, F. M., Duprat, T., Fukuda, M., Grobe, H., Haeffelin, M., Hodges, G., Hyett, N., Ijima, O., Kallis, A., Knap, W., Kustov, V., Long, C. N., Longenecker, D., Lupi, A., Maturilli, M., Mimouni, M., Ntsangwane, L., Ogihara, H., Olano, X., Olefs, M., Omori, M., Passamani, L., Pereira, E. B., Schmithüsen, H., Schumacher, S., Sieger, R., Tamlyn, J., Vogt, R., Vuilleumier, L., Xia, X., Ohmura, A., and König-Langlo, G.: Baseline Surface Radiation Network (BSRN): structure and data description (1992–2017), Earth Syst. Sci. Data, 10, 1491–1501, https://doi.org/10.5194/essd-10-1491-2018, 2018.
Ekaykin, A. A., Lipenkov, V. Y., Barkov, N. I., Petit, J. R., and Masson-Delmotte, V.: Spatial and temporal variability in isotope composition of recent snow in the vicinity of Vostok station, Antarctica: implications for ice core record interpretation, Ann. Glaciol., 35, 181–186, https://doi.org/10.3189/172756402781816726, 2002.
Ekaykin, A. A., Lipenkov, V. Y., Kuzmina, I. N., Petit, J. R., Masson-Delmotte, V., and Johnsen, S. J.: The changes in isotope composition and accumulation of snow at Vostok station, East Antarctica, over the past 200 years, Ann. Glaciol., 39, 569–575, https://doi.org/10.3189/172756404781814348, 2004.
Epstein, S. and Mayeda, T.: Variation of O18 content of waters from natural sources, Geochim. Cosmochim Ac., 4, 213–224, https://doi.org/10.1016/0016-7037(53)90051-9, 1953.
Epstein, S., Sharp, R. P., and Goddard, I.: Oxygen-isotope ratios in Antarctic snow, firn, and ice, J. Geol., 71, 698–720, https://doi.org/10.1086/626950, 1963.
EPICA community members: Eight glacial cycles from an Antarctic ice core, Nature, 429, 623–628, https://doi.org/10.1038/nature02599, 2004.
Fogt, R. L. and Marshall, G. J.: The Southern Annular Mode: Variability, trends, and climate impacts across the Southern Hemisphere, Wires Rev. Clim. Chang., 11, e652, https://doi.org/10.1002/wcc.652, 2020.
Fox, J. and Weisberg, S.: An R Companion to Applied Regression, 3rd Edn., Sage, Thousand Oaks CA, United States, ISBN 9781544336473, 2018.
Frezzotti, M., Pourchet, M., Flora, O., Gandolfi, S., Gay, M., Urbini, S., Vincent, C., Becagli, S., Gragnani, R., Proposito, M., Severi, M., Traversi, R., Udisti, R., and Fily, M.: New estimations of precipitation and surface sublimation in East Antarctica from snow accumulation measurements, Clim. Dyn., 23, 803–813, https://doi.org/10.1007/s00382-004-0462-5, 2004.
Frezzotti, M., Urbini, S., Proposito, M., Scarchilli, C., and Gandolfi, S.: Spatial and temporal variability of surface mass balance near Talos Dome, East Antarctica, J. Geophys. Res.-Earth, 112, F02032, https://doi.org/10.1029/2006JF000638, 2007.
Fujita, K. and Abe, O.: Stable isotopes in Daily precipitation at Dome Fuji, East Antarctica, Geophys. Res. Lett., 33, L18503, https://doi.org/10.1029/2006GL026936, 2006.
Genthon, C., Town, M. S., Six, D., Favier, V., Argentini, S., and Pellegrini, A.: Meteorological atmospheric boundary layer measurements and ECMWF analyses during summer at Dome C, Antarctica, J. Geophys. Res.-Atmos., 115, D05104, https://doi.org/10.1029/2009JD012741, 2010.
Genthon, C., Six, D., Gallée, H., Grigioni, P., and Pellegrini, A.: Two years of atmospheric boundary layer observations on a 45-m tower at Dome C on the Antarctic plateau, J. Geophys. Res.-Atmos, 118, 3218–3232, https://doi.org/10.1002/jgrd.50128, 2013.
Genthon, C., Six, D., Scarchilli, C., Ciardini, V., and Frezzotti, M.: Meteorological and snow accumulation gradients across Dome C, East Antarctic plateau, Int. J. Climatol., 36, 455–466, https://doi.org/10.1002/joc.4362, 2016.
Genthon, C., Piard, L., Vignon, E., Madeleine, J.-B., Casado, M., and Gallée, H.: Atmospheric moisture supersaturation in the near-surface atmosphere at Dome C, Antarctic Plateau, Atmos. Chem. Phys., 17, 691–704, https://doi.org/10.5194/acp-17-691-2017, 2017.
Gonfiantini, R. and Picciotto, E.: Oxygen isotope variations in Antarctic snow samples, Nature, 184, 1557–1558, https://doi.org/10.1038/1841557a0, 1959.
Goursaud, S., Masson-Delmotte, V., Favier, V., Orsi, A., and Werner, M.: Water stable isotope spatio-temporal variability in Antarctica in 1960–2013: observations and simulations from the ECHAM5-wiso atmospheric general circulation model, Clim. Past, 14, 923–946, https://doi.org/10.5194/cp-14-923-2018, 2018.
Grigioni, P., Camporeale, G., Ciardini, V., De Silvestri, L., Iaccarino, A., Proposito, M., and Scarchilli, C.: Dati meteorologici della Stazione meteorologica CONCORDIA presso la Base CONCORDIA STATION (DomeC), ENEA [data set], https://doi.org/10.12910/DATASET2022-002, 2022a.
Grigioni, P., Ciardini, V., Camporeale, G., De Silvestri, L., Iaccarino, A., Proposito, M., and Scarchilli, C.: Dati meteorologici della Stazione di Radiosondaggio presso la Base CONCORDIA STATION (DomeC), ENEA [data set], https://doi.org/10.12910/DATASET2022-004, 2022b.
Groot Zwaaftink, C. D., Cagnati, A., Crepaz, A., Fierz, C., Macelloni, G., Valt, M., and Lehning, M.: Event-driven deposition of snow on the Antarctic Plateau: analyzing field measurements with SNOWPACK, The Cryosphere, 7, 333–347, https://doi.org/10.5194/tc-7-333-2013, 2013.
Hersbach, H., Bell, B., Berrisford, P., Hirahara, S., Horányi, A., Muñoz-Sabater, J., Nicolas, J., Peubey, C., Radu, R., Schepers, D., Simmons, A., Soci, C., Abdalla, S., Abellan, X., Balsamo, G., Bechtold, P., Biavati, G., Bidlot, J., Bonavita, M., De Chiara, G., Dahlgren, P., Dee, D., Diamantakis, M., Dragani, R., Flemming, J., Forbes, R., Fuentes, M., Geer, A., Haimberger, L., Healy, S., Hogan, R. J., Hólm, E., Janisková, M., Keeley, S., Laloyaux, P., Lopez, P., Lupu, C., Radnoti, G., de Rosnay, P., Rozum, I., Vamborg, F., Villaume, S., and Thépaut, J. N.: The ERA5 global reanalysis, Q. J. Roy. Meteor. Soc., 146, 1999–2049, https://doi.org/10.1002/qj.3803, 2020.
Hersbach, H., Bell, B., Berrisford, P., Biavati, G., Horányi, A., Muñoz Sabater, J., Nicolas, J., Peubey, C., Radu, R., Rozum, I., Schepers, D., Simmons, A., Soci, C., Dee, D., and Thépaut, J.-N.: ERA5 hourly data on single levels from 1940 to present, Copernicus Climate Change Service (C3S) Climate Data Store (CDS) [data set], https://doi.org/10.24381/cds.adbb2d47, 2023.
Hoffmann, G., Werner, M., and Heimann, M.: Water isotope module of the ECHAM atmospheric general circulation model: A study on timescales from days to several years, J. Geophys. Res.-Atmos., 103, 16871–16896, https://doi.org/10.1029/98JD00423, 1998.
Horita, J.: Hydrogen isotope analysis of natural waters using an H2-water equilibration method: A special implication to brines, Chem. Geol., 72, 89–94, https://doi.org/10.1016/0168-9622(88)90040-1, 1988.
James, G., Witten, D., Hastie, T., and Tibshirani, R.: An introduction to Statistical Learning with Applications in R, Springer, New York, NY, USA, ISBN 9781461471387, https://doi.org/10.1007/978-1-4614-7138-7, 2013.
Joussaume, S., Sadourny, R., and Jouzel, J.: A general circulation model of water isotope cycles in the atmosphere, Nature, 311, 24–29, https://doi.org/10.1038/311024a0, 1984.
Jouzel, J.: Water stable isotopes: Atmospheric composition and applications in polar ice core studies, in: Treatise on Geochemistry, 2nd Edn., The Atmosphere, edited by: Keeling, R. and Russel, L., Elsevier, Amsterdam, The Netherlands, Vol. 5, 213–256, https://doi.org/10.1016/B978-0-08-095975-7.00408-3, 2014.
Jouzel, J. and Merlivat, L.: Deuterium and oxygen 18 in precipitation: Modeling of the isotopic effects during snow formation, J. Geophys. Res., 89, 11749–11757, https://doi.org/10.1029/JD089iD07p11749, 1984.
Jouzel, J., Russell, G. L., Suozzo, R. J., Koster, D., White, J. W. C., and Broecker, W. S.: Simulations of the HDO and HO atmospheric cycles using the NASA GISS general circulation model: The seasonal cycle for present-day conditions, J. Geophys. Res., 92, 14739–14760, https://doi.org/10.1029/JD092iD12p14739, 1987.
Jouzel, J., Alley, R. B., Cuffey, K. M., Dansgaard, W., Grootes, P., Hoffmann, G., Johnsen, S. J., Koster, R. D., Peel, D., Shuman, C. A., Stievenard, M., Stuiver, M., and White, J.: Validity of the temperature reconstruction from water isotopes in ice cores, J. Geophys. Res., 102, 26471–26487, https://doi.org/10.1029/97JC01283, 1997.
Jouzel, J., Vimeux, F., Caillon, N., Delaygue, G., Hoffmann, G., Masson-Delmotte, V., and Parrenin, F.: Magnitude of isotope/temperature scaling for interpretation of central Antarctic ice cores, J. Geophys. Res., 108, 4361, https://doi.org/10.1029/2002JD002677, 2003.
Jouzel, J., Masson-Delmotte, V., Cattani, O., Dreyfus, G., Falourd, S., Hoffmann, G., Minster, B., Nouet, J., Barnola, J. M., Chappellaz, J., Fisher, H., Gallet, J. C., Johnsen, S., Leuenberger, M., Loulergue, L., Luethi, D., Oerter, H., Parrenin, F., Raisbeck, G., Raynaud, D., Schilt, A., Schwander, J., Selmo, E., Souchez, R., Spahni, R., Stauffer, B., Steffensen, J. P., Stenni, B., Stocker, T. F., Tison, J. L., Werner, M., and Wolff, E. W.: Orbital and millennial Antarctic climate variability over the past 800,000 years, Science, 317, 793–796, https://doi.org/10.1126/science.1141038, 2007.
Kawamura, K., Abe-Ouchi, A., Motoyama, H., Ageta, Y., Aoki, S., Azuma, N., Fujii, Y., Fujita, K., Fujita, S., Fukui, K., Furukawa, T., Furusaki, A., Goto-Azuma, K., Greve, R., Hirabayashi, M., Hondoh, T., Hori, A., Horikawa, S., Horiuchi, K., Igarashi, M., Iizuka, Y., Kameda, T., Kanda, H., Kohno, M., Kuramoto, T., Matsushi, Y., Miyahara, M., Miyake, T., Miyamoto, A., Nagashima, Y., Nakayama, Y., Nakazawa, T., Nakazawa, F., Nishio, F., Obinata, I., Ohgaito, R., Oka, A., Okuno, J., Okuyama, J., Oyabu, I., Parrenin, F., Pattyn, F., Saito, F., Saito, Takashi, Saito, Takeshi, Sakurai, T., Sasa, K., Seddik, H., Shibata, Y., Shinbori, K., Suzuki, K., Suzuki, T., Takahashi, A., Takahashi, K., Takahashi, S., Takata, M., Tanaka, Y., Uemura, R., Watanabe, G., Watanabe, O., Yamasaki, T., Yokoyama, K., Yoshimori, M., and Yoshimoto, T.: State dependence of climatic instability over the past 720,000 years from Antarctic ice cores and climate modeling, Sci. Adv., 3, e1600446, https://doi.org/10.1126/sciadv.1600446, 2017.
Kendall, M. G.: Rank Correlation Methods, 4th Edn., Charles Griffin, London, UK, 1975.
Krinner, G., Genthon, C., and Jouzel, J.: GCM analysis of local influences on ice core delta signals, Geophys. Res. Lett., 24, 2825–2828, https://doi.org/10.1029/97gl52891, 1997.
Kuhn, M.: caret: Classification and Regression Training. R package version 6.0-93, https://CRAN.R-project.org/package=caret (last access: 19 August 2024), 2022.
Laepple, T., Münch, T., Casado, M., Hoerhold, M., Landais, A., and Kipfstuhl, S.: On the similarity and apparent cycles of isotopic variations in East Antarctic snow pits, The Cryosphere, 12, 169–187, https://doi.org/10.5194/tc-12-169-2018, 2018.
Langway, C. C.: A 400 Meter Deep Ice Core in Greenland: Preliminary Report, J. Glaciol., 3, 217–217, https://doi.org/10.3189/s0022143000024278, 1958.
Leisch, F.: Bootstrap: Functions for the Book “An Introduction to the Bootstrap”, R package version 2019.6, https://CRAN.R-project.org/package=bootstrap (last access: 19 August 2024), 2019.
Lupi, A.: Baseline Surface Radiation Network, PANGAEA [data set], https://dataportals.pangaea.de/bsrn/, last access: 19 August 2024.
Lupi, A., Lanconelli, C., and Vitale, V.: Basic and other measurements of radiation at Concordia station (2006-01 et seq), Institute of Atmospheric Sciences and Climate of the Italian National Research Council, Bologna, PANGAEA [data set], https://doi.org/10.1594/PANGAEA.935421, 2021.
Ma, T., Li, L., Shi, G., Li, Y.: Acquisition of post-depositional effects on stable isotopes (δ18O and δD) of snow and firn at Dome A, East Antarctica, Water (Switzerland), 12, 1707, https://doi.org/10.3390/W12061707, 2020.
Maindonald, J. and Braun, J. W.: Data Analysis and Graphics Using R, Third Edition. Cambridge University Press, Cambridge, UK, 565 pp., ISBN 9780511712869, 2011.
Mangiafico, S.: rcompanion: Functions to Support Extension Education Program Evaluation, R package version 2.4.18, https://CRAN.R-project.org/package=rcompanion (last access: 19 August 2024), 2022.
Mann, H. B.: Nonparametric Tests Against Trend, Econometrica 13, 245, https://doi.org/10.2307/1907187, 1945.
Marshall G. J.: Trends in the Southern Annular Mode from Observations and Reanalyses, J. Climate, 16, 4134–4143, https://doi.org/10.1175/1520-0442(2003)016<4134:TITSAM>2.0.CO;2, 2003.
Masson-Delmotte, V., Hou, S., Ekaykin, A., Jouzel, J., Aristarain, A., Bernardo, R.T., Bromwich, D., Cattani, O., Delmotte, M. M., Falourd, S., Frezzotti, M., Gallée, H., Genoni, L., Isaksson, E., Landais, A., Helsen, M. M., Hoffmann, G., Lopez, J., Morgan, V., Motoyama, H., Noone, D., Oerter, H., Petit, J. R., Royer, A., Uemura, R., Schmidt, G. A., Schlosser, E., Simões, J. C., Steig, E. J., Stenni, B., Stievenard, M., Van Den Broeke, M. R., Van De Wal, R. S. W., Van De Berg, W. J., Vimeux, F., and White, J. W. C.: A review of antarctic surface snow isotopic composition: Observations, atmospheric circulation, and isotopic modeling, J. Climate, 21, 3359–3387, https://doi.org/10.1175/2007JCLI2139.1, 2008.
Mathieu, R., Pollard, D., Cole, J. E., White, J. W. C., Webb, R. S., and Thompson, S. L.: Simulation of stable water isotope variations by the GENESIS GCM for modern conditions, J. Geophys. Res., 107, 4037, https://doi.org/10.1029/2001JD900255, 2002.
Merlivat, L. and Jouzel J.: Global climatic interpretation of the deuterium-oxygen 18 relationship for precipitation, J. Geophys. Res., 84, 5029–5033, https://doi.org/10.1029/JC084iC08p05029, 1979.
Münch, T. and Laepple, T.: What climate signal is contained in decadal- to centennial-scale isotope variations from Antarctic ice cores?, Clim. Past, 14, 2053–2070, https://doi.org/10.5194/cp-14-2053-2018, 2018.
Münch, T., Kipfstuhl, S., Freitag, J., Meyer, H., and Laepple, T.: Regional climate signal vs. local noise: a two-dimensional view of water isotopes in Antarctic firn at Kohnen Station, Dronning Maud Land, Clim. Past, 12, 1565–1581, https://doi.org/10.5194/cp-12-1565-2016, 2016.
Murphy, D. M. and Koop, T.: Review of the vapour pressures of ice and supercooled water for atmospheric applications, Q. J. Roy. Meterol. Soc., 131, 1539–1565, https://doi.org/10.1256/qj.04.94, 2005.
NOAA: Antarctic Oscillation (AAO), https://www.cpc.ncep.noaa.gov/products/precip/CWlink/daily_ao_index/aao/aao.shtml, last access: 19 August 2024.
Nusbaumer, J., Wong, T. E., Bardeen, C., and Noone, D.: Evaluating hydrological processes in the Community Atmosphere Model Version 5 (CAM5) using stable isotope ratios of water, J. Adv. Model. Earth Sy., 9, 949–977, https://doi.org/10.1002/2016ms000839, 2017.
Ohmura, A., Dutton, E. G., Forgan, B., Frohlich, C., Gilgen, H., Hegner, H., Heimo, A., König-Langlo, G., McArthur, B., Muller, G., Philipona, R., Pinker, R., Whitlock C. H., Dehne, K., and Wild, M.: Baseline Surface Radiation Network (BSRN/WCRP): New Precision Radiometry for Climate Research, B. Am. Meteorol. Soc., 79, 2115–2136, https://doi.org/10.1175/1520-0477(1998)079<2115:BSRNBW>2.0.CO;2, 1998.
Okazaki, A. and Yoshimura, K.: Global evaluation of proxy system models for stable water isotopes with realistic atmospheric forcing, J. Geophys. Res.-Atmos., 124, 8972–8993, https://doi.org/10.1029/2018JD029463, 2019.
Palerme, C., Genthon, C., Claud, C., Kay, J. E., Wood, N. B., and L'Ecuyer, T.: Evaluation of current and projected Antarctic precipitation in CMIP5 models, Clim. Dynam., 48, 225–239, https://doi.org/10.1007/s00382-016-3071-1, 2017.
Parrenin, F., Cavitte, M. G. P., Blankenship, D. D., Chappellaz, J., Fischer, H., Gagliardini, O., Masson-Delmotte, V., Passalacqua, O., Ritz, C., Roberts, J., Siegert, M. J., and Young, D. A.: Is there 1.5-million-year-old ice near Dome C, Antarctica?, The Cryosphere, 11, 2427–2437, https://doi.org/10.5194/tc-11-2427-2017, 2017.
Penna, D., Stenni, B., Šanda, M., Wrede, S., Bogaard, T. A., Michelini, M., Fischer, B. M. C., Gobbi, A., Mantese, N., Zuecco, G., Borga, M., Bonazza, M., Sobotková, M., Čejková, B., and Wassenaar, L. I.: Technical Note: Evaluation of between-sample memory effects in the analysis of δ2H and δ18O of water samples measured by laser spectroscopes, Hydrol. Earth Syst. Sci., 16, 3925–3933, https://doi.org/10.5194/hess-16-3925-2012, 2012.
Petenko, I., Argentini, S., Casasanta, G., Genthon, C., and Kallistratova, M.: Stable Surface-Based Turbulent Layer During the Polar Winter at Dome C, Antarctica: Sodar and In Situ Observations, Bound.-Lay. Meteorol., 171, 101–128, https://doi.org/10.1007/s10546-018-0419-6, 2019.
Petit, J. R., Jouzel, J., Pourchet, M., and Merlivat, L.: A detailed study of snow accumulation and stable isotope content in Dome C (Antarctica), J. Geophys. Res.-Oceans, 87, 4301–4308, https://doi.org/10.1029/JC087iC06p04301, 1982.
Petit, J. R., Jouzel, J., Raynaud, D., Barkov, N. I., Barnola, J. M., Basile, I., Bender, M., Chappellaz, J., Davis, M., Delaygue, G., Delmotte, M., Kotiyakov, V. M., Legrand, M., Lipenkov, V. Y., Lorius, C., Pépin, L., Ritz, C., Saltzman, E., and Stievenard, M.: Climate and atmospheric history of the past 420,000 years from the Vostok ice core, Antarctica, Nature, 399, 429–436, https://doi.org/10.1038/20859, 1999.
Pfahl, S. and Sodemann, H.: What controls deuterium excess in global precipitation?, Clim. Past, 10, 771–781, https://doi.org/10.5194/cp-10-771-2014, 2014.
Picard, G., Domine, F., Krinner, G., Arnaud, L., and Lefebvre, E.: Inhibition of the positive snow-albedo feedback by precipitation in interior Antarctica, Nat. Clim. Change, 2, 795–798, https://doi.org/10.1038/nclimate1590, 2012.
Picard, G., Arnaud, L., Caneill, R., Lefebvre, E., and Lamare, M.: Observation of the process of snow accumulation on the Antarctic Plateau by time lapse laser scanning, The Cryosphere, 13, 1983–1999, https://doi.org/10.5194/tc-13-1983-2019, 2019.
Pierce, D.: ncdf4: Interface to unidata netCDF (version 4 or earlier) format data files, R package version 1.21, https://CRAN.R-project.org/package=ncdf4 (last access: 19 August 2024), 2023
Pietroni, I., Argentini, S., and Petenko, I.: One Year of Surface-Based Temperature Inversions at Dome C, Antarctica, Bound.-Lay. Meteorol., 150, 131–151, https://doi.org/10.1007/s10546-013-9861-7, 2014.
R Core Team: R: A language and environment for statistical computing, R Foundation for Statistical Computing, Vienna, Austria, https://www.R-project.org/ (last access: 19 August 2024), 2022.
Risi, C., Bony, S., Vimeux, F., and Jouzel, J.: Water-stable isotopes in the LMDZ4 general circulation model: Model evaluation for present-day and past climates and applications to climatic interpretations of tropical isotopic records, J. Geophys. Res.-Atmos., 115, D12118, https://doi.org/10.1029/2009JD013255, 2010.
Ritter, F., Steen-Larsen, H. C., Werner, M., Masson-Delmotte, V., Orsi, A., Behrens, M., Birnbaum, G., Freitag, J., Risi, C., and Kipfstuhl, S.: Isotopic exchange on the diurnal scale between near-surface snow and lower atmospheric water vapor at Kohnen station, East Antarctica, The Cryosphere, 10, 1647–1663, https://doi.org/10.5194/tc-10-1647-2016, 2016.
Roeckner, E., Baeuml, G., Bonaventura, L., Brokopf, R., Esch, M., Giorgetta, M., Hagemann, S., Kirchner, I., Kornblueh, L., Manzini, E., Rhodin, A., Schlese, U., Schulzweida, U., and Tompkins, A.: The general circulation model ECHAM5. Part I: Model description, MPI-Report, https://pure.mpg.de/rest/items/item_995269_2/component/file_995268/content (last access: 19 August 2024), 2003.
Rozanski, K., Araguás-Araguás, L., and Gonfiantini, R.: Isotopic Patterns in Modern Global Precipitation, Climate Change in Continental Isotopic Records, edited by: Swart, P. K., Lohmann, K. C., Mckenzie, J., and Savin, S., Geophysical Monograph Series, vol. 78, https://doi.org/10.1029/gm078p0001, 1993.
Scarchilli, C., Frezzotti, M., Grigioni, P., De Silvestri, L., Agnoletto, L., and Dolci, S.: Extraordinary blowing snow transport events in East Antarctica, Clim. Dynam., 34, 1195–1206, https://doi.org/10.1007/s00382-009-0601-0, 2010.
Scarchilli, C., Frezzotti, M., and Ruti, P. M.: Snow precipitation at four ice core sites in East Antarctica: Provenance, seasonality and blocking factors, Clim. Dynam., 37, 2107–2125, https://doi.org/10.1007/s00382-010-0946-4, 2011.
Schlosser, E., Reijmer, C., Oerter, H., and Graf, W.: The influence of precipitation origin on the δ18O-T relationship at Neumayer station, Ekströmisen, Antarctica, Ann. Glaciol., 39, 41–48, https://doi.org/10.3189/172756404781814276, 2004.
Schlosser, E., Oerter, H., Masson-Delmotte, V., and Reijmer, C.: Atmospheric influence on the deuterium excess signal in polar firn: Implication for ice-core interpretation, J. Glaciol., 54, 117–124, https://doi.org/10.3189/002214308784408991, 2008.
Schmidt, G. A., Hoffmann, G., Shindell, D. T., and Hu, Y.: Modelling atmospheric stable water isotopes and the potential for constraining cloud processes and stratosphere-troposphere water exchange, J. Geophys. Res., 110, D21314, https://https://doi.org/10.1029/2005JD005790, 2005.
Sen, P. K.: Estimates of the Regression Coefficient Based on Kendall's Tau, J. Am. Stat. Assoc., 63, 1379–1389, https://doi.org/10.1080/01621459.1968.10480934, 1968.
Servettaz, A. P. M., Agosta, C., Kittel, C., and Orsi, A. J.: Control of the temperature signal in Antarctic proxies by snowfall dynamics, The Cryosphere, 17, 5373–5389, https://doi.org/10.5194/tc-17-5373-2023, 2023.
Sime, L., Wolff, E., Oliver, K., and Tindall, J. C.: Evidence for warmer interglacials in East Antarctic ice cores, Nature, 462, 342–345, https://doi.org/10.1038/nature08564, 2009.
Stenni, B., Scarchilli, C., Masson-Delmotte, V., Schlosser, E., Ciardini, V., Dreossi, G., Grigioni, P., Bonazza, M., Cagnati, A., Karlicek, D., Risi, C., Udisti, R., and Valt, M.: Three-year monitoring of stable isotopes of precipitation at Concordia Station, East Antarctica, The Cryosphere, 10, 2415–2428, https://doi.org/10.5194/tc-10-2415-2016, 2016.
Stenni, B., Curran, M. A. J., Abram, N. J., Orsi, A., Goursaud, S., Masson-Delmotte, V., Neukom, R., Goosse, H., Divine, D., van Ommen, T., Steig, E. J., Dixon, D. A., Thomas, E. R., Bertler, N. A. N., Isaksson, E., Ekaykin, A., Werner, M., and Frezzotti, M.: Antarctic climate variability on regional and continental scales over the last 2000 years, Clim. Past, 13, 1609–1634, https://doi.org/10.5194/cp-13-1609-2017, 2017.
Stevens, B., Giorgetta, M., Esch, M., Mauritsen, T., Crueger, T., Rast, S., Salzmann, M., Schmidt, H., Bader, J., Block, K., Brokopf, R., Fast, I., Kinne, S., Kornblueh, L., Lohmann, U., Pincus, R., Reichler, T., Roeckner, E.: Atmospheric component of the MPI-M earth system model: ECHAM6, J. Adv. Model. Earth Sy., 5, 146–172, https://doi.org/10.1002/jame.20015, 2013.
Theil, H.: A Rank-Invariant Method of Linear and Polynomial Regression Analysis, Proc. R. Netherlands Acad. Sci., 53, 386–392, https://doi.org/10.1007/978-94-011-2546-8_20, 1950.
Thompson, D. and Wallace, J.: Annular Modes in the Extratropical Circulation. Part I: Month-to-Month Variability, J. Climate, 13, 1000–1016, https://doi.org/10.1175/1520-0442(2000)013<1000:AMITEC>2.0.CO;2, 2000.
Touzeau, A., Landais, A., Stenni, B., Uemura, R., Fukui, K., Fujita, S., Guilbaud, S., Ekaykin, A., Casado, M., Barkan, E., Luz, B., Magand, O., Teste, G., Le Meur, E., Baroni, M., Savarino, J., Bourgeois, I., and Risi, C.: Acquisition of isotopic composition for surface snow in East Antarctica and the links to climatic parameters, The Cryosphere, 10, 837–852, https://doi.org/10.5194/tc-10-837-2016, 2016.
Turner, J., Phillips, T., Thamban, M., Rahaman, W., Marshall, G. J., Wille, J. D., Favier, V., Winton, V. H. L., Thomas, E., Wang, Z., van den Broeke, M., Hosking, J. S., and Lachlan-Cope, T.: The Dominant Role of Extreme Precipitation Events in Antarctic Snowfall Variability, Geophys. Res. Lett., 46, 3502–3511, https://doi.org/10.1029/2018GL081517, 2019.
Uemura, R., Matsui, Y., Yoshimura, K., Motoyama, H., and Yoshida, N.: Evidence of deuterium excess in water vapor as an indicator of ocean surface conditions, J. Geophys. Res.-Atmos., 113, D19114, https://doi.org/10.1029/2008JD010209, 2008.
Uemura, R., Masson-Delmotte, V., Jouzel, J., Landais, A., Motoyama, H., and Stenni, B.: Ranges of moisture-source temperature estimated from Antarctic ice cores stable isotope records over glacial–interglacial cycles, Clim. Past, 8, 1109–1125, https://doi.org/10.5194/cp-8-1109-2012, 2012.
Urbini, S., Frezzotti, M., Gandolfi, S., Vincent, C., Scarchilli, C., Vittuari, L., and Fily, M.: Historical behaviour of Dome C and Talos Dome (East Antarctica) as investigated by snow accumulation and ice velocity measurements, Global Planet. Change, 60, 576–588, https://doi.org/10.1016/j.gloplacha.2007.08.002, 2008.
Vimeux, F., Masson, V., Jouzel, J., Stievenard, M., Petit, J. R.: Glacial-interglacial changes in ocean surface conditions in the Southern Hemisphere, Nature, 398, 410–413, https://doi.org/10.1038/18860, 1999.
Wei, T. and Simko, V.: R package “corrplot”: Visualization of a Correlation Matrix, (Version 0.92), Github, https://Github.Com/Taiyun/Corrplot (last access: 19 August 2024), 2021.
Werner, M., Langebroek, P. M., Carlsen, T., Herold, M., and Lohmann, G.: Stable water isotopes in the ECHAM5 general circulation model: Toward high-resolution isotope modeling on a global scale, J. Geophys. Res.-Atmos., 116, D15109, https://doi.org/10.1029/2011JD015681, 2011.
Wood, S. N.: Generalized Additive Models: An Introduction with R, 2nd Edn., Chapman and Hall/CRC, 496 pp., ISBN 9781315370279, https://doi.org/10.1201/9781315370279, 2017.
Yoshimura, K.: Stable Water Isotopes in Climatology, Meteorology, and Hydrology: A Review, J. Meteorol. Soc. Jpn. Ser. II, 93, 513–533, https://doi.org/10.2151/jmsj.2015-036, 2015.
Zannoni, D., Steen-Larsen, H. C., Peters, A. J., Wahl, S., Sodemann, H., and Sveinbjörnsdóttir, A. E.: Non-Equilibrium Fractionation Factors for D/H and During Oceanic Evaporation in the North-West Atlantic Region, J. Geophys. Res.-Atmos, 127, e2022JD037076, https://doi.org/10.1029/2022JD037076, 2022.
Zeileis, A. and Grothendieck, G.: Zoo: S3 infrastructure for regular and irregular time series, J. Stat. Softw., 14, 1–27, https://doi.org/10.18637/jss.v014.i06, 2005.
- Abstract
- Introduction
- Materials and methods
- Results and discussion
- Comparisons with ECHAM5-wiso and ECHAM6-wiso simulations
- Conclusions
- Data availability
- Author contributions
- Competing interests
- Disclaimer
- Special issue statement
- Acknowledgements
- Financial support
- Review statement
- References
- Supplement