the Creative Commons Attribution 4.0 License.
the Creative Commons Attribution 4.0 License.
 | 22 Aug 2024
On the relationship between δO2∕N2 variability and ice sheet surface conditions in Antarctica
Romilly Harris Stuart
Amaëlle Landais
Laurent Arnaud
Christo Buizert
Emilie Capron
Marie Dumont
Quentin Libois
Robert Mulvaney
Anaïs Orsi
Ghislain Picard
Frédéric Prié
Jeffrey Severinghaus
Barbara Stenni
Patricia Martinerie
While the processes controlling pore closure are broadly understood, the physical mechanisms driving the associated elemental fractionation remains ambiguous. Previous studies have shown that the pore closure process leads to a depletion in small-sized molecules (e.g. H2, O2, Ar, Ne, He) in ice core bubbles relative to larger-sized molecules like N2. This size-dependent fractionation, identified using ice core records, exhibits a clear anti-correlation with local summer solstice insolation, making a valuable ice core dating tool. Mechanisms controlling this relationship are attributed to the physical properties of deep firn. In this study, we compile records from 15 polar ice cores and show a new additional link between and local surface temperature and/or accumulation rate. Using the Crocus snowpack model, we perform sensitivity tests to identify the response of near-surface snow properties to changes in insolation intensity, accumulation rate, and air temperature. These tests support a mechanism linked to firn grain size, such that the larger the grain size for a given density, the stronger the pore closure fractionation and, hence, the lower the values archived in the ice. Based on both snowpack model outputs and data compilation, our findings suggest that local accumulation rate and temperature should be considered when interpreting as a local insolation proxy.
- Article
(3761 KB) - Full-text XML
-
Supplement
(2252 KB) - BibTeX
- EndNote


Ice cores store crucial information for our understanding of past climate variability and atmospheric composition. Interpreting ice core gas records first requires an understanding of the evolution of snow into ice via the firnification processes. Firn is the name given to the layer of consolidated snow which makes up the top 50–120 m of ice sheets. Atmospheric air moves through porous networks within the firn until a critical depth (known as the lock-in depth) where vertical diffusion effectively stops, and pores gradually become sealed off from the atmosphere. The lock-in depth and the depth at which all pores are closed (close-off depth) are largely determined by local accumulation rate, temperature, and possibly the degree of density layering (Schwander et al., 1997; Martinerie et al., 1994; Mitchell et al., 2015). The region between the lock-in depth and close-off depth, where gases are progressively occluded into bubbles, is known as the lock-in zone (LIZ).
Gas records from ice cores provide a vital dating tool, especially at low-accumulation sites where other methods are unsuitable. One such tool is orbital dating, which enables certain gas records to be tuned to insolation curves directly calculated from astronomical variables (Laskar et al., 2004). For example, ice core δ18Oatm records (δ18O of atmospheric O2) are strongly correlated with precession (mid-June 65° N insolation) (Bender et al., 1994). δ18Oatm provides a direct atmospheric signal which may ultimately be used to align different ice core records (Extier et al., 2018). Two alternative proxies for orbital dating are (1) total air content, which is anti-correlated with integrated summer insolation, i.e. the annual sum of daily insolation above a certain threshold (Raynaud et al., 2007; Eicher et al., 2016), and (2) , which is anti-correlated with local summer solstice insolation intensity (e.g. Bender, 2002; Kawamura et al., 2007; Suwa and Bender, 2008b; Landais et al., 2012; Bouchet et al., 2023). Unlike δ18Oatm, total air content (TAC) and reflect processes within the firn column, making the records site specific. The term (hereafter, simply ) describes the relative difference between the ratio of O2 to N2 molecules trapped within the ice and that of the standard atmosphere and is expressed in the delta notation commonly used for stable isotope ratios.
The use of for dating was first proposed by Bender (2002) after observations of an anti-correlation between local summer solstice insolation (hereafter SSI) and from the Vostok ice core. A similar relationship was then observed at other sites such as Dome Fuji (Kawamura et al., 2007) and EPICA Dome C (Landais et al., 2012) in Antarctica, as well as GISP2 (Suwa and Bender, 2008b) in Greenland. Over orbital timescales, is in anti-phase with local SSI when drawn on the ice-age chronology, indicating that the firn properties controlling the fractionation are set near the surface. It is understood that increased temperature gradients under high SSI conditions enhance near-surface snow metamorphism, thus increasing near-surface grain size which persists throughout the firnification process down to the close-off depth (Bender, 2002; Severinghaus and Battle, 2006; Suwa and Bender, 2008a; Fujita et al., 2009).
Parallel firn air studies of the open porosity revealed an enrichment in O2 and other small molecules (Ar, Ne, and He) in the LIZ, providing further evidence of size-dependent fractionation during pore closure (Battle et al., 1996; Huber et al., 2006; Severinghaus and Battle, 2006). While the physical mechanisms controlling the amount of fractionation are not fully understood, it is believed that smaller molecules (<3.6 Å diameter) escape during pore closure via molecular diffusion through the ice lattice (or permeation), driven by pressure gradients between recently closed pores and neighbouring open pores (Ikeda-Fukazawa et al., 2004; Huber et al., 2006; Severinghaus and Battle, 2006). This process is facilitated by the pore network's capacity to export the fugitive gases back to the atmosphere, which is required for the observed depletion of O2 in bubbles (Fujita et al., 2009).
In addition, Fujita et al. (2009) proposed that enhanced layering in the deep firn under high SSI conditions would also facilitate depletion. They argue that large-grained, relatively low-density “summer” layers in the deep firn close off deeper and take longer to do so than neighbouring “winter” layers (smaller-grained, relatively high density). As a result, summer layers remain permeable for longer, allowing the O2-enriched air in the open porosity to be exported to the atmosphere, thereby reducing bulk ice under high SSI conditions (Fujita et al., 2009). While the proposed mechanisms are posited to explain the SSI imprint on , they are also influenced by local climate conditions such as temperature and accumulation rate. Indeed, there is a substantial amount of evidence linking local climate conditions with both firn physical properties (Casado et al., 2021; Inoue et al., 2024) and deep firn layering (Hörhold et al., 2011).
There is a growing body of evidence for a local climatic imprint on ice core records. Firstly, spectral analysis has revealed climate-related 100 kyr cyclicity at EPICA Dome C corresponding to glacial cycles (Bazin et al., 2016). However, this 100 kyr cyclicity is not apparent in the Dome Fuji record, which Kawamura et al. (2007) attribute to the idea that temperature and accumulation effects cancel each other out. Secondly, millennial-scale variability in records from the GISP2 core appeared in-phase with local temperature fluctuations driven by Dansgaard–Oeschger events (Suwa and Bender, 2008b). In contrast, Kobashi et al. (2015) evidenced an anti-phase effect of accumulation rate on records at GISP2 on decadal timescales over the last 6000 years. Like O2, Ar is a smaller molecule than N2, invoking the same driving mechanisms for and variations, albeit the anomaly tends to be half as large as the anomaly (Bender et al., 1995; Buizert et al., 2023). Kobashi et al. (2015) proposed a direct effect of accumulation rate or temperature on the () variations through the firn depth. Higher accumulation rates (or lower temperatures) increase firn weight, leading to greater overloading pressures in microbubbles, which results in the preferential expulsion of Ar (O2) in the LIZ. Alternatively, Severinghaus and Battle (2006) proposed that higher accumulation rates result in a more rapid burial of bubbles, allowing less time for gases to escape during pore closure.
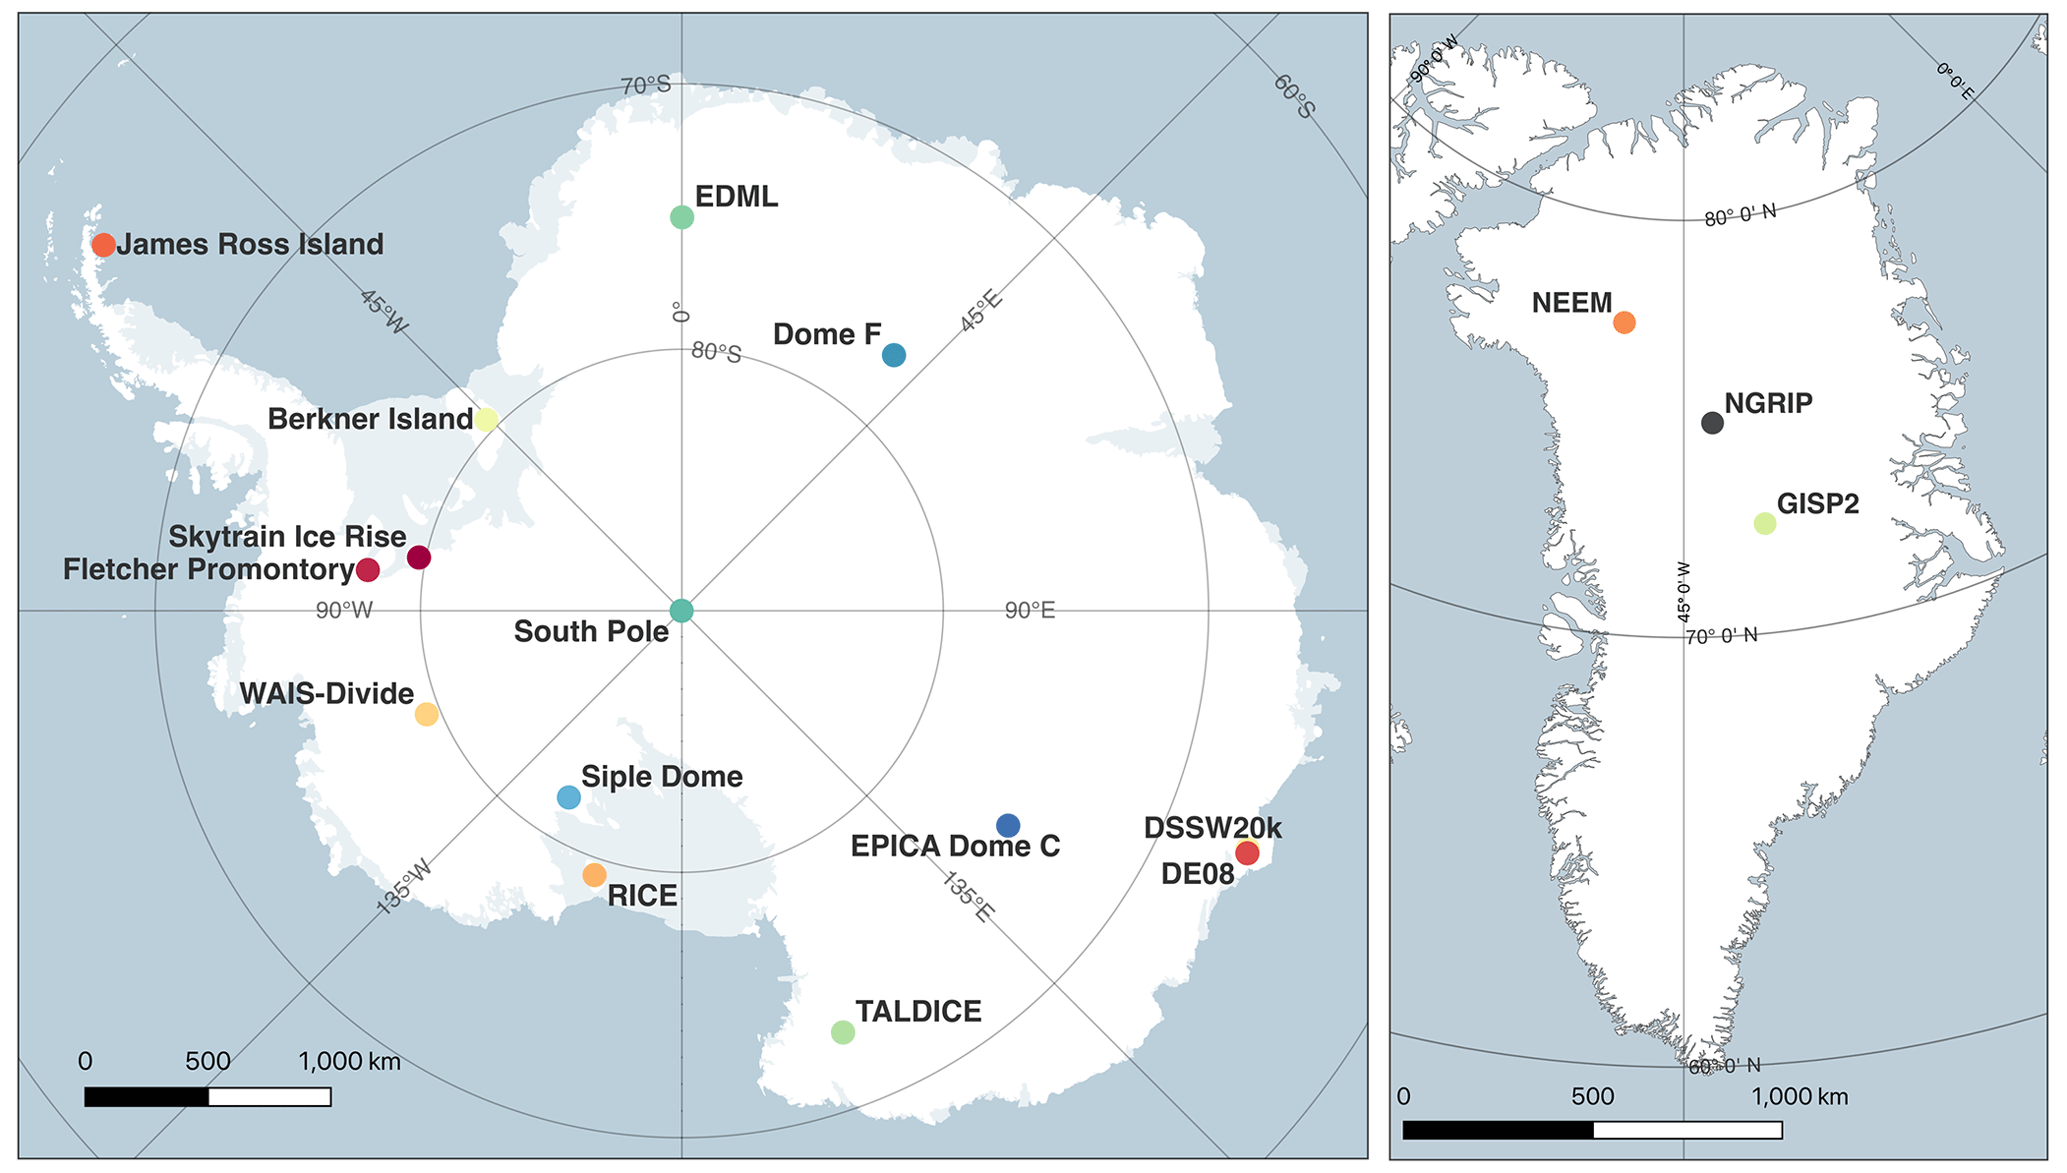
Figure 1Locations of each ice core site initially included in our study (Matsuoka et al., 2018; Moon et al., 2023).
Using a combination of data compilation and snowpack modelling, we aim to develop our understanding of the formation of the records by first determining the role of local climate parameters (accumulation rate and temperature), on variability and subsequently identifying potential mechanisms related to snow physical properties using snowpack sensitivity tests. We use a compilation of datasets from 15 ice cores from both Antarctica and Greenland to identify spatial and temporal patterns in depending on local surface conditions. The impacts of SSI and local climate on snow properties are then assessed using the SURFEX-ISBA-Crocus detailed snowpack model (Vionnet et al., 2012). We aim to constrain the influence of near-surface snow properties on variability, potentially contributing to a mechanistic explanation for elemental fractionation during pore closure.
2.1 Ice core sites
We compiled records from 18 ice cores from Antarctica and Greenland but use data from 15 of those sites for reasons explained in Sect. 2.2.3. Previously published data were measured on ice cores from the following: Dome Fuji (DF), EPICA Dome C (EDC), Greenland Ice Core Project 2 (GISP2), Law Dome (LD) DE08 and DSSW20k, North Greenland Ice core Project (NGRIP), Roosevelt Island Climate Evolution (RICE), Siple Dome (SD), South Pole (SP), Talos Dome (TALDICE), Vostok, and the West Antarctic Ice Sheet Divide (WAIS) ice cores (references for all datasets are presented in Table S1 in the Supplement). We also present unpublished data from Berkner Island (BI), EPICA Dronning Maud Land (EDML), Fletcher Promontory (FP), GISP2, James Ross Island (JRI), North Greenland Eemian Ice Drilling (NEEM), Skytrain Ice Rise (SIR), and Talos Dome (TALDICE) ice cores (an overview of unpublished datasets is in Table S2). Table 1 provides an overview of the site characteristics.
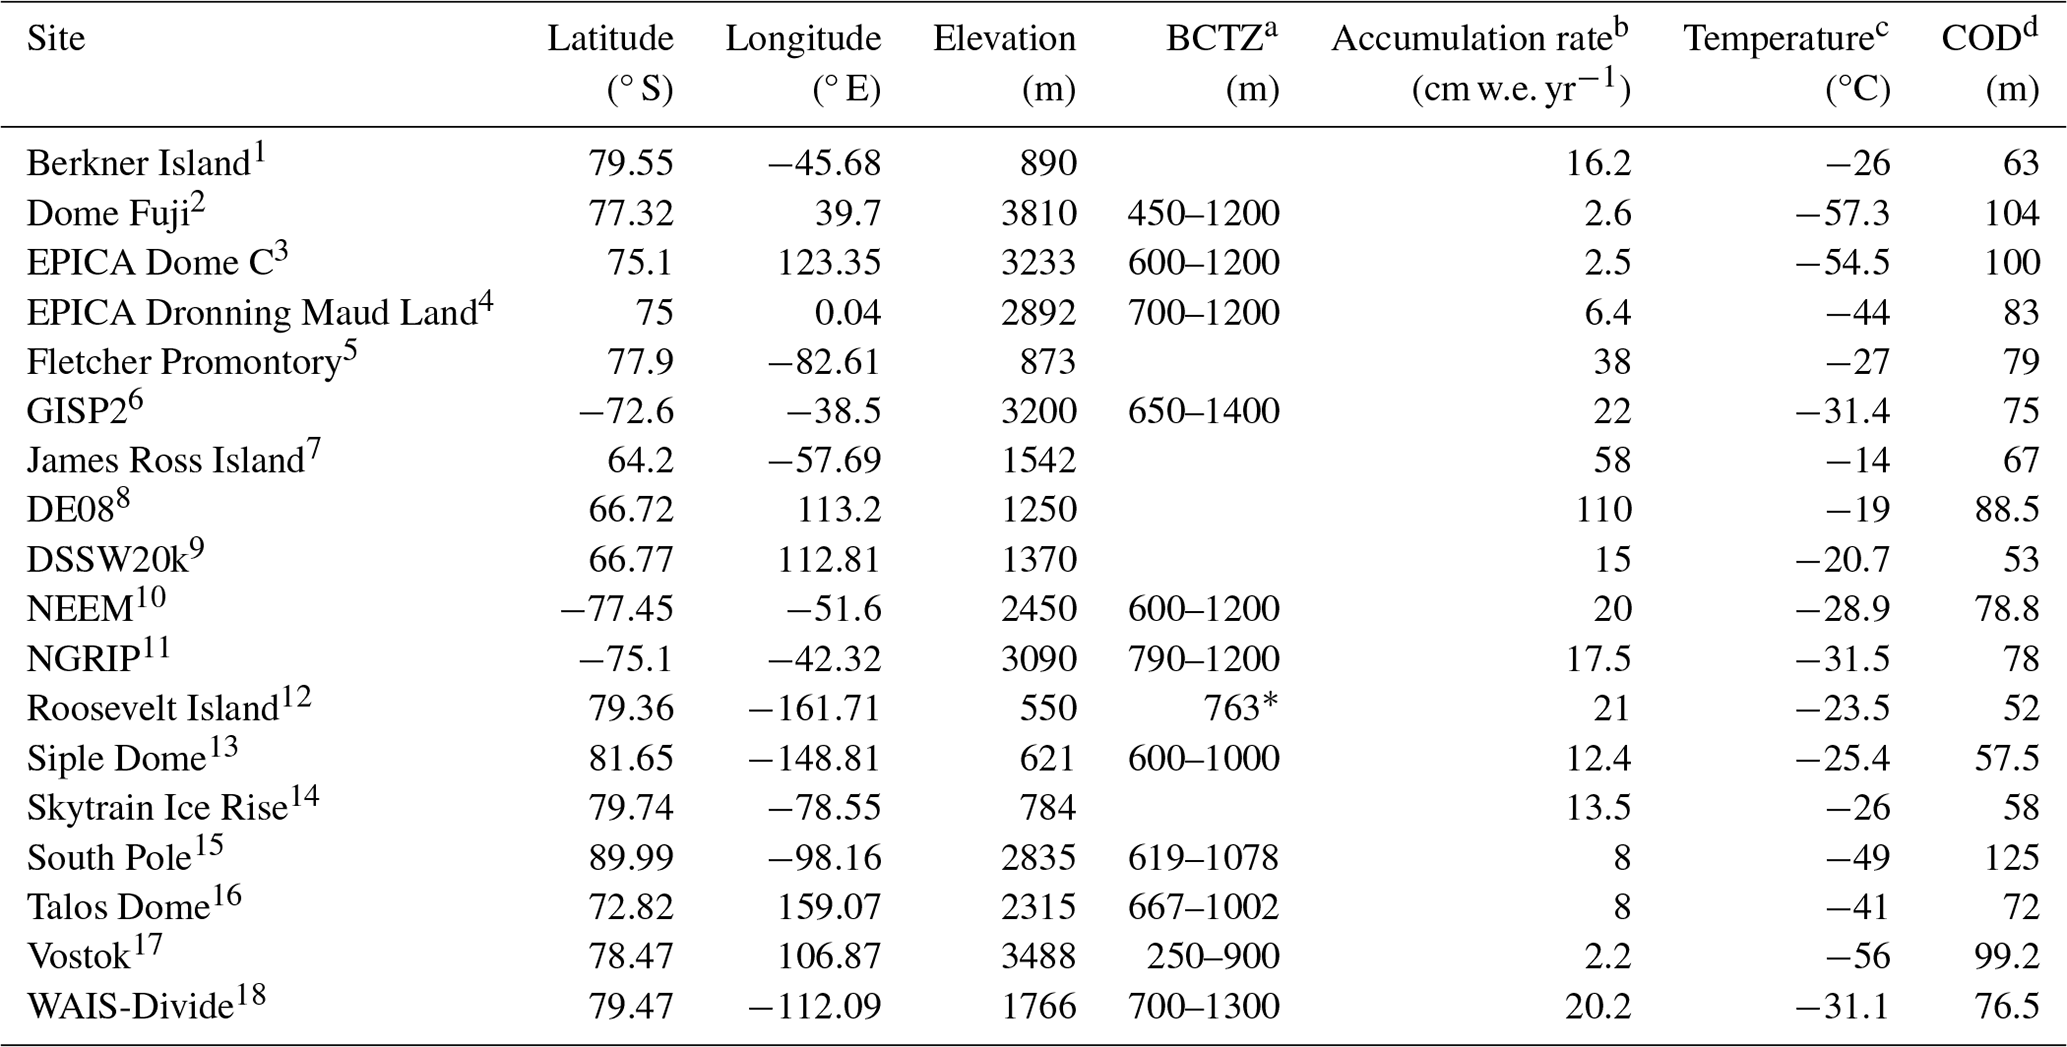
Table 1Overview of ice core site characteristics. The acronym BCTZ stands for brittle–clathrate transition zone, and COD stands for close-off depth.
1 Mulvaney et al. (2007); 2 Oyabu et al. (2021)a,d, Fujita et al. (1998)b,c; 3 Parrenin et al. (2012), a EPICA community members (2004)b,c, Landais et al. (2006)d; 4 Ueltzhöffer et al. (2010)a, EPICA community members (2006); 5 Mulvaney et al. (2014); 6 Gow et al. (1997)a, Alley et al. (1993)b, Alley and Koci (1988)c, Cuffey and Paterson (2010)d; 7 Mulvaney et al. (2014)a,d, Capron et al. (2013)b,c; 8 Etheridge et al. (1996), Etheridge and Wookey (1988)b,c, Etheridge et al. (1996)d; 9 Rubino et al. (2019)a, Morgan et al. (1997)b,c, Buizert and Severinghaus (2016)d; 10 Warming et al. (2013)a, NEEM Community Members (2013)b,c, Buizert et al. (2012)d; 11 NGRIP project members (2004), Martinerie et al. (2009)d; 12 Lee et al. (2020)a,, Bertler et al. (2017); 13 Gow and Meese (2007)a, Severinghaus et al. (2001); 14 Mulvaney et al. (2021), Hoffmann et al. (2022)d; 15 Lazzara et al. (2012)a, Severinghaus et al. (2001); 16 Neff (2014)a, Stenni et al. (2002)b,c; 17 Uchida et al. (1994)a, Petit et al. (1999)b,c, Cuffey and Paterson (2010)d; 18 Fitzpatrick et al. (2014)a, Fegyveresi et al. (2011)b,c, Battle et al. (2011)d.
*Reported bubble–clathrate transition depth corresponds to the maximum depth of RICE core (Lee et al., 2020).
2.2 Analytical techniques for previously unpublished data
The previously unpublished datasets were measured at the Laboratoire des Sciences du Climat et de l'Environnement (LSCE), with the addition of new GISP2 data measured at Scripps Institution of Oceanography (Scripps). At both LSCE and Scripps, gases are extracted from the ice using a melt–refreeze technique based on the method described by Sowers et al. (1989), with modifications to the LSCE method as described by Landais et al. (2003) and to the Scripps method as outlined in Petrenko et al. (2006). In short, ice samples are placed into glass flasks at −20 °C and the atmospheric air is evacuated. Samples are then left to slowly melt to release the trapped gases, before being refrozen. The extracted air samples are then passed through a CO2 and water vapour trap, before being trapped in the stainless-steel dip-tubes submerged in liquid helium. An alternative semi-automated extraction technique was also used at LSCE which removes the need for refreezing the samples (Bazin et al., 2016; Bouchet et al., 2023).
2.2.1 New measurements
Samples from the following sites were measured at LSCE, France, on a 10-collector Thermo Delta V Plus isotope ratio mass spectrometer (IRMS), unless otherwise stated. This instrument allows for simultaneous measurements of elemental and isotopic ratios, including , δ15N-N2, and δ18O-O2. We note that δ15N-N2 data from the BI, EDML, JRI, and TALDICE samples were previously published by Capron et al. (2013). In most cases, the values used in this study are the average of at least two replicate measurements and have an average analytical uncertainty of 0.5 ‰ for .
-
Berkner Island. Measurements were performed on bubbly ice from the BI ice core every 55 cm (every bag) between 631 and 680 m, corresponding to 10.27 to 21.35 ka (Capron et al., 2013). Replicate samples were prepared at LSCE using the melt–refreeze method between March 2010 and March 2011.
-
EDML. Nine samples were measured on bubbly ice from the EDML ice core over five depth levels between 328 and 473 m (327.8 m (4.51 ka), 354.2 m (4.95 ka), 381 m (5.43 ka), 467 m (7.04 ka), and 473 m (7.16 ka)) (Bazin et al., 2013). The samples were prepared using the melt–refreeze method at LSCE. Corresponding measurements of δ15N of N2 were previously published in Capron et al. (2013).
-
Fletcher Promontory. In January 2015, 39 depth levels were measured from the FP ice core, retrieved in 2012. Measurements were performed approximately every 3 m starting at 289 m down to 388 m. There is currently no published age scale for the FP ice core. All samples were prepared using the melt extraction method.
-
James Ross Island. Between February and March 2011, measurements were performed at 16 depth levels on the JRI ice core. The depth resolution varied between 2–50 m starting at 52 m until 363 m corresponding to 0.03–14.3 ka (Mulvaney et al., 2012). Samples were prepared using the melt extraction method.
-
NEEM. Clathrate ice from the NEEM ice core was measured between February and April 2011, a year after the core was retrieved. A total of 119 depth levels were sampled at varying resolutions over the following intervals: 55 cm intervals (every bag) between 1757–1773 m (38.127–39.735 ka b2k), 5.5 m intervals (every 10 bags) between 2205 and 2370 m (108.56–120.237 ka b2k), every 2 bags from 2375–2434 m (no published age scale available below these depths), and 5.5 m intervals (every 10 bags) between 2436 and 2519 m (Gkinis et al., 2021; Rasmussen et al., 2013). Samples were prepared using the melt–refreeze method.
-
Skytrain Ice Rise. Measurements were performed on bubbly ice from the SIR ice core between March and April 2021. Samples were taken sporadically (1–15 m intervals) at 16 depth levels between 307 and 436 m depth (4.707–11.696 ka) (Mulvaney et al., 2023). Each sample was prepared at LSCE using the melt extraction method.
-
TALDICE. Numerous measurements have been performed on bubbly and clathrate ice from TALDICE between 2008 and 2022 at LSCE. A total of 308 depth levels were measured at varying intervals starting at 155 m down to 1617 m. Published age scales reach 1548 m, giving an age range of 1.55–343 ka for TALDICE samples (Buiron et al., 2011; Crotti et al., 2021). All samples were prepared using the melt extraction technique. Some measurements between 1356–1620 m depth have been published previously and are available in Crotti et al. (2021).
Samples from GISP2 were measured at Scripps on a 3 kV Thermo Finnigan Delta V Plus dual-inlet IRMS. All measurements were measured in replicate.
-
GISP2. Two datasets were measured on GISP2 ice. The first set was measured in 2009 at 266 depth intervals from 318.67–1201.22 m. The second set of measurements was performed on samples from 643 depths between 1740 and 2400 m (13–50 ka) over several measurement campaigns between 2017–2020 The δ15N of N2 data from these samples were previously reported (Martin et al., 2023). In both cases, gases were extracting using the melt–refreeze technique, and all measurements were referenced to La Jolla pier air.
2.2.2 Corrections
Chemical slope and pressure imbalance corrections are applied to the measurements during data processing (Landais et al., 2003). In addition, all data are corrected for gravitational fractionation in the firn using δ15N of N2 from the same samples.
Gas loss effects during ice core storage are well documented to modify , causing significant depletion in O2 in clathrate ice stored above −50 °C (Ikeda-Fukazawa et al., 2005; Kawamura et al., 2007; Landais et al., 2012). Ikeda-Fukazawa et al. (2005) proposed a correction for storage gas loss effects as a function of temperature and time. However, given the incomplete storage history for all ice cores, we do not attempt to correct for storage gas loss but rather define rejection criteria outlined in Sect. 2.2.3.
2.2.3 Data rejection criteria
Ice core storage histories need to be considered before interpreting the data to account for post-coring gas loss effects which disturb the signal (Sect. 2.2.2). Successive measurements from TALDICE and GISP2 clathrate ice samples stored above −50 °C show strong depletion of O2 through time (Sect. S1 in the Supplement), which is consistent with observations from EDC (Bouchet et al., 2023). We systematically reject measurements from clathrate ice stored at −20 °C for over 3 years or at −36 °C for more than 4 years. Bubbly ice stored at these same temperatures appears to be mostly unaffected by gas loss (Sect. S1.2), with the exception of Vostok (Bender, 2002).
Several measurements were performed on ice within the bubble–clathrate transition zone (BCTZ), where high hydrostatic pressure in bubbles cause entrapped gases to form clathrate hydrates (Schaefer et al., 2011). At these depths, elemental fractionation occurs due to some gas species being preferentially incorporated into the clathrate structures (Ikeda-Fukazawa et al., 2001), thus making the interpretation of gas measurements unreliable (Bender, 2002). Measurements from the BCTZ may either have increased mean (usually in excess of 0 ‰) or strong data scattering, expressed as a high standard deviation (Oyabu et al., 2021). To avoid adding biases to our analysis, measurements from BCTZ are removed (Sect. S1.1). Additional scattering in elemental ratios, characterised by a standard deviation of 6.2 ‰ compared to 1.8 ‰ in pure bubble and clathrate ice, is observed below the BCTZ in the WAIS record between 1300–1500 m (Shackleton, 2019). Similar effects have been documented in the EDC and TALDICE ice cores (Lüthi et al., 2010), as well as the Dome Fuji ice core (Oyabu et al., 2021). Data influenced by this scattering effect were also removed from our analysis, followed by the removal of outliers (2σ) from the cleaned datasets.
We note that these criteria result in the removal of all data from NGRIP, as well as sections of data from other sites (Sect. S1 for overview). We also exclude FP and SIR due to limited availability of accumulation rate and temperature records over the depth/age ranges covered by the date. The remaining 15 datasets are presented in Table 3 and were used to analyse the drivers of variability.
2.3 Modelling near-surface snow properties
The second component of our study addresses the modelled response of snow physical properties to perturbations in SSI, accumulation rate, and temperature with the aim of identifying which properties may be influencing elemental fractionation during pore closure. We use the SURFEX-ISBA-Crocus detailed snowpack model (Crocus hereafter) to simulate snowpack evolution (Vionnet et al., 2012). Crocus simulates changes in snow physical properties induced by surface metamorphism and the evolution of these properties with depth. The model is forced by ERA5 reanalysis data (Hersbach et al., 2020), and the snowpack is initialised with measurements of snow density, effective optical radius of snow grains, and snow temperature. Optical radius is defined as the radius which snow grains would have for their surface area-to-volume ratio if they were spherical (Domine et al., 2006). Optical radius is thus directly linked to specific surface area (SSA), defined as the surface area of snow at the ice–air interface per unit mass (units m2 kg−1) (Legagneux et al., 2002), via the following equation:
where ropt is the optical radius and where ρice is the density of ice (Gallet et al., 2014). We use this model to assess changes in snow physical properties near the surface which are invoked to explain variability. Dome C is used as the test site, given the abundance of snowpack observations as well as high-resolution data.
2.3.1 Crocus model description
Crocus is a one-dimensional model which simulates the evolution of snow properties with time and depth on a layer-by-layer basis, i.e. in a Lagrangian framework (Vionnet et al., 2012). A detailed description of the model can be found in Vionnet et al. (2012). Briefly, the initial number of layers is defined by the user, with the thickness of each layer allowed to change along the simulation (layer thickness ranging from 2 mm at the surface to metres thick). The maximum number of layers available in the model was increased from 50 (Libois et al., 2014) to 80 (this study) to maximise the resolution with depth, owing to the higher number of thin layers forming at Dome C than at Alpine sites. Once the simulated snowpack consists of 80 layers, the aggregation scheme merges internal neighbouring layers with similar properties, allowing a new surface layer to form. The key physical processes incorporated into Crocus for dry snow conditions are accumulation of snowfall, snow metamorphism, compaction of snow by the wind, compaction due to the weight of the overlaying layers, absorption of solar radiation, heat diffusion, and surface energy budget.
For our study, two fundamental user-defined model components are the snow metamorphism and radiative transfer schemes. We use the semi-empirical model from Flanner and Zender (2006) (F06) for the metamorphism scheme which describes the evolution of optical radius with time. F06 was found to be the most appropriate formulation for Dome C conditions (Carmagnola et al., 2014; Libois et al., 2014). To successfully reproduce the snow temperature profile (vital for realistically simulating snow metamorphism), the Two-streAm Radiative TransfEr in Snow (TARTES) model is used to account for vertical distribution of absorbed solar radiation in the snowpack (Libois et al., 2013). TARTES also considers the effect of impurities on snow temperature via albedo. For Dome C, we include black carbon content, which is set to 3 ng g−1 (Warren et al., 2006; Libois et al., 2015). Here we assess the simulated snow density, snow temperature, and snow SSA from the Crocus model outputs.
2.3.2 Dome C-specific Crocus configuration
Crocus was initially developed for Alpine or sub-polar regions with seasonal snowpacks. Libois et al. (2014) modified multiple components of the Crocus model to improve its suitability to high-latitude sites with low accumulation rates – specifically for Dome C. The modifications are extensively described in Libois et al. (2014) and were implemented into the current version of Crocus for this study. The changes are as follows:
-
Fresh snow properties. The parameterisation of fresh snow density is based on temperature and wind speed, which results in an unrealistically low density for Dome C (50 kg m−3). Fresh snow density is fixed to a minimum of 170 kg m−3, the lowest fifth percentile from Dome C observations (Libois et al., 2014). Similarly, fresh snow SSA is set to 100 m2 kg−1 instead of the 65 m2 kg−1 used in the standard version of the model (Grenfell et al., 1994; Libois et al., 2014).
-
Wind-induced compaction. At low-accumulation sites, snow remains at the surface for prolonged periods of time. The long exposure time to surface winds facilitates compaction and, hence, increases density. The maximum surface snow density is increased from 350 kg m−3 to 450 kg m−3 to account for this effect (Albert et al., 2004; Libois et al., 2014).
-
Aggregation scheme. The formation of a new snow layer requires a minimum amount of snowfall. Due to the low accumulation rate at Dome C, the amount of snowfall needed to form a new layer was decreased from 0.03 mm h−1 to 0.003 mm h−1. In the instance when the snowpack has the maximum number of layers (80) at the time a new snow layer is formed, layers with similar properties will be aggregated, resulting in a smoothed signal. The aggregation scheme was disabled for the top six layers to resolve realistic near-surface snow temperature profiles, required to accurately simulate snow metamorphism.
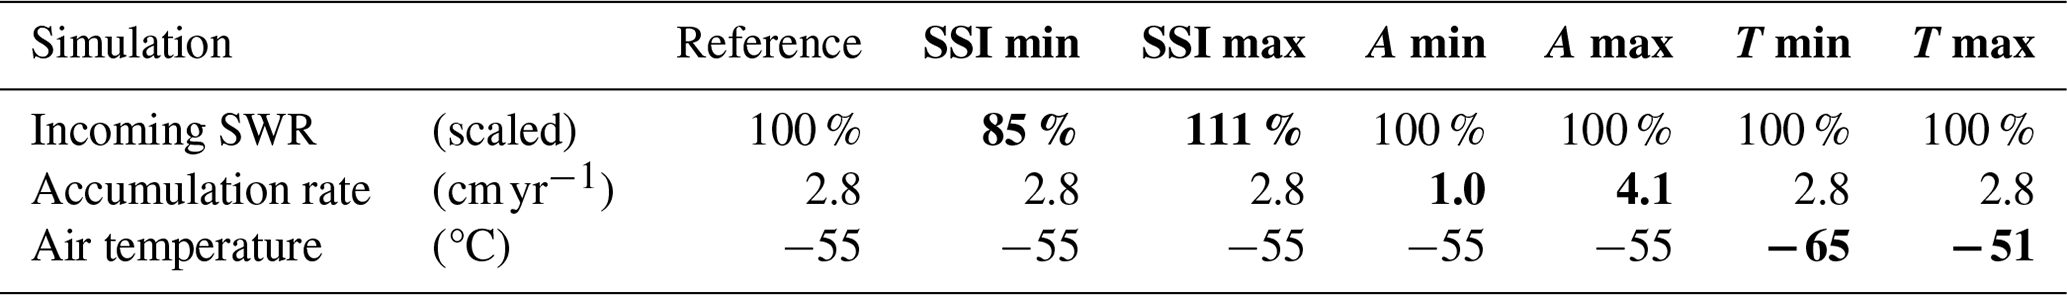
Table 2Overview of modifications made to forcing test parameters in Crocus snowpack sensitivity test scenarios. Perturbed forcing parameters are shown in bold.
2.3.3 Model initialisation
The snowpack was initialised with density and optical radius profiles measured in January 2010 at Dome C down to 20 m (Champollion et al., 2019), as well as snow temperature data from a probe installed at Dome C in 2012 with 5 cm resolution near the surface, coarsening with depth down to 12 m. ERA5 reanalysis data for Dome C was used to force the model at 3-hourly resolution over the period between 1 January 2000 and 1 December 2020 (Hersbach et al., 2020). The model requires atmospheric forcings for air temperature, accumulation rate, wind speed and direction, incoming shortwave and longwave radiation, and specific humidity. ERA5 gives a mean annual snowfall rate between 2000 and 2020 of 2.3 , and as such, the snowfall rate was multiplied by 1.2 to match the observed mean annual accumulation rate of around 2.8 (Frezzotti et al., 2004; Libois et al., 2014). To ensure that at least the top 1 m consists of accumulated snow, a 100-year spin-up was used by running the forcing file 10 times between 2000 and 2010, followed by the period from 2000 to 2020. The outputs from 2010 to 2020 were then used for analysis.
2.3.4 Sensitivity tests
The sensitivity of snowpack properties to perturbations in surface forcings is tested by modifying one of three forcing parameters: incoming shortwave radiation, accumulation rate, or 2 m air temperature. The magnitude of the perturbation to each parameter corresponds to minimum and maximum values reconstructed over the last 800 kyr. We use shortwave radiation as a proxy of insolation and scale the values in proportion to the SSI values. A total of seven simulations are used to perform sensitivity analysis and are outlined in Table 2. The model configuration and initial snow profile were kept constant for each simulation; only the tested parameter in the atmospheric forcing file was modified as follows:
-
Summer solstice insolation (SSI). Over the last 1000 years, the average SSI at 75.1° S was 544 W m−2 (Laskar et al., 2004), compared to a minimum of 462 W m−2 and a maximum of 601 W m−2 over the past 800 kyr. To translate to forcing perturbations, the incoming shortwave radiation (SWR) is scaled by 85 % and 111 %, respectively, to reach the target values (462 and 601 W m−2). No additional modifications are applied to the annual distribution of SWR.
-
Annual mean accumulation rate (A). Present-day accumulation rate at Dome C is set to 2.8 following Libois et al. (2014). Hereafter, accumulation rates are expressed as water equivalent centimetres per year (in the form cm yr−1). ERA5 snowfall was scaled by 36 % to reach the target accumulation rate of 1.0 cm yr−1, representing the 800 kyr minimum, and 146 % to produce an accumulation rate of 4.1 cm yr−1, which corresponds to the 800 kyr maximum (Bazin et al., 2013).
-
Annual mean air temperature (T). Snowpack sensitivity to air temperature is tested by decreasing the 2 m air temperature by 10 °C for glacial conditions (Jouzel et al., 2007) and applying a 4 °C increase to represent the 800 kyr maximum temperatures. We note, however, that borehole temperature measurements and delta-age are more consistent with a 5 °C cooling (Buizert et al., 2021). Furthermore, these temperature modifications do not include changes in seasonal temperature variability but suffices for the purpose of identifying bulk changes in the snow properties. The average seasonal cycle is kept constant with an average amplitude of 35 °C.
It is important to highlight that, at polar sites, accumulation rate is dependent on temperature, and temperature is influenced by insolation, such that these parameters are not independent. However, we use the model to constrain the influences of each forcing parameter in an independent manner to understand the mechanisms, even if, in reality, these parameters are inter-dependent.
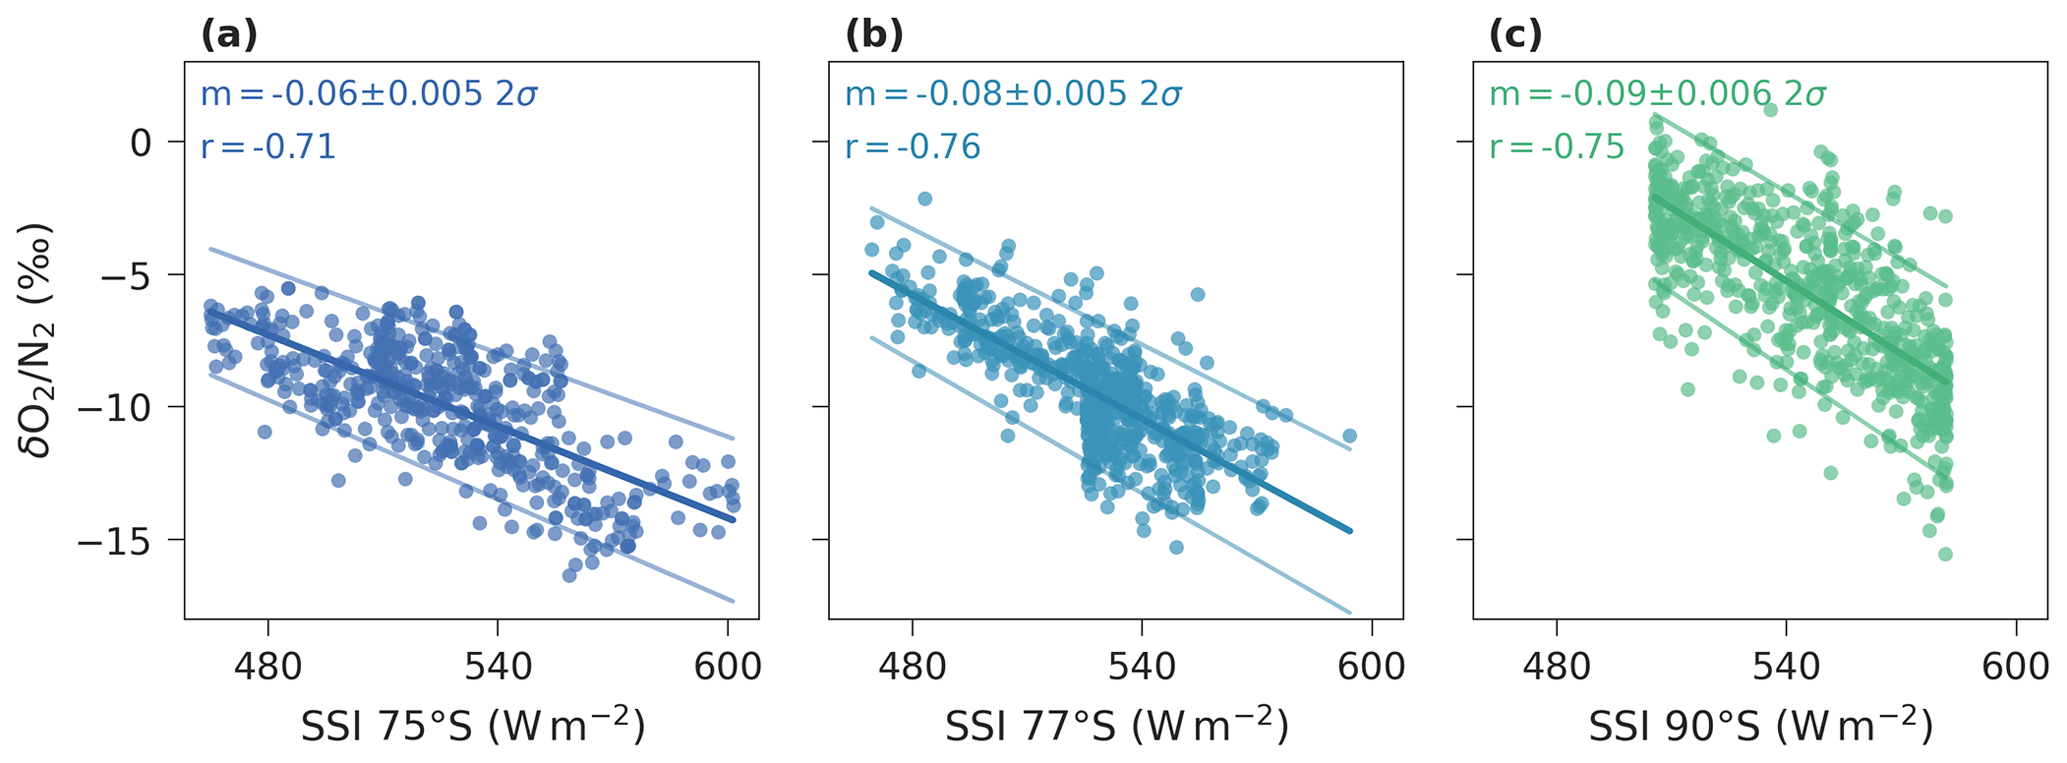
Figure 2Scatterplots showing the relationship between SSI and at three Antarctic sites. Significant negative correlations (over 99 % confidence) are observed using relatively high-resolution data from (a) EDC (Bouchet et al., 2023), (b) Dome F (Kawamura et al., 2007; Oyabu et al., 2021), and (c) South Pole (Severinghaus, 2019). The slope (m, units ‰ W−1 m2) and r values are presented for each site.
3.1 Influence of SSI and local climate on variability in ice cores
Figure 2 shows versus SSI for EDC, Dome F, and South Pole. These three sites are used owing to their temporal range and high-resolution measurements, largely uninfluenced by gas loss. The regression slopes vary between ‰ W−1 m2 for South Pole to ‰ W−1 m2 for EDC. The regression for Dome F falls within two standard deviations (2σ) of the regression for EDC, but the regression for South Pole falls outside this uncertainty. values from South Pole are higher than for EDC and Dome F for the same SSI, suggesting that additional factors are influencing the records, such as accumulation rate, which at South Pole is around three times that of both EDC and Dome F. In the following sections, we provide evidence for the influences of accumulation rate and air temperature on , in addition to SSI, using both spatial (inter-site) and temporal (EDC ice core) variability of .
3.1.1 Inter-site comparison of mean
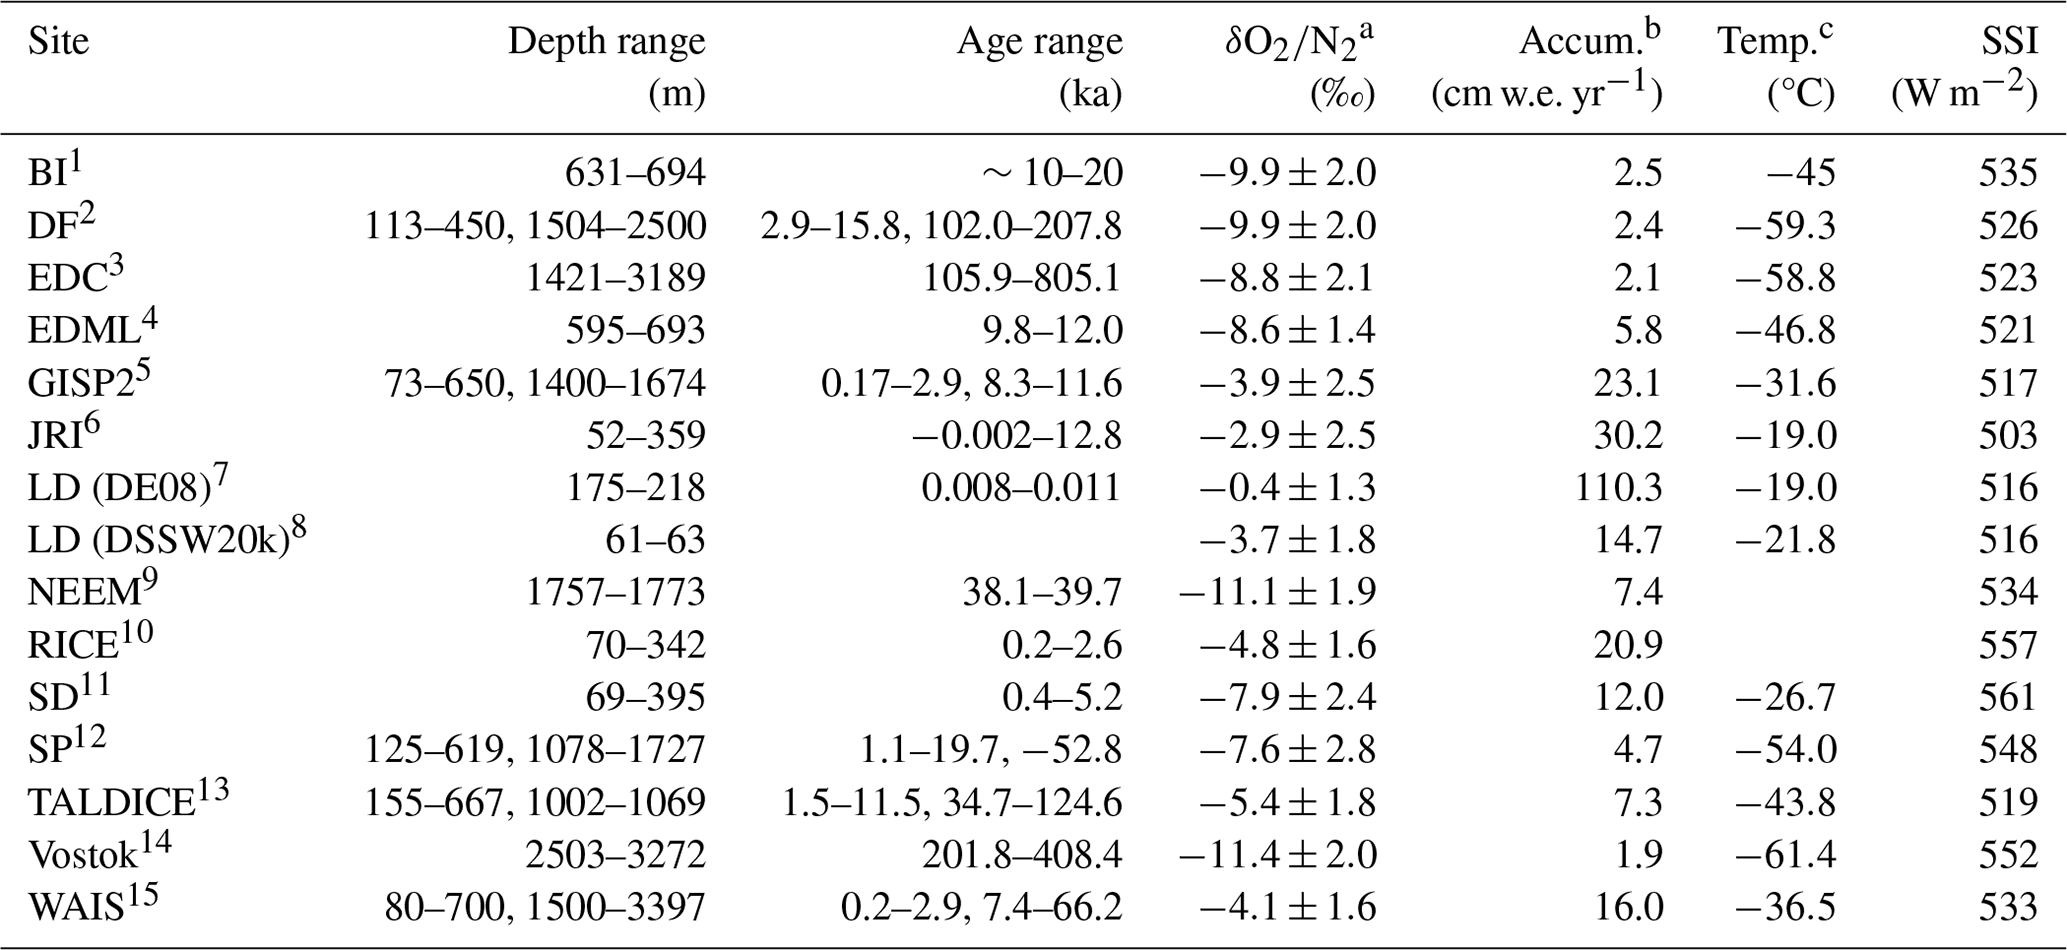
In addition to the datasets, we compile SSI, accumulation rate, and temperature reconstructions for each site over the age/depth ranges which overlap in all records (Table 3). Drivers of mean are then explored using regression analysis, as presented in Fig. 3. Due to limited data availability from the BI ice core, we use the average of present-day and Last Glacial Maximum temperature and accumulation rates from Capron et al. (2013). This is justified given the data span approximately the Last Glacial Maximum to the start of the Holocene (Massam, 2018). Present-day values are used for accumulation rate and temperature at DE08 and DSSW20k due to the relatively young ages corresponding to the data (∼0.09 ka).
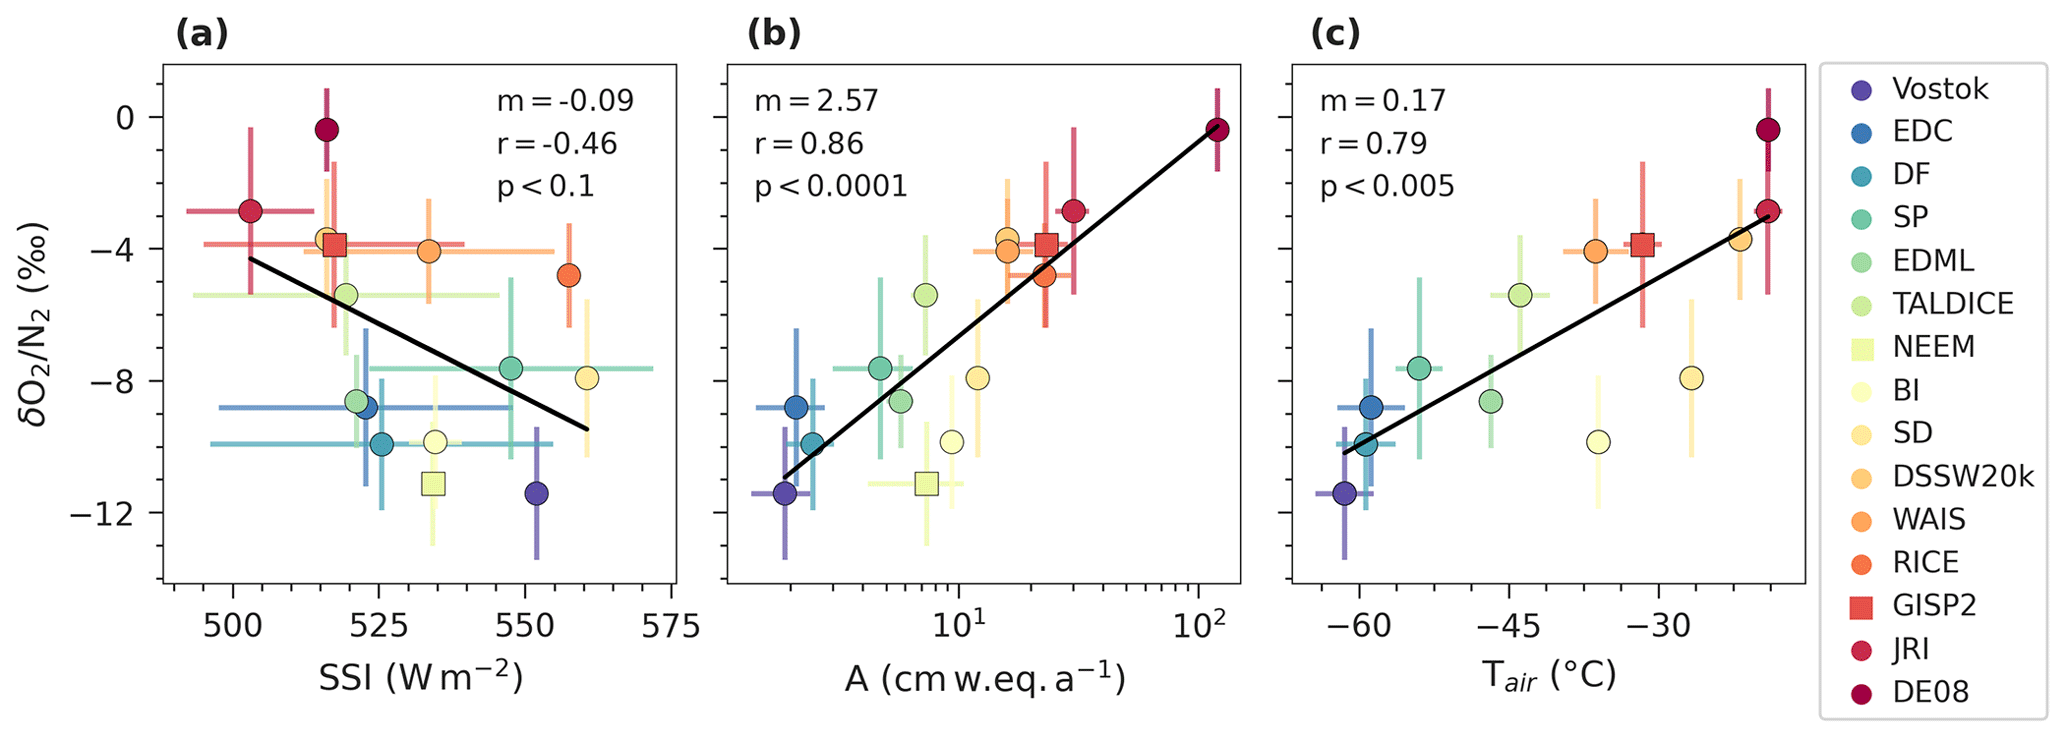
Figure 3Scatterplots showing the dependence of on (a) SSI, (b) accumulation rate (A), and (c) air temperature (Tair). Each point represents the mean values of each site over the depth interval in Table 3, with error bars showing the standard deviation (1σ). Sites from Greenland are identified by square markers. Linear regressions are shown in black, along with the associated slope (m, units ‰ W−1 m2), correlation coefficient (r), and p value (p).
Table 3Overview of data used in Fig. 3. Mean values are presented for , accumulation rate (in water equivalent), temperature, and SSI at the current site latitude (Laskar et al., 2004). Where age scales are available, the SSI represents the mean values at the present-day site latitude. For sites without age scales, the average SSI over the last 1000 years is used. All data compiled for this study can be accessed at https://doi.org/10.5281/zenodo.12571888 (Harris Stuart, 2024).
1 This studya, Capron et al. (2013)b,c
2 Kawamura et al. (2007)a, Oyabu et al. (2021)a, Kawamura et al. (2017)b, Uemura et al. (2018)c
3 Bouchet et al. (2023)a, Bazin et al. (2013)b, Jouzel et al. (2007)c
4 This studya, Bazin et al. (2013)b, Stenni et al. (2010)c
5 This studya, Bender et al. (1994)a, Smith (1998)a, Suwa and Bender (2008b)a, Cuffey and Clow (1999)b, Clow (1999)c
6 This studya, Mulvaney et al. (2012)b,c, Capron et al. (2013)b,c
7 Buizert et al. (2020)a, Etheridge and Wookey (1988)b,c
8 Buizert et al. (2020)a, Morgan et al. (1997)b,c
9 This studya, Rasmussen et al. (2013)b
10 Lee et al. (2020)a, Winstrup et al. (2019)b
11 Severinghaus (2009)a, Buizert (2021)b,c
12 Severinghaus (2019)a, Kahle et al. (2020)b,c
13 This studya, Crotti et al. (2021)a, Bazin et al. (2013)b,c
14 Bender (2002)a, Suwa and Bender (2008a)a, Bouchet et al. (2023)b, Petit et al. (1999)c
15 Severinghaus (2015)a, Fudge et al. (2017)b, White et al. (2019)c.
Figure 3 indicates significant correlations between mean and all surface variables (SSI, accumulation rate, and temperature). Mean SSI appears to have the weakest influence on mean (Fig. 3a; , p<0.1), but a slope of ‰ W−1 m2 is statistically indistinguishable from the temporal slope (−0.07 ‰ W−1 m2; Fig. 2). The weaker spatial correlation may be linked to the narrow range in SSI between sites compared to the temporal range of SSI at an individual site. Figure 3b and c show strong, significant correlations between mean and both the natural log of accumulation rate (r=0.86, p<0.0001) and temperature (r=0.79, p<0.005). The log-linear model in Fig. 3b indicates that a doubling of accumulation rate would result in a 1.4 ‰ increase in (). However, it is important to note that temperature and the logarithm of accumulation rate are strongly correlated in Antarctica, such that the correlations seen in panels (b) and (c) of Fig. 3 are dependent on one another.
Deviations from the regression lines in Fig. 3 may have multiple origins, such as discrepancies in site latitude resulting from the ice flow speeds at different sites or simply uncertainties in the records. For BI and SD, we consider that the relatively low values may be the result of storage gas loss effects (Sects. 2.2.3 and S1), given that the measurements were carried out ∼7 and ∼8 years after coring for BI and SD, respectively. While clathrates are reportedly absent from BI (Mulvaney et al., 2007; Neff, 2014) and while SD data were removed below 600 m, i.e. the depth at which clathrate-like features first appear (Gow and Meese, 2007), the low values may link to gas loss during storage within increasingly brittle ice at depth in the core. Indeed, brittle ice is reported from 450 m at BI and from 400 m at SD (Neff, 2014).
3.1.2 Temporal variability of at Dome C
High-resolution data are required to investigate the temporal variability in as a function of accumulation rate and temperature. The δ-deuterium (δD) record from water isotope measurements is used as a qualitative proxy for accumulation rate and temperature, whereby higher δD values are generally associated with increased accumulation rate and temperature in ice cores from the East Antarctic plateau (Jouzel et al., 2007; Parrenin et al., 2007). The following analysis uses the longest period of relatively high-resolution measurements from the EDC ice core between 190–259 ka (1980–2350 m) on the AICC2023 ice-age chronology (Bouchet et al., 2023).
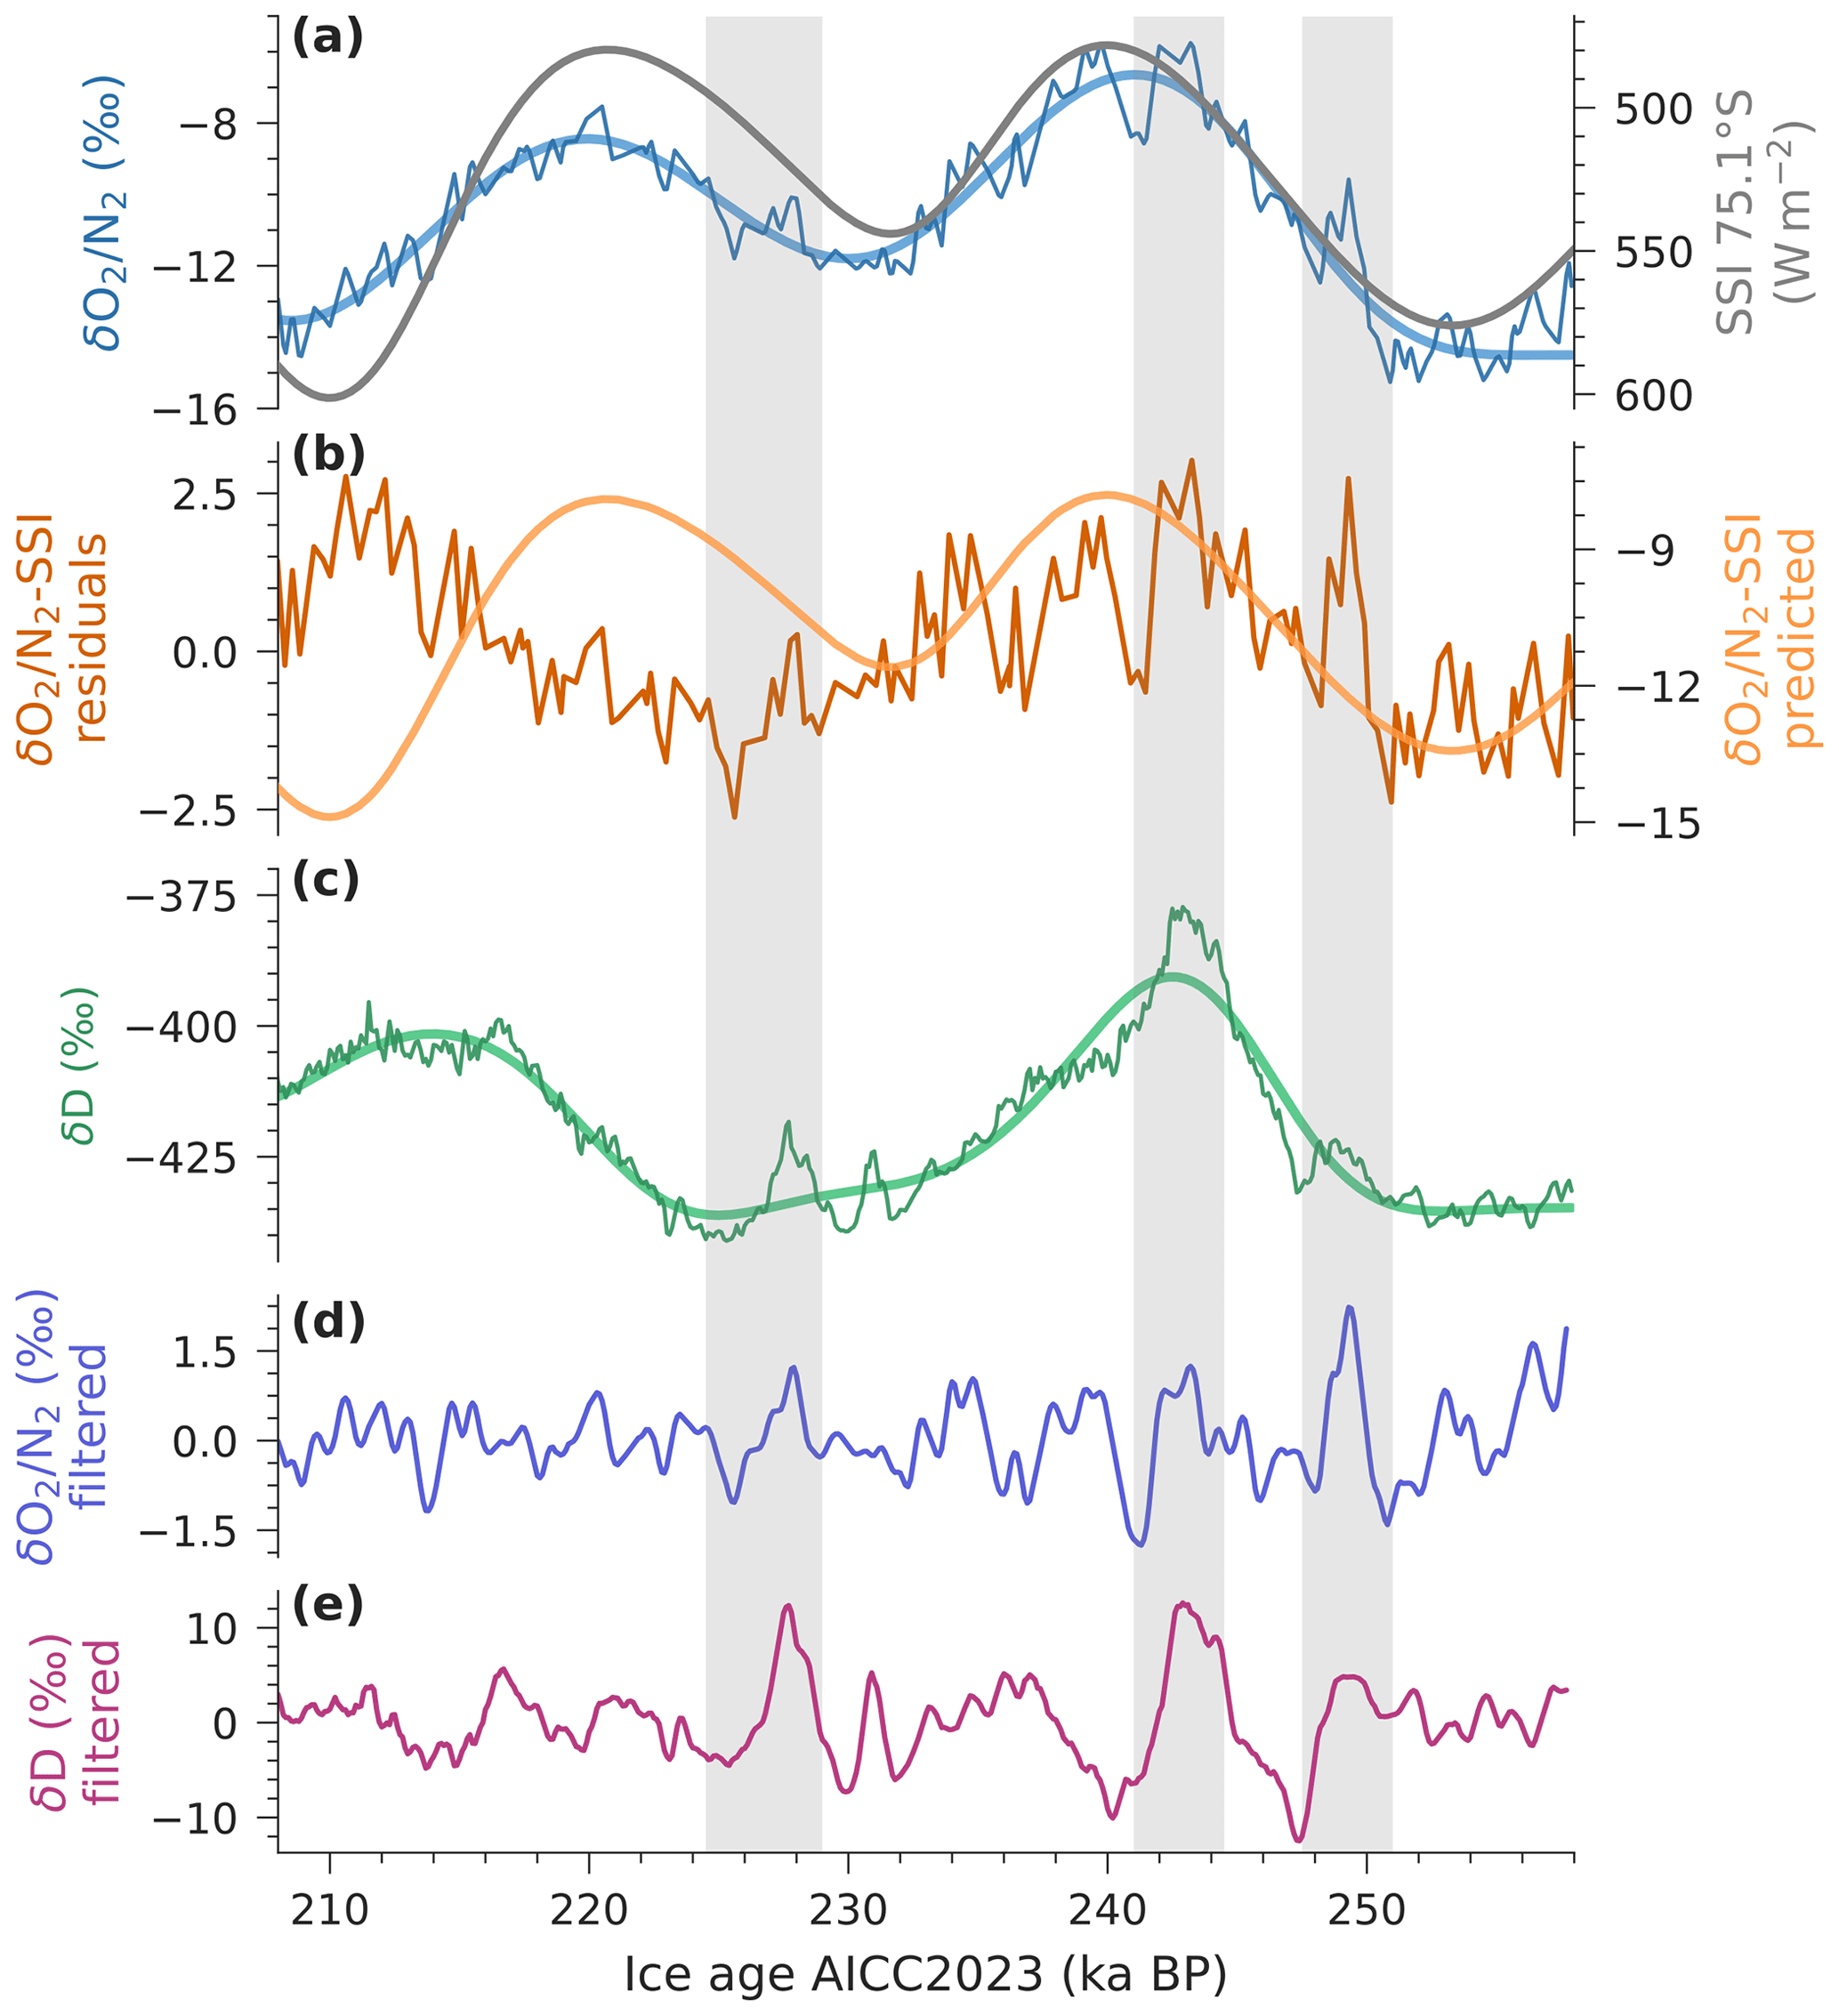
Figure 4Evolution of , SSI, and δD on the AICC2023 ice-age timescale from EDC (Bouchet et al., 2023). Panel (a) presents the 100-year interpolated overlain with the low-pass-filtered curve (blue). The right y axis in panel (a) shows SSI at 75.1° S (grey). The predicted as a function of SSI (–SSI predicted) is shown on the right axis of panel (b), and the residuals of the observed and predicted data are on the left axis. Panel (c) shows the 100-year interpolated δD overlain with the low-pass-filtered curve (green). The bottom two panels present the residuals of the low-pass-filtered curves for (d) and δD (e). Grey bars highlight the pronounced millennial-scale variability.
Two approaches are used to extract the non-SSI signals in the records. First, we interpolate SSI onto the ages and take the deviations from the –SSI linear regression to isolate the variability not explained by SSI (hereafter, –SSI residual). The second approach directly investigates the millennial-scale variability by applying a low-pass filter to the and δD records (interpolated onto a 100-year time step), using a 10 kyr cut-off to isolate the low-frequency signals associated with SSI. The filtered curves are then subtracted from the original curves to remove the orbital (SSI) signal, and a five-point moving average is applied to the residuals to reduce noise but retain millennial-scale variability in the records.
Figure 4 primarily shows the dominant SSI cyclicity in the record, as has been documented previously (e.g. Landais et al., 2012). Superimposed onto this signal are millennial-scale peaks in which appear to coincide with peaks in δD, highlighted by grey bars. This high-frequency variability is more clearly identified from the filtered curves in Fig. 4d and e. The coherence between millennial-scale peaks in and δD suggests a positive correlation with accumulation rate and temperature, which shares analogy with the positive spatial correlation between and both accumulation rate and temperature (Fig. 3). We note a remnant 20 kyr variability in the –SSI residual, in phase with δD, which is present when using either the AICC2012 chronology (Bazin et al., 2013) or the AICC2023 chronology (Bouchet et al., 2023). Given that the new AICC2023 age scale (used here) has been orbitally tuned using these data (Bouchet et al., 2023), this signal is not expected to be the result of a phase difference between the EDC chronology and SSI.
3.2 Crocus model results
3.2.1 Crocus model evaluation for Dome C
The Crocus model outputs are first evaluated by comparing the reference simulation (“Reference” in Table 2) to observational data from Dome C. Simulated density and SSA profiles are compared to data from Libois et al. (2014), measured daily between 23 November 2012 and 16 January 2013 at two sites within 600 m of Concordia station, Dome C. Density was measured at 2.5 cm resolution down to 25 cm, while SSA was measured at 1 cm depth intervals down to 50 cm. Snow temperature at Dome C has been continuously measured since 2012 at 30 min intervals. Simulated snow density and SSA were interpolated to a fixed grid of 1 cm depth resolution and a 24 h time step between 1 January 2010 and 1 December 2020, while snow temperature was interpolated onto a 1 mm by 6-hourly grid over the same time period.
Density and SSA outputs presented in Fig. 5a and b are averaged values over the measurement period. For the most part, the observations fall within the range of the simulations. The simulated SSA profile is consistently within 1 standard deviation of the measurements below 10 cm; above this depth, simulated SSA is overestimated by up to 10 m2 kg−1. Small standard deviations associated with simulated density and SSA profiles suggest that variability is not well reproduced. As discussed in Libois et al. (2014), the standard version of Crocus is unable to reproduce density and SSA variability with depth due to its one-dimensional nature. For the purpose of our study, we consider the standard version sufficient to assess the overall sensitivity of snowpack properties to perturbations in forcings.
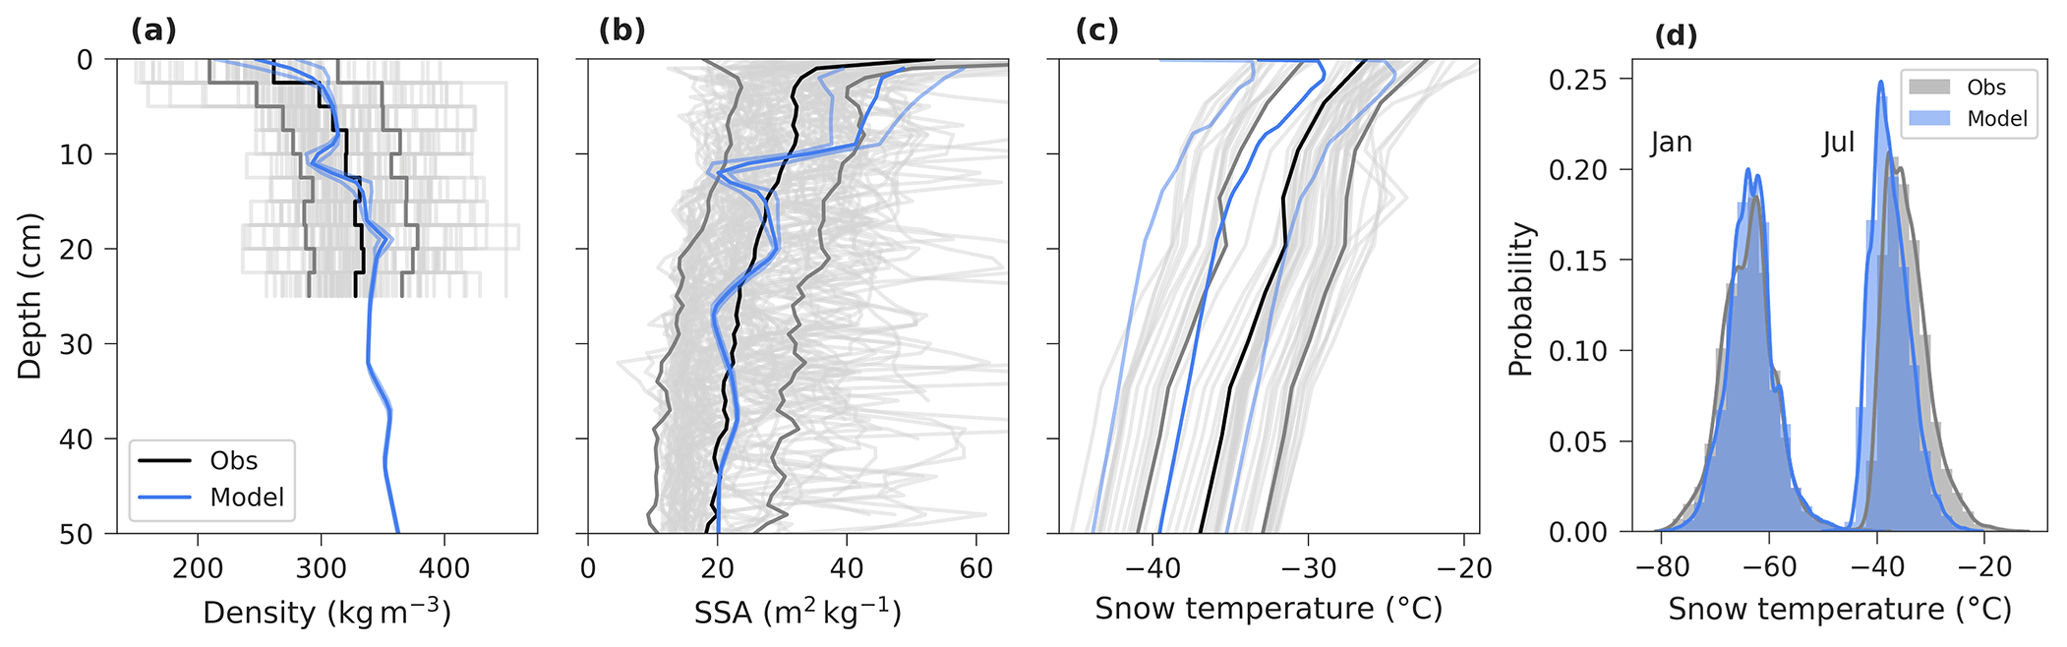
Figure 5Comparison of observations and Crocus-simulated snowpack profiles. Density (a) and SSA (b) profiles represent the average from 23 November 2012 and 16 January 2013, covering the measurement period (Libois et al., 2014). Snow temperature profiles (c) both from Crocus (blue) and observations (grey) represent 23 November 2019 to 16 January 2020 averages. Faded grey lines represent individual profiles from observations, and the shaded bands show the standard deviations. Snow temperature distributions in panel (d) represent January and June temperatures between 2016 and 2020.
Snow temperature in Fig. 5c covers the period between 23 November 2019 and 16 January 2020. A 3 °C cold bias is apparent, but the mean falls within 1σ of the observations. Figure 5d presents distributions of the stacked January snow temperatures between 2016 and 2020, further highlighting this 3 °C cold bias during summer ( and °C for Crocus outputs and observations, respectively). However, winter snow temperatures are well simulated with a 1 m mean of and °C from Crocus outputs and observations, respectively. The overestimation of simulated SSA in the top 10 cm may be linked to the cold bias in modelled snow temperature during summer via the reduced rate of near-surface snow metamorphism. Alternatively, high SSA may be the result of a recent precipitation event. During large precipitation events, the initial surface snow layer is buried rapidly, allowing less time for snow metamorphism (SSA decrease). This is particularly pronounced near the surface (top 5 cm) where the majority of metamorphism occurs in response to strong diurnal temperature gradients driven by solar radiation (Picard et al., 2012). This could result in sustained high SSA in the top 10 cm.
3.2.2 Simulated response of snowpack properties to surface forcing perturbations
Sensitivity tests were run using the Crocus model to assess the response of near-surface snowpack properties to perturbations in surface forcings. The following analysis uses optical radius as a measure of grain size, which is directly linked to SSA and the density of ice (Sect. 2.3.1), and focuses on the response of near-surface snow density and grain size to the six scenarios outlined in Table 2. We firstly assess the bulk changes in physical properties before looking at the variability with depth.
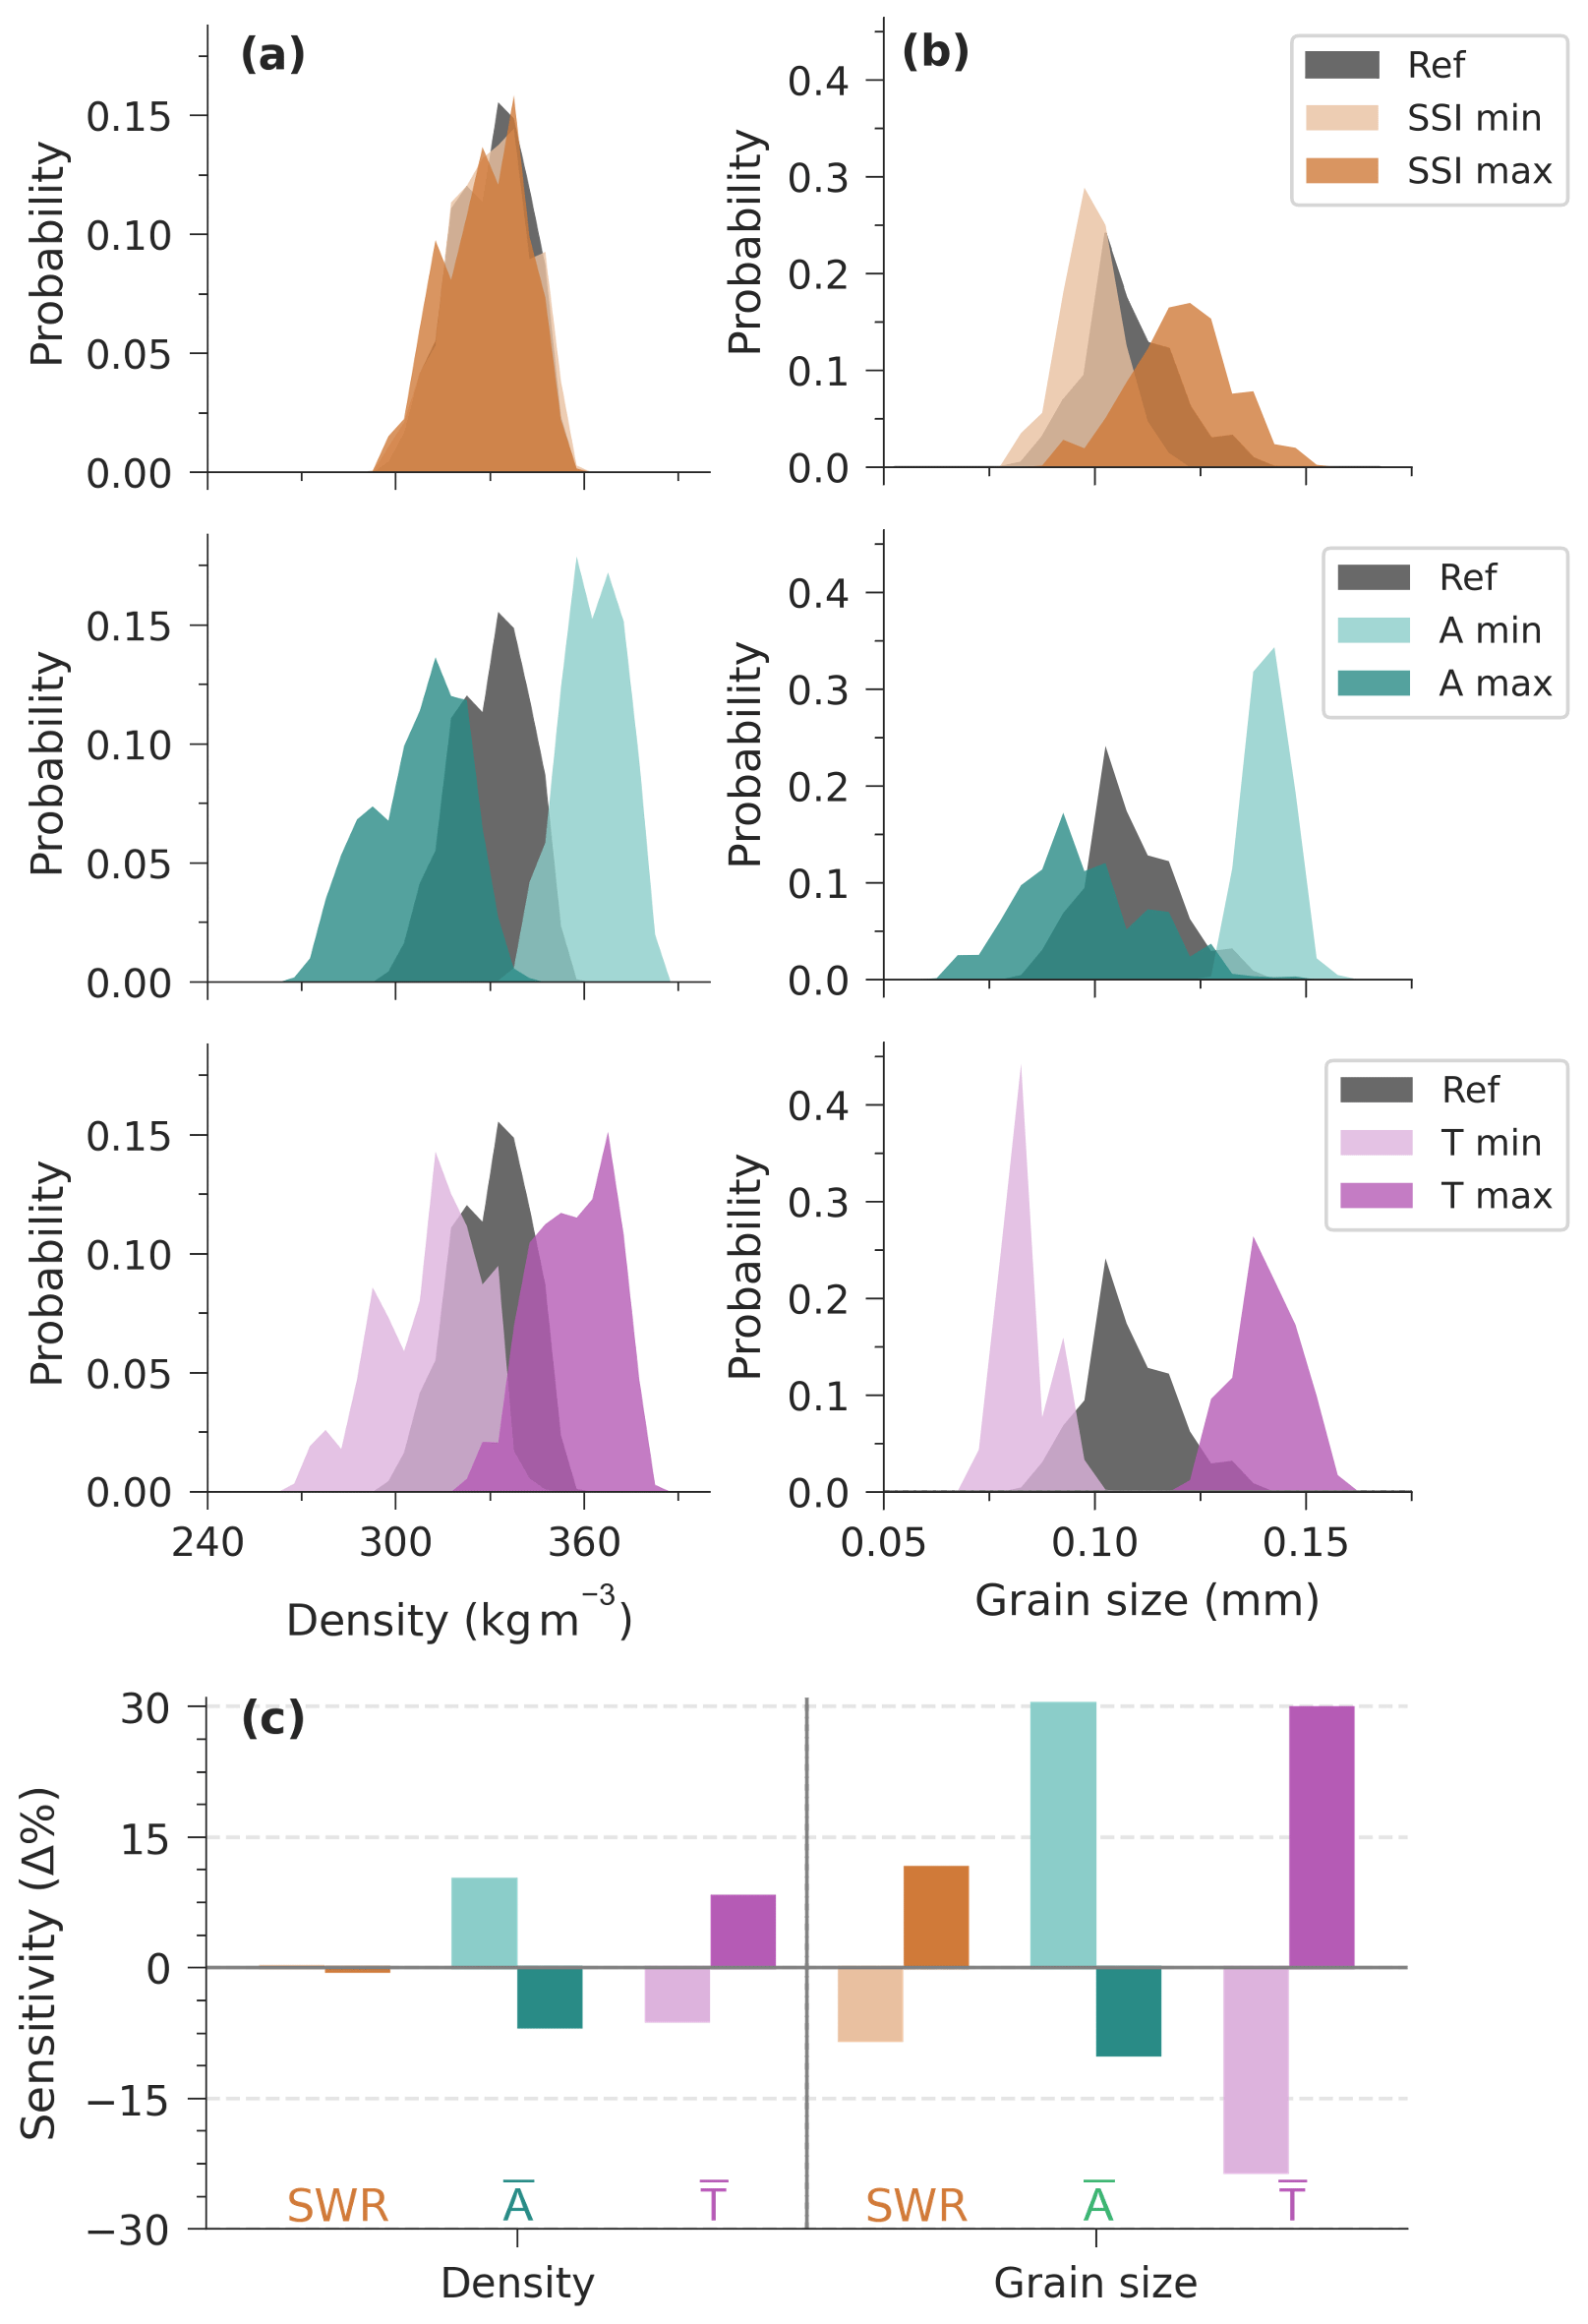
Figure 6Comparison of density and grain size (ropt) over the top 20 cm from Crocus sensitivity simulations. Distributions of (a) density and (b) grain size outputs from each test simulation are compared to the reference simulation (bin size is 5 kg m−3 and 0.005 mm). In panel (c), bars represent the percentage change in mean density and mean grain size for perturbations in SSI (orange), accumulation rate (green), and temperature (purple), with the decreased scenarios represented by the faded colour and the increased scenarios by the bold colour.
3.2.3 Bulk snowpack sensitivity
Numerous studies have suggested that modifications in near-surface density and grain size are key parameters influencing elemental fractionation during pore closure (e.g. Bender, 2002; Fujita et al., 2009). Figure 6 shows results from the sensitivity analysis, comparing differences in density and grain size between simulations outlined in Table 2. Overall, grain size is more sensitive to changes in surface forcing than density in the top 20 cm. Perturbations in SSI appear to have a minimal influence on density (<1 % change compared to the reference simulation): a 15 % decrease in SSI (SSI min) corresponds to an 8 % decrease in grain size, and an 11 % increase in SSI (SSI max) causes a 12 % increase in grain size. The magnitudes of change in both density and grain size are much larger under accumulation rate and temperature perturbations than under SSI perturbations.
Accumulation rate and temperature have opposite effects on density and grain size: a 4 °C increase in temperature (T max; 7 % increase) increases density and grain size by 8 % and 29 %, respectively, while increasing the accumulation rate to 4.1 cm yr−1 (A max; 46 % increase) results in a 7 % decrease in density and a 10 % decrease in grain size. Mean density and grain size respond non-linearly to perturbations in all forcing parameters, as is shown by the magnitude of the increase in grain size from decreased accumulation rate being 3 times greater than the magnitude of decrease induced by an increase in accumulation rate (right panel of Fig. 6c, green bars). This is in line with the dependence of to the logarithm of accumulation rate documented in Fig. 3.
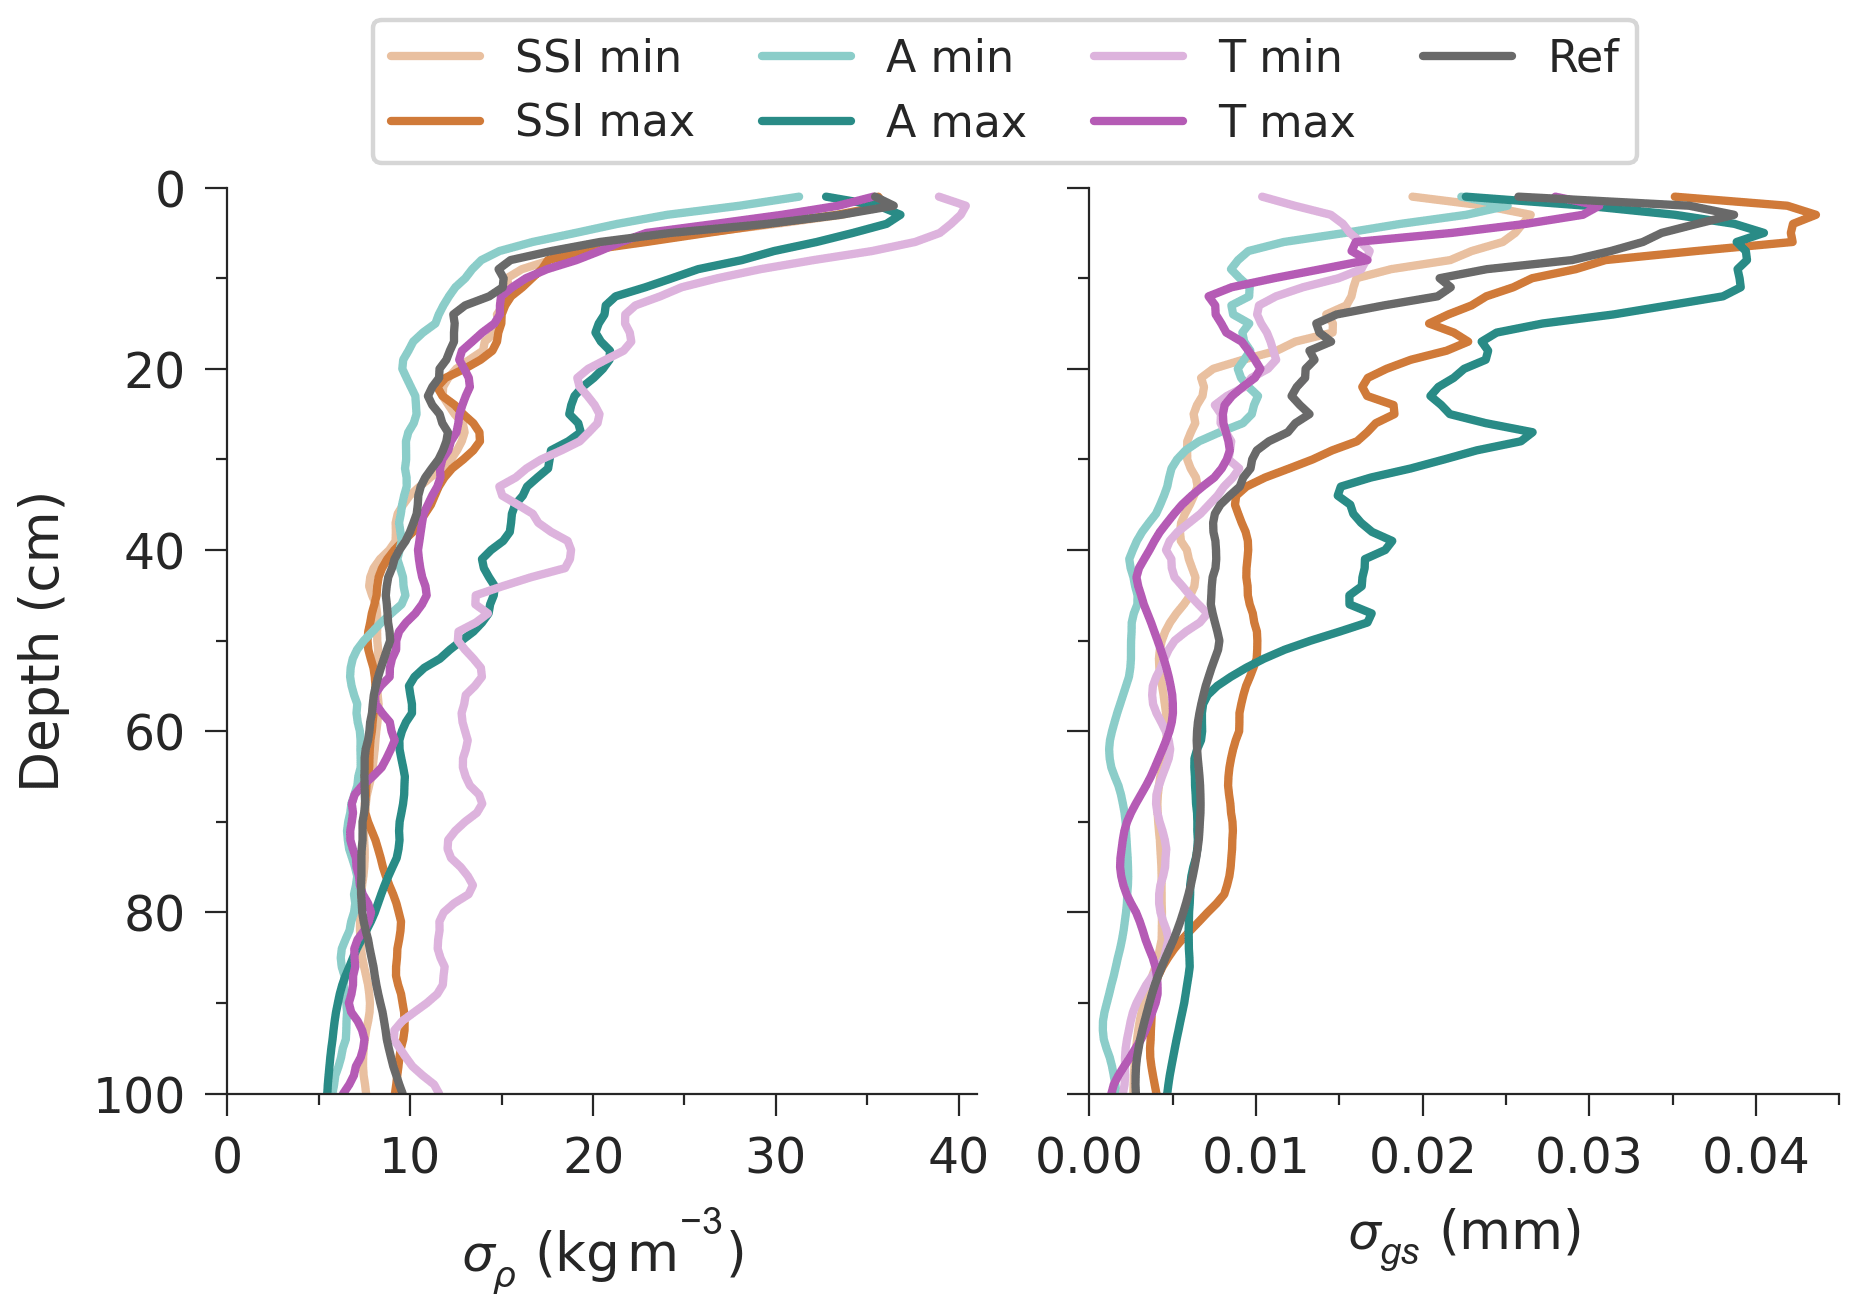
Figure 7Variability in density and grain size with depth over the top 1 m. Each pair of simulations is represented by a colour: SSI in orange, accumulation rate in green, and temperature in purple. The faded line of each pair represents the 800 kyr minimum simulation, and the bold line represents the 800 kyr maximum simulation.
3.2.4 Depth variability sensitivity
An alternative (although possibly complementary) explanation for the mechanistic control of snow properties on elemental fractionation links to stratigraphic layering due to seasonality (Fujita et al., 2009). Here we explore the influence of layering by looking at the depth variability in density and grain size as a qualitative measure of stratification (Hörhold et al., 2011), assuming that higher variability indicates stronger layering. Variability is defined as the standard deviation of each depth interval (denoted σ) over the period between 1 January 2010 and 1 December 2020.
The σ values for each simulation are presented in Fig. 7 for the top 1 m of snowpack. In all runs, σ peaks near the surface and decreases with depth for both density and grain size (σρ and σgs). Density variability for four out of the six test simulations is largely similar to the reference. High-accumulation rate (A max) and low-temperature (T min) are the exception, with an increase in σρ of up to 5 kg m−3 compared to all other runs. The spread in σgs between simulations is broader than for σρ over the top 50 cm, with T min, SSI min, A min, and T max all resulting in reduced variability compared to the reference run. The σgs values increase with an increase in SSI and accumulation rate throughout the top metre. At 100 cm, there is no significant difference in the σρ and σgs for the different forcing scenarios, which is discussed in Sect. 4.4.
To summarise, outputs from the Crocus model indicate that insolation modifies mean grain size but has negligible effect on mean density in the top 20 cm. On the other hand, higher air temperature and lower accumulation rate result in increases in both mean density and mean grain size, although this change is not necessarily proportional. The depth variability of the two snowpack parameters is strongly influenced by increased accumulation rate, with decreased temperature also having a large effect on density variability, and increased SSI causing an increase in grain size variability.
4.1 Evidence for non-SSI dependence of
The compilation of deep ice core records in Fig. 2 reinforces the widely documented anti-correlation between SSI and (e.g. Oyabu et al., 2022; Bouchet et al., 2023). However, a comparison of EDC, Dome F, and South Pole (Fig. 2) reveals an additional influence of site conditions which cannot be explained by SSI alone. Indeed, our compilation of records from 15 sites shows that mean is strongly correlated with accumulation rate and temperature (Fig. 3). While similar spatial and temporal slopes characterise the SSI dependence of , accumulation rate and temperature appear to be better predictors of site mean . However, a key distinction between the temporal and spatial variations in lies in the range of variations in the three forcing parameters. For example, spatial variations in accumulation rate are much larger than the variations at a single site through time (2–110 cm yr−1 compared to 1–4 cm yr−1 in the EDC core). Conversely, the spatial range of SSI values is between 500–560 W m−2, whereas the range at EDC, for instance, is between 470–600 W m−2.
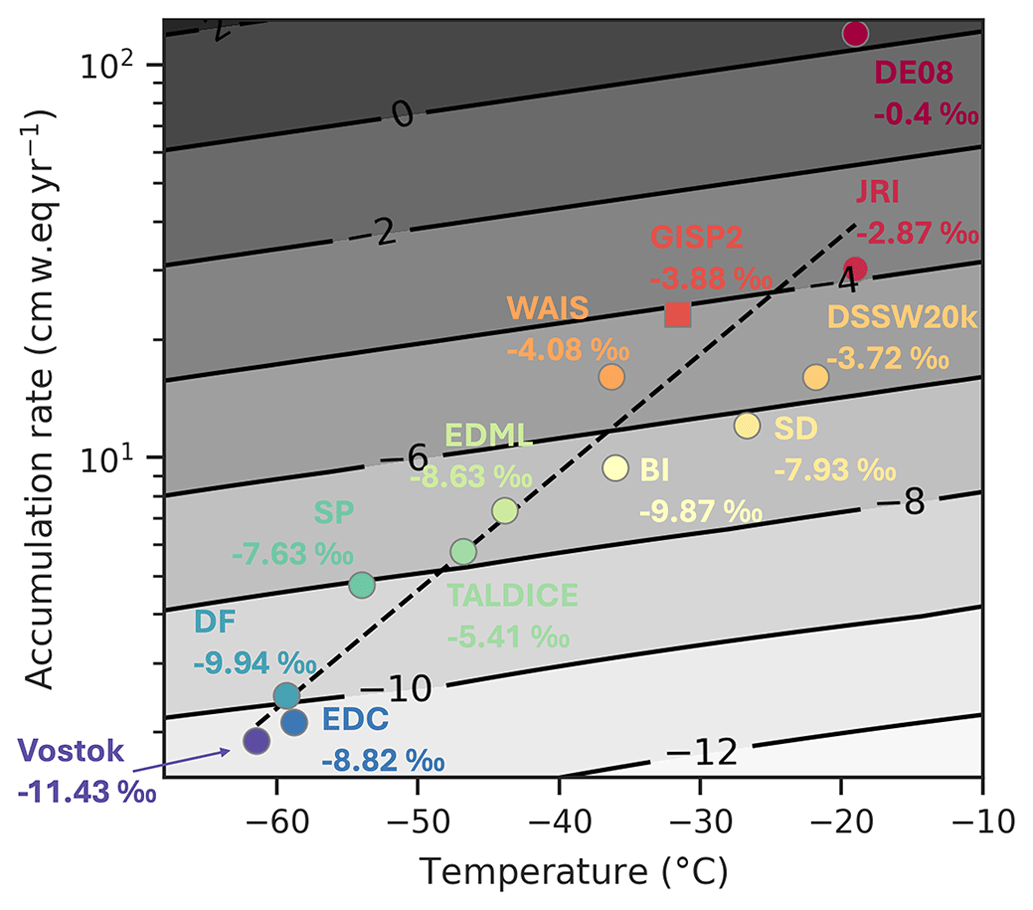
Figure 8 as a function of accumulation rate and temperature. Contours show the predicted values calculated using the multiple linear regression of accumulation rate (A) and temperature (T) (). Measured mean values are noted alongside each site. The accumulation rate vs. temperature regression (dashed, black line) is defined using a regression on temperature and accumulation rate for all sites in the data compilation ().
To further constrain the drivers of variability, we construct a multiple regression fit to parameterise mean as a function of accumulation rate and temperature (Fig. 8). Combined, accumulation rate and temperature can explain up to 80 % of the total variance in mean (r2=0.81, adjusted r2=0.766). Including SSI to the multiple linear regression further improves the adjusted r2 from 0.77 to 0.82. These results reiterate that is highly sensitive to accumulation rate, especially at low-accumulation sites. Although not explicitly explored, the site dependence of has been noted in previous studies. For example, Bazin et al. (2016) identified an offset in absolute values in the Vostok core compared to Dome F and EDC, similar to our observation in Fig. 2. By including records from numerous ice cores, we are able to definitively show that absolute values are systematically linked to site accumulation rate and temperature.
4.2 Millennial-scale variability in records
Further investigation into drivers of variability in the EDC core reveals a millennial-scale climate signal in the record. The timing of these anomalies in broadly corresponds to those in the δD record from EDC between 200–260 ka (Fig. 4), suggesting that millennial-scale variations can arise from changes in accumulation rate and/or temperature. The anomalies observed in the EDC record are not unique to this period but vary between time periods and sites (Sect. S2). Indeed, a similar effect was previously observed in the GISP2 core, where was found to be positively correlated with local temperature over millennial timescales (i.e. Dansgaard–Oeschger (D–O) events) (Suwa and Bender, 2008b).
Previous studies suggest an overlap between the drivers of variability and those of TAC variability (Fujita et al., 2009; Lipenkov et al., 2011). Ice core and TAC records exhibit slight differences in their spectral signals, whereby is dominated by precession (hence SSI pacing) and TAC is dominated by obliquity (hence the integrated summer insolation pacing). However, variability in both records is linked to local insolation via the modulation of near-surface snow properties, which ultimately influence pore closure processes (Lipenkov et al., 2011). Fujita et al. (2009) hypothesised that permeation, the process driving size-dependent fractionation of , can explain about half the variation in TAC, with the rest being driven by effusion (not believed to substantially influence ). We therefore draw on TAC studies to aid our interpretation of millennial-scale variability in .
Several mechanisms have been proposed to explain millennial-scale variability in TAC and , with apparent differences in the dominant mechanisms between hemispheres; TAC is anti-correlated with accumulation rate in the NGRIP core (Eicher et al., 2016) but positively correlated in the South Pole ice core (Epifanio et al., 2023). Eicher et al. (2016) attributed this anti-correlation between TAC and accumulation rate during D–O events at NGRIP, Greenland, to transient effects in the firn column. During the initial stage of a D–O event, rapid increases in accumulation rate increase overburden pressure, reducing the pore volume at close off and consequently decreasing TAC (Eicher et al., 2016). Similarly, Kobashi et al. (2015) suggested that rapid changes in overburden pressure could explain the negative correlation between (and thus ) and accumulation rate over multi-decadal timescales at GISP2 via its influence on the permeation rate of gases in the deep firn. In contrast, a positive correlation between TAC and accumulation rate at South Pole is attributed to increased snow burial rates, leading to smaller grains and therefore increased pore volume at close-off (Epifanio et al., 2023). Such a grain size mechanism is understood to drive the integrated summer insolation signal in TAC records (Raynaud et al., 2007) as well as the SSI signal in records (e.g. Bender, 2002).
Transient effects in the firn column in response to rapid climatic changes (linked to overburden pressure) are expected to be largely absent from Antarctic sites due to reduced magnitude in climate variability compared to Greenland. However, an accumulation-dependent grain size mechanism may explain the positive correlation between δD and at EDC. Epifanio et al. (2023) proposed that the contradictory behaviour of TAC between NGRIP and South Pole may be explained by varying responses of the firn to changes in accumulation rate, depending on the site's local climate conditions. They suggest that a grain size mechanism dominates TAC modulation at low-accumulation sites, while transient effects from rapid climatic changes are more important at warm, high-accumulation sites. We expect that the mechanisms driving are also modulated by accumulation rate. Indeed, observations of records from South Pole appear to support the in-phase coherence between and δD in the EDC core, but only when δD is sufficiently low (Fig. S4 in the Supplement). A shifted, anti-phase relationship is apparent when δD is higher, which suggests that different mechanisms may be dominant under high-accumulation conditions.
4.3 Towards a mechanistic understanding of variability at low-accumulation sites
Previous studies have demonstrated the link between climate and snow metamorphism, showing that snow metamorphism is enhanced during summers with very low accumulation rates (Picard et al., 2012; Casado et al., 2021). However, the connection to pore closure processes has received less attention. One possible reason for this gap is the added complexity which would be required to implement surface snow metamorphism into firn models, which necessitates prior information such as surface grain size. The following sections propose some ideas to bridge this gap by examining the influence of local climate parameters (accumulation rate and temperature) and SSI on near-surface snow metamorphism and how these might modulate elemental fractionation during pore closure.
4.3.1 Surface snow properties
Variations in grain properties are thought to drive the SSI signal in records (e.g. Bender, 2002; Fujita et al., 2009). Indeed, results from sensitivity tests in Fig. 6 show an increase in grain size under increased SSI, which is attributed to both stronger near-surface temperature gradients (Appendix B in Vionnet et al., 2012) and higher snow temperatures during summer (Fig. S4). Negligible change in simulated density under perturbations in SSI appears to support the hypothesis of a near-surface grain size mechanism (e.g. Bender, 2002), although this may be linked to the absence of vapour transport in the Crocus model. Increased snow metamorphism rate can also explain the increased grain size with increased temperature (Legagneux et al., 2003), while an increase in density results from increased compaction rates (Vionnet et al., 2012). The decrease in grain size with increased accumulation rate is the result of shorter residence time of a snow layer in the upper centimetres to metres of the snowpack, where temperature gradients are strongest (Picard et al., 2012).
It is widely accepted that permeation is the process by which small molecules escape during pore closure (e.g. Ikeda-Fukazawa et al., 2004; Huber et al., 2006; Severinghaus and Battle, 2006). Gregory et al. (2014) found that permeability is increased in high-density, large-grained firn due to a less complex pore structure. Indeed, Calonne et al. (2022) showed that grain size has a strong influence on permeability, such that for a given density permeability is increased with grain size. Our results show that high SSI and low accumulation rate are associated with larger grain size and lower . This observation supports the hypothesis that increased SSI (decreased accumulation rate) ultimately leads to lower due to the increased permeability associated with increased grain size (e.g. Severinghaus and Battle, 2006; Fujita et al., 2009), and suggests a similar mechanism may partially explain the accumulation rate dependence.
Identifying the mechanisms driving the accumulation rate dependence of is complicated by the fact that, at polar sites, accumulation rate tends to covary with temperature (Fig. 8). Thus, an increase in grain size with increased near-surface residence time (decreased accumulation rate) will be countered by reduced snow metamorphism rates with a decrease in temperature (Fig. 6). These counteracting effects were invoked by Kawamura et al. (2007) to explain the absence of a 100 kyr periodicity in records at Dome Fuji. However, a stronger correlation between and accumulation rate than temperature in Fig. 3 suggests a dominant role of accumulation. Therefore, we propose that a grain size mechanism controlling pore structure at close-off, like that of SSI, may explain the positive correlation between accumulation rate and in the EDC core (Fig. 3b).
Previous studies propose that firn column characteristics, such as delta-age, will also modulate via changes in accumulation rate and temperature (Severinghaus and Battle, 2006; Bazin et al., 2016). One mechanism links to the time for pores to close off. At low-accumulation sites, pores will take longer to fully close; thus, they experience more elemental fractionation (Severinghaus and Battle, 2006). Additional hypotheses point to LIZ thickness and pore space geometry (or tortuosity) (e.g. Fujita et al., 2009). Low-accumulation sites tend to have thinner LIZs (e.g. Landais et al., 2006; Witrant et al., 2012) and less tortuous pore structure in deep firn associated with large, rounded grains (Gregory et al., 2014). Such characteristics are associated with increased gas diffusivity that would facilitate the removal of O2-enriched gas back to the atmosphere. In contrast, at high-accumulation sites, the associated decrease in gas diffusivity in the LIZ would lead to a build up of a stagnant air enriched in O2, resulting in the trapping of gas with relatively high . Alternatively, Hutterli et al. (2009) proposed that varying near-surface temperature gradients under different SSI intensities modulates anisotropy of the snow, leading to vertically elongated pores (as was confirmed by Leinss et al., 2020) under high SSI (low-accumulation) conditions. They argue that elongated pores facilitate vertical diffusivity in the LIZ, leading to greater fractionation of (Hutterli et al., 2009), an alternative but complementary mechanism to LIZ thickness. A simplified and non-exhaustive illustration of these various interactions can be found in Fig. S6.
The aforementioned mechanisms relating to firn column characteristics indicate a positive correlation between and accumulation rate. This is consistent with Fig. 3b but cannot be directly supported by our sensitivity results. Based on the sensitivity tests in Fig. 6, a link to surface density is not clear. We expect that the role of density in modulating derives from the grain size dependence of densification rates invoked by Freitag et al. (2004), providing an additional link between near-surface grain size and , as is outlined in the following section.
4.3.2 Depth-dependent variability as a proxy for layering
Density stratification in deep firn has also been invoked to modulate (Fujita et al., 2009). Results from the Crocus model are tentatively used to infer the sensitivity of near-surface density and grain size variability to perturbations in input forcing parameters. Figure 7 shows that grain size variability is increased with an increase in both SSI and accumulation rate. For SSI, this is expected given the enhanced snow metamorphism during summer due to higher snow temperatures, while winter conditions are largely unchanged (Fig. S5). Decreased grain size variability in both the increased and decreased temperature simulations is likely linked to the way in which temperature forcing is perturbed. By applying a constant increase in air temperature, the strength of metamorphism is increased during winter due to higher temperatures (Legagneux et al., 2003; Flanner and Zender, 2006) but largely unchanged during summer due to the dominant influence of insolation on summer snow temperature (Fig. S5), resulting in homogeneity within the snowpack.
Linking variability near the surface with variability in deep firn is not trivial. Indeed, a study by Hörhold et al. (2011) used a compilation of firn cores from numerous polar sites to show that density variability in deep firn is positively correlated with local accumulation rate and temperature but anti-correlated with near-surface density variability. However, this anti-correlation was not observed by Inoue et al. (2024) when comparing firn cores in the Dome Fuji area. Additional consideration, both from data and modelling approaches, is required for density inversions in the firn column – whereby relatively low-density layers in the upper part of the firn become relatively high-density layers below the density inversion depth, due to preferential deformation in the upper firn (Freitag et al., 2004; Fujita et al., 2009). Freitag et al. (2004) proposed that the inversion is largely driven by grain size, such that initially low-density layers associated with large grain size become relatively high-density layers with large grain size below the density inversion. This has since been supported by Gregory et al. (2014), who further show that near-surface grain size determines the density at which pores close off. They show that large-grained, high-density layers are more permeable and, hence, close off deeper than fine-grained, low-density layers. In addition, Hörhold et al. (2012) suggested that stratification at depth is influenced by impurity content, with impurity-rich layers being more susceptible to densification. Given the array of factors proposed to influence deep firn density variability, we focus on the role of grain size variability.
No inversion is observed for grain size variability. Deep firn layers retain evidence of near-surface grain size, which is determined by snow metamorphism and accumulation rate (Gregory et al., 2014), as mentioned previously. While our sensitivity tests are constrained to the near surface, we draw on previous studies to suggest potential links with deep firn properties and fractionation. Given the presence of a density inversion at Dome C (Hörhold et al., 2011), we may expect that relatively increased variability in near-surface grain size from our sensitivity tests would translate to increased grain size and density variability in the deep firn. As such, increased grain size variability in our SSI max simulation (Fig. 7) supports the conclusions of Fujita et al. (2009), that elemental fractionation is enhanced under high-SSI conditions due partially to layering.
The link to accumulation rate is less clear. As for SSI, we observe an increase in grain size variability with increased accumulation rate. However, according to the layering hypothesis, this should result in more fractionation at close off, which contradicts our observations of a positive correlation between and accumulation rate (Fig. 3b). Instead, our observations suggest that a decrease in mean grain size with increased accumulation rate is dominant over the layering effect. Future work would benefit from an inter-site comparison of deep firn properties alongside gas measurements in order to disentangle these effects.
Extracting concrete conclusions from our variability analysis and extrapolating these into the deep firn is inhibited by both the ascribed forcing perturbations and the aggregation scheme of the model, which is particularly sensitive to changes in accumulation rate. We thus conclude that the simulations performed with the Crocus model can support a mechanism linked to average grain size on but not a mechanism implying density or grain size variability. However, our conclusion does not rule out the effect of layering or grain size variability on variability but highlights a limitation in our study, as explained in the next section.
4.4 Limitations and perspectives
A number of limitations have been mentioned throughout our study and warrant some further discussion. As mentioned in Sect. 4.3.2, our study is unable to fully consider the sensitivity of layering to perturbations in forcing parameters. Firstly, near-surface density and grain size variability are not fully captured by the model which can be partially attributed to the absence of snow transport by the wind in the standard version of Crocus (Libois et al., 2014). While wind is known to strongly influence snow properties (e.g. Inoue et al., 2024), we are limited in our understanding of winds throughout the past 800 kyr; therefore, wind effects are not considered in our study. Secondly, the aggregation of layers with depth in Crocus make it difficult to focus on both the fine-layered near-surface snow and the propagation of stratified layers into the deep firn. Accurate assessment of the layering effect would require a new dedicated snow model preserving individual snow layers and properties over a wide depth range, from the surface to LIZ, and at high resolution.
While the single-parameter sensitivity tests presented here provide useful insights for understanding physical mechanisms, they do not account for complex compound effects associated with the covariance of accumulation rate and temperature at polar sites. Additional tests perturbing both accumulation rate and temperature simultaneously indicate that snowpack properties are very sensitive to the ascribed accumulation rate and temperature values, i.e. for glacial temperature reconstructions which are debated to have been overestimated by as much as 5 °C at Dome C (Buizert et al., 2021). Moreover, the additive effects from the single-parameter sensitivity tests for accumulation rate and temperature do not equal the effects of multi-parameter sensitivity simulations (i.e. perturbing both accumulation rate and temperature). This discrepancy highlights the complex interactions between quasi-covarying accumulation rate and temperature on snow properties. Indeed, a cancellation of the accumulation rate and temperature effects was invoked by Kawamura et al. (2007) to explain the absence of a 100 kyr periodicity in at Dome Fuji. Given the uncertainties in climate reconstructions and the limitations of the model, we refrained from using multi-parameter simulations for interpretation of empirical results. Future studies would benefit from obtaining measurements in open and closed porosity at sites with distinct characteristics to better constrain the physical mechanisms.
Finally, given that the high-resolution records tend to be from Antarctic sites (e.g. Fig. 2), our study is slightly biased towards low-accumulation conditions. Indeed, initial temporal analysis of variability at South Pole suggests that different mechanisms may be dominant at relatively high-accumulation sites, as has been previously suggested (Suwa and Bender, 2008b; Kobashi et al., 2015), but this was outside the scope of this study. Future studies focusing on the dominance of different mechanisms under different site conditions would therefore benefit from obtaining high-resolution measurements from sites with distinct characteristics. Furthermore, a comparison of deep firn properties alongside measurements from the open and closed porosity would aid a mechanistic understanding.
We present a compilation of records measured on multiple ice cores from Antarctica and Greenland to develop a mechanistic understanding of variability. Analysis of both temporal (single-site) and spatial (multi-site) variability in presents new evidence of a dependence on local climate (accumulation rate and temperature), in addition to the well-documented SSI dependence. High-resolution measurements from the EDC ice core reveal millennial-scale variability in in phase with δD records when both parameters are plotted on the AICC2023 ice-age scale. The inter-site analysis showed an increase in mean for sites with higher accumulation rate and temperature, which is analogous with the temporal analysis from EDC, showing to increase together with δD.
We suggest that a mechanism relating to firn physical properties can partially explain both the influence of SSI and local climate on variability. Sensitivity tests using the Crocus model show that grain size is very responsive to perturbations in SSI, accumulation rate, and air temperature, while density responds to all but SSI perturbations. Our findings support the hypothesis that a grain size mechanism is a dominant driver of elemental fractionation at low-accumulation sites, such that increased grain size for a given density facilitates O2 expulsion via enhanced permeability. Furthermore, our results support the hypothesis that the presence, or lack thereof, of a local climatic signal in variability is due to the delicate balance between the counter-effects of accumulation rate and temperature on grain properties. However, the inter-site results suggest that low-accumulation, low-temperature sites experience stronger elemental fractionation, having a comparable effect to high insolation.
While our findings from the data compilation are supported by the Crocus sensitivity tests, we acknowledge that additional mechanisms are at play. In particular, the influence of deep firn layering – itself linked to surface snow metamorphism – could not be tested fully in this study but is believed to play a major role in modulating . Determining the relative influence of stratification, firn physical properties, and residence time in the lock-in zone using a combination of firn models and observations would be useful for future studies.
The Crocus model is open source, and the code is available via its GitHub repository (https://github.com/UMR-CNRM/snowtools, last access: 2 July 2022, Vionnet et al., 2012). Registration and user procedure is found at https://opensource.umr-cnrm.fr/projects/snowtools_git/wiki/Procedure_for_new_users (last access: 1 January 2022). The version used is labelled as Surfex V8_1.
Published accumulation rate and temperature reconstructions used for the data compilation are accessible at https://doi.org/10.5281/zenodo.12571888 (Harris Stuart, 2024). All published and unpublished datasets measured at LSCE are also available at this link.
The supplement related to this article is available online at: https://doi.org/10.5194/tc-18-3741-2024-supplement.
AL, EC, and FP performed measurements or produced the unpublished datasets measured at LSCE on ice provided by RM and BS. CB and JS provided unpublished datasets measured at Scripps. Snow temperature data from Dome C were acquired and shared by LA and GP. RHS ran the Crocus simulations, with the support of MD and QL. RHS and AL prepared the manuscript with contributions from all co-authors.
At least one of the (co-)authors is a member of the editorial board of The Cryosphere. The peer-review process was guided by an independent editor, and the authors also have no other competing interests to declare.
Publisher's note: Copernicus Publications remains neutral with regard to jurisdictional claims made in the text, published maps, institutional affiliations, or any other geographical representation in this paper. While Copernicus Publications makes every effort to include appropriate place names, the final responsibility lies with the authors.
This publication was generated in the frame of the DEEPICE project. In addition to the financial support from the Horizon 2020 research and innovation programme (grant nos. 955750 and 817493), we acknowledge the logistics involved in the cutting and transportation of BI, FP, JRI, and SIR ice samples between LSCE and BAS. We also thank the projects EPICA, GISP2, NEEM, and TALDICE. Emilie Capron acknowledges the support from the French National Research Agency under the Programme d'Investissements d'Avenir (ANR-19-MPGA-0001). Marie Dumont has received funding from the European Research Council (ERC) under the European Union's Horizon 2020 research and innovation programme (IVORI, grant no. 949516). We also thank Matthieu Fructus for providing his expertise and support in the Crocus model.
This research has been supported by the EU Horizon 2020 research and innovation programme (grant nos. 955750 and 817493).
This paper was edited by Michiel van den Broeke and reviewed by Jochen Schmitt and one anonymous referee.
Albert, M., Shuman, C., Courville, Z., Bauer, R., Fahnestock, M., and Scambos, T.: Extreme firn metamorphism: impact of decades of vapor transport on near-surface firn at a low-accumulation glazed site on the East Antarctic plateau, Ann. Glaciol., 39, 73–78, https://doi.org/10.3189/172756404781814041, 2004. a
Alley, R. B. and Koci, B. R.: Ice-core analysis at site A, Greenland: preliminary results, Ann. Glaciol., 10, 1–4, https://doi.org/10.3189/S0260305500004067, 1988. a
Alley, R. B., Meese, D. A., Shuman, C. A., Gow, A. J., Taylor, K. C., Grootes, P. M., White, J. W. C., Ram, M., Waddington, E. D., Mayewski, P. A., and Zielinski, G. A.: Abrupt increase in Greenland snow accumulation at the end of the Younger Dryas event, Nature, 362, 527–529, https://doi.org/10.1038/362527a0, 1993. a
Battle, M., Bender, M., Sowers, T., Tans, P., Butler, J., Elkins, J., Ellis, J., Conway, T., Zhang, N., Lang, P., and Clarket, A. D.: Atmospheric gas concentrations over the past century measured in air from firn at the South Pole, Nature, 383, 231–235, https://doi.org/10.1038/383231a0, 1996. a
Battle, M. O., Severinghaus, J. P., Sofen, E. D., Plotkin, D., Orsi, A. J., Aydin, M., Montzka, S. A., Sowers, T., and Tans, P. P.: Controls on the movement and composition of firn air at the West Antarctic Ice Sheet Divide, Atmos. Chem. Phys., 11, 11007–11021, https://doi.org/10.5194/acp-11-11007-2011, 2011. a
Bazin, L., Landais, A., Lemieux-Dudon, B., Toyé Mahamadou Kele, H., Veres, D., Parrenin, F., Martinerie, P., Ritz, C., Capron, E., Lipenkov, V., Loutre, M.-F., Raynaud, D., Vinther, B., Svensson, A., Rasmussen, S. O., Severi, M., Blunier, T., Leuenberger, M., Fischer, H., Masson-Delmotte, V., Chappellaz, J., and Wolff, E.: An optimized multi-proxy, multi-site Antarctic ice and gas orbital chronology (AICC2012): 120–800 ka, Clim. Past, 9, 1715–1731, https://doi.org/10.5194/cp-9-1715-2013, 2013. a, b, c, d, e, f
Bazin, L., Landais, A., Capron, E., Masson-Delmotte, V., Ritz, C., Picard, G., Jouzel, J., Dumont, M., Leuenberger, M., and Prié, F.: Phase relationships between orbital forcing and the composition of air trapped in Antarctic ice cores, Clim. Past, 12, 729–748, https://doi.org/10.5194/cp-12-729-2016, 2016. a, b, c, d
Bender, M., Sowers, T., and Lipenkov, V.: On the concentrations of O2, N2, and Ar in trapped gases from ice cores, J. Geophys. Res.-Atmos., 100, 18651–18660, https://doi.org/10.1029/94JD02212, 1995. a
Bender, M. L.: Orbital tuning chronology for the Vostok climate record supported by trapped gas composition, Earth Planet. Sc. Lett., 204, 275–289, https://doi.org/10.1016/S0012-821X(02)00980-9, 2002. a, b, c, d, e, f, g, h, i, j
Bender, M. L., Tans, P. P., Ellis, J., Orchardo, J., and Habfast, K.: A high precision isotope ratio mass spectrometry method for measuring the ratio of air, Geochim. Cosmochim. Ac., 58, 4751–4758, https://doi.org/10.1016/0016-7037(94)90205-4, 1994. a, b
Bertler, N. A. N., Conway, H., Dahl-Jensen, D., Emanuelsson, D. B., Winstrup, M., Vallelonga, P. T., Lee, J. E., Brook, E. J., Severinghaus, J. P., Fudge, T. J., Keller, E. D., Baisden, W. T., Hindmarsh, R. C. A., Neff, P. D., Blunier, T., Edwards, R., Mayewski, P. A., Kipfstuhl, S., Buizert, C., Canessa, S., Dadic, R., Kjær, H. A., Kurbatov, A., Zhang, D., Waddington, E. D., Baccolo, G., Beers, T., Brightley, H. J., Carter, L., Clemens-Sewall, D., Ciobanu, V. G., Delmonte, B., Eling, L., Ellis, A., Ganesh, S., Golledge, N. R., Haines, S., Handley, M., Hawley, R. L., Hogan, C. M., Johnson, K. M., Korotkikh, E., Lowry, D. P., Mandeno, D., McKay, R. M., Menking, J. A., Naish, T. R., Noerling, C., Ollive, A., Orsi, A., Proemse, B. C., Pyne, A. R., Pyne, R. L., Renwick, J., Scherer, R. P., Semper, S., Simonsen, M., Sneed, S. B., Steig, E. J., Tuohy, A., Venugopal, A. U., Valero-Delgado, F., Venkatesh, J., Wang, F., Wang, S., Winski, D. A., Winton, V. H. L., Whiteford, A., Xiao, C., Yang, J., and Zhang, X.: The Ross Sea Dipole – temperature, snow accumulation and sea ice variability in the Ross Sea region, Antarctica, over the past 2700 years, Clim. Past, 14, 193–214, https://doi.org/10.5194/cp-14-193-2018, 2018. a
Bouchet, M., Landais, A., Grisart, A., Parrenin, F., Prié, F., Jacob, R., Fourré, E., Capron, E., Raynaud, D., Lipenkov, V. Y., Loutre, M.-F., Extier, T., Svensson, A., Legrain, E., Martinerie, P., Leuenberger, M., Jiang, W., Ritterbusch, F., Lu, Z.-T., and Yang, G.-M.: The Antarctic Ice Core Chronology 2023 (AICC2023) chronological framework and associated timescale for the European Project for Ice Coring in Antarctica (EPICA) Dome C ice core, Clim. Past, 19, 2257–2286, https://doi.org/10.5194/cp-19-2257-2023, 2023. a, b, c, d, e, f, g, h, i, j
Bouchet, M., Landais, A., Grisart, A., Parrenin, F., Prié, F., Jacob, R., Fourré, E., Capron, E., Raynaud, D., Lipenkov, V. Y., Loutre, M.-F., Extier, T., Svensson, A. M., Martinerie, P., Leuenberger, M. C., Jiang, W., Ritterbusch, F., Lu, Z.-T., and Yang, G.-M.: AICC2023, VOSTOK, PANGAEA [data set], https://doi.org/10.1594/PANGAEA.961022, 2023. a
Buiron, D., Chappellaz, J., Stenni, B., Frezzotti, M., Baumgartner, M., Capron, E., Landais, A., Lemieux-Dudon, B., Masson-Delmotte, V., Montagnat, M., Parrenin, F., and Schilt, A.: TALDICE-1 age scale of the Talos Dome deep ice core, East Antarctica, Clim. Past, 7, 1–16, https://doi.org/10.5194/cp-7-1-2011, 2011. a
Buizert, C.: The Ice Core Gas Age-Ice Age Difference as a Proxy for Surface Temperature, Geophys. Res. Lett., 48, e2021GL094241, https://doi.org/10.1029/2021GL094241, 2021. a
Buizert, C. and Severinghaus, J. P.: Dispersion in deep polar firn driven by synoptic-scale surface pressure variability, The Cryosphere, 10, 2099–2111, https://doi.org/10.5194/tc-10-2099-2016, 2016. a
Buizert, C., Martinerie, P., Petrenko, V. V., Severinghaus, J. P., Trudinger, C. M., Witrant, E., Rosen, J. L., Orsi, A. J., Rubino, M., Etheridge, D. M., Steele, L. P., Hogan, C., Laube, J. C., Sturges, W. T., Levchenko, V. A., Smith, A. M., Levin, I., Conway, T. J., Dlugokencky, E. J., Lang, P. M., Kawamura, K., Jenk, T. M., White, J. W. C., Sowers, T., Schwander, J., and Blunier, T.: Gas transport in firn: multiple-tracer characterisation and model intercomparison for NEEM, Northern Greenland, Atmos. Chem. Phys., 12, 4259–4277, https://doi.org/10.5194/acp-12-4259-2012, 2012. a
Buizert, C., Baggenstos, D., Bereiter, B., Bertler, N., Brook, E. J., and Etheridge, D.: Multi-site ice core Krypton stable isotope ratios, U.S. Antarctic Program (USAP) Data Center [data set], https://doi.org/10.15784/601394, 2020. a, b
Buizert, C., Fudge, T., Roberts, W. H., Steig, E. J., Sherriff-Tadano, S., Ritz, C., Lefebvre, E., Edwards, J., Kawamura, K., Oyabu, I., Motoyama, H., Kahle, E., Jones, T., Abe-Ouchi, A., Obase, T., Martin, C., Corr, H., Severinghaus, J., Beaudette, R., Epifanio, J., Brook, E., Martin, K., Chappellaz, J., Aoki, S., Nakazawa, T., Sowers, T., Alley, R. B., Ahn, J., Sigl, M., Severi, M., Dunbar, N. W., Svensson, A., Fegyveresi, J. M., He, C., Liu, Z., Zhu, J., Otto-Bliesner, B. L., Lipenkov, V. Y., Kageyama, M., and Schwander, J.: Antarctic surface temperature and elevation during the Last Glacial Maximum, Science, 372, 1097–1101, https://doi.org/10.1126/science.abd2897, 2021. a, b
Buizert, C., Shackleton, S., Severinghaus, J. P., Roberts, W. H. G., Seltzer, A., Bereiter, B., Kawamura, K., Baggenstos, D., Orsi, A. J., Oyabu, I., Birner, B., Morgan, J. D., Brook, E. J., Etheridge, D. M., Thornton, D., Bertler, N., Pyne, R. L., Mulvaney, R., Mosley-Thompson, E., Neff, P. D., and Petrenko, V. V.: The new Kr-86 excess ice core proxy for synoptic activity: West Antarctic storminess possibly linked to Intertropical Convergence Zone (ITCZ) movement through the last deglaciation, Clim. Past, 19, 579–606, https://doi.org/10.5194/cp-19-579-2023, 2023. a
Calonne, N., Burr, A., Philip, A., Flin, F., and Geindreau, C.: Effective coefficient of diffusion and permeability of firn at Dome C and Lock In, Antarctica, and of various snow types – estimates over the 100–850 kg m−3 density range, The Cryosphere, 16, 967–980, https://doi.org/10.5194/tc-16-967-2022, 2022. a
Capron, E., Landais, A., Buiron, D., Cauquoin, A., Chappellaz, J., Debret, M., Jouzel, J., Leuenberger, M., Martinerie, P., Masson-Delmotte, V., Mulvaney, R., Parrenin, F., and Prié, F.: Glacial–interglacial dynamics of Antarctic firn columns: comparison between simulations and ice core air-δ15N measurements, Clim. Past, 9, 983–999, https://doi.org/10.5194/cp-9-983-2013, 2013. a, b, c, d, e, f, g
Carmagnola, C. M., Morin, S., Lafaysse, M., Domine, F., Lesaffre, B., Lejeune, Y., Picard, G., and Arnaud, L.: Implementation and evaluation of prognostic representations of the optical diameter of snow in the SURFEX/ISBA-Crocus detailed snowpack model, The Cryosphere, 8, 417–437, https://doi.org/10.5194/tc-8-417-2014, 2014. a
Casado, M., Landais, A., Picard, G., Arnaud, L., Dreossi, G., Stenni, B., and Prié, F.: Water Isotopic Signature of Surface Snow Metamorphism in Antarctica, Geophys. Res. Lett., 48, e2021GL093382, https://doi.org/10.1029/2021GL093382, 2021. a, b
Champollion, N., Picard, G., Arnaud, L., Lefebvre, É., Macelloni, G., Rémy, F., and Fily, M.: Marked decrease in the near-surface snow density retrieved by AMSR-E satellite at Dome C, Antarctica, between 2002 and 2011, The Cryosphere, 13, 1215–1232, https://doi.org/10.5194/tc-13-1215-2019, 2019. a
Clow, G. D.: GISP2-D Temperature, PANGAEA [data set], https://doi.org/10.1594/PANGAEA.55517, 1999. a
Crotti, I., Landais, A., Stenni, B., Bazin, L., Parrenin, F., Frezzotti, M., Ritterbusch, F., Lu, Z.-T., Jiang, W., Yang, G.-M., Fourré, E., Orsi, A., Jacob, R., Minster, B., Prié, F., Dreossi, G., and Barbante, C.: An extension of the TALDICE ice core age scale reaching back to MIS 10.1, Quaternary Sci. Rev., 266, 107078, https://doi.org/10.1016/j.quascirev.2021.107078, 2021. a, b, c
Cuffey, K. M. and Clow, G. D.: GISP2 accumulation rate history, PANGAEA [data set], https://doi.org/10.1594/PANGAEA.56075, 1999. a
Cuffey, K. M. and Paterson, W. S. B. (Eds.): The physics of glaciers, Academic Press, ISBN 9780080919126, 2010. a, b
Domine, F., Salvatori, R., Legagneux, L., Salzano, R., Fily, M., and Casacchia, R.: Correlation between the specific surface area and the short wave infrared (SWIR) reflectance of snow, Cold Reg. Sci. Technol., 46, 60–68, https://doi.org/10.1016/j.coldregions.2006.06.002, 2006. a
Eicher, O., Baumgartner, M., Schilt, A., Schmitt, J., Schwander, J., Stocker, T. F., and Fischer, H.: Climatic and insolation control on the high-resolution total air content in the NGRIP ice core, Clim. Past, 12, 1979–1993, https://doi.org/10.5194/cp-12-1979-2016, 2016. a, b, c, d
EPICA community members: Eight glacial cycles from an Antarctic ice core, Nature, 429, 623–628, https://doi.org/10.1038/nature02599, 2004. a
EPICA community members: One-to-one coupling of glacial climate variability in Greenland and Antarctica, Nature, 444, 195–198, https://doi.org/10.1038/nature05301, 2006. a
Epifanio, J. A., Brook, E. J., Buizert, C., Pettit, E. C., Edwards, J. S., Fegyveresi, J. M., Sowers, T. A., Severinghaus, J. P., and Kahle, E. C.: Millennial and orbital-scale variability in a 54 000-year record of total air content from the South Pole ice core, The Cryosphere, 17, 4837–4851, https://doi.org/10.5194/tc-17-4837-2023, 2023. a, b, c
Etheridge, D. and Wookey, C.: Ice core drilling at a high accumulation area of Law Dome, Antarctica, 1987, in: Ice Core Drilling, Proceedings of the Third International Workshop on Ice Core Drilling Technology, Grenoble, France, 86–96, 1988. a, b
Etheridge, D. M., Steele, L., Langenfelds, R. L., Francey, R. J., Barnola, J.-M., and Morgan, V.: Natural and anthropogenic changes in atmospheric CO2 over the last 1000 years from air in Antarctic ice and firn, J. Geophys. Res.-Atmos., 101, 4115–4128, https://doi.org/10.1029/95JD03410, 1996. a, b
Extier, T., Landais, A., Bréant, C., Prié, F., Bazin, L., Dreyfus, G., Roche, D. M., and Leuenberger, M.: On the use of δ18Oatm for ice core dating, Quaternary Sci. Rev., 185, 244–257, https://doi.org/10.1016/j.quascirev.2018.02.008, 2018. a
Fegyveresi, J. M., Alley, R., Spencer, M., Fitzpatrick, J., Steig, E., White, J., McConnell, J., and Taylor, K.: Late-Holocene climate evolution at the WAIS Divide site, West Antarctica: bubble number-density estimates, J. Glaciol., 57, 629–638, https://doi.org/10.3189/002214311797409677, 2011. a
Fitzpatrick, J. J., Voigt, D. E., Fegyveresi, J. M., Stevens, N. T., Spencer, M. K., Cole-Dai, J., Alley, R. B., Jardine, G. E., Cravens, E. D., Wilen, L. A., Fudge, T. J., and McConnell, J. R.: Physical properties of the WAIS Divide ice core, J. Glaciol., 60, 1181–1198, https://doi.org/10.3189/2014JoG14J100, 2014. a
Flanner, M. G. and Zender, C. S.: Linking snowpack microphysics and albedo evolution, J. Geophys. Res.-Atmos., 111, D12208, https://doi.org/10.1029/2005JD006834, 2006. a, b
Freitag, J., Wilhelms, F., and Kipfstuhl, S.: Microstructure-dependent densification of polar firn derived from X-ray microtomography, J. Glaciol., 50, 243–250, https://doi.org/10.3189/172756504781830123, 2004. a, b, c
Frezzotti, M., Pourchet, M., Flora, O., Gandolfi, S., Gay, M., Urbini, S., Vincent, C., Becagli, S., Gragnani, R., Proposito, M., Severi, M., Traversi, R., Udisti, R., and Fily, M.: New estimations of precipitation and surface sublimation in East Antarctica from snow accumulation measurements, Clim. Dynam., 23, 803–813, https://doi.org/10.1007/s00382-004-0462-5, 2004. a
Fudge, T. J., Buizert, C., Conway, H., and Waddington, E. D.: Accumulation Rates from the WAIS Divide Ice Core, U.S. Antarctic Program (USAP) Data Center [data set], https://doi.org/10.15784/601004, 2017. a
Fujita, S., Kawada, K., and Fujii, Y.: Glaciological Data Collected by the 37th Japanese Antarctic Research Expedition during 1996–1997, JARE data reports, 27, 1–46, https://doi.org/10.15094/00004965, 1998. a
Fujita, S., Okuyama, J., Hori, A., and Hondoh, T.: Metamorphism of stratified firn at Dome Fuji, Antarctica: A mechanism for local insolation modulation of gas transport conditions during bubble close off, J. Geophys. Res.-Earth Surf., 114, F03023, https://doi.org/10.1029/2008JF001143, 2009. a, b, c, d, e, f, g, h, i, j, k, l, m, n
Gallet, J.-C., Domine, F., and Dumont, M.: Measuring the specific surface area of wet snow using 1310 nm reflectance, The Cryosphere, 8, 1139–1148, https://doi.org/10.5194/tc-8-1139-2014, 2014. a
Gkinis, V., Vinther, B. M., Popp, T. J., Quistgaard, T., Faber, A.-K., Holme, C. T., Jensen, C.-M., Lanzky, M., Lütt, A.-M., Mandrakis, V.,Ørum, N.-O., Pedersen, A.-S., Vaxevani, N., Weng, Y., Capron, E., Dahl-Jensen, D., Hörhold, M., Jones, T. R., Jouzel, J., Landais, A., Masson-Delmotte, V., Oerter, H., Rasmussen, S. O., Steen-Larsen, H. C., Steffensen, J.-P., Sveinbjörnsdóttir, Á.-E., Svensson, A., Vaughn, B., and White, J. W. C.: A 120,000-year long climate record from a NW-Greenland deep ice core at ultra-high resolution, Sci. Data, 8, 141, https://doi.org/10.1038/s41597-021-00916-9, 2021. a
Gow, A., Meese, D., Alley, R., Fitzpatrick, J., Anandakrishnan, S., Woods, G., and Elder, B.: Physical and structural properties of the Greenland Ice Sheet Project 2 ice core: A review, J. Geophys. Res.-Oceans, 102, 26559–26575, https://doi.org/10.1029/97JC00165, 1997. a
Gow, A. J. and Meese, D.: Physical properties, crystalline textures and c-axis fabrics of the Siple Dome (Antarctica) ice core, J. Glaciol., 53, 573–584, https://doi.org/10.3189/002214307784409252, 2007. a, b
Gregory, S. A., Albert, M. R., and Baker, I.: Impact of physical properties and accumulation rate on pore close-off in layered firn, The Cryosphere, 8, 91–105, https://doi.org/10.5194/tc-8-91-2014, 2014. a, b, c, d
Grenfell, T. C., Warren, S. G., and Mullen, P. C.: Reflection of solar radiation by the Antarctic snow surface at ultraviolet, visible, and near-infrared wavelengths, J. Geophys. Res.-Atmos., 99, 18669–18684, https://doi.org/10.1029/94JD01484, 1994. a
Harris Stuart, R.: Compilation of records, and accumulation rate and temperature reconstructions from various polar ice cores, Zenodo [data set], https://doi.org/10.5281/zenodo.12571888, 2024. a, b
Hersbach, H., Bell, B., Berrisford, P., Hirahara, S., Horányi, A., Muñoz-Sabater, J., Nicolas, J., Peubey, C., Radu, R., Schepers, D., Simmons, A., Soci, C., Dee, D., and Thépaut, J.-N.: The ERA5 global reanalysis, Q. J. Roy. Meteor. Soc., 146, 1999–2049, https://doi.org/10.1002/qj.3803, 2020. a, b
Hoffmann, H. M., Grieman, M. M., King, A. C. F., Epifanio, J. A., Martin, K., Vladimirova, D., Pryer, H. V., Doyle, E., Schmidt, A., Humby, J. D., Rowell, I. F., Nehrbass-Ahles, C., Thomas, E. R., Mulvaney, R., and Wolff, E. W.: The ST22 chronology for the Skytrain Ice Rise ice core – Part 1: A stratigraphic chronology of the last 2000 years, Clim. Past, 18, 1831–1847, https://doi.org/10.5194/cp-18-1831-2022, 2022. a
Hörhold, M., Kipfstuhl, S., Wilhelms, F., Freitag, J., and Frenzel, A.: The densification of layered polar firn, J. Geophys. Res.-Earth Surf., 116, F01001, https://doi.org/10.1029/2009JF001630, 2011. a, b, c, d
Hörhold, M., Laepple, T., Freitag, J., Bigler, M., Fischer, H., and Kipfstuhl, S.: On the impact of impurities on the densification of polar firn, Earth Planet. Sc. Lett., 325, 93–99, https://doi.org/10.1016/j.epsl.2011.12.022, 2012. a
Huber, C., Beyerle, U., Leuenberger, M., Schwander, J., Kipfer, R., Spahni, R., Severinghaus, J., and Weiler, K.: Evidence for molecular size dependent gas fractionation in firn air derived from noble gases, oxygen, and nitrogen measurements, Earth Planet. Sc. Lett., 243, 61–73, https://doi.org/10.1016/j.epsl.2005.12.036, 2006. a, b, c
Hutterli, M. A., Schneebeli, M., Freitag, J., Kipfstuhl, J., and Röthlisberger, R.: Impact of local insolation on snow metamorphism and ice core records, 2nd International Workshop on Physics of Ice Core Records, 2–6 February 2007, Sapporo, Japan, edited by: Hondoh, T., http://hdl.handle.net/2115/45450, 2009. a, b
Ikeda-Fukazawa, T., Hondoh, T., Fukumura, T., Fukazawa, H., and Mae, S.: Variation in ratio of occluded air in Dome Fuji antarctic ice, J. Geophys. Res.-Atmos., 106, 17799–17810, https://doi.org/10.1029/2000JD000104, 2001. a
Ikeda-Fukazawa, T., Kawamura, K., and Hondoh, T.: Mechanism of Molecular Diffusion in Ice Crystals, Molecular Simulation, 30, 973–979, https://doi.org/10.1080/08927020410001709307, 2004. a, b
Ikeda-Fukazawa, T., Fukumizu, K., Kawamura, K., Aoki, S., Nakazawa, T., and Hondoh, T.: Effects of molecular diffusion on trapped gas composition in polar ice cores, Earth Planet. Sc. Lett., 229, 183–192, https://doi.org/10.1016/j.epsl.2004.11.011, 2005. a, b
Inoue, R., Fujita, S., Kawamura, K., Oyabu, I., Nakazawa, F., Motoyama, H., and Aoki, T.: Spatial distribution of vertical density and microstructure profiles in near-surface firn around Dome Fuji, Antarctica, The Cryosphere, 18, 425–449, https://doi.org/10.5194/tc-18-425-2024, 2024. a, b, c
Jouzel, J., Masson-Delmotte, V., Cattani, O., Dreyfus, G., Falourd, S., Hoffmann, G., Minster, B., Nouet, J., Barnola, J.-M., Chappellaz, J., Fischer, H., Gallet, J. C., Johnsen, S., Leuenberger, M., Loulergue, L., Luethi, D., Oerter, H., Parrenin, F., Raisbeck, G., Raynaud, D., Schilt, A., Schwander, J., Selmo, E., Souchez, R., Spahni, R., Stauffer, B., Steffensen, J. P., Stenni, B., Stocker, T. F., Tison, J. L., Werner, M., and Wolff, E. W.: Orbital and millennial Antarctic climate variability over the past 800,000 years, Science, 317, 793–796, https://doi.org/10.1126/science.1141038, 2007. a, b, c
Kahle, E., Buizert, C., Conway, H., Epifanio, J., Fudge, T. J., and Jones, T. R.: Temperature, accumulation rate, and layer thinning from the South Pole ice core (SPC14), U.S. Antarctic Program (USAP) Data Center [data set], https://doi.org/10.15784/601396, 2020. a
Kawamura, K., Parrenin, F., Lisiecki, L., Uemura, R., Vimeux, F., Severinghaus, J. P., Hutterli, M. A., Nakazawa, T., Aoki, S., Jouzel, J., Raymo, M. E., Matsumoto, K., Nakata, H., Motoyama, H., Fujita, S., Goto-Azuma, K., Fujii, Y., and Watanabe, O.: Northern Hemisphere forcing of climatic cycles in Antarctica over the past 360,000 years, Nature, 448, 912–916, https://doi.org/10.1038/nature06015, 2007. a, b, c, d, e, f, g, h
Kawamura, K., Motoyama, H., Goto-Azuma, K., Uemura, R., and Oyabu, I.: Dome Fuji Oxygen Isotope and Dust Data over the past 720 ka, NOAA National Centers for Environmental Information [data set], https://doi.org/10.25921/zphz-qz79, 2017. a
Kobashi, T., Ikeda-Fukazawa, T., Suwa, M., Schwander, J., Kameda, T., Lundin, J., Hori, A., Motoyama, H., Döring, M., and Leuenberger, M.: Post-bubble close-off fractionation of gases in polar firn and ice cores: effects of accumulation rate on permeation through overloading pressure, Atmos. Chem. Phys., 15, 13895–13914, https://doi.org/10.5194/acp-15-13895-2015, 2015. a, b, c, d
Landais, A., Chappellaz, J., Delmotte, M., Jouzel, J., Blunier, T., Bourg, C., Caillon, N., Cherrier, S., Malaizé, B., Masson-Delmotte, V., Raynaud, D., Schwander, J., and Steffensen, J. P.: A tentative reconstruction of the last interglacial and glacial inception in Greenland based on new gas measurements in the Greenland Ice Core Project (GRIP) ice core, J. Geophys. Res.-Atmos., 108, 4563, https://doi.org/10.1029/2002JD003147, 2003. a, b
Landais, A., Barnola, J., Kawamura, K., Caillon, N., Delmotte, M., Van Ommen, T., Dreyfus, G., Jouzel, J., Masson-Delmotte, V., Minster, B., Freitag, J., Leuenberger, M., Schwander, J., Huber, C., Etheridge, D., and Morgan, V.: Firn-air δ15N in modern polar sites and glacial–interglacial ice: a model-data mismatch during glacial periods in Antarctica?, Quaternary Sci. Rev., 25, 49–62, https://doi.org/10.1016/j.quascirev.2005.06.007, 2006. a, b
Landais, A., Dreyfus, G., Capron, E., Pol, K., Loutre, M. F., Raynaud, D., Lipenkov, V. Y., Arnaud, L., Masson-Delmotte, V., Paillard, D., Jouzel, J., and Leuenberger, M.: Towards orbital dating of the EPICA Dome C ice core using , Clim. Past, 8, 191–203, https://doi.org/10.5194/cp-8-191-2012, 2012. a, b, c, d
Laskar, J., Robutel, P., Joutel, F., Gastineau, M., Correia, A. C. M., and Levrard, B.: A long-term numerical solution for the insolation quantities of the Earth, A&A, 428, 261–285, https://doi.org/10.1051/0004-6361:20041335, 2004. a, b, c
Lazzara, M. A., Keller, L. M., Markle, T., and Gallagher, J.: Fifty-year Amundsen–Scott South Pole station surface climatology, Atmos. Res., 118, 240–259, https://doi.org/10.1016/j.atmosres.2012.06.027, 2012. a
Lee, J. E., Brook, E. J., Bertler, N. A. N., Buizert, C., Baisden, T., Blunier, T., Ciobanu, V. G., Conway, H., Dahl-Jensen, D., Fudge, T. J., Hindmarsh, R., Keller, E. D., Parrenin, F., Severinghaus, J. P., Vallelonga, P., Waddington, E. D., and Winstrup, M.: An 83 000-year-old ice core from Roosevelt Island, Ross Sea, Antarctica, Clim. Past, 16, 1691–1713, https://doi.org/10.5194/cp-16-1691-2020, 2020. a, b, c
Legagneux, L., Cabanes, A., and Dominé, F.: Measurement of the specific surface area of 176 snow samples using methane adsorption at 77 K, J. Geophys. Res.-Atmos., 107, ACH–5, https://doi.org/10.1029/2001JD001016, 2002. a
Legagneux, L., Lauzier, T., Domin, F., Kuhs, W. F., Heinrichs, T., and Techmer, K.: Rate of decay of specific surface area of snow during isothermal experiments and morphological changes studied by scanning electron microscopy, Can. J. Phys., 81, 459–468, https://doi.org/10.1139/p03-025, 2003. a, b
Leinss, S., Löwe, H., Proksch, M., and Kontu, A.: Modeling the evolution of the structural anisotropy of snow, The Cryosphere, 14, 51–75, https://doi.org/10.5194/tc-14-51-2020, 2020. a
Libois, Q., Picard, G., France, J. L., Arnaud, L., Dumont, M., Carmagnola, C. M., and King, M. D.: Influence of grain shape on light penetration in snow, The Cryosphere, 7, 1803–1818, https://doi.org/10.5194/tc-7-1803-2013, 2013. a
Libois, Q., Picard, G., Arnaud, L., Morin, S., and Brun, E.: Modeling the impact of snow drift on the decameter-scale variability of snow properties on the Antarctic Plateau, J. Geophys. Res.-Atmos., 119, 11662–11681, https://doi.org/10.1002/2014JD022361, 2014. a, b, c, d, e, f, g, h, i, j, k, l, m
Libois, Q., Picard, G., Arnaud, L., Dumont, M., Lafaysse, M., Morin, S., and Lefebvre, E.: Summertime evolution of snow specific surface area close to the surface on the Antarctic Plateau, The Cryosphere, 9, 2383–2398, https://doi.org/10.5194/tc-9-2383-2015, 2015. a
Lipenkov, V., Raynaud, D., Loutre, M., and Duval, P.: On the potential of coupling air content and from trapped air for establishing an ice core chronology tuned on local insolation, Quaternary Sci. Rev., 30, 3280–3289, https://doi.org/10.1016/j.quascirev.2011.07.013, 2011. a, b
Lüthi, D., Bereiter, B., Stauffer, B., Winkler, R., Schwander, J., Kindler, P., Leuenberger, M., Kipfstuhl, S., Capron, E., Landais, A., Fischer, H., and Stocker, T. F.: CO2 and variations in and just below the bubble–clathrate transformation zone of Antarctic ice cores, Earth Planet. Sc. Lett., 297, 226–233, https://doi.org/10.1016/j.epsl.2010.06.023, 2010. a
Martin, K. C., Buizert, C., Edwards, J. S., Kalk, M. L., Riddell-Young, B., Brook, E. J., Beaudette, R., Severinghaus, J. P., and Sowers, T. A.: Bipolar impact and phasing of Heinrich-type climate variability, Nature, 617, 100–104, https://doi.org/10.1038/s41586-023-05875-2, 2023. a
Martinerie, P., Lipenkov, V. Y., Raynaud, D., Chappellaz, J., Barkov, N. I., and Lorius, C.: Air content paleo record in the Vostok ice core (Antarctica): A mixed record of climatic and glaciological parameters, J. Geophys. Res.-Atmos., 99, 10565–10576, https://doi.org/10.1029/93JD03223, 1994. a
Martinerie, P., Nourtier-Mazauric, E., Barnola, J.-M., Sturges, W. T., Worton, D. R., Atlas, E., Gohar, L. K., Shine, K. P., and Brasseur, G. P.: Long-lived halocarbon trends and budgets from atmospheric chemistry modelling constrained with measurements in polar firn, Atmos. Chem. Phys., 9, 3911–3934, https://doi.org/10.5194/acp-9-3911-2009, 2009. a
Massam, A.: Modelling the age-depth and temperature profiles of deep ice cores from the Antarctic Peninsula and the Weddell Sea region, Phd thesis, University of Durham, https://nora.nerc.ac.uk/id/eprint/520454/ (last access: 2 August 2023), 2018. a
Matsuoka, K., Skoglund, A., and Roth, G.: Quantarctica, Norwegian Polar Institute [data set], https://doi.org/10.21334/npolar.2018.8516e961, 2018. a
Mitchell, L. E., Buizert, C., Brook, E. J., Breton, D. J., Fegyveresi, J., Baggenstos, D., Orsi, A., Severinghaus, J., Alley, R. B., Albert, M., Rhodes, R. H., McConnell, J. R., Sigl, M., Maselli, O., Gregory, S., and Ahn, J.: Observing and modeling the influence of layering on bubble trapping in polar firn, J. Geophys. Res.-Atmos., 120, 2558–2574, https://doi.org/10.1002/2014JD022766, 2015. a
Moon, T. A., Fisher, M., Stafford, T., and Thurber, A.: QGreenland (v3), National Snow and Ice Data Center [data set], https://doi.org/10.5281/zenodo.12823307, 2023. a
Morgan, V., Wookey, C., Li, J., van Ommen, T., Skinner, W., and Fitzpatrick, M. F.: Site information and initial results from deep ice drilling on Law Dome, Antarctica, J. Glaciol., 43, 3–10, https://doi.org/10.3189/S0022143000002768, 1997. a, b
Mulvaney, R., Alemany, O., and Possenti, P.: The Berkner Island (Antarctica) ice-core drilling project, Ann. Glaciol., 47, 115–124, https://doi.org/10.3189/172756407786857758, 2007. a, b
Mulvaney, R., Abram, N. J., Hindmarsh, R. C., Arrowsmith, C., Fleet, L., Triest, J., Sime, L. C., Alemany, O., and Foord, S.: Recent Antarctic Peninsula warming relative to Holocene climate and ice-shelf history, Nature, 489, 141–144, https://doi.org/10.1038/nature11391, 2012. a, b
Mulvaney, R., Triest, J., and Alemany, O.: The James Ross Island and the Fletcher Promontory ice-core drilling projects, Ann. Glaciol., 55, 179–188, https://doi.org/10.3189/2014AoG68A044, 2014. a, b
Mulvaney, R., Rix, J., Polfrey, S., Grieman, M., Martìn, C., Nehrbass-Ahles, C., Rowell, I., Tuckwell, R., and Wolff, E.: Ice drilling on Skytrain Ice Rise and Sherman Island, Antarctica, Ann. Glaciol., 62, 311–323, https://doi.org/10.1017/aog.2021.7, 2021. a
Mulvaney, R., Wolff, E. W., Grieman, M. M., Hoffmann, H. H., Humby, J. D., Nehrbass-Ahles, C., Rhodes, R. H., Rowell, I. F., Parrenin, F., Schmidely, L., Fischer, H., Stocker, T. F., Christl, M., Muscheler, R., Landais, A., and Prié, F.: The ST22 chronology for the Skytrain Ice Rise ice core – Part 2: An age model to the last interglacial and disturbed deep stratigraphy, Clim. Past, 19, 851–864, https://doi.org/10.5194/cp-19-851-2023, 2023. a
NEEM Community Members: Eemian interglacial reconstructed from a Greenland folded ice core, Nature, 493, 489–494, https://doi.org/10.1038/nature11789, 2013. a
Neff, P. D.: A review of the brittle ice zone in polar ice cores, Ann. Glaciol., 55, 72–82, https://doi.org/10.3189/2014AoG68A023, 2014. a, b, c
NGRIP project members: High-resolution record of Northern Hemisphere climate extending into the last interglacial period, Nature, 431, 147–151, https://doi.org/10.1038/nature02805, 2004. a
Oyabu, I., Kawamura, K., Uchida, T., Fujita, S., Kitamura, K., Hirabayashi, M., Aoki, S., Morimoto, S., Nakazawa, T., Severinghaus, J. P., and Morgan, J. D.: Fractionation of and in the Antarctic ice sheet during bubble formation and bubble–clathrate hydrate transition from precise gas measurements of the Dome Fuji ice core, The Cryosphere, 15, 5529–5555, https://doi.org/10.5194/tc-15-5529-2021, 2021. a, b, c, d, e
Oyabu, I., Kawamura, K., Buizert, C., Parrenin, F., Orsi, A., Kitamura, K., Aoki, S., and Nakazawa, T.: The Dome Fuji ice core DF2021 chronology (0–207 kyr BP), Quaternary Sci. Rev., 294, 107754, https://doi.org/10.1016/j.quascirev.2022.107754, 2022. a
Parrenin, F., Barnola, J.-M., Beer, J., Blunier, T., Castellano, E., Chappellaz, J., Dreyfus, G., Fischer, H., Fujita, S., Jouzel, J., Kawamura, K., Lemieux-Dudon, B., Loulergue, L., Masson-Delmotte, V., Narcisi, B., Petit, J.-R., Raisbeck, G., Raynaud, D., Ruth, U., Schwander, J., Severi, M., Spahni, R., Steffensen, J. P., Svensson, A., Udisti, R., Waelbroeck, C., and Wolff, E.: The EDC3 chronology for the EPICA Dome C ice core, Clim. Past, 3, 485–497, https://doi.org/10.5194/cp-3-485-2007, 2007. a
Parrenin, F., Petit, J.-R., Masson-Delmotte, V., Wolff, E., Basile-Doelsch, I., Jouzel, J., Lipenkov, V., Rasmussen, S. O., Schwander, J., Severi, M., Udisti, R., Veres, D., and Vinther, B. M.: Volcanic synchronisation between the EPICA Dome C and Vostok ice cores (Antarctica) 0–145 kyr BP, Clim. Past, 8, 1031–1045, https://doi.org/10.5194/cp-8-1031-2012, 2012. a
Petit, J.-R., Jouzel, J., Raynaud, D., Barkov, N. I., Barnola, J.-M., Basile, I., Bender, M., Chappellaz, J., Davis, M., Delaygue, G., Delmotte, M., Kotlyakov, V. M., Legrand, M., Lipenkov, V. Y., Lorius, C., PÉpin, L., Ritz, C., Saltzman, E., and Stievenard, M.: Climate and atmospheric history of the past 420,000 years from the Vostok ice core, Antarctica, Nature, 399, 429–436, https://doi.org/10.1038/20859, 1999. a, b
Petrenko, V. V., Severinghaus, J. P., Brook, E. J., Reeh, N., and Schaefer, H.: Gas records from the West Greenland ice margin covering the Last Glacial Termination: a horizontal ice core, Quaternary Sci. Rev., 25, 865–875, https://doi.org/10.1016/j.quascirev.2005.09.005, 2006. a
Picard, G., Domine, F., Krinner, G., Arnaud, L., and Lefebvre, E.: Inhibition of the positive snow-albedo feedback by precipitation in interior Antarctica, Nat. Clim. Change, 2, 795–798, https://doi.org/10.1038/nclimate1590, 2012. a, b, c
Rasmussen, S. O., Abbott, P. M., Blunier, T., Bourne, A. J., Brook, E., Buchardt, S. L., Buizert, C., Chappellaz, J., Clausen, H. B., Cook, E., Dahl-Jensen, D., Davies, S. M., Guillevic, M., Kipfstuhl, S., Laepple, T., Seierstad, I. K., Severinghaus, J. P., Steffensen, J. P., Stowasser, C., Svensson, A., Vallelonga, P., Vinther, B. M., Wilhelms, F., and Winstrup, M.: A first chronology for the North Greenland Eemian Ice Drilling (NEEM) ice core, Clim. Past, 9, 2713–2730, https://doi.org/10.5194/cp-9-2713-2013, 2013. a, b
Raynaud, D., Lipenkov, V., Lemieux-Dudon, B., Duval, P., Loutre, M.-F., and Lhomme, N.: The local insolation signature of air content in Antarctic ice. A new step toward an absolute dating of ice records, Earth Planet. Sc. Lett., 261, 337–349, https://doi.org/10.1016/j.epsl.2007.06.025, 2007. a, b
Rubino, M., Etheridge, D. M., Thornton, D. P., Howden, R., Allison, C. E., Francey, R. J., Langenfelds, R. L., Steele, L. P., Trudinger, C. M., Spencer, D. A., Curran, M. A. J., van Ommen, T. D., and Smith, A. M.: Revised records of atmospheric trace gases CO2, CH4, N2O, and δ13C-CO2 over the last 2000 years from Law Dome, Antarctica, Earth Syst. Sci. Data, 11, 473–492, https://doi.org/10.5194/essd-11-473-2019, 2019. a
Schaefer, H., Lourantou, A., Chappellaz, J., Lüthi, D., Bereiter, B., and Barnola, J.-M.: On the suitability of partially clathrated ice for analysis of concentration and δ13C of palaeo-atmospheric CO2, Earth Planet. Sc. Lett., 307, 334–340, https://doi.org/10.1016/j.epsl.2011.05.007, 2011. a
Schwander, J., Sowers, T., Barnola, J.-M., Blunier, T., Fuchs, A., and Malaizé, B.: Age scale of the air in the summit ice: Implication for glacial-interglacial temperature change, J. Geophys. Res.-Atmos., 102, 19483–19493, https://doi.org/10.1029/97JD01309, 1997. a
Severinghaus, J.: Nitrogen and Oxygen Gas Isotopes in the Siple Dome and Byrd Ice Cores, Antarctica, U.S. Antarctic Program (USAP) Data Center [data set], https://doi.org/10.7265/N55X26V0, 2009. a
Severinghaus, J.: Low-res d15N and d18O of O2 in the WAIS Divide 06A Deep Core, U.S. Antarctic Program (USAP) Data Center [data set], https://doi.org/10.7265/N5S46PWD, 2015. a
Severinghaus, J.: South Pole (SPICECORE) 15N, 18O, and , U.S. Antarctic Program (USAP) Data Center [data set], https://doi.org/10.15784/601152, 2019. a, b
Severinghaus, J. P. and Battle, M. O.: Fractionation of gases in polar ice during bubble close-off: New constraints from firn air Ne, Kr and Xe observations, Earth Planet. Sc. Lett., 244, 474–500, https://doi.org/10.1016/j.epsl.2006.01.032, 2006. a, b, c, d, e, f, g, h
Severinghaus, J. P., Grachev, A., and Battle, M.: Thermal fractionation of air in polar firn by seasonal temperature gradients, Geochem. Geophys. Geosyst., 2, 7, https://doi.org/10.1029/2000GC000146, 2001. a, b
Shackleton, S. A.: Tracking Past Changes in Ocean Heat Content with Atmospheric Noble Gases in Ice Cores, Doctoral dissertation, University of California, San Diego, http://dissertations.umi.com/ucsd:18809 (last access: 16 May 2024), 2019. a
Smith, M. E.: The Pleistocene O2 record in two ice cores, Undergraduate Senior Thesis, Princeton University, http://arks.princeton.edu/ark:/88435/dsp013484zk00q (last access: 1 November 2023), 1998. a
Sowers, T., Bender, M., and Raynaud, D.: Elemental and isotopic composition of occluded O2 and N2 in polar ice, J. Geophys. Res.-Atmos., 94, 5137–5150, https://doi.org/10.1029/JD094iD04p05137, 1989. a
Stenni, B., Proposito, M., Gragnani, R., Flora, O., Jouzel, J., Falourd, S., and Frezzotti, M.: Eight centuries of volcanic signal and climate change at Talos Dome (East Antarctica), J. Geophys. Res.-Atmos., 107, ACL–3, https://doi.org/10.1029/2000JD000317, 2002. a
Stenni, B., Masson-Delmotte, V., Selmo, E., Oerter, H., Meyer, H., Röthlisberger, R., Jouzel, J., Cattani, O., Falourd, S., Fischer, H., Hoffmann, G., Iacumin, P., Johnsen, S., Minster, B., and Udisti, R.: The deuterium excess records of EPICA Dome C and Dronning Maud Land ice cores (East Antarctica), Quaternary Sci. Rev., 29, 146–159, https://doi.org/10.1016/j.quascirev.2009.10.009, 2010. a
Suwa, M. and Bender, M. L.: Chronology of the Vostok ice core constrained by ratios of occluded air, and its implication for the Vostok climate records, Quaternary Sci. Rev., 27, 1093–1106, https://doi.org/10.1016/j.quascirev.2008.02.017, 2008a. a, b
Suwa, M. and Bender, M. L.: ratios of occluded air in the GISP2 ice core, J. Geophys. Res.-Atmos., 113, D11119, https://doi.org/10.1029/2007JD009589, 2008b. a, b, c, d, e, f
Uchida, T., Duval, P., Lipenkov, V. Y., Hondoh, T., Mae, S., and Shoji, H.: Brittle zone and air-hydrate formation in polar ice sheets, Memoirs of National Institute of Polar Research, Special issue, 49, 298–305, http://purl.org/coar/resource_type/c_6501 (last access: 20 June 2023), 1994. a
Ueltzhöffer, K. J., Bendel, V., Freitag, J., Kipfstuhl, S., Wagenbach, D., Faria, S. H., and Garbe, C. S.: Distribution of air bubbles in the EDML and EDC (Antarctica) ice cores, using a new method of automatic image analysis, J. Glaciol., 56, 339–348, https://doi.org/10.3189/002214310791968511, 2010. a
Uemura, R., Motoyama, H., Masson-Delmotte, V., Jouzel, J., Kawamura, K., Goto-Azuma, K., Fujita, S., Kuramoto, T., Hirabayashi, M., Miyake, T., Ohno, H., Fujita, K., Abe-Ouchi, A., Iizuka, Y., Horikawa, S., Igarashi, M., Suzuki, K., Suzuki, T., and Fujii, Y.: Asynchrony between Antarctic temperature and CO2 associated with obliquity over the past 720,000 years, Nat. Commun., 9, 961, https://doi.org/10.1038/s41467-018-03328-3, 2018. a
Vionnet, V., Brun, E., Morin, S., Boone, A., Faroux, S., Le Moigne, P., Martin, E., and Willemet, J.-M.: The detailed snowpack scheme Crocus and its implementation in SURFEX v7.2, Geosci. Model Dev., 5, 773–791, https://doi.org/10.5194/gmd-5-773-2012, 2012 (code available at: https://github.com/UMR-CNRM/snowtools, last access: 2 July 2022). a, b, c, d, e, f, g
Warming, E., Svensson, A., Vallelonga, P., and Bigler, M.: A technique for continuous detection of drill liquid in ice cores, J. Glaciol., 59, 503–506, https://doi.org/10.3189/2013JoG12J124, 2013. a
Warren, S. G., Brandt, R. E., and Grenfell, T. C.: Visible and near-ultraviolet absorption spectrum of ice from transmission of solar radiation into snow, Appl. Optics, 45, 5320–5334, https://doi.org/10.1364/AO.45.005320, 2006. a
White, J., Bradley, E., Garland, J., Jones, T. R., Morris, V., Price, M., and Vaughn, B.: Stable Isotopes of Ice in the Transition and Glacial Sections of the WAIS Divide Deep Ice Core, U.S. Antarctic Program (USAP) Data Center [data set], https://doi.org/10.15784/601274, 2019. a
Winstrup, M., Vallelonga, P., Kjær, H. A., Fudge, T. J., Lee, J. E., Riis, M. H., Edwards, R., Bertler, N. A. N., Blunier, T., Brook, E. J., Buizert, C., Ciobanu, G., Conway, H., Dahl-Jensen, D., Ellis, A., Emanuelsson, B. D., Hindmarsh, R. C. A., Keller, E. D., Kurbatov, A. V., Mayewski, P. A., Neff, P. D., Pyne, R. L., Simonsen, M. F., Svensson, A., Tuohy, A., Waddington, E. D., and Wheatley, S.: A 2700-year annual timescale and accumulation history for an ice core from Roosevelt Island, West Antarctica, Clim. Past, 15, 751–779, https://doi.org/10.5194/cp-15-751-2019, 2019. a
Witrant, E., Martinerie, P., Hogan, C., Laube, J. C., Kawamura, K., Capron, E., Montzka, S. A., Dlugokencky, E. J., Etheridge, D., Blunier, T., and Sturges, W. T.: A new multi-gas constrained model of trace gas non-homogeneous transport in firn: evaluation and behaviour at eleven polar sites, Atmos. Chem. Phys., 12, 11465–11483, https://doi.org/10.5194/acp-12-11465-2012, 2012. a