the Creative Commons Attribution 4.0 License.
the Creative Commons Attribution 4.0 License.
 | 16 Aug 2024
Wind tunnel experiments to quantify the effect of aeolian snow transport on the surface snow microstructure
Hagen Weigel
Sonja Wahl
Henning Löwe
The evolution of the surface snow microstructure under the influence of wind during precipitation events is hardly understood but crucial for polar and alpine snowpacks. Available statistical models are solely parameterized from field data where conditions are difficult to control. Controlled experiments which exemplify the physical processes underlying the evolution of density or specific surface area (SSA) of surface snow under windy conditions are virtually non-existent. As a remedy, we conducted experiments in a cold laboratory using a ring-shaped wind tunnel with an infinite fetch to systematically investigate wind-induced microstructure modifications under controlled atmospheric, flow and snow conditions and to identify the relevant processes. Airborne snow particles are characterized by high-speed imaging, while deposited snow is characterized by density and SSA measurements. We used a single snow type (dendritic fresh snow) for simulating different precipitation intensities, varied wind speeds at a height of 0.4 m from 3 to 7 m s−1 (for fixed temperature) and varied temperatures from −24 to −2 °C (for fixed wind speed). The measured airborne impact trajectories confirm the consistency of our coefficient of restitution with large-scale saltation, rendering the setup suitable for realistically studying interactions between airborne and deposited snow. Increasing wind speeds resulted in intensified densification and stronger SSA decreases. The most drastic snow density and SSA changes in deposited snow are observed close to the melting point. Our measured densification rates as a function of wind speed show clear deviations from existing statistical models but can be re-parameterized through our data. This study, as a first of its kind, exemplifies a rich nonlinear interplay between airborne and deposited snow particles, which is discussed in view of a multitude of involved processes, i.e., airborne metamorphism, cohesion, particle separation and fragmentation.
- Article
(4343 KB) - Full-text XML
- BibTeX
- EndNote


The topmost centimeters of a snowpack (herein referred to as “surface snow”) form the interface to the atmosphere and are frequently affected by wind (e.g., Seligmann, 1936; Mott et al., 2019). During a snowstorm, the typically dendritic precipitation particles with diameters of 1–5 mm (Woods et al., 2008; Garrett and Yuter, 2014) are subject to aerodynamic drag forces. Depending on wind speed and particle size and shape, the snow particles either roll on the ground (rolling or creeping), follow near-ground ballistic trajectories occasionally impacting the ground (saltation) or are transported without contacting the ground (suspension) (e.g., Walter et al., 2014). Snow particle fragmentation upon surface collisions during saltation (Sato et al., 2008; Comola et al., 2017), rounding due to abrasion while rolling and sublimation in sub-saturated air (Dai and Huang, 2014) are key factors determining the size, shape and packing density (Golubev and Sokratov, 2004; Cho et al., 2006) of the ultimately deposited snow. Blowing snow particles are typically smaller than precipitation crystals (Schmidt, 1982; Nishimura and Nemoto, 2005; Nishimura et al., 2014), with diameters ranging from 50–500 µm and with a higher sphericity and lower dendricity (Bartlett et al., 2008). The deposited snow particles define the microstructure and thereby the properties of surface snow like albedo, density or cohesion. These properties are relevant for the mechanical stability of wind slabs for avalanche formation (Schweizer et al., 2003), the exchange of chemical substances with the atmosphere (e.g., Wolff and Bales, 1996), alpine and polar mass balances (Rignot and Thomas, 2002), or radiative transfer (Flanner and Zender, 2006). Thus, it is critical for models of different spatial resolutions from process-based snowpack models to global-scale climate models to accurately simulate how the physical properties of the snow surface change under the influence of wind.
The physical properties of snow are mainly dominated by two snow microstructural parameters: (i) the snow density ρs = ρi ϕi, where ρi=917 kg m−3 is the density of ice and is the ice volume fraction of snow, and (ii) the specific surface area (SSA) defined as the surface area per ice mass (or volume) (e.g., Proksch et al., 2015; Warren, 2019). Surface snow densities range from 70–100 kg m−3 for Alpine fresh snow deposited under weak wind conditions up to typically 250–400 kg m−3 for strongly wind-affected surface snow in Arctic and Antarctic regions (Brun et al., 1997; Fausto et al., 2018; Domine et al., 2021). The SSA of surface snow ranges from 70–150 mm−1 for fresh snow (Yamaguchi et al., 2019) to 20–40 mm−1 for strongly wind-affected snow in Antarctica (Gallet et al., 2011). For stationary surface snow under isothermal temperature conditions, the density increases and the SSA decreases over time (Schleef et al., 2014a). Wind generally results in an increase in the surface snow density (Seligmann, 1936; Sokratov and Sato, 2001; Liston et al., 2007; Vionnet et al., 2012), with densification rates that are 1 to 2 orders of magnitude higher than for isothermal metamorphism (Liston et al., 2007). Available statistical models (Lehning et al., 2002; Liston et al., 2007; Vionnet et al., 2012) for the increase in surface snow density due to wind are exclusively based on field measurements that are difficult to control and limited by the problem of accurately measuring snow transport and microstructure simultaneously. Recently, Domine et al. (2019) found that the snow models SNOWPACK (Lehning et al., 2002) and Crocus (Vionnet et al., 2012) greatly underestimate the increase in snow density for Arctic surface layers. However, Royer et al. (2021), Wever et al. (2022), and Amory et al. (2021) illustrate how the parameterizations of the increase in surface snow density due to wind can be adjusted to better represent the properties of surface snow in the Arctic and in Antarctica. Cabanes at al. (2003) found that wind increases the rate of SSA decrease, but insufficient data prevented a parametrization of this effect. To the best of our knowledge, no other study has yet investigated the effect of wind on the SSA.
Different physical processes occurring during aeolian snow transport like particle fragmentation, sublimation and water vapor re-deposition may be responsible for the increase in deposited snow density and SSA changes. Snow densification by wind is believed to be mainly the consequence of particle fragmentation, resulting in higher packing densities of the ultimately deposited blowing snow particles (Sato et al., 2008; Comola et al., 2017). Fragmentation of snowflakes may already occur at low wind velocities (Sato et al., 2008). For wind velocities <2 m s−1 measured at a height of 1 m, highly dendritic precipitation snowflakes were found to not break upon collision with the surface, whereas they are completely decomposed for wind velocities >5 m s−1. The number of fragments increased while the fragment size decreased with impact velocity (Sato et al., 2008). A discrete element model (DEM) of the fragmentation process was presented by Comola et al. (2017), linking the size distribution of blowing snow particles to that of falling snow crystals. Pure sublimation of windblown snow particles results in a reduction in snow particle size and partial disappearance of entire grains, potentially resulting in a significant mass loss (Groot-Zwaaftink et al., 2013; Palm et al., 2017). A decreasing SSA with increasing relative humidity was found by Yamaguchi et al. (2019) for precipitation particles, likely being the result of vapor deposition and riming. To discern the different processes responsible for snow density and SSA changes due to wind, it is necessary to complement field measurements by controlled laboratory experiments.
It is the aim of our study to propose an experimental setup to systematically investigate how wind affects the evolution of the surface snow density and SSA during precipitation events as functions of the wind speed, air temperature and transport duration. We therefore deployed a ring-shaped wind tunnel (RWT) in a walk-in cold room to combine flow measurements (velocity, temperature, humidity) and particle characteristics (coefficient of restitution, impact angle, velocity) with established snow microstructure measurements (X-ray tomography, IceCube, density cutter) under controlled cold laboratory conditions. The relevant physical processes responsible for the density and SSA changes, i.e., particle fragmentation, sublimation and vapor re-deposition, are characterized, discussed and linked to the surface snow microstructure modifications.
The paper is organized as follows. The methods, instrumentation and models used and tested in this study are introduced in Sect. 2. The density and SSA measurements, high-speed camera particle imaging, and the microstructural modifications due to wind are introduced, discussed and compared to the models in Sect. 3. A summary of the results, the main conclusions and an outlook can be found in Sect. 4.
2.1 Ring wind tunnel
Experiments using a closed-circuit RWT were performed under stable temperature conditions in one of the WSL/SLF (Swiss Federal Institute for Forest, Snow and Landscape/Institute for Snow and Avalanche Research) cold labs in Davos (Switzerland). The RWT (Fig. 1a) has an obround shape with two straight sections providing space for measurements without centrifugal effects as they occur in the curved sections. The RWT system is 2.2 m long and 1.2 m wide, and its tunnel is 20 cm wide and 50 cm high (Sommer et al., 2017). A model-aircraft propeller driven by an electric motor is used to create the airflow. The propeller is controlled by the wind velocity V0.4 m measured at a height of 0.4 m to maintain a target wind velocity. In the empty RWT without snow, the maximum possible wind speed is approximately V0.4 m≈8.5 m s−1. The infinite fetch of the closed-circuit RWT enables continuous snow transport with particles rolling or saltating on the ground or being in suspension for longer time periods. This is not possible in open-circuit wind tunnels like the large-scale wind tunnel at WSL/SLF (e.g., Walter et al., 2012a, b, c), where particles are blown out of the tunnel after a few seconds of transport.
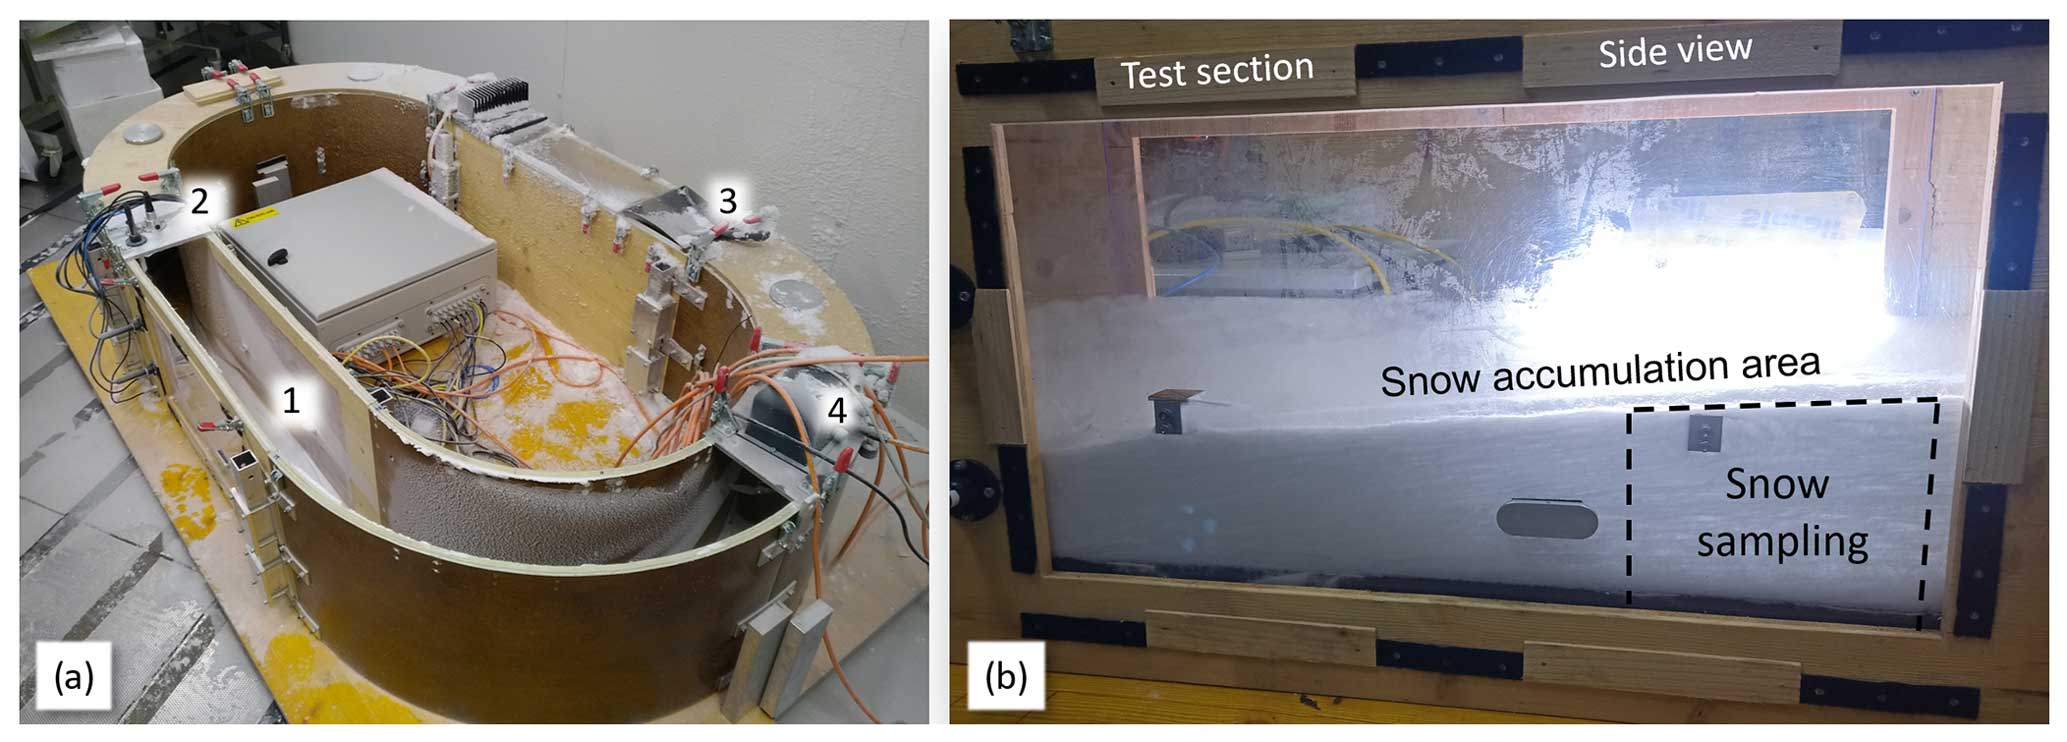
Figure 1(a) RWT installed in the cold laboratory at °C: (1) straight test section; (2) measurement section with snow and air temperature, relative humidity, and wind speed sensors; (3) inlet for adding fresh snow; and (4) wind turbine. The RWT ceiling is removed at the test section and at a part of the lower curved section in this image. The flow direction is counterclockwise. (b) Side view of the test section with the snow accumulation area where the snow microstructure measurements were performed.
2.2 Drift experiments
We performed a total of 14 RWT experiments for testing the effects of wind speed (Experiments 1–7), transport duration (Experiments 8–9) and temperature (Experiments 10–12) on the surface snow microstructure (Table 1). Particle impact characteristics were measured with a high-speed camera during Experiment 13, while Experiment 14 served as a sensitivity study to test the effect of sublimation and vapor re-deposition on airborne particles. For the drift experiments, dendritic fresh snow was produced in the WSL/SLF snowmaker machine (Schleef et al., 2014b) at an air temperature of −20 °C and a water bath temperature of +30 °C, resulting in initial snow densities of 45–80 kg m−3 and SSA of 45–70 mm−1 for the experiments. For each of the 12 main experiments, a constant wind velocity was initially set ranging between V0.4 m=4–7.1 m s−1 (Table 1). A total volume of cm3 of fresh snow was then slowly added to the wind tunnel, temporally equally distributed over the entire experiment duration τexp (Table 1), to mimic snow precipitation until the end of the experiment. The new snow was carefully poured into the wind tunnel at an inlet (Fig. 1a) with a shovel, minimizing the destruction of the initial microstructure. Only the microstructure of the snow crystals coming into contact with the shovel may be slightly affected by the pouring procedure, while their quantity is negligible compared to the entire volume of snow on the shovel. No sieving was applied to avoid prior fragmentation of the highly dendritic snow crystals. Once a portion of new snow was poured into the RWT, it got immediately suspended and redistributed in the flow. The wind turbine propeller is located beneath the lid in the curved section of the ring wind tunnel (Fig. 1a), covering approximately the top quarter of the wind tunnel cross-section. The propeller blades are 90 mm long. As the particle mass flux exponentially decreases with height as shown by Yu et al. (2023) for our RWT, only a negligible part of the snow particles will come into contact with the propeller. A schematic drawing of the RWT and additional figures can be found in Yu et al. (2023).
The new snow in the snowmaker box that served as the initial condition for the experiments is regarded as the microstructure representing precipitation deposition unaffected by wind (V0.4 m=0 m s−1). The settings and atmospheric conditions for the 12 experimental runs are summarized in Table 1. For Experiments 1–7, the wind velocity ranged from V0.4 m=4–7.1 m s−1, while the transport duration (0.5 h) and the air temperature ( °C) were constant. For Experiments 8–12, the wind velocity was set to V0.4 m=6 m s−1, while the experiment duration was varied (τexp=1 and 2.5 h, Experiments 8 and 9) or the air temperature was changed to , −6 and −2 °C (Experiments 10–12). The major snow accumulations analyzed with the instruments discussed in the following section developed in the straight test section of the RWT (Fig. 1b).
Two complementary experiments were conducted to (i) measure and analyze particle impact characteristics and (ii) separately investigate the effect of long snow transport durations. Both experiments were conducted at an air temperature of Ta °C, while a low mass of snow (600 g) was poured into the RWT at the beginning of the experiment. For experiment (i) the wind speed was varied from V0.4 m=3–7 m s−1, and near-surface particle impacts were recorded with a high-speed camera (Experiment 13 in Table 1). A total of 75 particle impacts were analyzed for the different wind velocities. For experiment (ii) the wind speed was set to V0.4 m=8 m s−1 to keep the particles in suspension as long as possible, and the transported particles were sampled out of the air every 15 min (Experiment 14 in Table 1).
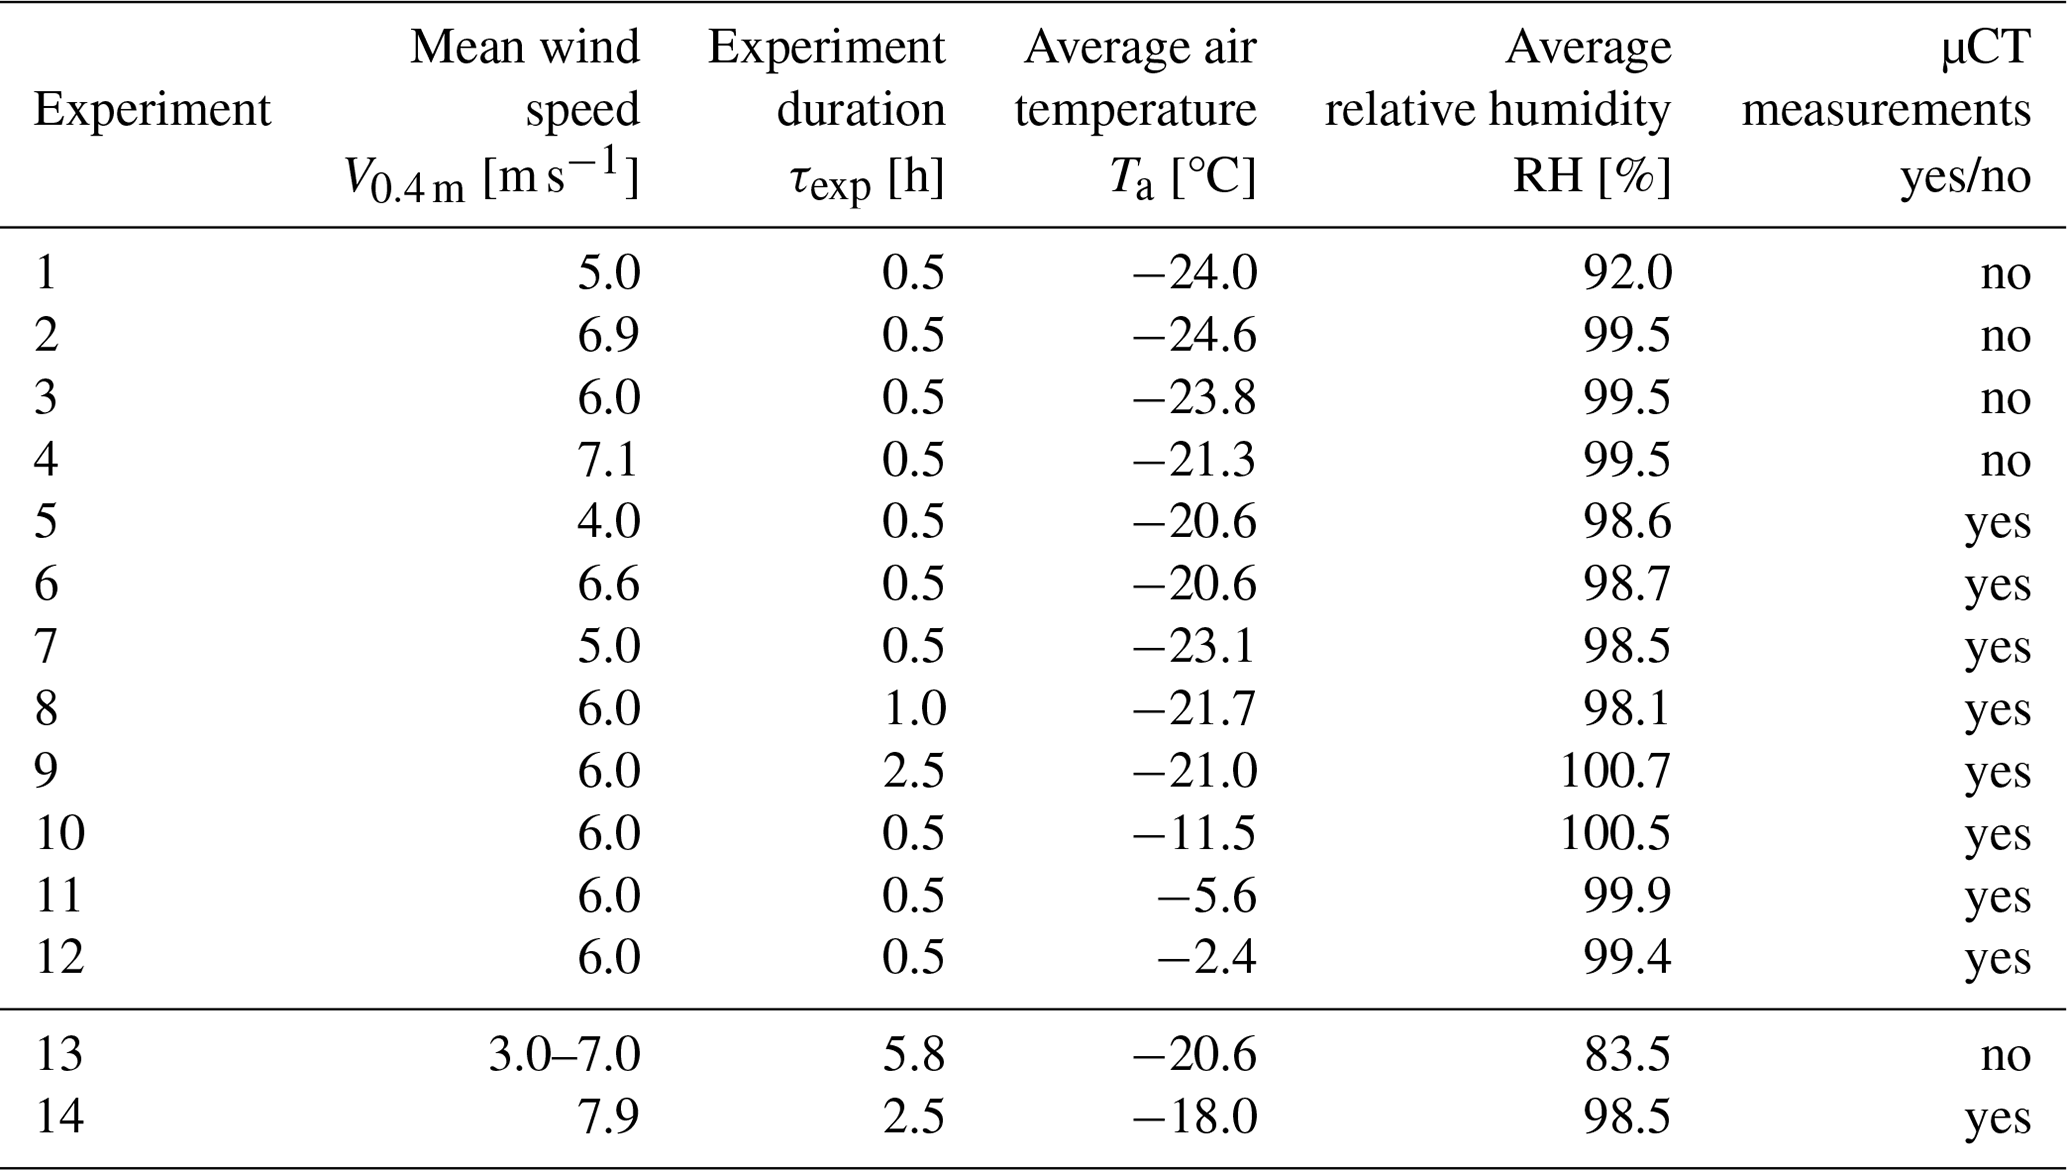
Table 1Overview of the experimental settings and atmospheric conditions for the main experiments (1–12) and the complementary experiments (13–14). The average value for RH measured with respect to ice is calculated from the second period of each experiment where a situation close to equilibrium for RH is reached (Fig. 2).
2.3 Instrumentation and measurements
The straight test section (Fig. 1a and b) is equipped with various sensors for continuously measuring the air temperature Ta (HC2-S, Rotronic, uncertainty: ± 0.3 °C), the relative humidity RH (HC2-S, Rotronic, uncertainty: ± 1.5 %) and the wind speed V0.4 m (MiniAir, Schildknecht, uncertainty: ± 0.2 m s−1). The air temperature and relative humidity are measured at a height of 0.15 m, while the wind speed is measured at a height of 0.4 m above the wind tunnel floor. Because the snow height increased during the experiments, the height of the sensors above the snow surface decreased; however, none of the sensors was covered in snow at anytime. The atmospheric data are sampled at a frequency of 5 Hz using custom-made software based on LabVIEW (National Instruments). A high-speed camera (Phantom, Vision Research) is used to record particle impacts close to the snow surface and to calculate particle impact characteristics like the coefficient of restitution and impact and ejection angles.
Snow microstructure measurements were performed before and after the drift experiments to characterize the fresh and the wind-affected snow microstructures. An IceCube (A2 Photonics Sensors) instrument was used to measure the specific surface area of the snow in the measurement section (Fig. 1b) with a stated measurement uncertainty of ± 10 % (Gallet et al., 2009). Recently reported systematic IceCube measurement errors detected for SSA < 20 mm−1 (Martin and Schneebeli, 2023) are unproblematic for our dendritic fresh snow experiments with SSA > 20 mm−1. A standard density cutter ( cm3) was used to measure the snow density. The cutter and micro-computed tomography (µCT) density measurements were found (Proksch et al., 2016) to agree within 5 %–9 %, thus resulting in a similar overall uncertainty for the density and for the SSA measurements. Up to 30 IceCube and density cutter measurements were performed for each experiment depending on the dimensions of the snow accumulation to characterize the spatial variability in the snow density and SSA.
Micro-computed tomography (µCT) measurements of the initial and final snow microstructures were performed for Experiments 5–12 and 14 to access information on particle size distributions and to obtain complementary measurements of the SSA and the snow density. A cylindrical snow sample with a diameter of 36 mm and a height of 70 mm was vertically cut out of the initial new snow or the accumulated snow for the µCT measurements. Because of the limited sampling volume, only a little information on the spatial density and SSA variability is obtained from these measurements. The µCT measurements for the main experiments (Experiments 5–12 and 14; Table 1) were performed with a Scanco CT-40 scanner with a voxel size of 18 µm (e.g., Pinzer and Schneebeli, 2009; Heggli et al., 2011). The rather low resolution is chosen because of the necessity of using sufficiently large sample holders for taking snow samples from the deposit. For smaller sample holders, an impact of sampling on the density is unavoidable for the densities of interest. Therefore it cannot be ruled out that absolute values of the SSA are biased low due to resolution. A smaller sample holder was used for the additional Experiment 14 resulting in a voxel size of 8 µm. For the binary segmentation, the energy-based segmentation procedure presented by Hagenmuller et al. (2013) was used. A marching cubes approach (Hagenuller et al., 2016) is used for calculating the SSA from the segmented µCT images.
2.4 Densification models
To make contact to field-based results, three available model formulations for wind-induced snow densification during snow precipitation events (SNOWPACK: Lehning et al., 2002; SnowTran-3D: Liston et al., 2007; Crocus: Vionnet et al., 2012) are tested in our study. In all three models, snow densification by wind can be active with and without concurrent snowfall and is initiated when wind speed exceeds certain thresholds to generate snow transport. Therefore, all models include terms describing ground-based densification of surface snow layers due to wind transport and new-snow density terms (ρns) that also depend on wind speed for describing an initial compaction of precipitation. This separation is likely resulting from different timescales and snow types involved in these different processes. During precipitation events, the typically highly dendritic new snow will quite quickly (depending also on the wind speed) cover the underlying (new) snow which then cannot be entrained anymore by the wind, resulting in rather short effective transport durations. However, without precipitation, loose surface snow of likely different grain types (potentially more decomposed rounded particles) may be entrained and affected by wind for much longer time (or transport) durations. As we simulate precipitation events in our RWT, only the equations for the wind-speed-dependent new-snow density ρns with concurrent snowfall are considered in our study. In Zwart (2007), a relationship between the wind velocity, air temperature, relative humidity and new-snow density used in SNOWPACK was derived by relating local weather station data to snow density measurements in an alpine catchment.
In Eq. (1), β0=3.28, β1=0.03, and β3=0.3 are constants; Ta is the air temperature [°C]; RH is the dimensionless relative humidity varying between 0 and 1; and V the wind velocity at 2 m height [m s−1]. In contrast, Liston et al. (2007) describe the evolution of the surface snow density during periods of precipitation as a function of the temperature-dependent new-snow density ρns plus a wind-related density offset for wind speeds >5 m s−1.
In Eq. (2), D1=25, D2=250 and D3=0.2 are constants; Twb is the wet-bulb air temperature [K]; and V is the wind speed at 2 m height [m s−1]. Another empirical description for the new-snow density affected by wind during precipitation events is implemented in the Crocus snow model (Brun et al., 1997; Vionnet et al., 2012), which is also expressed as a function of the wind speed V and the air temperature Ta.
In Eq. (3), Tfus is the temperature of the melting point for water; aρ=109 kg m−3, bρ=6 kg m−3 K−1 and cρ=26 kg m s are constants; and the minimal initial density is 50 kg m2 (Pahaut, 1975).
3.1 Atmospheric and flow conditions
The air temperature (Ta), relative humidity (RH) and wind speed (V0.4 m) are continuously measured and provide a basis for the surface snow microstructure analysis and discussion. The air temperatures typically increased by about 1–2 °C during an experiment due to turbulent energy dissipation in the flow and heat generated by the turbine (Fig. 2). The RWT is not sealed, and air is exchanged between the RWT and the cold lab mainly at the inlet where the fresh snow was poured into the RWT (Fig. 1a). The relative humidity typically increased significantly by about 5 %–10 % during the first 5–10 min of the experiments due to sublimation of snow particles in suspension and at the snow surface. Afterwards, an equilibrium situation is reached between sublimation and dry-air exchange between the RWT and the cold lab at the inlet, resulting in a rather stable or minor increase in RH until the end of the experiment. In Fig. 2, RH is shown with respect to ice and thus typically close to saturation during the second half of the experiments. The relative humidity of the cold room varies depending on how often people enter and leave the room during a day. In the morning, RH is typically low at around 40 %–50 %. Therefore, depending on the initial relative humidity before an experiment, a more or less strong increase in RH is obtained due to sublimation of the suspended particles (Dai and Huang, 2014).
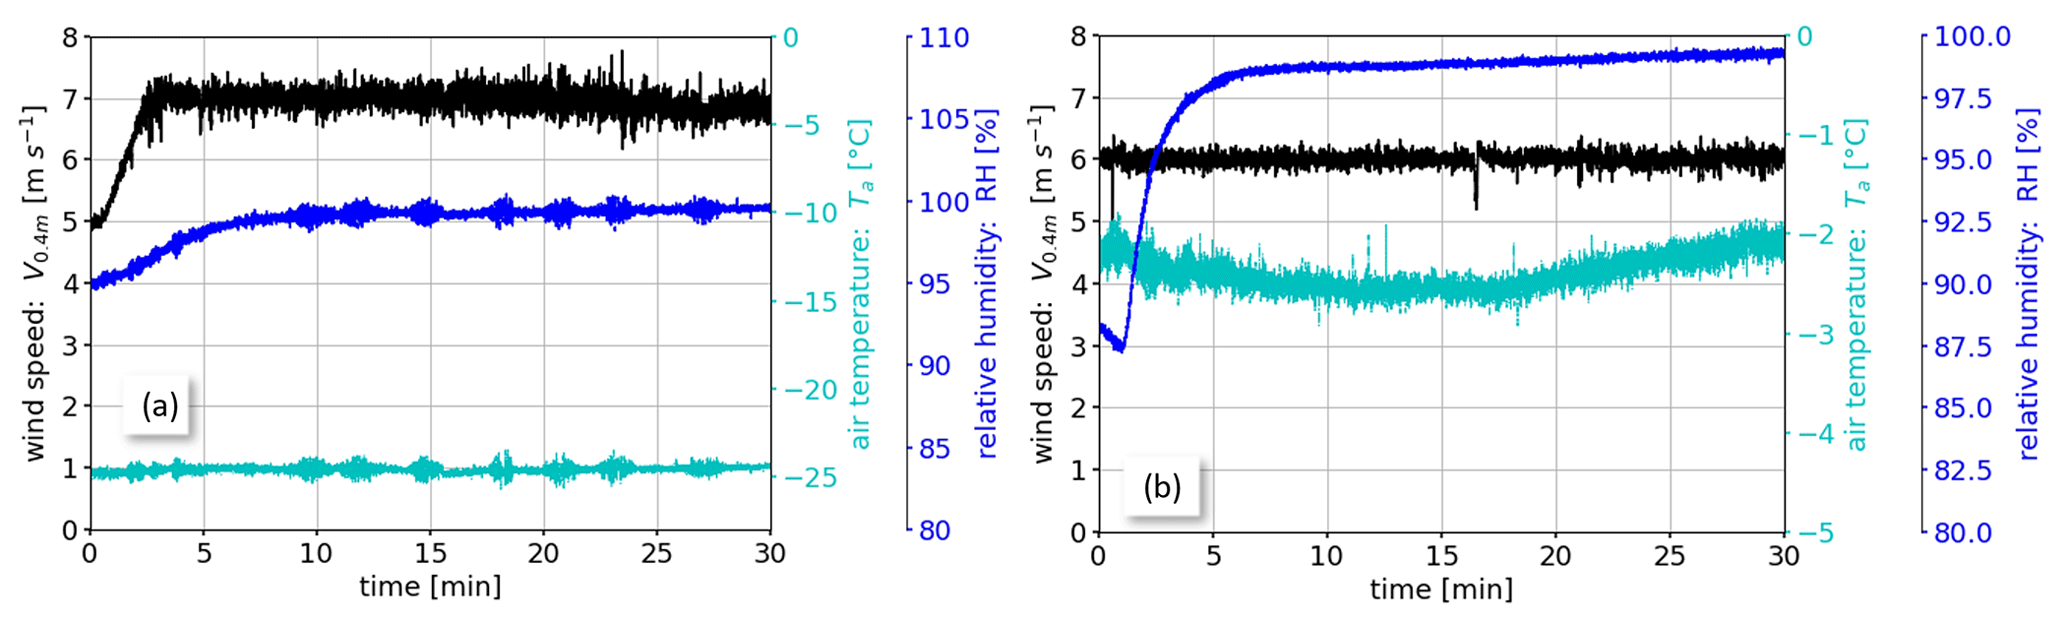
Figure 2(a) Evolution of the atmospheric conditions for Experiments (a) 2 and (b) 12 including the wind speed (V0.4 m), air temperature (Ta) and relative humidity (RH).
3.2 Particle transport characteristics
To compare the quality of our particle transport phase to previous studies of well-developed boundary layer flows, we address the consistency of particle transport and impact characteristics. A known limitation of the closed-circuit RWT is that the deflection of the flow in the curved sections and the small tunnel cross-section prevents the development of a stable logarithmic boundary layer flow (Sommer et al., 2017) which is indeed critical for flow properties. In contrast, for this study, it is important that the relevant particle transport properties, i.e., the particle impact angles and velocities in the saltation layer, are comparable to those of a fully developed natural boundary layer flow. These particle properties drive particle fragmentation, abrasion and sublimation and therefore the interaction with the microstructure of the ultimately deposited snow. We thus argue here that the boundary layer flow may not necessarily be perfectly homogeneous, stationary and well-developed, as long as the particle impact characteristics are consistent with those of a well-developed boundary layer flow as studied by Sugiura and Maeno (2000). Using the high-speed camera setup we measured particle impact angles, ejection angles and velocities for a wide range of different wind speeds (Experiment 13; Table 1).
An image sequence of a dendritic snow particle impacting a snow surface recorded with a high-speed camera is shown in Fig. 3 as an exemplary case. The incoming particle merely rotates before the impact (Fig. 3a). The vertical (Vin,y) and horizontal (Vin,x) particle velocities define the absolute impact velocity Vin. Figure 3b shows the situation at the time when the particle is in contact (impacting) with the stationary snow surface. The impact angle αin and the ejection angle αout are defined by the incoming and outgoing particle trajectories. Depending on the amount of energy that is dissipated or transformed on impact, the particle is ejected at a lower ejection velocity Vout (Fig. 3c). In this case, no fragmentation of the impacting particle happened; however, the ejected particle is strongly rotating after the impact. Additionally, two different fragments that are transported by the wind are shown in the three images of Fig. 3.
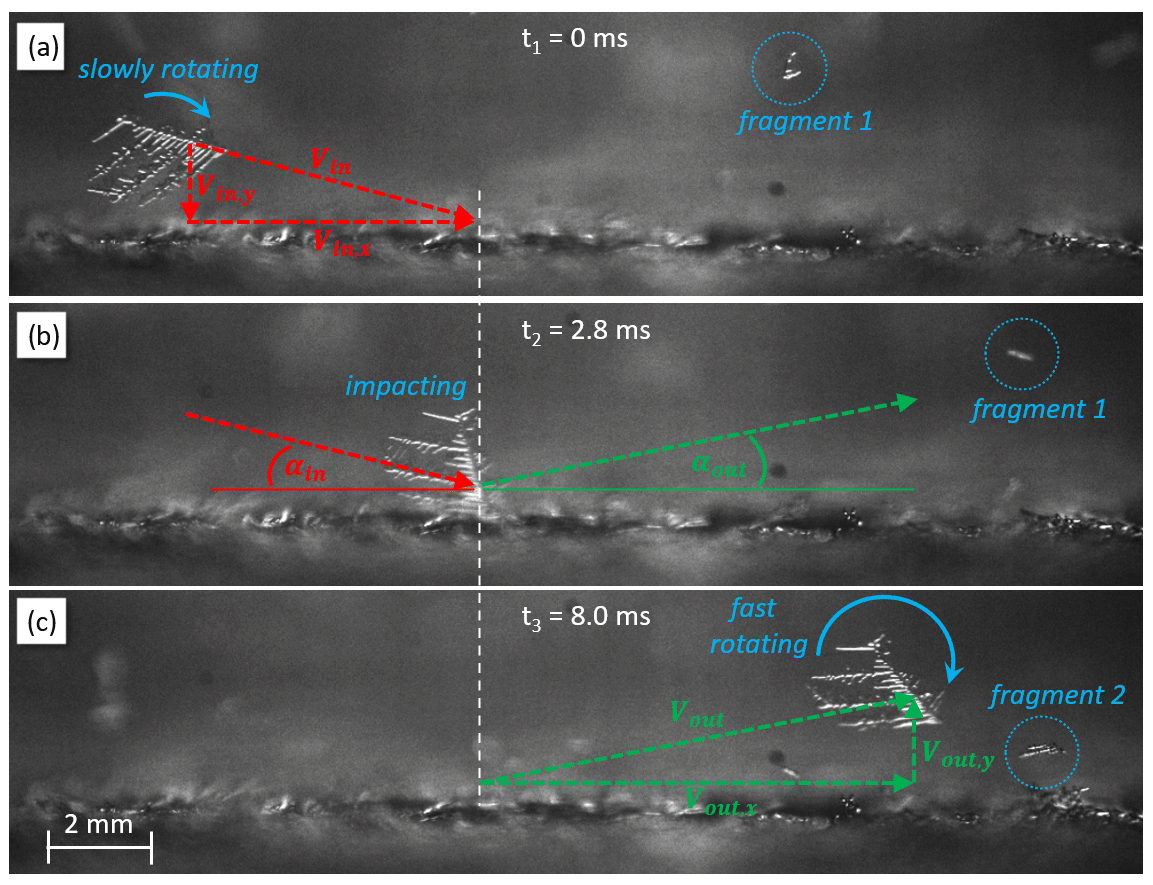
Figure 3High-speed camera recording of a dendritic new-snow particle impacting a snow surface for an experiment with a wind speed of V0.4 m=6 m s−1. (a) The particle slowly rotates before impacting the surface with an impact velocity Vin. (b) The particle impacts the surface at an impact angle αin and leaves the surface at an ejection angle αout. (c) The particle is ejected at a different, lower ejection velocity Vout and is fast rotating. Furthermore, two different fragments being transported by the wind are shown.
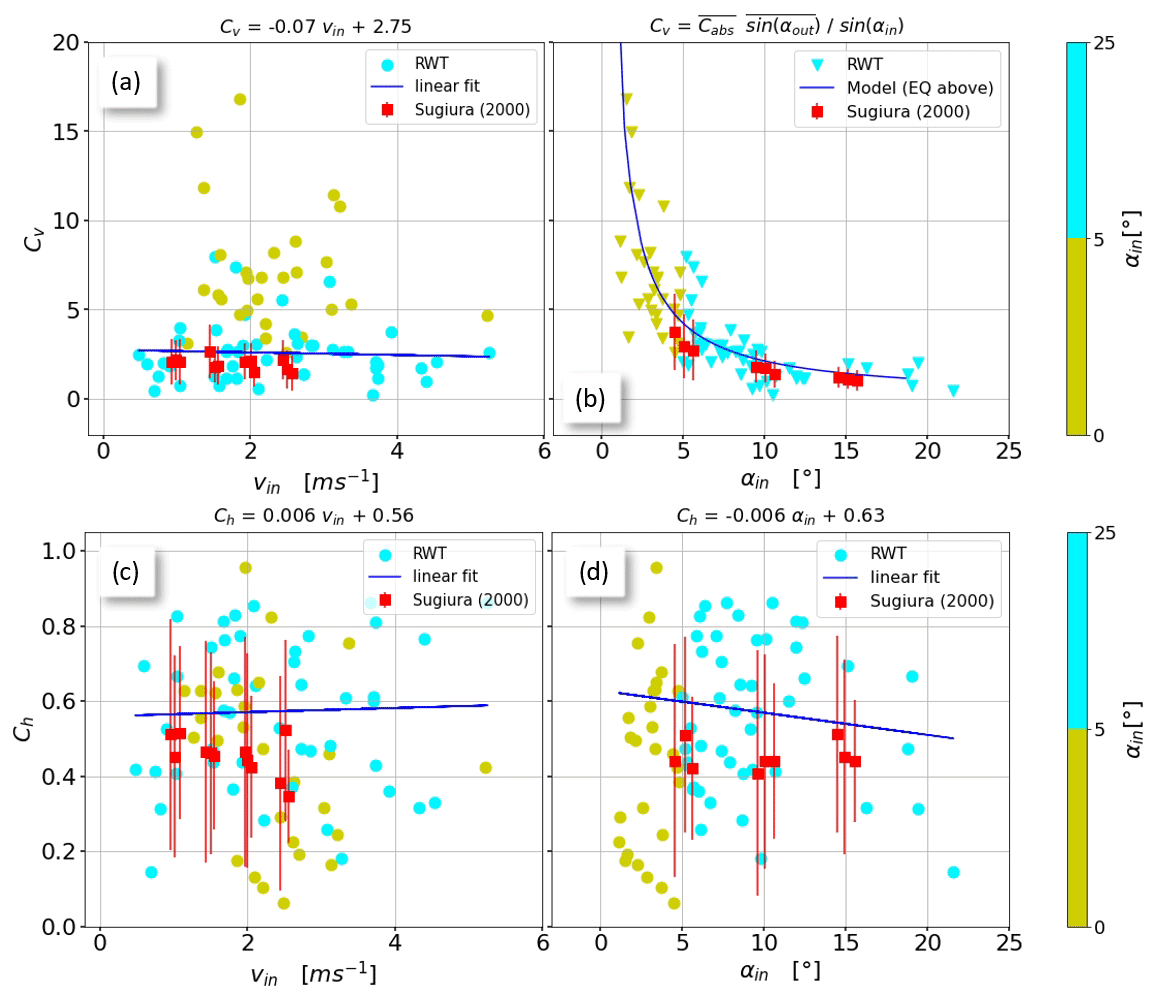
Figure 4Vertical Cv (a, b) and horizontal Ch (c, d) coefficients of restitution as functions of the impact velocity Vin (a, c) and the impact angle αin (b, d). Note that our RWT data are color-coded to visualize the agreement with Sugiura and Maeno (2000) for αin>5°.
The energy dissipation upon particle impact can be quantified through the apparent coefficients of restitution. The relevant collision quantities, the impact velocities (Vin≈1–5 m s−1), the impact angles (αin≈1–20°), and the vertical () and horizontal () coefficients of restitution (Fig. 4) compare well with those measured by Sugiura and Maeno (2000) in a large-scale boundary layer wind tunnel under well-developed and stationary flow conditions. The values for the vertical coefficient of restitution are in the range of Cv≈0.5–18 (Fig. 4a), which are slightly higher than those found by Sugiura and Maeno (2000), who measured values of Cv≈1–3. The reason for this difference is our high-speed camera setup that allowed for high-resolution images close to the ground (Fig. 3) and thus the detection of very low impact and ejection angles down to αin=1° (Fig. 4b), while the data of Sugiura and Maeno (2000) are limited to αin>5°. Particles with low impact angles and high ejection angles result in high vertical coefficients of restitution Cv (yellow dots in Fig. 4) and explain the difference to Sugiura and Maeno (2000). For Cv we find a clear dependence on the impact angle αin, similar to Sommerfeld et al. (2021), which can be cast into the form
Equation (4) is plotted in Fig. 4b with (Fig. 5b). For a better comparability of our horizontal and vertical coefficients of restitution with the results of Sugiura and Maeno (2000), the linear fits shown in Fig. 4a, c and d are limited to the collisions with αin>5°. Our horizontal coefficients of restitution span the same range of Ch≈0.1–0.9 (Fig. 4c–d) as those found by Sugiura and Maeno (2000). These collision quantities (Cv and Ch) define the forces acting on the dendrites or branches of the fresh snow particles during an impact and thus the degree of fragmentation (Comola et al., 2017).
To complete this impact analysis, we show in Fig. 5a that the average impact velocity Vin increases with increasing wind speed V0.4 m. Figure 5b demonstrates that, despite considerable scatter, the absolute coefficient of restitution Cabs slightly increases with wind speed V0.4 m. This implies that the total energy available for the densification processes – the normalized dissipated impact energy – – increases with wind speed (Fig. 5c). The p values for the statistical significance are p=0.011 (strong evidence; Fig. 5a), p=0.079 (weak evidence or trend; Fig. 5b) and p=0.0067 (strong evidence; Fig. 5c).
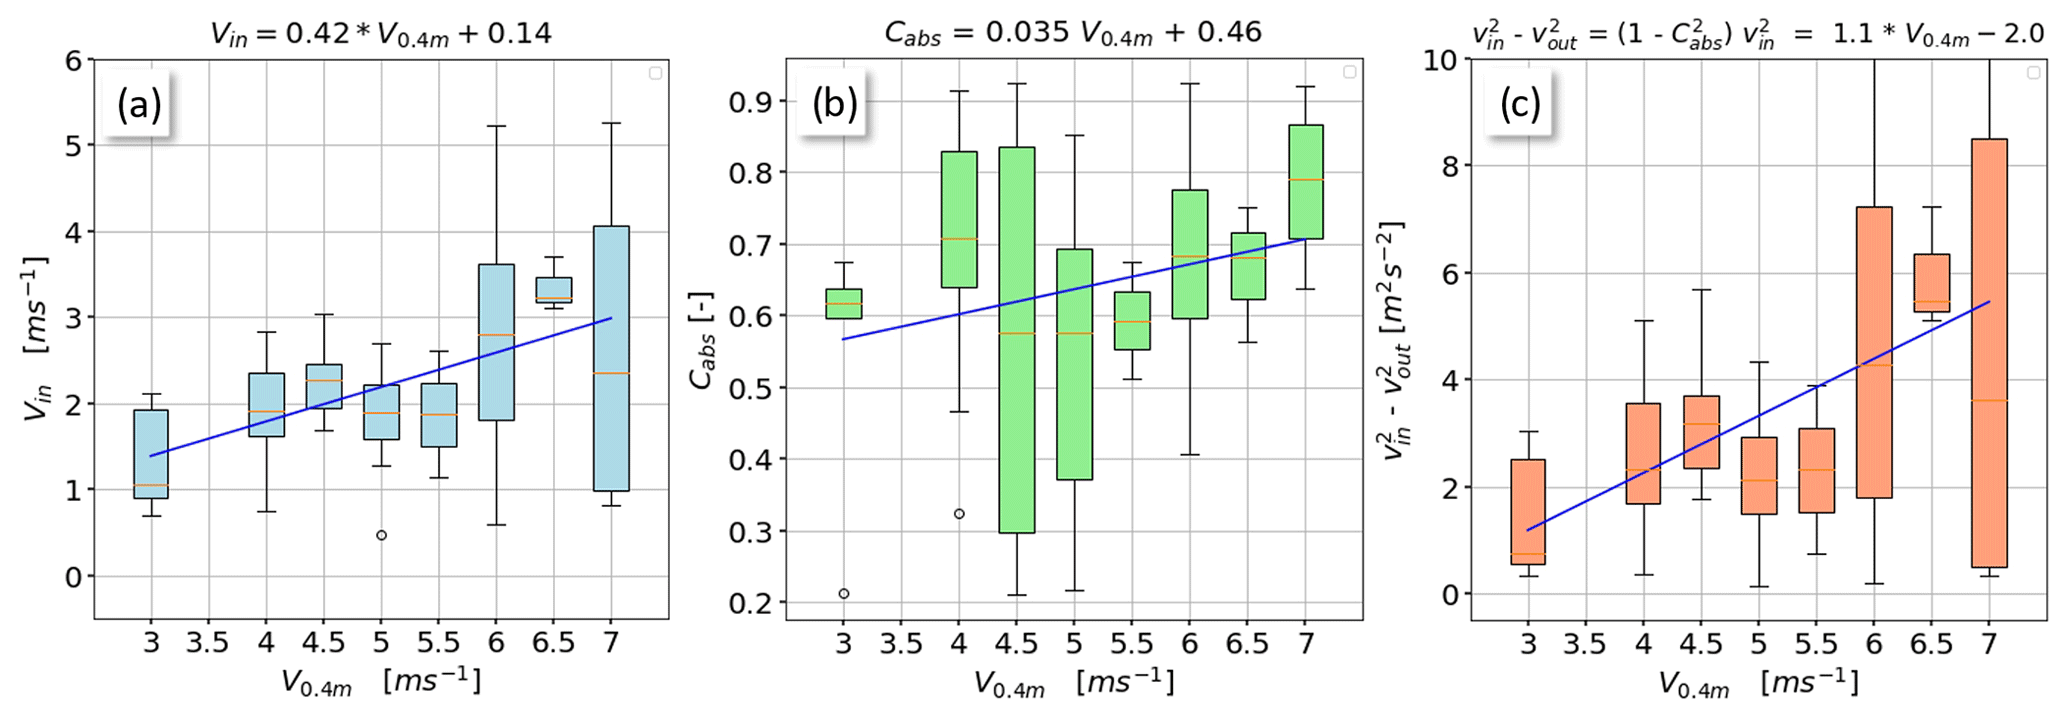
Figure 5(a) Particle impact velocity Vin, (b) absolute coefficient of restitution Cabs and (c) normalized dissipated impact energy – as a function of the RWT wind speed V0.4 m including linear fits.
A visual inspection of the saltation layer shows a typical saltation layer height of hsalt≈30–50 mm with a homogeneous particle distribution across the RWT cross-section in the straight test section (not shown here). Comparable saltation layer heights were measured for well-developed natural boundary layer flows in the large-scale wind tunnel using shadowgraphy imaging (Gromke et al., 2014). The particle concentration in the RWT also exponentially decreases with height as shown by the measurements of Yu et al. (2023) while studying snow cornice formation in the same RWT. In the curved sections, a large portion of the snow particles are transported along the outer wall due to centrifugal forces. The smallest particles are transported in suspension without contacting the snow surface and are partially blown out of the wind tunnel at the inlet. Overall, the results of this section emphasize that our boundary layer flow is sufficiently developed, which substantiates the feasibility of quantifying the effect of wind on the surface snow microstructure using the RWT.
3.3 Snow density and SSA measurements
An increase in snow density is measured for all experiments, while the magnitude of the increase depends on the flow and atmospheric conditions (Fig. 6a–b). The horizontal and vertical density variability across the wind tunnel width was measured with the density cutter for 2–3 profiles in the flow direction at the snow accumulation area (Fig. 1b), resulting in a total of 5–30 density measurements for each experiment depending on the amount and height of the snow accumulation. The initial new-snow densities representing snow deposited without wind (V0.4 m=0 m s−1) measured inside the snowmaker box ranged between 45–80 kg m−3 (Fig. 6a–b) and define the initial ice volume fraction ϕi0 for the calculation of the densification rates in the following figures. These initial densities increased after wind exposure to values ranging from 75–350 kg m−3, depending on the wind speed, air temperature and transport duration. An overall good agreement with strongly increasing densities for both the cutter (Fig. 6a) and the µCT (Fig. 6b) measurements is found for Experiments 5–12 where µCT measurements are available (Table 1). However, differences of up to 20 % between the individual experiments are attributed to general differences between the two methods as described in Sect. 2.3 and the spatial variability (Fig. 7), which is poorly represented by the single µCT sample of limited dimension.
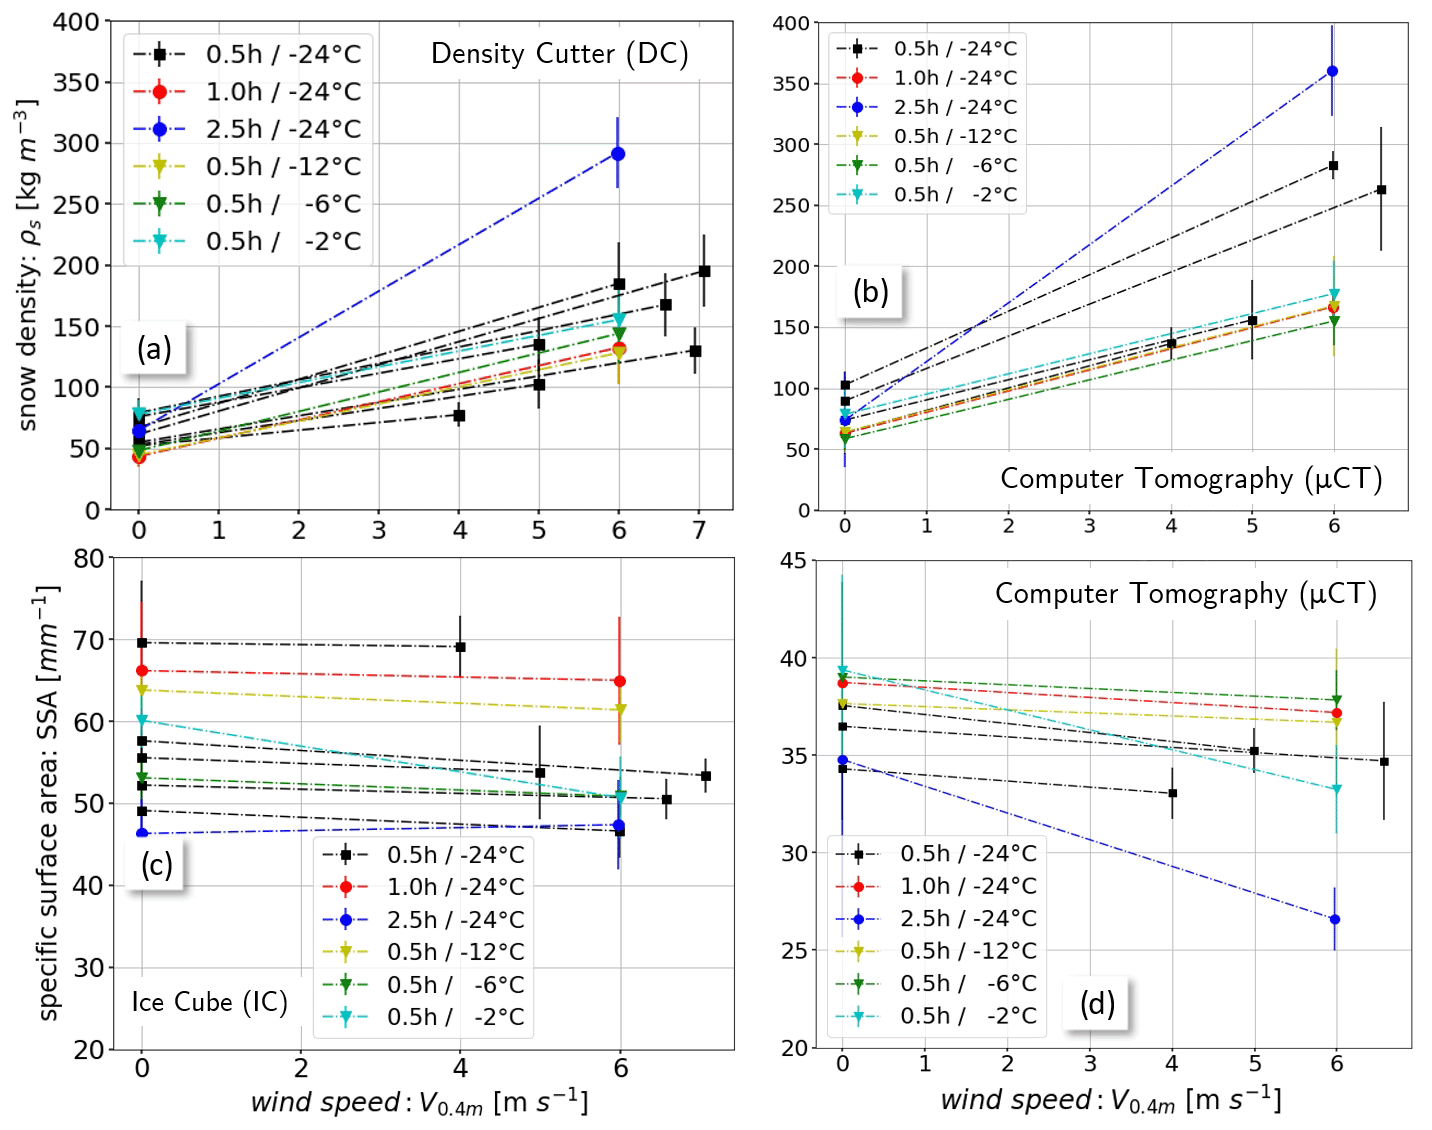
Figure 6Summary of the snow densities ρs measured with (a) the density cutter and (b) µCT, as well as the specific surface area (SSA) measured with (c) the IceCube instrument and (d) µCT as a function of the wind speed V0.4 m. V0.4 m=0 m s−1 corresponds to the initial new snow from the snowmaker box. The error bars indicate 1 standard deviation of the variability (including spatial variability) in the measurements. A different y scaling is used in (d) relative to (c) for a better visualization of the SSA changes for the µCT measurements.
The corresponding SSA values measured with the IceCube and µCT are shown in Fig. 6c–d, both indicating a reduction in the SSA values due to wind exposure. The initial new-snow SSA values range from 45 mm−1 < SSA < 70 mm−1 for the IceCube measurements, whereas lower values of 35 mm−1 < SSA < 40 mm−1 were measured with the µCT. The lower µCT values are partially the result of the µCT resolution with a voxel size of 18 µm as discussed in Sect. 2.3. Differences between IceCube and µCT measurements may also be based on other reasons like the µCT SSA computation algorithm or grain shape (Hagenuller et al., 2016). However, the relative changes (e.g., SSA rates in Fig. 11b) are consistent between the IceCube and µCT measurements. Because the aim of this study is the investigation of relative changes in the snow density and SSA induced by wind, the discrepancy in the absolute SSA values is not necessarily a problem but must be considered carefully for the interpretation of the results. The error bars in Fig. 6 include, besides systematic and statistical measurement uncertainties, also the spatial variability (Fig. 7) in the snow density and SSA in the accumulation area (Fig. 1b) for the density cutter and IceCube measurements. The error bars for the µCT measurements in Fig. 6b and d are derived from the standard deviation of the vertical density and SSA variability in the 3–6 cm high snow samples with 20–40 data points.
Figure 7 shows the vertical and horizontal density and SSA variations across the wind tunnel cross-section averaged for all experiments. The variability is first normalized by the mean for each experiment before an average of all 12 (10 for the SSA) experiments is calculated. The density varies by about ±25 % relative to the mean, with the lowest densities at the lower left of the vertical snow profiles, which corresponds to the inside wall of the RWT at x=4 cm. The wind velocities are lowest at this location where the first and thus least-fragmented snow accumulations with rather low densities appear. While the snow accumulations grow during the experiment, the densities tend to increase with height and towards the outer wall at x=16 cm. Increasing densities with height can be explained by the gentle slope that forms during the experiment facing the wind (Fig. 1b). Sommer et al. (2018) found increasing densities with increasing slope angle of the snow cover because of steeper snow particle impact angles and thus most likely enhanced fragmentation and higher packing densities.
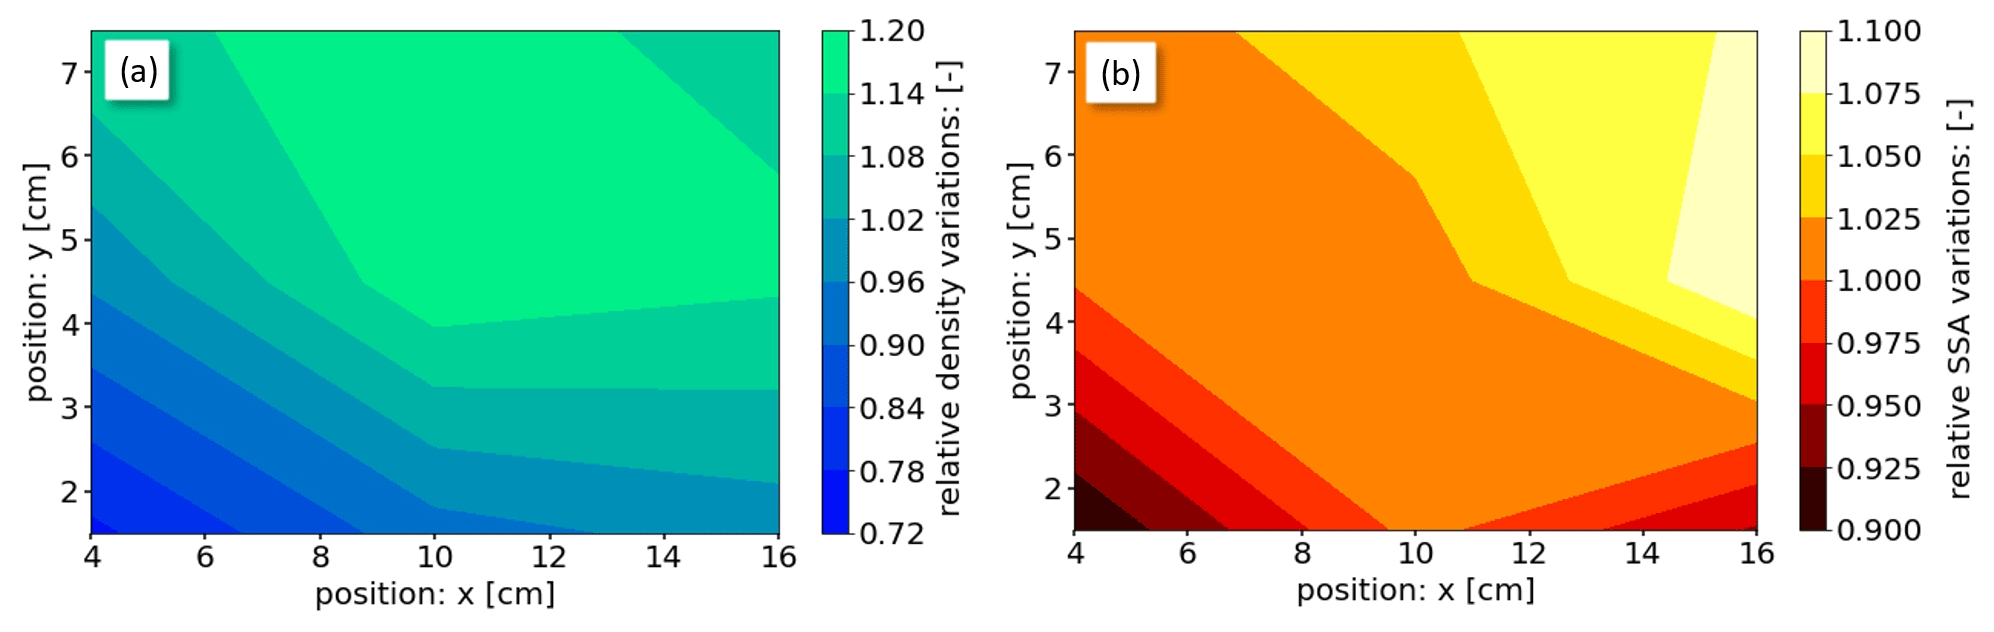
Figure 7Average of the spatial variability in (a) the snow density measured with the density cutter and (b) the SSA measured with the IceCube instrument. Position x=4 cm corresponds to the inside wall of the RWT, so the view is in the flow direction.
The spatial SSA variability is overall smaller compared to the density with ±10 % variation across the wind tunnel cross-section (Fig. 7b). The smallest SSA values are found at the lower left corner at x=4 cm, while the SSA increases towards the upper right. One explanation could be that initially the smallest fragments sublimate due to the low relative humidity (Fig. 2) and that the largest particles from the added new snow accumulate first, resulting in initial snow accumulations with a rather low SSA. However, the measured spatial SSA variability is of the same order of magnitude as the SSA measurement uncertainty (Sect. 2.3).
3.4 Snow densification rate
The snow densification rate describes the temporal increase in density relative to the initial snow density and is defined as ϕrate= (ϕi−ϕi0) (ϕi0 Δt), where ϕi0 is the initial and ϕi the final ice volume fraction after a time duration Δt when snow transport occurs. To understand the origin of snow densification we consider the kinetic energy loss by impacting particles which can only be transformed into rotational kinetic energy (Fig. 3), friction (heat), bed compression, or abrasion and fragmentation. Rotation and friction (heat) cannot be responsible for densification. The pressure that saltating particles exert on the snow surface resulting in bed compression can be estimated from the particles momentum difference before and after the impact. An upper limit for this pressure estimate includes the assumptions of ice spheres of 0.5 mm diameter, purely vertical impacts, a maximum velocity difference of 3 m s−1 before and after the impact, and 10 impacts per square centimeter and second. The maximum pressure estimate of 0.02 Pa is too low to result in a significant bed compression and thus snow densification when being compared to the pressure of 133 Pa that was applied to a snow surface during the compaction experiments of Schleef et al. (2014a). Therefore, fragmentation and abrasion resulting in smaller fragments (e.g., dendrites broken off from new snow crystals) and thus higher packing densities (Parteli et al., 2014) are assumed to be the major processes behind wind-induced surface snow densification. This conclusion is also supported by the findings of Sato et al. (2008), showing that snow flakes are completely decomposed when impacting a surface for wind speeds >5 m s−1 during precipitation.
3.4.1 Dependence on wind speed and involved mechanisms
Figure 8 summarizes the densification rates for the experiments with different wind velocities (Table 1) which are derived from the averages of the density cutter and the µCT measurements weighted by their sampling volume. Furthermore, Fig. 8 includes model predictions and model fits to our RWT data using the theoretical descriptions from the SNOWPACK, SnowTran-3D and Crocus models (Eqs. 1–3). The densification rates for the experiments (black squares in Fig. 8) show an increase with increasing wind speed from ϕrate=1.3–4.3 h−1. These rates are 2 to 3 orders of magnitude higher than those measured for isothermal metamorphism by Schleef et al. (2014a), which underlines the effect of wind.
Comola et al. (2017) showed with simulations that the average fragment size decreases and the number of fragments increases with increasing particle impact velocities Vin. As Vin was found to increase with increasing wind speed V0.4 m (Fig. 5a), we assume that also in our case the average fragment size decreases and the packing density increases with increasing wind velocity V0.4 m, thus being responsible for the observed densification rate increase shown in Fig. 8. Furthermore, stronger fragmentation at higher wind velocities requires higher impact energies being dissipated by plastic deformation of snow crystals. To test this assumption, and therefore also the simulated results of Comola et al. (2017), the dissipated impact energy is estimated by calculating the normalized kinetic energy difference = () before and after the particle impacts. Figure 5c shows that the dissipated impact energy increases with increasing wind velocity V0.4 m (despite an increase in the absolute coefficient of restitution shown in Fig. 5b), likely resulting in smaller fragments, higher packing densities and thus stronger densification. The quality and resolution of the high-speed camera recordings did not, however, allow for analyzing fragmentation from individual particle impacts.
In the curved sections, the particles are transported within a few centimeters' distance from the vertical RWT outer wall. The visually identified modes of transport were a mixture of bouncing (saltation), rolling and sliding along the wall, thus similar to saltation at the horizontal snow surfaces at the straight sections. The particle transport along the curved side walls is inevitable for a compact closed circuit wind tunnel in a cold laboratory of limited dimensions. The centrifugal forces acting on snow particles in the curved section were estimated to be 1 to 2 orders of magnitude smaller compared to the forces acting on the snow particles during surface impact while saltating. The maximum centrifugal force was calculated as µN for a large spherical snow particle of 0.5 mm diameter with a mass of mp=0.06 mg, a maximum horizontal velocity of vp=6 m s−1 (V0.4 m≈7 m s−1) and the RWT radius of the curved section of r=0.5 m. Horizontal snow particle velocities in snow saltation layers can be approximated as being about 1–2 m s−1 lower than the mean horizontal wind speed (Nishimura et al., 2014). The maximum impact force can be calculated as Fi = µN, where ΔEk is the kinetic energy difference before and after an impact of a similar snow particle of mass (mp=0.06 mg) estimated from Fig. 5c as ⋅ () m2 s−2 at the same wind speed of V0.4 m=7 m s−1. An unknown parameter in this estimate is the height h, which defines the particle penetration distance into the snow surface. For small h equal to the particle diameter, the particle impact force is about 2 orders of magnitude larger than the centrifugal force according to the values above. For increasing penetration distances h (depending on the snow surface elastic or plastic deformation potential), the impact force decreases but is still 1 order of magnitude larger than the centrifugal force even for h equal to 8 times the particle diameter. We conclude that centrifugal forces in the curved section are negligible compared to surface impact forces for our RWT experiments.
Besides the centrifugal forces along the curved side walls, the first impact of snow particles against the vertical, curved side walls after the straight sections introduces additional unnatural mechanical stress on the snow particles, potentially affecting fragmentation. The above-introduced estimate of the impact force Fi onto the horizontal snow surface is based on impact characteristics determined from the particle tracking measurements – data that are not available for the first impacts at the curved sections. Therefore, we can only provide a discussion of potential differences that may increase or decrease the wall impact force relative to the snow surface impact force. The impact angles of the snow particles' first impact against the side walls were calculated (based on geometrical considerations) to be within a range of 5–25°. These angles are comparable to the observed impact angles αin on the horizontal snow surface in the straight test section (Fig. 4b and d). The maximum particle impact velocities into the side wall can again be estimated as being 1–2 m s−1 lower than the mean horizontal wind speed, thus about vp=5–6 m s−1 (V0.4 m≈7 m s−1). These maximum impact velocities are comparable to the maximum impact velocities Vin on the horizontal snow surface (Fig. 5a). Geometric vector analysis revealed similar wall-normal velocity components for the snow and the curved-wall impacts. While the impact angles and velocities are similar, the hard wooden surface of the curved side walls likely increases the impact force relative to the snow surface. Contrarily, the smooth surface of the side walls is assumed to reduce the ejection angle and increase the ejection velocity compared to a snow surface impact, resulting in a decrease in the normalized dissipated impact energy (Fig. 5c) and impact force. The impact angle and the impact force may further be reduced by the particles’ ability to follow the flow. Smaller particles (<100 µm) have a good flow-following behavior (Huang and Wang, 2015), resulting in a reduction in the impact angles and thus forces. Conversely, larger particles (>300 µm) have a poor flow-following behavior, resulting in a minor reduction in the impact angle and force. An estimate of the particle size distribution for our experiments (Sect. 3.6.1, Fig. 12a) reveals that the majority of our snow particles are of a size smaller than 200 µm, indicating that our particles likely experienced a significant reduction in the impact angle and thus force relative to the impacts analyzed based on purely geometrically calculated impact angles. We conclude that these first difficult to quantify particle impacts at the curved side walls after a straight test section introduce some uncertainty but result in similar or in the worst case slightly higher impact forces compared to snow surface impacts. Based on the above discussion, we assume that the mechanical stresses affecting the snow particles in the curved section are comparable to real, natural snow transport situations. A more in-depth analysis of the wall impact forces would require detailed simulations or particle tracking measurements, which is beyond the scope of this work.
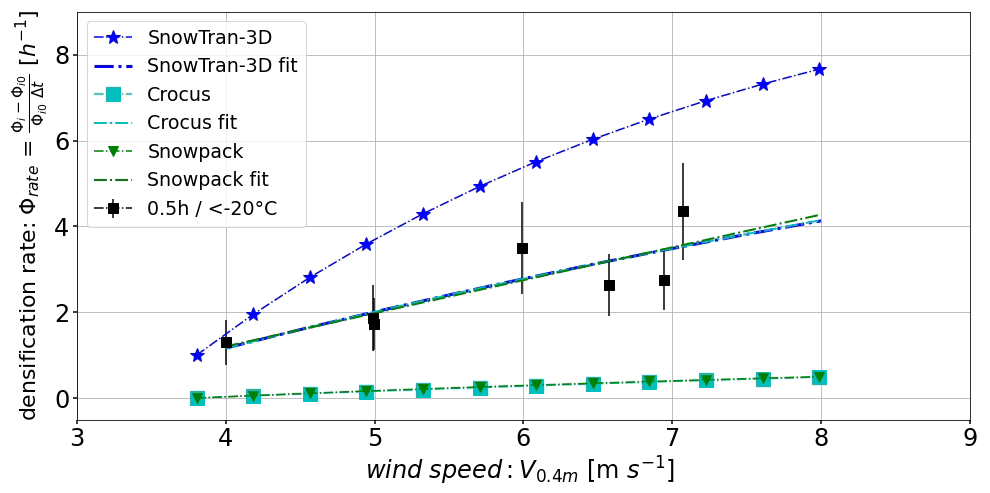
Figure 8Densification rate as a function of wind speed for Experiments 1–7 with constant air temperature ( °C) and experiment duration (τexp=0.5 h) including the results of the SnowTran-3D, SNOWPACK and Crocus model predictions and model fits to our experiments.
3.4.2 Comparison to models
Our data facilitate a direct comparison with the predictions from SNOWPACK (Eq. 1), SnowTran-3D (Eq. 2) and Crocus (Eq. 3). All three models (Fig. 8) predict an increase in the densification rate with wind speed; however, they significantly differ from each other and from our measurements when the original parameters are used. Our measured densification rates fall right in between the range of values predicted by the models.
All models are parameterized from field measurements, where simultaneous flow and microstructure measurements in unstable wind conditions with intermittent snow transport are difficult. The SNOWPACK model was parameterized based on data collected at an alpine catchment close to Davos, Switzerland (Weissfluhjoch, 2544 m altitude). The density of the topmost 3 cm of new snow was regularly sampled during different snowfall events, resulting in a temporal resolution of one sample per 0.5–1 h depending on the precipitation intensity. This is comparable to the timescale of our experiments with τexp=0.5 h (Fig. 8). The SnowTran-3D model was parameterized based on data collected at rather smooth hills at a different climate in the USA. We did not find any information on the timescales of the data set used for the SnowTran-3D parameterization (Liston et al., 2007). However, the higher densification rates predicted by the SnowTran-3D model (Fig. 8) may result from different timescales, atmospheric conditions or additional transport in the absence of precipitation involved in the measurements they used for their parameterization. The parameters in Eq. (3) for the Crocus model originate from a study carried out by Pahaut (1975) at Col de Porte (1325 m altitude, French Alps). Unfortunately, no information on these measurements could be found.
We conclude that the differences between the models and our measurements are mainly the result of the estimated timescale (Δt) used for the calculation of the densification rates (Fig. 8). The new-snow densification parameterizations (Eqs. 1–3) do not contain any temporal component at all, although the measurements they are based on involved some timescales. However, densification of new snow under windy conditions during precipitation events depends not only on the wind speed but also on an effective transport duration (τt) of individual precipitation particles, which is mainly governed by the precipitation intensity and particle cohesion as discussed below. We used a timescale of Δt=0.5 h for calculating the densification rates for our experiments and all three models (Fig. 8). This timescale is at least appropriate for the SNOWPACK model and our measurements. That the SNOWPACK model nevertheless predicts significantly lower densification rates might be the result of lower precipitation rates during their field measurements resulting in longer effective transport durations τt as discussed in the following section (Fig. 9a). The discrepancy for the two other models (SnowTran-3D and Crocus) is likely also the result of different timescales Δt involved in their measurements used for the model parameterization. Changing Δt from 0.5 to 1 h for the SnowTran-3D model and to 0.1 h for SNOWPACK and Crocus already results in reasonable agreement of the models with our measurements, highlighting the strong dependency of the model on involved timescales. Additional discrepancies between the model descriptions and our measurements may arise from the fact that we did not consider additional compaction of surface snow layers due to wind when using the models (Fig. 8) because our RWT simulations are similar to the field measurements used to parameterize the wind-speed-dependent new-snow density in the models. This highlights the problem of overlapping processes, where wind compaction during precipitation may be treated twice in the models: once within the description of the wind-speed-dependent new-snow density (Eqs. 1–3) and once during additional wind compaction of surface layers. We conclude that a clearer separation in snowpack schemes may improve future model attempts of wind-induced snow compaction, where the snowfall density only depends on temperature and humidity (to indirectly represent the variability in falling hydrometeors) and all the wind-related processes are treated by a well-calibrated wind compaction routine. Overall, the discrepancies between the models and our measurements can be attributed to poorly defined timescales; different precipitation intensities; different initial precipitation particles, particle cohesion and local topography; and climate conditions. This highlights the importance of more detailed physical descriptions of snow densification.
For completeness, we re-parameterize all three models by fitting them to our RWT data (Experiments 1–7; Table 1). We obtain the following parameters: β0=2.16, β1=0.034, and β3=0.97 for the SNOWPACK model (Eq. 1) using the default “ZWART” parameterization (Zwart, 2007) and D1=17, D2=250 and D3=0.06 for the SnowTran-3D model (Eq. 2). The following parameters aρ=43 kg m−3, bρ=9 kg m−3 K−1 and cρ=35 kg m s were obtained for the Crocus model when fitting Eq. (3) to our data. Minimum air temperatures of °C (Crocus) and °C (SnowTran-3D) had to be used for these model fits instead of the actual air temperature °C measured during Experiments 1–7 (Table 1) because the models result in unrealistic values (negative densification rates) for lower air temperatures. However, Fig. 9b in our paper shows that the densification rate tends to be temperature independent below approximately °. Therefore, the fit parameters for the Crocus model are only considered to be valid for V0.4 m>3.8 m s−1 in Eq. (3), which corresponds to a wind speed of 5 m s−1 at a height of 2 m with an aerodynamic roughness length of z0=0.24 mm for fresh snow as determined by Gromke et al. (2011).
The current separation into precipitation and no-precipitation events in the three models as discussed in Sect. 2.4 results in a gray zone where processes may overlap. New, temporally highly resolved models may aim for more physically based descriptions of these processes. Therefore, a particle-shape-based parameterization of the density and SSA as proposed in Crocus (Vionnet et al., 2012) based on dendricity and sphericity in combination with an effective particle transport duration τt would likely be beneficial to simultaneously cover precipitation and no-precipitation events in future modeling attempts. However, these parameters are very difficult to measure and quantify experimentally, which is probably the reason why current snow models prefer using simple empirical correlations instead of physically based process descriptions.
3.4.3 Sensitivity to duration and temperature
The measurements with different experiment durations (Experiments 8–9, τexp=1 and 2.5 h; Table 1) and air temperatures (Experiments 10–12, , −6 and −2 °C; Table 1) were conducted at a wind speed of V0.4 m=6 m s−1 and span a range of densification rates from 1.5 h h−1 (Fig. 9). An effective transport duration τt can be interpreted as the average time individual snow particles are effectively transported by the wind, whereas the experiment duration τexp (Table 1) is defined as the time during which one box of new snow is slowly added to the wind tunnel simulating precipitation. Therefore, an increasing τexp can thus be interpreted as a decreasing precipitation rate. The transport duration τt is difficult to quantify for these experiments. However, τt is a function of τexp, so τt can be indirectly controlled by varying the time a box of snow is slowly added to the RWT and thus by τexp. By reducing this “precipitation rate” for Experiments 8 (τexp=1 h) and 9 (τexp=2.5 h), the effective transport duration τt of individual snow grains is increased as they are exposed longer to the wind before ultimately being deposited and covered by additional new snow, which was argued to be an effect of additional fragmentation.
The decrease in the densification rate with experiment duration (Fig. 9a) would be consistent with this: fragmentation should be high initially and decrease with time, since the most fragile particles break first. If thus fragmentation controls densification, a decrease in the rate as a function of transport duration can be expected, as observed in Fig. 9a. A simple two-parameter fit of a function inversely proportional to the experiment duration (similar to the definition of the ϕrate) is applied to the data in Fig. 9a, resulting in
with A1=1.30 and B1=0.80 h−1, simply to represent the three data points in the experimental range with a two-parameter fit. On physical grounds, the densification rate should tend to zero instead for very long times, which would require more data points to obtain a reasonable fit. However, the good fit of the reciprocal function (Eq. 5) indicates that the time τexp (experiment duration) governs the decrease in the densification rate and not the change in ice volume fraction.
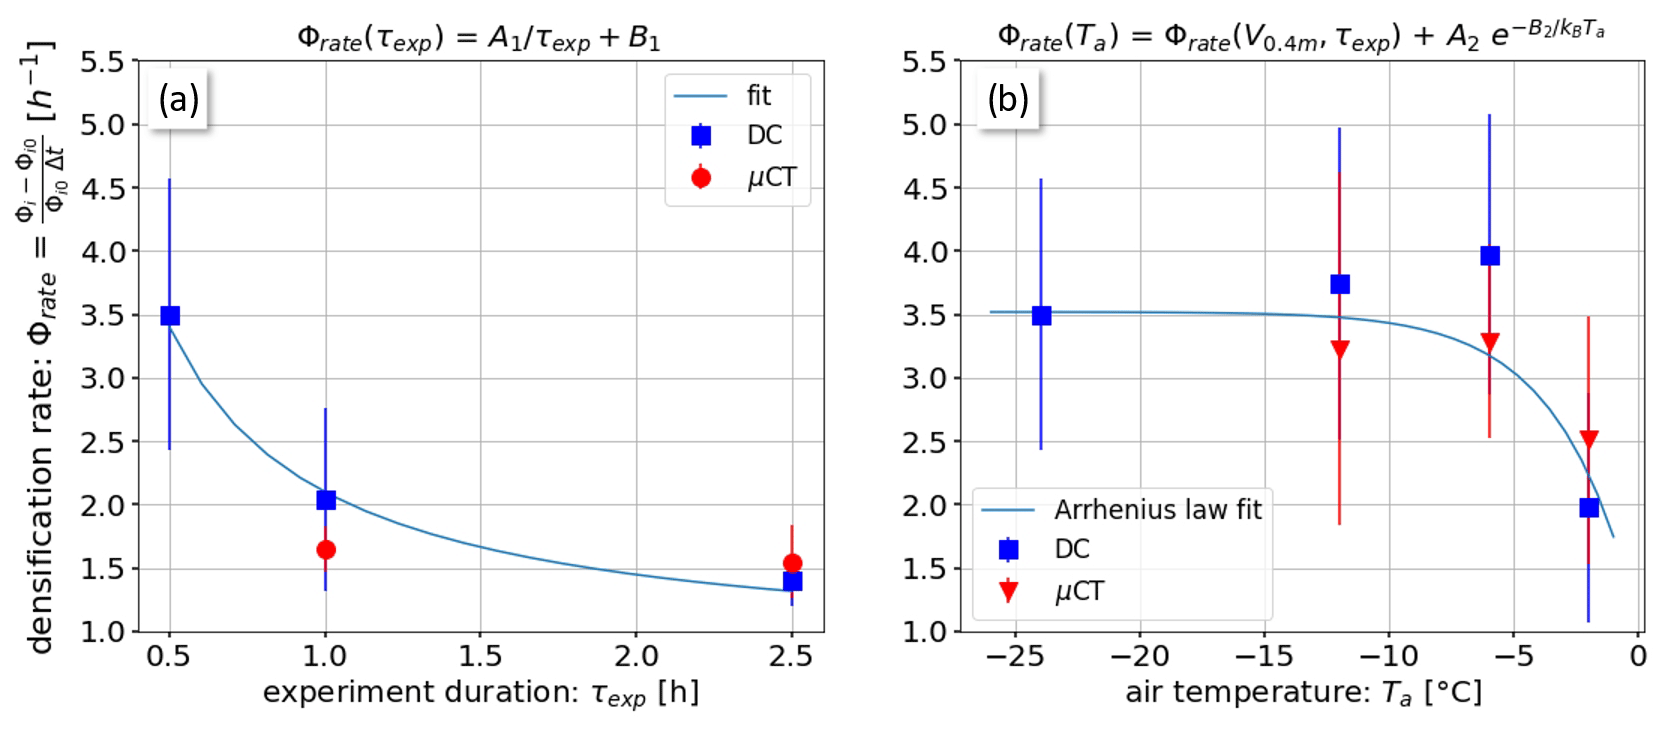
Figure 9Densification rate as a function of (a) the experiment duration τexp and (b) the air temperature Ta including fits.
The temperature dependence of the densification rate shows little or no trend for temperatures below °C (Fig. 9b) with values of ϕrate≈3.5 h−1, while it significantly drops to ϕrate≈2.2 h−1 for higher air temperatures of °C (Experiment 12). Cohesion of the snow particles drastically increases for °C as shown by the angle of repose experiments performed by Willibald et al. (2020) and Eidevåg et al. (2022). We hypothesize that cohesion and sintering at higher air temperatures inhibit snow particle transport, saltation, and thus fragmentation and snow densification. This hypothesis cannot be proven based on our RWT experiments presented in this study. However, for another RWT study, we simulated precipitation while continuously increasing the air temperature from to +2 °C. We found that the particle mass flux in the saltation layer gradually decreased and entirely stopped at around −0.5 to 0 °C due to strong cohesion between the new snow crystals on the ground resulting in low-density snow accumulations. As in Willibald et al. (2020), we can assume an Arrhenius form for the temperature dependency of the densification rate:
where ϕrate (V0.4 m=6 m s−1, τexp=0.5 h) = 3.5 h−1 is the mean initial densification rate for °C, h−1 and B2=2.06 eV are constants, and eVK−1 is the Boltzmann constant; thus the air temperature in kelvin must be used in Eq. (6). While the inferred parameterization ϕrate=f(Ta) is based on limited data and a limited range of parameter validity, the data highlight a similar temperature effect in wind-deposited snow observed here and ballistically deposited snow governing the angle of repose (Willibald et al., 2020).
3.5 SSA rate
The impact of wind speed, transport duration and air temperature on the SSA rate, defined as SSArate = (SSA–SSA0)(SSA0 Δt), is discussed in this section in analogy to the densification rate.
3.5.1 Dependence on wind speed and involved mechanisms
Figure 10 shows that the SSArate increases in absolute values from SSA h−1 to SSA h−1 with increasing wind speed (V0.4 m=4–7.1 m s−1). Although the SSA decrease is generally small relative to the error bars (Fig. 6c–d; partially due to the spatial SSA variability; Fig. 7b), the data point for V0.4 m=7.1 m s−1 confirms a significant deviation from SSArate=0 h−1. These rates are up to 1 order of magnitude higher than the rates (SSA h−1) found by Schleef et al. (2014a) for isothermal metamorphism. Our result substantiates the findings of Cabanes at al. (2003), who found wind to increase the rate of SSA decrease, which was not further quantified in their study due to limited data.
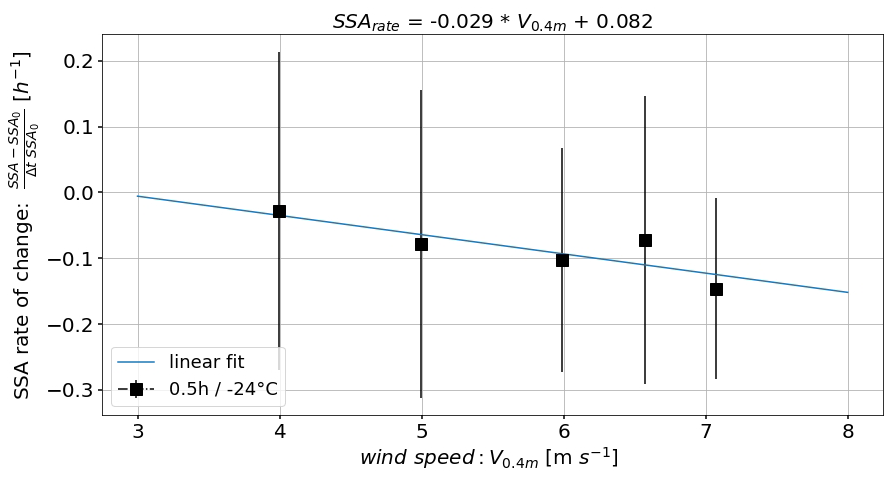
Figure 10SSArate as a function of wind speed V0.4 m for Experiments 3–7 (Table 1) including a linear fit.
Fragmentation of dendritic crystals cannot cause the measured reduction in the SSA because the resulting additional surfaces would lead in an increase in the ice surface and thus the SSA. Different mechanisms remain that may be responsible for the SSA decrease. (i) First is sublimation, in which some of the smallest fragments and dendrites entirely disappear because of sublimation (Groot-Zwaaftink et al., 2013). This assumption is supported by the increase in relative humidity as shown in Fig. 2. (ii) Second is vapor re-deposition, in which recrystallization of humidity at the surface of suspended snow particles likely results in an average grain growth similar to isothermal metamorphism of new snow (e.g., Schleef et al., 2014a). These first two mechanisms we refer to as “airborne snow metamorphism”, in analogy to sublimation and re-deposition processes occurring in isothermal deposited snow. (iii) Particle separation, whose effect has not yet been documented for snow, however, likely occurs when larger fragments remain in saltation close to the snow surface (Fig. 3), whereas the smallest fragments transition into suspension (Nishimura and Nemoto, 2005), forming a blowing snow layer (Palm et al., 2017). In the field, these small blowing snow particles may disappear due to sublimation or being blown out of an area of interest (Palm et al., 2017). In a non-sealed RWT, small particles may be also blown out at the inlet (Fig. 1a). Thin layers of fine snow dust were found after the experiments outside the RWT in proximity to the inlet (Fig. 1a), supporting particle separation occurring in our experiments.
The minor, potentially linear increase in the negative SSA rates (in absolute values) in Fig. 10 suggests an amplification of the assumed processes above of airborne metamorphism and particle separation with increasing wind speed. We argue that higher airborne particle concentrations at higher wind speeds allow an increasing number of particles experiencing airborne metamorphism. Higher mass fluxes also result in an increasing number of smaller particles in higher air layers (Walter et al., 2017) that may partially be blown out of the inlet, thus likely resulting in intensified particle separation. These processes are further analyzed based on additional sensitivity experiments introduced and discussed in Sect. 3.6.
3.5.2 Sensitivity to duration and temperature
The SSArate for the different experiment durations (Experiments 8–9, τexp=1 and 2.5 h) and air temperatures (Experiments 10–12, , −6 and −2 °C) span a range of −0.3 h−1 < SSArate<0.01 h−1 (Fig. 11). Regarding the dependency of SSArate on the experiment duration τexp (Fig. 11a) a mean value of SSA h−1 is found. Due to the limited data and the relatively large error bars, no firm conclusion can be drawn on the dependency of SSArate on the experiment duration τexp based on Fig. 11a. However, a supplement experiment introduced in Sect. 3.6.2 demonstrates a distinct effect of airborne snow metamorphism on the SSA decrease and its dependency on the effective transport duration τt.
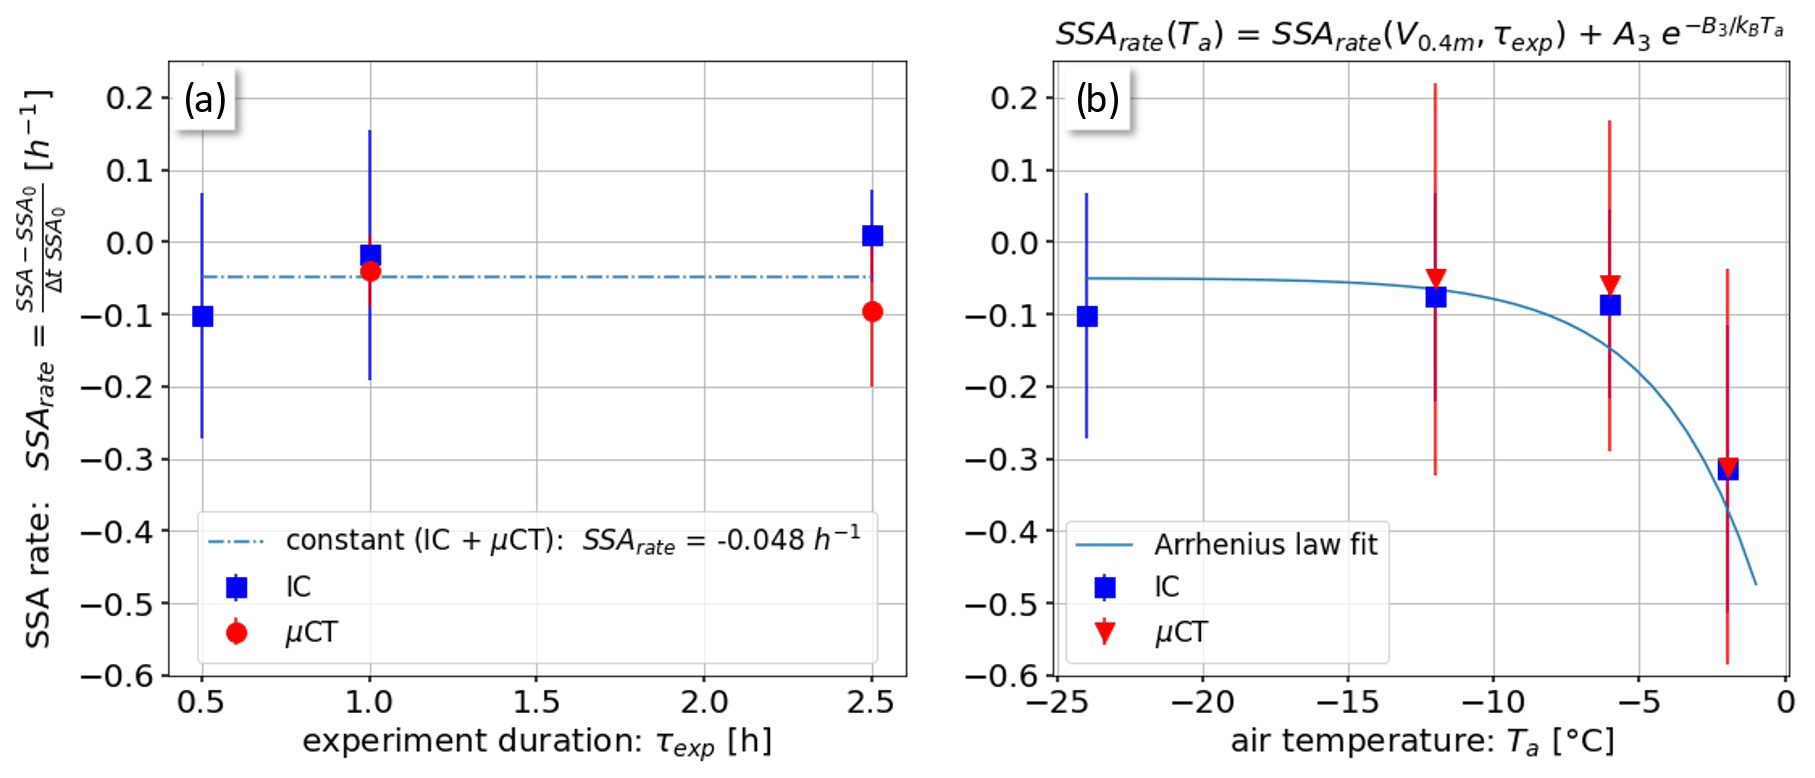
Figure 11SSArate as a function of (a) the experiment duration τexp and (b) the air temperature Ta including an exponential fit.
A different picture appears for the dependency of the SSArate on the air temperature Ta (Fig. 11b), where a constant value of SSA h−1 is measured for °C, while a significant drop to a value of SSA h−1 is measured for Experiment 12 at °C. Despite the rather large error bars (see Sect. 3.3), the significant change in SSArate for °C has individually been measured by two independent instruments, with good agreement between the SSArate values determined from the IceCube (blue squares) and the µCT (red triangles) measurements. While stronger cohesion was likely the reason for the reduced densification rate ϕrate for °C (Fig. 9b), enhanced sublimation (Palm et al., 2017) and vapor re-deposition at higher air temperatures may explain intensified airborne snow metamorphism and thus a stronger reduction in the SSA values in this case (e.g., Harris et al., 2023). Like for the densification rate (Eq. 6), we assume an Arrhenius form (Willibald et al., 2020) for the temperature dependency of the SSA rate:
where SSArate (V0.4 m=6 m s−1, τexp=0.5 h) h−1 is the mean initial SSArate for °C, h−1 and B3=1.8 eV are constants, and the air temperature Ta in kelvin must be used in Eq. (7). Whether the proposed parameterization of Eq. (7) is valid for different wind speeds V0.4 m, experiment durations τexp and relative humidity RH must be tested in future studies. Similar results of a decreasing SSA with increasing wet-bulb air temperature were found by Yamaguchi et al. (2019) for precipitation particles under low wind conditions, while also Schleef et al. (2014a) found that the SSA decay increased with higher air temperatures for isothermal snow metamorphism.
3.6 Particle separation and airborne snow metamorphism
To further substantiate the previous hypotheses that airborne snow metamorphism and particle separation play a role in the evolution of the SSA under the influence of wind, we provide sensitivity evaluations.
3.6.1 Particle separation
For Experiment 9 we also collected some of the accumulated dust outside of the RWT for µCT analysis, in addition to the initial snow and the snow deposited in the RWT. A metric for the particle size distribution can be derived from the µCT images by filling the 3D ice matrix with inscribed spheres of different diameters D (Hildebrand and Rüegsegger, 1997). Figure 12a shows the frequency distribution of the spheres for the three snow samples taken during Experiment 9 (Table 1). Similar distributions were obtained for all experiments (5–12) where µCT samples were taken. The dendritic new snow produced in the snowmaker (cyan squares) shows a peak in the distribution at a size of Dpeak=80 µm and only a few particles at a maximum size of Dmax=300 µm. A general shift in the distribution towards larger sphere sizes (Dpeak=100 µm), along with a reduction in the frequency of smaller spheres (20 µm 80 µm) and a maximum size increase to Dmax=900 µm, is found for the accumulated snow after wind exposure (green dots). This shift indicates that smaller particles, e.g., fragmented dendrites, are removed from the system likely due to sublimation and particle separation where, for the latter, the smallest fragments are partially blown out of the RWT. The increased appearance of particles with D>300 µm after wind exposure may also be the result of particle separation, where the largest particles remain in saltation or roll on the ground and are finally deposited in the accumulation area. The general shift in the particle size distribution towards larger spheres due to particle separation and airborne metamorphism is in line with our finding of a decreasing SSA, as discussed in the previous section.
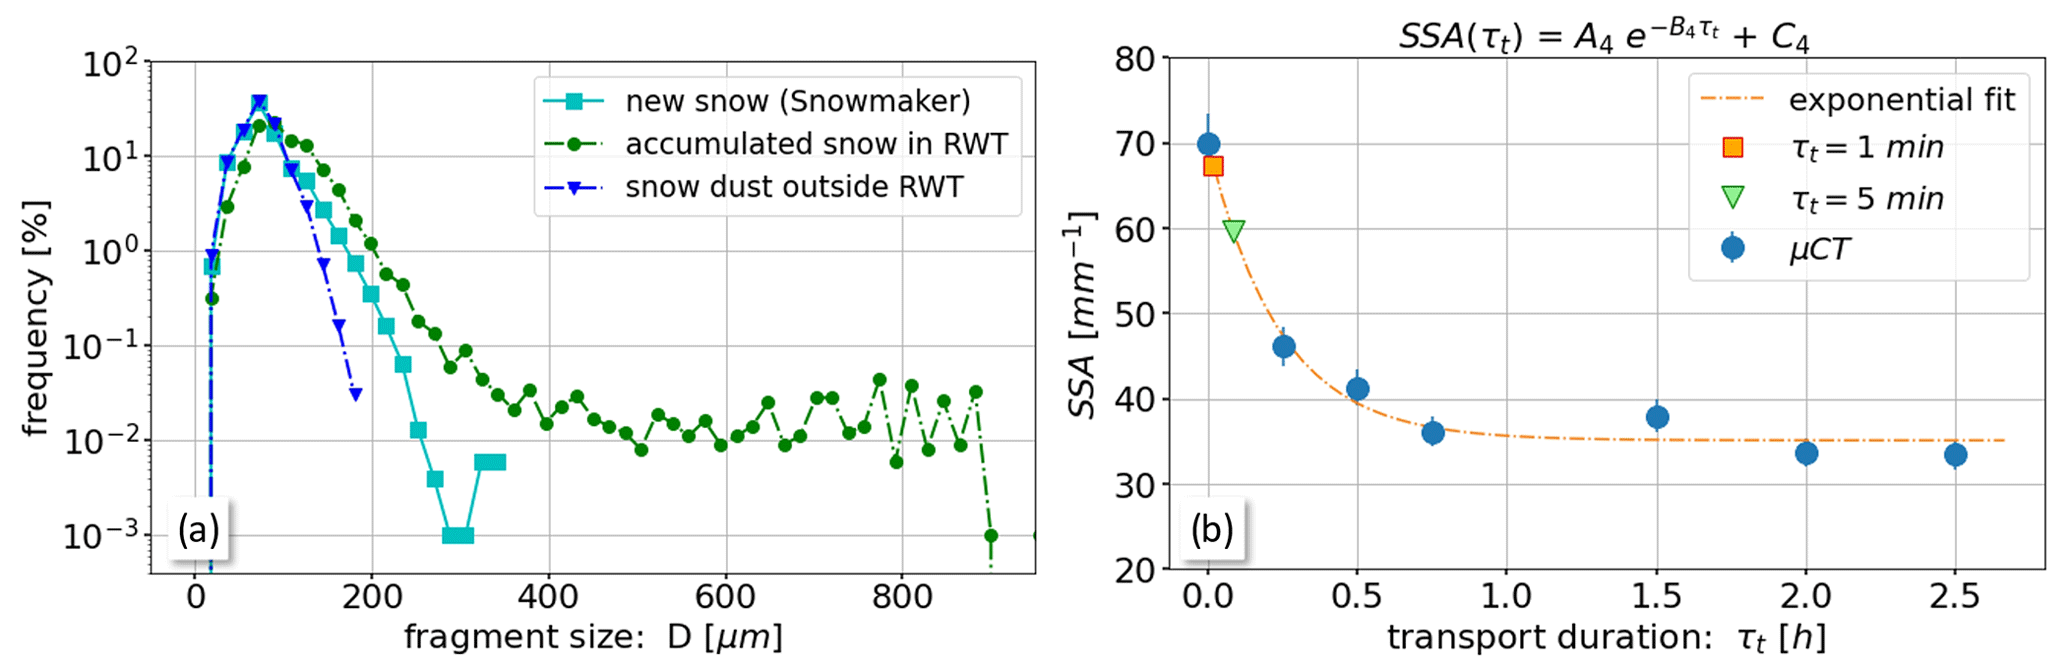
Figure 12(a) Particle size distributions derived from µCT measurements for the fresh snow produced in the snowmaker (cyan squares), the wind-affected snow sampled in the accumulation area (green dots), and snow dust that has been blown out of the RWT for Experiment 9 (blue triangles). (b) Exponential SSA decrease measured for the supplementary experiment on long transport durations τt including estimates for the effective transport durations of the main experiments (orange square and green triangle).
The existence of the process of particle separation in our RWT experiments is substantiated by the particle size distribution of a small snow dust sample taken outside of the RWT (blue triangles, Fig. 12a). Most of these snow dust particles are within a range of 20 µm µm and coincide exactly with the size range where a depletion is found for the wind-affected snow (green circles) relative to the initial new snow (cyan squares). Generally, particle sizes in snow saltation layers were experimentally (Gromke et al., 2014) and numerically (Melo et al., 2021) found to strongly decrease with increasing height above the ground, this being the reason that only the smallest particles are blown out at the inlet. Similar processes of particle separation occur during Saharan dust events, where micrometer-sized particles are transported hundreds or thousands of kilometers, whereas larger sand grains are predominantly re-deposited locally (e.g., van der Does et al., 2016). For ice deserts, sublimation of blowing snow particles results in a significant snow mass loss for Antarctica (Palm et al., 2017). Apparent similarities are also found between our wind-affected particle size distributions and the model results from Comola et al. (2017). While this analysis of size distributions is consistent with particle separation and the hypothesized impact on SSA decay, we acknowledge the known difficulties of the involved size distribution (Löwe et al., 2011) for characterizing the full size complexity of dendritic crystals. A further analysis likely requires a better metric to discern fragmentation and separation.
3.6.2 Airborne snow metamorphism
In our main experiments, the SSA decay in the deposit (Figs. 6c–d, 10 and 11) is only moderate and the hypothesized process of airborne snow metamorphism through continuous sublimation and vapor re-deposition is difficult to verify. To illustrate the existence of airborne metamorphism and its relevance for the SSA decrease, a sensitivity RWT experiment was conducted where a single portion (600 g) of dendritic new snow from the snowmaker was added to the initially empty RWT at °C, while the wind speed was set to the maximum of V0.4 m=8 m s−1 (Experiment 14). In this way we were able to maintain a large portion of the particles in suspension over long periods without deposition. Snow was periodically collected from the suspended particle phase by capturing particles with a small bag for µCT analysis out of the airstream. For this experiment, the RWT was sealed as well as possible to avoid particles being blown out of the RWT. A more detailed description of this additional experiment and compelling evidence of the existence of airborne snow metamorphism based on stable water isotope analyses can be found in Wahl et al. (2024).
Figure 12b shows a considerable decrease in the SSA with increasing transport duration τt. Here, the real transport duration for the particles is used instead of the previously (Figs. 9a and 11a) used experiment duration τexp, as it can be assumed that the particles that are captured out of the flow after some time were mobile the majority of the preceding time. The decrease can be empirically described by an exponential function:
where A4=34.5 mm−1, B4=4.2 h and C4=35.2 mm−1 are constants. The observed change in the snow microstructure from highly dendritic crystals to continuously growing rounded grains together with the strong decrease in the SSA demonstrates the existence of airborne snow metamorphism, with an impact on the SSA decrease which depends on transport duration.
We can compare our previous results with Fig. 12b by the following reasoning. The average transport duration τt for the main RWT experiments can be roughly estimated when dividing the experiment duration (τexp) (Table 1) by the number of snow supplies (≈ 30) when simulating precipitation. This leads to an estimate of τt≈1 min for the 0.5 h lasting experiments and τt≈5 min for the 2.5 h lasting experiment. The corresponding SSA reductions are shown in Fig. 12b, implying a reduction in the specific surface area from SSA =70 mm−1 to SSA =67 mm−1 for the 0.5 h experiments (orange square) and a reduction to SSA =60 mm−1 for the 2.5 h experiment (green triangle in Fig. 12b). The corresponding SSA rates are in both cases h−1, which is consistent with the rates measured for the main RWT experiments (Figs. 10 and 11). We thus expect these rates to be a real signature of airborne snow metamorphism that is concealed in the uncertainties due to the short transport durations, spatial variability and measurement uncertainties in our experiments.
The focus of this study is on linking atmospheric and aeolian snow transport conditions during precipitation events to the snow microstructure of the ultimately deposited snow and to identify the relevant processes. Therefore, ring wind tunnel experiments were performed to investigate the evolution of the surface snow microstructure (specific surface area and density) under windy conditions for different transport conditions (wind speed, air temperature and transport duration) in a controlled cold laboratory environment. The results provide novel insight into the link between atmospheric conditions, airborne snow particles and deposited snow. While we show magnitudes of dependencies between different flow and snow parameters, processes, and snow microstructures, natural conditions may be different in the field, depending on the snow type or flow conditions, while the latter is also rarely well-developed and stationary for natural conditions.
The measured increase in the densification rate with increasing wind speed (Fig. 8) significantly differs from the increase in previous model parameterizations that are exclusively based on field studies. Therefore, a re-parameterization of these models from our data is derived. The dissipated energy upon particle impact (Fig. 5) suggests that enhanced fragmentation of dendritic snow crystals along with higher packing densities is the reason for increasing snow densities at higher wind speeds. A decreasing densification rate with increasing transport duration (Fig. 9a) is consistent with that, since the initial fragmentation must be higher where the most fragile dendrites or particles break first. For higher air temperatures ( °C), the densification rate shows a marked decrease compared to the rather constant rates at lower temperatures (Fig. 9b). This was attributed to the effect of enhanced cohesion (or sintering) which on one hand inhibits particle transport and fragmentation and thus reduces the packing fraction directly close to the melting point.
The observed slight enhancement in SSArate (Fig. 10) with increasing wind velocity is attributed to the processes of airborne snow metamorphism and particle separation. Both are expected to be amplified with increasing wind velocities. Similar to the densification rate, the SSA decrease rate was approximately constant at low air temperatures ( °C) and markedly increased (in absolute values) for higher air temperatures ( °C). The significance of airborne snow metamorphism, where sublimation and vapor re-deposition result in a SSA reduction, was demonstrated in a sensitivity experiment which revealed a strong SSA decrease in the airborne particles for long transport durations (Fig. 12b). The process of particle separation, where some of the smallest particles in suspension are blown out of the wind tunnel, was exemplified by an analysis of the particle size distribution of a small snow dust sample taken outside from the wind tunnel roof; however, its relevance for real, natural blowing snow events remains debatable. Although the processes of airborne snow metamorphism and particle separation are certainly not perfectly reproduced in the RWT relative to real field conditions due to the uncontrolled exchange of air with the outside of the RWT at the inlet, they both occur during natural aeolian snow transport. Therefore, the observed SSA decrease (Figs. 10, 11 and 12b) provides a first assessment of the impact of these processes on the SSA; however, the magnitudes of the SSA decrease must be verified in future studies.
Overall, we have demonstrated that our setup of a ring wind tunnel in a cold laboratory allows for revealing the relevant processes responsible for snow densification and SSA decrease under windy conditions. The presented results highlight the complexity of the involved processes and how they may affect the resulting surface snow microstructure. However, more detailed studies on the individual processes, i.e., particle fragmentation, airborne snow metamorphism and particle separation, are required to fully understand and quantify their impact. Our study also emphasizes the importance of developing process-based rather than empirically based parameterizations for the evolution of the surface snow microstructure under windy conditions. Such improved model descriptions of surface snow will especially be relevant for applications in radiative transfer (snow albedo or radar remote sensing), where the SSA is the dominant parameter. Furthermore, the exchange of chemical species with the atmosphere, snow hydrology or avalanche prediction will also profit from a better understanding and prediction of the surface snow microstructure. Finally, any layer within a snowpack originates from a surface snow layer. A detailed understanding of the initial microstructure of the surface snow layer is therefore critical for the evolution of any layer within the snowpack throughout its (seasonal) lifetime.
The data can be made available by contacting the corresponding author.
BW, HW and SW conducted the experiments, and BW analyzed the data, created the figures, and prepared the manuscript. HW analyzed the high-speed camera data. HL provided theoretical input and edited the manuscript.
The contact author has declared that none of the authors has any competing interests.
Publisher’s note: Copernicus Publications remains neutral with regard to jurisdictional claims made in the text, published maps, institutional affiliations, or any other geographical representation in this paper. While Copernicus Publications makes every effort to include appropriate place names, the final responsibility lies with the authors.
The authors acknowledge Hongxiang Yu for providing OpenFoam simulations of the airflow and the particle saltation layer in the ring wind tunnel, Matthias Jaggi for the cold laboratory support, and Christian Sommer and Charles Fierz for the design and realization of the ring wind tunnel system.
This paper was edited by Guillaume Chambon and reviewed by Nikolas Aksamit and one anonymous referee.
Amory, C., Kittel, C., Le Toumelin, L., Agosta, C., Delhasse, A., Favier, V., and Fettweis, X.: Performance of MAR (v3.11) in simulating the drifting-snow climate and surface mass balance of Adélie Land, East Antarctica, Geosci. Model Dev., 14, 3487–3510, https://doi.org/10.5194/gmd-14-3487-2021, 2021. a
Bartlett, S. J., Rüedi, J.-D., Craig, A., and Fierz, C.: Assessment of techniques for analyzing snow crystals in two dimensions, Ann. Glaciol., 48, 103–112, https://doi.org/10.3189/172756408784700752, 2008. a
Brun, E., Martin, E., and Spiridonov, V.: Coupling a multi-layered snow model with a GCM, Ann. Glaciol., 25, 66–72, https://doi.org/10.3189/S0260305500013811, 1997. a, b
Cabanes, A., Legagneux, L., and Domine, F.: Rate of Evolution of the Specific Surface Area of Surface Snow Layers, Environ. Sci. Technol., 37, 661–666, https://doi.org/10.1021/es025880r, 2003. a, b
Cho, G., Dodds, J., and Santamarina, J.: Particle shape effects on packing density, stiffness, and strength: natural and crushed sands, J. Geotech. Geoenviron. Eng., 132, 591–602, https://doi.org/10.1061/(ASCE)1090-0241(2006)132:5(591), 2006. a
Comola, F., Kok, J. F., Gaume, J., Paterna, E., and Lehning, M.: Fragmentation of wind-blown snow crystals, Geophys. Res. Lett., 44, 4195–2403, https://doi.org/10.1002/2017GL073039, 2014. a, b, c, d, e, f, g
Dai, X. and Huang, N.: Numerical simulation of drifting snow sublimation in the saltation layer, Sci. Rep., 4, 6611, https://doi.org/10.1038/srep06611, 2014. a, b
Domine, F., Picard, G., Morin, S., Barrere, M., Madore, J.-B., and Langlois, A.: Major issues in simulating some Arctic snowpack properties using current detailed snow physics models: Consequences for the thermal regime and water budget of permafrost, J. Adv. Model. Earth Syst., 11, 34–44, https://doi.org/10.1029/2018MS001445, 2019. a
Domine, F., Lackner, G., Sarrazin, D., Poirier, M., and Belke-Brea, M.: Meteorological, snow and soil data (2013–2019) from a herb tundra permafrost site at Bylot Island, Canadian high Arctic, for driving and testing snow and land surface models, Earth Syst. Sci. Data, 13, 4331–4348, https://doi.org/10.5194/essd-13-4331-2021, 2021. a
Eidevåg, T., Thomson, E., Kallin, D., Casselgren, J., and Rasmuson, A.: Angle of repose of snow: An experimental study on cohesive properties, Cold Reg. Sci. Technol., 194, 103470, https://doi.org/10.1016/j.coldregions.2021.103470, 2022. a
Fausto, R. S., Box, J. E., Vandecrux, B., Van As, D., Steffen, K., MacFerrin, M. J., Machguth, H., Colgan, W., Koenig, L. S., McGrath, D., Charalampidis, C., and Braithwaite, R. J.: A snow density dataset for improving surface boundary conditions in Greenland ice sheet firn modeling, Front. Earth Sci., 6, 51, https://doi.org/10.3389/feart.2018.00051, 2018. a
Fierz, C., Armstrong, R. L., Durand, Y., Etchevers, P., Greene, E., McClung, D. M., and Sokratov, S. A.: The international classification for seasonal snow on the ground, Prepared by the ICSI-UCCS-IACS working group on snow classification (IHP-VII technical documents in hydrology), UNESCO; IHP, https://www.dora.lib4ri.ch/wsl/islandora/object/wsl:10162 (last access: June 2024), 2009.
Flanner, M. G. and Zender, C. S.: Linking snowpack microphysics and albedo evolution, J. Geophys. Res., 111, D12208, https://doi.org/10.1029/2005JD006834, 2006. a
Gallet, J.-C., Domine, F., Zender, C. S., and Picard, G.: Measurement of the specific surface area of snow using infrared reflectance in an integrating sphere at 1310 and 1550 nm, The Cryosphere, 3, 167–182, https://doi.org/10.5194/tc-3-167-2009, 2009. a
Gallet, J.-C., Domine, F., Arnaud, L., Picard, G., and Savarino, J.: Vertical profile of the specific surface area and density of the snow at Dome C and on a transect to Dumont D'Urville, Antarctica – albedo calculations and comparison to remote sensing products, The Cryosphere, 5, 631–649, https://doi.org/10.5194/tc-5-631-2011, 2011. a
Garrett, T. J. and Yuter, S. E.: Observed influence of riming, temperature, and turbulence on the fall velocity of solid precipitation, Geophys. Res. Lett., 41, 6515–6522, https://doi.org/10.1002/2014GL061016, 2014. a
Golubev V. N. and Sokratov, S. A.: Regular packing of grains as a model of snow structure, Ann. Glaciol., 38, 25–29, https://doi.org/10.3189/172756404781815004, 2004. a
Gromke, C., Manes, C., Walter, B., Lehning, M., and Guala, M.: Aerodynamic roughness length of fresh snow, Bound.-Lay. Meteorol., 141, 21–34, https://doi.org/10.1007/s10546-011-9623-3, 2011. a
Gromke, C., Horender, S., Walter, B., and Lehning, M.: Snow particle characteristics in the saltation layer, J. Glaciol., 60, 431–439, https://doi.org/10.3189/2014JoG13J079, 2014. a, b
Groot-Zwaaftink, C. D., Mott, R., and Lehning, M.: Seasonal simulation of drifting snow sublimation in Alpine terrain, Water Resour. Res., 49, 1581–1590, https://doi.org/10.1002/wrcr.20137, 2013. a, b
Hagenmuller, P., Chambon, G., Lesaffre, B., Flin, F., and Naaim, M.: Energy-based binary segmentation of snow microtomographic images, J. Glaciol., 59, 859–873, https://doi.org/10.3189/2013JoG13J035, 2013. a
Hagenmuller, P., Matzl, M., Chambon, G., and Schneebeli, M.: Sensitivity of snow density and specific surface area measured by microtomography to different image processing algorithms, The Cryosphere, 10, 1039–1054, https://doi.org/10.5194/tc-10-1039-2016, 2016. a, b
Harris Stuart, R., Faber, A.-K., Wahl, S., Hörhold, M., Kipfstuhl, S., Vasskog, K., Behrens, M., Zuhr, A. M., and Steen-Larsen, H. C.: Exploring the role of snow metamorphism on the isotopic composition of the surface snow at EastGRIP, The Cryosphere, 17, 1185–1204, https://doi.org/10.5194/tc-17-1185-2023, 2023. a
Heggli, M., Köchle, B., Matzl, M., Pinzer, B. R., Riche, F., Steiner, S., Steinfeld, D., and Schneebeli, M.: Measuring snow in 3-D using X-ray tomography: assessment of visualization techniques, Ann. Glaciol., 52, 231–236, https://doi.org/10.3189/172756411797252202, 2011. a
Hildebrand, T. and Rüegsegger, P.: A new method for the model-independent assessment of thickness in three-dimensional images, J. Microsc., 185, 67–75, https://doi.org/10.1046/j.1365-2818.1997.1340694.x, 1997. a
Huang, N. and Wang, Z.: A 3-D simulation of drifting snow in the turbulent boundary layer, The Cryosphere Discuss., 9, 301–331, https://doi.org/10.5194/tcd-9-301-2015, 2015. a
Lehning, M., Bartelt, P., Brown, R. L., Fierz, C., and Satyawali, P. K.: A physical SNOWPACK model for the Swiss avalanche warning, Part II. Snow microstructure, Cold Reg. Sci. Technol., 35, 147–167, https://doi.org/10.1016/S0165-232X(02)00073-3, 2002. a, b, c
Libbrecht, K. G.: The Physics of Snow Crystals, Rep. Prog. Phys., 68, 855, https://doi.org/10.1088/0034-4885/68/4/R03, 2005.
Liston, G., Haehnel, R., Sturm, M., Hiemstra, C., Berezovskaya, S., and Tabler, R.: Simulating complex snow distributions in windy environments using SnowTran-3D, J. Glaciol., 53, 241–256, https://doi.org/10.3189/172756507782202865, 2007. a, b, c, d, e, f
Löwe, H., Spiegel, J. K., and Schneebeli, M.: Interfacial and structural relaxations of snow under isothermal conditions, J. Glaciol., 57, 499–510, https://doi.org/10.3189/002214311796905569, 2011. a
Martin, J. and Schneebeli, M.: Impact of the sampling procedure on the specific surface area of snow measurements with the IceCube, The Cryosphere, 17, 1723–1734, https://doi.org/10.5194/tc-17-1723-2023, 2023. a
Melo, D. B., Sharma, V., Comola, F., Sigmund, A., and Lehning, M.: Modeling snow saltation: The effect of grain size and interparticle cohesion, J. Geophys. Res.-Atmos., 127, e2021JD035260, https://doi.org/10.1029/2021JD035260, 2021. a
Meredith, M., Sommerkorn, M., Cassotta, S., Derksen, C., Ekaykin, A., Hollowed, A., Kofinas, G., Mackintosh, A., Melbourne-Thomas, J., Muelbert, M. M. C., Ottersen, G., Pritchard, H., and Schuur, E. A. G.: Polar Regions, in: IPCC Special Report on the Ocean and Cryosphere in a Changing Climate, edited by: Pörtner, H.-O., Roberts, D. C., Masson-Delmotte, V., Zhai, P., Tignor, M., Poloczanska, E., Mintenbeck, K., Alegría, A., Nicolai, M., Okem, A., Petzold, J., Rama, B., and Weyer, N. M., Cambridge University Press, Cambridge, UK and New York, NY, USA, 203–320 pp., https://www.ipcc.ch/site/assets/uploads/sites/3/2019/12/SROCC_FullReport_FINAL.pdf (last access: October 2023), 2019.
Mott, R., Vionnet, V., and Grünewald, T.: The Seasonal Snow Cover Dynamics: Review on Wind-Driven Coupling Processes, Front. Earth Sci., 6, 197, https://doi.org/10.3389/feart.2018.00197, 2019. a
Nishimura, K. and Nemoto, M.: Blowing snow at Mizuho station, Antarctica, Phil. Trans. R. Soc. A, 363, 1647–1662, https://doi.org/10.1098/rsta.2005.1599, 2005. a, b
Nishimura, K., Yokoyama, C., Ito, Y., Nemoto, M., Naaim-Bouvet, F., Bellot, H., and Fujita, K.: Snow particle velocities in drifting snow, J. Geophys. Res. Atmos., 119, 9901–9913, https://doi.org/10.1002/2014JD021686, 2014. a, b
Pahaut, E.: La métamorphose des cristaux de neige (Snow crystal metamorphosis), Monographies de la Météorologie Nationale, Vol. 96, Météo France, 1975. a, b
Palm, S. P., Kayetha, V., Yang, Y., and Pauly, R.: Blowing snow sublimation and transport over Antarctica from 11 years of CALIPSO observations, The Cryosphere, 11, 2555–2569, https://doi.org/10.5194/tc-11-2555-2017, 2017. a, b, c, d, e
Parteli, E. J. R., Schmidt, J., Blümel, C., Wirth, K.-E., Peukert, W., and Pöschel, T.: Attractive particle interaction forces and packing density of fine glass powders, Sci. Rep., 4, 6227, https://doi.org/10.1038/srep06227, 2014. a
Pinzer, B. and Schneebeli, M.: Snow metamorphism under alternating temperature gradients: morphology and recrystallization in surface snow, Geophys. Res. Lett., 36, L23503, https://doi.org/10.1029/2009GL039618, 2009. a
Proksch, M., Löwe, H., and Schneebeli, M.: Density, specific surface area, and correlation length of snow measured by high-resolution penetrometry, J. Geophys. Res.-Earth Surf., 120, 346–362, https://doi.org/10.1002/2014JF003266, 2015. a
Proksch, M., Rutter, N., Fierz, C., and Schneebeli, M.: Intercomparison of snow density measurements: bias, precision, and vertical resolution, The Cryosphere, 10, 371–384, https://doi.org/10.5194/tc-10-371-2016, 2016. a
Rignot, E. and Thomas, R. H.: Mass Balance of Polar Ice Sheets, Science, 297, 1502–1506, https://doi.org/10.1126/science.1073888, 2002. a
Royer, A., Picard, G., Vargel, C., Langlois, A., Gouttevin, I., and Dumont, M.: Improved simulation of arctic circumpolar land area snow properties and soil temperatures, Front. Earth Sci., 9, 685140, https://doi.org/10.3389/feart.2021.685140, 2021. a
Sato, T., Kosugi, K., Mochizuki, S., and Nemoto, M.: Wind velocity dependences of fracture and accumulation of snowflakes on snow surface, Cold Reg. Sci. Technol., 51, 229–239, https://doi.org/10.1016/j.coldregions.2007.05.004, 2008. a, b, c, d, e
Schleef, S., Löwe, H., and Schneebeli, M.: Influence of stress, temperature and crystal morphology on isothermal densification and specific surface area decrease of new snow, The Cryosphere, 8, 1825–1838, https://doi.org/10.5194/tc-8-1825-2014, 2014a. a, b, c, d, e, f
Schleef, S., Jaggi, M., Löwe, H., and Schneebeli, M.: An improved machine to produce nature-identical snow in the laboratory, J. Glaciol., 60, 94–102, https://doi.org/10.3189/2014JoG13J118, 2014b. a
Schmidt, R.: Vertical profiles of wind velocity, snow concentration, and humidity in blowing snow, Bound. Lay. Meteorol., 23, 223–246, https://doi.org/10.1007/BF00123299, 1982. a
Schweizer, J., Jamieson, J. B., and Schneebeli, M.: Snow avalanche formation, Rev. Geophys., 41, 25 pp., https://doi.org/10.1029/2002RG000123, 2003. a
Seligman, G.: Snow structure and ski fields, 1980 edition by International Glaciological Society, Cambridge, Cambridge, UK, 555 pp., 1936. a, b
Sokratov, S. and Sato, A.: The effect of wind on the snow cover, Ann. Glaciol., 32, 116–120, https://doi.org/10.3189/172756401781819436, 2001. a
Sommer, C. G., Lehning, M., and Fierz, C.: Wind tunnel experiments: saltation is necessary for wind-packing, J. Glaciol., 63, 950–958, https://doi.org/10.1017/jog.2017.53, 2017. a, b
Sommer, C. G., Lehning, M., and Fierz, C.: Wind Tunnel Experiments: Influence of Erosion and Deposition on Wind-Packing of New Snow, Front. Earth Sci., 6, 4, https://doi.org/10.3389/feart.2018.00004, 2018. a
Sommerfeld, H., Koch, C., Schwarz A., and Beck, C.: High velocity measurements of particle rebound characteristics under erosive conditions of high-pressure compressors, Wear, 470–471, 203626, https://doi.org/10.1016/j.wear.2021.203626, 2021. a
Sugiura, K. and Maeno, N.: Wind-Tunnel Measurements Of Restitution Coefficients And Ejection Number Of Snow Particles In Drifting Snow: Determination Of Splash Functions, Bound.-Lay. Meteorol., 95, 123–143, https://doi.org/10.1023/A:1002681026929, 2000. a, b, c, d, e, f, g, h
van der Does, M., Korte, L. F., Munday, C. I., Brummer, G.-J. A., and Stuut, J.-B. W.: Particle size traces modern Saharan dust transport and deposition across the equatorial North Atlantic, Atmos. Chem. Phys., 16, 13697–13710, https://doi.org/10.5194/acp-16-13697-2016, 2016. a
Vionnet, V., Brun, E., Morin, S., Boone, A., Faroux, S., Le Moigne, P., Martin, E., and Willemet, J.-M.: The detailed snowpack scheme Crocus and its implementation in SURFEX v7.2, Geosci. Model Dev., 5, 773–791, https://doi.org/10.5194/gmd-5-773-2012, 2012. a, b, c, d, e, f
Wahl, S., Walter, B., Aemisegger, F., Bianchi, L., and Lehning, M.: Identifying airborne snow metamorphism with stable water isotopes, EGUsphere [preprint], https://doi.org/10.5194/egusphere-2024-745, 2024. a
Walter, B., Gromke, C., Leonard, K., Clifton, A., and Lehning, M.: Spatially resolved skin friction velocity measurements using Irwin sensors: a calibration and accuracy analysis, J. Wind Eng. Ind. Aerodyn., 144, 104–106, https://doi.org/10.1016/j.jweia.2012.02.018, 2012a. a
Walter, B., Gromke, C., Leonard, K., Manes, C., and Lehning, M.: Spatio-temporal surface shear stress variability in live plant canopies and cube arrays, Bound.-Lay. Meteorol., 143, 337–356, https://doi.org/10.1007/s10546-011-9690-5, 2012b. a
Walter, B., Gromke, C., and Lehning, M.: Shear stress partitioning in live plant canopies and modifications to Raupach’s model, Bound.-Lay. Meteorol., 144, 217–241, https://doi.org/10.1007/s10546-012-9719-4, 2012c. a
Walter, B., Horender, S., Voegeli, C., and Lehning, M.: Experimental assessment of Owen’s second hypothesis on surface shear stress induced by a fluid during sediment saltation, Geophys. Res. Lett., 41, 6298–6305, https://doi.org/10.1002/2014GL061069, 2014. a
Walter, B., Voegeli, C., and Horender, S.: Estimating sediment mass fluxes on surfaces sheltered by live vegetation, Bound.-Lay. Meteorol., 163, 273, https://doi.org/10.1007/s10546-016-0224-z, 2017. a
Warren, S. G.: Optical properties of ice and snow, Phil. Trans. R. Soc., A377, 20180161, https://doi.org/10.1098/rsta.2018.0161, 2019. a
Wever, N., Keenan, E., Amory, C., Lehning, M., Sigmund, A., Huwald, H., and Lenaerts, J. T.: Observations and simulations of new snow density in the drifting snow-dominated environment of Antarctica, J. Glaciol., 69, 823–840, https://doi.org/10.1017/jog.2022.102, 2023. a
Willibald, C., Löwe, H., Theile, T., Dual, J., and Schneebeli, M.: Angle of repose experiments with snow: role of grain shape and cohesion, J. Glaciol., 66, 658–666, https://doi.org/10.1017/jog.2020.36, 2020. a, b, c, d
Wolff, E. and Bales, R.: Chemical Exchange Between the Atmosphere and Polar Snow, 453–489, Springer-Verlag, New York, 1996. a
Woods, C. P., Stoelinga, M. T., and Locatelli, J. D.: Size spectra of snow particles measured in wintertime precipitation in the Pacific Northwest, J. Atmos. Sci., 65, 189–205, https://doi.org/10.1175/2007JAS2243.1, 2008. a
Yamaguchi, S., Ishizaka, M., Motoyoshi, H., Nakai, S., Vionnet, V., Aoki, T., Yamashita, K., Hashimoto, A., and Hachikubo, A.: Measurement of specific surface area of fresh solid precipitation particles in heavy snowfall regions of Japan, The Cryosphere, 13, 2713–2732, https://doi.org/10.5194/tc-13-2713-2019, 2019. a, b, c
Yu, H., Li, G., Walter, B., Lehning, M., Zhang, J., and Huang, N.: Wind conditions for snow cornice formation in a wind tunnel, The Cryosphere, 17, 639–651, https://doi.org/10.5194/tc-17-639-2023, 2023. a, b, c
Zwart, C.: Significance of new-snow properties for snow-cover development, Master thesis, WSL Institute for Snow and Avalanche Research SLF, Davos, Switzerland, 2007. a, b