the Creative Commons Attribution 4.0 License.
the Creative Commons Attribution 4.0 License.
 | 04 Jul 2024
Surface dynamics and history of the calving cycle of Astrolabe Glacier (Adélie Coast, Antarctica) derived from satellite imagery
Floriane Provost
Dimitri Zigone
Emmanuel Le Meur
Jean-Philippe Malet
Clément Hibert
The recent calving of Astrolabe Glacier on the Adélie Coast (East Antarctica) in November 2021 presents an opportunity to better understand the processes leading to ice tongue fracturing. To document the fractures and rift evolution that led to the calving, we used the archive of Sentinel-2 optical images to measure the ice motion and strain rates from 2017 to 2021. The long-term evolution of the Astrolabe ice tongue is mapped using airborne and satellite imagery from 1947 to November 2021. These observations are then compared with measurements of sea-ice extent and concentration. We show that calving occurs almost systematically at the onset of or during the melting season. Additionally, we observe a significant change in the periodicity of sea ice surrounding Astrolabe Glacier in the last decade (2011–2021) compared to previous observations (1979–2011), which has resulted in a change in the Astrolabe calving cycle. Indeed, one can observe a decrease in the duration of sea-ice-free conditions during the austral summers after 2011 in the vicinity of the glacier, which seems to have favoured spatial extension of the ice tongue. However, the analysis of strain rate time series revealed that the calving of November 2021 (20 km2) occurred at the onset of sea-ice melting season but resulted from the glacier dislocation that took place suddenly in June 2021 in the middle of the winter. These observations indicate that while sea ice can protect and promote the spatial extension of a glacier ice tongue, its buttressing is not sufficient to inhibit rifting and ice fracturing.
- Article
(6752 KB) - Full-text XML
- BibTeX
- EndNote


Determining the contribution of polar ice sheets to sea level rise is a major concern for society, and a better understanding of the processes and factors controlling ice retreat is of paramount importance for simulating the response of ice sheets to global warming (Seroussi et al., 2020; Chambers et al., 2022). Coastal glaciers in polar regions differ from mountain glaciers in temperate regions in terms of volume, catchment size, and thermal state, associated with complex interactions with the ocean. The presence of floating tongues with marine termini makes Antarctic glaciers more sensitive to atmospheric and ocean dynamics (Gudmundsson et al., 2019; Olinger et al., 2019; Paolo et al., 2015; Pritchard et al., 2012; Christie et al., 2022). Monitoring of Antarctic glaciers remains heterogeneous (Baumhoer et al., 2018), and studies focus on either continental-scale monitoring, which usually leads to commenting on the evolution of Antarctica's largest glaciers (Walker et al., 2013; Rignot et al., 2019; Miles et al., 2022; Millan et al., 2022; Baumhoer et al., 2023), or specific glaciers or groups of glaciers that receive most of the attention (Baumhoer et al., 2018). In this study, we document and analyse the evolution of the Astrolabe Glacier ice tongue calving cycle, which has not been updated since Frezzotti and Polizzi (2002).
Astrolabe Glacier is located on the Adélie Coast (140° E, 67° S) near the French research station Dumont d'Urville. The glacier outlet is ca. 8 km wide (Fig. 1a), while the drainage basin stretches as much as 200 km inland. It is characterised by an ice tongue developing on the water, with a calving front 6 km wide (Fig. 1a). Due to its proximity to the Dumont d’Urville research station, the glacier has been instrumented over the last few decades, focusing on the grounding zone (Drouet, 2012; Le Meur et al., 2014). However, the last study documenting the calving cycle of the glacier's ice tongue only covers the period of 1940–2000 (Frezzotti and Polizzi, 2002), while recent observations show an unusual spatial extension of the ice tongue up to November 2021 when a major calving event occurred (Fig. 1f–i). Due to its small size and rapid recent dynamics, the Astrolabe Glacier ice tongue is not adequately monitored by global value-added products such as the NASA MEaSUREs ITS_LIVE product (https://doi.org/10.5067/6II6VW8LLWJ7, Gardner et al., 2022).
Ice calving is defined as the detachment of a smaller piece of ice from a larger one (Alley et al., 2023). Calving is mostly controlled by brittle processes (Alley et al., 2023) and results from the extensive opening of cracks or rifts within the ice shelf. Lateral spreading and thinning of the ice shelf can explain the formation and propagation of these fractures and/or rifts (Liu et al., 2015; Larour et al., 2021; Borstad et al., 2017; Alley et al., 2023). However, environmental forcing can also accelerate their propagation through hydrofracturing (Scambos et al., 2000), subglacial warm water intrusion and basal melting (Ritz et al., 2015; Rignot et al., 2019; Pritchard et al., 2012), and bending of the ice due to flexural rebound after lake drainage (Banwell et al., 2013). Examples of tsunamis contributing to open rifts and triggering calving are also reported (Liang et al., 2023; Alley et al., 2023). Another important forcing is the influence of the sea ice surrounding the ice tongues, resulting from atmospheric and oceanic dynamics (Campagne et al., 2015). In fact, changes in atmospheric and oceanic dynamics favouring the presence of sea ice can act as a protector and allow glacier expansion by either protecting the ice tongue from ocean swell in the case of landfast sea ice (i.e. sea ice fastened to the glacier and/or to the coastline) or buttressing the ice tongue (Massom et al., 2001; Walker et al., 2013; Robel, 2017; Wearing et al., 2020; Massom et al., 2010; Gomez-Fell et al., 2022; Massom et al., 2018; Wille et al., 2022; Christie et al., 2022). The thickness of sea ice or ice melange within a pre-existing rift may influence the acceleration of the rift opening (Larour et al., 2021), leading to complex calving cycles. In several cases, the disappearance of sea ice around the ice tongue front has been reported to trigger instantaneous calving (Massom et al., 2001, 2018; Robel, 2017; Wearing et al., 2020; Gomez-Fell et al., 2022; Xie et al., 2019). However, it remains unclear whether the sea ice, and in particular the landfast sea ice, is buttressing the ice tongue, preventing fracture propagation, or whether it merely holds the ice tongue parts together until calving is possible. All of these processes are still poorly understood, as they exhibit a strong spatial and temporal variability that is highly difficult to document with direct observations in Antarctica.
In this study, we determine for the first time the ice tongue extension cycle of Astrolabe Glacier from an aerial photograph taken in 1947 and from high-resolution satellite imagery (European Remote Sensing, ERS; MODIS; Landsat; Sentinel-2; and Advanced Spaceborne Thermal Emission and Reflection Radiometer, ASTER) covering the period of 1960–2021. The archive of Sentinel-2 images is used to compute surface velocity of the ice for the entire area of Astrolabe Glacier from 2017 to 2021. We demonstrate the added value of optical-satellite imagery for monitoring fracture propagation using ice velocity and strain rate calculated from optical-image correlation. We compare the front-line evolution of the ice tongue with the sea-ice extent around Astrolabe Glacier from the NSIDC (National Snow and Ice Data Center; Fetterer et al., 2017). We show that calving events occur almost systematically when sea ice disappears around the ice tongue terminus but that the rift propagation can take place in the middle of the austral winter when the ice tongue is totally embedded in sea ice, suggesting that sea-ice buttressing may not be sufficient at Astrolabe Glacier to prevent calving.
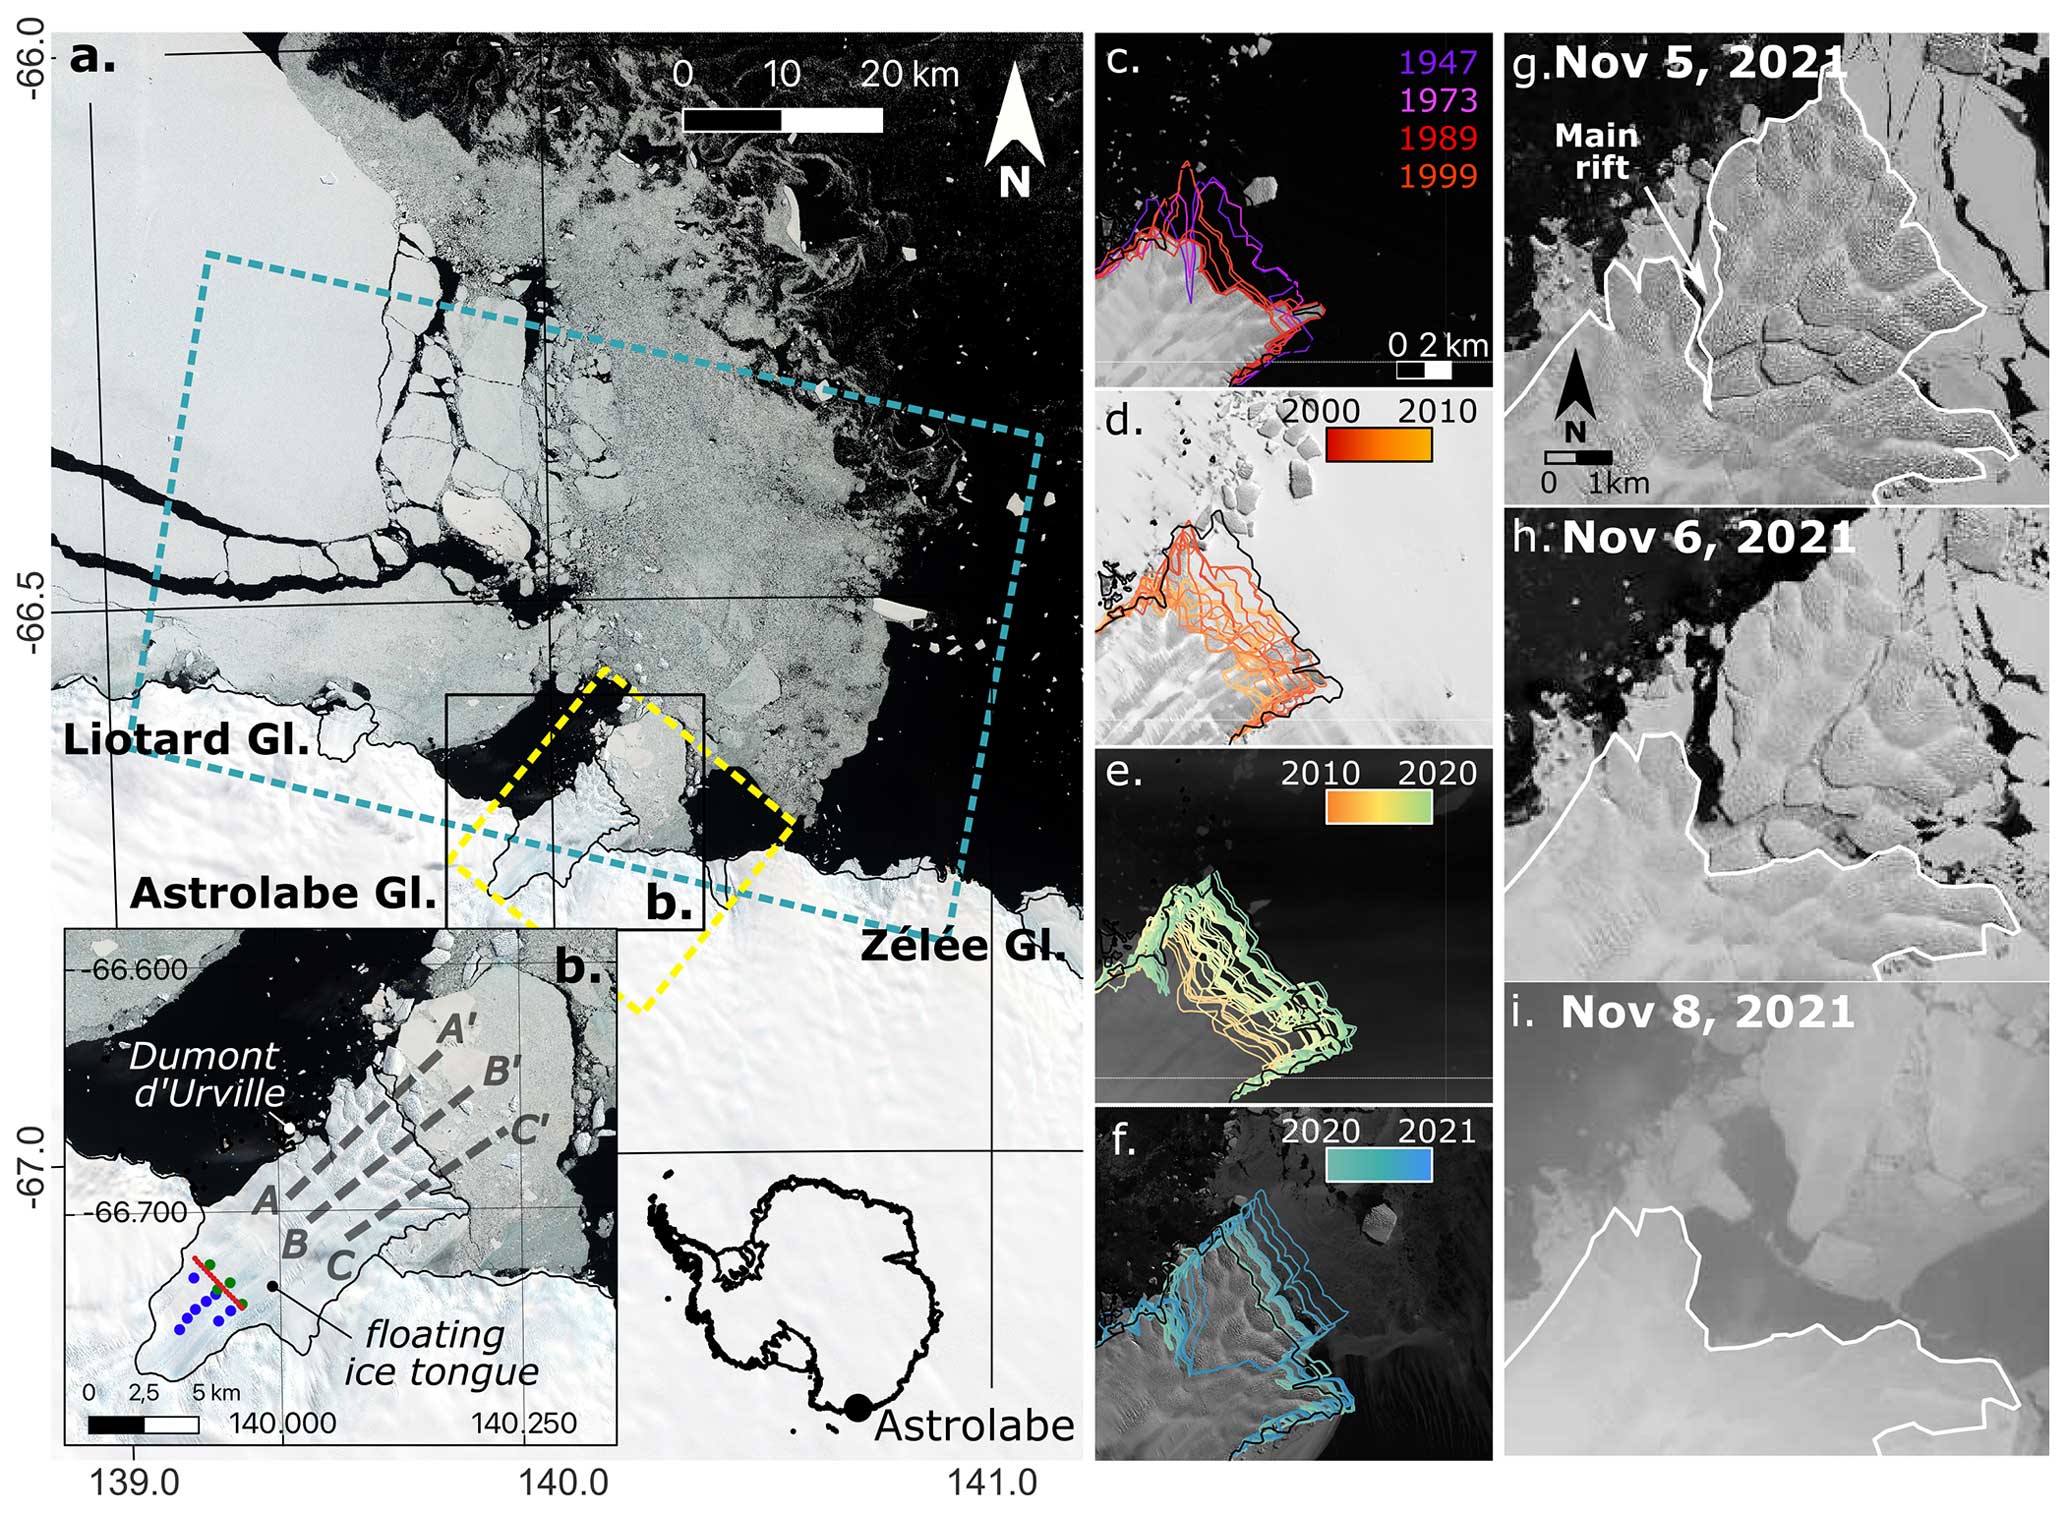
Figure 1(a) Location of Astrolabe Glacier with the coastline and grounding lines from Gerrish et al. (2022) and the 7 February 2020 Sentinel-2 image in the background. The limits of the 4000 km2 box where the sea-ice extent is extracted are represented by dotted blue lines. Dotted yellow lines delineate the pixel extent and location of the sea-ice concentration grid from which the sea-ice concentration is extracted. Panel (b) is a zoom of the Astrolabe Glacier ice tongue and indicates the profiles where the evolution of the ice front position is presented (Fig. 2). In situ measurements are also represented: red dots show the locations of the bamboo stakes and blue and green dots are the initial GNSS positions of the 2018 and 2021 campaigns respectively. Panels (c) to (f) show the ice front position at different dates with the background image of Landsat-5 on 14 January 1989 (c), Landsat-7 on 19 November 2002 (d), Landsat-7 on 9 February 2013 (e), and Sentinel-2 on 13 March 2021 (f). Panels (g) to (i) show the calving on 6 November 2021 from the 5 November 2021 Sentinel-2 acquisition (g), the 6 November 2021 Landsat-8 acquisition (h), and the 8 November 2021 Sentinel-2 acquisition (i).
2.1 Satellite imagery
2.1.1 Mapping of the ice front position
The ice front of Astrolabe Glacier is mapped using mainly high-resolution (<50 m) optical-satellite imagery available in the public domain (i.e. Landsat, MODIS, ASTER, and Sentinel-2). The first available satellite image was acquired by Landsat-1 on 29 January 1973 (Fig. 1c). The next available images were acquired in 1989 by Landsat-4/5 and then in 1999 by Landsat-7 (Fig. 1c). In 1947, the US Navy Operation Highjump took several aerial photographs of the Adélie Coast, including over Astrolabe Glacier. We used a sketch derived from the photographs (https://archives-polaires.fr/idurl/1/14865, last access: March 2024) to extract the ice front position (Fig. 1c). We manually co-register the photograph and attempt to compensate for most of the distortions, although significant shifts remain visible. We therefore allow for an error of ±1 km in the position of the ice front. To complement the optical dataset, we used radar imagery from ERS satellites and the RADARSAT-1 Antarctic Mapping Project (RAMP) product (Jezek et al., 2013) to map the ice front position between 1996 and 1999 (Fig. 1c). From 2000 to 2013, Landsat-7 and ASTER satellites provide from one to three images per year. We complete this dataset with the analysis of MODIS images (Fig. 1d). Starting in 2010, Landsat-8 and then Sentinel-2 in 2017 provide regular high-resolution coverage of ice front evolution (Fig. 1e). The combination of these two satellites allowed us to monitor the calving of November 2021 with daily acquisitions (Fig. 1g–i). A total of 113 images are analysed, and the evolution of the ice front is manually mapped. Finally, the area of the floating tongue is estimated considering an arbitrary reference grounding line position (Bindschadler et al., 2011; Fig. 1a). A more precise delineation of the grounding line has been proposed by Le Meur et al. (2014).
2.1.2 Ice velocity monitoring from optical images
Satellite imagery is commonly used to compute the ice velocity using image correlation techniques (Avouac et al., 2006; Leprince et al., 2007; Rignot et al., 2011; Mouginot et al., 2017; Millan et al., 2022). These techniques consist of matching pixels from one image to another in order to obtain the shift in position of a given feature over time. Several studies have shown interest in this technique for monitoring ice surface velocity (Dehecq et al., 2015; Altena et al., 2019), especially in polar regions (Joughin et al., 2018; Millan et al., 2022). We used the GDM-OPT-ICE service (Provost et al., 2022; Stumpf et al., 2017) to compute the ice displacement time series. The GDM-OPT-ICE service allows the precise co-registration of a satellite imagery stack using the CO-REGIS algorithm (Stumpf et al., 2018), which computes the displacement between pairs of co-registered images with the open source stereo-photogrammetric library MicMac (Rosu et al., 2015; Rupnik et al., 2017), and inverts the displacement time series using the TIO algorithm (Doin et al., 2011; Bontemps et al., 2018).
The Copernicus Sentinel-2 mission provides acquisitions of Astrolabe Glacier every 3 to 6 days during the austral summer (September to April). In total, 59 Sentinel-2 images without cloud cover have been acquired over Astrolabe Glacier from February 2017 to early November 2021. The pairing network is set so that each image is successively paired with the next five images, resulting in 280 pairs. Correlation is computed on a 5 by 5 pixel window using sub-pixel refinement. The displacement time series is inverted for each acquisition date with a spatial resolution of 1 by 1 pixel (i.e. 10 m × 10 m). The resulting displacement time series is interpolated at 30 d in order to compute the evolution of the ice velocity and to reduce the noise.
2.1.3 Computation of the strain rates from the ice velocity fields
Strain is a measure of how much a medium (here ice) stretches, compresses, and deforms in all directions as it flows, whereas strain rates represent how quickly these deformations occur. Strain rates can therefore be computed using satellite-derived velocities (Alley et al., 2018; Cheng et al., 2021). We used the method described in Alley et al. (2018) and Nye (1959) to compute the longitudinal, transverse, and shear strain rates using the annual estimate of the ice velocity derived from the GDM-OPT-ICE outputs (see Sect. 3.2.1). Strain rates are computed at a spatial resolution of 20 m.
2.2 In situ sensors
2.2.1 On-site GNSS observations and displacement measurements
A permanent global navigation satellite system (GNSS) network is maintained by the Institut des Géosciences de l'Environnement (IGE) on Astrolabe Glacier. It consisted of eight GNSS stations in 2018 and four stations in 2021 (mainly because of a lack of maintenance in 2019/2020 due to the cancellation of the summer operations in Antarctica because of the COVID pandemic; Fig. 1b). The GNSS receivers and antennas are mounted on beacons specially designed to withstand harsh environmental conditions (e.g. strong winds, local wind-driven snow accumulation, ice movement, and summer melting leading to beacon tilting or even collapse). These harsh conditions explain some gaps in the GNSS time series, especially during the austral winters. The receivers are geodetic dual-frequency receivers (Trimble™NetR9) connected to Zephir geodetic antennas. The GNSS observations consist of three 2 h measurement sessions per day, where positions are averaged from 30 s sampling measurements. The positions are calculated for 24 h measurements in PPP mode (precise point positioning) using the GipsyX geodetic software (Zumberge et al., 1997). The accuracy is 1.5 cm (standard deviation 0.9 cm) in the horizontal component and 3.8 cm (standard deviation 2.7 cm) in the vertical component.

Figure 2Comparison between yearly velocity measured with in situ measurements from the year-long GNSS campaigns and the week-long bamboo stake campaign: (a) location of the GNSS and bamboo stakes (see Fig. 1 for the location on the ice tongue) and (b) comparison between the different in situ datasets. (c) Comparison between the estimation of the velocity from the bamboo stake campaign and the yearly estimation of the velocity from satellite imagery from the NASA MEaSUREs ITS_LIVE product (https://doi.org/10.5067/6II6VW8LLWJ7, Gardner et al., 2022).
A field campaign was carried out in 2020 to quantify the ice velocity in the vicinity of the grounding line position. It consisted of 16 bamboo stakes that were implanted in the ice during the winter of 2020 for 1 week between 31 January 2020 and 7 February 2020 (Fig. 1b). The position of the stakes was measured on the first day and then 1 week later with a GNSS dual-frequency receiver, allowing the ice velocity to be estimated. The derived velocity is compared to the GNSS-derived velocity from the 2018 and 2021 campaigns and to the NASA MEaSUREs ITS_LIVE data (https://doi.org/10.5067/6II6VW8LLWJ7, Gardner et al., 2022) available in this part of the ice tongue. The result shows good agreement between all datasets (Fig. 2), meaning that the velocity remains locally constant in this part of the ice tongue over the years from 2000 to 2018.
3.1 Ice front position: 2000–2021
Changes in the frontal position are shown in Fig. 3. The evolution of the ice front position varies from profile to profile. Between 1945 and 1995, historical images are sparse but show a maximum position of 4.2, 4.0, and 4.1 km for profiles AA', BB', and CC' respectively. In 2016 and 2019, the terminus of the ice front reaches this maximal position simultaneously for all three profiles. From 2019 to 2021, unprecedentedly observed positions of 7.2 and 6.7 km are reached for profiles AA' and BB' respectively (Fig. 3a, b). Conversely, the ice front position of profile CC' decreases progressively after 2020 due to successive calving events (Fig. 3c). It should be noted that the central profile BB' regularly reached its maximum position before the calving events of 2002 and 2010 (Fig. 3b), while profiles AA' and CC' only reached the maximum position in 2002 or in late 2002 (Fig. 3a). From 2002 to 2010, the ice front position experiences annual calving periods of different lengths depending on the profiles considered: 2002–2008 for profile AA', 2004–2007 for profile BB', and 2003–2010 for profile CC'. A linear regression is performed to obtain the velocity of the ice front progression between the successive calving events (Fig. 3). The velocity varies greatly from one period to another, but it can be observed that the velocities are significantly lower for profile CC' (1.17–1.55 m d−1) than for profiles AA' (0.96–1.79 m d−1) and BB' (1.75–2.12 m d−1).
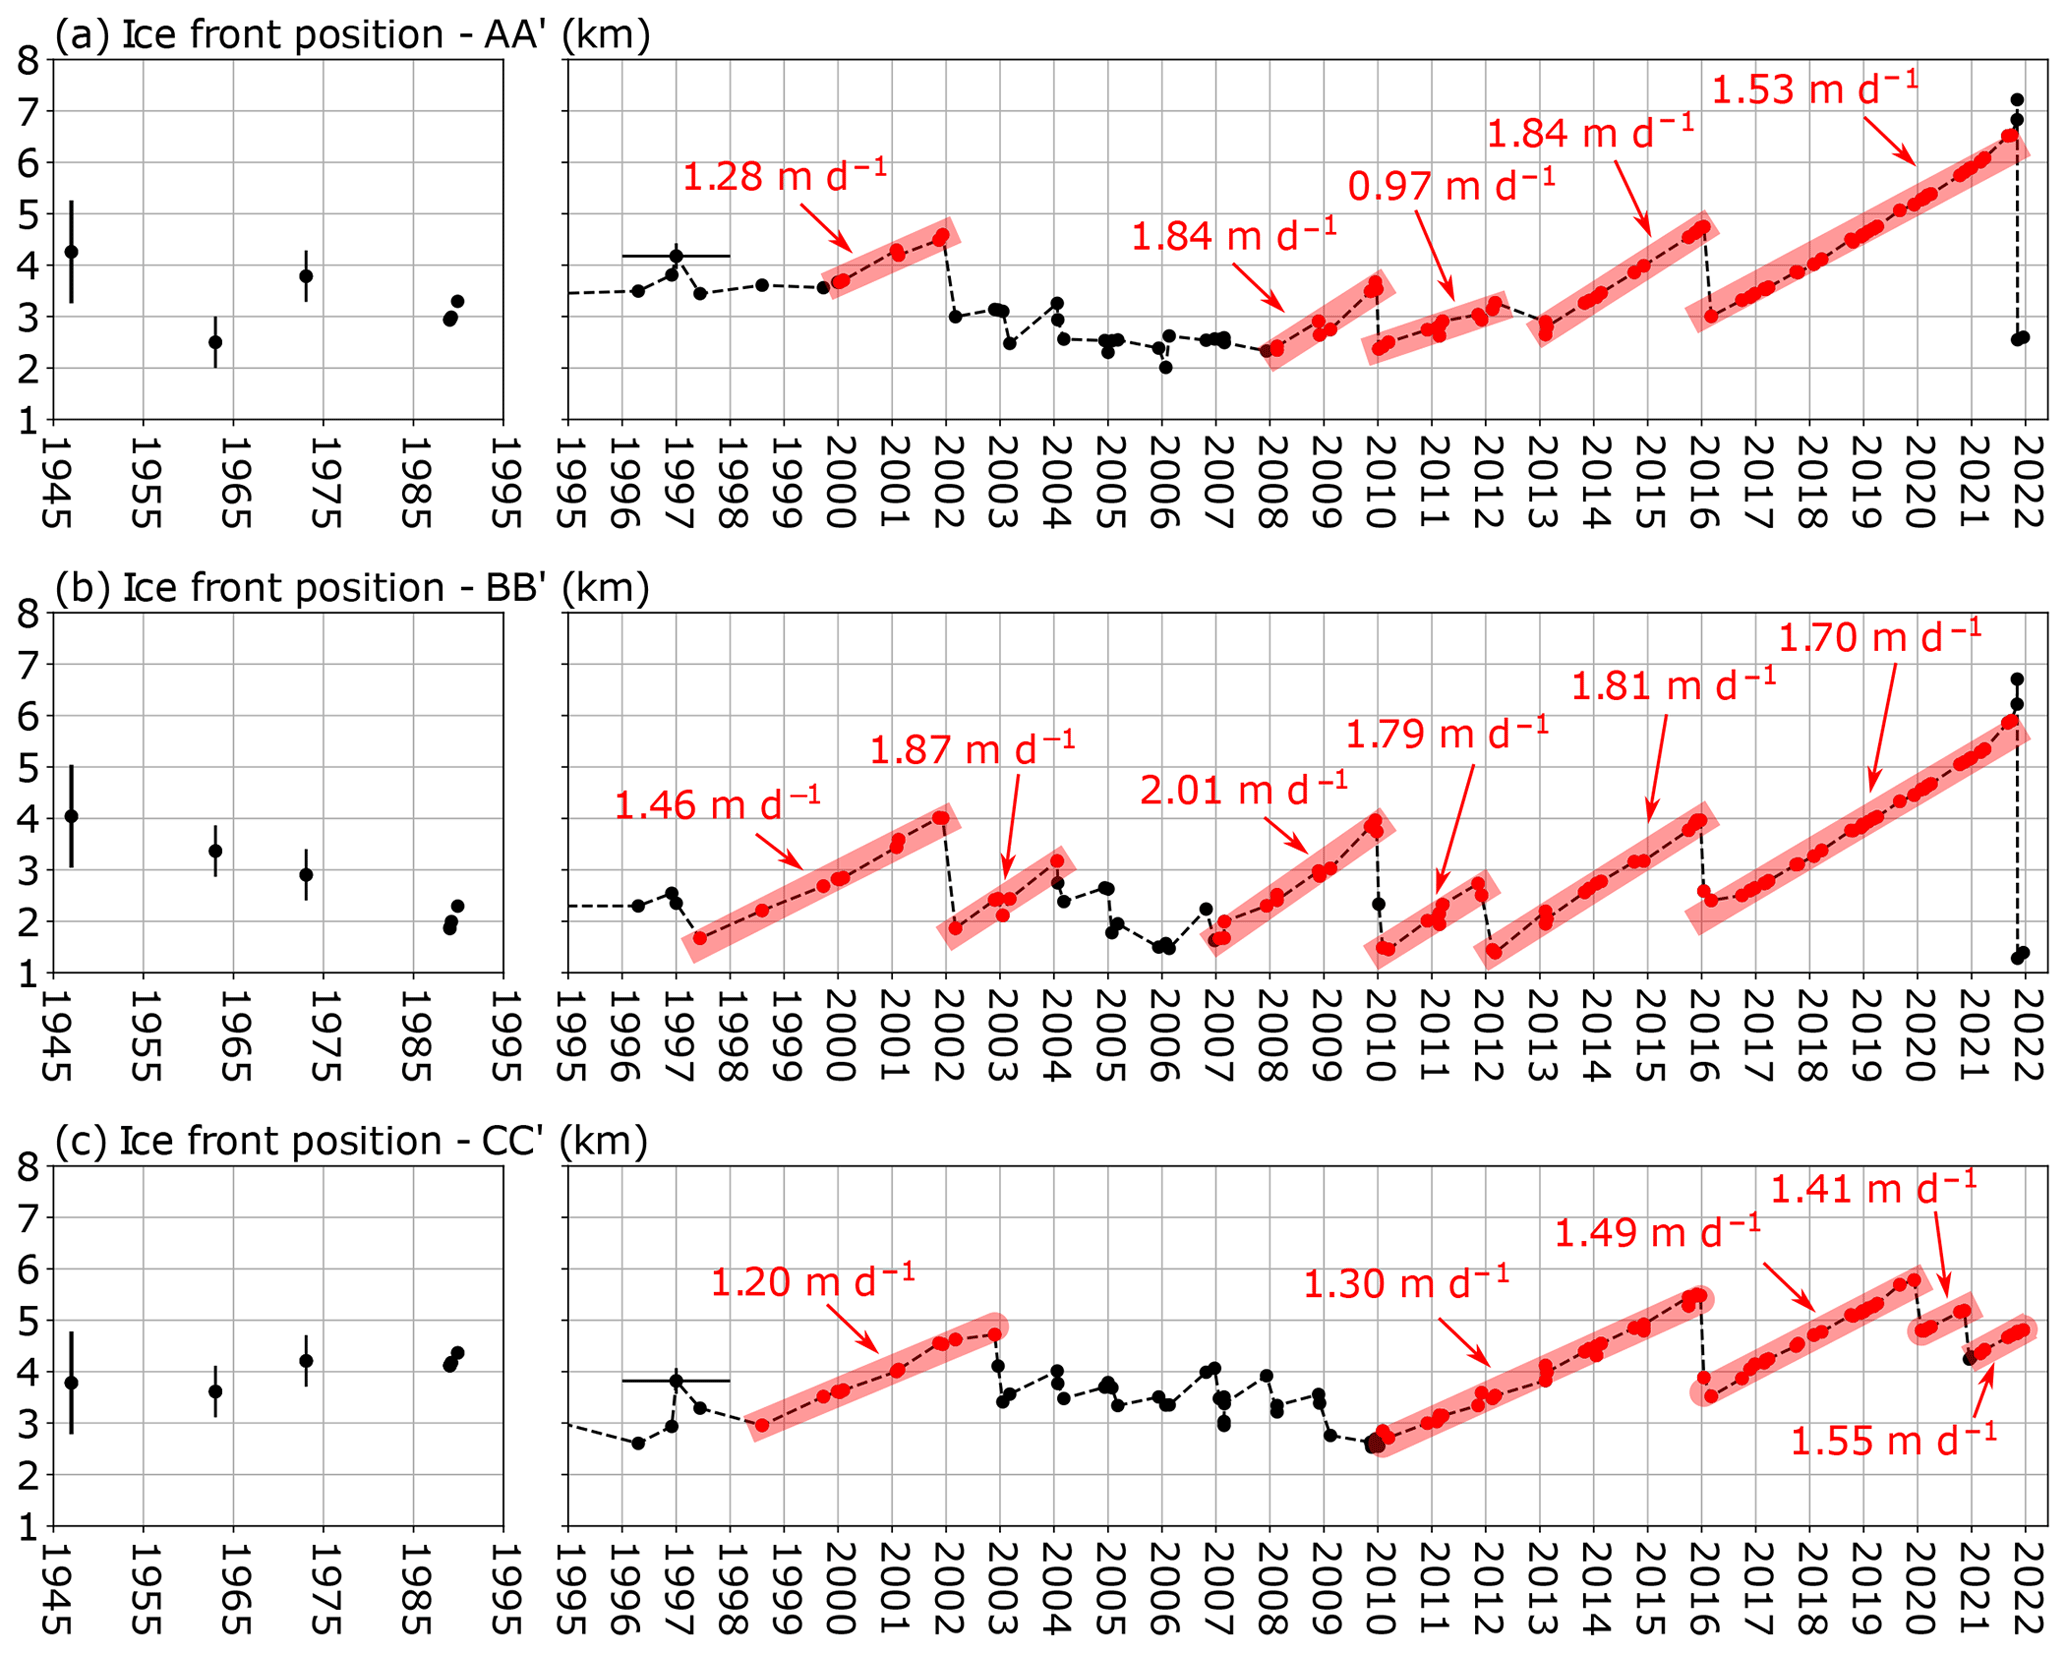
Figure 3Evolution of the position of the glacier terminus along profiles AA' (a), BB' (b), and CC' (c) (see Fig. 1b for the location of the profiles). The velocity of the ice front motion is indicated for the periods of ice front progression. The delineation of the terminus positions is mapped in Fig. 1c–f.
3.2 Ice velocity: 2017–2021
The ice velocity is plotted for each year from 2017 to 2021 (Fig. 4a), together with the derived longitudinal, transverse, and shear strain rates (Fig. 4c, d, and e respectively). The yearly estimation obtained with GDM-OPT-ICE is compared to that measured by in situ instruments (GNSS and the bamboo stake campaign). The in situ data show that the velocity in this part of the glacier is very constant through time (Fig. 2b, c), allowing for a comparison between different years. Figure 4b presents the ice velocity computed with GDM-OPT-ICE and the velocity measured by in situ instrumentation (i.e. GNSS and the bamboo stake campaign). The comparison shows that the estimation of the velocity from GDM-OPT-ICE improves with time, with poor accuracy in 2017 (RMS = 0.76 m d−1) and much better accuracy starting in 2019 (RMS < 0.25 m d−1). One can observe that the gradient of velocity from the western margin to the centre of the glacier is retrieved well with the GDM-OPT-ICE products of 2019–2021 (Fig. 3b), while in 2017 and 2018, the limit between stable ice and the flowing ice tongue is retrieved in the wrong position with the GDM-OPT-ICE products. Indeed, in 2017, the GDM-OPT-ICE velocity of the 9 bamboo sticks located on the western side of the profile is almost zero for all locations. Conversely, a progressive increase in the velocity is measured during the bamboo sick campaign (Fig. 2b) and by the ITS_LIVE products (Fig. 2c). The same is observed in 2018, although the velocity derived from GDM-OPT-ICE is slightly larger than that in 2017 (Fig. 3b). The small number of cloud-free Sentinel-2 acquisitions for those years may explain the small RMS error for these 2 years, as well as the misestimation of the ice tongue boundary.
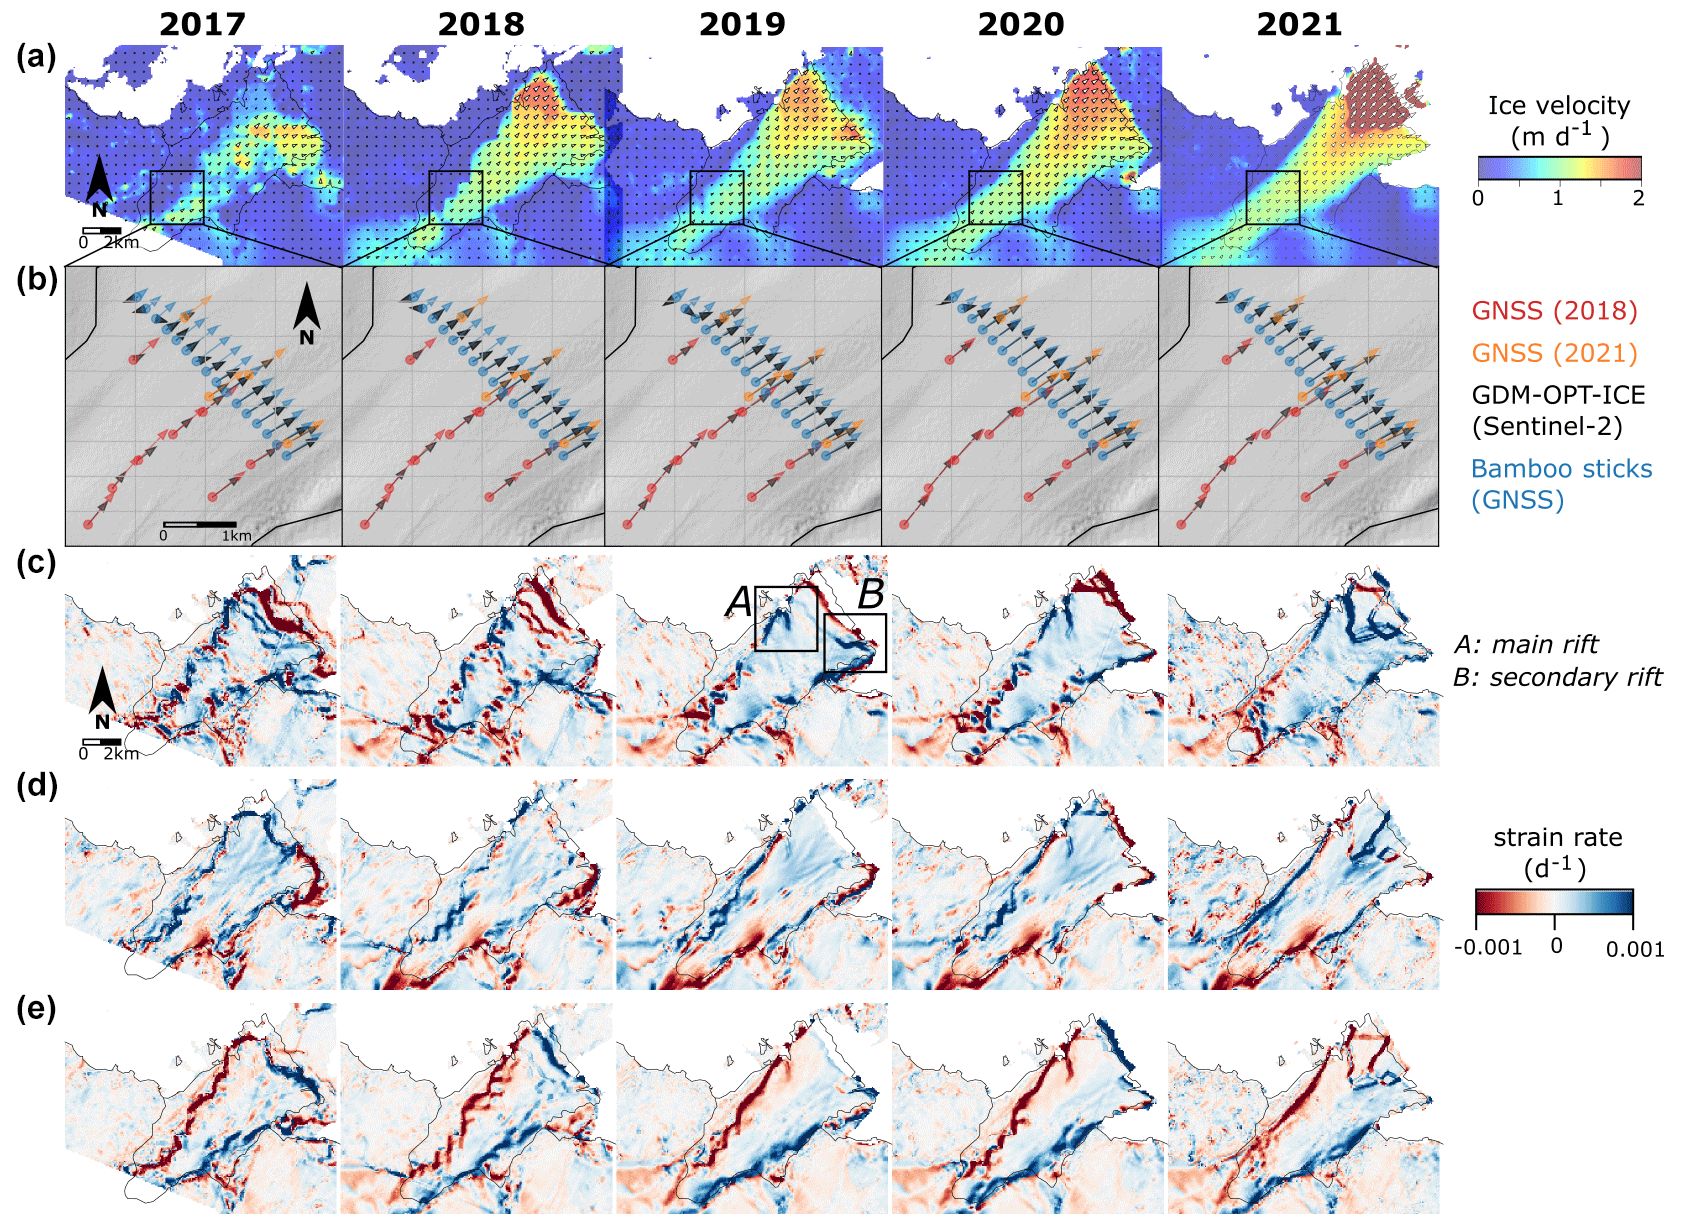
Figure 4(a) Yearly estimation of ice velocity for Astrolabe Glacier for the period of 2017–2021 and (b) comparison of the magnitude and direction of the velocity as measured by the in situ instrumentation (GNSS and bamboo stake campaigns) and as measured by GDM-OPT-ICE. Panels (c–e) present the longitudinal, transversal, and shear strain rates derived from the ice velocity fields.
The velocity field shows a smooth gradient with a lower velocity of about 1 m d−1 in the southeastern part of the glacier and a faster velocity of 1.2–1.5 m d−1 in the northwestern part of the glacier. In 2019, a small block of ice accelerated in the eastern part of the ice front (Fig. 4a), which is also visible in the longitudinal strain rate field (Fig. 4c, the box labelled “B”). This block disappears from both the 2020 mean velocity (Fig. 4a) and the strain rate field (Fig. 4c) due to the calving of this part of the glacier in December 2020 (Fig. 3d, profile CC'). In 2019, an extensive fracture appeared in the western part of the ice tongue in front of the Dumont d'Urville station, clearly visible in the longitudinal and shear components of the strain rate fields (Fig. 4c and e, the box labelled “A”). The northwestern part of the ice tongue begins to exhibit higher velocities simultaneously in 2020 and 2021 (Fig. 4a). In 2021, a complex network of localised increases in strain rates appears on the northwestern part of the glacier, delimiting the potential area of the future iceberg calving (Fig. 4c, d, and e). This complex network delineates the fractures that were observed on the ice in the first available summer acquisition in September 2021 and that remained unchanged until the ice calving (Fig. 1f). In addition to the evolution of the fractures in the ice, one can also observe the high strain rates (>0.002 d−1) that are clearly identifiable along the lateral boundaries of the glacier over time (Fig. 4e).
3.3 Ice tongue break off: 2021
The displacement time series is linearly interpolated with a time step of 30 d from the first acquisition in 2017 to 5 November 2021. Mean monthly velocity and strain rate fields are derived from this interpolation. We examine the evolution of the strain rates for the period of January to November 2021 to understand the dynamics of the recent calving (Fig. 5). The strain rate maps show a high concentration of strain localised along linear structures that grow progressively in length from April 2021 to November 2021. We set a threshold on the strain rates in order to analyse the evolution of these localised strain concentrations as well as the occurrence of the spatial connection between them (Fig. 5a). The evolution of their growth is complex, with transitions from one component to another. For example, the main rift exhibits a clear longitudinal strain rate from April 2021 to September 2021, which evolves into a shear strain rate in October–November 2021 (Fig. 5a). From May 2021, a large concentration of strain appears in the transverse component along a northeast/southwest trending fracture (Fig. 5a). Similarly, a third fracture appears in the longitudinal component on the eastern side (Fig. 5a). These fractures grow rapidly and join in June 2021 (Fig. 5a). One can also observe that starting in October 2021, most of the fractures show a shear strain rate, probably due to the rotation of the blocks. We then analyse the Sentinel-1 synthetic-aperture radar (SAR) images from May 2021 to August 2021 in order to validate these observations. We observe that the fracture network suddenly opened between 13 June 2021 and 25 June 2021 (Fig. 5b, c), which is consistent with the timing of the connection derived from the strain rate time series (Fig. 5a). It can be noted that compressional strain rates are measured from 2017 to 2020 at the terminus of the glacier tongue with an absolute value greater than 0.001 d−1, while they are not observed in 2021 (Fig. 4c).

Figure 5(a) Evolution of the strain rate from April to November 2021 in the longitudinal, transverse, and shear directions. (b) Mapping of the area where the strain rates are larger than 0.002 d−1 from April to November 2021. The three strain rate components (longitudinal, transverse, and shear) are plotted together using different colours. Panels (c) and (d) show the occurrence of the fractures detected by the Sentinel-1 acquisitions of 13 June and 25 June 2021. The white arrows indicate the location of the main rift in panel (c) and of the network of secondary fractures appearing in June 2021 in panel (d).
3.4 Sea-ice forcing
We analyse the time series of sea-ice extent and concentration in the region of Astrolabe Glacier (Fig. 1a). The data for sea-ice extent and concentration were downloaded from the NSIDC repository (Fetterer et al., 2017) and cover the period from 1979 to the end of 2021. We cropped the data to analyse the monthly variation in the sea-ice extent over an area of 4000 km2 around Astrolabe Glacier (dashed blue lines in Fig. 1a). This area is arbitrarily chosen to represent the influence of regional variation in sea-ice conditions. The daily variation in the sea-ice concentration is taken at the pixel (25 km × 25 km) encompassing Astrolabe Glacier (dotted yellow lines in Fig. 1a) to focus on the conditions at the Astrolabe ice tongue.
We observe a significant change in the periodicity of sea ice around Astrolabe Glacier in the last decade (2011–2021). From 1979 to 2011, the extent of the sea ice decreases significantly every year during the summer (Fig. 6a). From 2011 to 2021, the annual disappearing of sea ice does not occur every year (Fig. 6a). Indeed, during two consecutive periods, 2012–2016 and 2016–2021, the extent of the sea ice remains at maximum during the summer (Fig. 6a). In detail, one can see that during those two periods, the sea-ice extent decreased occasionally (e.g. early 2015 and 2018) or during longer periods such as the 2018–2019 austral summer (Fig. 6a). However, the reduced length or absence of sea-ice-free periods during 2012–2016 and 2016–2021 is notably different from the previous decades. The time series of daily sea-ice concentration shows similar observations (Fig. 6b). Before 2011, the sea-ice concentration drops below 15 % for periods of 2 to 3–4 months from November to mid-March, with small variations in the length of sea-ice-free periods (Fig. 6b). From 2008 to 2011, one can observe a decrease in the duration of low sea-ice concentration to 2 months (Fig. 6b, d), corresponding to a shift in the onset of the sea-ice-free period from November to mid-December/January, while the end of the sea-ice-free period remains stable over time: early to mid-March. From 2012 to 2016, the sea-ice-free periods disappear or are shortened to less than 1 month (i.e. February 2015; Fig. 6d). From 2016 to 2021, the regime of sea-ice concentration is highly variable, with years of no to very short periods of sea-ice-free conditions (austral summer 2016–2017, February 2020; Fig. 6b, d) and years of prolonged sea-ice-free conditions (December 2018–March 2019). From austral summer 2020–2021, the duration of sea-ice-free conditions seems to return to the pre-2012 level, with a duration of 3–4 months from mid-November to March (Fig. 6b, d).
We compare the evolution of sea-ice extent and concentration with the evolution of ice tongue area (Fig. 6c). We observe that the periods of 2012–2016 and 2016–2021 correspond to periods of significant extension of the Astrolabe ice tongue (Fig. 6c), with an increase of 15 km2 between 2012 and 2016 and of almost 20 km2 between 2016 and 2021. For the period of 2002–2012, the ice tongue extension is much more limited due to regular calving at different locations on the ice front (Fig. 3). Before 2002, satellite imagery is scarcer, but the ice tongue appears to have reached a fairly advanced position in 2002, with an area of almost 81 km2. This advance cannot be linked to significant variations in the sea-ice seasonal cycle. We report the calving events observed in the analysed satellite images (Fig. 6d) with the uncertainty in the date of the different calving events. One can observe that all detected calving occurs when sea-ice concentration decreases at the end of the austral autumn (Fig. 5d), except for the austral summer of 2006–2007 when several calving events are reported and do not necessarily occur at the onset of the decrease in sea-ice concentration.
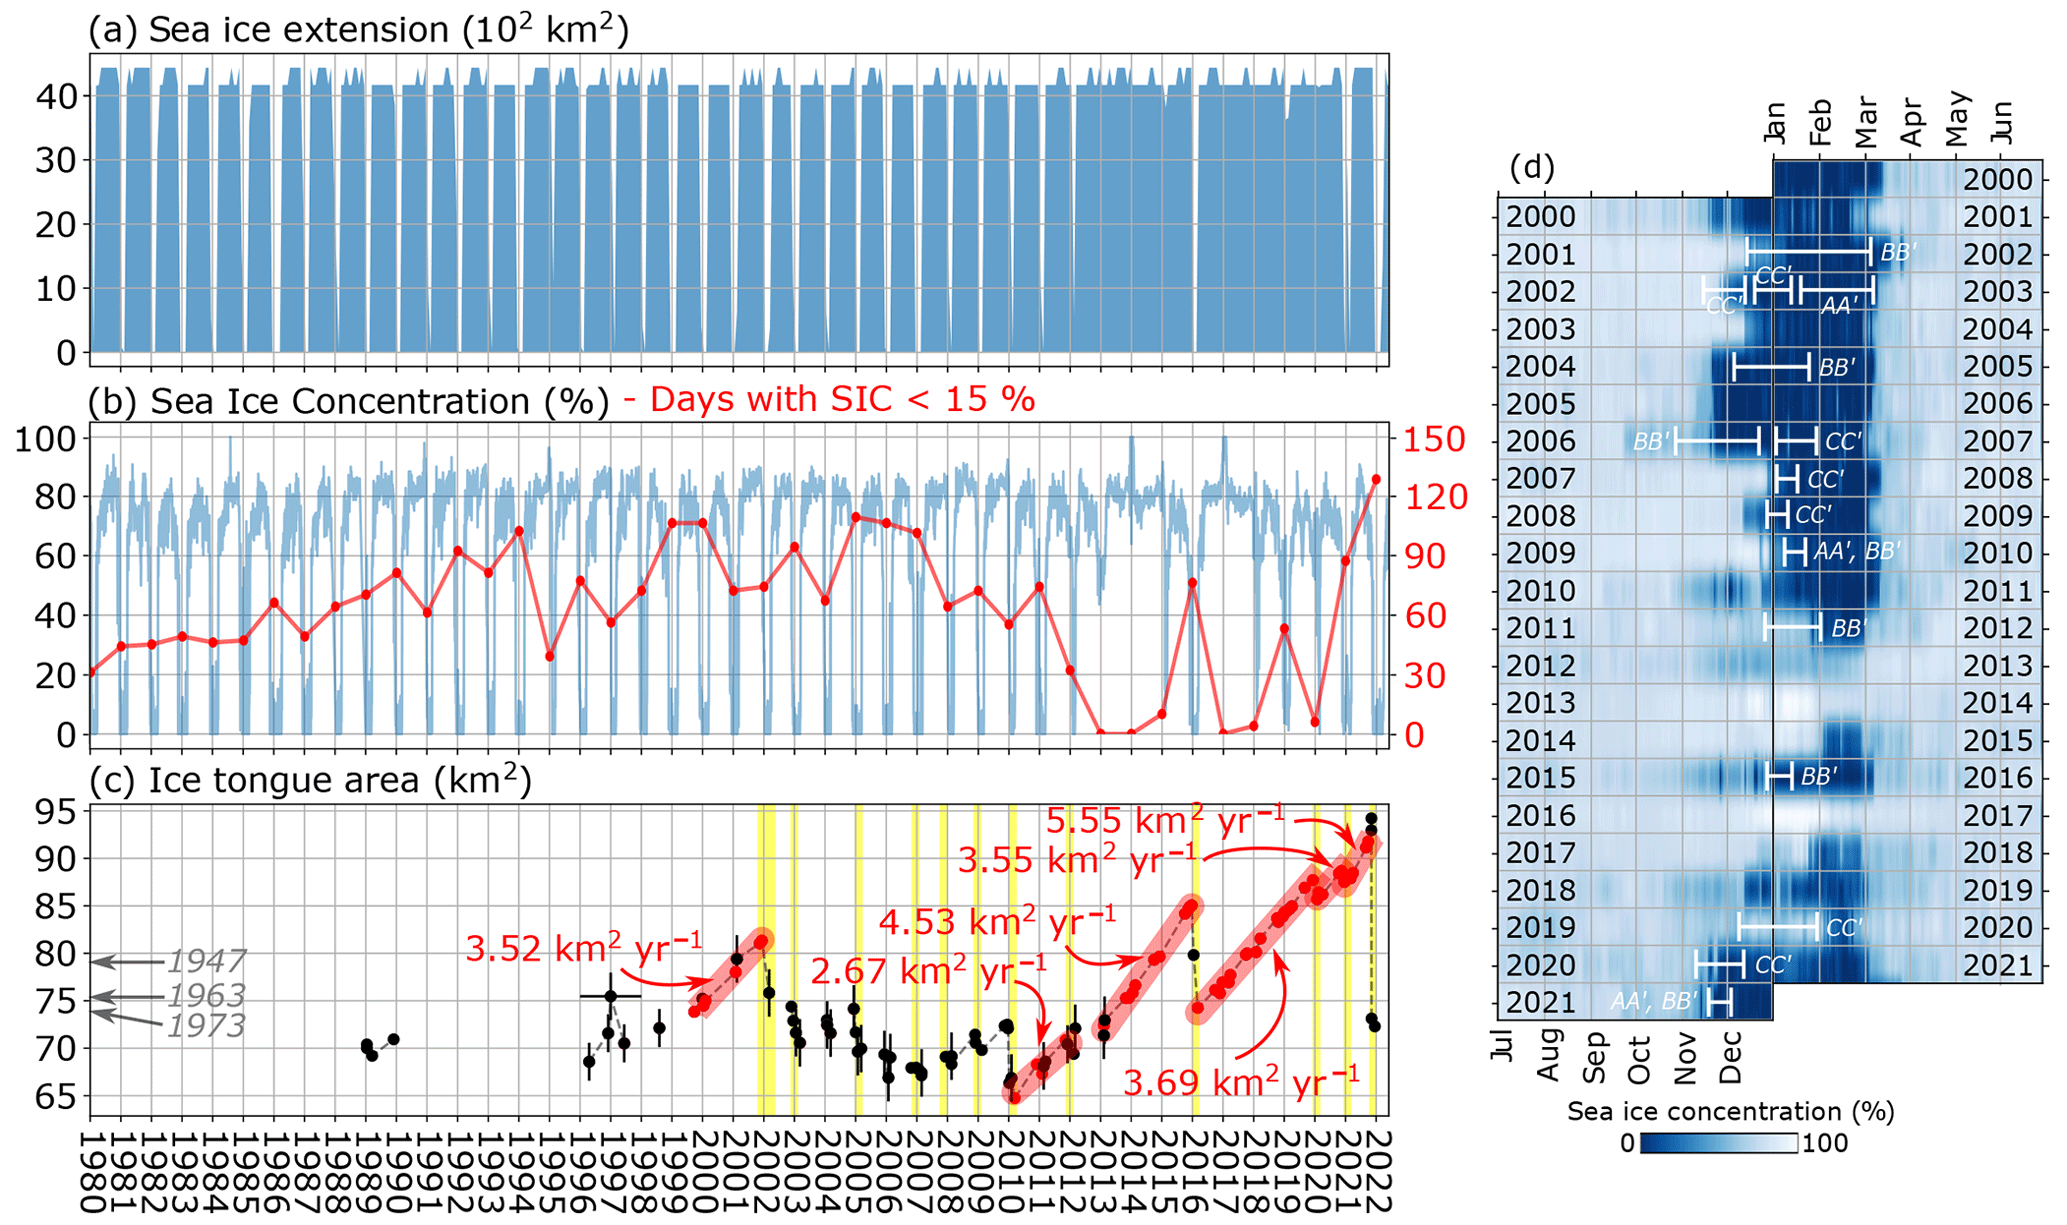
Figure 6Evolution of monthly sea-ice extent (a) and daily sea-ice concentration, with the number of days of sea-ice concentration lower than 15 % in red (b). Monthly sea-ice extent is computed for a wide region of 4000 km2 around Astrolabe Glacier (dotted blue line in Fig. 1a), while the daily sea-ice concentration is taken for the 25 km by 25 km pixel at the Astrolabe ice tongue (dotted yellow line in Fig. 1a), and both are extracted from Fetterer et al. (2017). The evolution of the ice tongue area is presented in (c) with the period of extension and the ice tongue growth speed in red. Calving events that were observed by satellite imagery are plotted in yellow. In 2003–2005 calving likely occurred, although no observation can confirm the dates. Panel (d) also presents the evolution of the daily sea-ice concentration from 2000 to 2021, and calving events are reported.
To understand the recent evolution of Astrolabe Glacier, we investigated the evolution of sea ice in the vicinity of the Astrolabe ice tongue. The evolution of sea ice, and of landfast sea ice in particular, is usually assumed to delay the break-up of ice tongues and favour its extension by buttressing the ice tongues and protecting them from ocean swells (Massom et al., 2010, 2018; Rott et al., 2018; Gomez-Fell et al., 2022). At Astrolabe Glacier, we observe a significant change in the periodicity of sea ice in the last decade (2011–2021) compared to the previous observations (1979–2011; Fig. 6). The recent multiyear periods of sea ice are correlated well with the spatial extension of the Astrolabe ice tongue (Fig. 6) and seem to validate the assumption that sea ice protects the ice tongue and favours its extension. Furthermore, the disappearance of such protection has been reported to trigger crack propagation, in some cases leading to rapid calving (Miles et al., 2017; Cassotto et al., 2021; Gomez-Fell et al., 2022; Christie et al., 2022). At Astrolabe Glacier, we also observe that the calving, when it occurs, systematically takes place at the beginning of the sea-ice disappearance (Fig. 6d), which seems to confirm the potential of sea-ice disappearance as a triggering factor for calving. However, the analysis of satellite images from 2017 to 2021 at the Astrolabe ice tongue shows that the rifts or crevasses that lead to the 2021 calving event form several months to years before calving (Figs. 4, 5), suggesting a different mechanism. The presence of rift and fracture networks in the ice tongue several months to several years prior to calving has been reported in other glaciers (Fricker et al., 2005; Walker et al., 2013, 2015; Cheng et al., 2021; Larour et al., 2021; Gomez-Fell et al., 2022). In most cases, rift growth or (re)activation is observed during the austral summer (Fricker et al., 2005; Walker et al., 2013; Cheng et al., 2021; Gomez-Fell et al., 2022), and little rift propagation is reported during the austral winter (Walker et al., 2013; Larour et al., 2021). On the Astrolabe Glacier ice tongue, the main rift is located in front of the Dumont d'Urville research station and began in 2019, a year with almost 2 consecutive months of low sea-ice concentration. The absence of a significant rift in 2017 and 2018 suggests that sea ice had the effect of inhibiting rift growth on the Astrolabe ice tongue and delaying calving in 2017–2018 and, possibly, in 2012–2016. We note that no calving occurred in 2019 despite the long period of low sea-ice concentration, while in 2020, the eastern part of the ice tongue calved at the onset of the short (1 month) period of sea-ice concentration decrease (Fig. 6d). These observations suggest that sea ice acts as a glue to hold the ice tongue together and that deeply opened rifts/cracks must be present for calving to occur.
In June 2021, we observe the sudden opening of a complex network of fractures in the middle of the austral winter (Fig. 5). Larour et al. (2021) proposed a mechanism to explain the winter propagation at the Larsen ice shelf C, Antarctica, prior to the calving of iceberg A68 based on the critical thinning of the ice shelf and of the ice melange within the rifts. Here, the critical thinning of the ice tongue due to its exceptional extension may explain this timing (Robel, 2017; Larour et al., 2021; Åström and Benn, 2019), although it would likely favour the propagation of the rift along the same direction as the pre-existing rift, which is not observed at Astrolabe Glacier (Fig. 5). Instead, the main fracture propagating in June 2021 is oriented along the flow direction and opened in extension (Fig. 5a, b). Another possible explanation for the development of these fractures could be a transition from ductile to brittle behaviour, with a decrease in temperature during winter that may favour fractures along the flow resulting from the differential compressive load due to sea-ice buttressing and rift opening (Fig. 4). This mechanism might be possible, as the compressive longitudinal strain seems to disappear in 2021 at the glacier terminus (Fig. 4c), and the rift opens progressively. However, such a scenario remains to be validated because it would keep the terminus of the ice tongue in the same position due to the effect of sea-ice buttressing, which is not observed (Fig. 4c, d), and because the compressive strength of the ice is much higher than the extensive strength (Benn et al., 2007). The presence of extensive circumferential stress that occurs when the unconfined part of the ice tongue reaches a certain extension (Wearing et al., 2020) should be also considered, as well as the presence of basal channels and basal melt that may play a role in the dislocation of the ice tongue (Vaughan et al., 2012; Alley et al., 2023). The differences in calving cycles and ice velocity between the eastern and western parts of the glacier terminus also suggest that the bathymetry beneath the ice tongue controls the location and evolution of the rifts. Our analysis remains limited, and further modelling is needed to understand the mechanisms that lead to the appearance of these fractures at this time of the year (Åström and Benn, 2019; Crawford et al., 2021; Alley et al., 2023).
Sea ice is strongly linked to regional and local atmospheric and oceanic conditions (Fogt et al., 2022). At the continental scale, records in Antarctica show a positive increase in the sea-ice extent from 1979 to 2016, with a minimum global sea-ice extent recorded in summer 2017 (Fogt et al., 2022). In the Astrolabe region, which includes the Adélie Coast and George V Land, the calving of the Mertz ice tongue in 2010 (Massom et al., 2018) led to strong changes in sea-ice production and location, reflecting regional changes in the oceanic and atmospheric currents (Campagne et al., 2015). The Mertz ice tongue was hit by the B09B iceberg in 2010 and lost about 80 km of its length (Massom et al., 2015). Campagne et al. (2015) show that calving of the Mertz ice tongue is directly responsible for a 50 % increase in sea-ice concentration in the Mertz Glacier polynya. The Mertz ice tongue probably acts as a barrier to westward ice advection within the Adélie Depression (Lacarra et al., 2014; Campagne et al., 2015), and its regular calving is followed by decades of high sea-ice concentration before the tongue regains sufficient length (Campagne et al., 2015). The region of the Astrolabe Glacier some 230 km to the west appears to be undergoing similar changes (Fig. 6), and the calving of the Mertz ice tongue is likely at the origin of the transition in the sea-ice seasonal cycle at Astrolabe Glacier (Fig. 6). Moreover, Miles et al. (2022) report similar observations further west on the Adélie Coast, with continuous growth of the Commandant Glacier (Adélie Coast) from 2010 to 2018 due to the presence of persistent sea ice. This illustrates how a calving event such as the Mertz ice tongue calving in 2010 can significantly alter the calving cycle of neighbouring ice tongues several hundred kilometres away, which remains difficult to account for in current models (Edwards et al., 2021; Miles et al., 2022). The extent of the regional impact of the 2010 Mertz ice tongue calving is not clearly known, as most studies focus on the George V Land area and the Adélie Depression (Kusahara et al., 2011, 2017; Campagne et al., 2015; Cougnon et al., 2017). In addition, the evolution of the Adélie Coast and George V Land ice shelves remains limited (Frezzotti et al., 1998; Frezzotti and Polizzi, 2002), preventing a better understanding of the environmental forcing (Massom et al., 2018; Christie et al., 2022).
In this study, we analysed the evolution of Astrolabe Glacier located on the Adélie Coast, Antarctica. We used open-access optical-satellite imagery (MODIS, ASTER, Landsat, and Sentinel-2) along with ERS and RADARSAT images to map the evolution of the ice front from 1947 to 2022. We also measure the surface velocity and derived strain rate fields between 2017 and 2022 using image correlation of Sentinel-2 images. The recent evolution of the glacier shows an unprecedentedly documented extension of 95 km2 favoured by the concomitant high concentration of the sea ice in the region during 2011–2021, in comparison with previous records (2000–2011). Early sea-ice melt in November 2021 favoured the release of a 20 km2 iceberg in the northwestern part of Astrolabe Glacier. This is the first time that a calving of this size has been documented on Astrolabe Glacier. We also observed that a complex network of fractures opened during the austral winter in June 2021, several months before the iceberg calved. This study demonstrates the importance of time series of ice velocity and strain rate fields derived from high-resolution optical-satellite imagery in documenting fracture opening and raises further questions about the mechanism of fracture propagation.
We acknowledge the use of imagery from Copernicus Sentinel-1 and 2 data (https://dataspace.copernicus.eu/, last access: January 2023) and NASA MODIS, ASTER, and Landsat images (from https://earthexplorer.usgs.gov/, last access: January 2023). The GNSS observations are accessible upon request to the authors. The Astrolabe sketch from the US Navy Operation Highjump aerial photographs of the Adélie Coast is available at https://archives-polaires.fr/idurl/1/14865 (Archives Polaires Françaises, 2023). We also acknowledge the use of NASA MEaSUREs ITS_LIVE data at https://doi.org/10.5067/6II6VW8LLWJ7 (Gardner et al., 2022) and of the NSIDC Sea Ice Index data set at https://doi.org/10.7265/N5K072F8 (Fetterer et al., 2017). The data processed in this study are available at https://geohazards-tep.eu/ (last access: June 2024) and upon request.
FP designed the experiments with contributions from DZ, ELM, JPM, and CH. ELM provided the GNSS data, and JPM processed them. FP processed the satellite data. All co-authors participated in the writing, revision, and/or approval of the submitted paper.
The contact author has declared that none of the authors has any competing interests.
Publisher’s note: Copernicus Publications remains neutral with regard to jurisdictional claims made in the text, published maps, institutional affiliations, or any other geographical representation in this paper. While Copernicus Publications makes every effort to include appropriate place names, the final responsibility lies with the authors.
The GDM-OPT-ICE service was developed and maintained by ForM@Ter (Data and Service for the Solid Earth, https://en.poleterresolide.fr, last access: June 2024) and run on the EOST/A2S High-Performance Computing (HPC) infrastructure of the University of Strasbourg (1.5 Tier Mesocentre), allowing optimised computation. The service is accessible on-demand through the ForM@Ter data hub (https://en.poleterresolide.fr/services-en/gdm-en/#/optic, last access: June 2024) and at the Geohazards Exploitation Platform (GEP, https://geohazards-tep.eu, last access: June 2024). The authors thank the two anonymous reviewers for their constructive comments that helped improve the manuscript.
This work was supported by the French Agence Nationale de la Recherche (ANR), grant no. ANR-20-CE01-0006 (project HighLand). The GNSS data were collected with support from the French Polar Institute (IPEV) as part of project no. 1053 DACOTA.
This paper was edited by Chris R. Stokes and reviewed by two anonymous referees.
Alley, K. E., Scambos, T. A., Anderson, R. S., Rajaram, H., Pope, A., and Haran, T. M.: Continent-wide estimates of Antarctic strain rates from Landsat 8-derived velocity grids, J. Glaciol., 64, 321–332, https://doi.org/10.1017/jog.2018.23, 2018. a, b
Alley, R., Cuffey, K., Bassis, J., Alley, K., Wang, S., Parizek, B., Anandakrishnan, S., Christianson, K., and DeConto, R.: Iceberg Calving: Regimes and Transitions, Annu. Rev. Earth Pl. Sc., 51, 189–215, https://doi.org/10.1146/annurev-earth-032320-110916, 2023. a, b, c, d, e, f
Altena, B., Haga, O. N., Nuth, C., and Kääb, A.: Monitoring Sub-Weekly Evolution of Surface Velocity and Elevation for a High-Latitude Surging Glacier Using Sentinel-2, Int. Arch. Photogramm. Remote Sens. Spatial Inf. Sci., XLII-2/W13, 1723–1727, https://doi.org/10.5194/isprs-archives-XLII-2-W13-1723-2019, 2019. a
Archives Polaires Françaises: Altimétrique du glacier de l'Astrolabe, Archives Polaires Françaises [data set], https://archives-polaires.fr/idurl/1/14865 last access: October 2023. a
Åström, J. A. and Benn, D. I.: Effective rheology across the fragmentation transition for sea ice and ice shelves, Geophys. Res. Lett., 46, 13099–13106, https://doi.org/10.1029/2019GL084896, 2019. a, b
Avouac, J.-P., Ayoub, F., Leprince, S., Konca, O., and Helmberger, D. V.: The 2005, Mw 7.6 Kashmir earthquake: Sub-pixel correlation of ASTER images and seismic waveforms analysis, Earth Planet. Sc. Lett., 249, 514–528, https://doi.org/10.1016/j.epsl.2006.06.025, 2006. a
Banwell, A. F., MacAyeal, D. R., and Sergienko, O. V.: Breakup of the Larsen B Ice Shelf triggered by chain reaction drainage of supraglacial lakes, Geophys. Res. Lett., 40, 5872–5876, https://doi.org/10.1002/2013GL057694, 2013. a
Baumhoer, C. A., Dietz, A. J., Dech, S., and Kuenzer, C.: Remote sensing of antarctic glacier and ice-shelf front dynamics – A review, Remote Sensing, 10, 1445, https://doi.org/10.3390/rs10091445, 2018. a, b
Baumhoer, C. A., Dietz, A. J., Heidler, K., and Kuenzer, C.: IceLines – A new data set of Antarctic ice shelf front positions, Scientific Data, 10, 138, https://doi.org/10.1038/s41597-023-02045-x, 2023. a
Benn, D. I., Warren, C. R., and Mottram, R. H.: Calving processes and the dynamics of calving glaciers, Earth-Sci. Rev., 82, 143–179, https://doi.org/10.1016/j.earscirev.2007.02.002, 2007. a
Bindschadler, R., Choi, H., Wichlacz, A., Bingham, R., Bohlander, J., Brunt, K., Corr, H., Drews, R., Fricker, H., Hall, M., Hindmarsh, R., Kohler, J., Padman, L., Rack, W., Rotschky, G., Urbini, S., Vornberger, P., and Young, N.: Getting around Antarctica: new high-resolution mappings of the grounded and freely-floating boundaries of the Antarctic ice sheet created for the International Polar Year, The Cryosphere, 5, 569–588, https://doi.org/10.5194/tc-5-569-2011, 2011. a
Bontemps, N., Lacroix, P., and Doin, M.-P.: Inversion of deformation fields time-series from optical images, and application to the long term kinematics of slow-moving landslides in Peru, Remote Sens. Environ., 210, 144–158, https://doi.org/10.1016/j.rse.2018.02.023, 2018. a
Borstad, C., McGrath, D., and Pope, A.: Fracture propagation and stability of ice shelves governed by ice shelf heterogeneity, Geophys. Res. Lett., 44, 4186–4194, https://doi.org/10.1002/2017GL072648, 2017. a
Campagne, P., Crosta, X., Houssais, M.-N., Swingedouw, D., Schmidt, S., Martin, A., Devred, E., Capo, S., Marieu, V., Closset, I., and Massé, G.: Glacial ice and atmospheric forcing on the Mertz Glacier Polynya over the past 250 years, Nat. Commun., 6, 6642, https://doi.org/10.1038/ncomms7642, 2015. a, b, c, d, e, f
Cassotto, R. K., Burton, J. C., Amundson, J. M., Fahnestock, M. A., and Truffer, M.: Granular decoherence precedes ice mélange failure and glacier calving at Jakobshavn Isbræ, Nat. Geosci., 14, 417–422, https://doi.org/10.1038/s41561-021-00754-9, 2021. a
Chambers, C., Greve, R., Obase, T., Saito, F., and Abe-Ouchi, A.: Mass loss of the Antarctic ice sheet until the year 3000 under a sustained late-21st-century climate, J. Glaciol., 68, 605–617, https://doi.org/10.1017/jog.2021.124, 2022. a
Cheng, Y., Xia, M., Qiao, G., Lv, D., Li, Y., and Hai, G.: Imminent calving accelerated by increased instability of the Brunt Ice Shelf, in response to climate warming, Earth Planet. Sc. Lett., 572, 117132, https://doi.org/10.1016/j.epsl.2021.117132, 2021. a, b, c
Christie, F. D., Benham, T. J., Batchelor, C. L., Rack, W., Montelli, A., and Dowdeswell, J. A.: Antarctic ice-shelf advance driven by anomalous atmospheric and sea-ice circulation, Nat. Geosci., 15, 356–362, https://doi.org/10.1038/s41561-022-00938-x, 2022. a, b, c, d
Cougnon, E., Galton-Fenzi, B., Rintoul, S., Legresy, B., Williams, G., Fraser, A., and Hunter, J.: Regional changes in icescape impact shelf circulation and basal melting, Geophys. Res. Lett., 44, 11–519, https://doi.org/10.1002/2017GL074943, 2017. a
Crawford, A. J., Benn, D. I., Todd, J., Åström, J. A., Bassis, J. N., and Zwinger, T.: Marine ice-cliff instability modeling shows mixed-mode ice-cliff failure and yields calving rate parameterization, Nat. Commun., 12, 2701, https://doi.org/10.1038/s41467-021-23070-7, 2021. a
Dehecq, A., Gourmelen, N., and Trouve, E.: Deriving large-scale glacier velocities from a complete satellite archive: Application to the Pamir–Karakoram–Himalaya, Remote Sens. Environ., 162, 55–66, https://doi.org/10.1016/j.rse.2015.01.031, 2015. a
Doin, M.-P., Guillaso, S., Jolivet, R., Lasserre, C., Lodge, F., Ducret, G., and Grandin, R.: Presentation of the small baseline NSBAS processing chain on a case example: the Etna deformation monitoring from 2003 to 2010 using Envisat data, in: Proceedings of the Fringe symposium, Frascati, Italy, 2011, ESA SP-697, 3434–3437, https://earth.esa.int/eogateway/documents/20142/37627/Presentation_small_baseline_NSBAS_Etna_deformation_Envisat.pdf (last access: June 2024), 2011. a
Drouet, A.-S.: Dynamique du glacier émissaire des processus à l'application sur un glacier école, Astrolabe, Antarctique de l'Est, PhD thesis, Université de Grenoble, https://theses.hal.science/tel-00843026/file/Drouet.pdf (last access: June 2024), 2012. a
Edwards, T. L., Nowicki, S., Marzeion, B., et al.: Projected land ice contributions to twenty-first-century sea level rise, Nature, 593, 74–82, https://doi.org/10.1038/s41586-021-03302-y, 2021. a
Fetterer, F., K., Knowles, W. N., Meier, M., Savoie, and Windnagel, A. K.: Sea Ice Index, Version 3, National Snow and Ice Data Center [data set], https://doi.org/10.7265/N5K072F8, 2017. a, b, c, d
Fogt, R. L., Sleinkofer, A. M., Raphael, M. N., and Handcock, M. S.: A regime shift in seasonal total Antarctic sea ice extent in the twentieth century, Nat. Clim. Change, 12, 54–62, https://doi.org/10.1038/s41558-021-01254-9, 2022. a, b
Frezzotti, M. and Polizzi, M.: 50 years of ice-front changes between the Adélie and Banzare Coasts, East Antarctica, Ann. Glaciol., 34, 235–240, https://doi.org/10.3189/172756402781817897, 2002. a, b, c
Frezzotti, M., Cimbelli, A., and Ferrigno, J. G.: Ice-front change and iceberg behaviour along Oates and George V Coasts, Antarctica, 1912–96, Ann. Glaciol., 27, 643–650, https://doi.org/10.3189/1998AoG27-1-643-650, 1998. a
Fricker, H., Young, N., Coleman, R., Bassis, J., and Minster, J.-B.: Multi-year monitoring of rift propagation on the Amery Ice Shelf, East Antarctica, Geophys. Res. Lett., 32, L02502, https://doi.org/10.1029/2004GL021036, 2005. a, b
Gardner, A., Fahnestock, M., and Scambos, T.: MEaSUREs ITS_LIVE Regional Glacier and Ice Sheet Surface Velocities, Version 1, NASA National Snow and Ice Data Center Distributed Active Archive Center [data set], https://doi.org/10.5067/6II6VW8LLWJ7, 2022. a, b, c, d
Gerrish, L., Fretwell, P., and Cooper, P.: High resolution vector polylines of the Antarctic coastline (7.6), UK Polar Data Centre, Natural Environment Research Council, UK Research & Innovation [data set], https://doi.org/10.5285/45174e8c-7ce8-4d87-a6f7-570db476c6c9, 2022. a
Gomez-Fell, R., Rack, W., Purdie, H., and Marsh, O.: Parker Ice Tongue Collapse, Antarctica, Triggered by Loss of Stabilizing Land-Fast Sea Ice, Geophys. Res. Lett., 49, e2021GL096156, https://doi.org/10.1029/2021GL096156, 2022. a, b, c, d, e, f
Gudmundsson, G. H., Paolo, F. S., Adusumilli, S., and Fricker, H. A.: Instantaneous Antarctic ice sheet mass loss driven by thinning ice shelves, Geophys. Res. Lett., 46, 13903–13909, https://doi.org/10.1029/2019GL085027, 2019. a
Jezek, K. C., Curlander, J. C., Carsey, F., Wales, C., and Barry., R. G.: RAMP AMM-1 SAR Image Mosaic of Antarctica, Version 2, NASA National Snow and Ice Data Center Distributed Active Archive Center [data set], https://doi.org/10.5067/8AF4ZRPULS4H, 2013. a
Joughin, I., Smith, B. E., and Howat, I. M.: A complete map of Greenland ice velocity derived from satellite data collected over 20 years, J. Glaciol., 64, 1–11, https://doi.org/10.1017/jog.2017.73, 2018. a
Kusahara, K., Hasumi, H., and Williams, G. D.: Impact of the Mertz Glacier Tongue calving on dense water formation and export, Nat. Commun., 2, 159, https://doi.org/10.1038/ncomms1156, 2011. a
Kusahara, K., Hasumi, H., Fraser, A. D., Aoki, S., Shimada, K., Williams, G. D., Massom, R., and Tamura, T.: Modeling ocean–cryosphere interactions off Adélie and George V land, east Antarctica, J. Climate, 30, 163–188, https://doi.org/10.1175/JCLI-D-15-0808.1, 2017. a
Lacarra, M., Houssais, M.-N., Herbaut, C., Sultan, E., and Beauverger, M.: Dense shelf water production in the Adélie Depression, East Antarctica, 2004–2012: Impact of the Mertz Glacier calving, J. Geophys. Res.-Oceans, 119, 5203–5220, https://doi.org/10.1002/2013JC009124, 2014. a
Larour, E., Rignot, E., Poinelli, M., and Scheuchl, B.: Physical processes controlling the rifting of Larsen C Ice Shelf, Antarctica, prior to the calving of iceberg A68, P. Natl. Acad. Sci. USA, 118, e2105080118, https://doi.org/10.1073/pnas.2105080118, 2021. a, b, c, d, e, f
Le Meur, E., Sacchettini, M., Garambois, S., Berthier, E., Drouet, A. S., Durand, G., Young, D., Greenbaum, J. S., Holt, J. W., Blankenship, D. D., Rignot, E., Mouginot, J., Gim, Y., Kirchner, D., de Fleurian, B., Gagliardini, O., and Gillet-Chaulet, F.: Two independent methods for mapping the grounding line of an outlet glacier – an example from the Astrolabe Glacier, Terre Adélie, Antarctica, The Cryosphere, 8, 1331–1346, https://doi.org/10.5194/tc-8-1331-2014, 2014. a, b
Leprince, S., Barbot, S., Ayoub, F., and Avouac, J.-P.: Automatic and precise orthorectification, coregistration, and subpixel correlation of satellite images, application to ground deformation measurements, IEEE T. Geosci. Remote, 45, 1529–1558, https://doi.org/10.1109/TGRS.2006.888937, 2007. a
Liang, Q., Li, T., Howat, I., Xiao, W., Hui, F., Chen, Z., Zheng, L., and Cheng, X.: Ice tongue calving in Antarctica triggered by the Hunga Tonga volcanic tsunami, January 2022, Sci. Bull., 68, 456–459, https://doi.org/10.1016/j.scib.2023.02.022, 2023. a
Liu, Y., Moore, J. C., Cheng, X., Gladstone, R. M., Bassis, J. N., Liu, H., Wen, J., and Hui, F.: Ocean-driven thinning enhances iceberg calving and retreat of Antarctic ice shelves, P. Natl. Acad. Sci. USA, 112, 3263–3268, https://doi.org/10.1073/pnas.1415137112, 2015. a
Massom, R., Hill, K., Lytle, V., Worby, A., Paget, M., and Allison, I.: Effects of regional fast-ice and iceberg distributions on the behaviour of the Mertz Glacier polynya, East Antarctica, Ann. Glaciol., 33, 391–398, https://doi.org/10.3189/172756401781818518, 2001. a, b
Massom, R., Giles, A. B., Fricker, H. A., Warner, R. C., Legrésy, B., Hyland, G., Young, N., and Fraser, A. D.: Examining the interaction between multi-year landfast sea ice and the Mertz Glacier Tongue, East Antarctica: Another factor in ice sheet stability?, J. Geophys. Res.-Oceans, 115, C12027, https://doi.org/10.1029/2009JC006083, 2010. a, b
Massom, R., Scambos, T. A., Bennetts, L. G., Reid, P., Squire, V. A., and Stammerjohn, S. E.: Antarctic ice shelf disintegration triggered by sea ice loss and ocean swell, Nature, 558, 383–389, https://doi.org/10.1038/s41586-018-0212-1, 2018. a, b, c, d, e
Massom, R. A., Giles, A. B., Warner, R. C., Fricker, H. A., Legrésy, B., Hyland, G., Lescarmontier, L., and Young, N.: External influences on the Mertz Glacier Tongue (East Antarctica) in the decade leading up to its calving in 2010, J. Geophys. Res.-Earth, 120, 490–506, https://doi.org/10.1002/2014JF003223, 2015. a
Miles, B. W. J., Stokes, C. R., and Jamieson, S. S. R.: Simultaneous disintegration of outlet glaciers in Porpoise Bay (Wilkes Land), East Antarctica, driven by sea ice break-up, The Cryosphere, 11, 427–442, https://doi.org/10.5194/tc-11-427-2017, 2017. a
Miles, B. W. J., Stokes, C. R., Jamieson, S. S., Jordan, J. R., Gudmundsson, G. H., and Jenkins, A.: High spatial and temporal variability in Antarctic ice discharge linked to ice shelf buttressing and bed geometry, Scientific Reports, 12, 10968, https://doi.org/10.1038/s41598-022-13517-2, 2022. a, b, c
Millan, R., Mouginot, J., Rabatel, A., and Morlighem, M.: Ice velocity and thickness of the world’s glaciers, Nat. Geosci., 15, 124–129, https://doi.org/10.1038/s41561-021-00885-z, 2022. a, b, c
Mouginot, J., Rignot, E., Scheuchl, B., and Millan, R.: Comprehensive annual ice sheet velocity mapping using Landsat-8, Sentinel-1, and RADARSAT-2 data, Remote Sensing, 9, 364, https://doi.org/10.3390/rs9040364, 2017. a
Nye, J. F.: A method of determining the strain-rate tensor at the surface of a glacier, J. Glaciol., 3, 409–419, https://doi.org/10.3189/S0022143000017093, 1959. a
Olinger, S., Lipovsky, B., Wiens, D., Aster, R., Bromirski, P., Chen, Z., Gerstoft, P., Nyblade, A., and Stephen, R.: Tidal and thermal stresses drive seismicity along a major Ross Ice Shelf rift, Geophys. Res. Lett., 46, 6644–6652, https://doi.org/10.1029/2019GL082842, 2019. a
Paolo, F. S., Fricker, H. A., and Padman, L.: Volume loss from Antarctic ice shelves is accelerating, Science, 348, 327–331, https://doi.org/10.1126/science.aaa0940, 2015. a
Pritchard, H., Ligtenberg, S. R., Fricker, H. A., Vaughan, D. G., van den Broeke, M. R., and Padman, L.: Antarctic ice-sheet loss driven by basal melting of ice shelves, Nature, 484, 502–505, https://doi.org/10.1038/nature10968, 2012. a, b
Provost, F., Michéa, D., Malet, J.-P., Boissier, E., Pointal, E., Stumpf, A., Pacini, F., Doin, M.-P., Lacroix, P., Proy, C., and Bally, P.: Terrain deformation measurements from optical satellite imagery: The MPIC-OPT processing services for geohazards monitoring, Remote Sens. Environ., 274, 112949, https://doi.org/10.1016/j.rse.2022.112949, 2022. a
Rignot, E., Mouginot, J., and Scheuchl, B.: Ice flow of the Antarctic ice sheet, Science, 333, 1427–1430, https://doi.org/10.1126/science.1208336, 2011. a
Rignot, E., Mouginot, J., Scheuchl, B., Van Den Broeke, M., Van Wessem, M. J., and Morlighem, M.: Four decades of Antarctic Ice Sheet mass balance from 1979–2017, P. Natl. Acad. Sci. USA, 116, 1095–1103, https://doi.org/10.1073/pnas.1812883116, 2019. a, b
Ritz, C., Edwards, T. L., Durand, G., Payne, A. J., Peyaud, V., and Hindmarsh, R. C.: Potential sea-level rise from Antarctic ice-sheet instability constrained by observations, Nature, 528, 115–118, https://doi.org/10.1038/nature16147, 2015. a
Robel, A. A.: Thinning sea ice weakens buttressing force of iceberg mélange and promotes calving, Nat. Commun., 8, 14596, https://doi.org/10.1038/ncomms14596, 2017. a, b, c
Rosu, A.-M., Pierrot-Deseilligny, M., Delorme, A., Binet, R., and Klinger, Y.: Measurement of ground displacement from optical satellite image correlation using the free open-source software MicMac, ISPRS J. Photogramm., 100, 48–59, https://doi.org/10.1016/j.isprsjprs.2014.03.002, 2015. a
Rott, H., Abdel Jaber, W., Wuite, J., Scheiblauer, S., Floricioiu, D., van Wessem, J. M., Nagler, T., Miranda, N., and van den Broeke, M. R.: Changing pattern of ice flow and mass balance for glaciers discharging into the Larsen A and B embayments, Antarctic Peninsula, 2011 to 2016, The Cryosphere, 12, 1273–1291, https://doi.org/10.5194/tc-12-1273-2018, 2018. a
Rupnik, E., Daakir, M., and Deseilligny, M. P.: MicMac – a free, open-source solution for photogrammetry, Open Geospatial Data, Software and Standards, 2, 14, https://doi.org/10.1186/s40965-017-0027-2, 2017. a
Scambos, T. A., Hulbe, C., Fahnestock, M., and Bohlander, J.: The link between climate warming and break-up of ice shelves in the Antarctic Peninsula, J. Glaciol., 46, 516–530, https://doi.org/10.3189/172756500781833043, 2000. a
Seroussi, H., Nowicki, S., Payne, A. J., Goelzer, H., Lipscomb, W. H., Abe-Ouchi, A., Agosta, C., Albrecht, T., Asay-Davis, X., Barthel, A., Calov, R., Cullather, R., Dumas, C., Galton-Fenzi, B. K., Gladstone, R., Golledge, N. R., Gregory, J. M., Greve, R., Hattermann, T., Hoffman, M. J., Humbert, A., Huybrechts, P., Jourdain, N. C., Kleiner, T., Larour, E., Leguy, G. R., Lowry, D. P., Little, C. M., Morlighem, M., Pattyn, F., Pelle, T., Price, S. F., Quiquet, A., Reese, R., Schlegel, N.-J., Shepherd, A., Simon, E., Smith, R. S., Straneo, F., Sun, S., Trusel, L. D., Van Breedam, J., van de Wal, R. S. W., Winkelmann, R., Zhao, C., Zhang, T., and Zwinger, T.: ISMIP6 Antarctica: a multi-model ensemble of the Antarctic ice sheet evolution over the 21st century, The Cryosphere, 14, 3033–3070, https://doi.org/10.5194/tc-14-3033-2020, 2020. a
Stumpf, A., Malet, J.-P., and Delacourt, C.: Correlation of satellite image time-series for the detection and monitoring of slow-moving landslides, Remote Sens. Environ., 189, 40–55, https://doi.org/10.1016/j.rse.2016.11.007, 2017. a
Stumpf, A., Michéa, D., and Malet, J.-P.: Improved Co-Registration of Sentinel-2 and Landsat-8 Imagery for Earth Surface Motion Measurements, Remote Sensing, 10, 160, https://doi.org/10.3390/rs10020160, 2018. a
Vaughan, D. G., Corr, H. F., Bindschadler, R. A., Dutrieux, P., Gudmundsson, G. H., Jenkins, A., Newman, T., Vornberger, P., and Wingham, D. J.: Subglacial melt channels and fracture in the floating part of Pine Island Glacier, Antarctica, J. Geophys. Res.-Earth, 117, F03012, https://doi.org/10.1029/2012JF002360, 2012. a
Walker, C. C., Bassis, J., Fricker, H., and Czerwinski, R.: Structural and environmental controls on Antarctic ice shelf rift propagation inferred from satellite monitoring, J. Geophys. Res.-Earth, 118, 2354–2364, https://doi.org/10.1002/2013JF002742, 2013. a, b, c, d, e
Walker, C. C., Bassis, J. N., Fricker, H. A., and Czerwinski, R. J.: Observations of interannual and spatial variability in rift propagation in the Amery Ice Shelf, Antarctica, 2002–14, J. Glaciol., 61, 243–252, https://doi.org/10.3189/2015JoG14J151, 2015. a
Wearing, M. G., Kingslake, J., and Worster, M. G.: Can unconfined ice shelves provide buttressing via hoop stresses?, J. Glaciol., 66, 349–361, https://doi.org/10.1017/jog.2019.101, 2020. a, b, c
Wille, J. D., Favier, V., Jourdain, N. C., Kittel, C., Turton, J. V., Agosta, C., Gorodetskaya, I. V., Picard, G., Codron, F., Leroy-Dos Santos, C., Amory, C., Fettweis, X., Blanchet, J., Jomelli, V., and Berchet, A.: Intense atmospheric rivers can weaken ice shelf stability at the Antarctic Peninsula, Communications Earth & Environment, 3, 90, https://doi.org/10.1038/s43247-022-00422-9, 2022. a
Xie, S., Dixon, T. H., Holland, D. M., Voytenko, D., and Vaňková, I.: Rapid iceberg calving following removal of tightly packed pro-glacial mélange, Nat. Commun., 10, 3250, https://doi.org/10.1038/s41467-019-10908-4, 2019. a
Zumberge, J. F., Heflin, M. B., Jefferson, D. C., Watkins, M. M., and Webb, F. H.: Precise point positioning for the efficient and robust analysis of GPS data from large networks, J. Geophys. Res.-Sol. Ea., 102, 5005–5017, https://doi.org/10.1029/96JB03860, 1997. a