the Creative Commons Attribution 4.0 License.
the Creative Commons Attribution 4.0 License.
 | 08 May 2024
A climate-driven, altitudinal transition in rock glacier dynamics detected through integration of geomorphological mapping and synthetic aperture radar interferometry (InSAR)-based kinematics
Aldo Bertone
Nina Jones
Volkmar Mair
Riccardo Scotti
Tazio Strozzi
Francesco Brardinoni
In dry southwestern South Tyrol, Italy, rock glaciers are dominant landforms of the high-mountain cryosphere. Their spatial distribution and degree of activity hold critical information on the current state of discontinuous permafrost and consequently on the response potential to climate warming. Traditional geomorphologic mapping, however, owing to the qualitative expert-based nature, typically displays a high degree of uncertainty and variability among operators with respect to the dynamic classification of intact (permafrost-bearing) and relict (permafrost-devoid) rock glaciers. This limits the reliability of geomorphologic rock glacier inventories for basic and applied purposes. To address this limitation, (i) we conduct a systematic evaluation of the improvements that synthetic aperture radar interferometry (InSAR) can afford to the detection and dynamic classification of rock glaciers and (ii) build an integrated inventory that combines the strengths of geomorphologic- and InSAR-based approaches. To exploit fully InSAR-based information towards a better understanding of the topo-climatic conditions that sustain creeping permafrost, we further explore how velocity and the spatial distribution of moving areas (MAs) within rock glaciers may vary as a function of simple topographic variables known to exert first-order controls on incoming solar radiation, such as elevation and aspect. Starting from a geomorphologic inventory (n=789), we characterize the kinematics of InSAR-based MAs and the relevant hosting rock glaciers on 36 Sentinel-1 interferograms in the 2018–2019 period. With respect to the original inventory, InSAR analysis allowed us to identify 14 previously undetected rock glaciers. Further, it confirmed that 246 (76 %) landforms, originally interpreted as intact, do exhibit detectable movement (i.e., ≥1 cm yr−1) and that 270 (60 %) of the relict labeled counterparts do not, whereas 144 (18 %) were kinematically undefined due to decorrelation. Most importantly, InSAR proved critical for reclassifying 121 (15 %) rock glaciers, clarifying that 41 (13 %) of those interpreted as being intact do not exhibit detectable movement and that 80 (17 %) of the original relict ones do move. Reclassification (i) allowed us to identify a cluster of intact rock glaciers below 2000 m a.s.l. associated with positive mean annual air temperature (MAAT), and (ii) by increasing the altitudinal overlap between intact and relict rock glaciers, it depicts a broad transition belt in the aspect–elevation space, which varies from 50 m on west-facing slopes to 500 m on easterly ones. This finding deteriorates the significance of elevation and aspect as topographic proxies for modeling permafrost occurrence and highlights the importance of using InSAR to inform such models. From a process-oriented standpoint, InSAR information proves fundamental for imaging how this altitudinal transition manifests through changing rates and styles of rock glacier surface deformation. Specifically, we find that, as rock glaciers move faster, an increasingly larger proportion of their surface becomes kinematically involved (i.e., percent MA cover) and that this proportion increases with elevation up to 2600–2800 m, beyond which an inflection occurs and consistent average values are attained. Considering that the inflection falls between the −1 and −2 °C MAAT – the lower boundary for discontinuous permafrost – and is independent of slope gradient, we conclude that this altitudinal pattern represents a geomorphic signature: the dynamic expression of increasing permafrost distribution, from sporadic to discontinuous.
- Article
(13093 KB) - Full-text XML
-
Supplement
(1278 KB) - BibTeX
- EndNote


In the last 4 decades, atmospheric temperature rise has led to rapid glacial retreat and permafrost degradation in high mountain environments. This trend has promoted slope instability (e.g., Huggel et al., 2015; Kos et al., 2016; Frattini et al., 2016; Schlögel et al., 2020), reduction in rock glacier water storage potential (e.g., Azocar and Brenning, 2010; Jones et al., 2018; Li et al., 2024) and runoff (Pruessner et al., 2022), as well as systematic acceleration in rock glacier velocity (e.g., Pellet et al., 2023; Kellerer-Pirklbauer et al., 2024). To assess relevant geohazards and adaptation measures in relation to climate change scenarios, comprehensive characterization and monitoring of the alpine cryosphere are needed. While glacier change is being successfully monitored worldwide through analysis of satellite imagery (e.g., Paul et al., 2004; Bolch et al., 2010), evaluating the spatial distribution of mountain permafrost and its ongoing degradation across regions is more challenging. This task may be tackled at the regional scale only indirectly by considering the spatial distribution of rock glaciers – complex depositional landforms that mainly develop through the former or current creep of perennially frozen ice-rich debris (permafrost), where creep refers to the variable combination of both internal deformation and shearing at depth – which are regarded as unambiguous morphological evidence of permafrost-bearing conditions (e.g., Haeberli et al., 2006; Harris et al., 2009). Operational steps entail the compilation of a rock glacier inventory; the dynamic classification of each rock glacier, i.e., active, inactive (also termed transitional), or relict (Barsch, 1996); and the relevant modeling based on the spatial distribution of intact (i.e., active and inactive) rock glaciers and available empirical measurements (e.g., Imhof, 1996; Lambiel and Reynard, 2001; Boeckli et al., 2012; Schmid et al., 2015).
Traditionally, inventories are compiled via identification, manual delineation, and dynamic classification of rock glaciers on optical imagery, complemented by some confirmatory fieldwork (e.g., Scotti et al., 2013; Falaschi et al., 2015; Onaca et al., 2017; Wagner et al., 2020; Johnson et al., 2021). Owing to the variability and complexity of rock glacier typology and morphology, compiling a “geomorphologic” rock glacier inventory requires some expert-based interpretation of landforms. Accordingly, the completeness and reliability of an inventory depend not only on the image quality, but also on the operator's mapping approach and experience. In this context, a recent comparative study indicated varying degrees of subjectivity in inventories compiled by different operators for a given study area, highlighting high variability associated with the morphological discrimination between intact and relict landforms (Brardinoni et al., 2019). This represents a practical limitation for evaluating permafrost distribution and geohazard potential, as the altitudinal transition between intact and relict rock glaciers typically sits at the fringe of permafrost-bearing terrain.
While this limitation can be overcome locally through ground confirmation and variable combinations of topographic, photogrammetric, geodetic, and geophysical surveys (e.g., Konrad et al., 1999; Delaloye et al., 2008; Bodin et al., 2009; Vivero and Lambiel, 2019; Fey and Krainer, 2020), when wishing to upscale the assessment of rock glacier activity over entire basins or regions, satellite synthetic aperture radar interferometry (InSAR) may prove fundamental. As a consolidated technique for detecting and mapping land surface deformation at suitable spatial and temporal resolutions (Rosen et al., 2000), InSAR warrants an objective kinematic characterization (and hence dynamic classification) of rock glaciers over large areas (e.g., Liu et al., 2013; Necsoiu et al., 2016; Wang et al., 2017; Bertone et al., 2019; Brencher et al., 2021; Reinosch et al., 2021). In this context, we argue that the kinematic approach – developed by Barboux et al. (2014) and refined by Bertone et al. (2022) – entailing the detection and delineation of moving areas (i.e., areas of detectable surface deformation on wrapped interferograms), besides elucidating which rock glaciers move and consequently bear permafrost, may prove strategic for documenting where about the rock glacier (e.g., the main front, the rooting zone, or the entire landform) and in what proportion surface deformation occurs. Following this logic, this type of spatially distributed information may open opportunities to improve our understanding of the topo-climatic conditions that control rock glacier activity (and ultimately permafrost persistence) in a mountain landscape. Although the application of InSAR technology to rock glacier inventories has straightforward advantages, amply demonstrated for a single glacier, a cluster of glaciers, or many rock glaciers (e.g., Barboux et al., 2014; Strozzi et al., 2020; Lambiel et al., 2023; Bertone et al., 2023), a systematic and quantitative evaluation of the improvements afforded to a traditional “geomorphologic” inventory, encompassing both intact and relict landforms over broad spatial scales, is missing.
To address this gap, following operational guidelines on the InSAR-based kinematic characterization of rock glaciers jointly proposed by the European Space Agency (ESA) Permafrost Climate Change Initiative (CCI) and the International Permafrost Association (IPA) Action Group on rock glacier inventories (Bertone et al., 2022), we wish to integrate geomorphologic and InSAR-based inventorying approaches in selected valleys of western South Tyrol, where rock glacier occurrence is overwhelming. Therein, starting from the compilation of a geomorphologic inventory, we aim to (i) characterize the kinematics of InSAR-based moving areas and relevant hosting rock glaciers and (ii) evaluate InSAR-derived improvements, in terms of inventory completeness and uncertainty reduction, in the detection and dynamic classification of rock glaciers. To fully exploit InSAR-based information towards a better understanding of the current topo-climatic conditions associated with creeping permafrost, we further aim to explore in which way the velocity and spatial distribution of moving areas within rock glaciers may vary as a function of simple topographic variables known to exert first-order controls on incoming solar radiation and ground temperature, such as elevation and aspect. To pursue these objectives, we use Sentinel-1 interferograms over the 2018–2019 period, as they warrant consistent and freely available acquisitions with short (i.e., 6 d) repeat-time intervals suitable for examining systematically rock glacier surface deformation over large areas.
This work is concerned with the rugged mountain terrain of the northeastern portion (970 km2) of the Ortles-Cevedale massif in the Autonomous Province of Bozen/Bolzano, Central-Eastern Italian Alps (46°31′ N, 10°50′ E; Fig. 1a). This comprises the southern side of the lower Vinschgau/Venosta Valley as well as five tributary valleys, i.e., the Ultental/Ultimo Valley, Martelltal/Martello Valley, Laasertal/Lasa Valley, and Suldental/Solda Valley. Elevation ranges from about 500 m a.s.l. at the Ultimo Valley outlet up to the 3905 m a.s.l. of Mount Ortles. Bedrock geology is dominated by metamorphic lithologies (chiefly paragneiss, micaschists, and orthogneiss), with granite outcropping locally in the lower Martello Valley and limestones and dolostones in the upper Solda Valley (Keim et al., 2013).
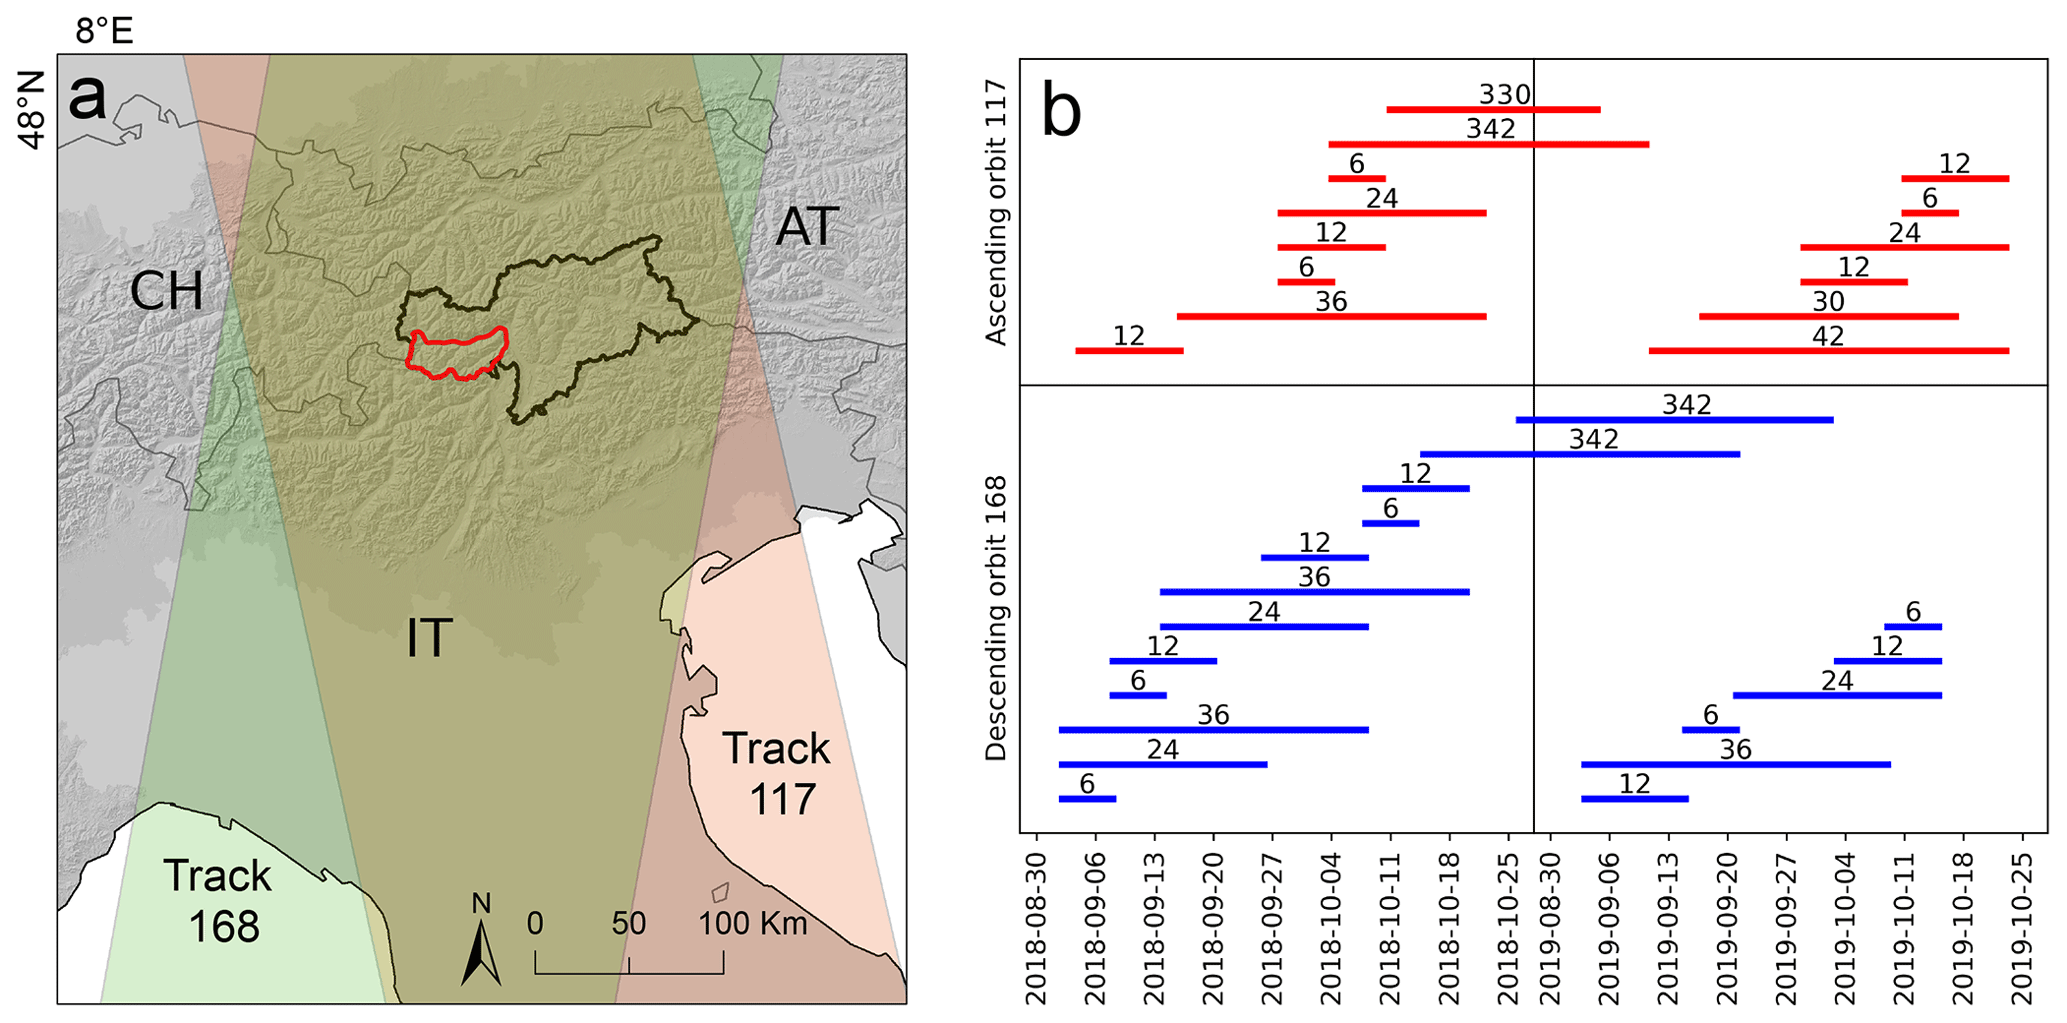
Figure 1(a) Autonomous Province of Bozen (black line work) and the southern Venosta Valley (red line work), including footprints of Sentinel-1 ascending orbit no. 117 and descending orbit no. 168 used for InSAR analysis in this study. (b) Summary of the interferograms used for the mapping and kinematic characterization of moving areas. Horizontal bars represent the time intervals of the wrapped interferograms expressed in number of days. Hillshade from the European Environment Agency (2004): https://data.opendatascience.eu/geonetwork/srv/api/records/84036394-19fc-466f-bc4b-b0748d5d29f4 (last access: 30 June 2023).
The climate is dry, with mean annual precipitation ranging from 506 mm (1921–2020) at Schlanders/Silandro (698 m a.s.l.) on the Venosta Valley floor to 779 mm (1972–2020) at Zufritt/Gioveretto Dam (1851 m a.s.l.) in upland valleys. According to Permanet modeling (https://www.permanet.eu, last access: 30 June 2023) and field-based evidence, discontinuous mountain permafrost roughly occurs above threshold elevations varying between 2300 and 2700 m a.s.l., depending on topographic aspect and microclimatic, site-specific conditions (Boeckli et al., 2012). This elevation belt roughly agrees with the lower boundary for discontinuous permafrost occurrence, as constrained by the −1 and −2 °C MAAT (mean annual air temperature) envelope (Haeberli, 1983; Haeberli et al., 1989), which in southwestern South Tyrol, based on regional climatic characterization (1981–2010), sits between 2595 and 2765 m a.s.l. (http://www.3pclim.eu/, last access: 30 June 2023). MAAT gridded data, available at 0.5 km × 0.5 km resolution, were obtained through spatial interpolation of 1460 meteorological stations (Frei, 2014; Hiebl and Frei, 2016) following ad hoc data homogenization (Nemec et al., 2013).
3.1 Rock glacier inventory and degree of activity
The geomorphologic rock glacier inventory in southwestern South Tyrol is part of a broader mapping effort conducted across the entire Autonomous Province of Bozen/Bolzano (Scotti et al., 2024). The identification, mapping, and dynamic classification of each rock glacier rely primarily on the visual interpretation of 0.2 m gridded optical imagery (i.e., orthophoto mosaics flown in 2014, 2017, and 2020) and a 2.5 m lidar-derived hillshade raster (i.e., 2006) – all available as Web Map Service (WMS) resources at the Geological Web Portal of the Autonomous Province of Bozen/Bolzano (https://geoportale.retecivica.bz.it/geodati.asp, last access: 30 June 2023) – and, where available, on information drawn from local reports on road closure or damage to infrastructure associated with the advance of rock glacier fronts. Landform delineation typically starts at the base of the rock glacier's front and proceeds through the lateral margins, up to the lower end of the rooting zone depression, which in this study is excluded from the rock glacier polygon (e.g., Brardinoni et al., 2019). Dynamic classification, which accounts for both the presence and absence of ice-rich debris (i.e., permafrost) and a rock glacier's degree of mobility, follows the classical three-part scheme summarized by Barsch (1996) and as such distinguishes between active, inactive, and relict landforms. Accordingly, active rock glaciers exhibit downslope movement (i.e., ≥1 cm yr−1) at their fronts and over large parts of their surface. Downslope movement is considered to be chiefly the result of ice content sufficient to sustain creep and internal shearing. Inactive (or transitional, according to RGIK, 2023a) rock glaciers, which in principle would still contain permafrost, even though in a lesser amount, do not move at their front (i.e., <1 cm yr−1) and may exhibit subsidence but could still support downslope shearing and displacement on their upper portions (i.e., Barsch, 1996, p. 190). Relict rock glaciers, as a result of exhausted permafrost content, do not bear any kind of surface deformation.
Considering the high variability (i.e., the low consensus among different operators) associated with the morphologically based dynamic classification of inactive rock glaciers (i.e., Brardinoni et al., 2019; see their Fig. 11), in this work we will merge active and inactive landforms in the so-called intact category (Haeberli, 1985; Barsch, 1996) and will evaluate their spatial distribution against that of relict counterparts. Following this logic, although permafrost occurrence can be unambiguously determined only through direct coring or (indirectly) via geophysical prospecting, in this contribution we will assume that intact rock glaciers bear permafrost and that relict rock glaciers do not. Similarly, in the next section, we will regard InSAR-based surface displacement ≥1 cm yr−1 detected within rock glaciers' morphological footprints (i.e., “moving” rock glaciers) as diagnostic of permafrost occurrence and equivalent to an intact dynamic state. Vice versa, the lack of movement ≥1 cm yr−1 (i.e., “not moving” rock glaciers) – excluding cases affected by decorrelation – will be regarded as conditions compatible with a relict dynamic state. The 1 cm threshold, which fits the multiannual sensitivity analysis of Sentinel-1 InSAR conducted in urban areas (Crosetto et al., 2009) and more recently in intact rock glaciers (Strozzi et al., 2020), is dictated by the maximum time interval considered in this study, which is 1 year.
3.2 InSAR-based kinematic characterization of moving areas and rock glaciers
The kinematic characterization of rock glaciers follows the specifics proposed by the IPA Action Group on rock glacier inventories and kinematics (2018–2023) (RGIK, 2023a), with the support of the ESA Permafrost CCI (Bertone et al., 2022). Accordingly, the methodology entails the identification, manual delineation, and kinematic classification of moving areas on Sentinel-1-wrapped interferograms (Fig. 2), where a moving area is a portion of detectable surface deformation within a hosting rock glacier polygon, as outlined in the geomorphologic inventory (Figs. 3 and S1). Subsequently, moving areas are used to classify the relevant hosting rock glaciers according to specific kinematic classes. They follow a detailed description of the methodological steps involved (Fig. 2).
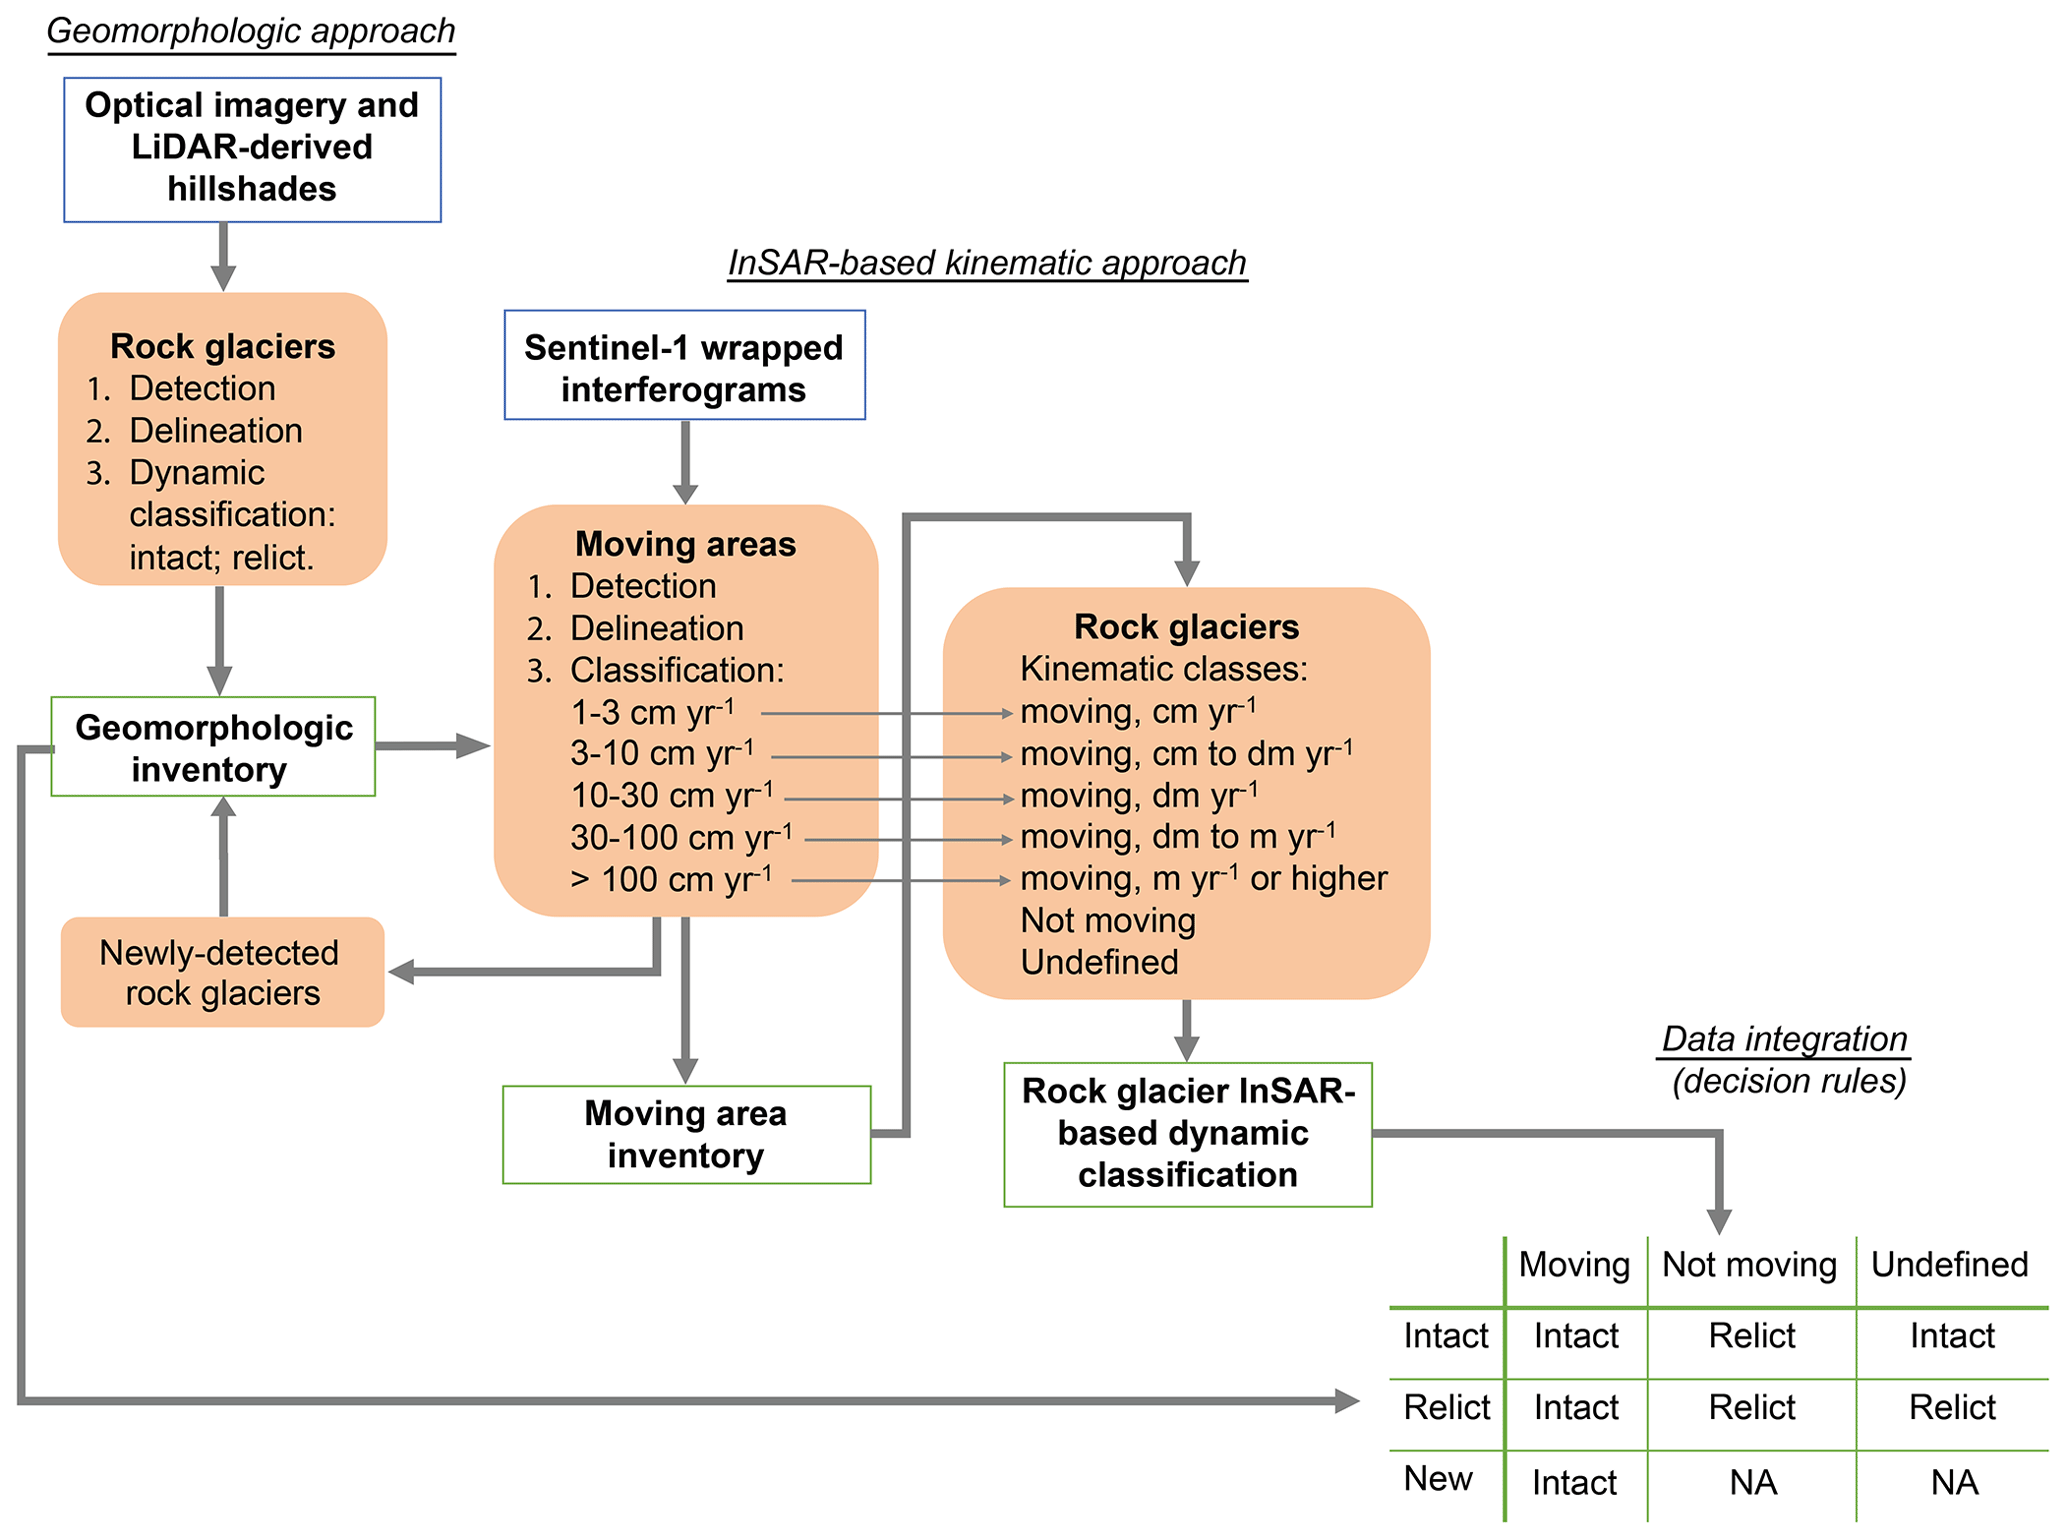
Figure 2Schematic flow diagram illustrating the data sources and the methodological steps involved in the dynamic classification of rock glaciers obtained through integration of the relevant geomorphologic information and InSAR-based kinematics. See text for a detailed description of the methodology.

Figure 3Sample kinematic characterization applied to two rock glaciers in the Ultimo Valley showing (a) initial manual delineation of rock glacier polygons (black line work) on optical imagery, Sentinel-1 interferograms calculated over (b) 6 d (28 September 2018–4 October 2018), (c) 12 d (11–23 October 2019), (d) 24 d (28 September 2018–22 October 2018), and (e) 330 d (10 October 2018–5 September 2019). In panel (f) is shown the color-coded scheme used for evaluating phase difference in interferograms. RG2 displays a consistent plain pattern across all the interferograms, indicating a lack of movement above the instrumental limit of detection (i.e., < cm yr−1). RG1 displays a partial fringe (6 d), a complete fringe (i.e., a complete phase cycle) (12 d), and finally a decorrelation pattern (24 d and longer) with an increasing temporal baseline. The velocity class of each moving area is estimated by counting the number of phase cycles, converting them into displacement (i.e., one phase cycle in Sentinel-1 corresponds to a displacement of 2.77 cm) and then converting displacement into velocity (red and orange line work in panels e–g). Each rock glacier is finally assigned to a velocity class (green and red centroids) according to the velocity of the relevant moving area(s), following the classification scheme illustrated in Fig. 2. To ease readability, a simplified version of this figure may be found as Fig. S1 in the Supplement. Orthoimage from the Autonomous Province of Bolzano (https://geoportale.retecivica.bz.it/geodati.asp, last access: 30 June 2023).
3.2.1 Interferometric data processing
In this work, InSAR analysis of Sentinel-1 acquisitions is performed using the Gamma software along track nos. 117 (ascending) and 168 (descending) (Fig. 1). Since snow cover represents a severe limitation to satellite SAR data analysis (Klees and Massonnet, 1998), acquisitions of interest are restricted to snow-free periods only, i.e., between 2 September 2018 and 23 October 2019 (Table S1 and Fig. 1b). In the Alps, this seasonal timing roughly corresponds to the period of maximum rock glacier displacement within the year (Delaloye and Staub, 2016; Wirz et al., 2016) and indirectly ensures the highest detectability rates across the population of favorably exposed rock glaciers. Collectively, we have processed 28 images in interferometric wide (IW) mode with a 250 km swath at 5 m by 20 m spatial resolution, a single look complex (SLC) product type, and vertical transmit vertical receive (VV) polarization.
Differential interferograms are computed with one look in range and four looks in azimuth by combining pairs of images with time intervals of 6, 12, 24, 30, 36, 42, 330, and 342 d. Areas affected by foreshortening, layover, and shadow are masked out (Klees and Massonnet, 1998). Topographic phase corrections on interferograms as well as data geolocation are conducted using a 2.5 m gridded lidar digital terrain model (DTM) (Bamler and Hartl, 1998; Yague-Martinez et al., 2016). Ultimately, we have computed 32 wrapped interferograms (Table S1 and Fig. 1b).
Wrapped interferograms provide surface displacement information. However, some limitations apply (Klees and Massonnet, 1998; Yague-Martinez et al., 2016). First, displacements between adjacent pixels higher than half of the wavelength (i.e., 2.77 cm for Sentinel-1) are not measurable because the interferometric phase signal becomes ambiguous, generating decorrelation (Massonnet and Souyris, 2008). To minimize this issue, interferograms with a range of temporal baselines are used. Second, artifacts due to uncompensated atmospheric delays (Yu et al., 2018) and decorrelation or phase bias due to changes in the physical properties of the surface (e.g., vegetation, snow, or soil moisture) (Klees and Massonnet, 1998; Zwieback et al., 2016) can prevent the detection of movement. Third, the orientation of a rock glacier's main flow line, with respect to the satellite's flying direction, represents a major limitation to detecting ground deformation. Specifically, since InSAR is sensitive only to the component of the three-dimensional surface deformation projected along the radar look direction (i.e., the so-called line of sight, LOS), the greater the geometric difference between the true three-dimensional flow direction of a rock glacier and the LOS, the greater the underestimation of the one-dimensional LOS measurements (Barboux et al., 2014; Klees and Massonnet, 1998). Assuming the downslope direction to be representative of the real three-dimensional movement of a rock glacier (Barboux et al., 2014; Liu et al., 2013), the underestimation (U) may be evaluated by computing the α angle between the downslope direction and the LOS (Eq. 1):
Following this logic, underestimation of ground deformation increases progressively as one examines rock glaciers approaching northerly or southerly slope aspects, due to downslope movements directed about parallel to the satellite's flight direction (i.e., perpendicular to the LOS direction), which InSAR cannot detect. In this context, concurrent consideration of both ascending and descending geometries warrants greater flexibility of acquisition and minimizes the number of unfavorably exposed landforms. Nevertheless, in rugged alpine terrain, rock glacier motion may still be subject to substantial underestimation or major distortions known as layover or shadowing, due to peculiar topographic configurations (i.e., combinations of slope aspect, gradient, and curvature). We consider InSAR measurements to be unreliable when underestimation exceeds 50 %, which corresponds to an α angle of 60° (Klees and Massonnet, 1998; Barboux et al., 2014). Evaluation of signal underestimation for all the rock glaciers inventoried in this study, as well as site-specific examples and relevant practical implications, will be discussed in Sect. 5.1 and 5.2.
To disentangle downslope components from vertical components of deformation, some studies have projected the measured LOS displacement along the maximum slope direction of a rock glacier, as calculated from a digital terrain model, while others have combined ascending and descending geometries to derive east–west and up–down components, assuming that no movement occurs along the north–south axis (e.g., Liu et al., 2013; Brencher et al., 2021; Reinosch et al., 2021). In our opinion, both approaches hold intrinsic bias, the magnitude of which is difficult to assess. The former is highly dependent on the quality of the DTMs, which in remote mountain areas are typically coarse in resolution (e.g., 30 m). Moreover, downslope creep of coarse debris does not necessarily follow the steepest descent. The latter, by conveying movement along the north–south axis mainly into the up–down component, may lead to unrealistic rates of deformation. For these reasons, in this work we prefer to stick to displacements along the LOS and express the relevant reliability based on the orientation of the rock glacier with respect to the LOS.
3.2.2 Inventorying moving areas
A moving area is defined as the portion of a rock glacier surface in which the direction and the velocity field of ground deformation are spatially consistent and homogenous. Accordingly, a moving area depicts the rate of movement of a portion of a given rock glacier along the one-dimensional LOS. In this study, each moving area is related to a specific (seasonal or annual) time window of observation occurring between 2 September 2018 and 23 October 2019.
Moving areas are manually mapped onto wrapped interferograms (Barboux et al., 2014). Specifically, they are identified by looking at textural image features such as (i) “fringe patterns” (Fig. 3b), an expression of detectable displacement; (ii) “plain patterns” (Fig. 3b–e), in the absence of detectable displacement; and (iii) “noisy (decorrelated) patterns” (Fig. 3d and e) associated with local ground noise (e.g., vegetation cover) or high (over threshold) rates of displacement (Fig. 3f). The rationale for inventorying moving areas is two-fold: they serve to characterize the degree of activity (i.e., intact or relict) of rock glacier polygons mapped in the geomorphologic inventory and to identify additional rock glaciers that may have gone undetected during aerial photo interpretation. Following this logic, the visual inspection of interferograms first focuses within the “geomorphologic” rock glacier outlines and then expands outside. When an “outsider” moving area is detected, an iterative process starts, and the manual delineation of a new rock glacier polygon is conducted on historical optical imagery and lidar-derived hillshades.
To ensure that different operators outline moving areas consistently as well as to distinguish moving areas from surrounding noise in a given interferogram, a minimum area threshold is applied. Following Bertone et al. (2022) and RGIK (2023a) guidelines, moving areas need to involve at least 20 adjacent pixels in a gridded interferogram. The outlines are drawn according to the detected fringe pattern, without necessarily fitting the entire geomorphologic outline of the rock glacier. In the present work, this mapping procedure is based on the combined visual inspection of the 32 interferograms (Fig. 3b–e). Outlines are provisionally drawn starting from interferograms associated with the shortest time intervals. As longer intervals are considered, moving areas are progressively refined and enriched with additional ones characterized by lower rates of displacement. Incidentally, this redundant multitemporal approach allows us to minimize decorrelation and local artifacts associated with unfavorable atmospheric and/or ground conditions (Barboux et al., 2014; Yu et al., 2018).
Following outline delineation, a specific velocity class is assigned to each moving area, where a velocity class is meant to reflect the mean movement rate over the 2018–2019 study period, i.e., not a specific intra-annual variation or an extreme value. The assigned annual velocity classes include 1–3, 3–10, 10–30, 30-100 cm yr−1, and >100 cm yr−1 (Fig. 2). Class membership is assigned depending on the change in color observed in the wrapped interferograms (Fig. 3b–e). A change in color expressed by fringe(s) corresponds to variations in the interferometric phase correlated with the ground deformation projected in the LOS direction (Klees and Massonnet, 1998; Strozzi et al., 2020). For example, a complete phase cycle corresponds to a displacement of 2.77 cm (half of one Sentinel-1 wavelength). Velocity is finally computed considering the temporal baseline of the interferogram under examination. The maximum temporal baseline considered in this work is 1 year. This choice sets the lower limit of velocity detection in Sentinel-1 interferograms to about 1 cm yr−1 (Barboux et al., 2014; Yague-Martinez et al., 2016). That is, in this work we will not able to distinguish between areas with movement <1 cm yr−1 and areas with no motion.
3.2.3 Rock glacier kinematic classification and analysis
Moving area characteristics – including extent, velocity class, and temporal baseline – are then used to assign the dynamic state (or degree of activity) to rock glaciers of the geomorphologic inventory (Figs. 2 and 3e). Accordingly, a rock glacier polygon that encloses one or more moving areas is labeled as moving. A rock glacier that does not exhibit any detectable moving area is labeled as not moving. A rock glacier for which reliable kinematic information is not available – due to extended layover, shadowing, atmospheric artifacts, phase bias, or decorrelation – is labeled as undefined. Based on the kinematics of the relevant moving area(s), each moving rock glacier is further assigned to a first-order mean annual velocity category, i.e., cm yr−1, cm to dm yr−1, dm yr−1, and dm to m yr−1 (Fig. 2), which in this paper we call “kinematic classification”. Categorical assignment takes into account the seasonal variability of rock glacier downslope deformation, which is generally highest during the late summer and fall months (Delaloye and Staub, 2016; Kellerer-Pirklbauer et al., 2018). Our annual rates of surface deformation reflect kinematic information retrieved from redundant interferograms computed over snow-free periods (i.e., from late July to late October). This kinematic approach, which averages across a minimum of 2 to 3 months, ensures that velocity peaks are not inadvertently selected as representative annual rates of surface displacement. Wishing to minimize inter-operator variability to a rock glacier that hosts two equally dominant moving areas with diverse kinematics, we assign the category of the area closer to the front. In case of multiple, equally dominant moving areas spanning across a wide range of categories, the rock glacier is assigned the median kinematic category (Bertone et al., 2022; RGIK, 2023a). To evaluate the extent to which rock glacier kinematics may depend on local, first-order topo-climatic conditions, we first examine how the size and velocity of moving areas (i.e., the rock glacier's kinematic building blocks) vary across elevations and aspects. Subsequently, at a higher hierarchical level, we examine the internal kinematic configuration of each rock glacier, that is, how total moving area (i.e., the proportion of a rock glacier footprint that actually moves) varies as a function of elevation, aspect, and displacement rate.
To pursue the objectives detailed in Sect. 1, we have subdivided the results into three subsections. Accordingly, we begin by presenting the dynamic and topographic characterization of the geomorphologic rock glacier inventory. We continue with the InSAR-based kinematic characterization of moving areas and hosting rock glaciers, and then we compare the geomorphologic and InSAR-based dynamic classification approaches and combine them in a so-called “integrated” inventory. We finally examine the velocity and spatial distribution of moving areas in relation to the elevation, aspect, and size of the hosting (geomorphologic) rock glacier polygon.
4.1 Rock glacier geomorphologic inventory
We have identified and mapped on optical imagery 789 rock glaciers, which occupy a total area of 35.55 km2. Among these, 322 and 457 are interpreted, respectively, as intact and relict landforms (Table 1 and Figs. 4 and 5a). The former are about one-third smaller than the latter (see the median size in Table 1) and tend to occur at higher elevations. Specifically, the median elevation of the intact rock glacier fronts is located about 400 m higher (i.e., 2680 m a.s.l.) than that of the relict counterparts (i.e., 2290 m a.s.l.) (Table 1 and Fig. 4a). This altitudinal separation is about constant across aspects, with median front elevations increasing progressively from north-facing slopes and reaching a maximum on southern aspects (Fig. 4a). The same mismatch is mirrored by the altitudinal distribution of the total rock glacier area (Fig. 4b), in which intact and relict rock glaciers are about normally distributed and peak, respectively, at elevation bands of 2600–2800 and 2200–2400 m a.s.l.
Table 1Rock glaciers stratified by the degree of activity in the geomorphologic inventory, based on interpretation of optical imagery and some confirmatory fieldwork.
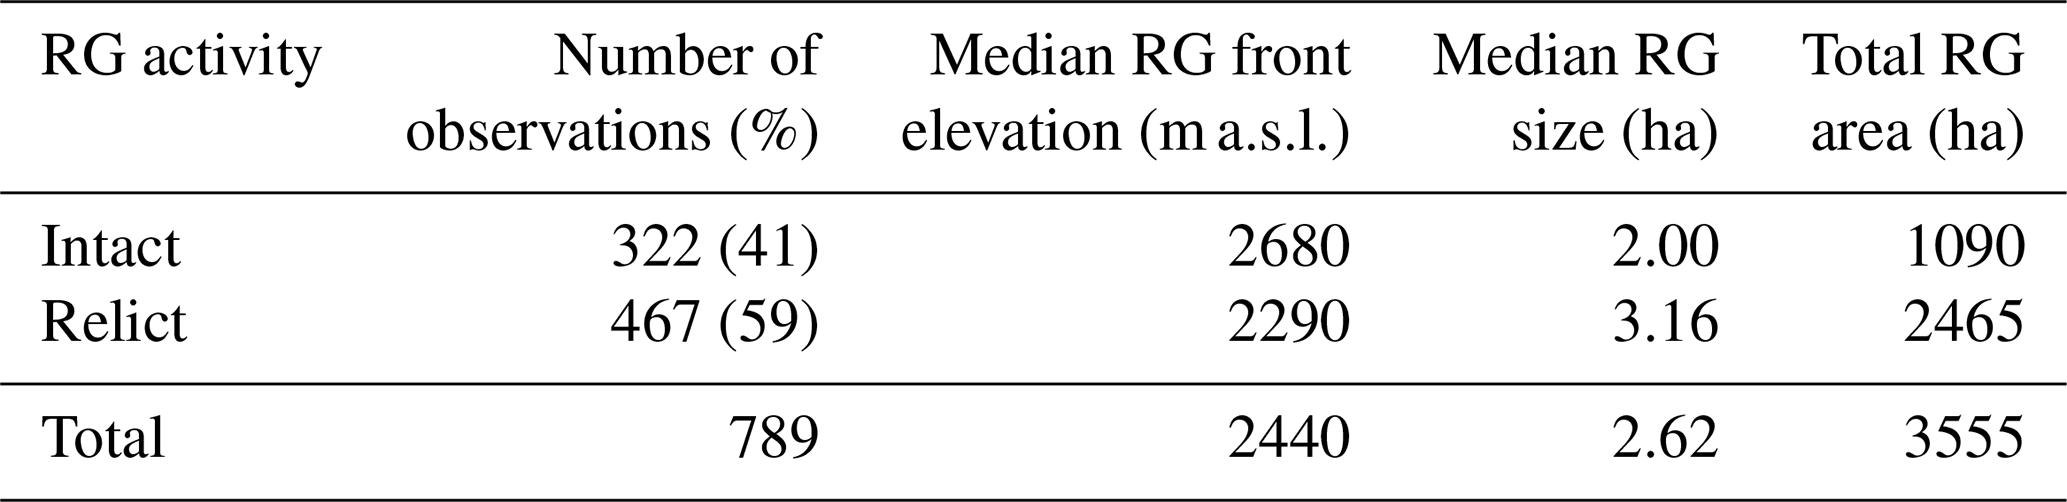
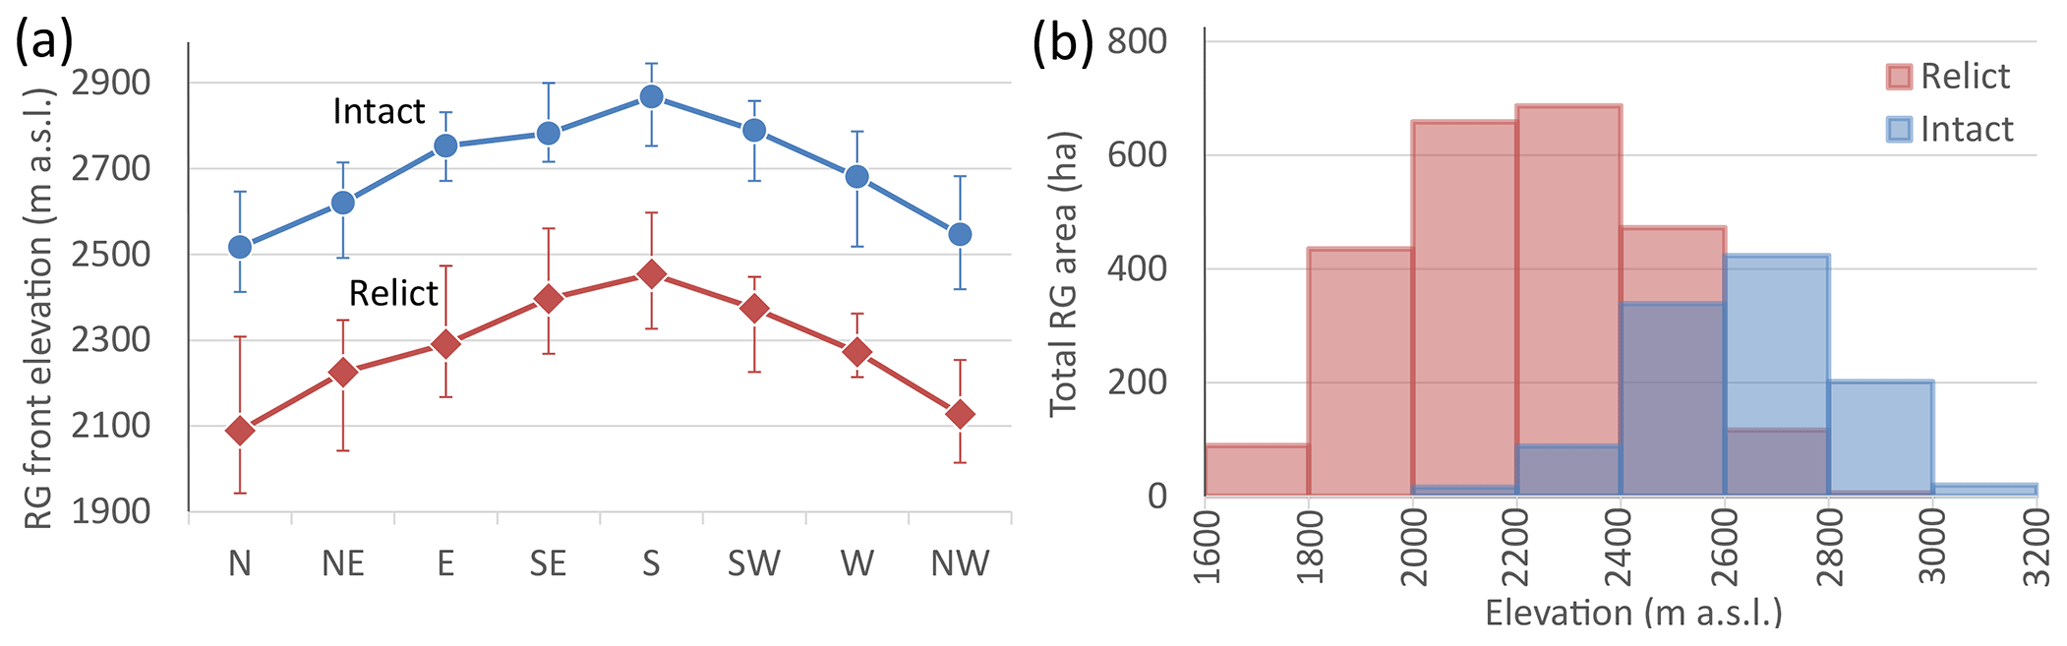
Figure 4(a) Median elevation of rock glacier fronts as a function of slope aspect. (b) Total rock glacier area across altitudinal bands. In panel (a), the bars enclose the interquartile ranges. In panel (b), note the altitudinal overlap (i.e., 2200–2800 m a.s.l.) between intact and relict rock glaciers.
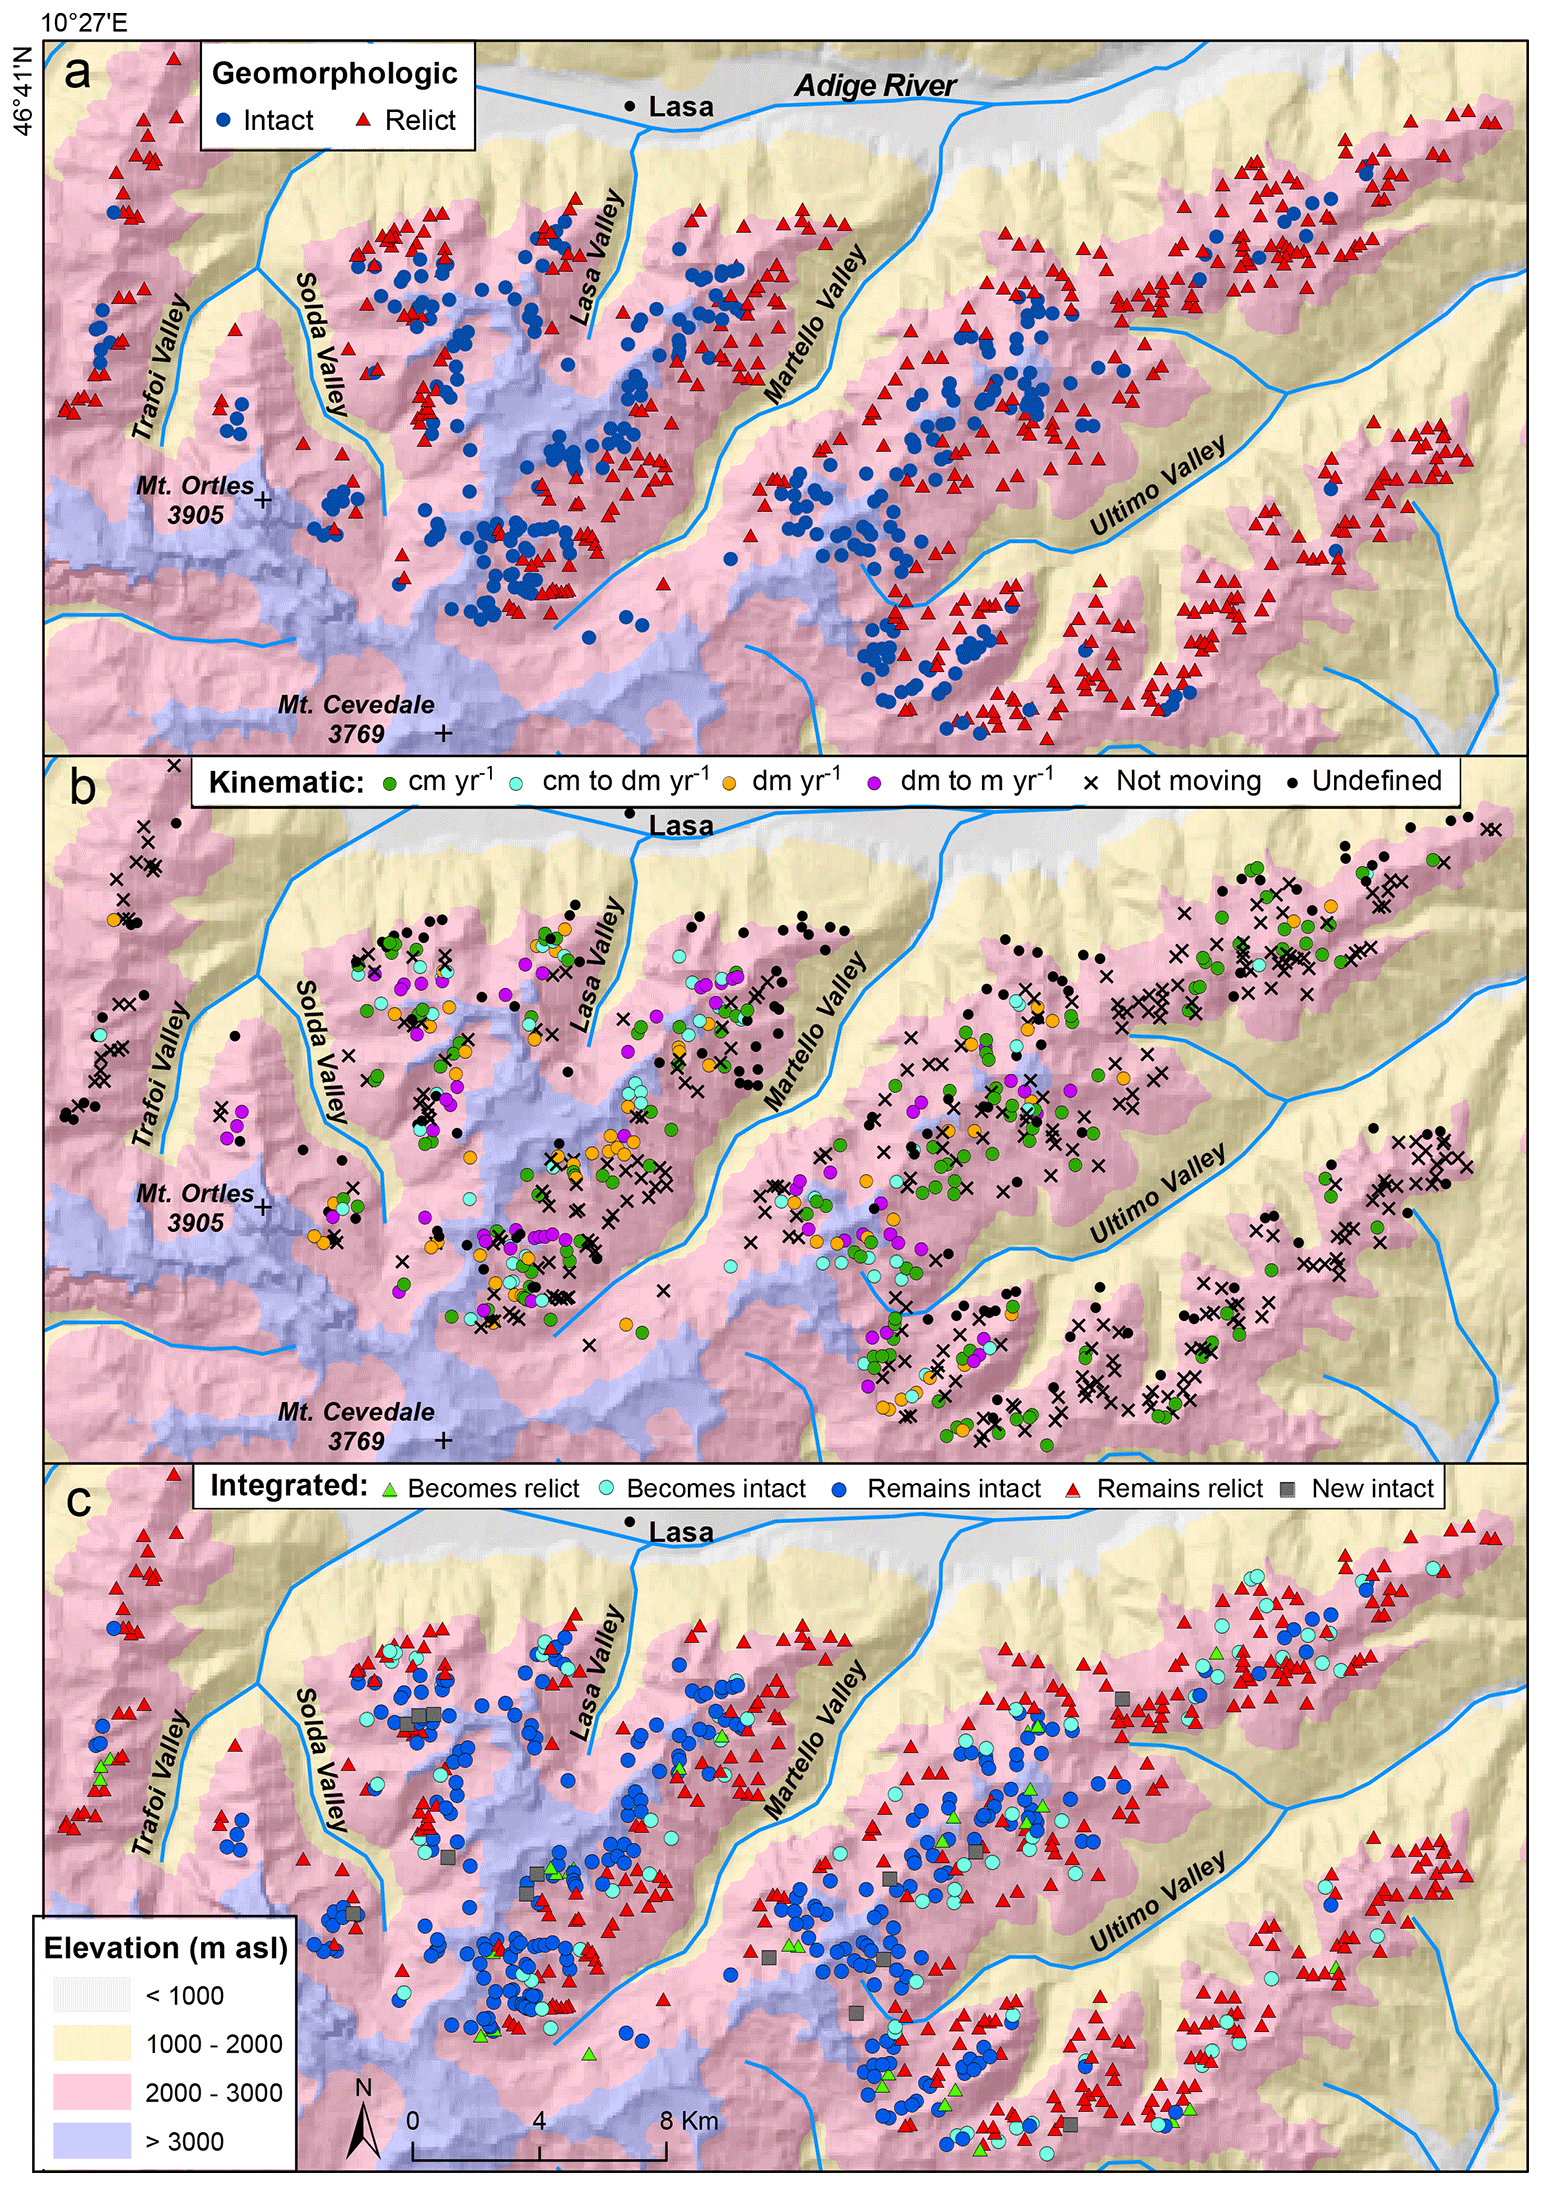
Figure 5Spatial distribution of rock glacier centroids stratified by the dynamic classification of (a) the geomorphologic approach; (b) the InSAR-based kinematic approach, including annual velocity classes; and (c) the integrated approach and including membership changes and newly detected landforms (see Fig. 2). Shaded relief from the Autonomous Province of Bolzano (https://geoportale.retecivica.bz.it/geodati.asp, last access: 30 June 2023).
4.2 Rock glacier kinematic inventory and integration with the geomorphological approach
Through visual inspection of 2018 and 2019 interferograms (Figs. 1c and 3), we have identified and manually delineated a total of 656 moving areas (MAs) (Table 2). They range in elevation from 1935 to 3177 m a.s.l. and display a median of 2680 m a.s.l. Of these, 640 lie within 326 (out of 789) rock glacier polygons previously mapped on optical imagery (Table 1 and Fig. 5a), and 16 belong to 14 newly detected rock glaciers, which were missed during the compilation of the geomorphologic inventory. The latter landforms range in elevation between 2440 and 3120 m a.s.l. Overall, mapped moving areas span across the five velocity classes considered (Table 2) and impart to hosting rock glaciers annual velocities ranging between “cm” and “dm to m” (Table 3 and Fig. 5b).
Table 2Moving areas detected within rock glacier polygons and stratified by velocity.

Table 3Rock glacier characteristics across InSAR-based kinematic classes. Moving rock glaciers include 14 additional units identified during multitemporal examination of interferograms.
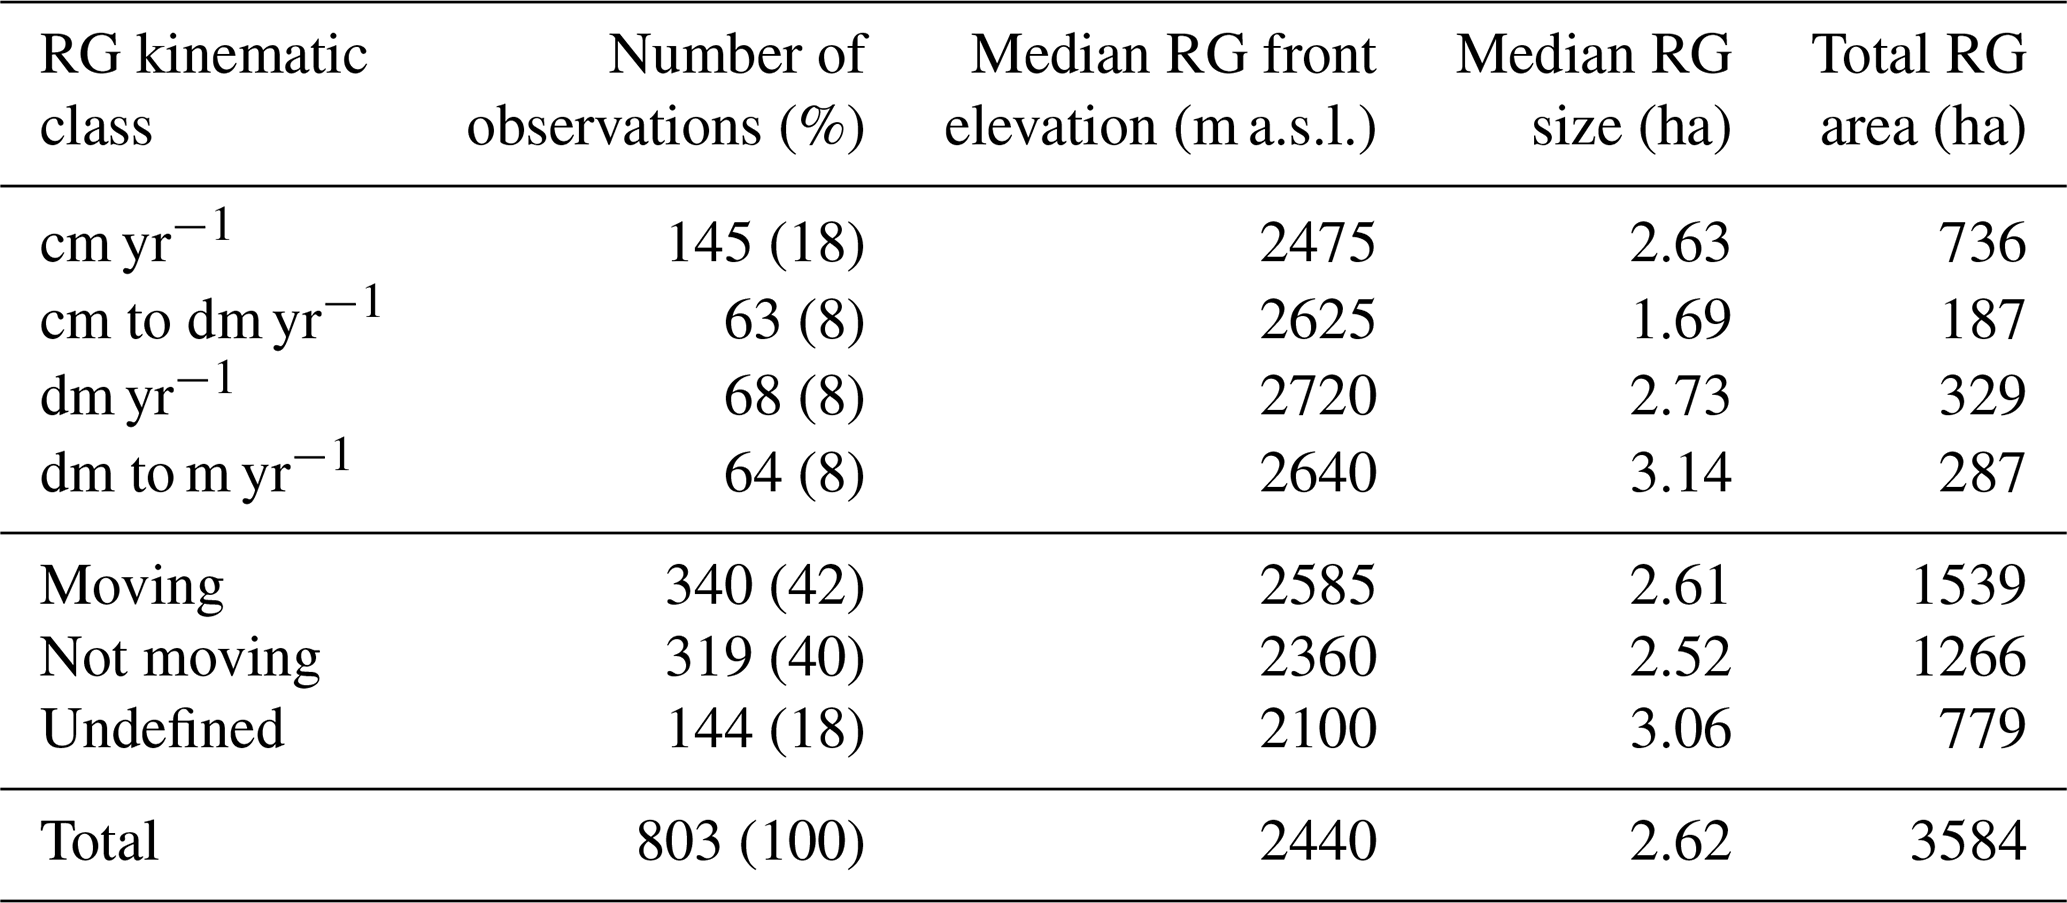
Based on the spatial distribution of moving areas, we have classified, respectively, 340 (42 %) “moving”, 319 (40 %) “not moving”, and 144 (18 %) kinematically “undefined” rock glaciers (Table 3 and Figs. 5b and 6), where “undefined” are those landforms for which, due to geometric distortions (layover or shadowing), atmospheric artifacts, phase bias, or decorrelated patterns in the interferograms, surface displacement could not be assuredly determined. Among those bearing movement, 145 (43 %) were found to displace at a centimeter annual rate, with the remaining 195 evenly distributed across cm-to-dm, dm, and dm-to-m kinematic classes (Table 3). Interestingly, faster moving areas, and consequently faster rock glaciers, appear to occupy (on average) higher elevations than slower ones, as suggested by their median elevation stratified by velocity class, which peak, respectively, for moving areas that displace at 10–30 cm yr−1, i.e., rock glaciers that move decimeter annual rates (see Tables 2 and 3).
With reference to the original geomorphologic inventory, InSAR analysis confirmed that 246 (76 %) rock glaciers originally interpreted as intact do exhibit movement and that 270 (60 %) of the relict-labeled counterparts do not display detectable surface displacement (Table 4 and Fig. 6). At the same time, InSAR contribution proved critical for reclassifying 121 (15 %) rock glaciers, clarifying that 41 (13 %) of those initially interpreted as intact do not exhibit detectable movement (i.e., ≥1 cm yr−1) and that 80 (17 %) of the relict ones do actually move (Table 4 and Fig. 6). Among the rock glaciers that have remained kinematically undefined, the proportion of those initially interpreted as relict (23 %; n=109) is much larger than that of the morphologically intact ones (11 %; n=35), suggesting that the former morphological type is subject to higher uncertainty. As previously noted, in the “integrated” version of the inventory, these landforms will retain their original morphologically based dynamic classification (Fig. 6).
Table 4Rock glacier dynamic classification and membership changes following integration of the geomorphologic and kinematic inventorying approaches.
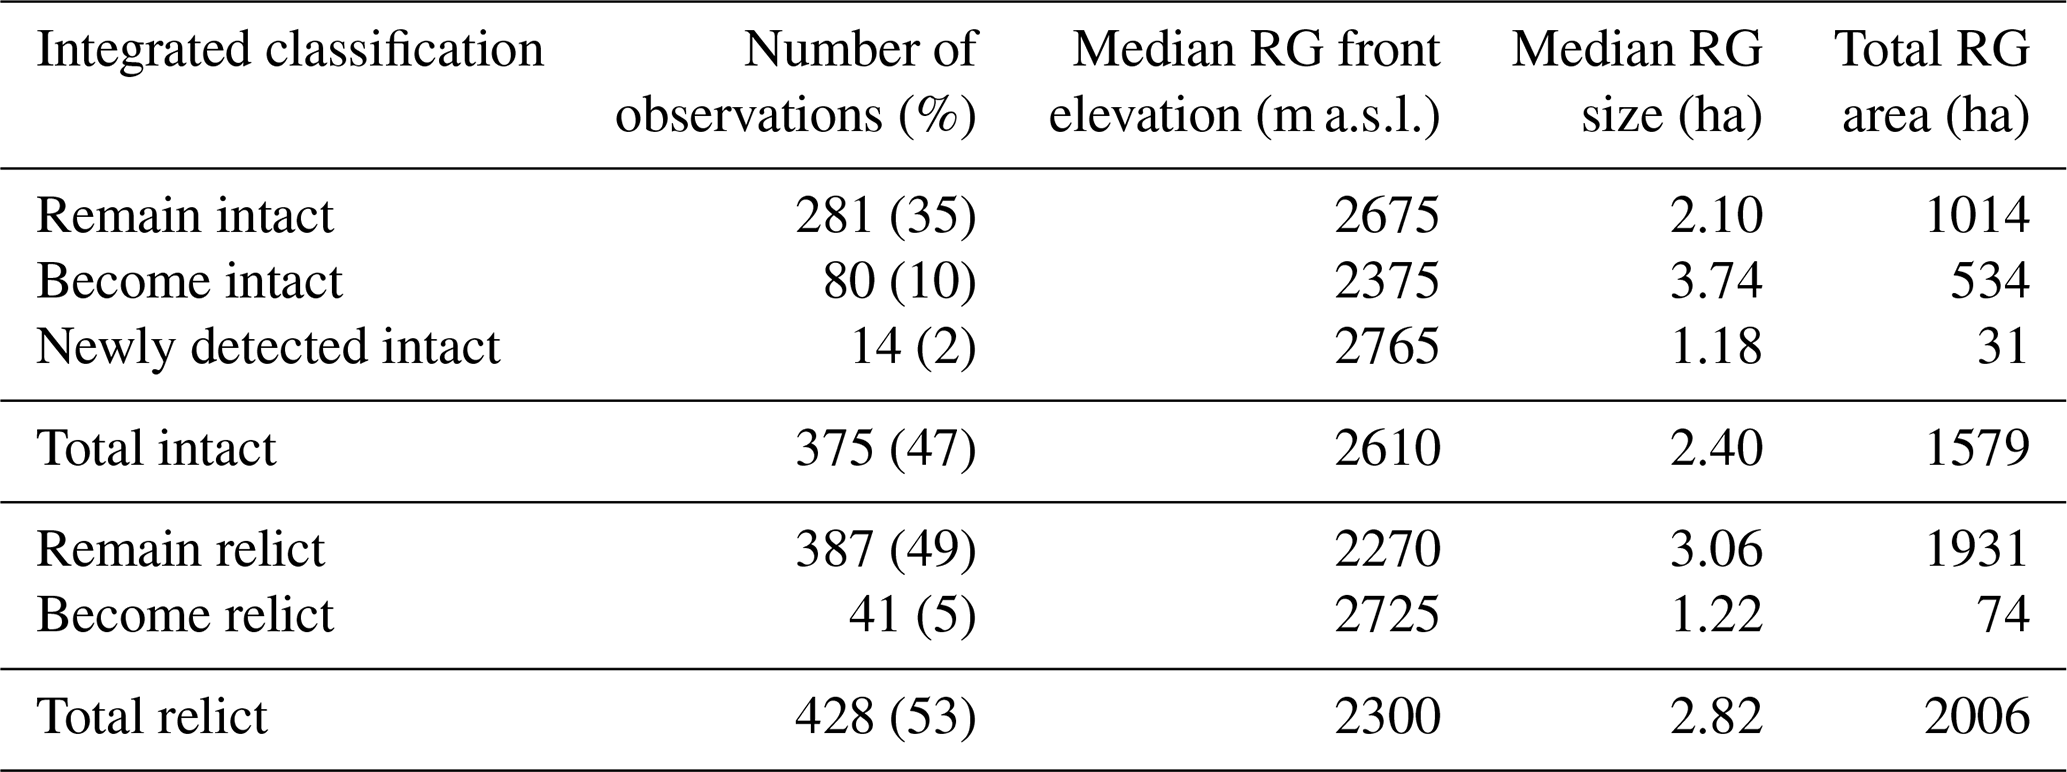

Figure 6Dynamic classification of rock glaciers and relevant membership changes across the geomorphologic, InSAR-based (i.e., kinematic), and integrated inventories. Dashed lines indicate uncertainty in membership attribution associated with undefined cases. See Fig. 2 and the relevant text for information on the decision rules adopted in the integrated inventory.
4.3 Topographic characterization of moving areas and distribution within intact rock glaciers
To fully exploit InSAR-based information and improve our understanding of rock glacier occurrence and dynamics in relation to present topo-climatic conditions, we examine how the velocity and spatial distribution of moving areas within rock glaciers vary as a function of simple topographic variables such as elevation and aspect, known to exert first-order controls on permafrost occurrence. The altitudinal distribution of moving areas displays a progressive increase from north- to south-facing slopes (Fig. 7), grossly confirming the strong dependence on slope aspect previously observed by the qualitative geomorphologic approach (Fig. 4a). This pattern, documented in other settings of the Alps and elsewhere (e.g., Barsch, 1996; Imhof, 1996; Scapozza and Mari, 2010; Scotti et al., 2013; Falaschi et al., 2015; Wagner et al., 2020), is regarded as an expression of aspect-dependent surface and subsurface thermal conditions that in rock glaciers occur at comparably higher elevations at slope aspects where the potential incoming solar radiation is higher.

Figure 7Altitudinal distribution of moving areas as a function of slope aspect and stratified by velocity: (a) 1–3 cm yr−1; (b) 3–10 cm yr−1; (c) 10–30 cm yr−1; (d) 30–100 cm yr−1 and >100 cm yr−1. Grey-shaded area and black line work indicate, respectively, the interquartile range (25th to 75th percentiles) and the median elevation of intact rock glacier fronts as mapped and classified in the geomorphologic inventory.
The aspect dependence is ill-defined for the “slowest” moving areas (i.e., 1–3 cm yr−1; Fig. 7a), which display high scatter at elevations below 2600 m and become better constrained for the 3–10 and 10–30 cm yr−1 counterparts (Fig. 7b and c). In this context, faster moving areas (i.e., >30 cm yr−1), while broadly following the same pattern across aspects, exhibit a remarkable gap on dominantly south-facing slopes (Fig. 7d). This is particularly the case for areas moving >1 m yr−1, which cluster on easterly and westerly aspects and appear not to be strongly constrained by elevation. Overall, the upper altitudinal limit of areas moving at 1–3 cm yr−1 plots about 300 m below that of the other (faster) classes (i.e., except for a cluster of seven moving areas on southerly aspects; Fig. 7a), which, by contrast, do not show altitudinal segregation from each other (Fig. 7b–d and Table 2).
Mapped moving areas range in size from 0.08 to 21 ha, with an overall median of 0.73 ha. Their median size, which does not vary systematically with velocity class, peaks distinctively for those that move at 30–100 cm yr−1 (i.e., 1.28 ha; Table 2). This finding suggests that, where such moving areas occur, they are likely to dictate (or greatly influence) the kinematic class assigned to the hosting rock glacier. When considered against the slope aspect, MA size exhibits no obvious dependence. Specifically, we observe a consistent, wide range of size variability across aspects, with relevant median sizes ranging from as little as 0.57 ha on western aspects up to 0.96 ha on the south-facing aspects (red triangles in Fig. 8a). This pattern does not change when considering moving areas slower than 30 cm yr−1 (Fig. S2a–c in the Supplement), whereas a cluster of small (i.e., area <0.4 ha) moving areas stands out on eastern, western, and northwestern aspects for velocities higher than 30 cm yr−1 (Fig. S2d). MA size does not appear to correlate with elevation either. Accordingly, if we exclude moving areas below 2200 m a.s.l. – which, however, have a limited sample size – consistent high scatter and comparable MA median sizes (red triangles range from 0.57 ha, (2000–2200 m a.s.l.) to 0.86 ha (2800–3000 m a.s.l.)) are observed across elevations (Fig. 8b), also when moving areas are stratified by velocity (Fig. S3).
To explore which proportion of a rock glacier polygon (as delineated in the geomorphologic inventory) actually moves and how this proportion may vary as a function of rock glacier size and elevation, we have represented total moving area – here defined as the combined areal extent of the moving areas hosted within a given rock glacier – against rock glacier size across four altitudinal bands (Fig. 9) and four velocity classes (Fig. 10). Data stratified by elevation show high variability below 2500 m a.s.l., ranging from cases in which virtually the entire rock glacier surface moves (1:1 line) to cases where the fractional moving extent drops to less than 10 % (1:10 line in Fig. 9a). At progressively higher elevations, this variability declines, and we observe that total moving area increasingly clusters between 50 % (1:2 line) and 100 % (1:1 line) (see Fig. 9b–d). At elevations above 2900 m a.s.l., where clustering is highest (despite the limited number of observations involved) and data trend parallel to isometry (1:1 line), total moving area increases at about the same rate of rock glacier size.
When rock glaciers are stratified by surficial velocity of displacement along the LOS, we observe patterns of variability similar to those just described across elevation bands. Accordingly, scatter is highest for rock glaciers moving at centimeter annual rates, where total moving area ranges from less than 10 % to 100 % of their surface (i.e., points cluster between 1:10 and 1:1 lines in Fig. 10a) and drops rather abruptly for faster rock glaciers, where at least 30 % to 40 % of their surface moves (i.e., points cluster predominantly between 1:2 and 1:1 lines in Fig. 10b–d). Collectively, the systematic variability of total moving area suggests that, as rock glaciers move faster, an increasingly larger proportion of their surface becomes kinematically involved and that this proportion increases with elevation, irrespective of rock glacier size. As will become clear, the increasing altitudinal clustering of moving areas characterized by higher velocity imparts a characteristic altitudinal continuum in rock glacier dynamics, which we consider a geomorphic expression of sporadic-to-discontinuous permafrost transition (Sect. 5.2).

Figure 8Moving area (MA) size represented as a function of (a) slope aspect and (b) elevation. Red triangles indicate median MA values across, respectively, aspect sectors and altitudinal zones, bounded by dashed lines.
The compilation and maintenance of a rock glacier inventory, which includes both intact and relict landforms, are critical for advancing knowledge on a variety of basic and applied challenges associated with the changing high-mountain cryosphere. For example, geomorphic change detection and analysis of rock glacier velocity (RGV) time series allow evaluation of contingent to century long responses to warmer climate conditions, which may range from transition to relict morphologies, with widespread surface subsidence and/or loss of downslope momentum (Bollmann et al., 2015; Necsoiu et al., 2016; Manchado et al., 2024), to generalized rock glacier destabilization with orders of magnitude increase in mean annual velocity at their fronts (Delaloye et al., 2008; Scotti et al., 2017a; Marcer et al., 2019, 2021; Pellet et al., 2023; RGIK, 2023b, c) and enhanced potential for debris-flow occurrence (Kummert and Delaloye, 2018; Kummert et al., 2018; Kofler et al., 2021). Similarly, detecting and mapping relict rock glaciers is critical for the appraisal of past environmental conditions that fostered permafrost development and persistence (e.g., Frauenfelder et al., 2001; Boeckli et al., 2012; Schmid et al., 2015) as well as for reconstructing geomorphic responses to Holocene climatic changes (e.g., Krainer et al., 2015; Zasadni and Kłapyta, 2016; Scotti et al., 2017b; Amschwand et al., 2021).
With respect to the original geomorphologic inventory, we first discuss the changes imparted by InSAR information to the dynamic classification of rock glaciers, consolidate the relevant gain in inventorying reliability, and acknowledge the remaining sources of uncertainty (Sect. 5.1). Subsequently, starting from a set of representative case studies, we illustrate local changes associated with the InSAR-based dynamic classification of rock glaciers – from intact to relict and vice versa – and illustrate how these translate into valley-wide changes to the altitudinal separation (or overlapping) between relict and intact landforms across slope aspects (Sect. 5.2). Finally, not accounting for variable slope aspect, we identify an elevation-dependent increase in average rock glacier velocity and average MA cover and discuss its geomorphic significance with respect to the current state of mountain permafrost.
5.1 InSAR-based kinematic information and sources of uncertainty
In this contribution, we illustrate the importance of complementing a geomorphologic rock glacier inventory with InSAR-derived kinematic information. Integration of the two inventorying approaches, each of which is characterized by specific strengths and weaknesses, allows us to reduce the overall uncertainty associated with the procedures of rock glacier detection, mapping, and dynamic classification. On the one hand, visual interpretation of multitemporal optical imagery is crucial for outlining the morphological footprint of a rock glacier and serves as a benchmark for developing automated mapping routines (e.g., Robson et al., 2020; Reinosch et al., 2021). On the other hand, visual interpretation of multitemporal wrapped interferograms – except where decorrelation occurs – ultimately determines whether a rock glacier exhibits surface deformation, at what mean annual rate, and in which portion of its morphological footprint, thus confirming or rectifying prior evaluation solely based on the interpretation of morphological attributes. This InSAR-based dynamic (re)classification, however, must take into account (i) the minimum phase difference (and thus the minimum rate of annual displacement) that a given SAR constellation can capture (i.e., ≈1 cm yr−1 for Sentinel-1 annual interferograms) and (ii) the underestimation of interferometric phase change due to unfavorable geometry, even when both ascending and descending acquisitions are examined (Klees and Massonnet, 1998; Liu et al., 2013).

Figure 9Total moving area per rock glacier as a function of rock glacier size across elevation bands: (a) below 2500 m a.s.l, (b) between 2500 and 2700 m, (c) between 2700 and 2900 m, and (d) above 2900 m. Solid lines indicate reference ratios corresponding to the percentages of moving area cover within a rock glacier: 1:1 (100 % cover), 1:2 (50 % cover), and 1:10 (10 % cover).
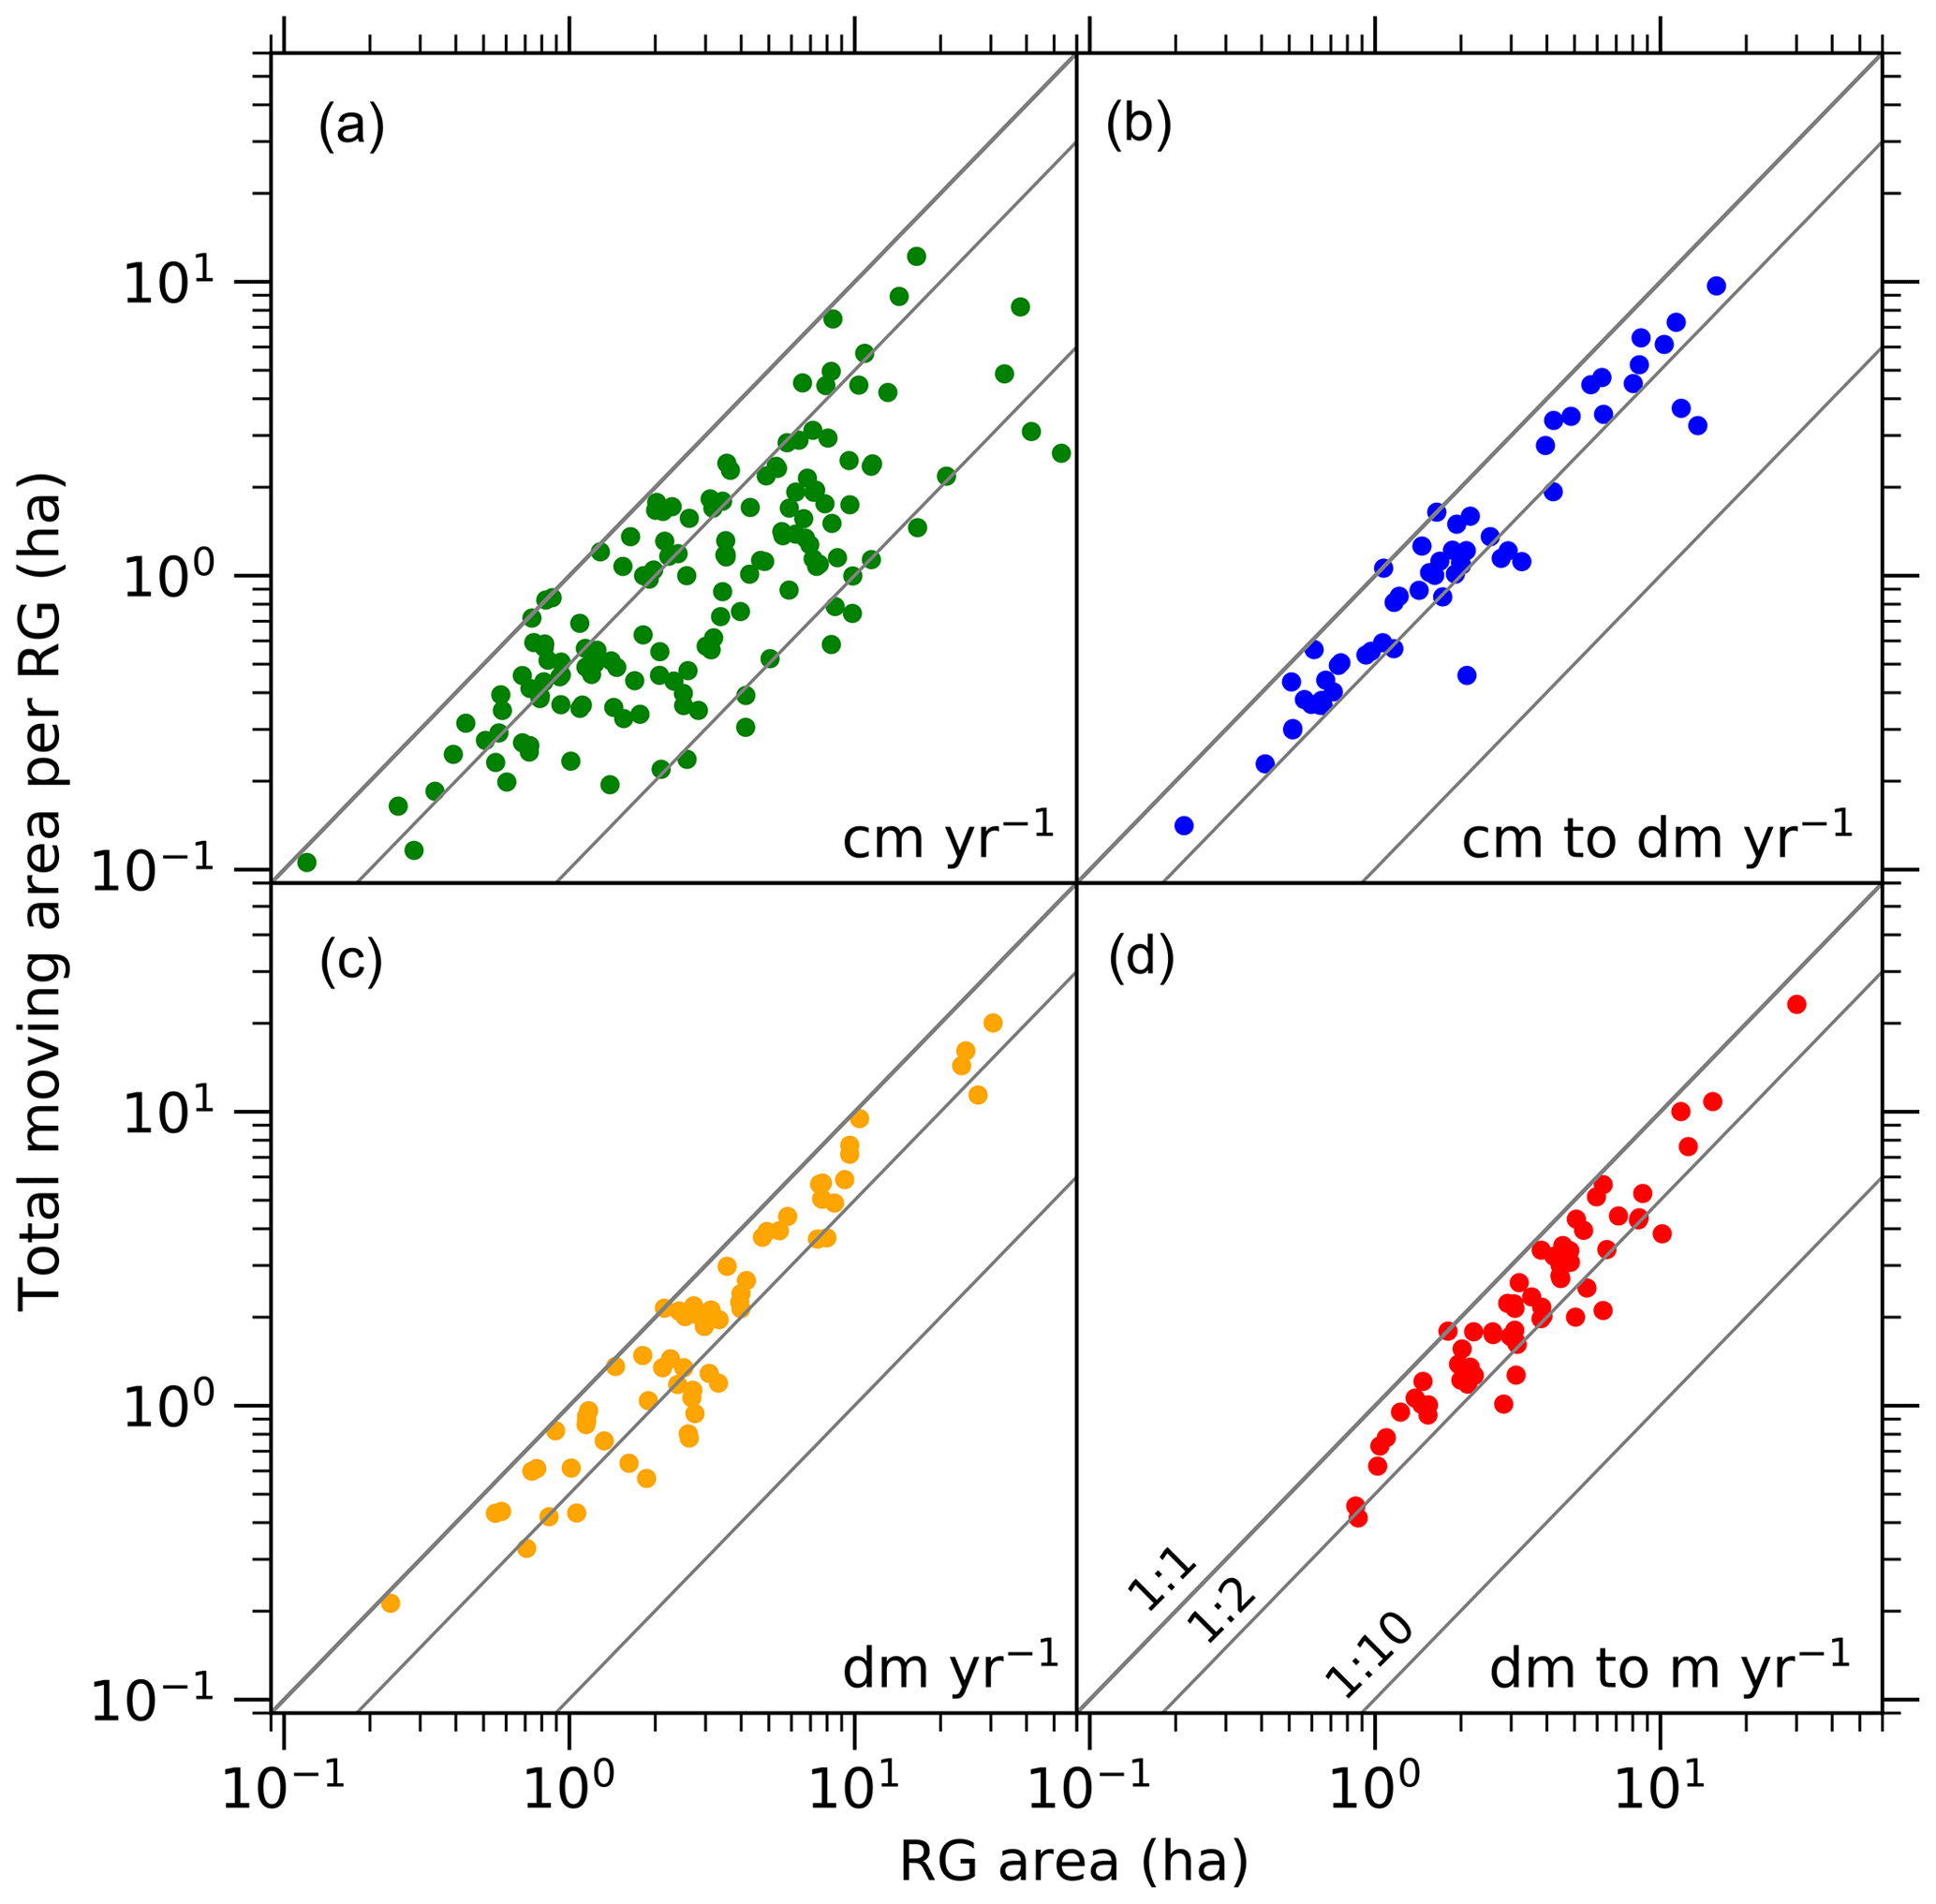
Figure 10Total moving area per rock glacier as a function of rock glacier size stratified by the annual rate of surficial displacement: (a) cm yr−1; (b) cm to dm yr−1; (c) dm yr−1; (d) dm to m yr−1. Solid lines indicate reference ratios corresponding to the percentages of moving area cover within a rock glacier: 1:1 (100 % cover), 1:2 (50 % cover), and 1:10 (10 % cover).
Computation of the α angle between the downslope direction of each rock glacier's main flow line and the LOS (see Eq. 1 in Sect. 3.2.1) aided identification in the aspect–slope space (Fig. 11a) of 177 landforms (out of 789) associated with phase underestimation that exceeds 50 % and is therefore deemed unreliable (e.g., Klees and Massonnet, 1998). In agreement with prior studies (e.g., Liu et al., 2013; Strozzi et al., 2020), we find that similar rates of underestimation primarily affect rock glaciers located around the southerly aspects (n=131) and secondarily around the northerly ones (n=46) (i.e., circles with red outline in Fig. 11a). Among these, 61 (34 %) bear moving areas and as such are classified as “moving”, 88 (50 %) lack moving areas and therefore are regarded as “not moving”, and 28 (16 %) are labeled as “undefined” due to decorrelation. While for the “moving” ones high underestimation would mean – in the worst-case scenario – assigning these landforms to a slower (than real) kinematic class, some of the 88 “not moving” rock glaciers may just be the result of signal underestimation, which for example would preclude detection of rock glacier portions moving at centimeter annual rates and consequently lead to misclassification (i.e., not moving rather than actually moving).

Figure 11(a) Color-coded percent underestimation of the interferometric phase signal as a function of the mean values of aspect and slope gradient. For each rock glacier, we consider and represent graphically the lower value of underestimation between the ascending and descending configurations. Red circles identify rock glaciers with underestimation >50 %, which we regard as being affected by high uncertainty. (b) Scatterplot showing in the aspect–elevation space the positions of rock glaciers that underwent dynamic reclassification following InSAR analysis and of those that are considered undefined (due to decorrelation), which therefore will retain the original geomorphologically based dynamic classification (i.e., undefined intact and undefined relict). For reference, we report the median and the interquartile range of altitudinal variability (i.e., whiskers) of relict (red) and intact (blue) rock glaciers as originally classified in the geomorphologic inventory. (c) Total rock glacier area across altitudinal bands, stratified into moving and not moving categories after InSAR analysis. This representation excludes undefined landforms. In panel (c), note the generalized altitudinal overlap between moving and not moving rock glaciers (see Fig. 4b).
A last source of uncertainty is represented by decorrelation, which affects 144 (18 %) landforms (Table 3 and Fig. 6). Of these, 109 had been classified as morphologically relict and 35 as morphologically intact. For the former set, visual examination of optical imagery suggests that decorrelation is likely associated with extensive vegetation cover, and therefore during aerial photo interpretation they were assumed to bear no motion (e.g., Barsch, 1992; Haeberli et al., 2006; Scotti et al., 2013). This qualitative interpretation appears reasonable, considering that most of the kinematically undefined, morphologically relict rock glaciers plot in the aspect–elevation space at low elevations (grey triangles in Fig. 11b). In particular, 88 (out of 98) lie within the interquartile altitudinal range of relict rock glaciers across slope aspects. The same reasoning can be extended to the 46 kinematically undefined, morphologically intact rock glaciers, considering that all but 4 of them lie within the interquartile altitudinal range of intact rock glaciers (orange dots in Fig. 11b). In this second set of rock glaciers, decorrelation is probably chiefly related to issues including persistent snow cover, atmospheric artifacts, phase bias, or extended layover and shadowing (Barboux et al., 2014; Yague-Martinez et al., 2016).
Despite the caveats noted in this section, the dynamic reclassification of rock glaciers based on InSAR kinematic information – for landforms in which signal underestimation falls below 50 % – has afforded a notable reduction in the uncertainty of the morphological inventory. This is apparent when considering that 80 rock glaciers previously regarded as relict did bear areas within their footprints and that 41 of those previously classified as intact did not host any (Fig. 6). The significance of this InSAR-based reclassification procedure is further supported by the distribution of the relevant rock glaciers in the aspect–elevation space. Accordingly, the vast majority of rock glaciers that have respectively “become intact” (70 out of 80) and “become relict” (39 out of 41) falls within the altitudinal domain (i.e., interquartile range) of the opposite dynamic category (Fig. 11b), thus indirectly weakening the altitudinal separation previously observed between morphologically intact and relict landforms in terms of both median front elevation across aspects (Fig. 4a) and total rock glacier area distribution (Fig. 4b). In particular, we observe that the median front elevation of rock glaciers that “become intact” (2375 m a.s.l.) approaches that of counterparts that “remain relict” (2270 m) (Table 4); vice versa, the median elevation front of those that “become relict” (2725 m) closely matches that of counterparts that “remain intact” (2675 m) (Table 4). With respect to total rock glacier area, the generalized altitudinal overlap between moving (i.e., intact) and not moving (i.e., relict) is striking when compared to the corresponding output of the geomorphologic inventory (see Figs. 4b and 11c). In addition, it is worth highlighting that dynamic reclassification allowed us to uncover a cluster of low-lying rock glaciers (i.e., below 2000 m a.s.l.) predominantly facing north. This finding agrees with previous reports on the occurrence of intact rock glaciers around (or slightly above) 2000 m a.s.l. in other mid-latitude mountain settings, such as the Southern Carpathians (Vespremeanu-Stroe et al., 2012; Necsoiu et al., 2016).
In the context of uncertainty reduction through integration of different inventorying approaches, InSAR contributions allowed lessening of what appears to be a systematic, altitudinal-driven bias that may affect operators' visual interpretation of landforms. Our findings suggest that operators, to some extent, may base their dynamic classification of rock glaciers – especially when these do not exhibit unambiguous morphological evidence – on the elevation at which they are located. Based on the foregoing quantitative evaluations, we suggest that geomorphic interpretation should not be entirely supplanted by InSAR-based kinematic characterization; instead, a combination of both approaches is deemed desirable.
5.2 InSAR-based dynamic reclassification of rock glaciers: from local examples to valley-wide effects
A cluster of six rock glaciers lying on a west-facing slope in the Solda Valley (Fig. 12) is instructive for illustrating how complex the spatial distribution of moving areas can be and for exemplifying the range of possible cases of agreement, disagreement, and indetermination associated with the joint evaluation of the morphological and kinematic approaches. Agreement applies to the uppermost intact landform (RG1), in which two moving areas are detected – a primary one (30–100 cm yr−1) that covers the entire rock glacier surface and a secondary faster one (>100 cm yr−1) located in the central portion – as well as to two relict rock glaciers (RG2 and RG3) further downslope, in which no moving areas were detected. Nearby, roughly at the same elevation, lie the kinematically undefined RG4 and RG5 as well as RG6, morphologically classified as relict but later reclassified as intact, in view of the two moving areas detected in the interferograms. This reclassification imparts a local drop (of about 100 m) to the lower limit of intact rock glaciers.
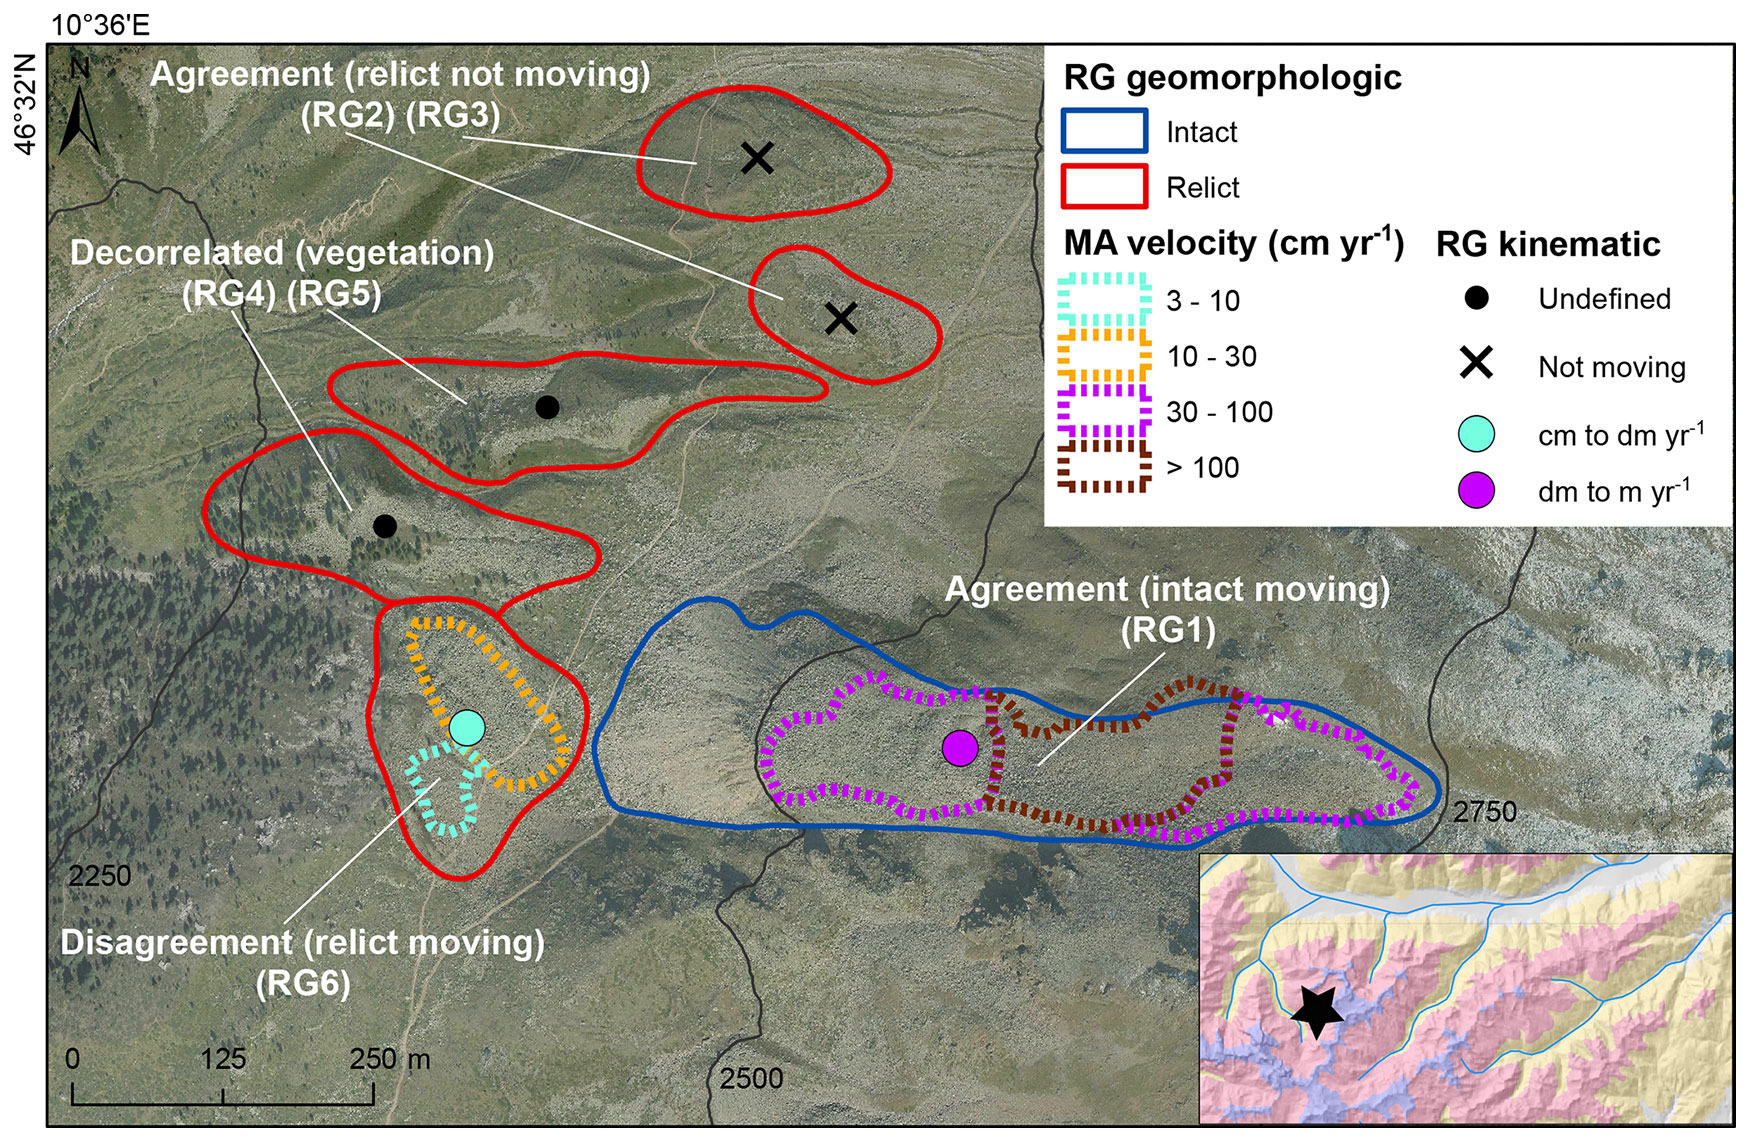
Figure 12Example of six rock glaciers in the Solda Valley. The intact rock glacier RG1 contains moving areas and is classified as moving (i.e., at dm to m yr−1 rate). At lower altitudes, relict rock glaciers RG2 and RG3 lack moving areas, and other two landforms are affected by InSAR decorrelation due to vegetation (i.e., “Undefined”; RG4 and RG5). RG6 was originally classified as relict, hosts moving areas, and is reclassified as intact. At this location, SAR underestimation is lower than 20 %. Orthoimage from the Autonomous Province of Bolzano (https://geoportale.retecivica.bz.it/geodati.asp, last access: 30 June 2023).
A second cluster of landforms on a slope facing south-southeast in the Martello Valley (Fig. 13) exemplifies dynamic classification agreement for intact rock glaciers RG1 and RG2 – in which moving areas span from the rooting zones down to the relevant fronts – and relict counterparts RG3 and RG4 but underlies disagreement for RG5 and RG6. The former hosts moving areas (3–10 to 10–30 cm yr−1) in the rooting zone and across its upper half (which qualifies as an example of an “inactive” rock glacier, following the definition by Barsch (1996); see Sect. 3.1). The latter exhibits surficial displacement, even though at the lowest detectable rate (1–3 cm yr−1), across the entire surface. As a result, the lower limit of intact rock glaciers drops locally from 2850 down to 2300 m a.s.l.
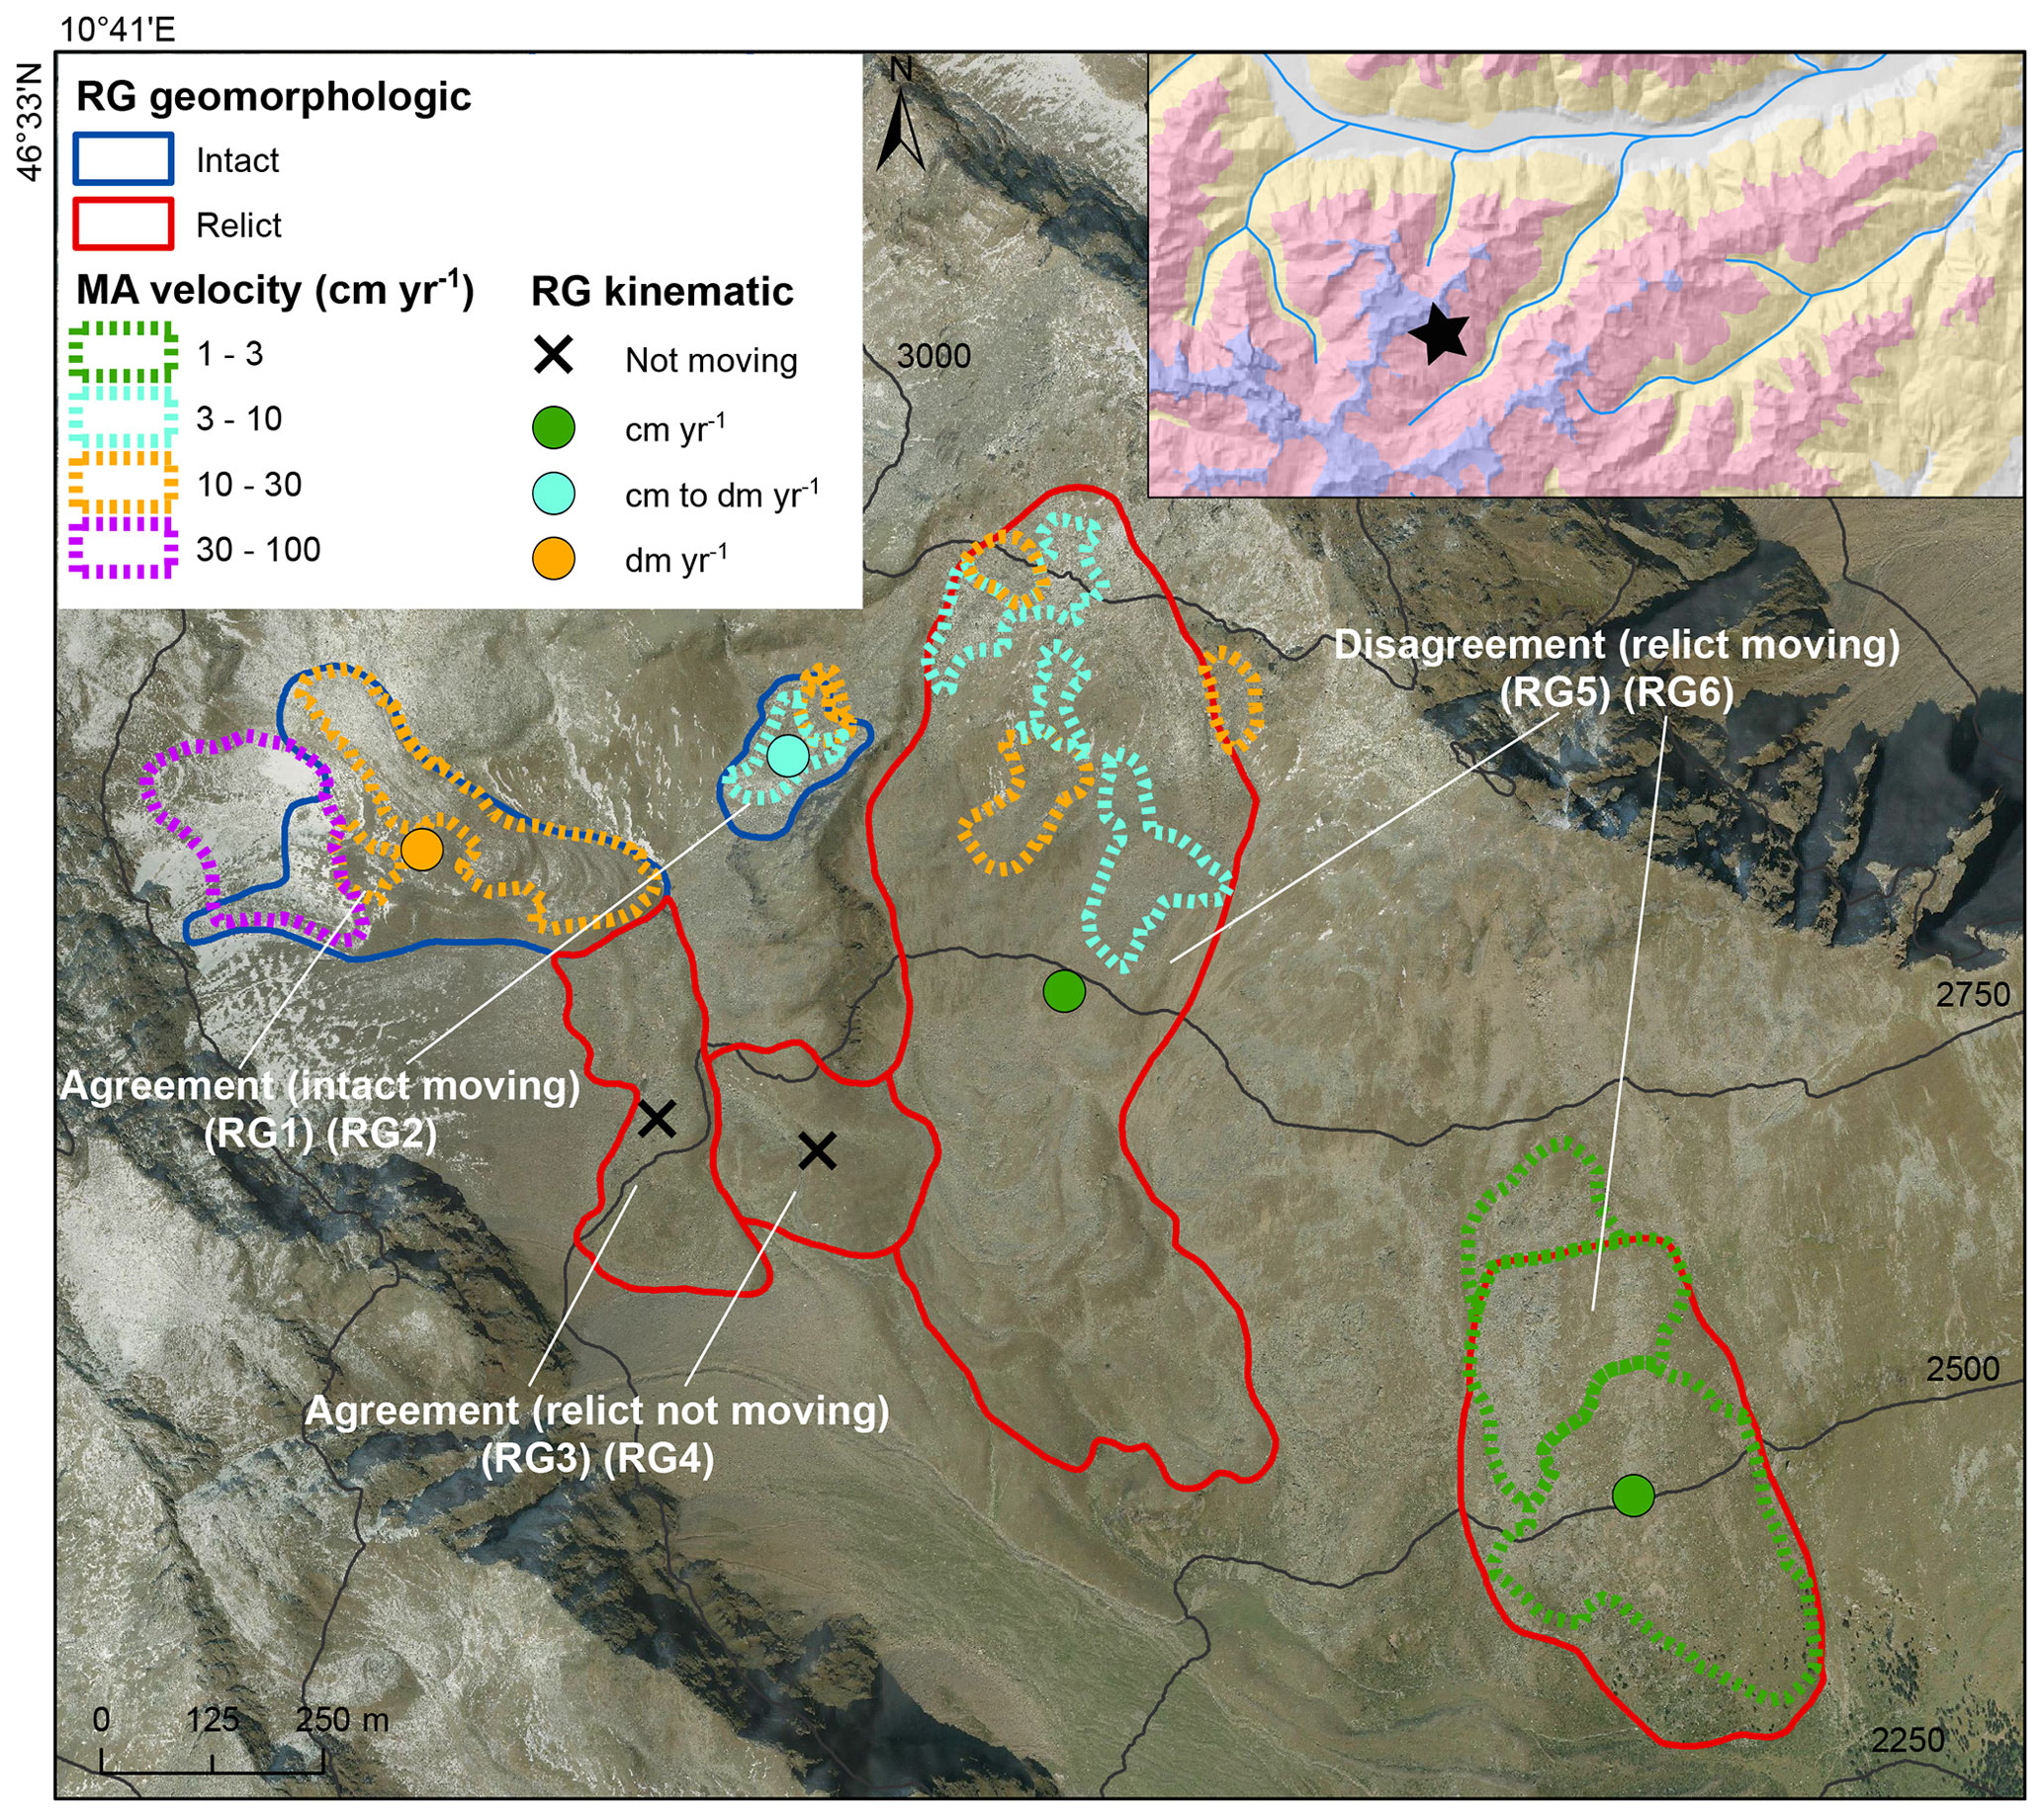
Figure 13Example of six rock glaciers in the Martello Valley. Two intact rock glaciers RG1 and RG2, located at high elevation (front elevations 2775 and 2820 m a.s.l.), host moving areas and are classified as moving. Relict rock glaciers RG3 and RG4 (front elevations 2680 and 2670 m a.s.l.) do not exhibit moving areas and therefore are classified as not moving. However, since underestimation of SAR signal lies close to the reliability threshold (i.e., between 38 % and 46 %) due to unfavorable geometry with respect to LOS, some degree of uncertainty remains as this configuration could prevent detection of slow surface displacement (i.e., cm yr−1). At lower elevations, RG5 (2555 m) and RG6 (2280 m), two relict rock glaciers are indeed characterized by moving areas: they are classified as moving and consequently become intact in the integrated classification. Orthoimage from the Autonomous Province of Bolzano (https://geoportale.retecivica.bz.it/geodati.asp, last access: 30 June 2023).
InSAR-based classification can also impart a local rise to the altitudinal distribution of relict rock glaciers. This is the case of RG1 (2585 m a.s.l.) and RG2 (2575 m a.s.l.) in the Ultimo Valley (Fig. S4a), originally classified as intact but which did not host any moving areas (i.e., InSAR underestimation <20 %) and therefore in the integrated classification became relict. A last example is drawn from the Martelltal/Martello Valley (Fig. S4b). At this north-facing site, despite InSAR underestimation ranging from 39 % to 57 %, three out of the four rock glaciers are found to host moving areas, with a velocity that ranges from 3 to 10 cm yr−1 in RG1 (at 2300 m a.s.l., formerly classified as relict) to 30–100 cm yr−1 in RG3 (at 2750 m a.s.l.). In this context of high phase underestimation, the lack of moving areas in RG4 should be considered with caution, as slow deformation (i.e., 1–3 cm yr−1) might be occurring.
Beyond local effects, integration of InSAR-based kinematics imparts substantial changes to the overall altitudinal distribution of intact and relict rock glaciers, as originally assessed in the geomorphologic inventory (Fig. 14), while he general pattern of progressively increasing front elevation, as one moves from northerly rock glacier fronts (the lowest) to southerly counterparts (the highest), is retained. The altitudinal separation between morphologically intact and relict landforms (i.e., median values are at least 400 m apart across aspects) (Fig. 14a) is substantially reduced when considering moving and not moving rock glaciers, which display widespread interquartile overlap (i.e., depending on aspect: median separation drops between 200 and 350 m) (Fig. 14b). Overlap is highest across southeast- through southwest-facing rock glaciers, whereas westerly oriented landforms change the least and maintain interquartile separation. These altitudinal changes, which are associated with the InSAR-based reclassification of 121 rock glaciers – and therefore neglect kinematically undefined landforms (n=144) – derive from a decrease in the altitudinal distribution of moving rock glaciers (compared to the morphologically intact ones) and a simultaneous increase in the not moving rock glaciers (compared to the morphologically relict ones), as previously shown (Table 4 and Fig. 11b).
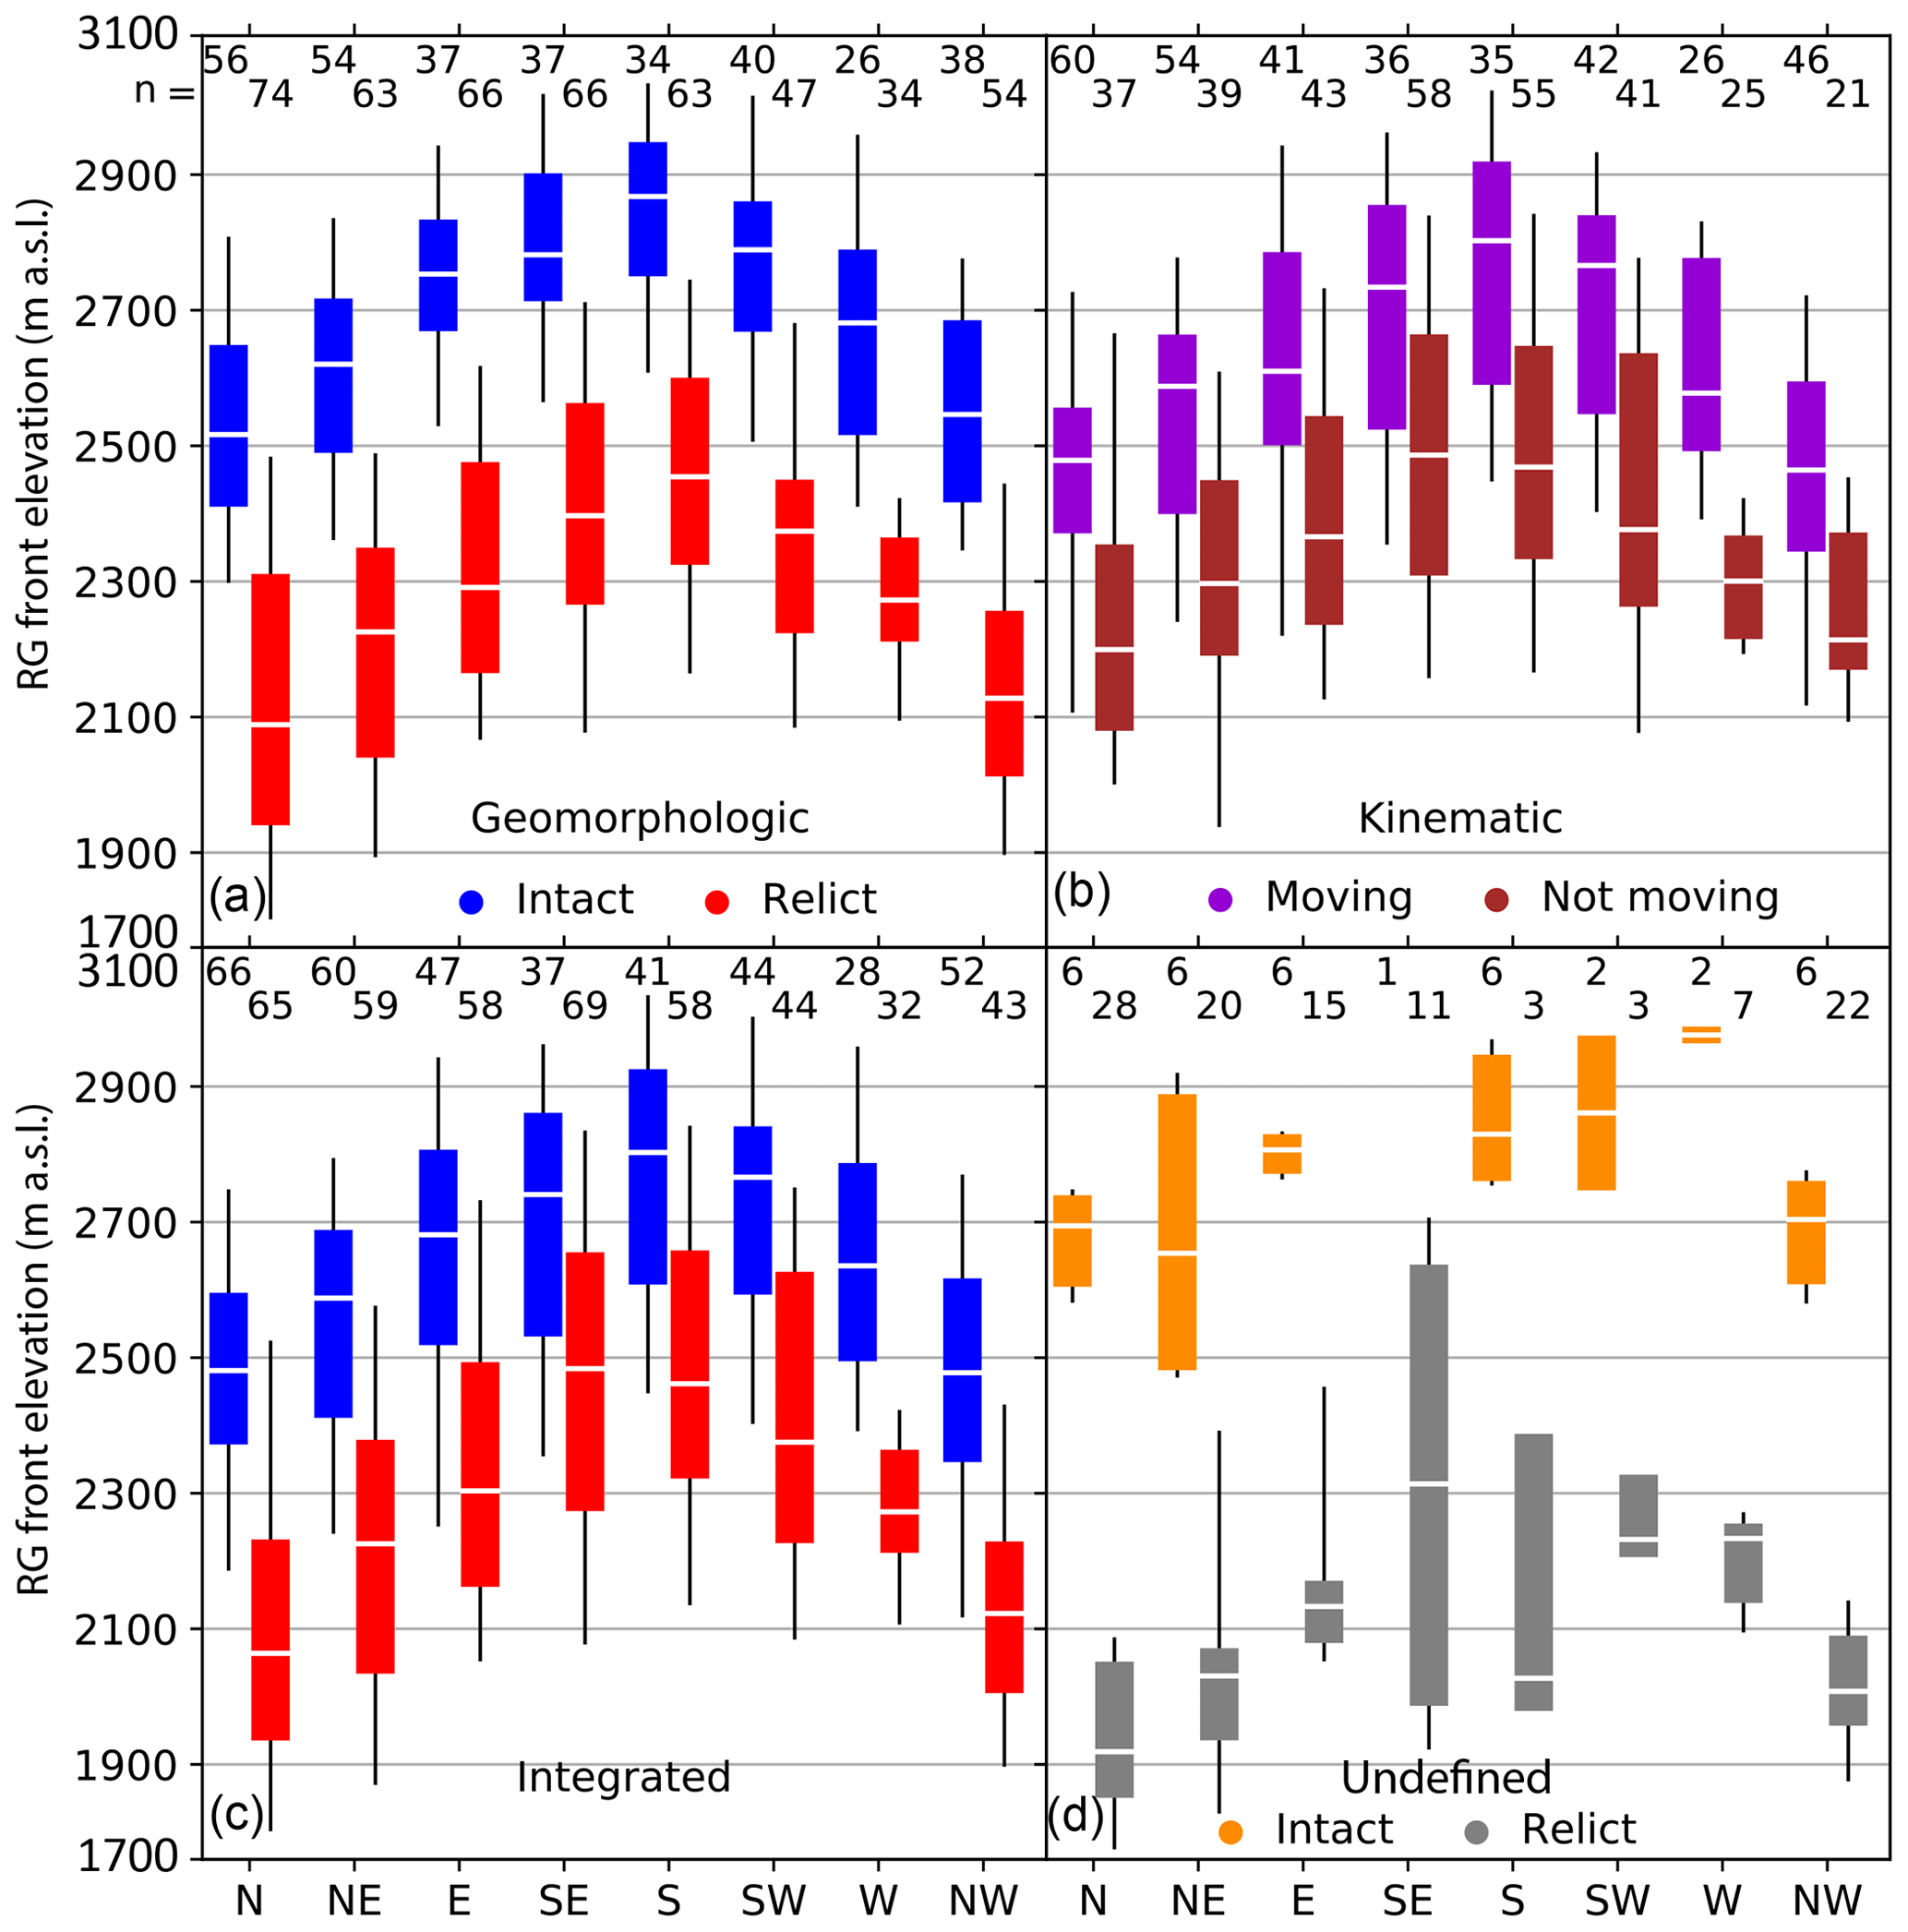
Figure 14Boxplots showing the altitudinal distribution of rock glacier fronts across slope aspects for (a) intact and relict rock glaciers of the geomorphologic inventory, (b) moving and not moving rock glaciers following the InSAR-based kinematic characterization, (c) intact and relict rock glaciers of the integrated inventory, and (d) kinematically undefined rock glaciers stratified according to the original morphologically based dynamic classification. The white horizontal line work represents median values, boxes enclose the interquartile range (25th–75th percentiles), and whiskers bound the 5th and 95th percentiles.
When kinematically undefined landforms are added (i.e., they retain their original morphologically based membership), interquartile separation between intact and relict landforms in the integrated inventory is partly regained (i.e., median values are 300 m apart) (Table 4), except in southeast- through southwest-facing landforms, which preserve the highest overlap (Fig. 14c). In this context, the striking altitudinal separation observed between undefined (morphologically) intact and relict rock glaciers (Fig. 14d) suggests that the two clusters may indeed belong to different dynamic categories (i.e., moving and not moving) and that our simplistic decision rule of data integration was reasonable.
Overall, the InSAR-based kinematic characterization of rock glaciers, by reducing the altitudinal separation between morphologically intact and relict landforms (Fig. 14), depicts a broad transition belt of intact–relict coexistence in the aspect–elevation space, the amplitude of which – here defined as the zone comprised of the 95th percentile of relict rock glaciers and the 5th percentile of intact counterparts – varies from as little as 50 m on west-facing slopes to a maximum of 500 m on easterly ones (Fig. 14c). A similar altitudinal overlap, which possibly reflects the complex spatial pattern of discontinuous permafrost, deteriorates the significance of elevation and aspect as topographic proxies for modeling permafrost occurrence in southwestern South Tyrol and consequently underlines the importance of using InSAR technology for informing such models.
Equally importantly, from a basic process-oriented standpoint, InSAR information proves fundamental for imaging how this altitudinal transition manifests through changing rates and styles of rock glacier surface deformation. Collectively, the systematic variability of total moving area suggests that, as rock glaciers move faster, an increasingly larger proportion of their surface gets kinematically involved and that this proportion increases with elevation (Figs. 9 and 10). This interpretation becomes apparent when lumping MA variability into rock glacier units, i.e., when representing rock glacier annual velocity and percent MA cover (i.e., the proportion of a rock glacier surface occupied by moving areas) as a function of elevation (Fig. 15). Indeed, both variables increase linearly with elevation up to the 2600–2800 m band, beyond which an inflection occurs and consistent average values (and ranges of variation) are attained. According to the classification scheme recently proposed by RGIK (2023a), the average dynamic state that characterizes rock glaciers below and above 2600 m are consistent, respectively, with transitional and active rock glacier types. Interestingly, this representation aids in elucidating that a number of moving areas and relevant hosting intact rock glaciers are located at positive MAAT values and that locally a lower limit for sporadic permafrost may be set around the 1880–2000 m elevation band (i.e., +3 °C MAAT).
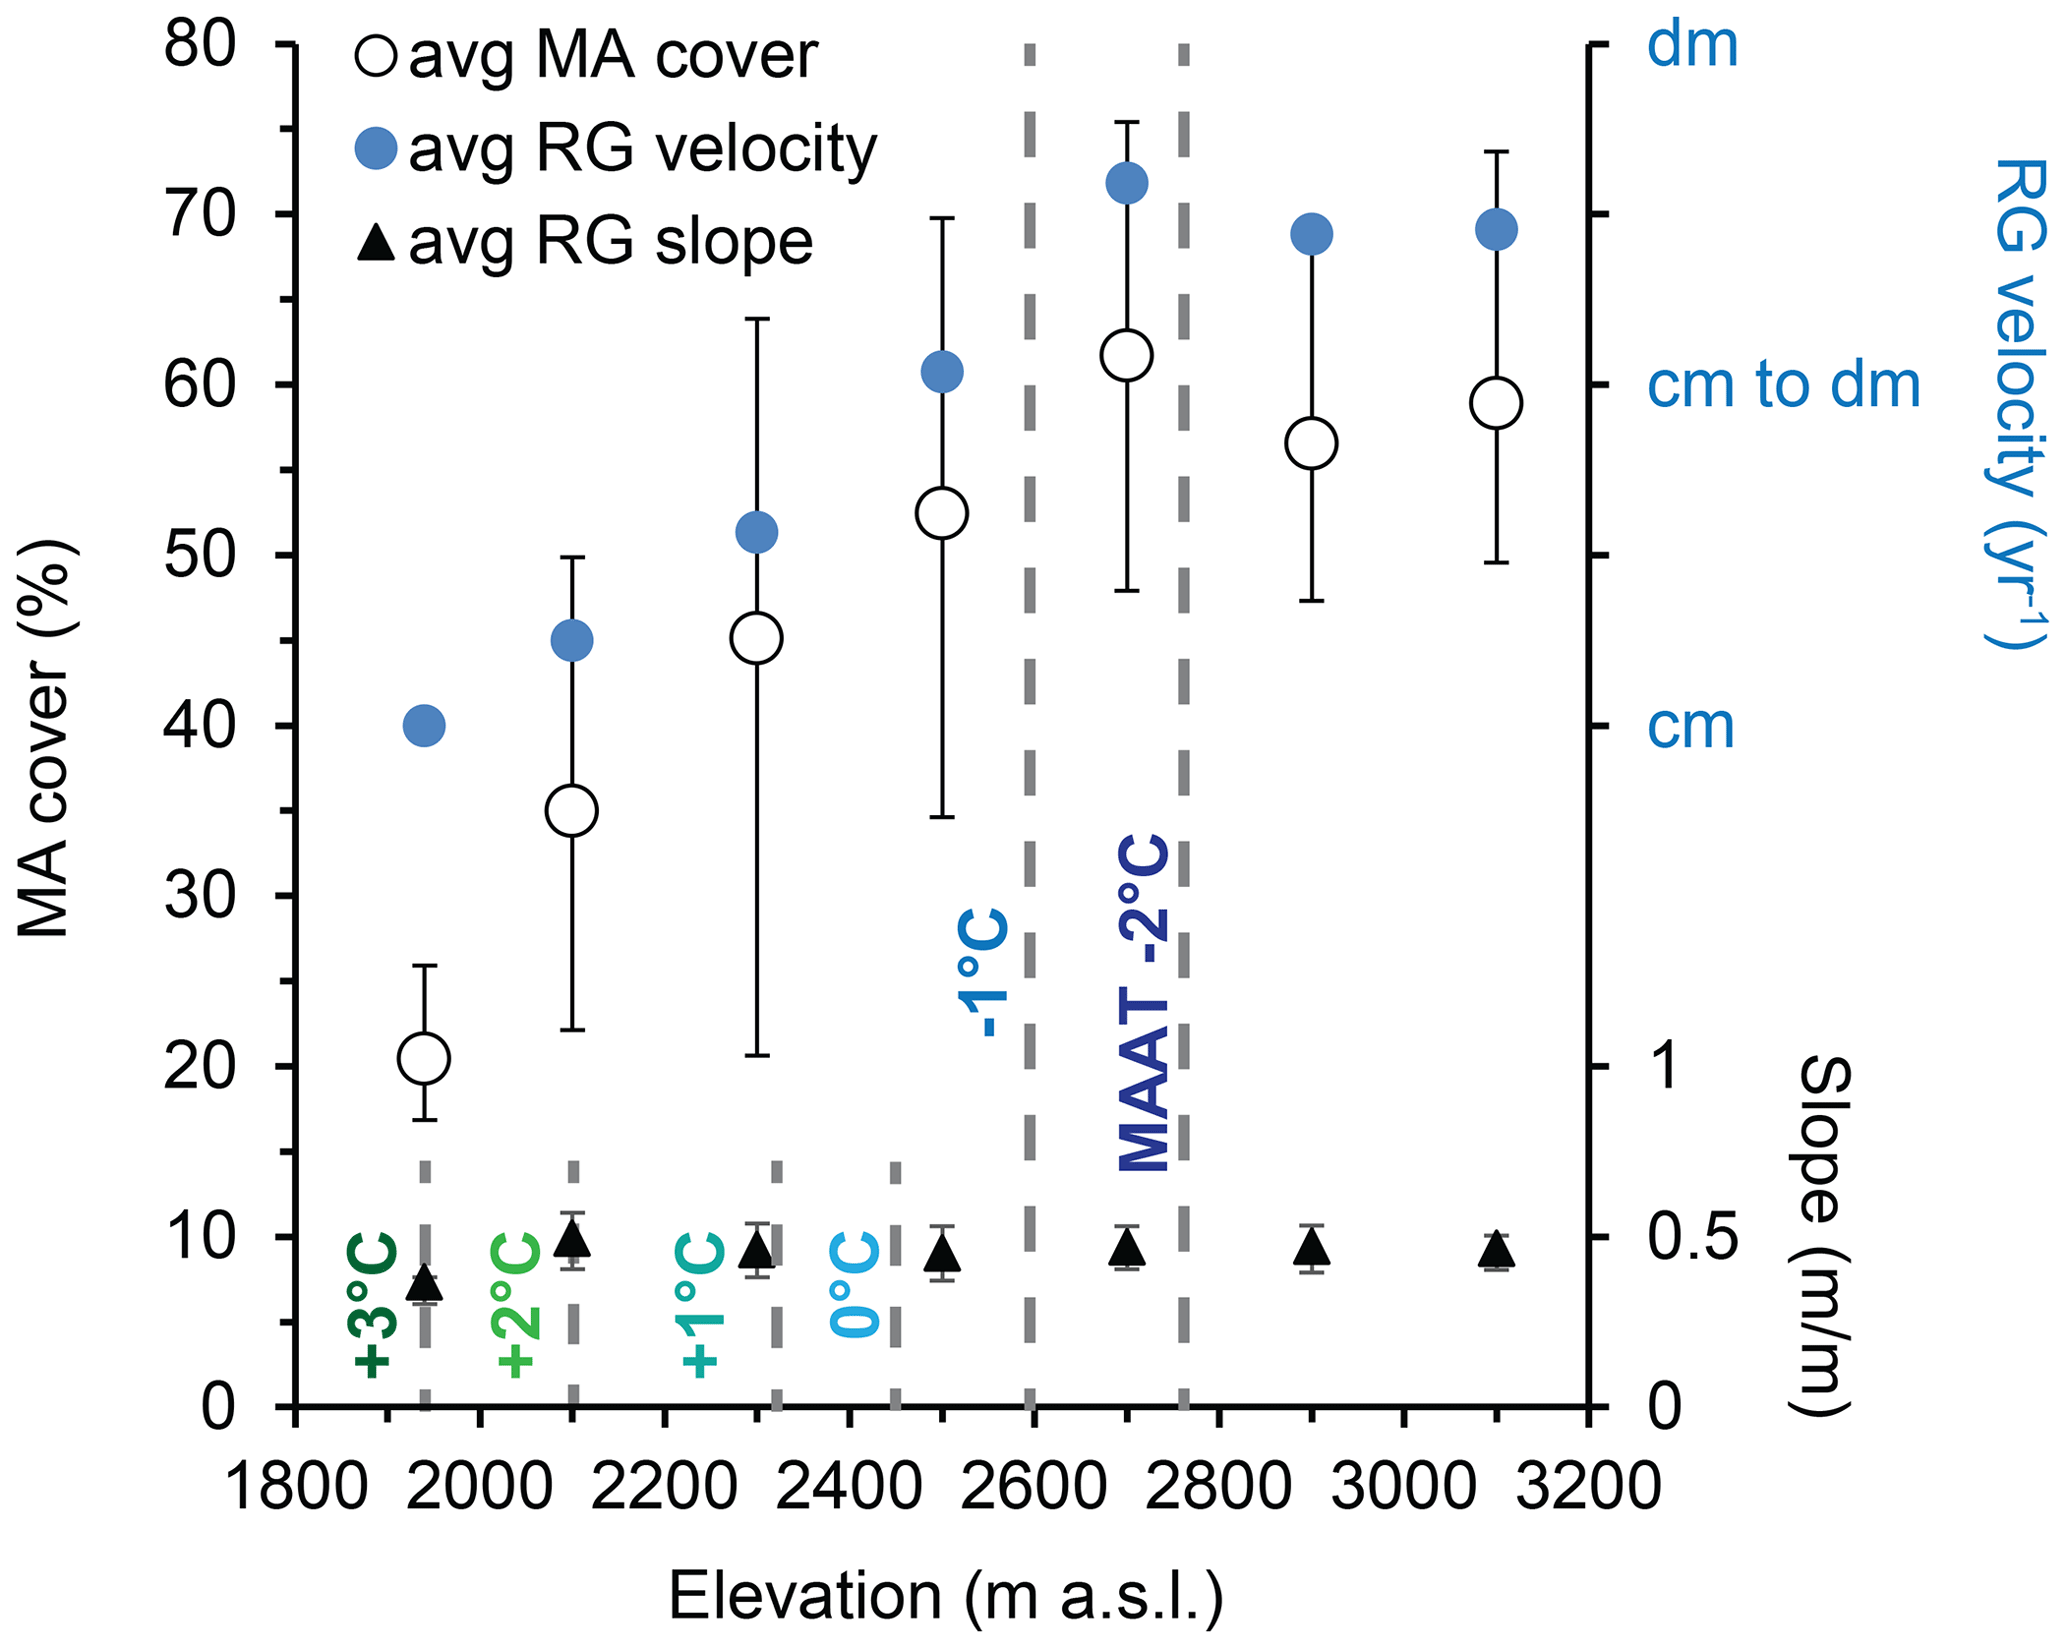
Figure 15Average variation of rock glacier velocity (class), rock glacier surface MA cover, and slope gradient (m/m) as a function of elevation. Averages are calculated across the following elevation bands: 1880–2000, 2000–2200, 2200–2400, 2400–2600, 2600–2800, 2800–3000, and 3000–3140 m. Whiskers around the average values bound the interquartile ranges (25th–75th percentiles). The velocity classes include cm yr−1, cm to dm yr−1, and dm yr−1. Note the inflection point in the velocity and MA cover at elevations between MAAT −1 and −2 °C. MAAT values are computed from gridded data drawn from http://www.3pclim.eu/ (last access: 30 June 2023) and refer to the period 1981–2010.
Our findings differ from similar work conducted in the Uinta Mountains (Utah), in which no apparent altitudinal dependence of rock glacier velocity was found (Brencher et al., 2021). Most importantly, the altitudinal inflection falls between the −1 (2595 m) and −2 °C MAAT (2765 m) – regarded as the lower boundary for discontinuous permafrost occurrence (Haeberli, 1983; Haeberli et al., 1989) – and appears to be decoupled from local topographic conditions, since average rock glacier slope gradient stays about constant (i.e., around 0.45 m/m) across the entire elevation range (Fig. 15). Based on these observations, we argue that the altitudinal increase in average rock glacier velocity and average MA cover represents the dynamic expression of increasing permafrost distribution (i.e., a transition from sporadic to discontinuous) until optimal thermal conditions are reached above 2600 m. To some extent, the increasing activity of rock glaciers with elevation may also have to do with increasing erosion rates on the overhanging rock walls (Draebing et al., 2022), which would supply the rooting zones with increasing amounts of debris as frost cracking becomes more efficient. With data at hand, however, we are unable to disentangle permafrost from frost cracking effects.
In this paper, we show that the integration of InSAR-based information can improve the reliability of a geomorphologic inventory in terms of both completeness, through the detection of additional intact rock glaciers on wrapped interferograms, and dynamic classification, through uncertainty reduction. On the one hand, the contribution of the newly detected rock glaciers is limited, as they account for less than 2 %; on the other hand, the dynamic membership is either confirmed or reclassified for, respectively, 67 % and 15 % of the originally mapped rock glaciers, leaving the remaining 18 % undefined due to decorrelation. This proportion of undefined cases, which may look high at first glance, drops substantially when considering that the vast majority of these landforms (i.e., 109 out of 144) has been labeled as morphologically relict due to widespread vegetation cover and therefore most likely represents “not moving” features. The next challenge that awaits similar studies in southwestern South Tyrol and elsewhere will involve reducing the number of undefined rock glaciers by considering longer baselines (e.g., 2 to 3 years) in Sentinel-1 and by integrating constellations characterized by different LOS geometries and SAR bands (e.g., CosmoSkyMed, SAOCOM, or TerraSAR-X). This combination would warrant greater flexibility at covering all slope aspects while lowering the 1 cm yr−1 threshold of (assuredly) detectable deformation.
We find that InSAR-based dynamic reclassification of rock glaciers (i) aids in detecting a cluster of low-lying intact rock glaciers (i.e., <2000 m a.s.l.) associated with positive MAAT values and (ii) induces a substantial increase in the altitudinal overlap between relict and intact rock glaciers across slope aspects. As a consequence, our results portray a more complex picture than that solely based on geomorphologic mapping and indicate that using elevation and aspect as topographic proxies for discriminating permafrost-bearing from permafrost-devoid rock glaciers may be problematic, especially on southwesterly through southeasterly aspects, where overlap is greater. As a practical implication, the existence of a broad altitudinal transition zone in which intact and relict rock glaciers coexist reinforces the need to use InSAR technology for the site-specific characterization of rock glacier displacement across large spatial scales and hence to infer the spatial distribution of discontinuous-to-sporadic permafrost in mountain terrain.
In this context, integration of the two inventorying approaches gains additional importance from a basic, process-oriented standpoint, as it proves particularly effective for imaging how creeping of perennially frozen, ice-debris mixtures varies (in intensity and spatial distribution) as a function of elevation. Specifically, we find that average annual rates of rock glacier surficial displacement and percent MA cover – where the latter variable relies on both the morphological delineation of rock glacier footprints in optical imagery and the kinematic characterization of hosted moving areas in wrapped interferograms – increase linearly with elevation until a sharp inflection occurs and consistent average values are attained above 2600 m a.s.l. Considering that this altitudinal inflection sits right between the −1 and −2 °C MAAT – regarded as the lower boundary for discontinuous permafrost occurrence – we interpret this altitudinal pattern as the geomorphic signature of increasing permafrost distribution (i.e., the transition from sporadic to discontinuous) until optimal thermal conditions, which promote “full-scale” viscous creep and shearing at depth, are met. Following this logic, we propose that average rock glacier velocity, in conjunction with percent MA cover, be considered possible metrics for defining the altitudinal transition in rock glacier kinematics and their styles of deformation within and across mountain ranges. This “landscape-scale” approach would complement site-scale essential climate variables (ECVs) (https://gcos.wmo.int/en/essential-climate-variables, last access: 30 June 2023) such as rock glacier velocity, which are currently being used to evaluate sensitivity to climate warming and envisage future scenarios of change.
The data that support the findings of this study are available upon reasonable request.
The Supplement includes the list of interferograms used in this study (Table S1), a simpler version of Fig. 3 (Fig. S1), the representation of moving area size as a function of slope aspect (Fig. S2) and elevation (Fig. S3) across kinematic classes; and examples or InSAR-based dynamic reclassification of rock glaciers (Fig. S4). The supplement related to this article is available online at: https://doi.org/10.5194/tc-18-2335-2024-supplement.
FB and TS designed the study and managed the project. NJ and TS produced the interferometric data. RS and FB updated and revised the geomorphologic inventory. AB compiled the InSAR-based inventory of moving areas and conducted the kinematic characterization of rock glaciers. AB and FB conducted the statistical analysis of the moving areas and rock glaciers. AB and FB wrote the manuscript. RS and VM contributed to the interpretation of the results. All the authors contributed to the drafting of the final version of the paper.
The contact author has declared that none of the authors has any competing interests.
Publisher’s note: Copernicus Publications remains neutral with regard to jurisdictional claims made in the text, published maps, institutional affiliations, or any other geographical representation in this paper. While Copernicus Publications makes every effort to include appropriate place names, the final responsibility lies with the authors.
This work was funded by the European Space Agency (ESA) Climate Change Initiative (CCI) project (grant no. 4000123681/18/I-NB). Aldo Bertone was supported by a postdoctoral fellowship jointly awarded by the Autonomous Province of Bolzano and the University of Bologna. We thank Gabriel Pellegrinon for aiding in the compilation of the moving area inventory. We are indebted to colleagues at the University of Fribourg for initiating and managing the IPA Working Group Rock Glacier inventories and kinematics, a great effort that has been instrumental in developing this work. The revised manuscript benefited from thorough and constructive reviews conducted by Remya Namboodiri and an anonymous referee.
This research has been supported by the European Space Agency (grant no. 4000123681/18/I-NB).
This paper was edited by Vishnu Nandan and reviewed by Remya Namboodiri and one anonymous referee.
Amschwand, D., Ivy-Ochs, S., Frehner, M., Steinemann, O., Christl, M., and Vockenhuber, C.: Deciphering the evolution of the Bleis Marscha rock glacier (Val d'Err, eastern Switzerland) with cosmogenic nuclide exposure dating, aerial image correlation, and finite element modeling, The Cryosphere, 15, 2057–2081, https://doi.org/10.5194/tc-15-2057-2021, 2021.
Azócar, G. F. and Brenning, A.: Hydrological and geomorphological significance of rock glaciers in the Dry Andes, Chile (27°–33° S), Permafr. Periglac. Process., 21, 42–53, https://doi.org/10.1016/j.jsames.2021.103471, 2010.
Bamler, R. and Hartl, P.: Synthetic aperture radar interferometry, Inverse Probl., 14, R1–R54, https://doi.org/10.1088/0266-5611/14/4/001, 1998.
Barboux, C., Delaloye, R., and Lambiel, C.: Inventorying slope movements in an Alpine environment using DInSAR, Earth Surf. Proc. Land., 39, 2087–2099, https://doi.org/10.1002/esp.3603, 2014.
Barsch, D.: Permafrost creep and rockglaciers, Permafr. Periglac. Process., 3, 175–188, https://doi.org/10.1002/PPP.3430030303, 1992.
Barsch, D.: Rockglaciers: Indicators for the Permafrost and Former Geoecology in High Mountain Environment, Series in the Physical Environment, 16. Springer Verlag, 331 pp., https://doi.org/10.1007/978-3-642-80093-1, 1996.
Bertone, A., Zucca, F., Marin, C., Notarnicola, C., Cuozzo, G., Krainer, K., Mair, V., Riccardi, P., Callegari, M., and Seppi, R.: An Unsupervised Method to Detect Rock Glacier Activity by Using Sentinel-1 SAR Interferometric Coherence: A Regional-Scale Study in the Eastern European Alps, Remote Sens., 11, 1711, https://doi.org/10.3390/rs11141711, 2019.
Bertone, A., Barboux, C., Bodin, X., Bolch, T., Brardinoni, F., Caduff, R., Christiansen, H. H., Darrow, M. M., Delaloye, R., Etzelmüller, B., Humlum, O., Lambiel, C., Lilleøren, K. S., Mair, V., Pellegrinon, G., Rouyet, L., Ruiz, L., and Strozzi, T.: Incorporating InSAR kinematics into rock glacier inventories: insights from 11 regions worldwide, The Cryosphere, 16, 2769–2792, https://doi.org/10.5194/tc-16-2769-2022, 2022.
Bertone, A., Seppi, R., Callegari, M., Cuozzo, G., Dematteis, N., Krainer, K., Marin, C., Notarnicola, C., and Zucca, F.: Unprecedented observation of hourly rock glacier velocity with ground-based SAR, Geophys. Res. Lett., 50, e2023GL102796, https://doi.org/10.1029/2023GL102796, 2023.
Bodin, X., Thibert, E., Fabre, D., Ribolini, A., Schoeneich, P., Francou, B., Reynaud, L., and Fort, M.: Two decades of responses (1986–2006) to climate by the Laurichard Rock Glacier, French Alps, Permafr. Periglac. Process., 344, 331–344, https://doi.org/10.1002/ppp.665, 2009.
Boeckli, L., Brenning, A., Gruber, S., and Noetzli, J.: Permafrost distribution in the European Alps: calculation and evaluation of an index map and summary statistics, The Cryosphere, 6, 807–820, https://doi.org/10.5194/tc-6-807-2012, 2012.
Bolch, T., Menounos, B., and Wheate, R.: Landsat-based inventory of glaciers in western Canada, 1985–2005, Remote Sens. Environ., 114, 127–137, https://doi.org/10.1016/j.rse.2009.08.015, 2010.
Bollmann, E., Girstmair, A., Mitterer, S., Krainer, K., Sailer, R., and Stötter, J.: A rock glacier activity index based on rock glacier thickness changes and displacement rates derived from airborne laser scanning, Permafr. Periglac. Process., 26, 347–359, https://doi.org/10.1002/ppp.1852, 2015.
Brardinoni, F., Scotti, R., Sailer, R., and Mair, V.: Evaluating sources of uncertainty and variability in rock glacier inventories, Earth Surf. Proc. Land., 44, 2450–2466, https://doi.org/10.1002/esp.4674, 2019.
Brencher, G., Handwerger, A. L., and Munroe, J. S.: InSAR-based characterization of rock glacier movement in the Uinta Mountains, Utah, USA, The Cryosphere, 15, 4823–4844, https://doi.org/10.5194/tc-15-4823-2021, 2021.
Crosetto, M., Monserrat, O., Bremmer, C., Hanssen, R., Capes, R., and Marsh, S.: Ground motion monitoring using SAR interferometry: Quality assessment, Eur. Geol., 26, 12–15, 2009.
Delaloye, R. and Staub, B.: Seasonal variations of rock glacier creep: time series observations from the Western Swiss Alps, in: XI. International Conference On Permafrost – Book of Abstracts, edited by: Günther, F. and Morgenstern, A., Potsdam, Germany, Bibliothek Wissenschaftspark Albert Einstein, 20–24 June 2016, 22–23, https://bigweb.unifr.ch/Science/Geosciences/Geomorphology/Pub/Website/Papers/Delaloye_and_Staub_(2016)_ICOP_Abstract_Seasonnal_variations_of_rock_glacier_creep.pdf (last access: 31 July 2023), 2016.
Delaloye, R., Perruchoud, E., Avian, M., Kaufmann, V., Bodin, X., Hausmann, H., Ikeda, A., Kääb, A., Kellerer-Pirklbauer, A., Krainer, K., Lambiel, C., Mihajlovic, D., Staub, B., Roer, I., and Thibert, E.: Recent interannual variations of rock glacier creep in the European Alps. In: 9th International Conference on Permafrost, Fairbanks, Alaska, 29 June 2008–3 July 2008, 343–348, https://doi.org/10.5167/uzh-7031, 2008.
Draebing, D., Mayer, T., Jacobs, B., and McColl, S.T.: Alpine rockwall erosion patterns follow elevation-dependent climate trajectories, Commun. Earth Environ., 3, 21, https://doi.org/10.1038/s43247-022-00348-2, 2022.
Falaschi, D., Tadono, T., and Masiokas, M.: Rock glaciers in the patagonian andes: an inventory for the monte san lorenzo (cerro cochrane) massif, 47° S, Geogr. Ann. Ser. A, 97, 769–777, https://doi.org/10.1111/geoa.12113, 2015.
Fey, C. and Krainer, K.: Analyses of UAV and GNSS based flow velocity variations of the rock glacier Lazaun (Ötztal Alps, South Tyrol, Italy), Geomorphology, 365, 107261, https://doi.org/10.1016/j.geomorph.2020.107261, 2020.
Frattini, P., Riva, F., Crosta, G. B., Scotti, R., Greggio, L., Brardinoni, F., and Fusi, N.: Rock-avalanche geomorphological and hydrological impact on an alpine watershed, Geomorphology 262, 47–60, https://doi.org/10.1016/j.geomorph.2016.03.013, 2016.
Frauenfelder, R., Haeberli, W., Hoelzle, M., and Maisch, M.: Using relict rock-glaciers in GIS-based modelling to reconstruct Younger Dryas permafrost distribution patterns in the Err-Julier area, Swiss Alps, Norw. J. Geogr., 55, 195–202, https://doi.org/10.1080/00291950152746522, 2001.
Frei, C.: Interpolation of temperature in a mountainous region using nonlinear profiles and non-Euclidean distances, Int. J. Climatol., 34, 1585–1605, https://doi.org/10.1002/joc.3786, 2014.
Haeberli, W.: Permafrost-glacier relationships in the Swiss Alps-today and in the past, in: Proceedings of the 4th International Conference on Permafrost, Nat. Ac. Press Fairbanks, AK, USA, 415–420, 1983.
Haeberli, W.: Creep of mountain permafrost: internal structure and flow of Alpine rock glaciers, Mitteilungen der Versuchsanstalt fur Wasserbau, Hydrologie und Glaziologie an der ETH Zurich, 77, 5–142, https://ethz.ch/content/dam/ethz/special-interest/baug/vaw/vaw-dam/documents/das-institut/mitteilungen/1980-1989/077.pdf (last access: 31 July 2023), 1985.
Haeberli, W., Alean, J. C., Müller, P., and Funk, M.: Assessing risks from glacier hazards in high mountain regions: some experiences in the Swiss Alps, Ann. Glac., 13, 96–102, https://doi.org/10.3189/S0260305500007709, 1989.
Haeberli, W., Hallet, B., Arenson, L., Elconin, R,, Humlum, O., Kääb, A., Kaufmann, V., Ladanyi, B., Matsuoka, N., Springman, S., and Vonder, M. D.: Permafrost creep and rock glacier dynamics, Permafr. Periglac. Process., 17, 189–214, https://doi.org/10.1002/ppp.561, 2006.
Harris, C., Arenson, L. U., Christiansen, H. H., Etzelmüller, B., Frauenfelder, R., Gruber, S., Haeberli, W., Hauck, C., Hölzle, M., Humlum, O., Isaksen, K., Kääb, A., Lehning, M., Lütschg, M. A., Matsuoka, N., Murton, J. B., Nötzli, J., Phillips, M., Ross, N., Seppälä, M., Springman, S. M., and Vonder, M. D.: Permafrost and climate in Europe: geomorphological impacts, hazard assessment and geotechnical response, Earth-Sci. Rev., 92, 117–171, https://doi.org/10.1016/j.earscirev.2008.12.002, 2009.
Hiebl, J. and Frei, C.: Daily temperature grids for Austria since 1961 – concept, creation and applicability, Theor. Appl. Climatol., 124, 161–178, https://doi.org/10.1007/s00704-015-1411-4, 2016.
Huggel, C., Carey, M., Clague, J. J., and Kaab, A.: The High-Mountain Cryosphere, in: Environmental changes and human risks, Cambridge University Press, 363 pp., https://doi.org/10.1017/CBO9781107588653, 2015.
Imhof, M.: Modelling and verification of the permafrost distribution in the Bernese Alps (Western Switzerland), Permafr. Periglac. Process., 7, 267–280, https://doi.org/10.1002/(SICI)1099-1530(199609)7:3<267::AID-PPP221>3.0.CO;2-L, 1996.
Johnson, G., Chang, H., and Fountain, A.: Active rock glaciers of the contiguous United States: geographic information system inventory and spatial distribution patterns, Earth Syst. Sci. Data, 13, 3979–3994, https://doi.org/10.5194/essd-13-3979-2021, 2021.
Jones, D. B., Harrison, S., Anderson, K., and Betts, R. A.: Mountain rock glaciers contain globally significant water stores, Sci. Rep., 8, 2834, https://doi.org/10.1038/s41598-018-21244-w, 2018.
Keim, L., Mair, V., and Morelli, C.: Inquadramento geologico regionale, in: Carta Geologica dell'Alto Adige, guida ai percorsi geologici Foglio 026 Appiano, LAC Firenze, https://maps.civis.bz.it/ (last access: 25 July 2023), 2013.
Kellerer-Pirklbauer, A., Delaloye, R., Lambiel, C., Gärtner-Roer, I., Kaufmann, V., Scapozza, C., Krainer, K., Staub, B., Thibert, E., Bodin, X., Fischer, A., Hartl, L., Morra di Cella, U., Mair, V., Marcer, M., and Schoeneich, P.: Interannual variability of rock glacier flow velocities in the European Alps, in: 5th European Conference on Permafrost, edited by: Deline, P., Bodin, X., and Ravanel, L., June 2018, Chamonix, France, Book of Abstract, Edytem, 396–397, https://hal.archives-ouvertes.fr/hal-01816115v1/, 2018.
Kellerer-Pirklbauer, A., Bodin, X., Delaloye, R., Lambiel, C., Gartner-Roer, I., Bonnefoy-Demongeot, M., Carturan, L., Damm, B., Eulenstein, J., Fischer, A., Hartl, L., Ikeda, A., Kaufmann, V., Krainer, K., Matsuoka, N., Morra Di Cella, U., Noetzli, J., Seppi, R., Scapozza, C., Schoeneich, P., Stocker-Waldhube, M., Thibert, E., and Zumiani, M.: Acceleration and interannual variability of creep rates in mountain permafrost landforms (rock glacier velocities) in the European Alps in 1995–2022, Environ. Res. Lett., 19, 034022, https://doi.org/10.1088/1748-9326/ad25a4, 2024.
Klees, R. and Massonnet, D.: Deformation measurements using SAR interferometry: potential and limitations, Geol. Mijnbouw, 77, 161–176, https://doi.org/10.1023/A:1003594502801, 1998.
Kofler, C., Mair, V., Gruber, S., Todisco, M. T., Nettleton, I., Steger, S., Zebisch, M., Schneiderbauer, S., and Comiti, F.: When do rock glacier fronts collapse? Insights from two case studies in South Tyrol (Italian Alps), Earth Surf. Proc. Land., 46, 1311–1327, https://doi.org/10.1002/esp.5099, 2021.
Konrad, S. K., Humphrey, N. F., Steig, E. J., Clark, D. H., Potter Jr, N., and Pfeffer, W. T.: Rock glacier dynamics and paleoclimatic implications, Geology, 27, 1131–1134, https://doi.org/10.1130/0091-7613(1999)027<1131:RGDAPI>2.3.CO;2, 1999.
Kos, A., Amann, F., Strozzi, T., Delaloye, R., von Ruette, J., and Springman, S.: Contemporary glacier retreat triggers a rapid landslide response, Great Aletsch Glacier, Switzerland, Geophys. Res. Lett., 43, 12466–12474, https://doi.org/10.1002/2016GL071708, 2016.
Krainer, K., Bressan, D., Dietre, B., Haas, J. N., Hajdas, L., Lang, K., Mair, V., Nickus, U., Reidl, D., Thies, H., and Tonidandel, D.: A 10300-year-old permafrost core from the active rock glacier Lazaun, southern Ötztal Alps (South Tyrol, northern Italy), Quaternary Res., 83, 324–335, https://doi.org/10.1016/j.yqres.2014.12.005, 2015.
Kummert, M. and Delaloye, R.: Mapping and quantifying sediment transfer between the front of rapidly moving rock glaciers and torrential gullies, Geomorphology, 309, 60–76, https://doi.org/10.1016/j.geomorph.2018.02.021, 2018.
Kummert, M., Delaloye, R., and Braillard, L.: Erosion and sediment transfer processes at the front of rapidly moving rock glaciers: Systematic observations with automatic cameras in the western Swiss Alps, Permafr. Periglac. Process., 29, 21–33, https://doi.org/10.1002/ppp.1960, 2018.
Lambiel, C. and Reynard, E.: Regional modelling of present, past and future potential distribution of discontinuous permafrost based on a rock glacier inventory in the Bagnes-Hérémence area (Western Swiss Alps), Norw. J. Geogr., 55, 219–223, https://doi.org/10.1080/00291950152746559, 2001.
Lambiel, C., Strozzi, T., Paillex, N., Vivero, S., and Jones, N.: Inventory and kinematics of active and transitional rock glaciers in the Southern Alps of New Zealand from Sentinel-1 InSAR, Arct. Antarct. Alp. Res., 55, 2183999, https://doi.org/10.1080/15230430.2023.2183999, 2023.
Li, M., Yang, Y., Peng, Z., and Liu, G.: Assessment of rock glaciers and their water storage in Guokalariju, Tibetan Plateau, The Cryosphere, 18, 1–16, https://doi.org/10.5194/tc-18-1-2024, 2024.
Liu, L., Millar, C. I., Westfall, R. D., and Zebker, H. A.: Surface motion of active rock glaciers in the Sierra Nevada, California, USA: inventory and a case study using InSAR, The Cryosphere, 7, 1109–1119, https://doi.org/10.5194/tc-7-1109-2013, 2013.
Manchado, A. M.-T., Allen, S., Cicoira, A., Wiesmann, S., Haller, R., and Stoffel, M.: 100 years of monitoring in the Swiss National Park reveals overall decreasing rock glacier velocities, Commun. Earth Environ., 5, 138, https://doi.org/10.1038/s43247-024-01302-0, 2024.
Marcer, M., Serrano, C., Brenning, A., Bodin, X., Goetz, J., and Schoeneich, P.: Evaluating the destabilization susceptibility of active rock glaciers in the French Alps, The Cryosphere, 13, 141–155, https://doi.org/10.5194/tc-13-141-2019, 2019.
Marcer, M., Cicoira, C., Cusicanqui, D., Bodin, X., Echelard, T., Obregon, R., and Schoeneich, P.: Rock glaciers throughout the French Alps accelerated and destabilised since 1990 as air temperatures increased, Commun. Earth Environ. 2, 81, https://doi.org/10.1038/s43247-021-00150-6, 2021.
Massonnet, D. and Souyris, J.-C.: Imaging with Synthetic Aperture Radar, EPFL Press, New York, USA, https://doi.org/10.1201/9781439808139, 2008.
Necsoiu, M., Onaca, A., Wigginton, S., and Urdea, P.: Rock glacier dynamics in Southern Carpathian Mountains from high-resolution optical and multi-temporal SAR satellite imagery, Remote Sens. Environ., 177, 21–36, https://doi.org/10.1016/J.RSE.2016.02.025, 2016.
Nemec, J., Gruber, C., Chimani, B., and Auer, I.: Trends in extreme temperature indices in Austria based on a new homogenised dataset of daily minimum and maximum temperature series, Int. J. Climatol., 33, 1538–1550, https://doi.org/10.1002/joc.3532, 2013.
Onaca, A., Ardelean, F., Urdea, P., and Magori, B.: Southern Carpathian rock glaciers: inventory, distribution and environmental controlling factors, Geomorphology, 293, 391–404, https://doi.org/10.1016/j.geomorph.2016.03.032, 2017.
Paul, F., Kääb, A., Maisch, M., Kellenberger, T., and Haeberli, W.: Rapid disintegration of Alpine glaciers observed with satellite data, Geophys. Res. Lett., 31, L21402, https://.https://doi.org/10.1029/2004GL020816, 2004.
Pellet, C., Bodin, X., Cusicanqui, D., Delaloye, R., Kääb, A., Kaufmann, V. Noetzli, J., Thibert, E., Vivero, S. and Kellerer-Pirklbauer, A.: Rock Glacier Velocity, B. Am. Meteorol. Soc., 104, S41–S42, https://doi.org/10.1175/2023BAMSStateoftheClimate.1, 2023.
Pruessner, L., Huss, M., and Farinotti, D.: Temperature evolution and runoff contribution of three rock glaciers in Switzerland under future climate forcing, Permaf. Periglac. Process., 33, 310–322, https://doi.org/10.1002/ppp.2149, 2022.
Reinosch, E., Gerke, M., Riedel, B., Schwalb, A., Ye, Q., and Buckel, J.: Rock glacier inventory of thewestern Nyainqêntanglha Range, Tibetan Plateau, supportedby InSAR time series and automated classification, Permafr. Periglac. Process., 32, 657–672, https://doi.org/10.1002/ppp.2117, 2021.
RGIK: Guidelines for inventorying rock glaciers: baseline and practical concepts (version 1.0). IPA Action Group Rock glacier inventories and kinematics, 25 pp., https://doi.org/10.51363/unifr.srr.2023.002, 2023a.
RGIK: Rock Glacier Velocity as an associated parameter of ECV Permafrost: Baseline concepts (Version 3.2), IPA Action Group Rock glacier inventories and kinematics, 12 pp., https://bigweb.unifr.ch/Science/Geosciences/Geomorphology/Pub/Website/IPA/CurrentVersion/Current_RockGlacierVelocity.pdf (last access: 31 July 2023), 2023b.
RGIK: Rock Glacier Velocity as associated product of ECV Permafrost: practical concepts (version 1.2), IPA Action Group Rock glacier inventories and kinematics, 17 pp., https://bigweb.unifr.ch/Science/Geosciences/Geomorphology/Pub/Website/IPA/CurrentVersion/Current_RGV_PC.pdf (last access: 31 July 2023), 2023c.
Robson, B. A., Bolch, T., MacDonell, S., Hölbling, D., Rastner, P., and Schaffer, N.: Automated detection of rock glaciers using deep learning and object-based image analysis, Remote Sens. Environ., 250, 112033, https://doi.org/10.1016/j.rse.2020.112033, 2020.
Rosen, P., Hensley, S., Joughin, I., Li, F., Madsen, S., Rodriguez, E., and Goldstein, R.: Synthetic aperture radar interferometry, Proc. IEEE, 88, 333–382, https://doi.org/10.1109/5.838084, 2000.
Scapozza, C. and Mari, S.: Catasto, caratteristiche e dinamica dei rock glaciers delle Alpi Ticinesi, Bollettino della Società Ticinese di Scienze Naturali, 98, 15–29, 2010.
Schlögel, R., Kofler, C., Gariano, S. L., Van Campenhout, J., and Plummer, S.: Changes in climate patterns and their association to natural hazard distribution in South Tyrol (Eastern Italian Alps), Sci. Rep., 10, 5022, https://doi.org/10.1038/s41598-020-61615-w, 2020.
Schmid, M.-O., Baral, P., Gruber, S., Shahi, S., Shrestha, T., Stumm, D., and Wester, P.: Assessment of permafrost distribution maps in the Hindu Kush Himalayan region using rock glaciers mapped in Google Earth, The Cryosphere, 9, 2089–2099, https://doi.org/10.5194/tc-9-2089-2015, 2015.
Scotti, R., Brardinoni, F., Alberti, S., Frattini, P., and Crosta, G.B.: A regional inventory of rock glaciers and protalus ramparts in the central Italian Alps, Geomorphology, 186, 136–149, https://doi.org/10.1016/j.geomorph.2012.12.028, 2013.
Scotti, R., Crosta, G. B., and Villa, A.: Destabilisation of Creeping Permafrost: The Plator Rock Glacier Case Study (Central Italian Alps), Permafr. Periglac. Process., 28, 224–236, https://doi.org/10.1002/ppp.1917, 2017a.
Scotti, R., Brardinoni, F., Crosta, G. B., Cola, G., and Mair, V.: Time constraints for post-LGM landscape response to deglaciation in Val Viola, Central Italian Alps, Quat. Sci. Rev., 177, 10–33, https://doi.org/10.1016/j.quascirev.2017.10.011, 2017b.
Scotti, R., Mair, V., Costantini, D., and Brardinoni, F.: A high-resolution rock glacier inventory of South Tyrol. Evaluating lithologic, topographic, and climatic effects, Full paper, 8 pp. ICOP 2024, 16–20 June 2024, Whitehorse, Yukon, Canada, in press, 2024.
Strozzi, T., Caduff, R., Jones, N., Barboux, C., Delaloye, R., Bodin, X., Kääb, A., Mätzler, E., and Schrott, L.: Monitoring rock glacier kinematics with satellite synthetic aperture radar, Remote Sens., 12, 559, https://doi.org/10.3390/rs12030559, 2020.
Vespremeanu-Stroe, A., Urdea, P., Popescu, R., and Vasile, M.: Rock Glacier Activity in the Retezat Mountains, Southern Carpathians, Romania, Permaf. Periglac. Process., 23, 127–137, https://doi.org/10.1002/ppp.1736, 2012.
Vivero, S. and Lambiel, C.: Monitoring the crisis of a rock glacier with repeated UAV surveys, Geogr. Helv., 74, 59–69, https://doi.org/10.5194/gh-74-59-2019, 2019.
Wagner, T., Pleschberger, R., Kainz, S., Kellerer-Pirklbauer, A., Krainer, K., Philippitsch, R., and Winkler, G.: The first consistent inventory of rock glaciers and their hydrological catchments of the Austrian Alps, Austrian J. Earth Sc., 113, 1–23, https://doi.org/10.17738/ajes.2020.0001, 2020.
Wang, X., Liu, L., Zhao, L., Wu, T., Li, Z., and Liu, G.: Mapping and inventorying active rock glaciers in the northern Tien Shan of China using satellite SAR interferometry, The Cryosphere, 11, 997–1014, https://doi.org/10.5194/tc-11-997-2017, 2017.
Wirz, V., Gruber, S., Purves, R. S., Beutel, J., Gärtner-Roer, I., Gubler, S., and Vieli, A.: Short-term velocity variations at three rock glaciers and their relationship with meteorological conditions, Earth Surf. Dynam., 4, 103–123, https://doi.org/10.5194/esurf-4-103-2016, 2016.
Yague-Martinez, N., Prats-Iraola, P., Rodriguez Gonzalez, F., Brcic, R., Shau, R., Geudtner, D., Eineder, M., and Bamler, R.: Interferometric Processing of Sentinel-1 TOPS Data, IEEE T. Geosci. Remote, 54, 2220–2234, https://doi.org/10.1109/TGRS.2015.2497902, 2016.
Yu, C., Li, Z., and Penna, N.T.: Interferometric synthetic aperture radar atmospheric correction using a GPS-based iterative tropospheric decomposition model, Remote Sens. Environ., 204, 109–121, https://doi.org/10.1016/J.RSE.2017.10.038, 2018.
Zasadni, J. and Kłapyta, P.: From valley to marginal glaciation in alpine type relief: Lateglacial glacier advances in the Pięć Stawów Polskich/Roztoka Valley, High Tatra Mountains, Poland, Geomorphology, 253, 406–424, https://doi.org/10.1016/j.geomorph.2015.10.032, 2016.
Zwieback, S., Liu, X., Antonova, S., Heim, B., Bartsch, A., Boike, J., and Hajnsek, I.: A statistical test of phase closure to detect influences on DInSAR deformation estimates besides displacements and decorrelation noise: Two case studies in high-latitude regions, IEEE T. Geosci. Remote, 54, 5588–5601, https://doi.org/10.1109/TGRS.2016.2569435, 2016.