the Creative Commons Attribution 4.0 License.
the Creative Commons Attribution 4.0 License.
 | 07 May 2024
Sea ice transport and replenishment across and within the Canadian Arctic Archipelago, 2016–2022
Stephen E. L. Howell
David G. Babb
Jack C. Landy
Isolde A. Glissenaar
Kaitlin McNeil
Benoit Montpetit
Mike Brady
The Canadian Arctic Archipelago (CAA) serves as both a source and a sink for sea ice from the Arctic Ocean, while also exporting sea ice into Baffin Bay. We use observations from Sentinel-1, RADARSAT-2, the RADARSAT Constellation Mission (RCM), and CryoSat-2, together with the Canadian Ice Service ice charts, to quantify sea ice transport and replenishment across and within the CAA from 2016 to 2022. We also provide the first estimates of the ice area and volume flux within the CAA from the Queen Elizabeth Islands to Parry Channel, which spans the central region of the Northwest Passage shipping route. Results indicate that the CAA primarily exports ice to the Arctic Ocean and Baffin Bay, with an average annual (October to September) ice area flux of 137 ± 72 × 103 km2 and a volume flux of 58 ± 68 km3. The CAA contributes a larger area but smaller volume of ice downstream to the North Atlantic than what is delivered via Nares Strait. The average annual ice area flux from the Queen Elizabeth Islands to Parry Channel was 27 ± 10 × 103 km2 and the volume flux was 34 ± 12 km3, with a majority occurring through Byam Martin Channel, which is directly above the central region of Northwest Passage. Over our study period, annual multi-year ice (MYI) replenishment within the CAA was resilient, with an average of 14 ± 38 × 103 km2 imported from the Arctic Ocean and an average of 56 ± 36 × 103 km2 of first-year ice (FYI) retained following the melt season. The considerable ice flux to Parry Channel, together with sustained MYI replenishment, emphasizes the continued risk that sea ice poses to practical utilization of key shipping routes in the CAA, including the Northwest Passage.
- Article
(7308 KB) - Full-text XML
-
Supplement
(313 KB) - BibTeX
- EndNote


The Canadian Arctic Archipelago (CAA) is a collection of islands on the North American continental shelf that is bounded by the Arctic Ocean to the west and Baffin Bay to the east (Fig. 1). Therefore, the channels, straits, and inlets of the CAA are important pathways where both freshwater and human goods are transported. In terms of freshwater, the CAA is a primary pathway for transporting freshwater from the Arctic Ocean to the North Atlantic via Baffin Bay (Steele et al., 1996; Prinsenberg and Hamilton, 2005; Jones et al., 2003; Rudels, 2011; Zhang et al., 2021), where it has implications for large-scale meridional overturning circulation (Kuhlbrodt et al., 2007). In terms of transporting goods, the Northwest Passage bisects the CAA and provides a shorter path than the Northern Sea Route to connect the Atlantic and Pacific oceans. Under a warming environment, the ice pack within the CAA has declined in area and produced a longer melt season (Howell et al., 2009) that has led to an increase in shipping activity within the CAA since the 1990s (Pizzolato et al., 2014; Dawson et al., 2018). Interest in the practical usage of the Northwest Passage continues to grow as climate models project its sea ice cover to decline (e.g. Smith and Stephenson, 2013; Mudryk et al., 2021), together with the political uncertainty in utilizing the Northern Sea Route along the Russian Arctic coast (Vylegzhanin et al., 2020; Li and Lynch, 2023). Therefore, it is crucial to understand the current patterns of sea ice transport across and within the CAA in order to adapt to changes in shipping activity (Dawson et al., 2020).
Sea ice within the CAA is a mix of seasonal first-year ice (FYI) and perennial multi-year ice (MYI). The ice cover is typically landfast from November to July (Canadian Ice Service, 2021), during which time the ice is immobile and separated from the mobile pack ice beyond the CAA by stable ice arches that routinely form across the straits that bound the CAA (Fig. 1). When the ice in the CAA melts during spring, areas of open water form and the ice becomes mobile, creating a narrow window for ice dynamics to take place. Due to this brief window for ice dynamics to occur, the CAA is responding differently to climate change. For example, Melling (2022) recently reported similar ice thickness values within the northern CAA, or within the Queen Elizabeth Islands (QEI), between the 1970s and 40 years later in 2009–2010 and suggested that the dynamic processes that facilitate thick ice north of the CAA have been less impacted by climate change. Moreover, Glissenaar et al. (2023b) found no change in sea ice thickness along Parry Channel from January to April between 1996 and 2020 compared to dramatic thinning in both the Beaufort Sea and Baffin Bay regions on either side of the CAA. There is also evidence that the sea ice area flux from the Arctic Ocean into the QEI has increased (Howell and Brady, 2019) and that the dynamic processes that transport thick MYI from the Arctic Ocean into the CAA have exhibited no signs of stopping (Howell et al., 2023a). Regardless of when the Arctic Ocean becomes seasonally free of sea ice (Kim et al., 2023; Topál and Ding, 2023) and loses its MYI pack (Babb et al., 2023), the remaining reservoir of MYI located north of the CAA (i.e. the Last Ice Area) is still expected to flow southward into the CAA and maintain a thick ice pack.
High-spatial-resolution synthetic-aperture radar (SAR) satellite imagery is ideally suited for monitoring sea ice dynamics in the CAA due to the numerous narrow channels, straits, and inlets that are more difficult to resolve in coarser sea-ice-derived satellite products. The availability of SAR imagery across the CAA since the launch of RADARSAT-1 in 1995 and RADARSAT-2 in 2007 has allowed the ice area flux between the Arctic Ocean and the CAA to be quantified (Kwok, 2006; Howell et al., 2013; Howell and Brady, 2019). Unfortunately, image availability of RADARSAT-1 and RADARSAT-2 was not spatially and temporally uniform enough to construct ice flux values over all the gates in the CAA. For example, images from RADARSAT-1 and RADARSAT-2 were typically only available with high temporal resolution in certain regions of the CAA and mostly only during the operational months of June to October. As a result, a complete picture of sea ice dynamics of the CAA over the entire annual cycle was not possible. Indeed, Agnew et al. (2008) quantified sea ice dynamic processes (i.e. sea ice motion and ice area flux) across the CAA from September 2002 to June 2007 using enhanced-resolution Advanced Microwave Scanning Radiometer for EOS (AMSR-E) at 89 GHz satellite observations, but atmospheric interference at 89 GHz prevented estimates during the summer months when the ice pack is mobile. The relatively recent availability of Sentinel-1 followed by the RADARSAT Constellation Mission (RCM) has essentially transformed the availability of high-spatiotemporal-resolution SAR imagery across the entire CAA, facilitating almost daily coverage over the entire CAA (Howell et al., 2022). Moreover, there have been recent breakthroughs using CryoSat-2 that allow Arctic sea ice thickness to be estimated during the summer as well as during winter months (Landy et al., 2022) and also within the prominently landfast regions of the CAA (Glissenaar et al., 2023b). These recent developments present a new opportunity for improving our understanding of sea ice dynamics within and across the CAA on an annual basis. Specifically, previous studies using SAR imagery have only been able to quantify ice flux between the Arctic Ocean and the CAA (Kwok, 2006; Howell et al., 2013; Howell and Brady, 2019), ignoring ice flux between the CAA and Baffin Bay. This omission also constrained MYI replenishment estimates within the CAA (Howell et al., 2015). Limited SAR image availability has also prevented ice flux estimates from the QEI to Parry Channel, which is a key part of the Northwest Passage. Using SAR imagery from Sentinel-1 and RCM, Howell et al. (2023b) were able to provide year-round flux estimates between the Arctic Ocean and CAA but did not consider the ice flux between the CAA and Baffin Bay.
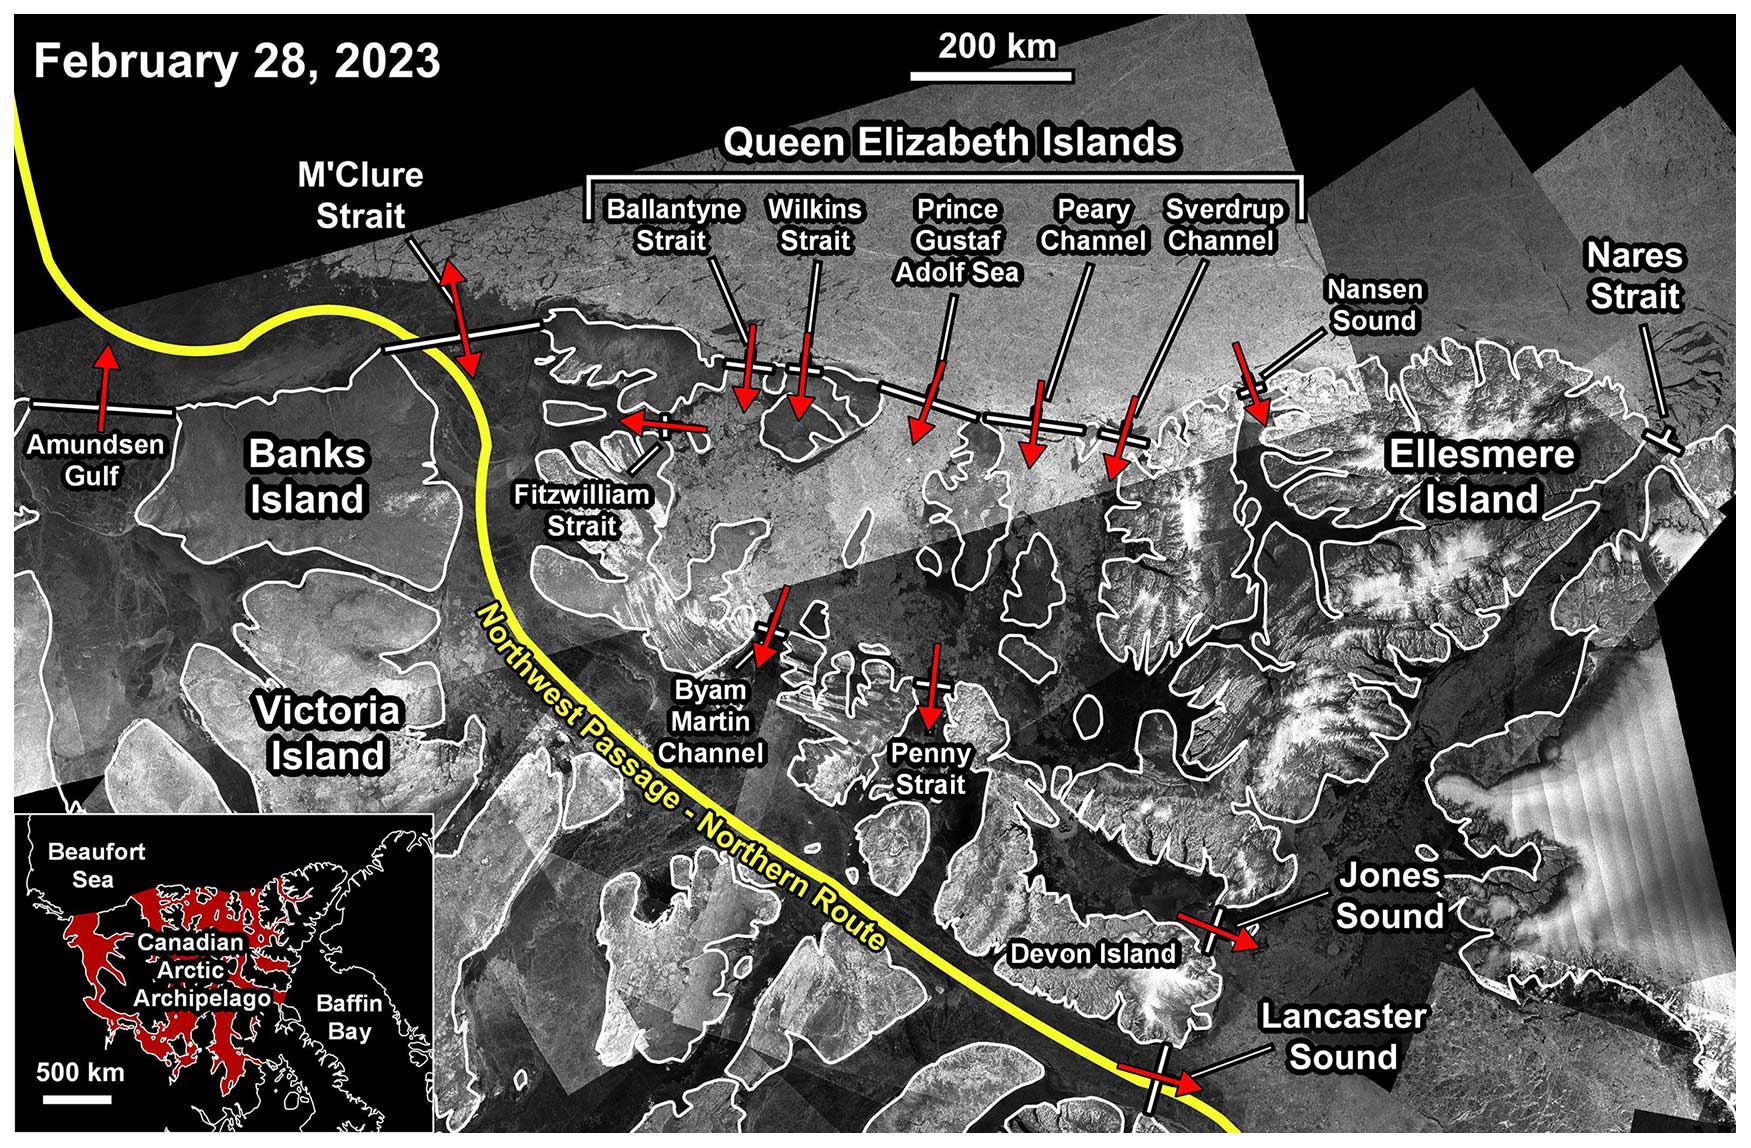
Figure 1Map of the Canadian Arctic Archipelago with the location of all the sea ice flux gates used in this study. The red arrows indicate the typical ice flow direction. The background is RADARSAT Constellation Mission (RCM) imagery from 28 February 2023 (RCM; © Government of Canada).
In this study we use Sentinel-1, RADARSAT-2, RCM, and CryoSat-2 together with the Canadian Ice Service ice charts to quantify the sea ice area flux from October 2016 to September 2022 (6 years) and the volume fluxes from October 2016 to September 2021 (5 years) across the CAA and discuss their annual and interannual variability. To our knowledge, this is the first study to provide coincident ice area and volume flux estimates across all of the boundaries of the CAA, in particular across the eastern boundaries to Baffin Bay, which have received considerably less attention. We also consider sea ice area and volume transport within the CAA, specifically between the QEI and Parry Channel, which is a key part of the Northwest Passage where ice transport is widely known to occur (Melling, 2002; Howell et al., 2009; Howell et al., 2023a) but has never been quantified. Finally, we use our flux estimates to provide a more robust estimate of MYI replenishment within the CAA on an annual basis.
The primary data source used in this analysis was synthetic-aperture radar (SAR) imagery from RADARSAT-2 (2016–2020), Sentinel-1 (2016–2021), and the RCM (2020–2022) at HH polarization. RADARSAT-2 and RCM imagery is available online at the Natural Resources Canada Earth Observation Data Management System (https://www.eodms-sgdot.nrcan-rncan.gc.ca, last access: 3 May 2024). Sentinel-1 imagery is available at the Copernicus Open Access Hub (https://dataspace.copernicus.eu/, last access: 3 May 2024). All images were resampled to a spatial resolution of 200 m. The average temporal sample window over all gates in the CAA was ∼ 1 d, and the record spans from October 2016 to September 2022.
Year-round sea ice thickness estimates for the outer flux gates were acquired from the CryoSat-2 radar altimeter from October 2016 to September 2021 (Landy et al., 2022). All CryoSat-2 ice thickness data are available from https://data.bas.ac.uk/full-record.php?id=GB/NERC/BAS/PDC/01613 (last access: 3 May 2024). No outer gate sea ice thickness estimates were available from October 2021 to September 2022.
Sea ice thickness estimates for the inner flux gates within the CAA were obtained from the ice thickness proxy record developed by Glissenaar et al. (2023a), which is available from https://doi.org/10.5281/zenodo.8245898. This proxy sea ice thickness dataset uses CryoSat-2 observations of sea ice thickness from Landy et al. (2022) in the marginal ice regions of the Canadian Arctic to train a random forest regression model to estimate sea ice thickness from information in the Canadian Ice Service ice charts (Tivy et al., 2011) within the channels of the CAA. This proxy sea ice thickness dataset is available for all channels in the CAA for November to April from 2016 to 2022. No inner gate sea ice thickness estimates were available from October 2021 to September 2022 (i.e. the 2021–2022 ice season). The uncertainty in the sea ice thickness values ranges from 30 to 50 cm. When the proxy dataset is compared against independent CryoSat-2 thickness values not used for training, the root mean square error (RMSE) is 41 cm (Glissenaar et al., 2023b). We also note that the ice thickness data from this product capture interannual variability after removing the average seasonal cycle of ice growth and melt, with anomaly correlation coefficients between 0.11 and 0.51 (Landy et al., 2022; Glissenaar et al., 2023b).
Additional supporting data used in this analysis include the weekly total, MYI concentration, and second-year ice (SYI) concentration from the Canadian Ice Service digital ice charts (Tivy et al., 2011).
The sea ice area flux for all outer and inner gates of the CAA was estimated from October 2016 to September 2022 (Fig. 1). The outer flux gates facing the Arctic Ocean are Amundsen Gulf, M'Clure Strait, and the QEI, with the QEI gates collectively comprised of Ballantyne Strait, Wilkins Strait, Prince Gustaf Adolf Sea, Peary Channel, Sverdrup Channel, and Nansen Sound. Amundsen Gulf has an aperture of 169 km, M'Clure Strait has an aperture of 183 km, and the total aperture of all QEI gates is 405 km. The outer flux gates facing Baffin Bay are the Jones Sound and Lancaster Sound, with apertures of 58 and 83 km, respectively. The inner flux gates of the CAA were chosen as the three gates that connect the QEI to the southern half of the CAA and the Northwest Passage; the three gates are Fitzwilliam Strait (34 km aperture), Byam Martin Channel (35 km aperture), and Penny Strait (49 km aperture).
Our approach to estimate the sea ice area flux from sequential pairs of SAR imagery is robust and based on previous work (e.g. Kwok, 2006; Agnew et al., 2008; Howell et al., 2013). For each SAR image pair, sea ice motion was estimated using the Environment and Climate Change Canada Automated Sea Ice Tracking System (ECCC-ASITS; Howell et al., 2022) that is based on the Komarov and Barber (2014) feature tracking algorithm. Sea ice motion estimates are then interpolated to a 30 km buffer region around each gate using inverse distance weighting. Both sea ice motion and Canadian Ice Service ice concentration values are then sampled at 5 km intervals along the gate as shown in Fig. 2 using the following equation:
where Δx is the spacing along each gate (i.e. 5 km), ui is the ice motion normal to the flux gate at the ith location, and ci is the sea ice concentration determined from the Canadian Ice Service ice charts. For the outer gates, positive flux values represent CAA ice import (i.e. Arctic Ocean or Baffin Bay ice import into the CAA), and negative flux values represent CAA ice export (i.e. ice export into the Arctic Ocean or Baffin Bay). For the inner gates, positive flux values represent southward transport of sea ice from the QEI, and negative values represent northward transport into the QEI. For all gates, the sea ice area flux values were summed over each month from October 2016 to September 2022.

Figure 2Sea ice motion vectors overlaid with sea ice concentration from the Canadian Ice Service ice charts for the Lancaster Sound gate. The yellow region represents the 30 km buffer zone around the gate. RADARSAT Constellation Mission (RCM) imagery from 8 April 2022 (RCM; © Government of Canada).
The uncertainty (σFA) in FA can be estimated following Kwok and Rothrock (1999) by assuming errors in sea ice motion are additive, uncorrelated, and normally distributed using the following equation:
where σu is the error in SAR-derived ice motion, L is the width of the gate, and Ns is the number of samples across the gate. The value of σu has been found to range from 0.43 to 3.43 km depending on the ice conditions for the region and on the time of year (Lindsay and Stern, 2003; Komarov and Barber, 2014; Howell et al., 2022). The higher σu values consider all vectors at the pan-Arctic scale together with no stringent conditions for buoy comparison and therefore are likely too high given slower ice movement and higher concentrations within the CAA; hence, we constrain σu to 3 km. The ice area flux uncertainty on a monthly basis (σT) can subsequently be estimated using the following equation:
where ND is the number of observations per month (∼ 30). Table 1 shows σT from solving Eqs. (2) and (3) with a range of σu.
The sea ice volume flux of the CAA's outer gates from October 2016 to September 2021 was determined from the product of the monthly ice area flux and the monthly average CryoSat-2 sea ice thickness within the 200 km buffer around each gate. For the inner gates, the volume flux was determined from the product of monthly ice area flux and the monthly average proxy sea ice thickness. Note that we use the larger (i.e. 200 km) buffer for volume flux given the coarse spatial resolution of the thickness products (i.e. 50–80 km).
Since sea ice thickness values from the proxy ice thickness dataset were not available from May to October, we used the linear trend of April to November to approximate those values. Figure 3 here shows a time series plot of CryoSat-2 sea ice thickness at the QEI gates (in black) followed by the time series proxy sea ice thickness at Byam Martin Channel (in red) and the linearly interpolated ice thickness at Byam Martin Channel (dashed red). Note that the thickness decrease with latitude is similar to what has been reported in previous studies (Melling, 2002; Haas and Howell, 2015). Looking at Fig. 3, it is apparent that the linear thickness approximation could overestimate thickness for 1–3 months during the melt season and underestimate it for the remainder. This variability is influenced by MYI flowing through these gates that is replaced by thicker MYI from the north (i.e. less seasonal ablation) over the duration of the melt season. As a result, the estimated value of uncertainty for the proxy sea ice thickness dataset that ranges from 30 to 50 cm could fluctuate even more during the summer months, thus impacting volume flux estimates in the region. We acknowledge that quantifying this exact amount for the summer months is challenging, and therefore there could be more variability in our annual volume flux values from the QEI to Parry Channel.
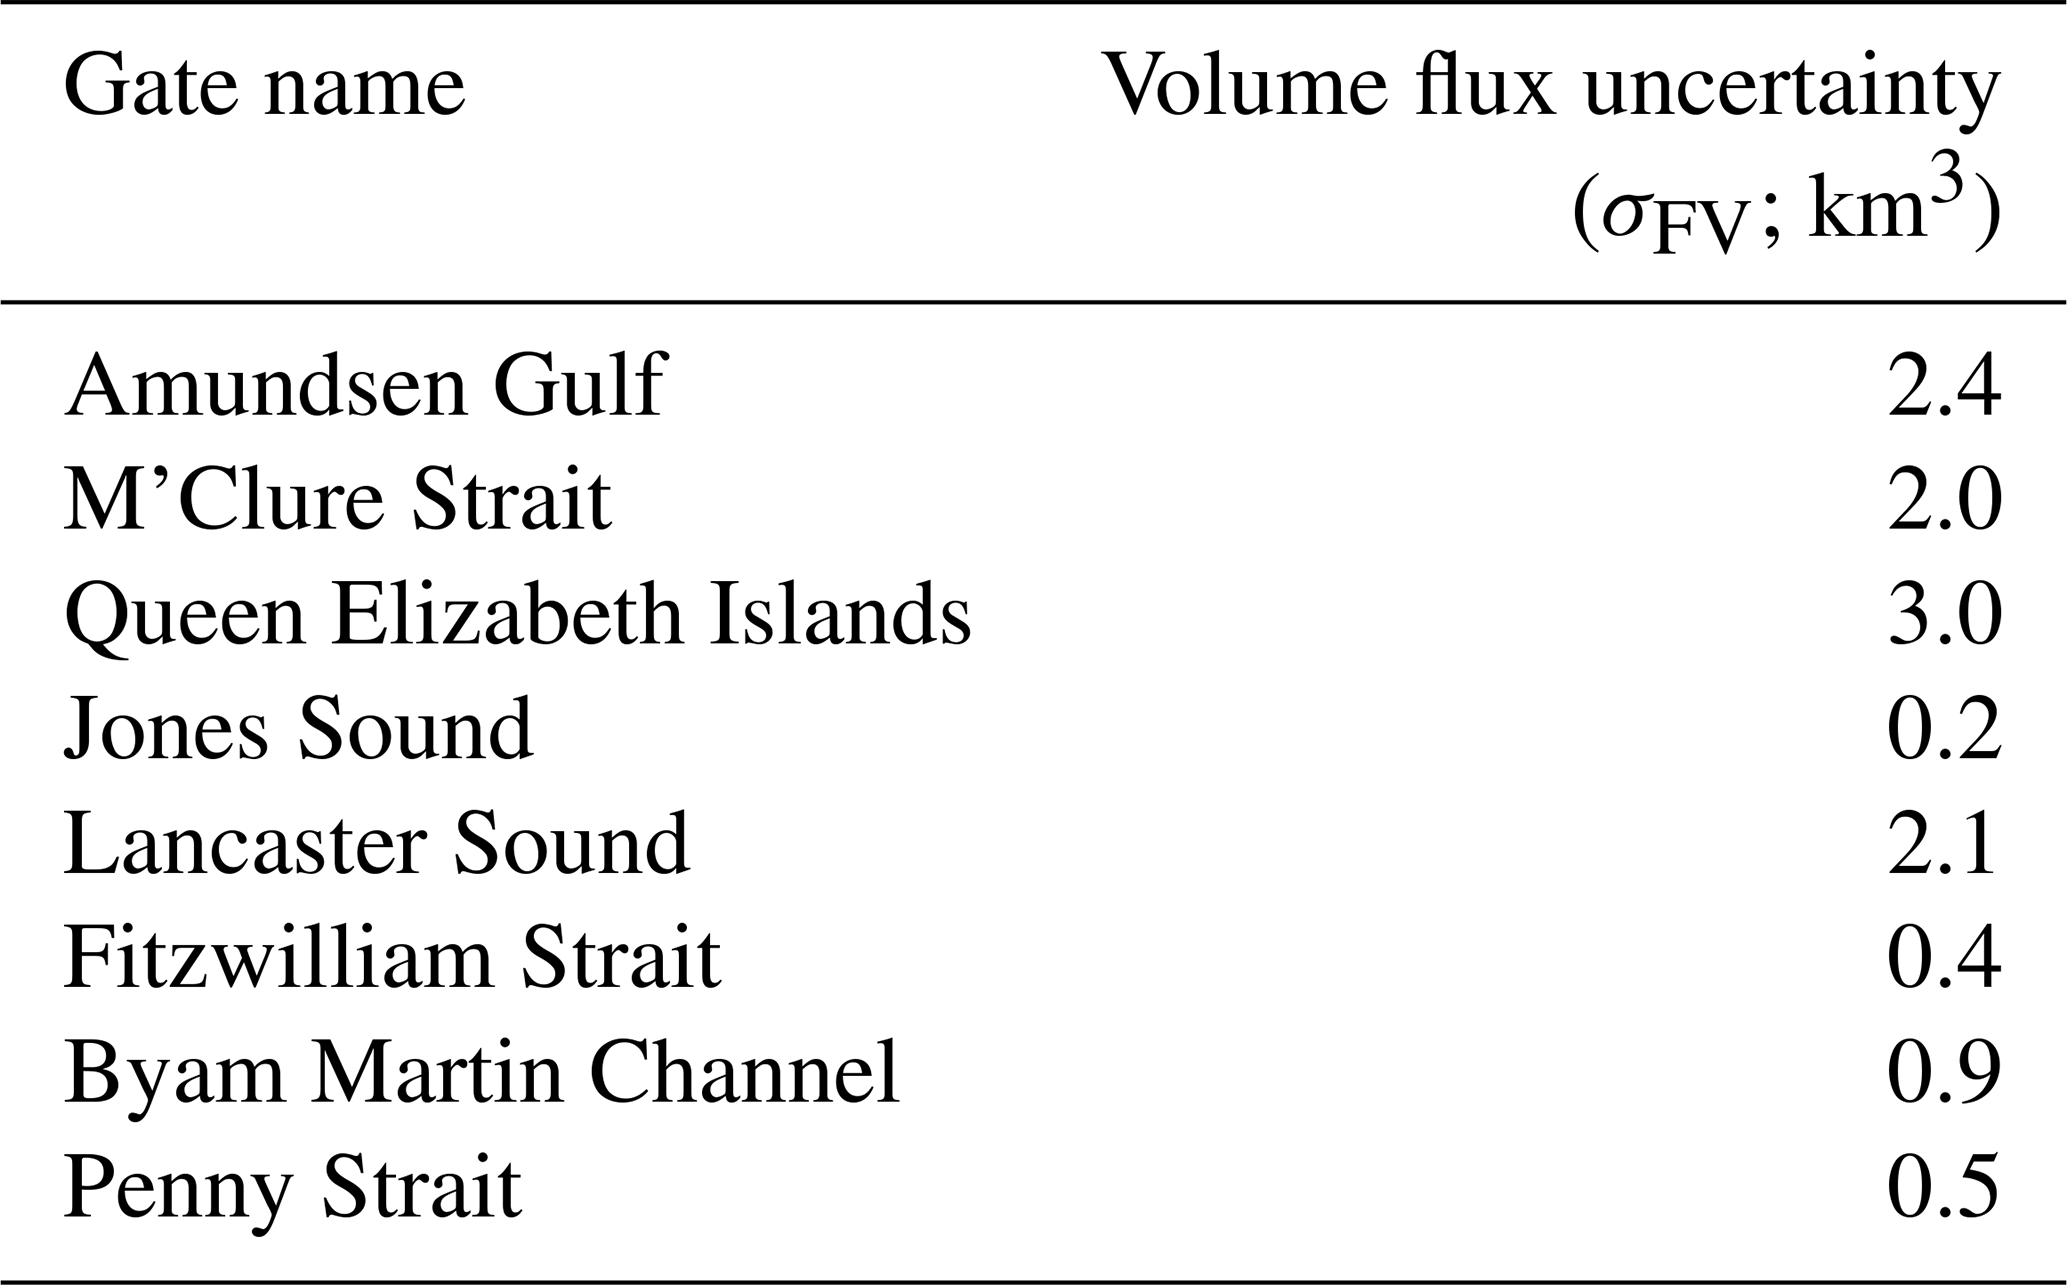
We estimate the uncertainty (σFV) in the ice volume flux following Kwok and Rothrock (1999) using
where h is the ice thickness and σh is the uncertainty in thickness. σh for the outer gates is taken from Landy et al. (2022). σh for the inner gates has been found to range from 30 to 50 cm (Glissenaar et al., 2023b), and accordingly, we have taken the average (40 cm) as the inner gate uncertainty. Table 2 summarizes σFV from solving Eq. (3) for the upper and lower bounds of σu.

Figure 3Time series of CryoSat-2 ice thickness for the Queen Elizabeth Islands (QEI; black) outer gates, proxy ice thickness for Byam Martin Channel (BMC; red) inner gate, and linearly interpolated ice thickness for the BMC inner gate (dashed red) from 2016 to 2022.
Table 1The uncertainty in monthly sea ice area flux (σT) for each gate.
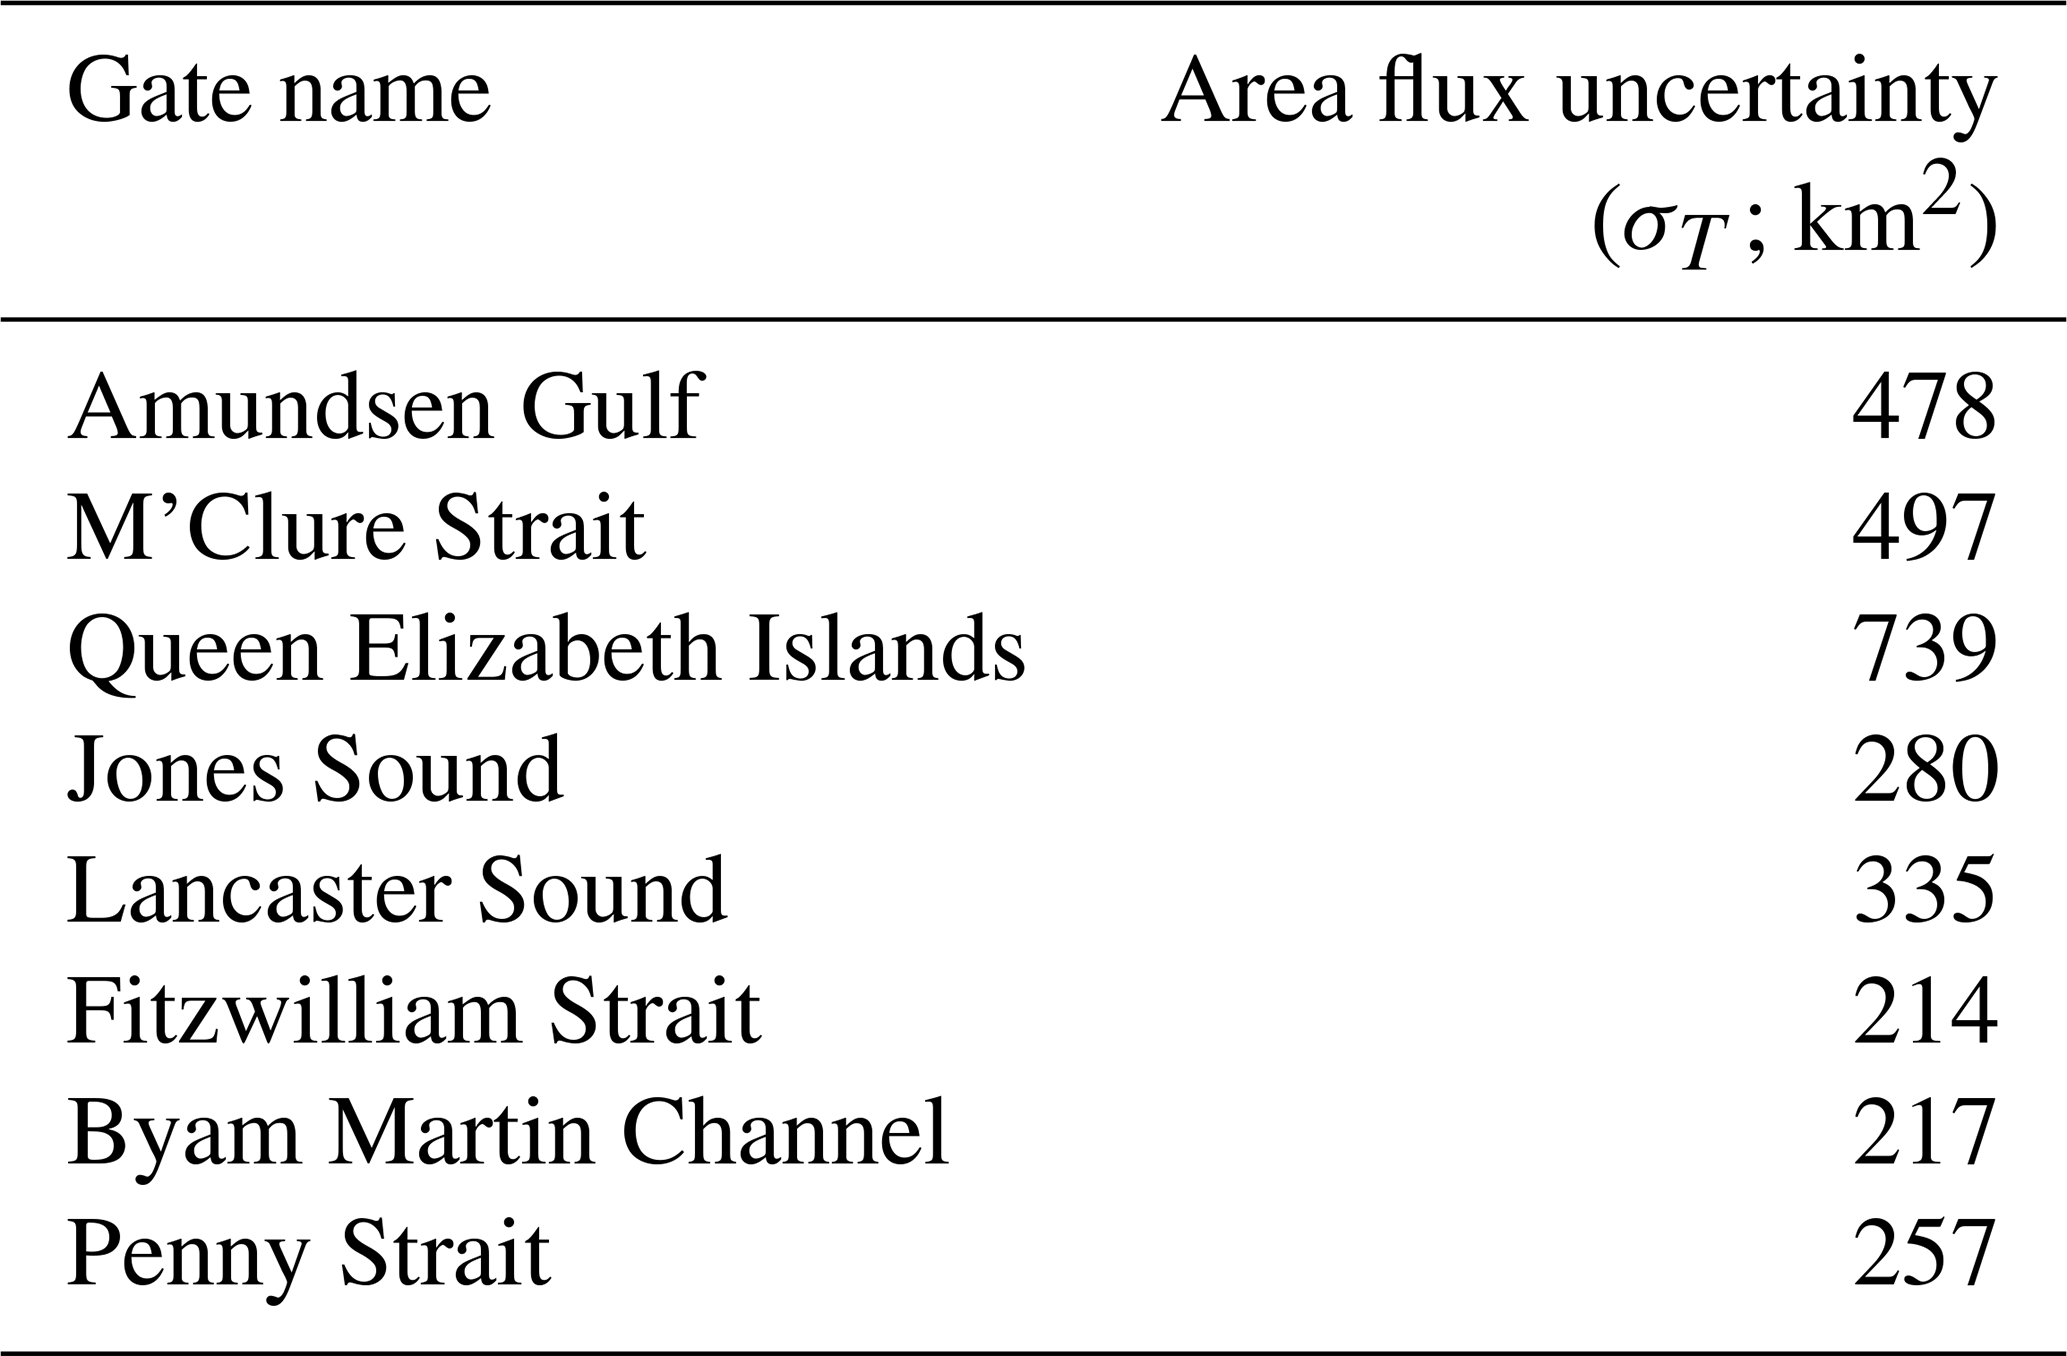
Table 2The uncertainty in monthly sea ice volume flux (σFV) for each gate.
4.1 CAA monthly and annual area flux and volume flux
The time series of monthly sea ice area and volume flux across the outer gates of the CAA from October 2016 to September 2022, together with their average climatological seasonal cycle (October to September), is shown in Fig. 4. The average monthly ice area flux (± standard deviation) was −11 ± 25 × 103 km2 and ranged from −70 × 103 to 55 × 103 km2 (Fig. 2a), while the average monthly ice volume flux (± standard deviation) was −5 ± 25 km3 and ranged from −64 to 53 km3 (Fig. 2c). For both ice area flux and volume flux, the monthly variability was substantial, but in general the CAA imported ice area from July to September and exported ice area from October to June (Fig. 4b). Ice volume was imported from June to November and exported from December to May (Fig. 4d).
The annual (October to September) ice area flux for the entire CAA and its individual outer gates is shown in Fig. 5. Over the 6-year period, the average annual ice area flux was −137 ± 71 × 103 km2 and ranged from −281 × 103 km2 in 2019 to −55 × 103 km2 in 2020. On an annual basis, the CAA exported more ice to the Arctic Ocean and Baffin Bay than it received, although ice is typically only imported via the small apertures of the QEI. On average, the annual ice area flux across the boundaries of the CAA is ∼ 16 % of the long-term average Fram Strait ice area flux (880 × 103 km2; Smedsrud et al., 2017). Compared to recent seasonal ice area flux estimates for Nares Strait by Howell et al. (2023b) for 2017 to 2021 (95 × 103 km2), the average seasonal ice area flux for the CAA is ∼ 145 % of Nares Strait.
The annual (October to September) ice volume flux for all of the CAA, together with its individual outer-exchange gates, is shown in Fig. 6. The average volume flux was −57 ± 68 km3, indicating a net export of ice out of the CAA over the 5-year period. Considerable interannual variability in the CAA ice volume flux was apparent with a small import in 2017 (9 km3), a moderate import in 2020 (20 km3), and a large export in 2019 (−154 km3). The CAA's annual ice volume flux across the outer boundaries of the CAA corresponds to ∼ 6 % of Fram Strait using the average ice volume from 2010 to 2018 (990 km3) estimated by Sumata et al. (2022) and ∼ 33 % of Nares Strait using average annual ice volume flux in Nares Strait from 2017 to 2020 (177 km3) estimated by Howell et al. (2023b).
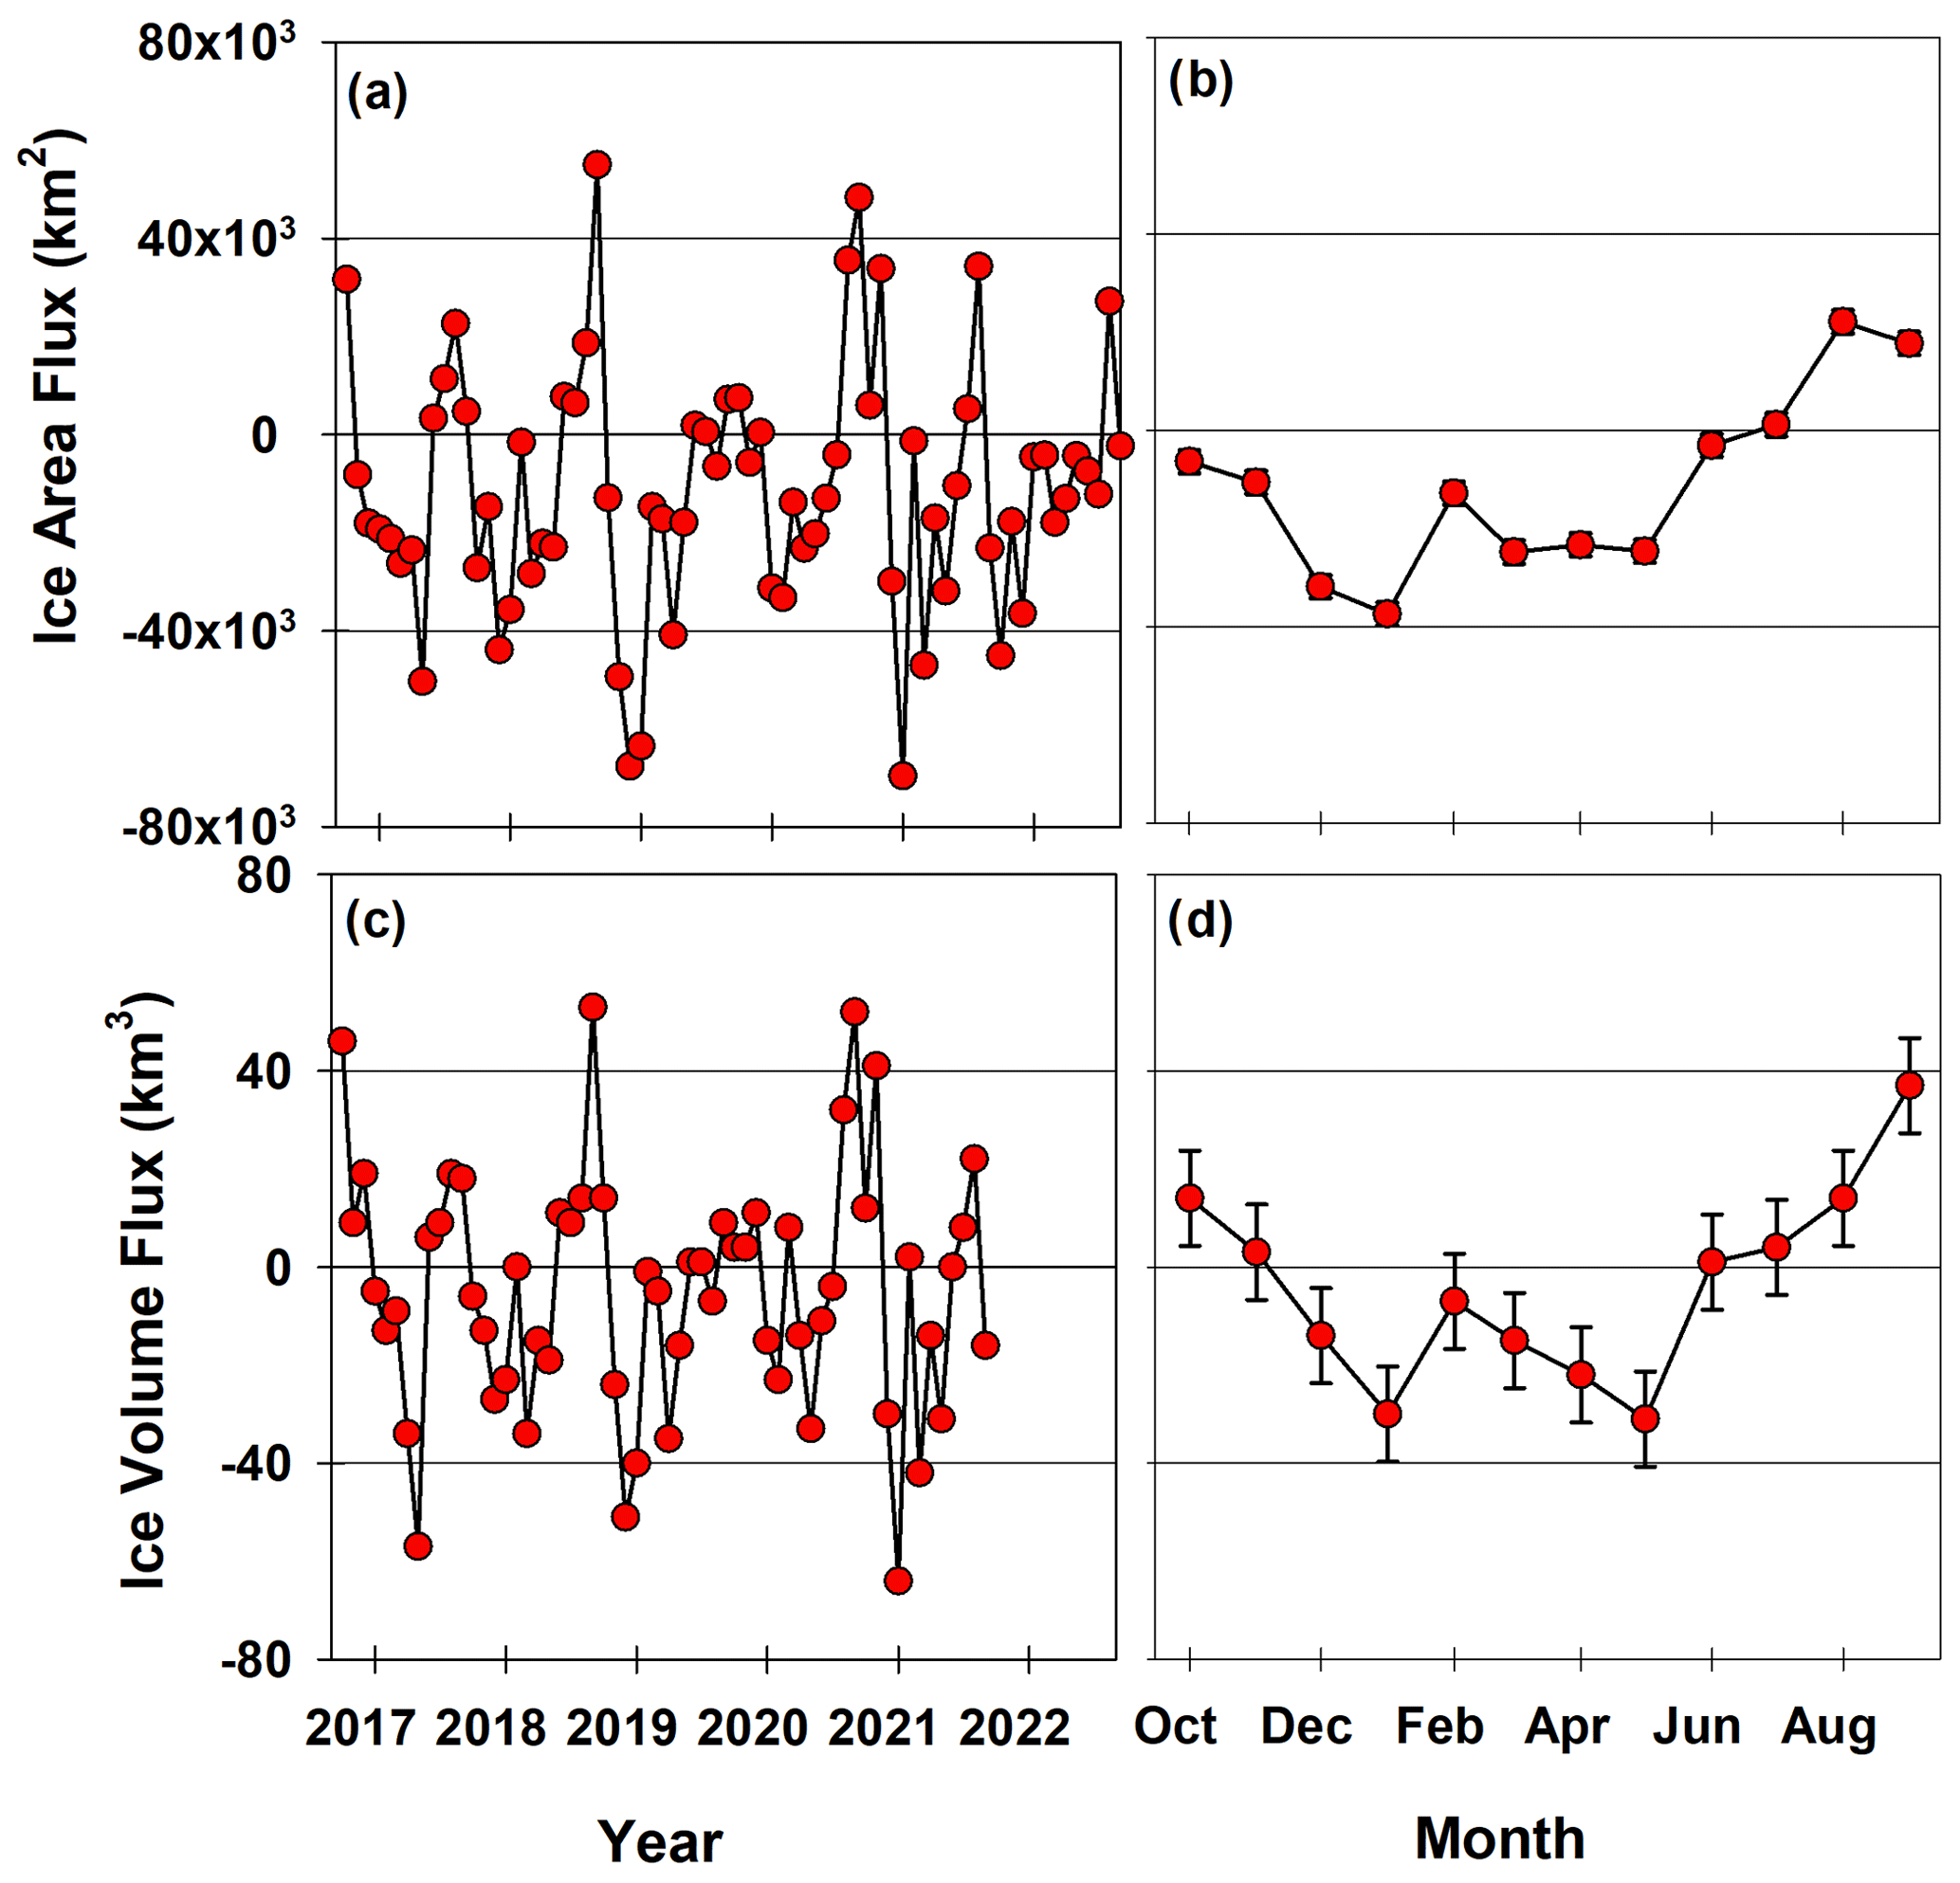
Figure 4(a) Time series of the monthly ice area flux from October 2016 to September 2022, (b) the average monthly ice area flux, (c) time series of the ice volume flux from October 2016 to September 2021, and (d) the average monthly ice volume flux. Positive flux values indicate ice import from the Arctic Ocean or Baffin Bay and negative values indicate ice export to the Arctic Ocean or Baffin Bay. Vertical black bars in (b and (d indicate uncertainty.
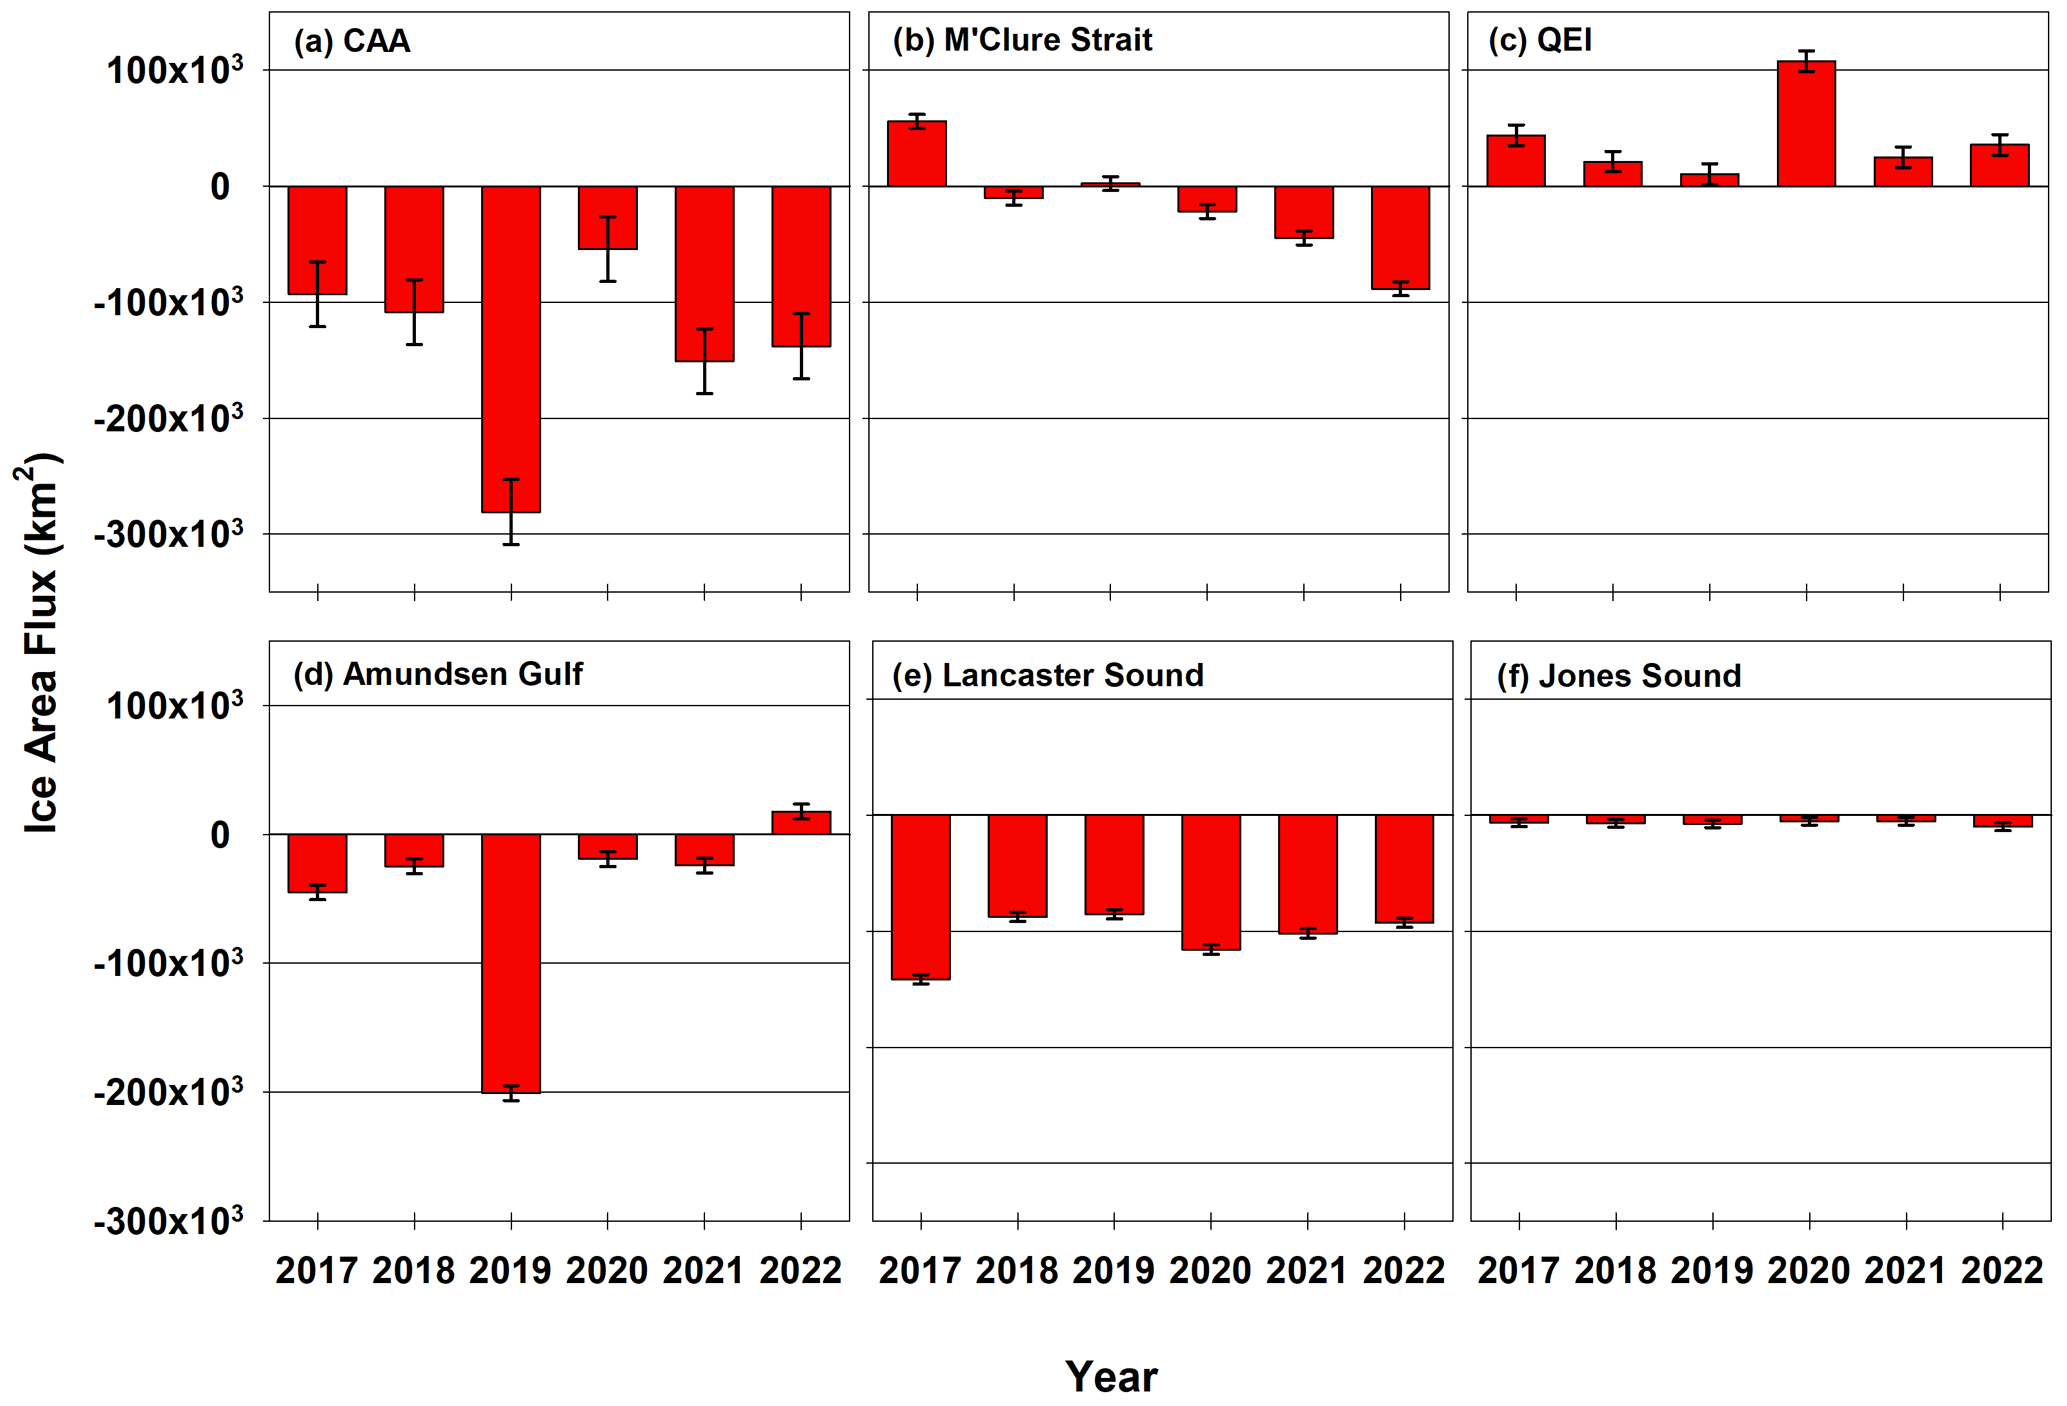
Figure 5Annual (October to September) ice area ice flux for (a) the Canadian Arctic Archipelago (CAA), (b) M'Clure Strait, (c) the Queen Elizabeth Islands (QEI), (d) Amundsen Gulf, (e) Lancaster Sound, and (f) Jones Sound for 2017 to 2022. Positive flux values indicate ice import from the Arctic Ocean or Baffin Bay, and negative values indicate ice export to the Arctic Ocean or Baffin Bay. Vertical black bars indicate uncertainty.
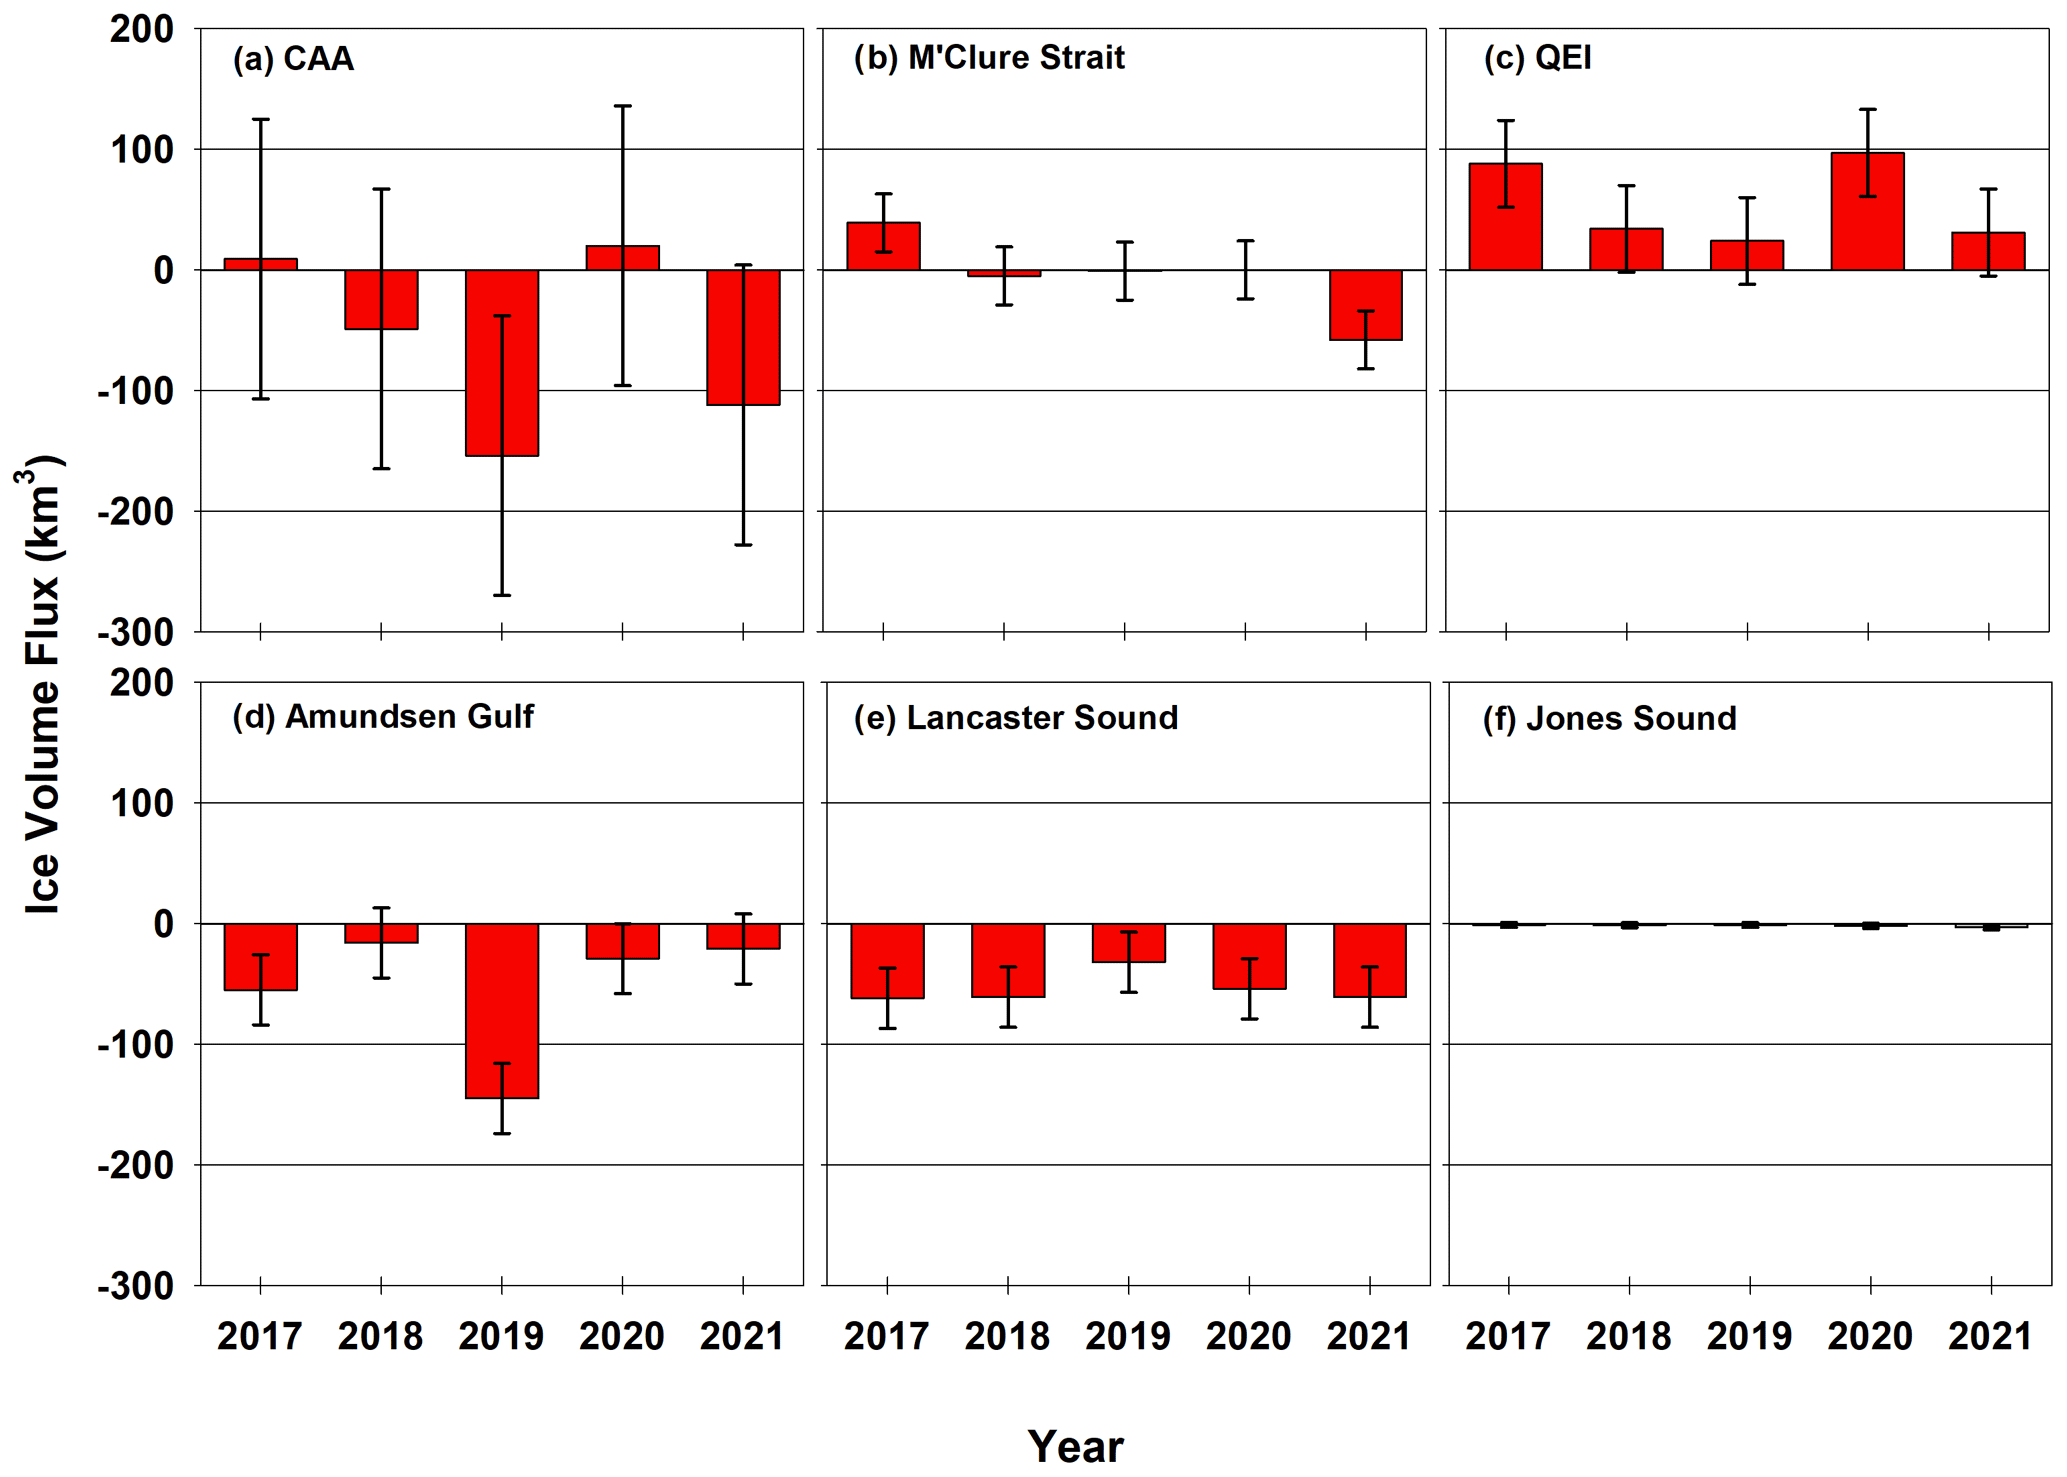
Figure 6Annual (October to September) ice volume flux for (a) the Canadian Arctic Archipelago (CAA), (b) M'Clure Strait, (c) the Queen Elizabeth Islands (QEI), (d) Amundsen Gulf, (e) Lancaster Sound, and (f) Jones Sound for 2017 to 2021. Positive flux values indicate ice import from the Arctic Ocean or Baffin Bay, and negative values indicate ice export to the Arctic Ocean or Baffin Bay. Vertical black bars indicate uncertainty.
4.2 Ice flux comparison between the Arctic Ocean and Baffin Bay
For the gates facing the Arctic Ocean, Amundsen Gulf was the primary export gate, while for the gates facing Baffin Bay, Lancaster Sound was the primary export gate (Figs. 5, 6). Sea ice was only imported via the gates facing the Arctic Ocean, and this primarily occurred through the QEI, although sea ice was imported once through M'Clure Strait and Amundsen Gulf. The majority of sea ice area flux was towards Baffin Bay, with a 6-year annual average of 111 ± 19 × 103 km2 or 81 % of the total sea ice flux, meaning that the remaining 26 ± 84 × 103 km2 or 18 % was exported into the Arctic Ocean (Fig. 5). With respect to ice volume flux, the 5-year annual average indicates that −3 ± 81 km3 was exported to the Arctic Ocean and 56 ± 12 km3 was exported to Baffin Bay (Fig. 6). In terms of the ice flux delivered downstream to the North Atlantic via Baffin Bay on an annual basis, the CAA was a larger contributor than Nares Strait for ice area but not for ice volume because the majority of sea ice being exported from the CAA was FYI compared to MYI from Nares Strait.
Comparing the primary export gate for the Arctic Ocean and Baffin Bay indicates more ice export and less interannual variability for Lancaster Sound compared to Amundsen Gulf. The annual 6-year average ice area flux for the Amundsen Gulf was −49 ± 70 × 103 km2 and ranged from −200 × 103 in 2019 to 18 × 103 km2 in 2022 (Fig. 5). The annual 6-year average at Lancaster Sound was −104 ± 20 × 103 km2 and ranged from −142 × 103 in 2017 to −85 × 103 km2 in 2019 (Fig. 5). In terms of the annual ice volume flux, the Amundsen Gulf volume flux was larger than that of Lancaster Sound, with 5-year annual averages of −53 ± 48 and −54 ± 11 km3, respectively (Fig. 6). It is also worth emphasizing that the CAA's large net annual ice area and volume export in 2019 was driven by the large anomalous export at Amundsen Gulf (Fig. 5). The time series of cumulative ice area flux at Amundsen Gulf during the anomalous year of 2019, together with the more typical year 2021, is shown in Fig. 7. Ice area export during winter 2019 was particularly pronounced despite a prolonged period of no flux during summer 2019 (Fig. 7). Export occurred almost continuously from October 2018 through May 2019, after which there was very little export during summer 2019 when the area is typically ice-free (Fig. 7). For comparison, ice export during 2020–2021 was characterized by ice import during November 2020, followed by episodic export through to May 2021 and limited flux during summer. The Amundsen Gulf region is part of a larger flaw-lead polynya system that forms throughout the southeastern Beaufort Sea (Carmack and MacDonald, 2002; Barber and Hanesiak, 2004; Galley et al., 2008). We suggest increased ice area export during 2019 was primarily due to the fact that the ice arch that typically forms across Amundsen Gulf never formed (not shown), allowing the ice pack to remain mobile and more responsive to synoptic winds that flushed ice out of Amundsen Gulf into the Beaufort Sea.
The primary pathway for sea ice import into the CAA was the QEI, which had a 6-year average annual ice area flux of 41 ± 32 × 103 km2 that ranged from 10 × 103 in 2019 to 108 × 103 km2 in 2020 (Fig. 5). The 5-year average annual volume flux was 55 ± 41 km3 and ranged from 24 in 2019 to 97 km3 in 2020 (Fig. 6). The processes responsible for the large ice flux into the QEI in 2020 were previously discussed by Howell et al. (2023b), who reported that the amount even exceeded the largest-reported annual ice flux at Nares Strait and was ∼ 10 % of the average sea ice volume export through Fram Strait from 2010 to 2018 (Sumata et al., 2022). The oldest and thickest sea ice in the Arctic lies just north of the QEI (Kwok, 2018; Landy et al., 2022), and this thick ice certainly plays a considerable role in modulating the annual ice area and volume flux for the CAA via the QEI. For example, the Arctic Ocean ice area flux into the QEI in 2020 was not sufficient to balance ice area export from the other regions, but the large Arctic Ocean ice volume flux in 2020 compensated for the volume of ice exported at all the other passageways and actually led to a net import of sea ice volume into the CAA (Fig. 6a). The year 2017 was similar such that the 88 km3 of Arctic Ocean ice imported through the QEI contributed to a net import into the CAA (9 km3). Overall, the CAA appears to be a strong ice area exporter and a lower ice volume exporter when appreciable ice from the Arctic Ocean is imported into the QEI. Ice thickness in the vicinity of the QEI has only experienced a slight (not significant) decrease over our study time period (Fig. 3). Therefore, the CAA's net volume import in certain years is not likely a result of how thick the ice is but rather how much thick ice is imported into the QEI, which is a function of ice arch duration and atmospheric circulation patterns (i.e. wind).
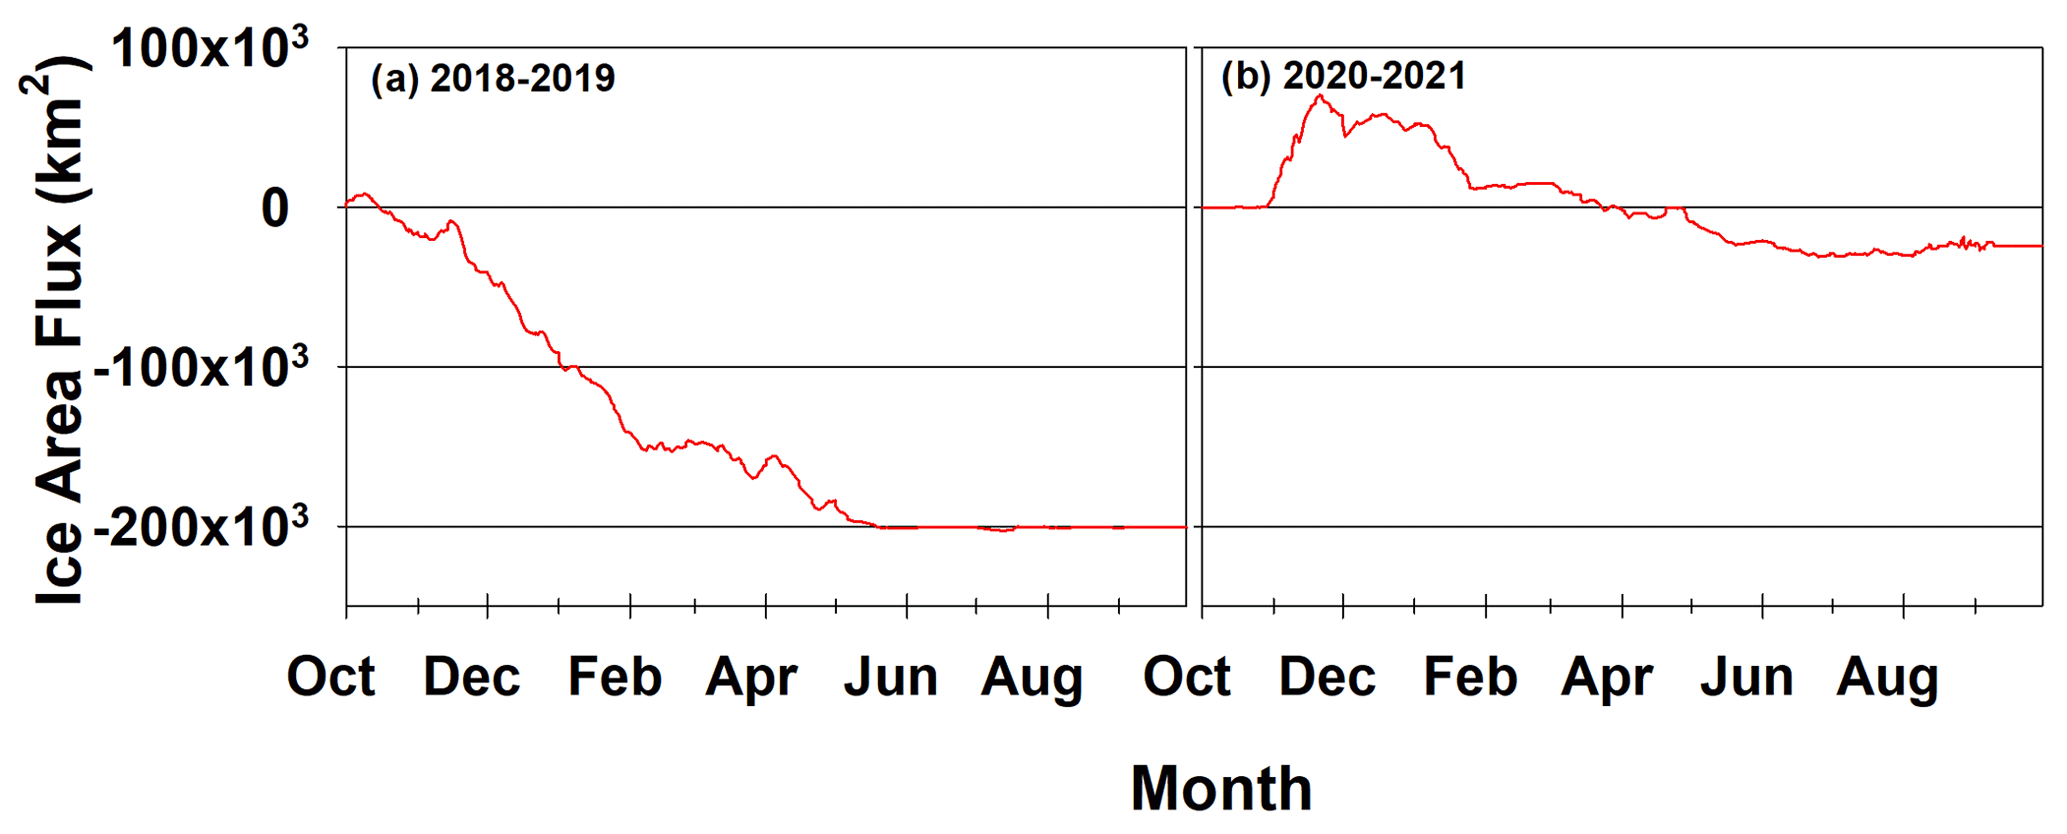
Figure 7Time series of the Amundsen Gulf cumulative ice area flux for (a) 2018–2019 and (b) 2020–2021. Positive flux values indicate ice import from the Arctic Ocean, and negative values indicate ice export to the Arctic Ocean.
4.3 Ice area and volume transport from the QEI to Parry Channel
The spatial distribution of MYI within the CAA at the end of the melt season for 2017 to 2022 is shown in Fig. 8. It is evident from Fig. 8 that MYI can be observed flowing southward from QEI to Parry Channel via the CAA's internal passageways of Fitzwilliam Strait, Byam Martin Channel, and Penny Strait. While this process of southward advection or flushing from the QEI has long been known to occur (i.e. Melling, 2002; Alt et al., 2006; Howell et al., 2009), it has never been quantified.
Figure 9 shows the monthly time series of the sea ice area flux at the CAA's internal passageways. It is clear that ice flux only occurs during summer when the ice pack is mobile and that the majority of ice exiting the QEI passes through Byam Martin Channel. The average monthly ice area flux through Byam Martin Channel is 2 ± 3 × 10³ km2, but importantly this can range from 1 × 10³ to 20 × 103 km2. The monthly mean ice area fluxes through Penny Strait and Fitzwilliam Strait are 0.5 ± 1 × 10³ and −0.03 ± 0.4 × 10³ km2, respectively. These average ice area flux values are relatively small because these regions remain landfast for much of the year, resulting in minimal sea ice motion outside of August and September when the majority of the flux occurs.
Considering all three passageways, the average annual ice area flux from the QEI over the 6-year period was 27 ± 10 × 103 km2 and ranged from 9 × 10³ in 2019 to 40 × 103 km2 in 2020, with MYI representing ∼ 39 % of the total ice area flux (Fig. 8). The average annual volume flux was 34 ± 12 km3 and ranged from 13 in 2019 to 49 km3 in 2020 (Fig. 10). It should be noted that there is more uncertainty in the inner-gate volume flux estimates compared to the outer gates because we used linearly interpolated ice thickness values during the summer months, and as a result, the uncertainty range shown in Fig. 10b could be more variable. The ice exiting out of these passageways subsequently flows into Parry Channel, where it represents a considerable risk to ships transiting the Northwest Passage. Moreover, Haas and Howell (2015) reported mean ice thickness values in Byam Martin Channel to be 3.84 m, and recent analysis by Melling (2022) suggests that dynamic thickening of MYI in the Arctic Ocean immediately north of the CAA has not declined in such a way that the ice imported into the QEI has significantly thinned since the 1970s. Ultimately, this suggests that thick MYI continues to be advected from the Arctic Ocean into the QEI and subsequently transported southwards to the Northwest Passage, where it poses a risk to ships navigating the area. The risk of encountering MYI in the Northwest Passage has not disappeared, in spite of significant overall thinning of the Arctic ice cover.
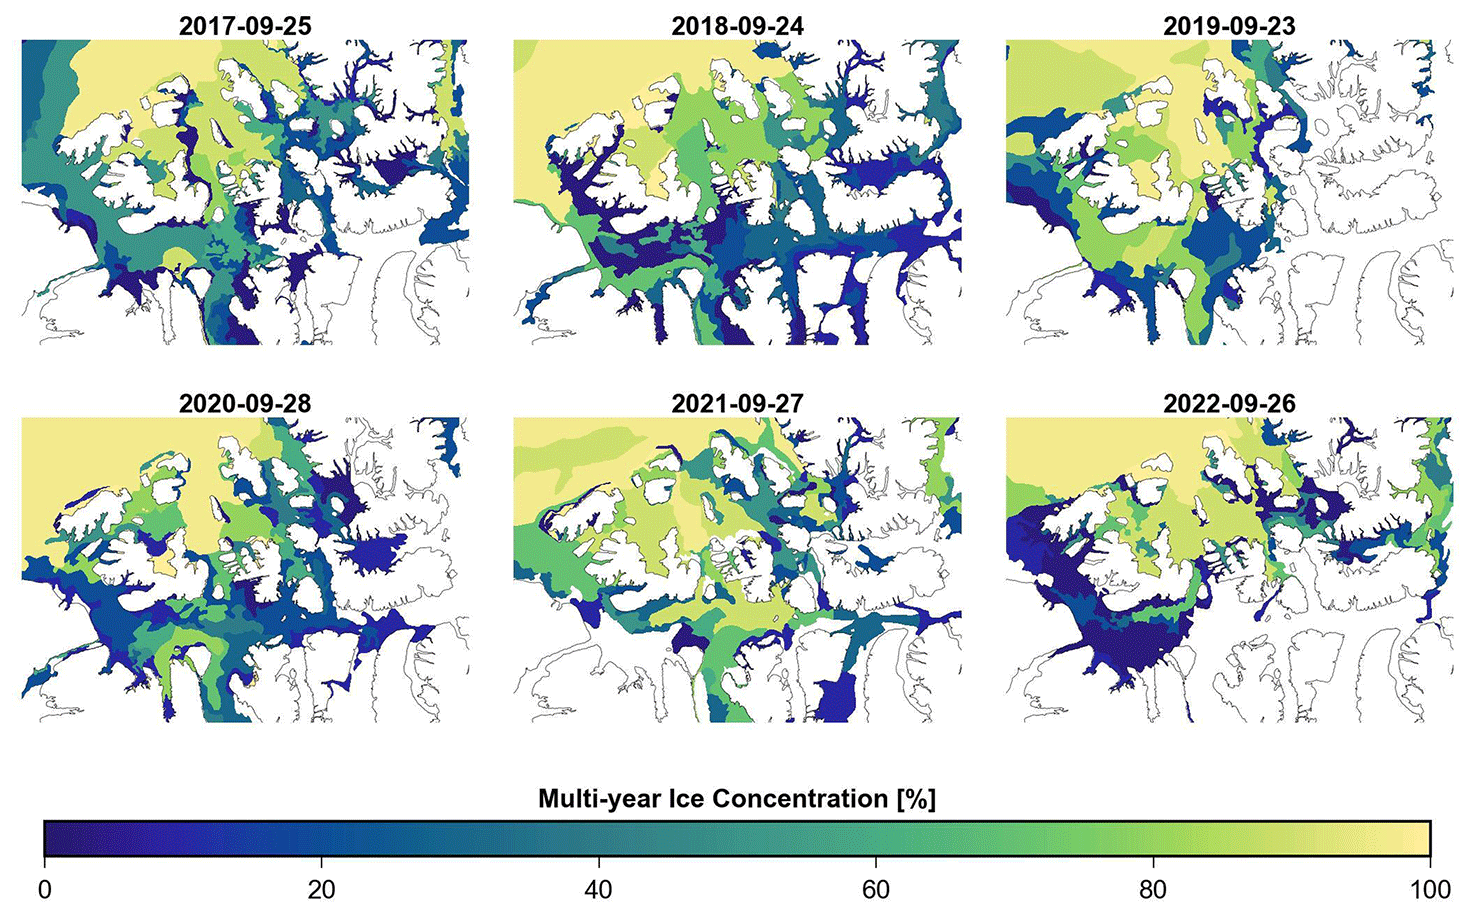
Figure 8Spatial distribution of multi-year ice (MYI) concentration on the last week of September in the Canadian Arctic Archipelago from 2017 to 2022.
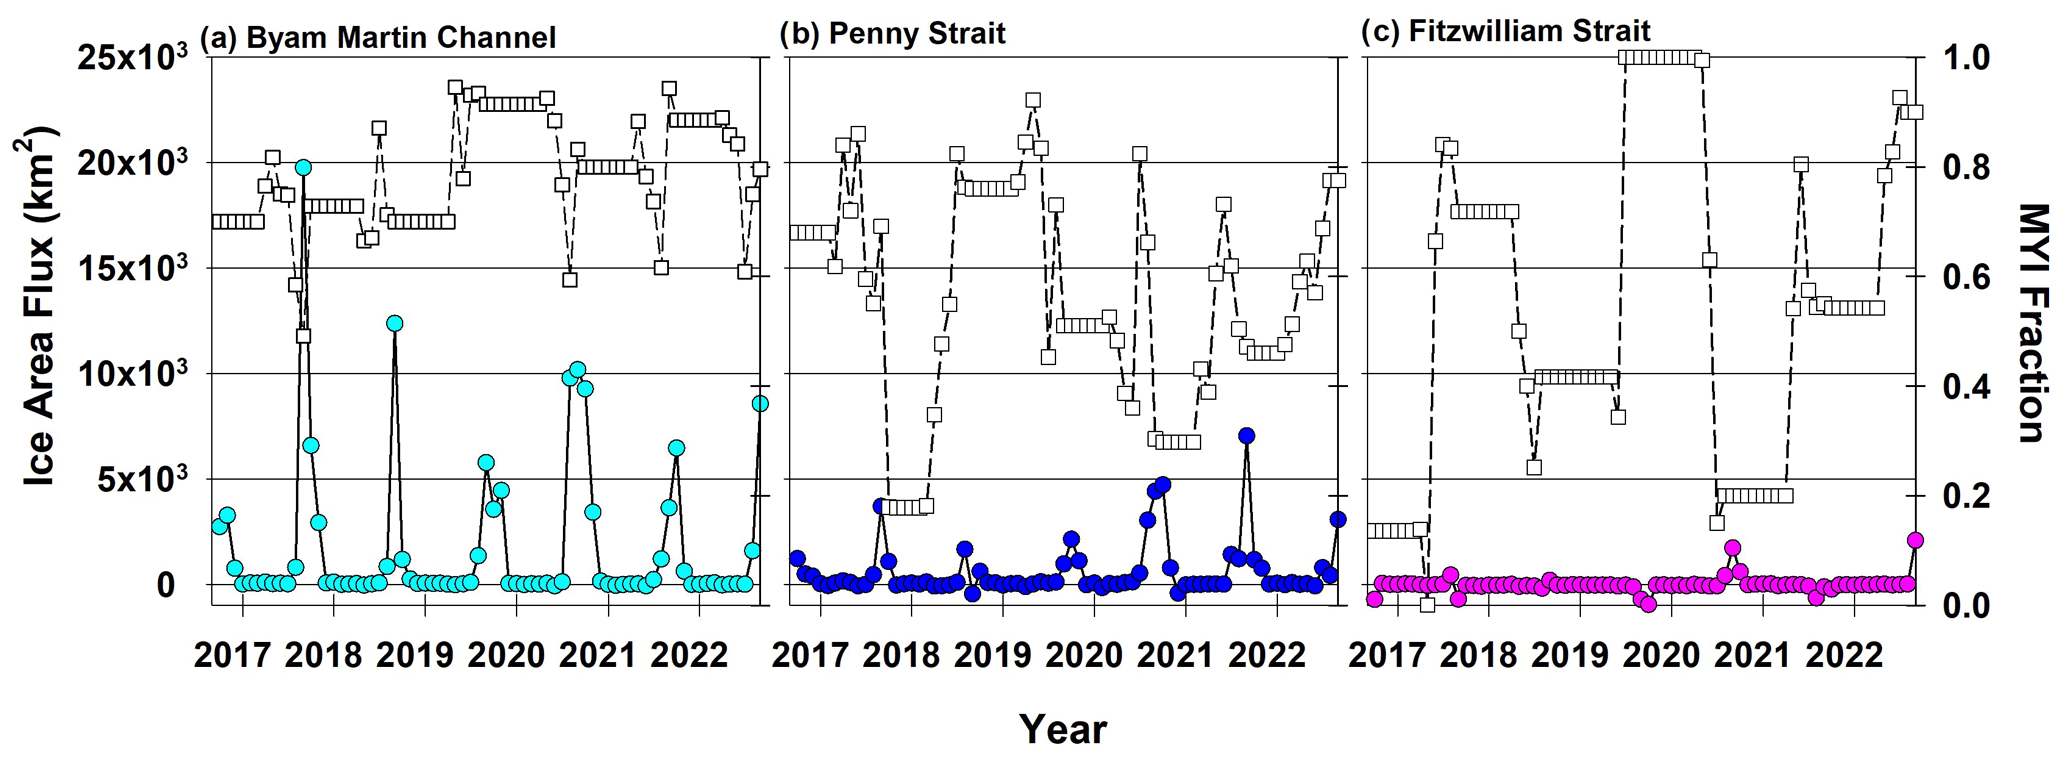
Figure 9Time series of the monthly ice area flux for (a) Byam Martin Channel, (b) Penny Strait, and (c) Fitzwilliam Strait, October 2016 to September 2022. Square boxes indicate the multi-year ice (MYI) fraction. Positive flux values indicate ice export from the Queen Elizabeth Islands to Parry Channel, and negative flux values indicate ice import from Parry Channel to the Queen Elizabeth Islands.

Figure 10Annual (October to September) (a) total ice and multi-year ice (MYI) area flux and (b) ice volume flux from the Queen Elizabeth Islands to Parry Channel from 2017 to 2022. No annual ice volume data were available in 2022. Vertical black bars indicate uncertainty.
4.4 MYI replenishment in the CAA
The two components that replenish the CAA's inventory of MYI are (i) MYI that is imported from the Arctic Ocean (dynamic) and (ii) FYI that survives the melt season and is promoted to MYI (thermodynamic). Howell et al. (2015) quantified these MYI replenishment components from 1997 to 2013 using the same ice area flux method used in this study for the dynamic component and the Canadian Ice Service ice charts for the thermodynamic component. Indeed, Canadian Ice Service ice charts can be used to estimate FYI ageing by taking the sum of all SYI within the CAA on the first weekly CIS chart of October. The first week of October is used because this is when all remaining FYI within the CAA that survived the melt season is promoted to SYI.
Howell et al. (2015) reported that the total MYI replenishment from 1997–2013 was an average of 65 × 103 km2, with 13 × 103 km2 representing dynamic import and 52 × 103 km2 representing FYI melt season survival. However, the dynamic component estimate was limited to May to November due to SAR image availability. Since our sea ice area flux estimates in this study are year-round, it provides an opportunity for more robust estimates of MYI replenishment within the CAA. Figure 11 shows the annual MYI replenishment within the CAA for our 6-year study period. The 6-year annual average for MYI replenishment was 70 ± 61 × 103 km2, with the dynamic component being 14 ± 38 × 103 km2 (20 %) and the thermodynamic component being 56 ± 36 × 103 km2 (80 %). These values are relatively similar to the replenishment components from 1997 to 2013 reported by Howell et al. (2015) and suggest the processes of MYI replenishment within the CAA have not changed appreciably over the last 25 years. This is a considerable contrast to the abrupt disruptions in MYI replenishment processes operating in the Arctic Ocean (Babb et al., 2023). It also reinforces the fact that MYI replenishment within the CAA is primarily the result of FYI surviving through the summer rather than the annual import of MYI from the Arctic Ocean into the QEI. However, given that Arctic Ocean MYI import is increasing (Howell and Brady, 2019), together with thinning landfast ice in the CAA (Howell et al., 2016; Glissenaar et al., 2023b) becoming more prone to melt, it seems likely that the relative contributions of these two sources of MYI could change in the future.
Although over longer-term periods the MYI replenishment mechanisms appear to be stable, on an interannual basis the two can vary significantly. For instance, strong positive net MYI replenishment was mainly caused by FYI survival in 2017, 2018, and 2021 (Fig. 11). In 2021, the area of ice surviving summer melt was much lower, but this was offset by strong MYI import into the QEI and also led to a year of high net replenishment. In contrast, there was net MYI export from the CAA in 2019 and 2022, but this was not offset by strong thermodynamic survival, so the net replenishment in 2019 was >5 times smaller than the other years, and in 2022 there was actually a net loss of −34 × 103 km2 MYI.
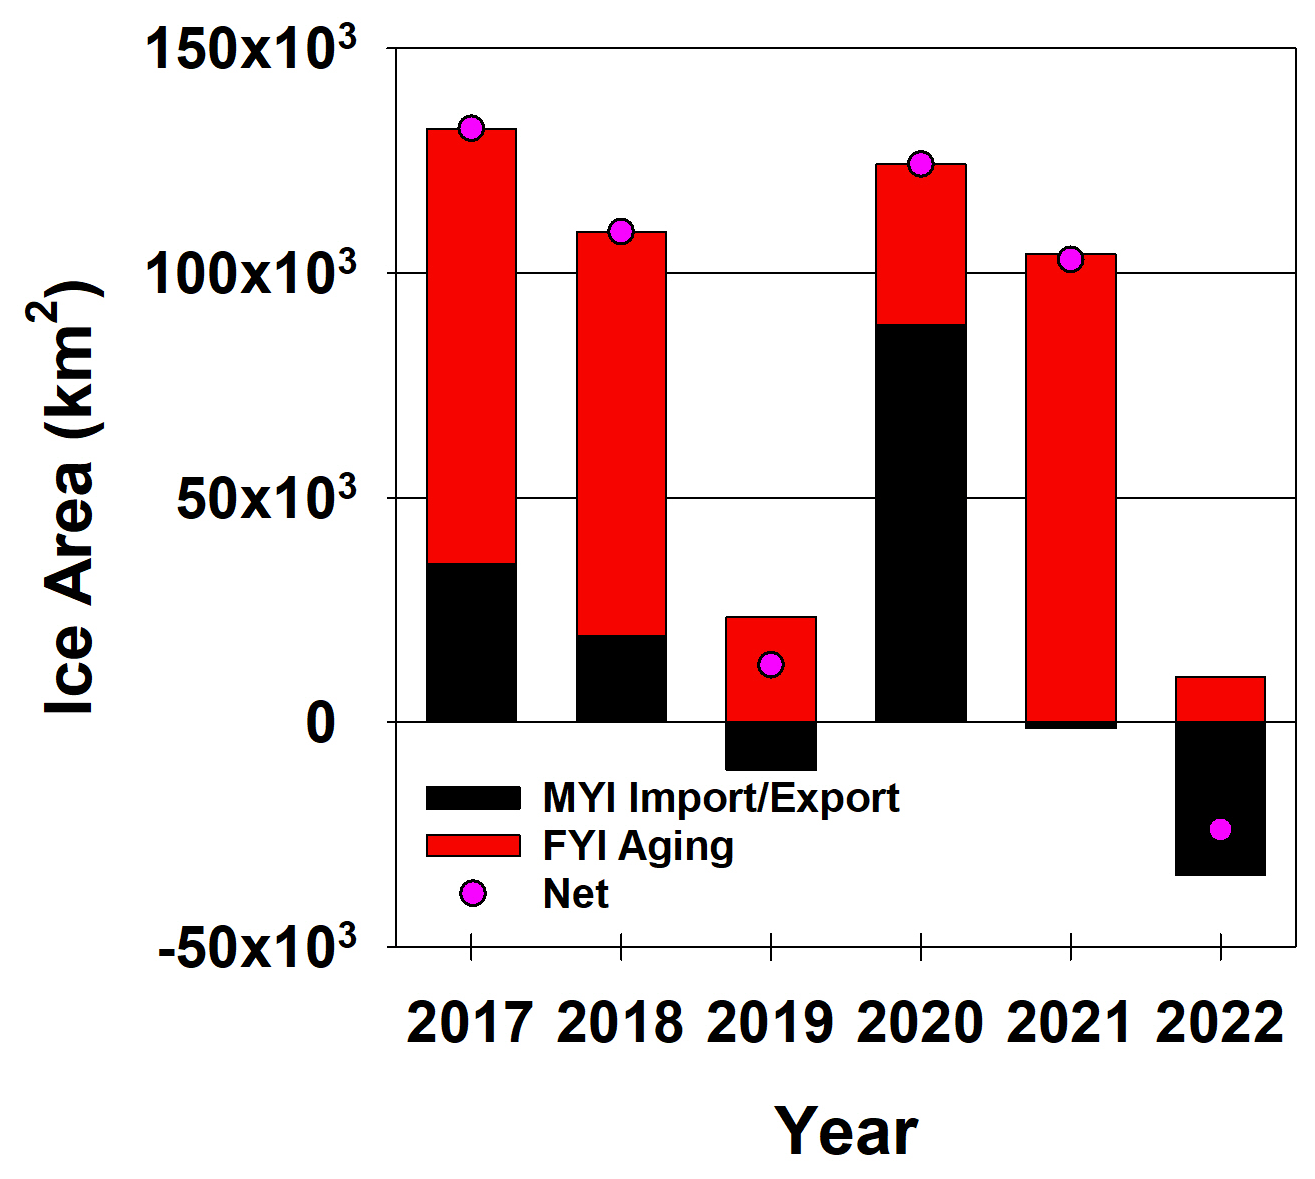
Figure 11Annual (October to September) multi-year ice (MYI) replenishment within the Canadian Arctic Archipelago (CAA) from 2017 to 2022. Positive MYI values indicate ice import from the Arctic Ocean or Baffin Bay to the CAA, and negative values indicate MYI export from the CAA.
We summarized the sea ice area transport across the CAA from October 2016 to September 2022 and sea ice volume transport across the CAA from October 2016 to September 2020. Over these time periods, the annual ice area flux average was −138 ± 71 × 103 km2, and the average volume flux was −57 ± 68 km3, indicating that the CAA exported more ice to the Arctic Ocean and Baffin Bay than it received. We demonstrated that the majority of the CAA's ice area and volume flux is exported to Baffin Bay, while the QEI is the only area where ice is routinely imported. On an annual basis, the CAA always acted as a conduit for ice area but appreciable import of thicker ice from the Arctic Ocean via the QEI can transform the CAA into a sink for ice volume. The latter was the case in 2020 and almost the case in 2017.
Compared to Nares Strait, the ice area flux from the entire CAA is considerably larger than the ice volume flux on an annual basis, with relative contributions of 145 % and 33 %, respectively. As a result, the CAA is a larger contributor of ice area but not ice volume, with respect to the transport of freshwater (as solid ice), to the North Atlantic compared to Nares Strait. This also emphasizes the importance of thick ice north of the CAA and Greenland that exits through Nares Strait in impacting ice volume transport downstream to the North Atlantic. Fram Strait still provides considerably more downstream ice transport to the North Atlantic than both Nares Strait and the CAA combined.
We also provided the first estimates of the sea ice area and volume flux within the CAA through the major passageways of the QEI to Parry Channel. Most of the ice leaving the QEI was via Byam Martin Channel followed by Penny Strait, and it was negligible at Fitzwilliam Strait. This confirms previous suggestions by Melling (2002) and Howell et al. (2009) that just south of Byam Martin Channel is the key “choke point” for marine navigation through the Northwest Passage. The ice flux from the QEI to Parry Channel primarily occurred in summer months but was substantial, with annual averages of 27 ± 10 × 103 km2 and 41 ± 15 km3 for ice area and volume flux, respectively.
Although the time series of this study was insufficient to examine long-term trends, Arctic Ocean ice import into the QEI has increased since 1997 (Howell and Brady, 2019), which means that it is unlikely that the ice flux from the QEI southward to Parry Channel has decreased. As long as dynamic processes continue to create thick ice along the north-facing coast of the CAA, the transport of thick sea ice from the Arctic Ocean southward through the CAA will continue. This southward transport of ice presents a considerable risk to safely navigating the Northwest Passage, a risk that seems unlikely to drop in the near future.
Finally, we provided more robust estimates of MYI replenishment within the CAA on an annual basis. The 6-year annual average of MYI replenishment was 70 ± 61 × 103 km2, with the dynamic ice import component contributing 14 ± 38 × 103 km2 and the thermodynamic FYI survival component contributing 56 ± 36 × 103 km2. MYI replenishment within the CAA from 2016 to 2022 was similar to estimates from 1997 to 2013 by Howell et al. (2015). This suggests that despite climate warming diminishing the sea ice cover in all seasons across the Arctic, the processes that contribute to MYI replenishment within the CAA continue to operate and appear not to have been severely impacted yet.
A spreadsheet with the monthly ice area and ice volume for all gates is available as a Supplement to this paper.
The supplement related to this article is available online at: https://doi.org/10.5194/tc-18-2321-2024-supplement.
SELH wrote the paper with input from DGB, JCL, IAG, KM, BM, and MB. SELH and MB performed the analysis. JCL and IAG provided the ice thickness data.
At least one of the (co-)authors is a member of the editorial board of The Cryosphere. The peer-review process was guided by an independent editor, and the authors also have no other competing interests to declare.
Publisher’s note: Copernicus Publications remains neutral with regard to jurisdictional claims made in the text, published maps, institutional affiliations, or any other geographical representation in this paper. While Copernicus Publications makes every effort to include appropriate place names, the final responsibility lies with the authors.
David G. Babb is supported by the Canada Excellence Research Chair in Arctic Ice, Freshwater Marine Coupling and Climate Change held by Dorthe Dahl-Jensen at the University of Manitoba. Jack C. Landy received support from the INTERAAC project (grant no. 328957) from the Research Council of Norway (RCN), from the Fram Centre program for Sustainable Development of the Arctic Ocean (SUDARCO) (grant no. 2551323), and from the European Research Council (grant no. SI3D/101077496).
This paper was edited by Yevgeny Aksenov and reviewed by Alek Petty and one anonymous referee.
Agnew, T., Lambe, A., and Long, D.: Estimating sea ice area flux across the Canadian Arctic Archipelago using enhanced AMSR-E, J. Geophys. Res., 113, C10011, https://doi.org/10.1029/2007JC004582, 2008.
Alt, B., Wilson, K., and Carrieres, T.: A case study of old ice import and export through the Peary and Sverdrup Channels of the Canadian Arctic Archipelago, Ann. Glaciol., 44, 329–338. https://doi.org/10.3189/172756406781811321, 2006.
Babb, D. G., Galley, R. J., Kirillov, S., Landy, J. C., Howell, S. E. L., Stroeve, J. C., Meier, W., Ehn, J. K., and Barber, D. G.: The stepwise reduction of multiyear sea ice area in the Arctic Ocean since 1980, J. Geophys. Res.-Oceans, 128, e2023JC020157, https://doi.org/10.1029/2023JC020157, 2023.
Barber, D. G. and Hanesiak, J. M.: Meteorological forcing of sea ice concentration in the southern Beaufort Sea over the period 1979 to 2000, J. Geophys. Res., 109, C06014, https://doi.org/10.1029/2003JC002027, 2004.
Canadian Ice Service: Sea ice climate normals for the northern Canadian waters 1991–2020, https://www.canada.ca/en/environment-climate-change/services/ice-forecasts-observations/latest-conditions/climatology/ice-climate-normals/northern-canadian-waters.html (last access: 3 May 2024), 2021.
Carmack, E. C. and MacDonald, R. W.: Oceanography of the Canadian Shelf of the Beaufort Sea: A setting for marine life, Arctic, 55, 29–45, 2002.
Dawson, J., Pizzolato, L., Howell, S. E. L., Copland, L., and Johnston, M. E.: Temporal and Spatial Patterns of Ship Traffic in the Canadian Arctic from 1990 to 2015 + Supplementary Appendix 1: Figs. S1–S7 (See Article Tools), Arctic, 71, 15, https://doi.org/10.14430/arctic4698, 2018.
Dawson, J., Carter, N., van Luijk, N., Parker, C., Weber, M., Cook, A., Grey, K., and Provencher, J.: Infusing inuit and local knowledge into the low impact shipping corridors: An adaptation to increased shipping activity and climate change in Arctic Canada, Environmental Science and Policy, 105, 19–36, https://doi.org/10.1016/j.envsci.2019.11.013, 2020.
Galley, R. J., Key, E., Barber, D. G., Hwang, B. J., and Ehn, J. K.: Spatial and temporal variability of sea ice in the southern Beaufort Sea and Amundsen Gulf: 1980–2004, J. Geophys. Res., 113, C05S95, https://doi.org/10.1029/2007JC004553, 2008.
Glissenaar, I., Landy, J., Babb, D., Howell, S., and Dawson, G.: Proxy SIT Canadian Arctic – dataset (v1.1), Zenodo [data set], https://doi.org/10.5281/zenodo.8245898, 2023a.
Glissenaar, I. A., Landy, J. C., Babb, D. G., Dawson, G. J., and Howell, S. E. L.: A long-term proxy for sea ice thickness in the Canadian Arctic: 1996–2020, The Cryosphere, 17, 3269–3289, https://doi.org/10.5194/tc-17-3269-2023, 2023b.
Haas, C. and Howell, S. E. L.: Ice thickness in the Northwest Passage, Geophys. Res. Lett., 42, 7673–7680, https://doi.org/10.1002/2015GL065704, 2015.
Howell, S. E. L. and Brady, M.: The dynamic response of sea ice to warming in the canadian arctic archipelago, Geophys. Res. Lett., 46, 13119–13125, https://doi.org/10.1029/2019GL085116, 2019.
Howell, S. E. L., Duguay, C. R., and Markus, T.: Sea ice conditions and melt season duration variability within the Canadian Arctic Archipelago: 1979–2008, Geophys. Res. Lett., 36, L10502, https://doi.org/10.1029/2009GL037681, 2009.
Howell, S. E. L., Wohlleben, T., Dabboor, M., Derksen, C., Komarov, A., and Pizzolato, L.: Recent changes in the exchange of sea ice between the Arctic Ocean and the Canadian Arctic Archipelago. J. Geophys. Res.-Oceans, 118, 3595–3607, https://doi.org/10.1002/jgrc.20265, 2013.
Howell, S. E. L., Derksen, C., Pizzolato, L., and Brady, M.: Multiyear ice replenishment in the Canadian Arctic Archipelago: 1997–2013, J. Geophys. Res.-Oceans, 120, 1623–1637, https://doi.org/10.1002/2015JC010696, 2015.
Howell, S. E. L., Brady, M., Derksen, C., and Kelly, R. E. J.: Recent changes in sea ice area flux through the Beaufort Sea during the summer, J. Geophys. Res.-Oceans, 121, 2659–2672, https://doi.org/10.1002/2015JC011464, 2016.
Howell, S. E. L., Brady, M., and Komarov, A. S.: Generating large-scale sea ice motion from Sentinel-1 and the RADARSAT Constellation Mission using the Environment and Climate Change Canada automated sea ice tracking system, The Cryosphere, 16, 1125–1139, https://doi.org/10.5194/tc-16-1125-2022, 2022.
Howell, S. E. L., Babb, D. G., Landy, J. C., and Brady, M.: Multi-year sea ice conditions in the Northwest Passage: 1968–2020, Atmos. Ocean, 61, 202–216, https://doi.org/10.1080/07055900.2022.2136061, 2023a.
Howell, S. E. L., Babb, D. G., Landy, J. C., Moore, G. W. K., Montpetit, B., and Brady, M.: A comparison of Arctic Ocean sea ice export between Nares Strait and the Canadian Arctic Archipelago, J. Geophys. Res.-Oceans, 128, e2023JC019687, https://doi.org/10.1029/2023JC019687, 2023b.
Jones, E. P., Swift, J. H., Anderson, L. G., Lipizer, M., Civitarese, G., Falkner, K. K., Kattner, G., and McLaughlin, F.: Tracing Pacific water in the North Atlantic Ocean, J. Geophys. Res., 108, 3116, https://doi.org/10.1029/2001JC001141, 2003.
Kim, Y.-H., Min, S.-K., Gillett, N. P., Notz, D., and Malinina, E.: Observationally-constrained projections of an ice-free Arctic even under a low emission scenario, Nat. Commun., 14, 3139, https://doi.org/10.1038/s41467-023-38511-8, 2023.
Komarov, A. S. and Barber, D. G.: Sea ice motion tracking from sequential dual-polarization RADARSAT-2 images. IEEE T. Geosci. Remote, 52, 121–136, https://doi.org/10.1109/TGRS.2012.2236845, 2014.
Kwok, R.: Exchange of sea ice between the Arctic Ocean and the Canadian Arctic Archipelago, Geophys. Res. Lett., 33, L16501, https://doi.org/10.1029/2006GL027094, 2006.
Kwok, R.: Arctic sea ice thickness, volume, and multiyear ice coverage: Losses and coupled variability (1958–2018), Environ. Res. Lett., 13, 105005, https://doi.org/10.1088/1748-9326/aae3ec, 2018.
Kwok, R. and Rothrock, D. A.: Variability of Fram Strait flux and north Atlantic oscillation, J. Geophys. Res., 104, 5177–5189, https://doi.org/10.1029/1998jc900103, 1999.
Kuhlbrodt, T., Griesel, A., Montoya, M., Levermann, A., Hofmann, M., and Rahmstorf, S.: On the driving processes of the Atlantic meridional overturning circulation, Rev. Geophys., 45, RG2001, https://doi.org/10.1029/2004rg000166, 2007.
Landy, J. C., Dawson, G. J., Tsamados, M., Bushuk, M., Stroeve, J. C., Howell, S. E. L., Krumpen, T., Babb, D. G., Komarov, A. S., Heorton, H. D. B. S., Belter, H. J., and Aksenov, Y.: A year-round satellite sea ice thickness record from CryoSat-2, Nature, 609, 517–522, https://doi.org/10.1038/s41586-022-05058-5, 2022.
Li, X. and Lynch, A. H.: New insights into projected Arctic sea road: operational risks, economic values, and policy implications, Climatic Change, 176, 30, https://doi.org/10.1007/s10584-023-03505-4, 2023.
Lindsay, R. W. and Stern, H. L.: The RADARSAT Geophysical Processor System: Quality of sea ice trajectory and deformation estimates, J. Atmos. Ocean. Tech., 20, 1333–1347, 2003.
Melling, H.: Sea ice of the northern Canadian Arctic archipelago, J. Geophys. Res.-Oceans, 107, 3181, https://doi.org/10.1029/2001JC001102, 2002.
Melling, H.: Thickness of multi-year sea ice on the northern Canadian polar shelf: a second look after 40 years, The Cryosphere, 16, 3181–3197, https://doi.org/10.5194/tc-16-3181-2022, 2022.
Mudryk, L., Dawson, J. P., Howell, S. E. L., Derksen, C., Zagon, T., and Brady, M.: Impact of 1, 2, and 4 °C of global warming on ship navigation in the Canadian Arctic, Nat. Clim. Change, 11, 673–679, https://doi.org/10.1038/s41558-021-01087-6, 2021.
Pizzolato, L., Howell, S. E. L., Derksen, C. Dawson, J., and Copland, L.: Changing sea ice conditions and marine transportation activity in Canadian Arctic waters between 1990 and 2012, Climatic Change, 123, 161–173, https://doi.org/10.1007/s10584-013-1038-3, 2014.
Prinsenberg, S. J. and Hamilton, J.: Monitoring the volume, freshwater and heat fluxes passing through Lancaster Sound in the Canadian Arctic Archipelago, Atmos. Ocean, 43, 1–22, https://doi.org/10.3137/ao.430101, 2005.
Rudels, B.: Volume and freshwater transports through the Canadian Arctic Archipelago–Baffin Bay system, J. Geophys. Res., 116, C00D10, https://doi.org/10.1029/2011JC007019, 2011.
Smedsrud, L. H., Halvorsen, M. H., Stroeve, J. C., Zhang, R., and Kloster, K.: Fram Strait sea ice export variability and September Arctic sea ice extent over the last 80 years, The Cryosphere, 11, 65–79, https://doi.org/10.5194/tc-11-65-2017, 2017.
Smith, L. C. and Stephenson, S. R.: New trans-Arctic shipping routes navigable by midcentury, P. Natl. Acad. Sci. USA, 110, E1191–E1195, https://doi.org/10.1073/pnas.1214212110, 2013.
Steele, M., Thomas, D., and Rothrock, D. A.: A simple model study of the Arctic freshwater balance, 1979–1985, J. Geophys. Res., 101, 20833–20848, 1996.
Sumata, H., De Steur, L., Gerland, S., Divine, D. V., and Pavlova, O: Unprecedented decline of Arctic sea ice outflow in 2018, Nat. Commun., 13, 1747, https://doi.org/10.1038/s41467-022-29470-7, 2022.
Tivy, A., Howell, S. E. L., Alt, B., McCourt, S., Chagnon, R., Crocker, G., Carrieres, T., and Yackel, J. J.: Trends and variability in summer sea ice cover in the Canadian Arctic based on the Canadian Ice Service Digital Archive, 1960–2008 and 1968–2008, J. Geophys. Res., 116, C03007, https://doi.org/10.1029/2009JC005855, 2011.
Topál, D. and Ding, Q.: Atmospheric circulation-constrained model sensitivity recalibrates Arctic climate projections, Nat. Clim. Change, 13, 710–718, https://doi.org/10.1038/s41558-023-01698-1, 2023.
Vylegzhanin, A., Bunik, I., Torkunova, E., and Kienko, E.: Navigation in the Northern Sea Route: interaction of Russian and international applicable law, The Polar Journal, 10, 285–302, https://doi.org/10.1080/2154896X.2020.1844404, 2020.
Zhang, J., Weijer, W., Steele, M., Cheng, W., Verma, T., and Veneziani, M.: Labrador Sea freshening linked to Beaufort Gyre freshwater release, Nat. Commun., 12, 1229, https://doi.org/10.1038/s41467-021-21470-3, 2021.