the Creative Commons Attribution 4.0 License.
the Creative Commons Attribution 4.0 License.
 | 07 May 2024
Extensive palaeo-surfaces beneath the Evans–Rutford region of the West Antarctic Ice Sheet control modern and past ice flow
Charlotte M. Carter
Michael J. Bentley
Stewart S. R. Jamieson
Guy J. G. Paxman
Tom A. Jordan
Julien A. Bodart
Neil Ross
Felipe Napoleoni
The subglacial landscape of Antarctica records and influences the behaviour of its overlying ice sheet. However, in many places, the evolution of the landscape and its control on ice sheet behaviour have not been investigated in detail. Using recently released radio-echo sounding data, we investigate the subglacial landscape of the Evans–Rutford region of West Antarctica. Following quantitative analysis of the landscape morphology under ice-loaded and ice-unloaded conditions, we identify 10 flat surfaces distributed across the region. Across these 10 surfaces, we identify two distinct populations based on clustering of elevations, which potentially represent remnants of regionally coherent pre-glacial surfaces underlying the West Antarctic Ice Sheet (WAIS). The surfaces are bounded by deeply incised glacial troughs, some of which have potential tectonic controls. We assess two hypotheses for the evolution of the regional landscape: (1) passive-margin evolution associated with the break-up of the Gondwana supercontinent or (2) an extensive planation surface that may have been uplifted in association with either the West Antarctic Rift System or cessation of subduction at the base of the Antarctic Peninsula. We suggest that passive-margin evolution is the most likely of these two mechanisms, with the erosion of glacial troughs adjacent to, and incising, the flat surfaces likely having coincided with the growth of the WAIS. These flat surfaces also demonstrate similarities to other identified surfaces, indicating that a similar formational process may have been acting more widely around the Weddell Sea embayment. The subsequent fluctuations of ice flow, basal thermal regime, and erosion patterns of the WAIS are therefore controlled by the regional tectonic structures.
- Article
(12363 KB) - Full-text XML
- BibTeX
- EndNote


Subglacial topography is an important boundary condition influencing ice sheet behaviour across Antarctica. The subglacial landscape is not static in time but evolves via erosion, deposition, and tectonic processes. As the landscape changes, ice flow patterns can change in response. Some patterns of landscape promote selective linear erosion, whereby incision in deep troughs occurs directly adjacently to elevated areas where little or no erosion occurs (Sugden, 1978). Such patterns can therefore be reinforced, as incision deepens valleys over time. However, the initiation of selective glacial incision at the onset of Antarctic glaciation is heavily preconditioned by the existing subaerial topography, which in itself is a function of processes such as tectonics, fluvial erosion and deposition, and hillslope processes (Jamieson and Sugden, 2008). Therefore, if we wish to understand the past and present ice flow conditions of Antarctica, it is important to explore the subglacial landscape and the processes that have led to its development.
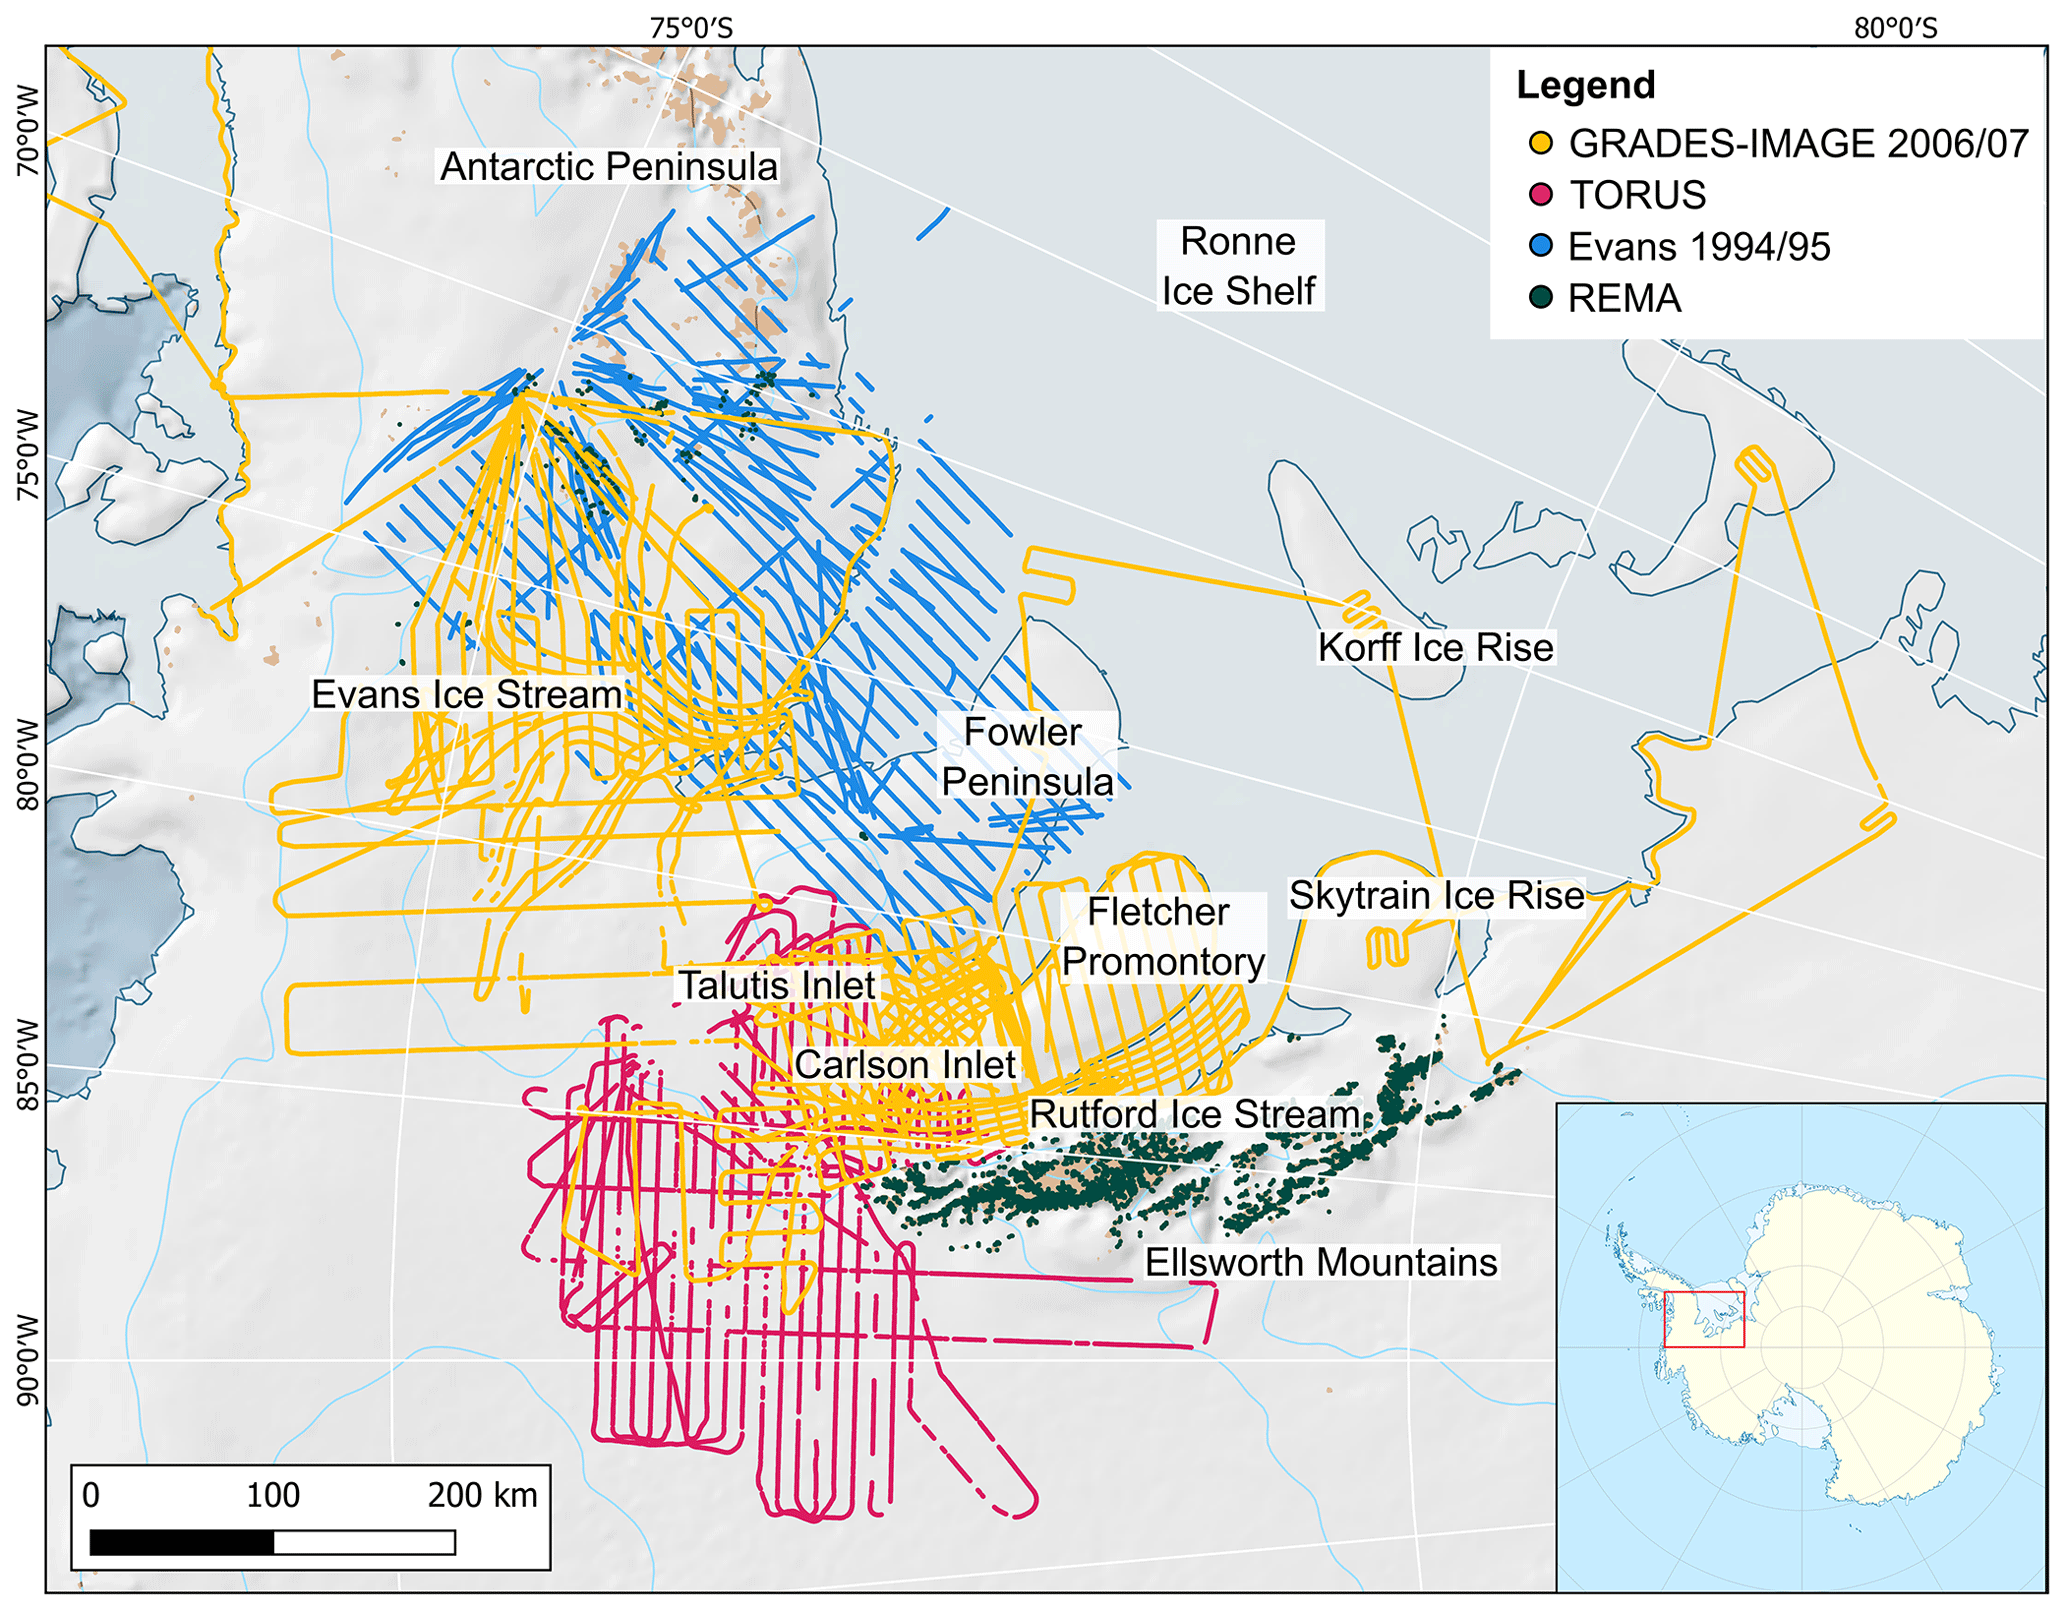
Figure 1Study site map of the Evans–Rutford region. Data points illustrate the RES surveys used in the study: GRADES-IMAGE 2006/07 carried out by the British Antarctic Survey (BAS), TORUS, REMA exposed bedrock, and Evans 1994/95. Detailed basemap sourced from Quantarctica (Matsuoka et al., 2021). Inset map shows location of the study region (red box) in relation to the Antarctic continent.
We aim to understand the evolution of the subglacial topography beneath the Evans–Rutford region of the West Antarctic Ice Sheet (WAIS). This region (Fig. 1) hosts significant ice streams that drain the WAIS and the Antarctic Peninsula and contains some of the highest-relief topography in Antarctica. However, its landscape evolution, as recorded in detailed subglacial geomorphology, has not been fully explored.
The Evans–Rutford region is located between the base of the Antarctic Peninsula and the Ellsworth Mountains (Fig. 1). This area is drained by two major outlet glaciers, the Evans and Rutford ice streams, which discharge into the Ronne Ice Shelf. Carlson Inlet contains a stagnated ice stream adjacent to the Rutford Ice Stream (King, 2011), whilst the Fletcher Promontory and Fowler Peninsula are slowly flowing ice rises (Matsuoka et al., 2015) between the ice streams.
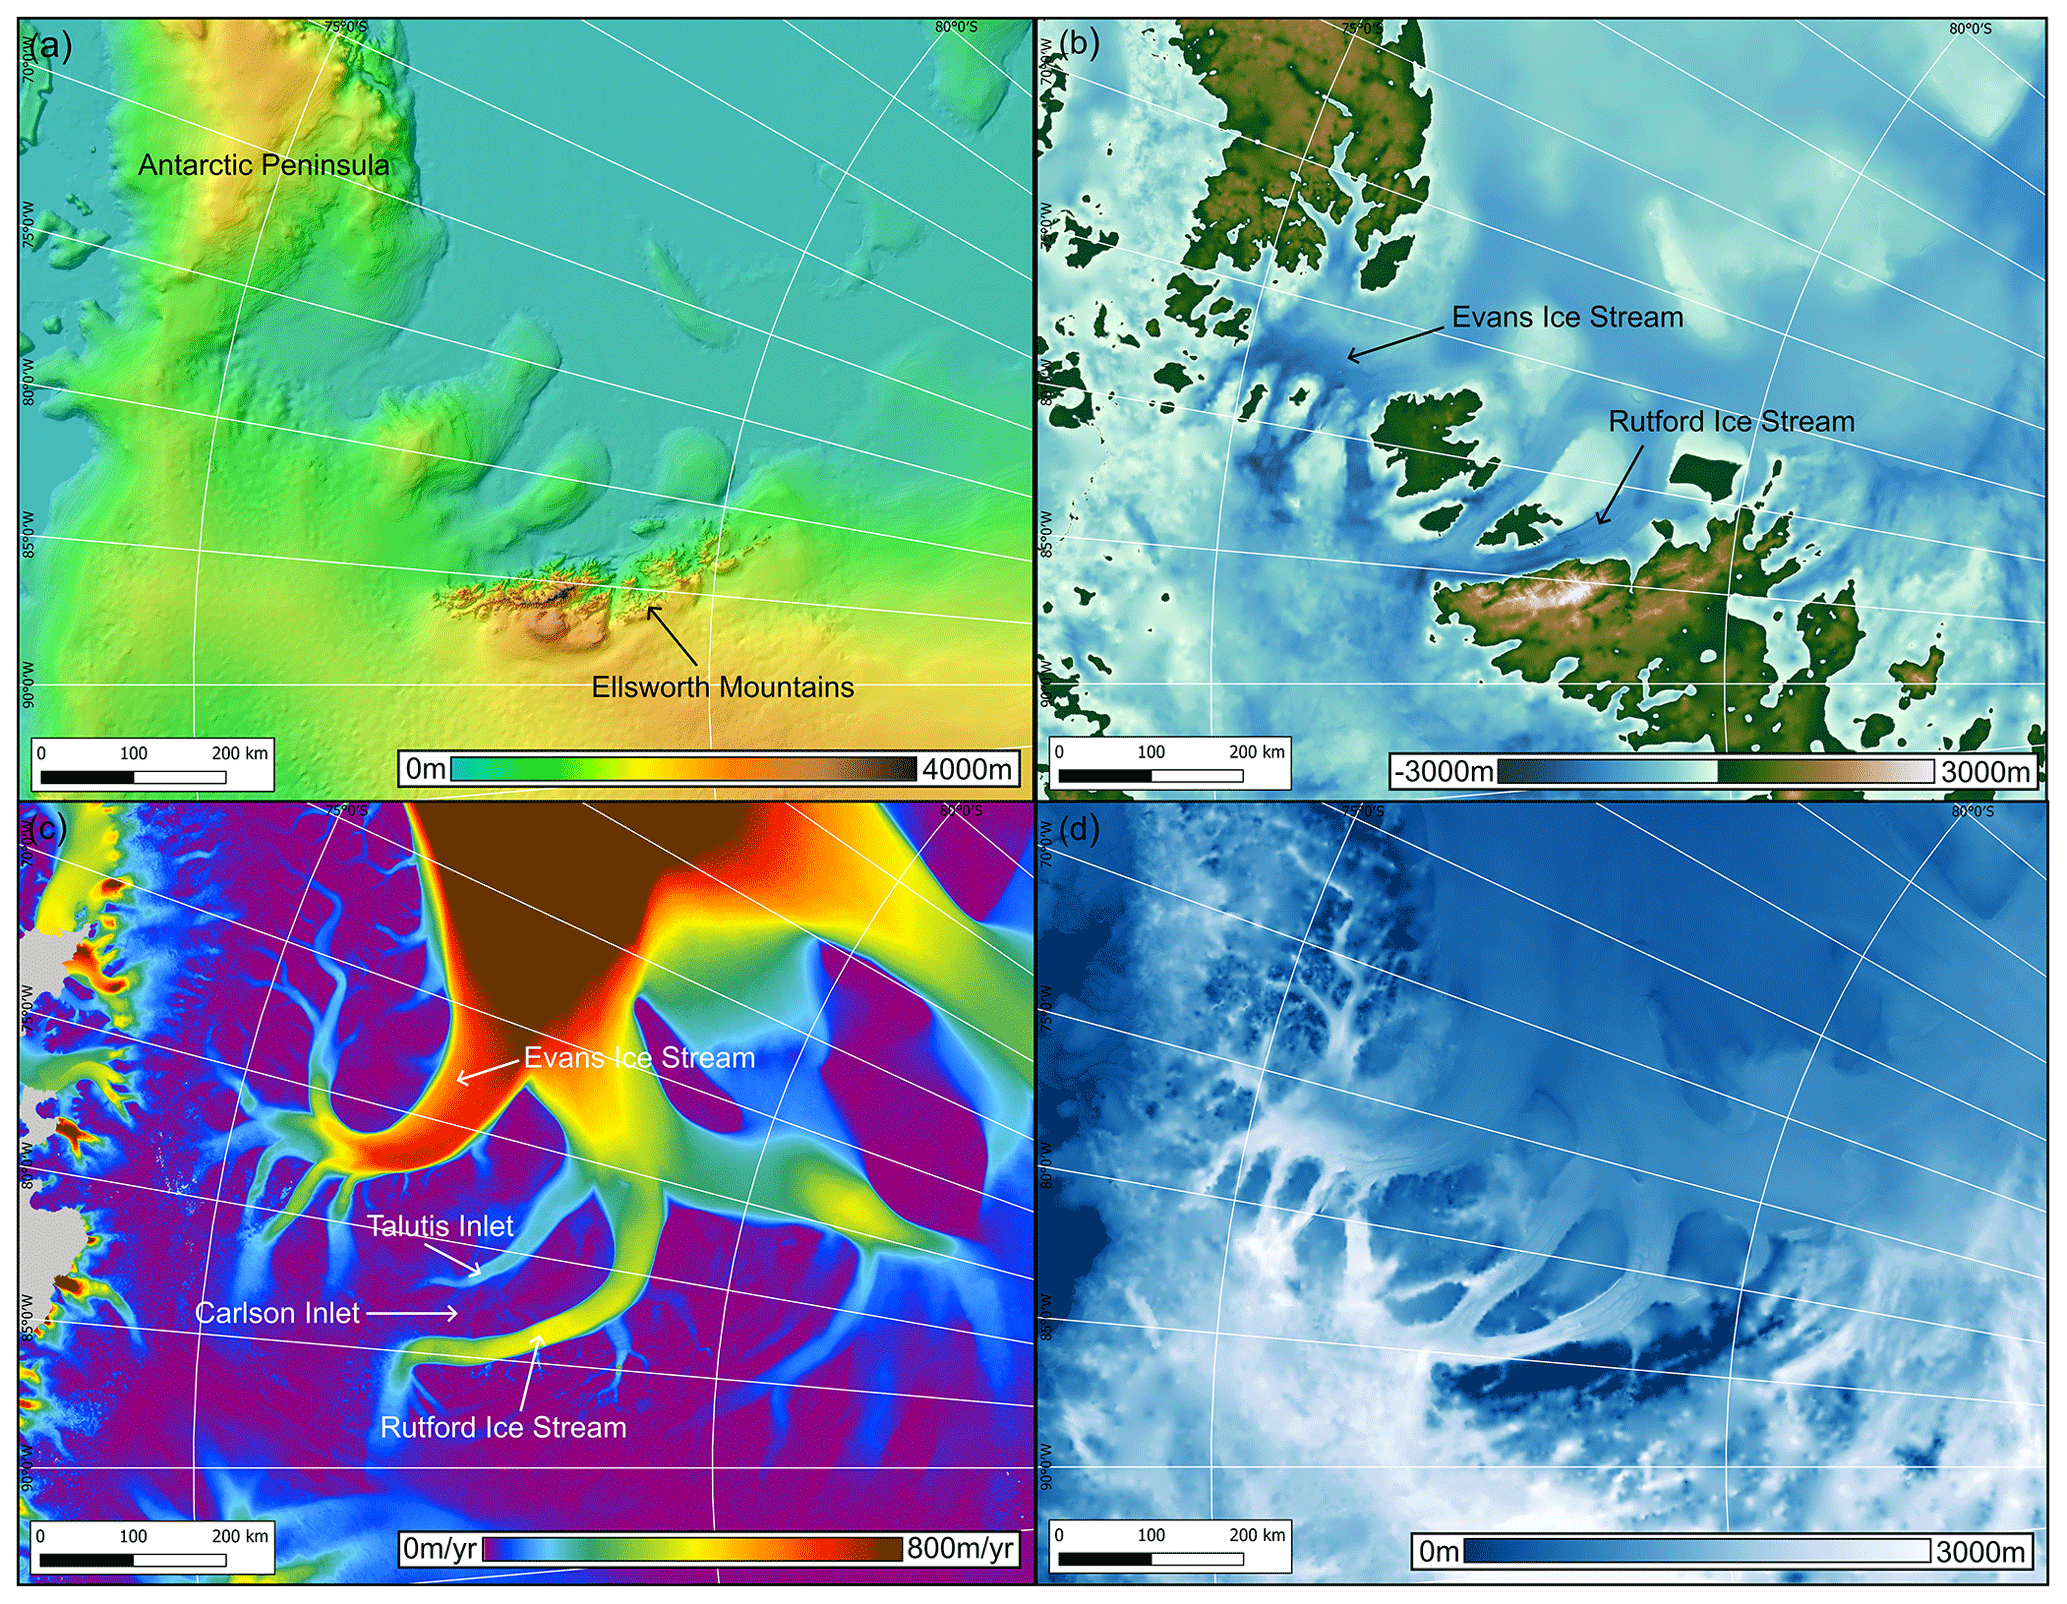
Figure 2Glaciology and topography of the study area (horizontal raster mesh resolution of grids stated in brackets): (a) RAMP2 ice surface elevation model (200 m) (Liu et al., 2015), (b) BedMachine bed elevation model (500 m) (Morlighem et al., 2020), (c) MEaSUREs ice flow velocity (450 m) (Rignot et al., 2017), and (d) BedMachine ice thickness (1 km) (Morlighem et al., 2020).
Ice flows from the high-ice-surface topography of the upper catchment of the Evans Ice Stream and from the Ellsworth Mountains (Fig. 2a and c). The Evans and Rutford ice streams occupy troughs up to 2200 m deep (Fig. 2b and c). The region is bounded by two areas of alpine-like topography, including overdeepened U-shaped valleys and headwall cirques: at the base of the Antarctic Peninsula to the northeast and the Ellsworth Mountains to the southwest. The two ice streams have significantly faster ice flow (> 600 m yr−1) close to the grounding line, in contrast with slowly flowing and almost stagnant ice overlying the higher-elevation points (> approx. 400 m elevation) and within Carlson Inlet (Fig. 2c).
Although there have been local-scale glaciological investigations into the physical properties, dynamics, and subglacial environments of the Rutford Ice Stream (Smith et al., 2015; King et al., 2016; Minchew et al., 2018; Schlegel et al., 2021), studies of the subglacial topography of the wider region are limited or pre-date modern survey data (Doake et al., 1983). Therefore, to understand the regional subglacial topography, we used spatially extensive radio-echo sounding (RES) surveys conducted by the British Antarctic Survey (BAS), including the 2006/07 GRADES-IMAGE, the BAS 1994/95 Evans, and 2001/02 TORUS (Targeting ice stream Onset Regions and Under-ice Systems) surveys. These campaigns provided approximately 48 000 line km of coverage over parts of the Antarctic Peninsula, Ellsworth Mountains, and Evans and Rutford ice streams, as well as opportunistic surveys of the Korff and Skytrain ice rises (Corr, 2021; Frémand et al., 2022). Airborne RES data compilations, which include these three RES surveys, have been used to produce gridded bed elevation models for the Weddell Sea sector of the WAIS, including in Bedmap2 and BedMachine (Fretwell et al., 2013; Morlighem et al., 2020; Jeofry et al., 2018), but the detail of the regional landscape has not been interpreted in the context of landscape evolution. Previous utilisation of the RES data from the GRADES-IMAGE survey has led to the identification of “sticky spots” beneath the Evans Ice Stream (Ashmore et al., 2014), as well as water piracy between the Rutford Ice Stream and Carlson Inlet from the TORUS data (Vaughan et al., 2008).

Figure 3Subglacial topography from BedMachine (Morlighem et al., 2020) overlaid with key West Antarctic geological provinces (red outlines) including the (i) Antarctic Peninsula–Thurston Island (TI), (ii) Weddell Sea province, and (iii) West Antarctic Rift System (Jordan et al., 2020). Dashed black lines mark sub-province boundaries, including the Haag block (H) and Ellsworth Whitmore Mountains (EWM). Black box locates Fig. 1.
1.1 Tectonic history of the Evans–Rutford region
Geologically, the study area lies at the junction of the three main provinces forming West Antarctica (Fig. 3): the Antarctic Peninsula–Thurston Island, the Weddell Sea province, and the West Antarctic Rift System–Marie Byrd Land (Jordan et al., 2020). Marie Byrd Land extends westwards from Ellsworth Land and the West Antarctic Rift System to the Ross Ice Shelf. The Weddell Sea province comprises the marine Weddell Sea Rift System, together with the onshore highlands of the Haag Nunataks block and the Ellsworth–Whitmore Mountains block. The Weddell Sea province was one of the regions of Antarctica most impacted by the break-up of Gondwana initiated in the Jurassic (Jordan et al., 2020).
The majority of the West Antarctic crust developed between 500 and 90 Ma, along an active ocean–continent convergence zone that bordered the ancient Pacific margin of Gondwana (Jordan et al., 2020). During the break-up of Gondwana, the four major crustal units making up the exposed rocks of West Antarctica, namely the Antarctic Peninsula, Thurston Island, the Ellsworth–Whitmore Mountains (EWM) including the Haag block, and Marie Byrd Land (Fig. 3), moved outwards from the margin of the East Antarctic craton towards the convergent Pacific margin (Dalziel and Lawver, 2001). This movement of crustal blocks during the early stages of Gondwana break-up may have been driven by an upwelling mantle plume, triggering a major pulse of magmatism and the break-up of the Gondwana supercontinent (Jordan et al., 2017; Jordan et al., 2020; Maslanyj and Storey, 1990).
The EWM block is a large crustal block that is allochthonous with respect to other parts of West Antarctica (Dalziel et al., 1987; Maslanyj and Storey, 1990), and its origin is subject to some debate. Some interpretations suggest that the EWM block was originally located in a position ∼ 1500 km further north adjacent to both the Antarctic and South African margins, with rotation into its current position taking place during Late Triassic or Early Jurassic crustal shearing as Gondwana break-up was initiated (Curtis and Storey, 1996; Dalziel, 2013). Others propose a less far travelled model, where the EWM block was located 500 km northeast of its current location and was rifted from East Antarctica by extension and transferred to West Antarctica (Jordan et al., 2017).
Regardless of the uncertainties around the initial position of the EWM block, its movement resulted in an extensional rift system (the Weddell Sea Rift System) that developed between the moving Haag–Ellsworth–Whitmore block and East Antarctica. This extensional rifting created major fault systems, with extended and modified crust, forming the floors of the Weddell Sea embayment (Dalziel and Lawver, 2001). The thermal age of the stretched continental crust below the Filchner–Ronne Ice Shelf has been dated to 230 to 165 Ma, which is in good agreement with the timing of Gondwana break-up (Jones et al., 2002; Studinger and Miller, 1999). Therefore, the broad assembly of the microcontinental blocks (Haag, EWM, Antarctic Peninsula) in the Evans–Rutford region (Fig. 3) was likely to have been completed within the Jurassic, with the latest time being approximately 165 Ma, the youngest thermal age of the crust underlying the Filchner–Ronne Ice Shelf.
Following this Jurassic assembly, thermochronometry data indicate that the Ellsworth Mountains experienced significant exhumation during the Early Cretaceous between ca. 145 and 117 Ma, uplifting by 4 km or more (Fitzgerald and Stump, 1991, 1992), following the initial separation of east and west Gondwana and closely following the opening of the Weddell Sea. Subsequent post-Early Cretaceous uplift and denudation have been constrained to a maximum of 3 km. However, it has not been distinguished whether this occurred gradually or in a short-lived pulse (Fitzgerald and Stump, 1992, 1991). Following assembly, the landscape has been modified by subaerial, and subsequently subglacial, processes.
1.2 Geomorphological evidence of erosional surfaces beneath the Antarctic Ice Sheet
An understanding of the past landscape evolution of a region can be gained by investigating remnants of ancient landscapes preserved beneath the ice sheet. The preservation of pre-glacial landscape remnants beneath the Antarctic Ice Sheet is most likely where the direction of ice flow under a selective erosion regime remains consistent over multiple glacial cycles. Under such conditions, warm-based erosive ice remains focused on pre-existing valleys and thin, slowly flowing, and cold-based ice can be present in adjacent areas of higher topography (Sugden, 1978). Therefore, ancient landscapes could have been preserved under cold-based ice throughout the Cenozoic despite having been subject to, for example, 58 glacial cycles during the last 13 Myr (Naish et al., 2009).
Features associated with selective linear erosion are flat surfaces with intervening troughs, which suggest the inheritance of pre-glacial topographic structure and provide insight into the co-evolution of the regional landscape and ice sheet (Sugden, 1978). Low-relief flat surfaces reflect potential relict non-glacial surfaces that have been preserved in the landscape (Goodfellow, 2006), in contrast to the overdeepened subglacial troughs which reflect the location of past erosion (Cook and Swift, 2012). Moreover, the presence of linear landscape breaks, steep-sided basins, and sharply bounded planar surfaces (tilted or otherwise) can be used to infer the presence of likely geological faults (Burbank and Anderson, 2012).
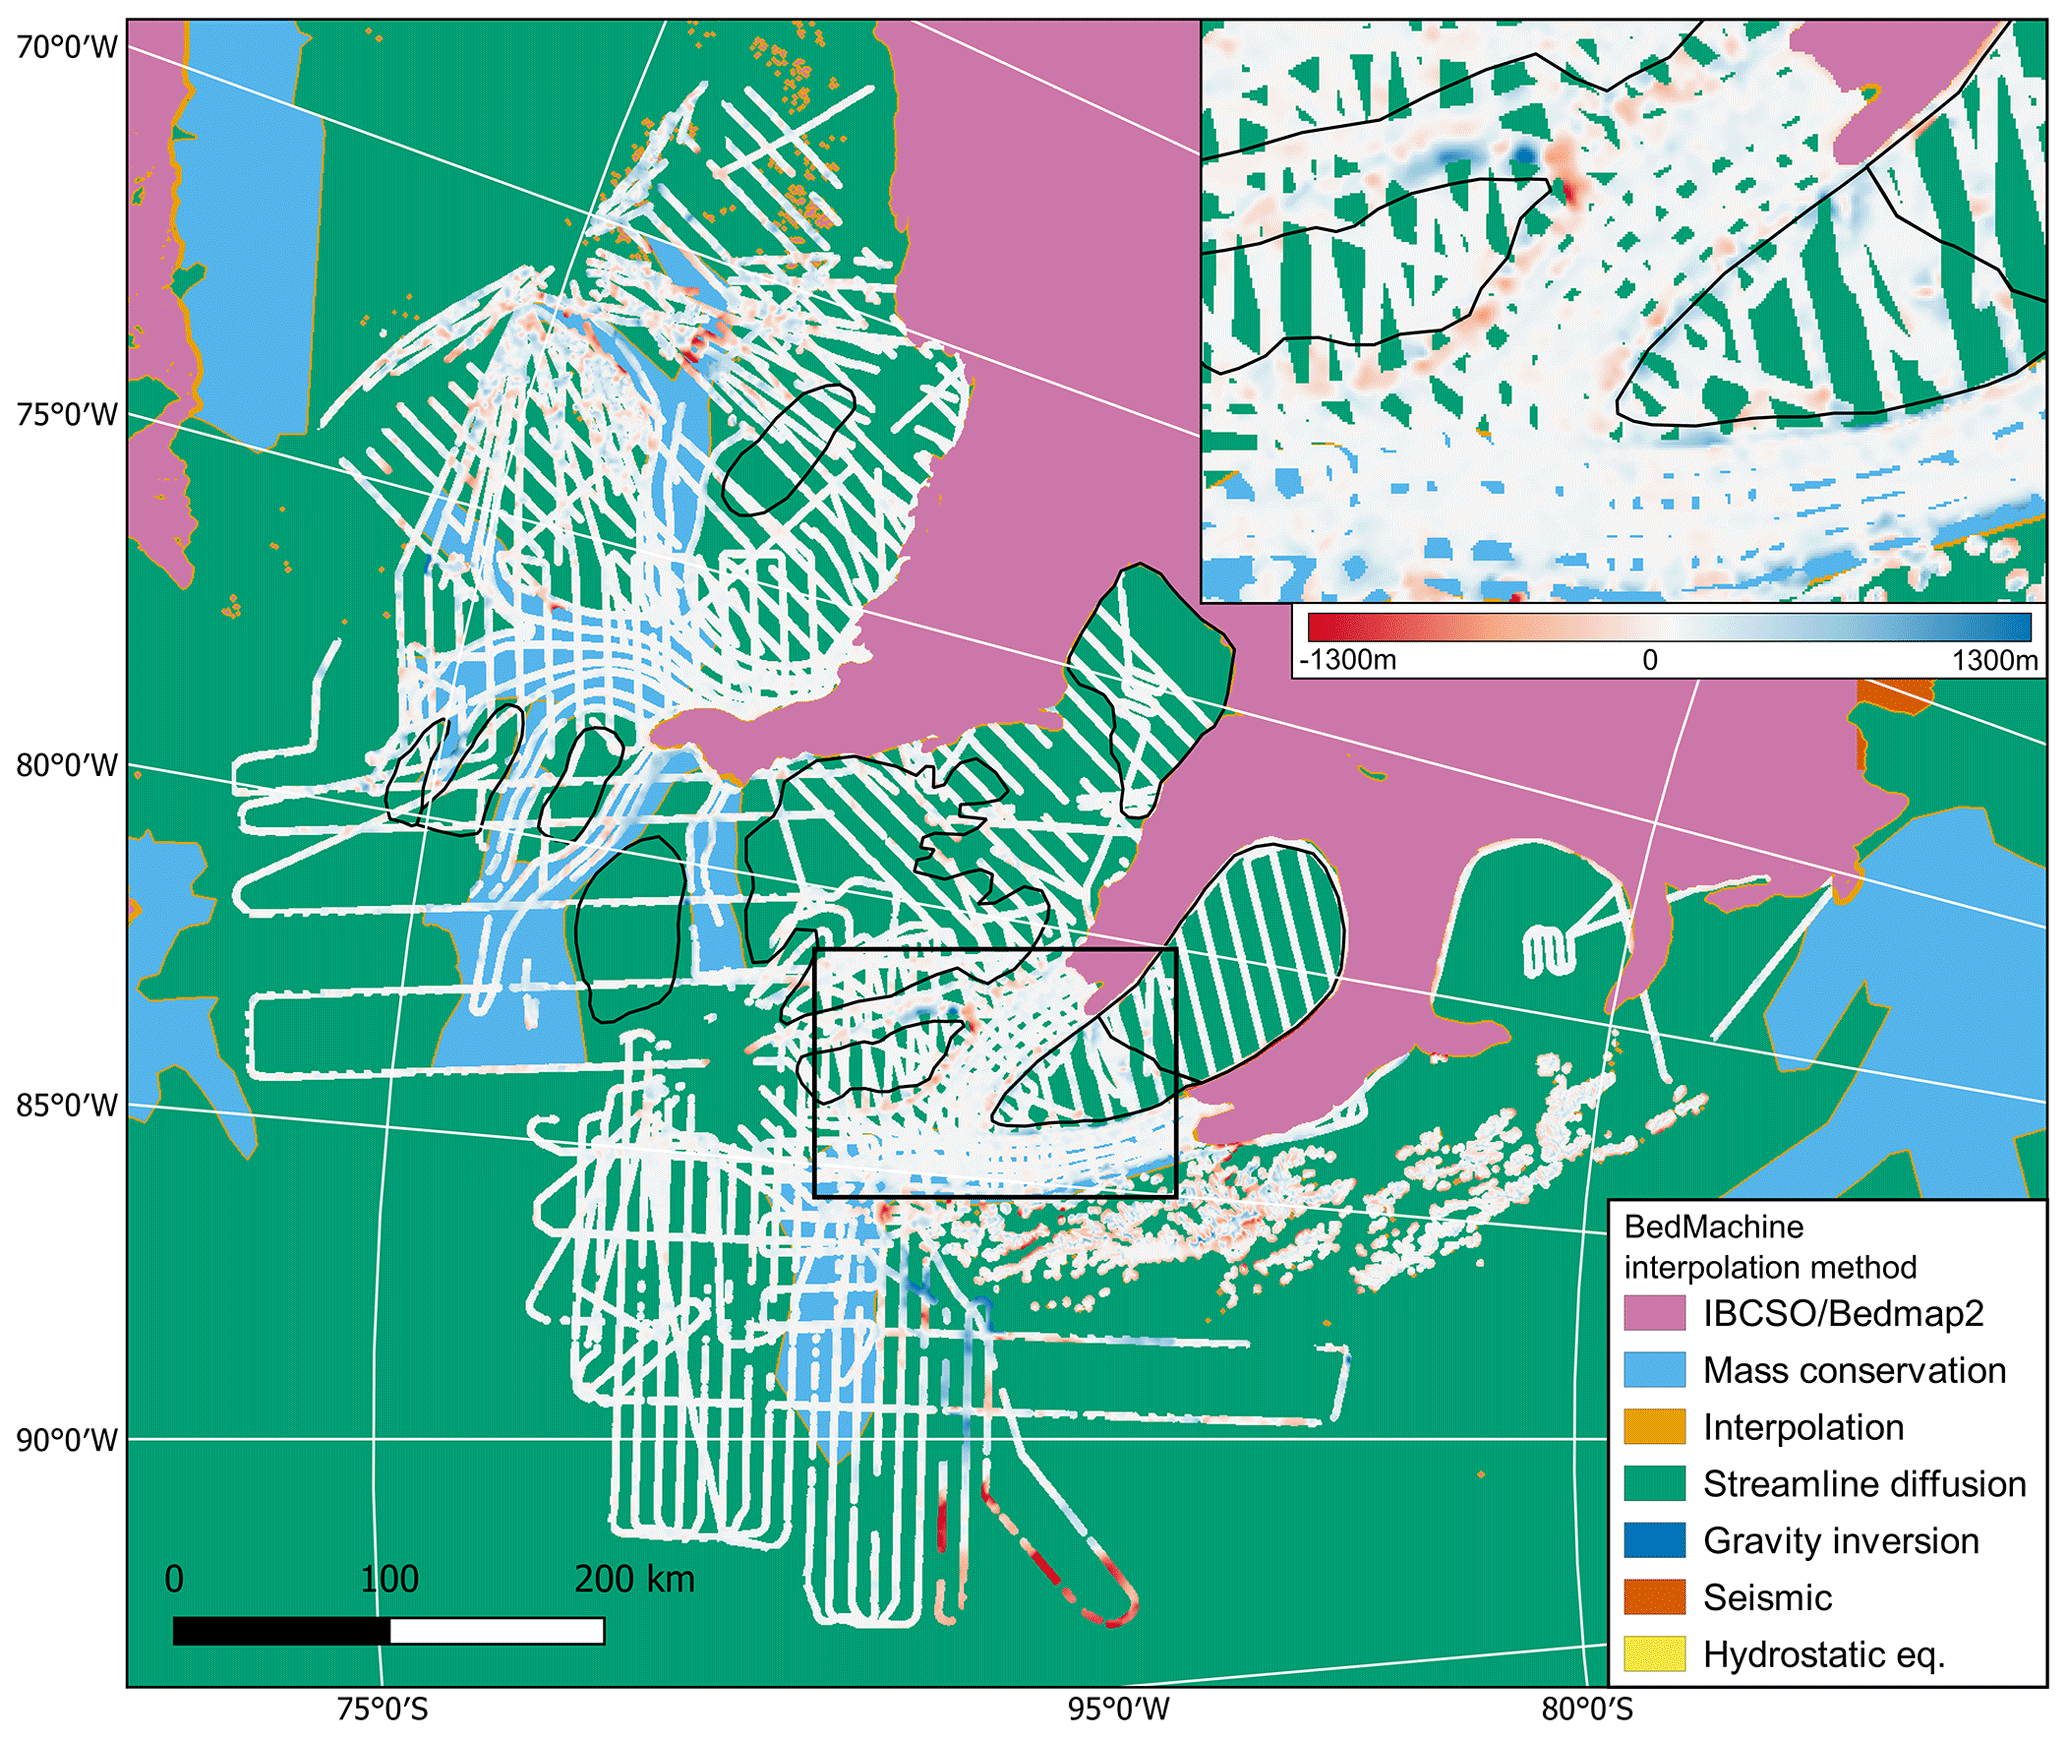
Figure 4Difference between BedMachine bed elevation and our picked bed elevation radar line data from the GRADES-IMAGE, TORUS, and Evans surveys. The legend shows different interpolation methods used in compiling the BedMachine topography (Morlighem et al., 2020). Black lines illustrate the grounding line derived from BedMachine (Morlighem et al., 2020). The colour ramp shows the difference between BedMachine and our picked line data. Reds show areas where BedMachine topography is lower; blues show areas where BedMachine topography is higher. The inset shows details of the mid-Rutford Ice Stream and Carlson Inlet. The biggest differences occur around the edges of plateaus and troughs and in the area of the TORUS survey. Inspection of individual radargrams shows that prominent breaks in topography are smoothed in BedMachine, and so we use our line data in our analysis.
To understand the landscape evolution of the Evans–Rutford region, the objective of this study was to conduct geomorphological analysis of the landscapes recorded in the RES data. We used the picked radar line data in preference to the BedMachine DEM (Morlighem et al., 2020) for three reasons that are specific to our study and type of analysis. Firstly, our focus in this study is mapping the detailed extent and morphology of geomorphological features with prominent edges such as troughs and plateaus. Close inspection of the difference between BedMachine and our picked line data shows that the line data better represent the edges of features, which are often smoothed in BedMachine (Fig. 4).
Secondly, our approach requires hypsometric analysis and so necessitated the minimisation of interpolated elevations that might smooth any frequency modes or “peaks” in the hypsometry. Thirdly, part of the area of our study is covered by the TORUS survey, which does not appear to be included in the BedMachine compilation (Morlighem et al., 2020). All of our quantitative analysis is carried out only on the picked and interpolated line data (see Sect. 2.2), but we use BedMachine in figures to illustrate broad topographic patterns. The subglacial topography derived from the interpolated RES surveys was analysed to classify the landscape of the study region (Jamieson et al., 2005), identify the geomorphic processes that have operated in the region, and reconstruct how the present subglacial topography formed.
2.1 RES datasets
The Twin Otter aircraft used during the GRADES-IMAGE survey was equipped with the British Antarctic Survey's PASIN (Polarimetric radar Airborne Science INstrument) radar system (Corr et al., 2007; Frémand et al., 2022). The aircraft was equipped with dual-frequency carrier-phase GPS for navigation (with an absolute GPS positional accuracy of 0.1 m), wing-tip magnetometers, and a radar altimeter for surface mapping. The instrumentation and initial processing of the RES data are outlined in Corr et al. (2007), Jeofry et al. (2018), and Frémand et al. (2022), with key aspects summarised below.
The PASIN system was operated with a centre frequency of 150 MHz and used two interleaved modes: a 4 µs, 10 MHz bandwidth, linear deep-sounding chirp and a 0.1 µs unmodulated shallow-sounding pulse. Along-track data were collected at a post-processing trace spacing of 20 m and vertical resolution of 8.4 m (Frémand et al., 2022). Compression of the chirp data, best used to assess the bed in deep-ice conditions, was applied using a Blackman window to minimise sidelobe levels and then processed using a coherent averaging filter along a moving window of length 15 (Corr, 2021). Synthetic-aperture radar (SAR) focusing was not applied to the data. Surface elevation was derived from the radar altimeter for ground clearance of less than 750 m and from the PASIN system for higher altitudes. Bed elevation values presented here are all referenced to the WGS84 ellipsoid.
The bed reflector was semi-automatically picked from the chirp data, using a first break picker below a top-mute window of ∼ 100 samples above the approximate bed reflection in the ProMAX software package (Frémand et al., 2022). In the event of multiple reflections at the ice–bed interface, the first reflection was assumed to be the bed except in areas where earlier reflections clearly represented areas of entrained debris or obvious processing artefacts (Frémand et al., 2022). Whilst the pick data were manually checked, the semi-automatic bed pick algorithm applied to the GRADES-IMAGE survey did result in some gaps and errors in the data, which were corrected where identified. However, due to the size of the dataset (27 550 line km), not all pick errors will have been identified. We manually reviewed and corrected the published GRADES-IMAGE data for erroneous bed reflection picks, which applied to approximately 10 % of total line length, using the software ReflexW. Most commonly, this applied to sections where the semi-automatic picker produced a bed pick but where no clear bed reflection was apparent in the RES data. Sources of error within the picked bed reflections can arise from surface clutter returns masking the echoes of the ice–bedrock transition at depth or from diffraction hyperbolae caused by an unfocused return of the energy. These would make the ice–bed interface reflection unclear and difficult to identify (Frémand et al., 2022; Napoleoni et al., 2020).
Picked travel time was converted to depth using a radar wave velocity through ice of 168 m µs−1 (as used in all BAS data; Frémand et al., 2022). A constant firn correction of 10 m was applied to correct for uncertainties in the speed of electromagnetic waves through the firn layer (e.g. Ross et al., 2012).
To increase the spatial coverage and point density of the bed elevation picks within the region of study, bed pick data from the BAS 1994/95 Evans and 2001/02 TORUS RES surveys were also used (Corr, 2020; Corr and Smith, 2020; Frémand et al., 2022). Combined, these two surveys collected a total of ∼ 20 000 line km of RES data over the Evans and Rutford ice streams using the coherent “BAS-built” radar system, a low-power predecessor of the PASIN system that operated with the same frequency and pulse modes as PASIN (Corr and Popple, 1994; Frémand et al., 2022).
Exposed bedrock data points were also added from the Reference Elevation Model of Antarctica (REMA) (Howat et al., 2019) so that exposed subaerial local- and regional-scale bedrock features such as nunataks or mountain ranges were included in the interpolated data points. These data were extracted from REMA v1 (Howat et al., 2019) using a bedrock mask derived from automated analysis of Landsat 8 imagery (Burton-Johnson et al., 2016a). The combined RES and subaerial datasets created a bed elevation point dataset covering ∼ 50 000 km of line data spanning large parts of the southern Antarctic Peninsula and WAIS (Fig. 1).
2.2 Interpolation of RES lines
Interpolation of bed elevation datasets derived from RES surveys has utilised a range of gridding algorithms, for example, natural-neighbour interpolation (Ross et al., 2012; Young et al., 2011), kriging (Aitken et al., 2014; Rippin et al., 2004; Fretwell et al., 2013; Jeofry et al., 2018), and minimum curvature gridding (Bianchi et al., 2003). Additionally, gridding techniques using tension spline algorithms have produced realistic DEMs of similar subglacial topography close to our study region (Paxman et al., 2018, 2019; Napoleoni et al., 2020). Such splining methods are commonly used with irregularly distributed data confined to discrete transects in order to create a grid of the inferred subglacial bed topography (Young et al., 2011). Given the irregular distribution of our survey data, we applied a continuous bivariate cubic spline algorithm to interpolate the radar lines. This was carried out in order to better illustrate the more precise data points given from the direct observations of the bed. The interpolated radar lines were generated at a spatial resolution of 500 m, and because of higher uncertainty with increased distance away from the directly surveyed points, we masked the interpolation at a radius of 2 km from each bed elevation point location in a similar method to those of Napoleoni et al. (2020) and Paxman et al. (2019). Whilst not producing a continuous DEM, the interpolation of the radar lines provides a more direct measurement of the morphology of the bed topography.
2.3 Terrain analysis
In order to understand landscape evolution, we used our buffered interpolated data to map macro-scale landforms across the study area, with additional interpretation of radargrams to assess detailed topographic morphology along profiles. This initial classification was aimed at identifying the presence of flat surfaces, troughs, and alpine glacial features within the study area.
We delineated valleys and troughs as linear features with high relief (Jamieson et al., 2014). Flat surfaces were mapped as continuous low-angle surfaces with low local relief which are characterised by a sharp break in slope at their edges with lower-elevation valleys on at least one steep side (Wilson and Luyendyk, 2006).
Troughs surrounding the surfaces were separated into different morphological types. Firstly, the widest troughs with more gently sloping trough walls were identified as U-shaped from the RES cross-profiles. Potential fault-bounded troughs were identified where linear, steeply sloping trough walls with excavation at the base were evident. Troughs with two thalwegs close to the slope breaks and a central topographic rise, giving the floor a W-shaped profile, were also identified. V-shaped troughs – often asymmetric – were commonly situated between surfaces, with intersecting RES profile lines showing V-shaped cross-sections with steep slopes and clear thalwegs. The thalwegs were mapped using profile lines across each channel to find the deepest section.
Hypsometric analysis was also undertaken to analyse the frequency distribution of elevations and highlight where there are significant areas of land at particular elevations. The distribution of area versus altitude can offer opportunities to study the dominance of particular processes within a landscape (Jamieson et al., 2014; Rose et al., 2013). For example, the presence of U-shaped valleys cut to a particular elevation or the presence of flat surfaces across a region might result in a peak in area–elevation distribution because of the relatively flat valley floors of those glacial troughs. Hypsometry was therefore calculated for the interpolated radar lines.
2.4 Analysis of pre-glacial topography
Given the possibility that remnants of pre-glacial topography can survive within the modern subglacial landscape (Sugden and Jamieson, 2018), we generated an ice-sheet-unloaded version of the topography in order to identify landscape components that may have existed prior to glacial inception. To do so, we adopted a recent calculation of the isostatic response to the complete unloading of the Antarctic Ice Sheet, computed using a flexed elastic plate model with a laterally variable effective elastic thickness of the lithosphere (Paxman et al., 2022a). The effective elastic thickness in this model exhibits relatively low values of 10–20 km in the Evans–Rutford region (Swain and Kirby, 2021). We added this correction to the present-day bed, yielding rebounded topography under ice-free conditions, which was then subjected to hypsometric analysis. The isostatic adjustment model does not account for vertical movements arising from the isostatic response to glacial erosion or glacio-tectonic interactions.

Figure 5Regional subglacial topography of the Evans–Rutford region. The background is BedMachine (Morlighem et al., 2020) but with our interpolated radar lines (outlined in black) of the Evans–Rutford region surveys overlaid, along with mapped plateau surfaces and troughs. The colour scale is saturated at −1.5 and 1.5 km in order to highlight the elevations of the surfaces in relation to the surrounding topography.
Table 1Zonal statistics calculated for each individual plateau surface derived from interpolated radar lines. Overlying ice flow velocity derived from MEaSUREs (Rignot et al., 2017).

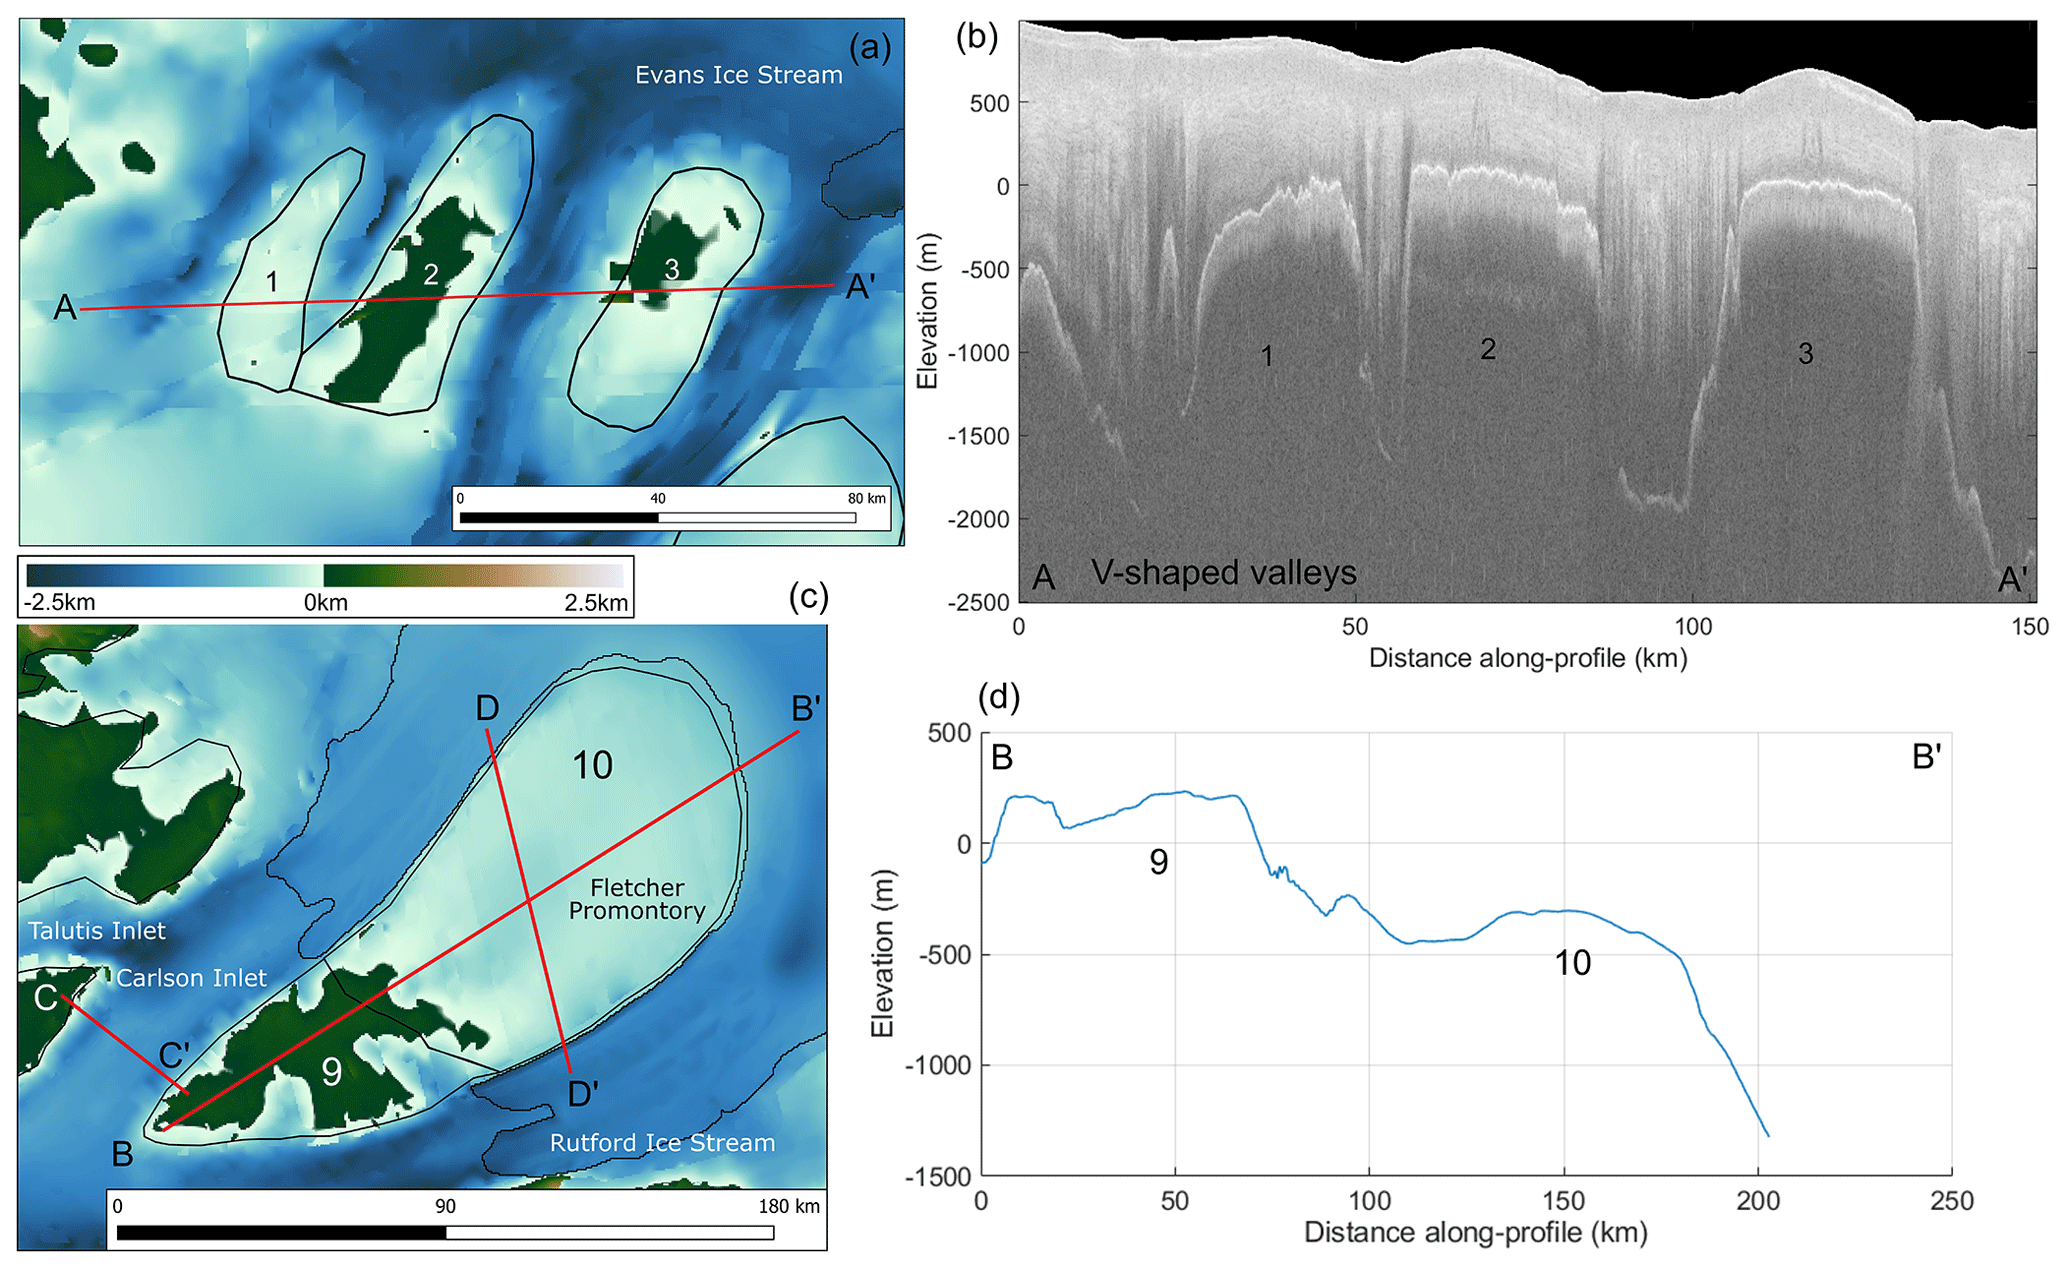
Figure 6(a) Profile line (A–A′, displayed in red) over plateau surfaces 1–3. (b) Radargram illustrating plateau surfaces 1–3 along profile A–A′. (c) Profile line (B–B′, displayed in red) over the Fletcher Promontory, plateau surfaces 9 and 10. Profile lines C–C′ and D–D′ illustrate the locations of radargrams in Figs. 7 and 9. (d) Interpolated elevations from BedMachine subglacial topography data (Morlighem et al., 2020) along profile B–B′. BedMachine data were used for this profile as there were no directly overflown flight lines from the GRADES-IMAGE RES survey.
3.1 Flat surfaces
We identified 10 distinct flat surfaces across the Evans–Rutford region between the Antarctic Peninsula and the Ellsworth Mountains (Fig. 5). The area of each surface ranges from 650 to 11 032 km2 (Table 1). Mean flat surface elevations are referenced to the WGS84 ellipsoid and range between −476 and 165 m. Clusters of similar mean elevations across multiple surfaces are also evident. For example, surfaces 7 and 9 have mean elevations at −62 and −60 m, respectively (and are located close to one another in the southwestern part of the study area). The lower-lying surfaces 4 and 8 have mean elevations of −476 and −456 m, respectively. Surfaces 1, 2, and 3, which are close neighbours in the northern part of the study area, sit at mean elevations within a range of less than 50 m. Mean slopes across the surfaces are all < 5°. The mean flow speed of the ice overlying the surfaces ranges between 7.3 and 22.8 m yr−1, with mean ice thicknesses ranging between 654 and 1252 m. Two potential flat surfaces beneath the Korff and Skytrain ice rises, at broadly similar elevations to the other identified surfaces, are also indicated by additional exploratory RES data.
The RES data suggest that the majority of the 10 “plateau” surfaces are extremely flat (Fig. 6a and b). In contrast, the topography of surface 6 is more variable, with a small peak on its eastern side and low-relief peaks and troughs across its surface. The margins of surface 6 are also more crenellated in comparison to the linear margins visible in the other surfaces (Fig. 5). The subglacial topography of the Fletcher Promontory consists of two surfaces (9 and 10) situated at two different elevations (200 and −400 m, respectively) separated by a step with a relief of ∼ 600 m (Fig. 6c and d).
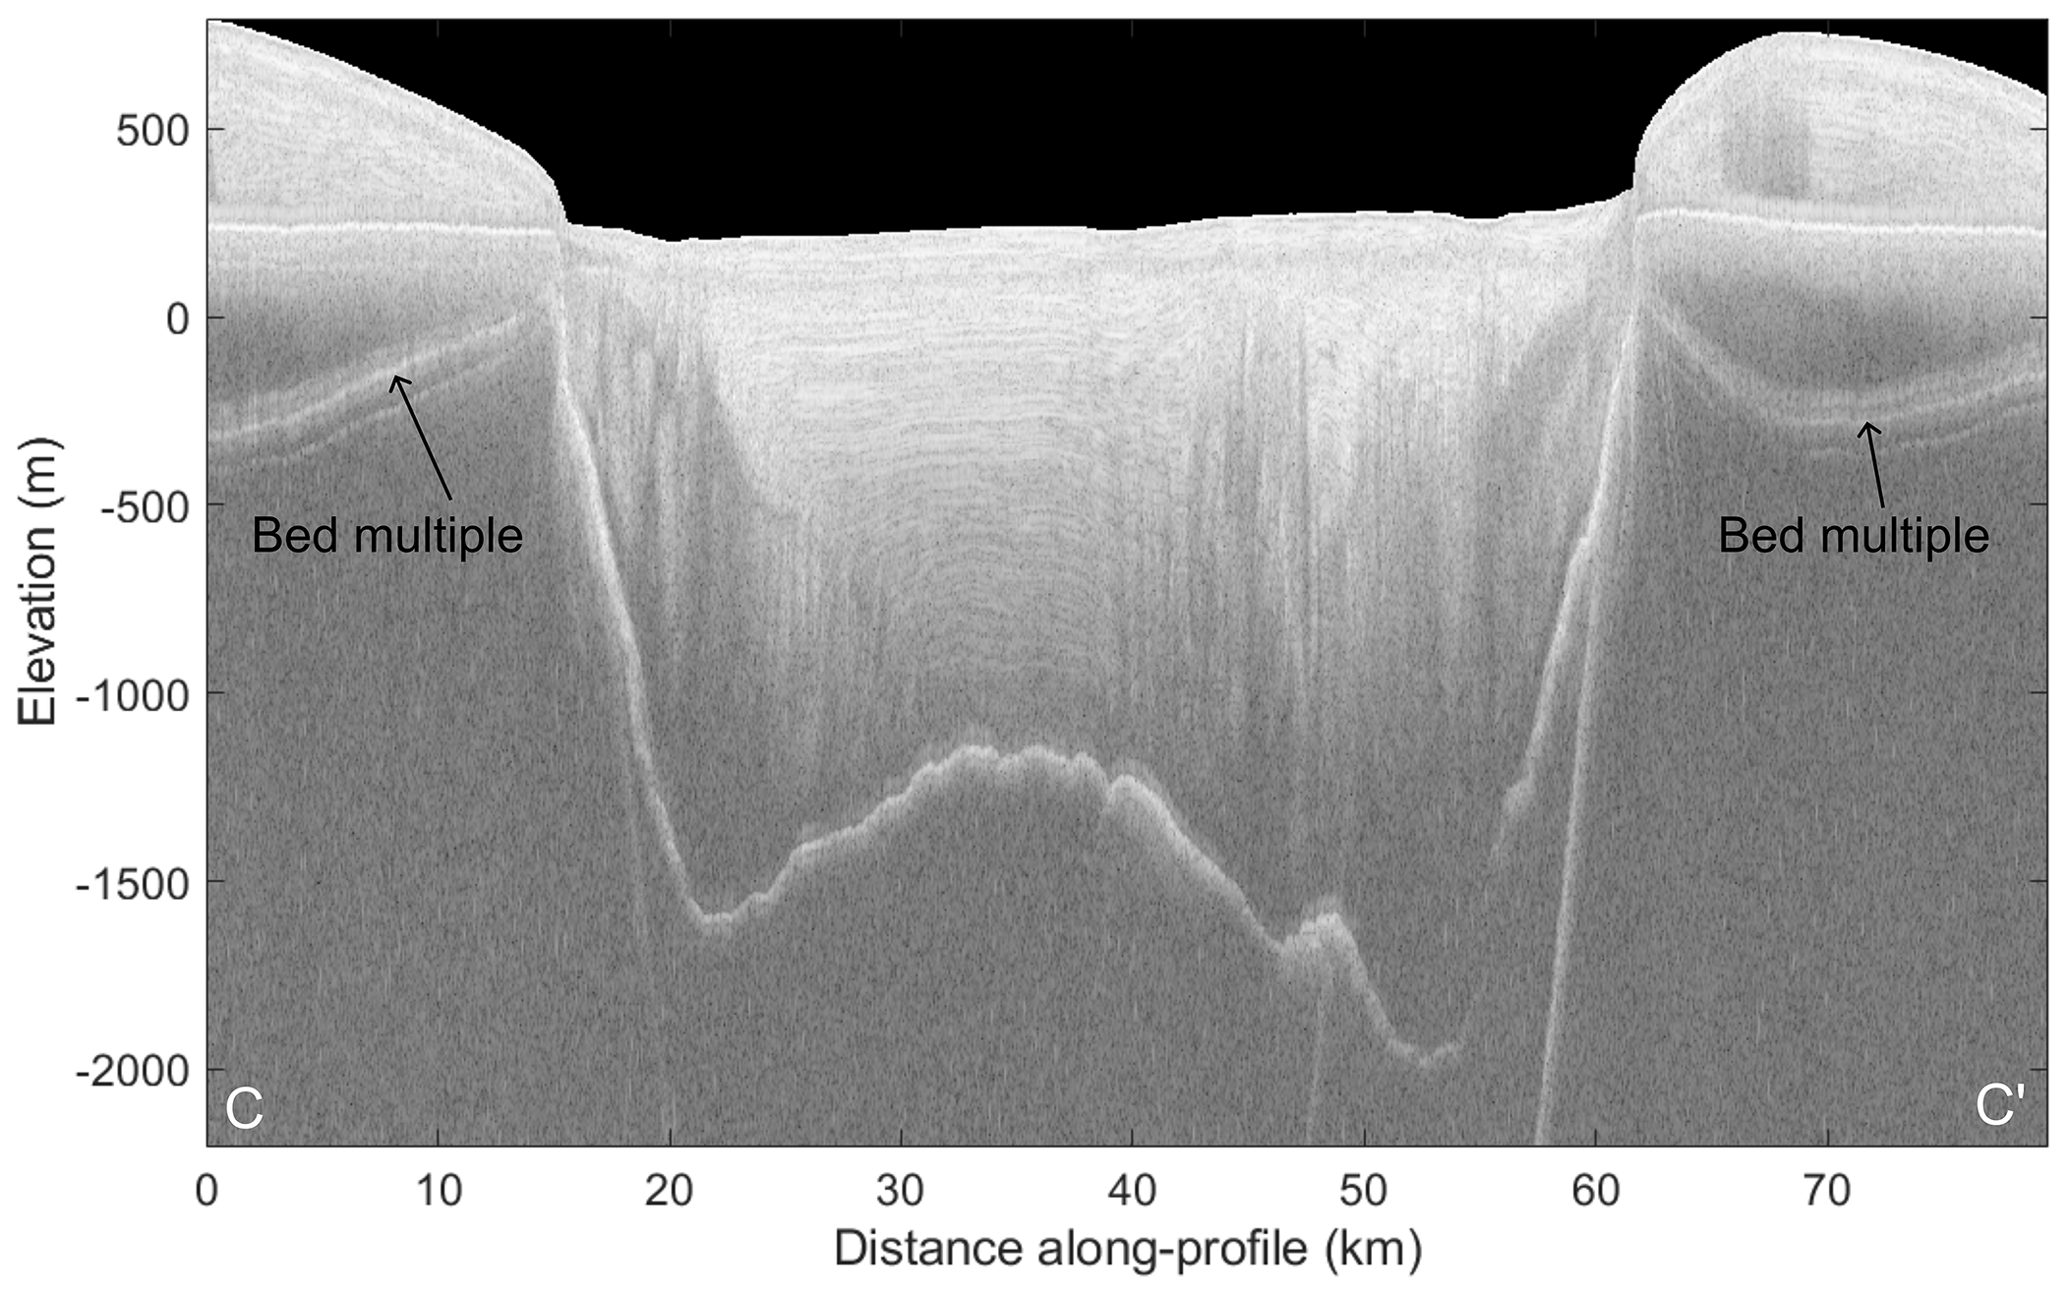
Figure 7Radargram demonstrating the W-shaped cross-profile in the Carlson Inlet trough. Location of the C–C′ profile line is illustrated in Fig. 6c. Bed multiples are due to an additional reflection between the initially transmitted radar wave with the ice surface and the aircraft.
3.2 Troughs
Throughout the Evans–Rutford region, three distinct trough morphologies are present. Troughs in the study area are linear valley features, mostly V- or W-shaped with abrupt, steep margins and some gently sloping U-shaped. Some of these troughs are presently occupied by fast-flowing ice, reaching a maximum of 641 m yr−1 in the Evans Ice Stream, whereas some contain slowly flowing ice (e.g. ∼ 0.2 m yr−1 in Carlson Inlet). The Rutford Ice Stream and Carlson Inlet, which surround the Fletcher Promontory (Fig. 5), are hosted by troughs that appear to be fault-bounded. The cross-profiles of these troughs have a W shape (Fig. 7), as the subglacial bed is deepest directly adjacent to the base of the trough walls with a raised ridge in the centre of the trough. The trough walls are linear and reach a maximum slope of ∼ 46°.
V-shaped asymmetric troughs are present between surfaces (e.g. Fig. 6b), with one containing Talutis Inlet (Fig. 1). The thalwegs of these troughs are offset from the centre of the valley, with a steeper trough wall closer to the line of the thalweg. The widths of these troughs average between 10.2 and 12.1 km across the top, with maximum relief ranging from 1398 to 2424 m. Wide U-shaped troughs contain the tributaries of the Evans Ice Stream, ranging between 20 and 70 km at their widest point.

Figure 8(a) Interpolated radar lines displayed in colour-categorised symbology relating to hypsometric peaks. Plateau surfaces are outlined in black, and these and the line data are displayed over hillshade BedMachine subglacial topography map (Morlighem et al., 2020). (b) Hypsometric curve of the line data classified according to significant peaks (coloured bars on right elevation scale correspond to colours in panel a). Values of significant peaks are marked. (c) Hypsometric curve derived from the isostatically rebounded digital elevation model of line data with significant peak values marked.
3.3 Hypsometry
The hypsometric curve derived from the interpolated radar lines contains three significant peaks in hypsometry at 171, −328, and −728 m (Fig. 8b). The non-rebounded dataset (Fig. 8a) illustrates where the areas contributing to these hypsometric peaks occur within the landscape. The highest-elevation surface population is situated between −50 and 500 m, whilst the mid-elevation surface population ranges from −550 to −50 m. The lowest-elevation hypsometric peak is associated with the geographic east side of the Evans Ice Stream and the onset zone of the Rutford Ice Stream. The elevations below all three hypsometric peaks can be attributed to the deeper western inland side of Evans and its tributaries, as well as the troughs containing the Rutford Ice Stream, Carlson Inlet, and Talutis Inlet.
In contrast to the three peaks in the present-day subglacial topography, the hypsometry of the rebounded topography (Fig. 8c) only demonstrates two significant peaks. The higher of these lies between 182 and 582 m, with a modal value of 382 m. The lower peak in hypsometry is most prominent at −217 m but ranges between −417 and −17 m. This indicates that some of the previously separate populations in the non-rebounded topography merge into a smaller number of populations when the landscape is rebounded. The majority of the flat surfaces have remained in the same population as in the non-rebounded hypsometry, although the hypsometric peak containing the lower surfaces has merged with the peaks representing the lower elevations of the troughs.
The uncertainty in the rebounded elevations of the surfaces ranges from 42 to 100 m (Paxman et al., 2022b). However, given that effective elastic thickness varies over relatively long wavelengths (> 100 km) in this region (Swain and Kirby, 2021), the surfaces will be near-equally affected by any uncertainty. Therefore, the uncertainty could have a minor effect (tens of metres) on the elevation of the hypsometric peaks but would not diffuse the peaks. The low effective elastic thicknesses used in the isostatic rebound calculation for the Evans–Rutford region (Paxman et al., 2022b) have been reported in multiple studies (Jordan et al., 2010; Chen et al., 2018; Swain and Kirby, 2021) and are at the lower end of the range used by Paxman et al. (2022b) to generate uncertainties. Therefore, we consider these uncertainties to be maximum values for this region.
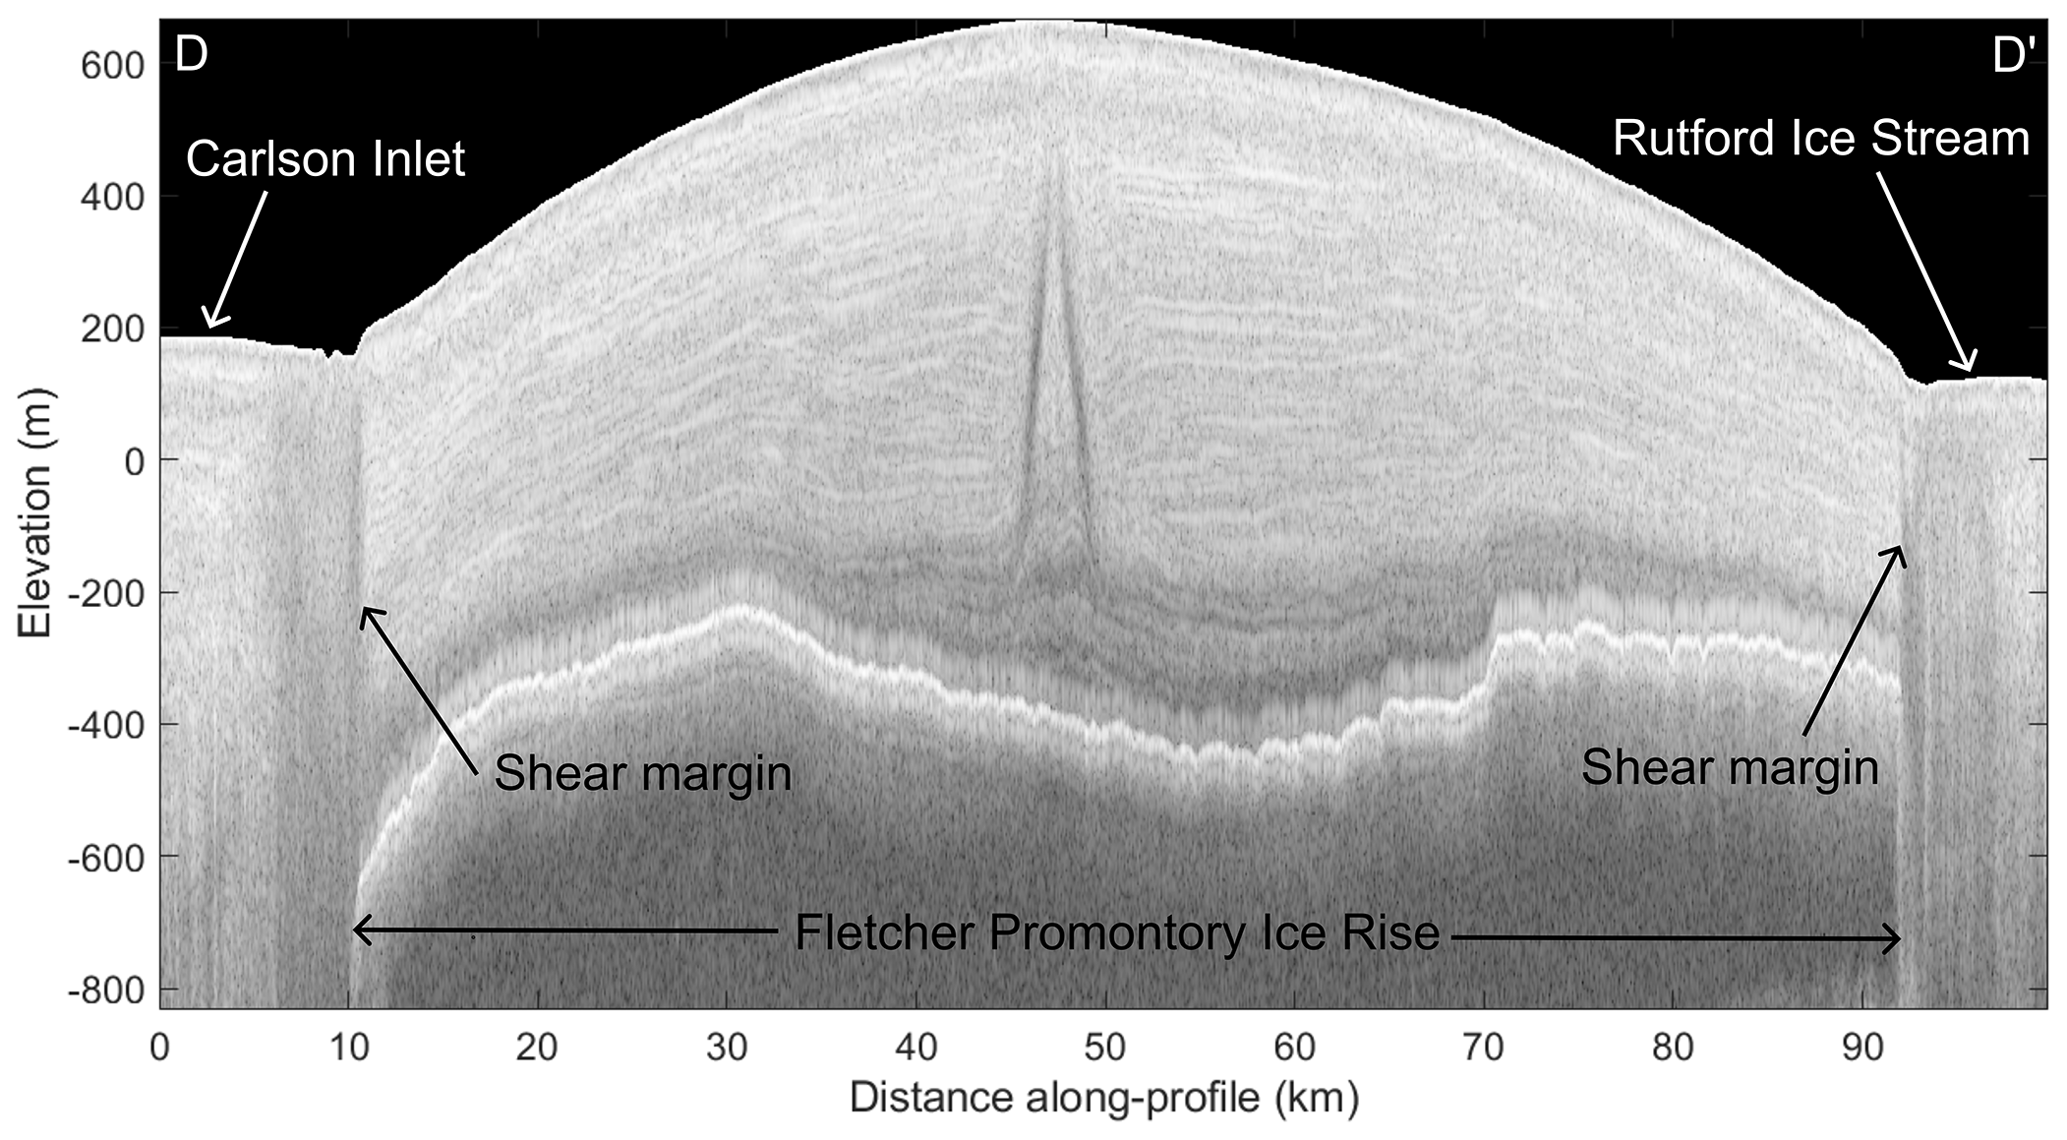
Figure 9Radargram illustrating continuous undisturbed layering overlying the Fletcher Promontory flat surface. Location of the D–D′ profile line is illustrated in Fig. 6c. The centre of the Fletcher Promontory demonstrates a well-developed Raymond bump, indicating an ice-divide triple junction (Hindmarsh et al., 2011).
4.1 Extensive (and ancient?) palaeo-surfaces beneath the Evans–Rutford region
Our mapping and hypsometric analysis show for the first time that a number of regionally coherent low-relief surfaces exist beneath the WAIS in the Evans–Rutford region. These surfaces have remarkably constant elevation and gentle slopes with minimal relief. The hypsometric peaks of the surface populations occupy a narrow range of elevations, and show modal values of 171 m for the higher-elevation surfaces (surfaces 1, 2, 3, 5, 6, 7, 9) and −328 m for the lower surfaces (surfaces 4, 8, 10). When rebounded, the elevations of these hypsometric peaks shift upwards to 382 and −217 m, respectively. Given that there is no obvious way to form such regional surfaces under conditions of glacial erosion, the similarities between surfaces allow us to propose that they represent remnants of pre-glacial surfaces that were originally laterally continuous over hundreds of kilometres. The preservation of such topography is plausible via the mechanisms of selective linear erosion in the troughs that bound the surfaces, allowing regional ice to be discharged and cold-based preservation to occur across these surfaces (Sugden, 1968). The internal structure of the layering visible in the RES data (Fig. 9) appears flat and continuous and undisturbed throughout the ice column overlying the surfaces, which lends further support to the idea of non-erosive ice conditions. The lateral continuity of the englacial layering suggests that this low-velocity pattern has been stable through time, at least for as long as the current ice column has been accumulating (Siegert et al., 2003; Matsuoka et al., 2015).
The presence of two populations of surfaces is suggestive of downwearing of the upper surface to form a second, lower, surface. The morphology of the Fletcher Promontory (surfaces 9–10) is an example of this, where there is a 600 m change in elevation at an obvious “step” between surfaces 9 and 10 (Fig. 6d). A similar pattern is evident further east between surfaces 6 and 8. The more seaward surfaces (8 and 10) make up the lower surface (illustrated in white in Fig. 8a) and are also at a similar elevation to the surface under the Korff Ice Rise, which sits within the same hypsometric peak. The higher-elevation surfaces (1, 2, 3, 5, 6, 7, and 9; Fig. 8a) sit landward of the lower surface.
Similar extensive flat surfaces have been identified using RES data elsewhere in Antarctica including in the Wilkes Subglacial Basin (Paxman et al., 2018), the Weddell Sea embayment (Rose et al., 2015), the Ross Embayment (Wilson and Luyendyk, 2006), and Marie Byrd Land (LeMasurier and Landis, 1996). Common features of these surfaces are that they are laterally continuous over 10–100 km scales and demonstrate a flat and level (or at least low-angle) nature with low relief, often separated by linear troughs. Interpretations of the formational processes of these surfaces have involved passive-margin evolution with a retreating escarpment dividing two surfaces following the Gondwana break-up (Paxman et al., 2018) or marine erosion or wave action into the basement in the absence of glacial ice (Wilson and Luyendyk, 2006). Prolonged fluvial erosion down to a peneplain has also been proposed, the processes of which may have interplayed with marine planation (LeMasurier and Landis, 1996; Rose et al., 2015). A model of high-elevation, low-relief landscape formation as a result of river network disruption (Yang et al., 2015) could potentially apply; however, this seems unlikely given how extensive these surfaces are across the region. In any case, the erosional surfaces represent prolonged intervals of erosional levelling that must have taken place in a relatively stable tectonic environment (Beaumont et al., 2000; Brown et al., 2000).
4.2 Regional extent of flat surfaces
The Evans–Rutford flat surfaces are not the only ones to have been identified beneath the WAIS. The identification of similar pre-glacial surfaces preserved beneath the upstream regions of the neighbouring Institute and Möller ice streams (Rose et al., 2015), approximately 400 km to the south of our study area, indicates that these surfaces may extend across microplate boundaries, implying a timing of formation that was after plate convergence and assembly in the Jurassic–Cretaceous. The geometry of the Evans–Rutford region is comparable to the gently sloping, low-relief topographic block of the Institute–Möller region, which comprises two surfaces separated by a distinct break in slope. Marine and fluvial peneplain erosion models have been presented for the formation of these surfaces (Rose et al., 2015).
As is the case for our flat surfaces, the Institute and Möller erosional surfaces comprise a lower seaward surface and a higher landward surface. The Institute–Möller surfaces exhibit hypsometric peaks at 900 and 400 m b.s.l. (below sea level), a vertical offset of ∼ 500 m (Rose et al., 2015). These similarities are consistent with a similar formational process acting more widely around the Weddell Sea embayment.
4.3 Geological structures in the Evans–Rutford region
The morphology of the troughs containing the Rutford Ice Stream and Carlson Inlet demonstrates a W-shaped cross-profile, with near-vertical trough walls and a topographic ridge running centrally down-trough, aligned with the trough axis (Fig. 7). The troughs are also very linear and have abrupt changes in slope where they meet the flat surfaces. The features of these troughs can be characterised as representing a fault-bounded trough, similar to those found in George VI Sound (Smith et al., 2007). These linear bedrock depressions bounded by steep escarpments are indicative of faults (Garrett et al., 1987), where glacial erosion has been focused along fault-damaged rock at the base of the trough wall. Similar deep subglacial troughs have been described on either side of the Shackleton Range in East Antarctica, where the fast-flowing glaciers reflect the trend of, and have exploited, the subglacial fault systems (Paxman et al., 2017; Sugden et al., 2014).
Primarily, the troughs have been identified as a structural feature or tectonic valley, the topography of which has been subsequently modified by glacial activity (Smith et al., 2007). The coincidence of this morphology in the Rutford and Carlson troughs suggests a common process. The nature of the fault-bounded flat surfaces may suggest a block-faulted landscape, which can be produced by extension in rifted basins (Burbank and Anderson, 2012).
4.4 At what elevation might these surfaces have formed?
The isostatically rebounded interpolated radar lines reinforce the interpretation of two pre-glacial laterally continuous surfaces (Fig. 8c). The fact that isostatic rebound reduces the number of hypsometric peaks would be most consistent with two plateau surfaces forming pre-glacially but differential ice loading subsequently offsetting some of the surfaces. However, the isostatic adjustment model may not take into account all other processes that may have subsequently affected the elevation of these surfaces.
Processes capable of vertical displacement of the surfaces include processes driving uplift and some driving subsidence. Where selective erosion occurred within the glacial troughs, and with relatively little erosion occurring on the flat surfaces themselves, the flexural isostatic response to erosional unloading would have uplifted the flat surfaces (Summerfield, 1991). The pattern of this effect would be dependent upon the amount of glacial erosion and the flexural rigidity of the lithosphere. This region of West Antarctica is characterised by relatively low flexural rigidity, resulting in shorter-wavelength variability in isostatic uplift (Paxman et al., 2022b;, Swain and Kirby, 2021). Additional flexural uplift may have also been driven by mechanical unloading of the footwall by the hanging wall in any troughs bounded by extensional faults, as demonstrated in the Shackleton Range region (Paxman et al., 2017), although the sense of motion on the faults in the Evans–Rutford region is unclear. Both of these processes would have acted to increase the elevations of the flat surfaces. In other words, the pre-glaciation elevation of the flat surfaces was likely lower than the ice-rebounded hypsometric peak values of 382 and −217 m, meaning that the higher-elevation population of surfaces may have resided closer to palaeo-sea level at the inception of the Antarctic Ice Sheet. Our rebounded topography does not incorporate tectonics or the effects of rebound due to erosion, and so we are unable to quantify these effects. However, the surfaces in this region do not show systematic tilting, as is observed in the Shackleton Range, suggesting that fault-driven upwarping may be less important.
Conversely, two processes that may have caused post-formation subsidence of the surfaces include long-term thermal subsidence post-dating West Antarctic and/or Weddell Sea rifting (Wilson and Luyendyk, 2006) and long-term sediment loading in the Weddell Sea to the north and east (Hochmuth et al., 2020). A third process, which is not well constrained but can cause long-wavelength uplift or subsidence, is the effect of dynamic topography (Austermann et al., 2015). Therefore, it is likely that the pre-glacial elevations were different to the simple ice-unloaded values. The potential effects of these uplift and subsidence processes in the landscape evolution of the region are discussed further below.
The relative age of some of the events that formed the Evans–Rutford landscape can be discerned by the relationships of the different landscape elements. Firstly, the faults must pre-date the flat surfaces as the surfaces are not displaced across the faults. Secondly, the lower surface post-dates the higher surface into which it is eroded. Thirdly, the glacial troughs must post-date the surfaces, since they separate surfaces of accordant elevation. Given this sequence of events and what is known about the geological evolution of the region, as described in Sect. 1.1, potential hypotheses for the formation of the flat surfaces are presented below.
5.1 Passive-margin evolution
The first potential mechanism for the formation of the flat surfaces is through passive-margin evolution (Burbank and Anderson, 2012), where the upper surface forms through the initial topographic uplift and erosion associated with the continental break-up of Gondwana, with subsequent post-rifting scarp retreat forming the lower surface. The most prominent landforms resulting from continental break-up are high-elevation passive-margin escarpments. For example, the central Namibian margin demonstrates similar topographic elements of a well-defined major escarpment with a relief of 1000 m, separating a gently inclined coastal plain from an interior plateau (Cockburn et al., 2000). Passive-margin retreat of a similar lateral extent over hundreds of kilometres, as well as a similar timescale of movement post-Gondwana break-up, can be seen in the continental rifting between South America and Africa, which began during the Late Jurassic (Brown et al., 2000). The lateral extent of the flat surfaces in the Evans–Rutford region compares closely to the scale of the features in Namibia, with the escarpment in Namibia retreating around 160 km (Cockburn et al., 2000), whilst the lower surface of the Fletcher Promontory spans approx. 130 km. An Antarctic analogy can also be drawn with the McMurdo Dry Valleys mountain block, which contains two escarpments with relief over 1000 m. As a result of initial lithospheric extension and rifting, fluvial denudation to a new sea level has removed ∼ 4 km of material from the coast in that area, accompanied by isostatic uplift and faulting (Fitzgerald, 1992).
Marine planation forming erosional surfaces has been suggested in the Ross Embayment, creating plateaus and terraces sitting 350 to 100 m b.s.l., separated by bedrock troughs occupied by West Antarctic ice streams (Wilson and Luyendyk, 2006). In contrast, one of the models proposed for bedrock surfaces in the Institute and Möller catchments of the Weddell Sea involves fluvial peneplain erosion, during or after the rifting and break-up of Gondwana at around ∼ 180 Ma, although another proposed mechanism is also marine planation (Rose et al., 2015). In response to the downward shift in base level caused by the rifting of Gondwana (Beaumont et al., 2000), fluvial systems were incised into the landscape, forming broad, extensive coastal surfaces backed by erosional escarpments.
Similar formational processes could have created the geomorphology seen in the Evans–Rutford region, as there is a lower seaward surface, backed by a landward higher-elevation surface, with a relief of at least 600 m between them (Figs. 6 and 8).
However, the lower surface sits below the present-day sea level (and also therefore below the higher palaeo-sea level in an ice-free world) when isostatically rebounded for ice sheet removal (−217 m), therefore requiring other processes to have since led to subsidence. Potential mechanisms for this include (1) prolonged regional thermal subsidence that will have occurred after uplift resulting from the main magmatic event in the region at ∼ 180 Ma (Sleep, 1971) or (2) sediment loading in the Weddell Sea, where sediment deposition in offshore basins that evolved after the break-up of Gondwana would likely have led to local subsidence (Hochmuth et al., 2020). Dynamic topography is another process by which subsidence may have taken place, as evolving viscous stress and buoyancy associated with mantle convection flow can drive vertical deflections of the crust (Austermann et al., 2017, 2015) but are currently poorly constrained for Antarctica.
5.2 Planation and uplift associated with the West Antarctic Rift System or Antarctic Peninsula
The other hypothesis for flat surface formation is through the planation of an extensive surface throughout the region by marine erosional processes, similar to those proposed for the Norwegian strandflat surface (Fossen, 2023). The surface would then have been uplifted in association with the West Antarctic Rift System (WARS) or cessation of subduction along the margin of the Antarctic Peninsula, allowing subsequent incision of a second lower-elevation surface. These processes would have to have occurred after the Jurassic assembly of the microplates (Jordan et al., 2020) and exhumation of the Ellsworth Mountains (Fitzgerald and Stump, 1991), with sea level remaining stable in order to allow for the prolonged planation that would result in an erosional surface of this nature. We regard marine planation at this scale as unlikely, as there is no modern analogue for how surfaces of such breadth could be produced by wave action. For marine planation to have formed these surfaces at this scale as an extensive process of erosion, it would require an unlikely relationship with sea level over millions of years.
Similar, but not as extensive, low-relief erosion surfaces occur in West Antarctica and New Zealand, representing prolonged intervals of erosional levelling in a stable tectonic environment (LeMasurier and Landis, 1996). These surfaces are compatible with prolonged fluvial erosion, marine planation, or a combination of both, with the New Zealand surface being found to consist of a composite of features. The data from these surfaces do not support a continuous low-relief landscape pre-break-up (LeMasurier and Landis, 1996); however, they can provide a clear comparison. Erosion surfaces in western Marie Byrd Land, which formed around ca. 70–60 Ma, have also been identified, corresponding to slow cooling following activity in the West Antarctic Rift System (Zundel et al., 2019).
Rock uplift in the EWM block in the Early Cretaceous may have been caused by early rifting in the WARS between the EWM and Marie Byrd Land (Fitzgerald, 2002). The WARS saw further activity in the Cenozoic and ongoing fracturing, volcanic activity, and bordering uplift associated with development of the rift and combined to modify the topography of West Antarctica (Dalziel and Lawver, 2001). This may have created enough uplift in the Evans–Rutford region to initiate erosion of the lower surface via either marine or fluvial erosion.
Alternatively, the collision of spreading ridge segments at the continental ocean boundary of the Antarctic Peninsula triggered the progressive northward shutdown of subduction along the Antarctic Peninsula margin after 90 Ma, which could have resulted in uplift in the Evans–Rutford region (Jordan et al., 2020; Larter and Barker, 1991). The initial updoming associated with the West Antarctic and New Zealand surfaces at 85–75 Ma may have then been succeeded by uplift further north along the Antarctic Peninsula as subduction ceased between 83 and 45 Ma.
Long-term subsidence following rifting, or other potential mechanisms that would lead to subsidence as described in Sect. 5.1, would consequently lead to the lower-elevation surfaces now residing below sea level, as indicated by the flexural isostatic rebounding model.
Differentiating between an origin of passive-margin evolution or of WARS-associated planation and uplift is challenging. However, the presence of erosional surfaces in the Institute and Möller catchment on the eastern side of the Evans–Rutford region gives an indication that the surfaces were formed through passive-margin evolution, as the other hypotheses involve processes of uplift occurring on the western margin, distally to the Rose et al. (2015) surfaces. Given the coincidence of these surfaces and other similar flat surfaces across Antarctica, for example in Marie Byrd Land (Wilson and Luyendyk, 2006), the Wilkes Basin (Paxman et al., 2018), and West Antarctica and New Zealand (LeMasurier and Landis, 1996), we propose that passive-margin evolution associated with fragmentation of the Gondwanan supercontinent may be a fundamental process driving formation of these flat surfaces. We note that similar sets of surfaces are found around other continents that were formerly part of Gondwana (Ollier, 2014; Summerfield, 2000).
5.3 Controls on long-term ice sheet flow
The current ice flow patterns are controlled by the inherited drainage patterns imposed by Gondwanan tectonic processes and by the original fluvial network that would have formed prior to Antarctic glaciation. We note the distinctive dendritic pattern and confluence angle of the valleys, particularly in the upper reaches of the Evans Ice Stream. The ice flow would likely have inherited the fluvial network and exploited it via selective linear erosion (Sugden, 1968; Sugden et al., 2014), leading to trough formation and flat surface preservation. Erosion of the structurally and fluvially controlled troughs lying between the flat surfaces is likely to have occurred after surface planation, forming conduits for the ice streams observed today. After onset of the WAIS, incision would have followed the structural weaknesses in the bedrock and pre-existing fluvial network, which both happen to be largely aligned with radial ice flow from the central WAIS (Bingham et al., 2012; Jamieson et al., 2014). Therefore, these troughs would act as conduits for ice during the initiation of Antarctic glaciation, providing topographic steering (Bingham et al., 2012; Kessler et al., 2008) and promoting fast, warm-based ice flow that would have strongly influenced the long-term structure and evolution of the ice sheet (Aitken et al., 2014).
Assuming the flat surfaces are pre-glacial, the flat surfaces themselves are therefore indicators of a long-term relatively stable thermal and ice flow regime over those areas of the WAIS. To have survived, the surfaces must have been preserved beneath cold-based, slowly flowing ice. In periods of expanded ice (for example, the Last Glacial Maximum, LGM) these surfaces could not have been significantly modified. In periods of potentially reduced WAIS extent, such as the Pliocene, it is plausible that some of these flat surfaces could act as independent ice dispersal centres and, if they rebounded above sea level enough, as potential stabilisation points for advancing ice shelves and grounded ice during periods of ice re-advance (Bradley et al., 2015; Matsuoka et al., 2015) but without significant erosion.
In this study we facilitated the first in-depth investigation of the large-scale subglacial topography of the Evans–Rutford region. We combined bed picks from the newly released BAS GRADES-IMAGE RES survey, alongside the TORUS and Evans 1994/95 RES surveys. From geomorphological analysis of these RES surveys, we conclude the following.
Two populations of flat surfaces identified across the region suggest two extensive regionally coherent surfaces, which can be interpreted as pre-glacial landscape remnants lying at similar elevations. The topography of the region suggests the incision of the lower surface into the higher surface, given the two populations lying at different elevations and the stepped topography evident on the Fletcher Promontory.
The surfaces are likely to pre-date inception of the WAIS, and the step between them likely formed as part of passive-margin evolution following Gondwana break-up.
Deep troughs were incised between surfaces through selective linear erosion during the glaciation of the WAIS, potentially due to the exploitation of structural weaknesses in the bedrock that have resulted from faulting. This has controlled the long-term pattern of ice discharge from the WAIS.
The preservation of these pre-glacial flat surfaces is an indication of where cold-based, non-erosive ice has prevailed for much of WAIS history. The flat surfaces also have the potential to impact patterns of ice sheet retreat and re-advance given their elevation and extent.
Sampling of the subglacial bedrock, along with potentially determining exhumation histories from thermochronometry, would be required to better constrain the potential formational mechanisms of the flat surfaces within the Evans–Rutford region. Higher-resolution gravity, magnetic, or seismic surveys could also be used to identify variations in bedrock geology or constrain geophysical modelling. Specifically, modelling of the gravity anomalies over the plateaus and incised troughs could give an idea of the nature of their isostatic support and the extent of uplift driven by glacial incision. Higher-resolution magnetic data would help constrain the location of faults and other major tectonic boundaries which we hypothesise to be preconditioned areas for more rapid erosion.
The following radio-echo sounding datasets used in this study are available from the British Antarctic Survey Discovery Metadata System: Evans 1994/95 (https://doi.org/10.5285/2c261013-9a0e-447d-a5bb-b506610b14ff, Corr, 2020), GRADES-IMAGE (https://doi.org/10.5285/c7ea5697-87e3-4529-a0dd-089a2ed638fb, Corr, 2021), and TORUS (https://doi.org/10.5285/4b2ccda1-91ec-4c57-9ae0-07b9a387f352, Corr and Smith, 2020). The REMA data (Howat et al., 2019) used to generate the elevation of surface outcrops were accessed from the Polar Geospatial Center (https://doi.org/10.7910/DVN/SAIK8B, Howat et al., 2018). The shapefile of rock outcrops across the Antarctic continent (Burton-Johnson et al., 2016a) used to extract the REMA data points is available via the British Antarctic Survey Discovery Metadata System (https://doi.org/10.5285/f7947381-6fd7-466f-8894-25d3262cbcf5, Burton-Johnson et al., 2016b). The isostatic response to the unloading of the modern Antarctic Ice Sheet (Paxman et al., 2022b) is available from the NSIDC Arctic Data Center (https://doi.org/10.18739/A2WS8HN3C, Paxman et al., 2022a). Datasets used to create figures in this study include Quantarctica (Matsuoka et al., 2021), available from the Norwegian Polar Institute (https://doi.org/10.21334/npolar.2018.8516e961, Matsuoka et al., 2018), and BedMachine version 3, accessed from the NSIDC Archive Center (https://doi.org/10.5067/FPSU0V1MWUB6, Morlighem, 2022). MEaSUREs ice velocity data (https://doi.org/10.5067/D7GK8F5J8M8R, Rignot et al., 2017) and RAMP2 surface elevation data (https://doi.org/10.5067/8JKNEW6BFRVD, Liu et al., 2015) are also available from the NSIDC Archive Center.
CMC, MJB, and SSRJ conceptualised the study, with CMC carrying out the investigation under supervision from MJB and SSRJ. GJGP, JAB, NR, TAJ, and FN contributed to the development of the methodology and data analysis alongside CMC. CMC prepared the manuscript with contributions from all co-authors.
The contact author has declared that none of the authors has any competing interests.
Publisher's note: Copernicus Publications remains neutral with regard to jurisdictional claims made in the text, published maps, institutional affiliations, or any other geographical representation in this paper. While Copernicus Publications makes every effort to include appropriate place names, the final responsibility lies with the authors.
This article is part of the special issue “Icy landscapes of the past”. It is not associated with a conference.
We are grateful to the scientists, pilots, and support staff who collected the radar data utilised here, especially the late Richard Hindmarsh, who conceptualised the GRADES-IMAGE survey, and to Rob Bingham, who designed the survey lines.
This research has been supported by the Natural Environment Research Council (grant no. NE/R002029/1). Michael J. Bentley's involvement was supported by funding received from the European Research Council (ERC) under the European Union's Horizon 2020 research and innovation programme (grant agreement no. 885205).
The article processing charges for this open-access publication were covered by the Alfred-Wegener-Institut Helmholtz-Zentrum für Polar- und Meeresforschung.
This paper was edited by Yusuke Suganuma and reviewed by David Sugden and one anonymous referee.
Aitken, A. R. A., Young, D. A., Ferraccioli, F., Betts, P. G., Greenbaum, J. S., Richter, T. G., Roberts, J. L., Blankenship, D. D., and Siegert, M. J.: The subglacial geology of Wilkes Land, East Antarctica, Geophys. Res. Lett., 41, 2390–2400, https://doi.org/10.1002/2014GL059405, 2014.
Ashmore, D. W., Bingham, R. G., Hindmarsh, R. C. A., Corr, H. F. J., and Joughin, I. R.: The relationship between sticky spots and radar reflectivity beneath an active West Antarctic ice stream, Ann. Glaciol., 55, 29–38, https://doi.org/10.3189/2014AoG67A052, 2014.
Austermann, J., Pollard, D., Mitrovica, J. X., Moucha, R., Forte, A. M., DeConto, R. M., Rowley, D. B., and Raymo, M. E.: The impact of dynamic topography change on Antarctic ice sheet stability during the mid-Pliocene warm period, Geology, 43, 927–930, https://doi.org/10.1130/G36988.1, 2015.
Austermann, J., Mitrovica, J. X., Huybers, P., and Rovere, A.: Detection of a dynamic topography signal in last interglacial sea-level records, Sci. Adv., 3, e1700457, https://doi.org/10.1126/sciadv.1700457, 2017.
Beaumont, C., Kooi, H., and Willett, S.: Coupled tectonic-surface process models with applications to rifted margins and collision orogens, in: Geomorphology and Global Tectonics, edited by: Summerfield, M. A., John Wiley and Sons, Chichester, ISBN 978-0-471-97193-1, 29–55, 2000.
Bianchi, C., Cafarella, L., de Michelis, P., Forieri, A., Frezzotti, M., Tabacco, I. E., and Zirizzotti, A.: Radio Echo Sounding (RES) investigations at Talos Dome (East Antarctica): bedrock topography and ice thickness, Ann. Geophys, 46, 1265–1270, http://hdl.handle.net/2122/1016 (last access: 25 March 2024), 2003.
Bingham, R. G., Ferraccioli, F., King, E. C., Larter, R. D., Pritchard, H. D., Smith, A. M., and Vaughan, D. G.: Inland thinning of West Antarctic Ice Sheet steered along subglacial rifts, Nature, 487, 468–471, https://doi.org/10.1038/nature11292, 2012.
Bradley, S. L., Hindmarsh, R. C. A., Whitehouse, P. L., Bentley, M. J., and King, M. A.: Low post-glacial rebound rates in the Weddell Sea due to Late Holocene ice-sheet readvance, Earth Planet. Sc. Lett., 413, 79–89, https://doi.org/10.1016/j.epsl.2014.12.039, 2015.
Brown, R. W., Gallagher, K., Gleadow, A. J. W., and Summerfield, M. A.: Morphotectonic evolution of the South Atlantic margins of Africa and South America, in: Geomorphology and Global Tectonics, edited by: Summerfield, M. A., John Wiley and Sons, Chichester, ISBN 978-0-471-97193-1, 255–281, 2000.
Burbank, D. W. and Anderson, R. S.: Tectonic Geomorphology, Second Edition, Wiley and Sons, Chichester, https://doi.org/10.1002/9781444345063 , 2012.
Burton-Johnson, A., Black, M., Fretwell, P. T., and Kaluza-Gilbert, J.: An automated methodology for differentiating rock from snow, clouds and sea in Antarctica from Landsat 8 imagery: a new rock outcrop map and area estimation for the entire Antarctic continent, The Cryosphere, 10, 1665–1677, https://doi.org/10.5194/tc-10-1665-2016, 2016a.
Burton-Johnson, A., Black, M., Fretwell, P., and Kaluza-Gilbert, J.: Rock outcrop map of the Antarctic continent derived from Landsat 8 imagery, Polar Data Centre, British Antarctic Survey, Natural Environment Research Council [data set], https://doi.org/10.5285/f7947381-6fd7-466f-8894-25d3262cbcf5, 2016b.
Chen, B., Haeger, C., Kaban, M. K., and Petrunin, A. G.: Variations of the effective elastic thickness reveal tectonic fragmentation of the Antarctic lithosphere, Tectonophysics, 746, 412–424, https://doi.org/10.1016/j.tecto.2017.06.012, 2018.
Cockburn, H. A. P., Brown, R. W., Summerfield, M. A., and Seidl, M. A.: Quantifying passive margin denudation and landscape development using a combined fission-track thermochronology and cosmogenic isotope analysis approach, Earth Planet. Sc. Lett., 179, 429–435, https://doi.org/10.1016/S0012-821X(00)00144-8, 2000.
Cook, S. J. and Swift, D. A.: Subglacial basins: Their origin and importance in glacial systems and landscapes, Earth. Sci. Rev., 115, 332-372, https://doi.org/10.1016/j.earscirev.2012.09.009, 2012.
Corr, H.: Processed bed elevation picks from airborne radar depth sounding across the Evans Ice Stream, Southern Palmer Land (1994/95 season) (Version 1.0), UK Polar Data Centre, Natural Environment Research Council, UK Research and Innovation [data set], https://doi.org/10.5285/2c261013-9a0e-447d-a5bb-b506610b14ff, 2020.
Corr, H.: Processed airborne radio-echo sounding data from the GRADES-IMAGE survey covering the Evans and Rutford Ice Streams, and ice rises in the Ronne Ice Shelf, West Antarctica (2006/2007) (Version 1.0), UK Polar Data Centre, Natural Environment Research Council, UK Research and Innovation [data set], https://doi.org/10.5285/c7ea5697-87e3-4529-a0dd-089a2ed638fb, 2021.
Corr, H. and Popple, M.: Airborne radio echo sounding on the Evans flowline, Ronne Ice Shelf, Filchner–Ronne Ice Shelf Programme Report, UNI Research Climate, Bergen, 8, https://nora.nerc.ac.uk/id/eprint/515954 (last access: 25 March 2024), 1994.
Corr, H. and Smith, A.: Processed bed elevation picks from airborne radar depth sounding across Ellsworth Land (2001) (Version 1.0), UK Polar Data Centre, Natural Environment Research Council, UK Research and Innovation [data set], https://doi.org/10.5285/4b2ccda1-91ec-4c57-9ae0-07b9a387f352, 2020.
Corr, H., Ferraccioli, F., Frearson, N., Jordan, T., Robinson, C., Armadillo, E., Caneva, G., Bozzo, E., and Tabacco, I.: Airborne Radio-Echo Sounding of the Wilkes Subglacial Basin, the Transantarctic Mountains, and the Dome C Region, Terra Antarctica Reports, 13, 55–63, https://nora.nerc.ac.uk/id/eprint/13578 (last access: 25 March 2024), 2007.
Curtis, M. L. and Storey, B. C.: A review of geological constraints on the pre-break-up position of the Ellsworth Mountains within Gondwana: implications for Weddell Sea evolution, in: Weddell Sea Tectonics and Gondwana Break-Up, edited by: Storey, B. C., King, E. C., and Livermore, R. A, Geological Society of London, London, https://doi.org/10.1144/GSL.SP.1996.108.01.02, 11–30, 1996.
Dalziel, I. W. D.: Antarctica and supercontinental evolution: Clues and puzzles, Earth Env. Sci. T. R. So., 104, 3–16, https://doi.org/10.1017/S1755691012000096, 2013.
Dalziel, I. W. D. and Lawver, L. A.: The Lithospheric Setting of the West Antarctic Ice Sheet, in: The West Antarctic Ice Sheet: Behaviour and Environment, edited by: Alley, R. B. and Bindschadle, R. A., American Geophysical Union, Washington, D.C., https://doi.org/10.1029/AR077, 29–44, 2001.
Dalziel, I. W. D., Garrett, S. W., Grunow, A. M., Pankhurst, R. J., Storey, B. C., and Vennum, W. R.: The Ellsworth-Whitmore Mountains Crustal Block: Its Role in the Tectonic Evolution of West Antarctica, in: Gondwana Six: Structure, Tectonics, and Geophysics, edited by: McKenzie, G. D., American Geophysical Union, Washington D.C., https://doi.org/10.1029/GM040P0173, 173–182, 1987.
Doake, C. S. M., Crabtree, R. D., and Dalziel, I. W. D.: Subglacial morphology between Ellsworth Mountains and Antarctic Peninsula: New data and tectonic significance, in: Antarctic Earth Science: Fourth International Symposium on Antarctic Earth Sciences, edited by: Oliver, R. L., James, P. R., and Jago, J. B., Cambridge University Press, New York, ISBN 9780521258364, 270–274, 1983.
Fitzgerald, P. G.: The Transantarctic Mountains of southern Victoria Land: the application of fission track analysis to a rift shoulder uplift, Tectonics, 11, 634–662. 1992.
Fitzgerald, P.: Tectonics and landscape evolution of the Antarctic plate since the breakup of Gondwana, with an emphasis on the West Antarctic Rift System and the Transantarctic Mountains, in: Antarctica at the close of a millenium, edited by: Gamble, J., Skinner, D. A., and Henrys, S., Proceedings of the 8th International Symposium on Antarctic Earth Science, The Royal Society of New Zealand, Wellington, 35, 453–469, ISBN 1-877264-06-7, 2002.
Fitzgerald, P. G. and Stump, E.: Early cretaceous uplift in the Ellsworth Mountains of West Antarctica, Science, 254, 92–94, https://doi.org/10.1126/science.254.5028.92, 1991.
Fitzgerald, P. G. and Stump, E.: Early Cretaceous Uplift of the Southern Sentinel Range, Ellsworth Mountains, West Antarctica, in: Recent Progress in Antarctic Earth Science, edited by: Yoshida, Y., Kaminuma, K., and Shiraishi, K., Terra Scientific Publishing Company (TERRAPUB), Tokyo, 331–340. 1992.
Fossen, H.: A Pleistocene origin of the strandflat coastal platform in southwestern Scandinavia, Commun. Earth. Environ., 4, 63, https://doi.org/10.1038/s43247-023-00724-6, 2023.
Frémand, A. C., Bodart, J. A., Jordan, T. A., Ferraccioli, F., Robinson, C., Corr, H. F. J., Peat, H. J., Bingham, R. G., and Vaughan, D. G.: British Antarctic Survey's aerogeophysical data: releasing 25 years of airborne gravity, magnetic, and radar datasets over Antarctica, Earth Syst. Sci. Data, 14, 3379–3410, https://doi.org/10.5194/essd-14-3379-2022, 2022.
Fretwell, P., Pritchard, H. D., Vaughan, D. G., Bamber, J. L., Barrand, N. E., Bell, R., Bianchi, C., Bingham, R. G., Blankenship, D. D., Casassa, G., Catania, G., Callens, D., Conway, H., Cook, A. J., Corr, H. F. J., Damaske, D., Damm, V., Ferraccioli, F., Forsberg, R., Fujita, S., Gim, Y., Gogineni, P., Griggs, J. A., Hindmarsh, R. C. A., Holmlund, P., Holt, J. W., Jacobel, R. W., Jenkins, A., Jokat, W., Jordan, T., King, E. C., Kohler, J., Krabill, W., Riger-Kusk, M., Langley, K. A., Leitchenkov, G., Leuschen, C., Luyendyk, B. P., Matsuoka, K., Mouginot, J., Nitsche, F. O., Nogi, Y., Nost, O. A., Popov, S. V., Rignot, E., Rippin, D. M., Rivera, A., Roberts, J., Ross, N., Siegert, M. J., Smith, A. M., Steinhage, D., Studinger, M., Sun, B., Tinto, B. K., Welch, B. C., Wilson, D., Young, D. A., Xiangbin, C., and Zirizzotti, A.: Bedmap2: improved ice bed, surface and thickness datasets for Antarctica, The Cryosphere, 7, 375–393, https://doi.org/10.5194/tc-7-375-2013, 2013.
Garrett, S. W., Herrod, L. D. B., and Mantripp, D. R.: Crustal Structure of the Area Around Haag Nunataks, West Antarctica: New Aeromagnetic and Bedrock Elevation Data, in: Gondwana Six: Structure, Tectonics, and Geophysics, edited by: McKenzie, G. D., American Geophysical Union, Washington D. C., 40, 109–115, https://doi.org/10.1029/gm040p0109, 1987.
Goodfellow, B. W.: Relict non-glacial surfaces in formerly glaciated landscapes, Earth. Sci. Rev., 80, 47–73, https://doi.org/10.1016/j.earscirev.2006.08.002, 2006.
Hindmarsh, R. C. A., King, E. C., Mulvaney, R., Corr, H. F. J., Hiess, G., and Gillet-Chaulet, F.: Flow at ice-divide triple junctions: 2. Three-dimensional views of isochrone architecture from ice-penetrating radar surveys, J. Geophys. Res.-Earth, 116, F02024, https://doi.org/10.1002/2014JF003275, 2011.
Hochmuth, K., Gohl, K., Leitchenkov, G., Sauermilch, I., Whittaker, J. M., Uenzelmann-Neben, G., Davy, B., and de Santis, L.: The Evolving Paleobathymetry of the Circum-Antarctic Southern Ocean Since 34 Ma: A Key to Understanding Past Cryosphere-Ocean Developments, Geochem. Geophys., 21, e2020GC00912, https://doi.org/10.1029/2020GC009122, 2020.
Howat, I., Morin, P., Porter, C., and Noh, M.-J.: The Reference Elevation Model of Antarctica (Version 1), Harvard Dataverse [data set], https://doi.org/10.7910/DVN/SAIK8B, 2018.
Howat, I. M., Porter, C., Smith, B. E., Noh, M.-J., and Morin, P.: The Reference Elevation Model of Antarctica, The Cryosphere, 13, 665–674, https://doi.org/10.5194/tc-13-665-2019, 2019.
Jamieson, S. S. R. and Sugden, D. E.: Landscape Evolution of Antarctica, in: Antarctica: A Keystone in a Changing World. Proceedings of the 10th International Symposium on Antarctic Earth Sciences, edited by: Cooper, A. K., Barrett, P. J., Stagg, H., Storey, B., Stump, E., Wise, W., and the 10th ISEAS editorial team, The National Academies Press, Washington, D.C., ISBN 0309178096, 39–54, 2008.
Jamieson, S. S. R., Hulton, N. R. J., Sugden, D. E., Payne, A. J., and Taylor, J.: Cenozoic landscape evolution of the Lambert basin, East Antarctica: the relative role of rivers and ice sheets, Global Planet. Change, 45, 35–49, https://doi.org/10.1016/J.GLOPLACHA.2004.09.015, 2005.
Jamieson, S. S. R., Stokes, C. R., Ross, N., Rippin, D. M., Bingham, R. G., Wilson, D. S., Margold, M., and Bentley, M. J.: The glacial geomorphology of the Antarctic ice sheet bed, Antarct. Sci., 26, 724–741, https://doi.org/10.1017/S0954102014000212, 2014.
Jeofry, H., Ross, N., Corr, H. F. J., Li, J., Morlighem, M., Gogineni, P., and Siegert, M. J.: A new bed elevation model for the Weddell Sea sector of the West Antarctic Ice Sheet, Earth Syst. Sci. Data, 10, 711–725, https://doi.org/10.5194/essd-10-711-2018, 2018.
Jones, P. C., Johnson, A. C., von Frese, R. R. B., and Corr, H.: Detecting rift basins in the Evans Ice Stream region of West Antarctica using airborne gravity data, Tectonophysics, 347, 25–41, https://doi.org/10.1016/S0040-1951(01)00236-0, 2002.
Jordan, T. A., Ferraccioli, F., Vaughan, D. G., Holt, J. W., Corr, H., Blankenship, D. D., and Diehl, T. M.: Aerogravity evidence for major crustal thinning under the Pine Island Glacier region (West Antarctica), Geol. Soc. Am. Bull., 122, 714–726, https://doi.org/10.1130/B26417.1, 2010.
Jordan, T. A., Ferraccioli, F., and Leat, P. T.: New geophysical compilations link crustal block motion to Jurassic extension and strike-slip faulting in the Weddell Sea Rift System of West Antarctica, Gondwana Res., 42, 29–48, https://doi.org/10.1016/j.gr.2016.09.009, 2017.
Jordan, T. A., Riley, T. R., and Siddoway, C. S.: The geological history and evolution of West Antarctica, Nat. Rev. Earth. Environ., 1, 117–133, https://doi.org/10.1038/s43017-019-0013-6, 2020.
Kessler, M., Anderson, R., and Briner, J.: Fjord insertion into continental margins driven by topographic steering of ice, Nature Geosci., 1, 365–369, https://doi.org/10.1038/ngeo201, 2008.
King, E. C.: Ice stream or not? Radio-echo sounding of Carlson Inlet, West Antarctica, The Cryosphere, 5, 907–916, https://doi.org/10.5194/tc-5-907-2011, 2011.
King, E. C., Pritchard, H. D., and Smith, A. M.: Subglacial landforms beneath Rutford Ice Stream, Antarctica: detailed bed topography from ice-penetrating radar, Earth Syst. Sci. Data, 8, 151–158, https://doi.org/10.5194/essd-8-151-2016, 2016.
Larter, R. D. and Barker, P. F.: Effects of ridge crest-trench interaction on Antarctic-Phoenix spreading: forces on a young subducting plate, J. Geophys. Res., 96, 19583–19607, https://doi.org/10.1029/91jb02053, 1991.
LeMasurier, W. E. and Landis, C. A.: Mantle-plume activity recorded by low-relief erosion surfaces in West Antarctica and New Zealand, Geol. Soc. Am. Bull., 108, 1450–1466, https://doi.org/10.1130/0016-7606(1996)108%3C1450:MPARBL%3E2.3.CO;2, 1996.
Liu, H., Jezek, K. C., Li, B., and Zhao, Z.: Radarsat Antarctic Mapping Project Digital Elevation Model, Version 2, NASA National Snow and Ice Data Center Distributed Active Archive Center [data set], Boulder, Colorado, USA, https://doi.org/10.5067/8JKNEW6BFRVD, 2015.
Maslanyj, M. P. and Storey, B. C.: Regional aeromagnetic anomalies in Ellsworth Land: Crustal structure and Mesozoic microplate boundaries within West Antarctica, Tectonics, 9, 1515–1532, https://doi.org/10.1029/TC009I006P01515, 1990.
Matsuoka, K., Hindmarsh, R. C. A., Moholdt, G., Bentley, M. J., Pritchard, H. D., Brown, J., Conway, H., Drews, R., Durand, G., Goldberg, D., Hattermann, T., Kingslake, J., Lenaerts, J. T. M., Martín, C., Mulvaney, R., Nicholls, K. W., Pattyn, F., Ross, N., Scambos, T., and Whitehouse, P. L.: Antarctic ice rises and rumples: Their properties and significance for ice-sheet dynamics and evolution, Earth. Sci. Rev., 150, 724–745, https://doi.org/10.1016/j.earscirev.2015.09.004, 2015.
Matsuoka, K., Skoglund, A., and Roth, G.: Quantarctica, Norwegian Polar Institute [data set], https://doi.org/10.21334/npolar.2018.8516e961, 2018.
Matsuoka, K., Skoglund, A., Roth, G., de Pomereu, J., Griffiths, H., Headland, R., Herried, B., Katsumata, K., le Brocq, A., Licht, K., Morgan, F., Neff, P. D., Ritz, C., Scheinert, M., Tamura, T., van de Putte, A., Liefferinge, M., Tronstad, S., and Malvær, Y.: Quantarctica, an integrated mapping environment for Antarctica, the Southern Ocean, and sub-Antarctic islands, Environ. Model. Softw., 140, 105015, https://doi.org/10.1016/j.envsoft.2021.105015, 2021.
Minchew, B. M., Meyer, C. R., Roble, A. A., Gudmundsson, G. H., and Simons, M.: Processes controlling the downstream evolution of ice rheology in glacier shear margins: case study on Rutford Ice Stream, West Antarctica, J. Glaciol., 64, 583–594, https://doi.org/10.1017/jog.2018.47, 2018.
Morlighem, M.: MEaSUREs BedMachine Antarctica (Version 3), NASA National Snow and Ice Data Center Distributed Active Archive Center [data set], Boulder, Colorado USA, https://doi.org/10.5067/FPSU0V1MWUB6, 2022.
Morlighem, M., Rignot, E., Binder, T., Blankenship, D., Drews, R., Eagles, G., Eisen, O., Ferraccioli, F., Forsberg, R., Fretwell, P., Goel, V., Greenbaum, J. S., Gudmundsson, H., Guo, J., Helm, V., Hofstede, C., Howat, I., Humbert, A., Jokat, W., Karlsson, N. B., Lee, W. S., Matsuoka, K., Millan, R., Mouginot, J., Paden, J., Pattyn, F., Roberts, J., Rosier, S., Ruppel, A., Seroussi, H., Smith, E. C., Steinhage, D., Sun, B., van den Broeke, M. R., van Ommen, T. D., van Wessem, M., and Young, D. A.: Deep glacial troughs and stabilizing ridges unveiled beneath the margins of the Antarctic ice sheet, Nat. Geosci., 13, 132–137, https://doi.org/10.1038/S41561-019-0510-8, 2020.
Naish, T., Powell, R., Levy, R., Wilson, G., Scherer, R., Talarico, F., Krissek, L., Niessen, F., Pompilio, M., Wilson, T., Carter, L., DeConto, R., Huybers, P., McKay, R., Pollard, D., Ross, J., Winter, D., Barrett, P., Browne, G., Cody, R., Cowan, E., Crampton, J., Dunbar, G., Dunbar, N., Florindo, F., Gebhardt, C., Graham, I., Hannah, M., Hansaraj, D., Harwood, D., Helling, D., Henrys, S., Hinnov, L., Kuhn, G., Kyle, P., Läufer, A., Maffioli, P., Magens, D., Mandernack, K., McIntosh, W., Millan, C., Morin, R., Ohneiser, C., Paulsen, T., Persico, D., Raine, I., Reed, J., Riesselman, C., Sagnotti, L., Schmitt, D., Sjunneskog, C., Strong, P., Taviani, M., Vogel, S., Wilch, T., and Williams, T.: Obliquity-paced Pliocene West Antarctic ice sheet oscillations, Nature, 458, 322–328, https://doi.org/10.1038/nature07867, 2009.
Napoleoni, F., Jamieson, S. S. R., Ross, N., Bentley, M. J., Rivera, A., Smith, A. M., Siegert, M. J., Paxman, G. J. G., Gacitúa, G., Uribe, J. A., Zamora, R., Brisbourne, A. M., and Vaughan, D. G.: Subglacial lakes and hydrology across the Ellsworth Subglacial Highlands, West Antarctica, The Cryosphere, 14, 4507–4524, https://doi.org/10.5194/tc-14-4507-2020, 2020.
Ollier, C.: Planation Surfaces of the Gondwana Continents: Synthesis and Problems, in: Gondwana Landscapes in southern South America, edited by: Rabassa, J. and Ollier, C., Springer Earth System Sciences, Springer, Dordrecht, https://doi.org/10.1007/978-94-007-7702-6_4, 2014.
Paxman, G. J. G., Jamieson, S. S. R., Ferraccioli, F., Bentley, M. J., Forsberg, R., Ross, N., Watts, A. B., Corr, H. F. J., and Jordan, T. A.: Uplift and tilting of the Shackleton Range in East Antarctica driven by glacial erosion and normal faulting, J. Geophys. Res.-Sol. Ea., 122, 2390–2408, https://doi.org/10.1002/2016JB013841, 2017.
Paxman, G. J. G., Jamieson, S. S. R., Ferraccioli, F., Bentley, M. J., Ross, N., Armadillo, E., Gasson, E. G. W., Leitchenkov, G., and DeConto, R. M.: Bedrock Erosion Surfaces Record Former East Antarctic Ice Sheet Extent, Geophys. Res. Lett., 45, 4114–4123, https://doi.org/10.1029/2018GL077268, 2018.
Paxman, G. J. G., Jamieson, S. S. R., Ferraccioli, F., Jordan, T. A., Bentley, M. J., Ross, N., Forsberg, R., Matsuoka, K., Steinhage, D., Eagles, G., and Casal, T. G.: Subglacial Geology and Geomorphology of the Pensacola-Pole Basin, East Antarctica, Geochem. Geophys., 20, 2786–2807, https://doi.org/10.1029/2018GC008126, 2019.
Paxman, G. J. G., Austermann, J., and Hollyday, A.: Grid files of the total isostatic response to the complete unloading of the Greenland and Antarctic Ice Sheets (version 2), Arctic Data Center [data set], https://doi.org/10.18739/A2WS8HN3C, 2022a.
Paxman, G. J. G., Austermann, J., and Hollyday, A.: Total isostatic response to the complete unloading of the Greenland and Antarctic Ice Sheets, Sci. Rep.-UK, 12, 1–10, https://doi.org/10.1038/s41598-022-15440-y, 2022b.
Rignot, E., Mouginot. J., and Scheuchl, B.: MEaSUREs InSAR-Based Antarctica Ice Velocity Map, Version 2, NASA National Snow and Ice Data Center Distributed Active Archive Center [data set], Boulder, Colorado, USA, https://doi.org/10.5067/D7GK8F5J8M8R, 2017.
Rippin, D. M., Bamber, J. L., Siegert, M. J., Vaughan, D. G., and Corr, H. F. J.: The role of ice thickness and bed properties on the dynamics of the enhanced-flow tributaries of Bailey Ice Stream and Slessor Glacier, East Antarctica, Ann. Glaciol., 39, 366–372, https://doi.org/10.3189/172756404781814375, 2004.
Rose, K. C., Ferraccioli, F., Jamieson, S. S. R., Bell, R. E., Corr, H., Creyts, T. T., Braaten, D., Jordan, T. A., Fretwell, P. T., and Damaske, D.: Early East Antarctic Ice Sheet growth recorded in the landscape of the Gamburtsev Subglacial Mountains, Earth Planet. Sc. Lett., 375, 1–12, https://doi.org/10.1016/j.epsl.2013.03.053, 2013.
Rose, K. C., Ross, N., Jordan, T. A., Bingham, R. G., Corr, H. F. J., Ferraccioli, F., Le Brocq, A. M., Rippin, D. M., and Siegert, M. J.: Ancient pre-glacial erosion surfaces preserved beneath the West Antarctic Ice Sheet, Earth Surf. Dynam., 3, 139–152, https://doi.org/10.5194/esurf-3-139-2015, 2015.
Ross, N., Bingham, R. G., Corr, H. F. J., Ferraccioli, F., Jordan, T. A., le Brocq, A., Rippin, D. M., Young, D., Blankenship, D. D., and Siegert, M. J.: Steep reverse bed slope at the grounding line of the Weddell Sea sector in West Antarctica, Nat. Geosci., 5, 393–396, https://doi.org/10.1038/ngeo1468, 2012.
Schlegel, R., Murray, T., Smith, A. M., Brisbourne, A. M., Booth, A. D., King, E. C., and Clark, R. A.: Radar Derived Subglacial Properties and Landforms Beneath Rutford Ice Stream, J. Geophys. Res.-Earth, 127, e2021JF006349, https://doi.org/10.1029/2021JF006349, 2021.
Siegert, M. J., Payne, A. J., and Joughin, I.: Spatial stability of Ice Stream D and its tributaries, West Antarctica, revealed by radio-echo sounding and interferometry, Ann. Glaciol., 37, 377–382, https://doi.org/10.3189/172756403781816022, 2003;.
Sleep, N. H.: Thermal Effects of the Formations of Atlantic Continental Margins by Continental Break up, Geophys. J. Int., 24, 325–350, https://doi.org/10.1111/j.1365-246X.1971.tb02182.x, 1971.
Smith, E. C., Smith, A. M., White, R. S., Brisbourne, A. M., and Pritchard, H. D.: Mapping the ice-bed interface characteristics of Rutford Ice Stream, West Antarctica, using microseismicity, J. Geophys. Res.-Earth, 120. 1881–1894, https://doi.org/10.1002/2015JF003587, 2015.
Smith, J. A., Bentley, M. J., Hodgson, D. A., and Cook, A. J.: George VI Ice Shelf: Past history, present behaviour and potential mechanisms for future collapse, Antarct. Sci., 19, 131–142, https://doi.org/10.1017/S0954102007000193, 2007.
Studinger, M. and Miller, H.: Crustal structure of the Filchner–Ronne shelf and Coats Land, Antarctica, from gravity and magnetic data: Implications for the breakup of Gondwana, J. Geophys. Res.-Sol. Ea., 104, 20379–20394, https://doi.org/10.1029/1999jb900117, 1999.
Sugden, D. E.: The selectivity of Glacial Erosion in the Cairngorm Mountains, Scotland, T. I. Brit. Geogr., 45, 79–92, https://doi.org/10.2307/621394, 1968.
Sugden, D. E.: Glacial erosion by the Laurentide Ice Sheet, J. Glaciol., 20, 367–391, https://doi.org/10.3189/S0022143000013915, 1978.
Sugden, D. E. and Jamieson, S. S. R.: The pre-glacial landscape of Antarctica, Scott. Geogr. J., 134, 203-223, https://doi.org/10.1080/14702541.2018.1535090, 2018.
Sugden, D. E., Fogwill, C. J., Hein, A. S., Stuart, F. M., Kerr, A. R., and Kubik, P. W.: Emergence of the Shackleton Range from beneath the Antarctic Ice Sheet due to glacial erosion, Geomorphology, 208, 190–199, https://doi.org/10.1016/j.geomorph.2013.12.004, 2014.
Summerfield, M. A.: Global Geomorphology, Longman Scientific & Technical, Abingdon, ISBN 9780582301566, 1991.
Summerfield, M. A.: Geomorphology and Global Tectonics, Wiley, Chichester, ISBN 0471971936, 2000.
Swain, C. J. and Kirby, J. F.: Effective Elastic Thickness Map Reveals Subglacial Structure of East Antarctica, Geophys. Res. Lett., 48, e2020GL091576, https://doi.org/10.1029/2020GL091576, 2021.
Wilson, D. S. and Luyendyk, B. P.: Bedrock platforms within the Ross Embayment, West Antarctica: Hypotheses for ice sheet history, wave erosion, Cenozoic extension, and thermal subsidence, Geochem. Geophys., 7, Q12011, https://doi.org/10.1029/2006GC001294, 2006.
Vaughan, D. G., Corr, H. F. J., Smith, A. M., Pritchard, H. D., and Shepherd, A.: Flow-switching and water piracy between Rutford Ice Stream and Carlson Inlet, West Antarctica, J. Glaciol., 54, 41–48, https://doi.org/10.3189/002214308784409125, 2008.
Yang, R., Willett, S. D., and Goren, L.: In situ low-relief landscape formation as a result of river network disruption, Nature, 520, 526–529, https://doi.org/10.1038/nature14354, 2015.
Young, D. A., Wright, A. P., Roberts, J. L., Warner, R. C., Young, N. W., Greenbaum, J. S., Schroeder, D. M., Holt, J. W., Sugden, D. E., Blankenship, D. D., van Ommen, T. D., and Siegert, M. J.: A dynamic early East Antarctic Ice Sheet suggested by ice-covered fjord landscapes, Nature, 474, 72–75, https://doi.org/10.1038/nature10114, 2011.
Zundel, M., Spiegel, C., Lisker, F., and Monien, P.: Post Mid-Cretaceous Tectonic and Topographic Evolution of Western Marie Byrd Land, West Antarctica: Insights from Apatite Fission Track and (U-Th-Sm)/He Data, Geochem. Geophys., 20, 5831–5848, https://doi.org/10.1029/2019GC008667, 2019.