the Creative Commons Attribution 4.0 License.
the Creative Commons Attribution 4.0 License.
 | 02 May 2024
Impact of subsurface crevassing on the depth–age relationship of high-Alpine ice cores extracted at Col du Dôme between 1994 and 2012
Susanne Preunkert
Pascal Bohleber
Michel Legrand
Adrien Gilbert
Tobias Erhardt
Roland Purtschert
Lars Zipf
Astrid Waldner
Joseph R. McConnell
Hubertus Fischer
Three seasonally resolved ice core records covering the 20th century were extracted in 1994, 2004, and 2012 at a nearly identical location from the Col du Dôme (4250 m above sea level, m a.s.l.; Mont Blanc, French Alps) drill site. Here, we complete and combine chemical records of major ions and radiometric measurements of 3H and 210Pb obtained from these three cores with a 3D ice flow model of the Col du Dôme glacier to investigate in detail the origin of discontinuities observed in the depth–age relation of the ice cores drilled in 2004 and 2012. Taking advantage of the granitic bedrock at Col du Dôme, which makes the ice core 210Pb records sensitive to the presence of upstream crevasses, and the fact that the depth–age disturbances are observed at depths for which absolute time markers are available, we draw an overall picture of a dynamic crevasse formation. This can explain the non-disturbed depth–age relation of the ice core drilled in 1994 and the perturbations observed in those drilled in 2004 and 2012. Since crevasses are common at high-Alpine glacier sites, our study points to the important need for rigorous investigations of the depth–age scale and glaciological conditions upstream of drill sites before interpreting high-alpine ice core records in terms of atmospheric changes.
- Article
(5193 KB) - Full-text XML
- BibTeX
- EndNote


Close proximity to European source regions makes ice cores from high-elevation Alpine glaciers an important target for the reconstruction of past anthropogenic perturbations of atmospheric chemistry. In the French Alps, the Col du Dôme (CDD) glacier close to the Mont Blanc summit has been studied extensively over the last 25 years with regard to its glaciological properties and suitability for glacio-chemical studies (e.g., Vincent et al., 1997; Preunkert et al., 2000). Although it has experienced significant warming in response to climate change since the 1980s (Vincent et al., 2007; Gilbert and Vincent, 2013; Vincent et al., 2020), the glacier has been shown to be entirely cold (i.e., the ice temperature is below freezing point at all depths), with the exception of sporadic surface melting and refreezing in the uppermost centimeters during summer. Ice cores extracted at CDD have been used to reconstruct various aspects of atmospheric changes during the 20th century over western Europe. These include major inorganic species (NH, NO, and SO; Fagerli et al., 2007; Preunkert et al., 2003; Preunkert et al., 2001a); halogens (HCl and HF; Legrand et al., 2002; Preunkert et al., 2001b; total I and Br; Legrand et al., 2018, 2021); black carbon (Moseid et al., 2022); dissolved organic carbon (DOC; Legrand et al., 2013); organic molecules (Legrand et al., 2003, 2007; Guilhermet et al., 2013); and trace elements such as Pb and Cd (Legrand et al., 2020), V and Mo (Arienzo et al., 2021), and Tl (Legrand et al., 2022). Underpinning these efforts are three ice cores, all drilled to bedrock within at most 10 m of each other (mean geographic location of 45.842195° N, 6.84675° E) in 1994 (C10; Vincent et al., 1997; Preunkert et al., 2000), 2004 (CDK; Legrand et al., 2013), and 2012 (CDM; Legrand et al., 2018; this study).

Figure 1Depth–age relation established for C10 between 2000 and 2016. Data are from Preunkert et al. (2000), Vincent et al. (1997), Preunkert et al. (2001a, b), Legrand et al. (2002, 2018), and Preunkert et al. (2019a), and the age scale is based on annual layer counting and absolute age markers. The shaded area refers to the depth zone where enhanced 210Pb values (see Sect. 3.2 and Fig. 6) were observed.
For the C10 ice core, drilled in 1994, a depth–age relationship (Fig. 1) was derived that was consistent across annual layer counting and several time markers. The age scale is strictly monotonic, meaning it does not show evidence of flow anomalies, hiatuses, or folding within the dating uncertainty (Preunkert et al., 2000). In contrast, it was shown that the 2004 CDK core is likely missing ∼16 years between ∼1970 and ∼1954 (Legrand et al., 2013), as confirmed by the absence of the well-known 3H maximum in 1963 caused by atmospheric nuclear tests. Although the precise cause remained unclear, it was suggested that the missing 1954–1970 period was related to an (upstream) crevasse that had disturbed the continuity of the CDK record by an inflow of a partly snow-filled crevasse to the ice core site. The presence of one or more crevasses in the upstream vicinity of the drill site was also suspected to cause strongly elevated concentrations of 210Pb observed in the C10 core (Vincent et al., 1997) because the bedrock at the CDD consists of granite that emits 222Rn (half-life of 3.8 d). 222Rn is able to diffuse in snow and firn but much less so in ice (see also Pourchet et al., 2000) and subsequently decays to produce 210Pb (half-life of 22.3 years). The existence of a 210Pb anomaly despite the continuous and monotonic depth–age relationship of core C10 suggests that the crevasse was close but did not intersect the C10 flowline or that the crevasse closed again without substantial disturbance of the ice stratigraphy in the decades prior to 1994 (see discussion below for more details).
As for the 2012 CDM core, only the upper core sections (down to 81 m depth, i.e., 1979) have been investigated previously for various trace elements including major ions, black carbon, halogens, Pb, Cd, V and Mo, Tl, and Bi and P (Legrand et al., 2018, 2020, 2021, 2022; Arienzo et al., 2021; Moseid et al., 2022; Eichler et al., 2023; Legrand et al., 2023a, b). Here, we report additional 210Pb measurements and use NO, NH, and 3H analysis to extend the depth–age relationship of the CDM core back to 1950. This homogeneous set of chemical and radiochemical data from C10, CDK, and CDM ice cores permits an investigation of the consistency of the depth–age relation back to 1950 between the ice cores drilled in 1994, 2004, and 2012, respectively. In addition, a first attempt to provide a qualitative glaciological explanation for the observed discontinuity in the depth–age relation of CDK and CDM and for the link with the presence of unexpectedly high 210Pb levels will be made. This is important for understanding the extent to which existing and future ice cores drilled at this location on the CDD saddle are suitable for reconstructing past atmospheric chemistry changes.

Figure 2View of the southeast flank of the Dôme du Gôuter and Col du Dôme saddle including the drill site of 1994, 2004, and 2012 situated downslope of Dôme du Gôuter. Note that the three drill sites are located within about 10 m of one another and are thus indicated by a single dot in panel (c). (a) Picture taken in summer of 2012. A large crevasse extends across the upstream catchment area of the drilling site. At the time of the picture, the distinctly visible crevasse was mainly snow-covered. A potential second crevasse is also visible on the southwestern slope of the glacier. (b) Picture taken in summer of 1999. Evidence of one to two crevasses limited to the southwestern side of the Dôme du Gôuter. Black arrows in panels (a) and (b) indicate parts of the crevasse which are suggested by the surface features in panels (a) and (b). Grey arrows in panel (a) mark the part of the crevasse which was only visible in 2012. (c) Topographic map of the Col du Dôme and the Dôme du Gôuter together with the underlying bedrock topography (adapted from Vincent et al., 2020). Contour lines are spaced at 5 m intervals. The main crevasse highlighted in panels (a) and (b) is reported in panel (c) based on an aerial photo from the Institut national de l'information géographique et forestière (IGNF) taken on 30 June 2004 (solid blue line in panel c indicates the part of the crevasse which was clearly visible, and the dashed blue line denotes the part which was less clearly visible).
Table 1Basic glaciological and radiometric parameters of the three CDD ice cores investigated in this study.
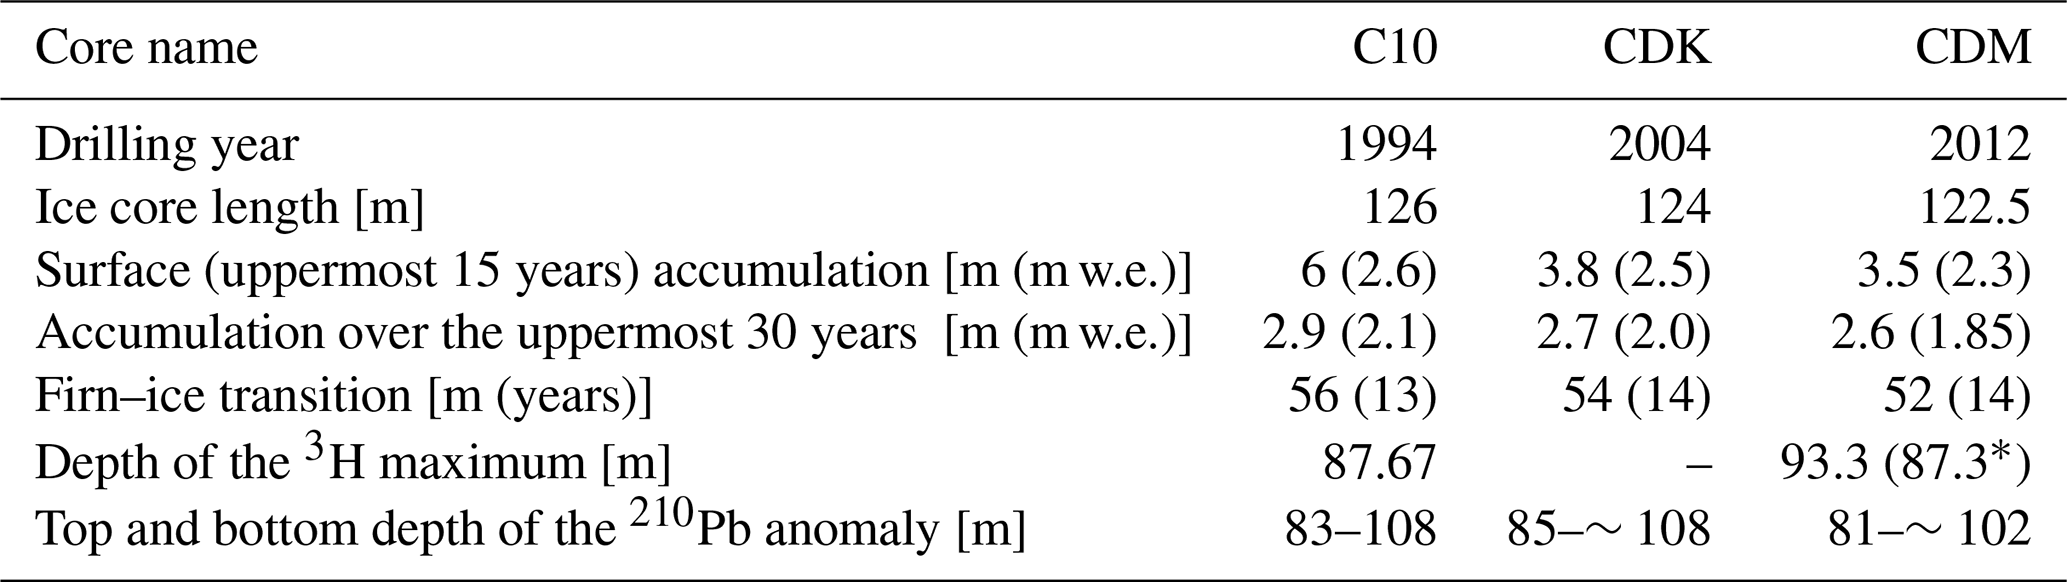
∗ Depth of the shallower 3H maximum detected in CDM ice, considered to not be corresponding to the year 1963 (see Sect. 3.1.3).
2.1 Site characteristics
The CDD site is located on a small cold glacier saddle downslope of the Dôme du Gôuter (4300 m a.s.l.; Fig. 2). On this slope, the C10, CDK, and CDM cores were drilled down to ∼125 m (Table 1; i.e., close to bedrock). Detailed glaciological descriptions of this site can be found in Vincent et al. (1997, 2020). Preunkert et al. (2000) characterized this site in terms of its usefulness for the reconstruction of past atmospheric changes since the beginning of the 20th century based specifically on data from the C10 ice core. The ice flow, firn compaction, and thermal regime have been modeled in three dimensions by Gilbert et al. (2014), allowing for particle backtracking and flow-based estimation of the depth–age relationship at the drilling site. However, Gilbert et al. (2014) did not allow for the occurrence of crevasses along the slope from Dôme du Gôuter to the Col du Dôme saddle. In fact, field observations and photographic evidence show the existence of a large crevasse (clearly indicated by a depression at the surface although the crevasse is not necessarily open to the atmosphere) east of the CDD dome which, depending on its north–south extension, could also intersect the upstream flowline from the drill site. Unfortunately, we do not have direct measurements of the depth and lateral extent of the crevasse. The crevasse appears approximately at an oversteepening of the bedrock topography (Fig. 2c) along the flowline, suggesting that it is extensive stress at the bottom that leads to crack formation at a specific point and allows for the opening of a crevasse that is deep down to bedrock (in line with 210Pb evidence as outlined below). We stress that the crevasse is not necessarily open to the surface (see Fig. 2a and b) but that a collapse of the snow bridge at the top in the past cannot be ruled out. We also note that this crevasse is not moving downhill with the surface velocity of several meters per year in the observations but is found approximately at the same location of the glacier surface every year. Despite this stationarity of the crevasse, the surface velocity field is not disturbed (Gilbert et al., 2014), implying that the ice flow is not totally interrupted across the crevasse. Together with the stationarity of the crevasse, this suggests that the subsurface void created by the crevasse is filled again by glacier flow after its opening, as also suggested by significant glacier thickness reductions of a few meters from 1993 to 2017 (Vincent et al., 2020) in the vicinity of the crevasse. Accordingly, we interpret the glaciological evidence as (recurrent) opening but also potential re-closure of the crevasse (Colgan et al., 2016) below the surface at the same bedrock-topography-induced position. Comparing photos taken in 2012 (Fig. 2a) and in 1999 (Fig. 2b) shows the widening and northward extension of the crevasse from 1999 to 2012, whereas in 2012 the crevasse is clearly indicated by a snow-covered depression on the surface slope; the crevasse appeared to be limited to the southwestern flank of the drill site catchment area in 1999. Following Fig. 3, the crevasse is situated more than 100 m upstream of the drill site of C10, CDK, and CDM. Figure 3a shows the CDD glacier thickness changes between 1993 and 2017 with the modeled flowline indicating the calculated arrival depths at the drill site of C10, CDK, and CDM overlaid (Gilbert et al., 2014). Figure 3b and c represent vertical cross sections along the modeled flowline in Fig. 3a, with simplified sketches of the upstream crevasse overlaid and visible in Fig. 2. We sketch the crevasse in two hypothesized temporal states, as concluded in Sect. 4, on the basis of C10, CDK, and CDM ice core data presented in Sect. 3. Table 1 summarizes the main characteristics of the three ice cores and basic findings related to radiometric analyses.

Figure 3(a) CDD thickness changes between 1993 and 2017. The contour lines of surface topography correspond to the 1993 surface (adapted from Vincent et al., 2020), with a modeled flowline overlaid (color scale on top), which reports the calculated arrival depth at the drill sites of C10, CDK, and CDM (black star) (Gilbert et al., 2014). Note the direction of the flowline which is not perpendicular to the surface topography but is mainly controlled by the bedrock topography. The crevasse location (blue line) is based on the 30 June 2004 aerial photo from IGNF (see Fig. 2). (b, c) Schematic representation of the origin of the 210Pb anomalies found at the drill site following the ice flow model of Gilbert et al. (2014), extracted along the flow path reaching the drill site. The crevasse is indicated approximately at its observed upstream position, but its width is not drawn to scale. Isochrones are marked in red and flowlines in green (see also Sect. 4). The grey-shaded zone indicates firn, and the dotted zone indicates the snow bridge over the crevasse. Note that the two thick green flowlines enclose approximately the depth section in the ice cores affected by the 210Pb anomalies. The sketch shows that the upstream origin at the crevasse location of the lower flowline coincides with the firn close-off depth. The upper flowline originates higher up in the firn at the crevasse location and is here hypothesized to coincide with the lower end of the snow bridge. Based on our conclusions derived from the C10, CDK, and CDM ice core data (see Sects. 3 and 4), two states of the crevasse are suggested: (b) in the years ∼1965–1970 (i.e., ∼25–30 years before the C10 drilling), the crevasse is open to the bedrock but sealed from the atmosphere by a snow bridge. In this state, 222Rn and 210Pb accumulate and reach concentrations well above atmospheric conditions in the crevasse and the surrounding firn. (c) After ∼1975 and at least until ∼1990 (i.e., ∼25–30 years before the CDK and CDM drilling), the crevasse could have been partly open to the atmosphere. In this state, 222Rn and 210Pb concentrations in the crevasse and the surrounding firn are strongly reduced compared to those shown in panel (b). Due to the infill of the crevasse by glacier flow and snow from above, either missing or a doubling of ice layers in the ice flowing downhill is possible, as indicated by the orange and pink arrows (see also in the main text).
Table 2Analytical methods of ice core analysis used for the present study.

2.2 Ice core analysis
Table 2 reports the analytical methods of ice core analysis used in this study. 3H analyses in CDK (Legrand et al., 2013) and CDM ice were performed at the Institute for Environmental Physics (IUP), Heidelberg University, by low-level gas counting with a detection limit typically around 1.5 TU (tritium units) and a mean measurement error (depending on measurement time and sample size) in the sample set presented here of 1.5±1.2 TU. 3H analyses using liquid scintillation counting with a mean error of 2.5±2.7 TU (for the samples presented here) in CDM ice were also performed at the Climate and Environmental Physics (CEP) division of the Physics Institute, University of Bern, using ice core samples at a higher depth resolution than used at IUP.
210Pb samples of CDK and CDM ice were analyzed at IUP by α spectrometry for its decay product, 210Po. Typical blank values of (5.7±2.5) × 10−5 Bq for 210Po and (3.8±1.6) × 10−5 Bq for 209Po were subtracted from the sample counts (see Stanzick, 2001, and Elsässer et al., 2011, for further analytical details). With typical sample masses of 300 to 1000 g and measurement times of 2 to 6 d, mean 210Pb measurement errors of 4±4 mBq kg−1 were achieved for ice core drill chip samples spanning ice core depths between 0.6 and 1 m. Previously reported 210Pb measurements in C10 ice (Vincent et al., 1997) analyzed at the Laboratoire de Glaciologie et Géophysique de l'Environnement (now Institut des Géosciences de l'Environnement, IGE) were complemented by two additional samples. The analytical technique used was high-resolution gamma-ray spectrometry, designed to detect very low levels of radioactivity using a 20 % high-purity Ge (N-type) detector, with an anti-Compton scintillation detector (Pinglot and Pourchet, 1995) for which snow and ice samples were previously filtered through ion exchange papers (Delmas and Pourchet, 1977). We note that the gamma-ray method is less sensitive than α spectrometry due to the high conversion of the low-energy γ line at 46 keV (96 % in the form of electron and only 4 % in the form of γ emission) (Gäggeler et al., 2020) and may have systematic differences. Although for a sediment sample with much higher specific 210Pb activities than found in ice cores, Pinglot and Pourchet (1995) made a direct comparison of 210Pb alpha- and gamma-ray measurements. They found that the measurements made with α spectrometry were only % of the respective values obtained with gamma spectrometry and attributed the difference to insufficient acid leaching during the α spectrometry sample preparation. However, both methods generally provide comparable activity values and the relative temporal variations in the activities should be robust. Vincent et al. (1997) did not assign uncertainties to their analyses. Here, we estimate the uncertainty based on what has been reported in other studies using this detection method developed at IGE. Pinglot et al. (2003) reported a detection level of 10 mBq at a 97.5 % confidence level for 3 d of counting for ice core samples with a typical 210Pb activity of 20–50 mBq kg−1. These measurements included Chernobyl fallout in sub-Arctic glacier sites, and the levels were similar in range to the background activities of 50–100 mBq kg−1 found in our cores. On the other hand, detection levels of 13 (and 25) mBq were calculated at 97.5 % confidence when peak interferences were neglected (or considered) for a 10 g sediment sample containing 210Pb activities 1000 times higher than those found in ice cores (∼70 Bq kg−1), and that was measured for 63 h (Pinglot and Pourchet, 1995). Vimeux et al. (2008) reported a lower detection limit of 4 mBq kg−1 for 210Pb measurements (activities between 20 and 100 mBq kg−1) on relatively small (150–250 g) ice core samples from Patagonia.
The 210Pb activities in C10 ranged from 50 to 700 mBq kg−1, with the measurements done on the C10 drill chips merged over 3 to 5 m, allowing for the obtainment of sample weights of ∼3 to 5 kg. Since these sample masses, the sample type (ice core sample), and the geometry (filter) are comparable to those used in the Pinglot et al. (2003) study but are very different from the sediment sample in Pinglot and Pourchet (1995), we assume in the following a detection level of 10 mBq, assigned by Pinglot et al. (2003), and a maximum uncertainty of 30 mBq for all C10 210Pb measurements. Taking 1 kg sample mass as an absolute lower limit, this amounts to a total error of 30 mBq kg−1. Note that the dataset from Vincent et al. (1997) was complemented by two additional samples for which the 210Pb analysis and quality control were not available in 1997. With measured activities of 760 and 460 mBq kg−1 of 210Pb, these samples were initially suspected to be contaminated and were not included by Vincent et al. (1997). Re-measurements of the respective ice core sections using samples extracted from the center of the core, however, confirmed the initial values, so they must be considered valid and were included in the dataset of this study.
We stress that although 210Pb was measured continuously on discrete samples covering the whole C10 ice core, 210Pb measurements in CDK and CDM were focused on the 210Pb anomaly starting around 80 m depth. Therefore, only pointwise measurements with sample lengths between 0.6 and 1 m in length (i.e., covering less than 1 year) were made in the upper part of the latter two cores, with the exception of two CDM samples which were integrated over core depths of 10 m each (covering 2 and 4 years).
Ionic species were analyzed continuously on discrete samples using ion chromatography along the upper 35 m of the CDM core at IGE (Eichler et al., 2023). Regular continuous flow analysis (CFA) of the CDM core, including measurements of nitrate (NO) and ammonium (NH), were made at the Desert Research Institute (DRI) in Reno from 45 to 86 m depth (see Legrand et al., 2018, and references therein). Additional NO and NH data that are useful for establishing an age scale by annual layer counting at CDD (Preunkert et al., 2000) were obtained on CDM ice with CFA measurements conducted at CEP along the whole ice core.
Details of the CFA analyses at CEP are provided in Kaufmann et al. (2008), Gfeller et al. (2014), and Erhardt et al. (2022). However, since the CDM ice core only has a 3 inch (7.5 cm) diameter, the ice available for the CFA analyses at CEP consisted only of a non-rectangular cross section with maximum outer dimensions of 2.5×3.0 cm instead of the standard quadratic size of 3.5×3.5 cm for which the standard melt head at CEP is designed. Although a special, smaller melt head was constructed for the CDM analyses, it was not always possible to ensure that the CFA meltwater only came from an inner section of the ice material with no contact with the outer surfaces. This may have led to a higher risk of contamination of the inner sample meltwater stream and, with the smaller meltwater flow available, also implied a reduced analyte spectrum. Despite the undersized core section available for the CFA analyses at CEP, 86 % of NO and/or NH raw data could be evaluated. To test the reliability of the CEP dataset, the nitrate profiles obtained at DRI and CEP (covering 97 % in this depth range) were compared at the depth interval from 45 to 86 m. Both datasets are in very good overall agreement, except in the case of individual outliers in the CEP data.
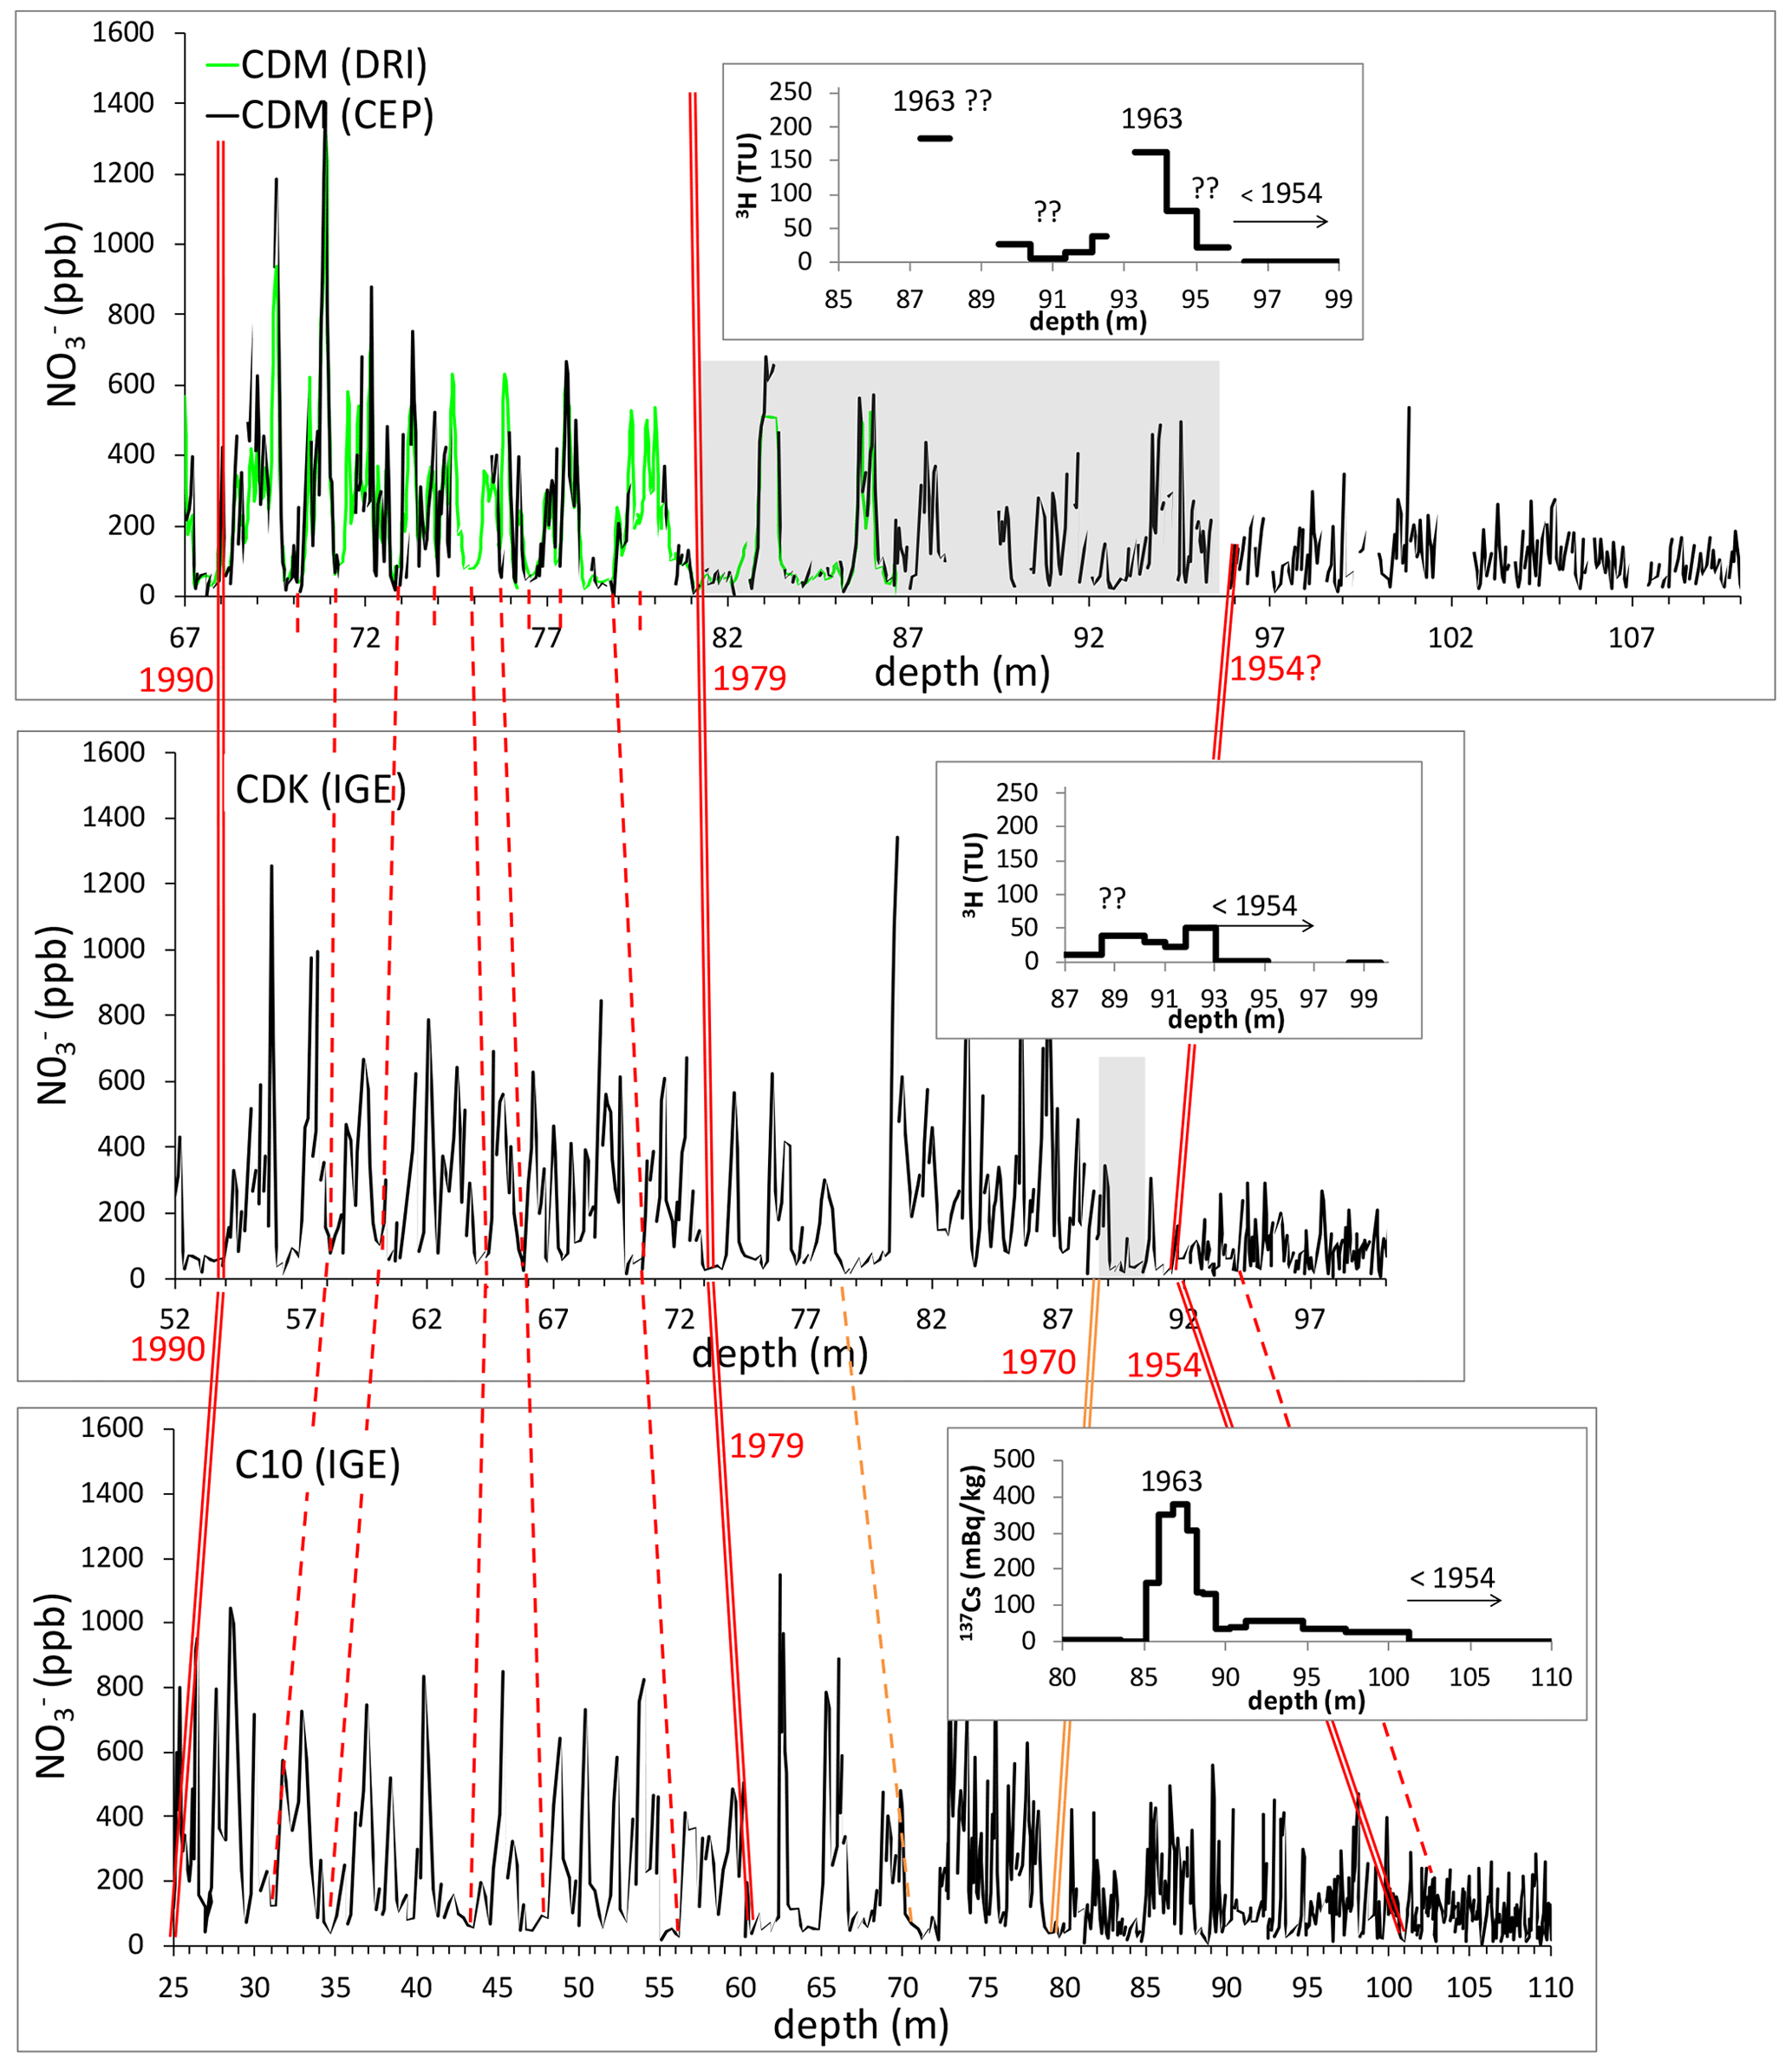
Figure 4Comparison of nitrate depth stratigraphies for CDM (this study), CDK (Legrand et al., 2013), and C10 (Preunkert et al., 2003). In addition, for each core, the bomb test horizons in 3H are reported (this study for CDM; Legrand et al., 2013, for CDK; and Vincent et al., 1997, for C10). Double and dashed red lines indicate common years found in all three cores. Double and dashed orange lines assign common years found only in C10 and CDK. Finally, short dashed red lines mark annual layers in the upper undisturbed part of CDM. Grey zones mark depth layers with apparent stratigraphic anomalies in CDM and CDK (see main text). Note that the chronological changes in the NO3 concentrations are offset in depth relative to each other due to the different years the cores were drilled.
After having additionally discarded very high peaks (concentrations above 700 ppb) in NO values (1.5 % of CEP data at the depth interval from 45 to 86 m), which were not present in the DRI dataset and could be attributed easily to contamination, mean NO values over this depth interval were 263±281 ppb (CEP) and 255±231 ppb (DRI) (Fig. 4). The agreement is somewhat weaker for NH, which is likely because for this species only 80 % of this depth range is covered by CEP measurements. After discarding an additional 8 % of the CEP NH data between 45 and 86 m consisting of high NH peaks (concentrations exceeding 190 ppb), which were not present in the DRI dataset, the mean NH values of 101±110 ppb (CEP) and 95±99 ppb (DRI) were in good agreement. As a consequence of the better reliability, we base our discussion mainly on the NO data. Below 86 m, no additional data were discarded from the CEP NO and NH datasets. However, because no further single NO peak values above 700 ppb were found below 86 m, we are confident in the NO data below this depth. In the case of NH, we cannot exclude that a few peaks in the record below 86 m with a concentration higher than 200 ppb might be influenced by contamination.
3.1 Ice core dating
The net annual accumulation in the upper layers of the drill site covering the upper 15 years is, on average, 2.5 m water equivalent (m w.e.) (Table 1) and typical at high-Alpine glacier sites (Vincent et al., 2020; Bohleber, 2019). The surface mass balance observed in the upstream area of the drilling site (i.e., upwind in the southeastern Dôme du Gôuter flank; Fig. 2) decreases by 1 order of magnitude and reaches only ∼0.2 m w.e. yr−1 at the summit of the Dôme du Gôuter (Vincent et al., 1997, 2020), where the glacier thickness is only ∼40 to 45 m. We point out that due to the much lower accumulation rate in the Dôme region, the firn–ice transition is also much shallower than in the lower-outflow regions, where higher vertical velocities move this transition downward. In addition to the annual layer thinning caused by the glacier flow, the upstream net accumulation decrease, which is accompanied by a decrease in the winter-to-summer net snow accumulation rate, also impacts the annual layer thickness at the drill site. As a consequence, annual layer thicknesses of only 0.7 and 0.2 m w.e. are observed at 100 and 118 m depth (Preunkert et al., 2000), and the winter-to-summer layer thickness ratio (which was calculated using the seasonal information embedded in the various aerosol tracers measured in the core; Preunkert et al., 2000) decreases from 1 at the surface to ∼0.5 at 100 m depth.
Based on the well-marked seasonality in the chemical stratigraphy for all cores, annual layer counting was used as the main dating tool during the time period of interest in this study (i.e., back to the 1950s). NH has a very strong seasonal variation (a factor of ∼14 higher in summer than in winter) caused by the parallel seasonal changes in source strengths and vertical transport of NH (Preunkert et al., 2000). However, other ions (such as nitrate and sulfate) also show clear seasonal variations (a factor of ∼4 higher in summer than in winter). The annual layer counting, which was based mainly on ammonia, was reinforced by absolute time markers such as Saharan dust events (for example, the prominent event in 1977) (Preunkert et al., 2000, for C10; Legrand et al., 2013, for CDK; Legrand et al., 2018, and this study for CDM) and radiometric analyses aimed at detecting fallout from atmospheric thermonuclear bomb testing via 3H (Legrand et al., 2013, for CDK and this study for CDM) and 137Cs (Vincent et al., 1997, for C10). Fallout from atmospheric thermonuclear bomb testing typically leads to elevated 137Cs and 3H levels from 1954 to about 1975, with maxima in 1963 if the depth–age relationship is well preserved. The 210Pb depth profiles (Vincent et al., 1997, for C10) were also obtained in the three ice cores, but because of the presence of the strong anomalies discussed in Sect. 3.2, these data are not useful as dating tools.
3.1.1 The C10 core
The dating of the C10 ice core back to 1925 obtained by annual layer counting of the ammonium record and supported by absolute time markers was initially established by Preunkert et al. (2000). More recently, new measurements of toxic metals such as lead, cadmium, and thallium underpinned the identification of an additional absolute time marker, visible as a marked concentration increase in all three metals at the beginning of the industrial period, which allowed for the extension of the C10 chronology back to 1890 (Legrand et al., 2018). This additional information did not significantly change the original dating back to 1935 (i.e., only by 1 year back to a depth of 106.5 m and by 5 years at a depth of 112 m), and these changes are within the estimated dating uncertainty of 5 to 10 years (Preunkert et al., 2000).
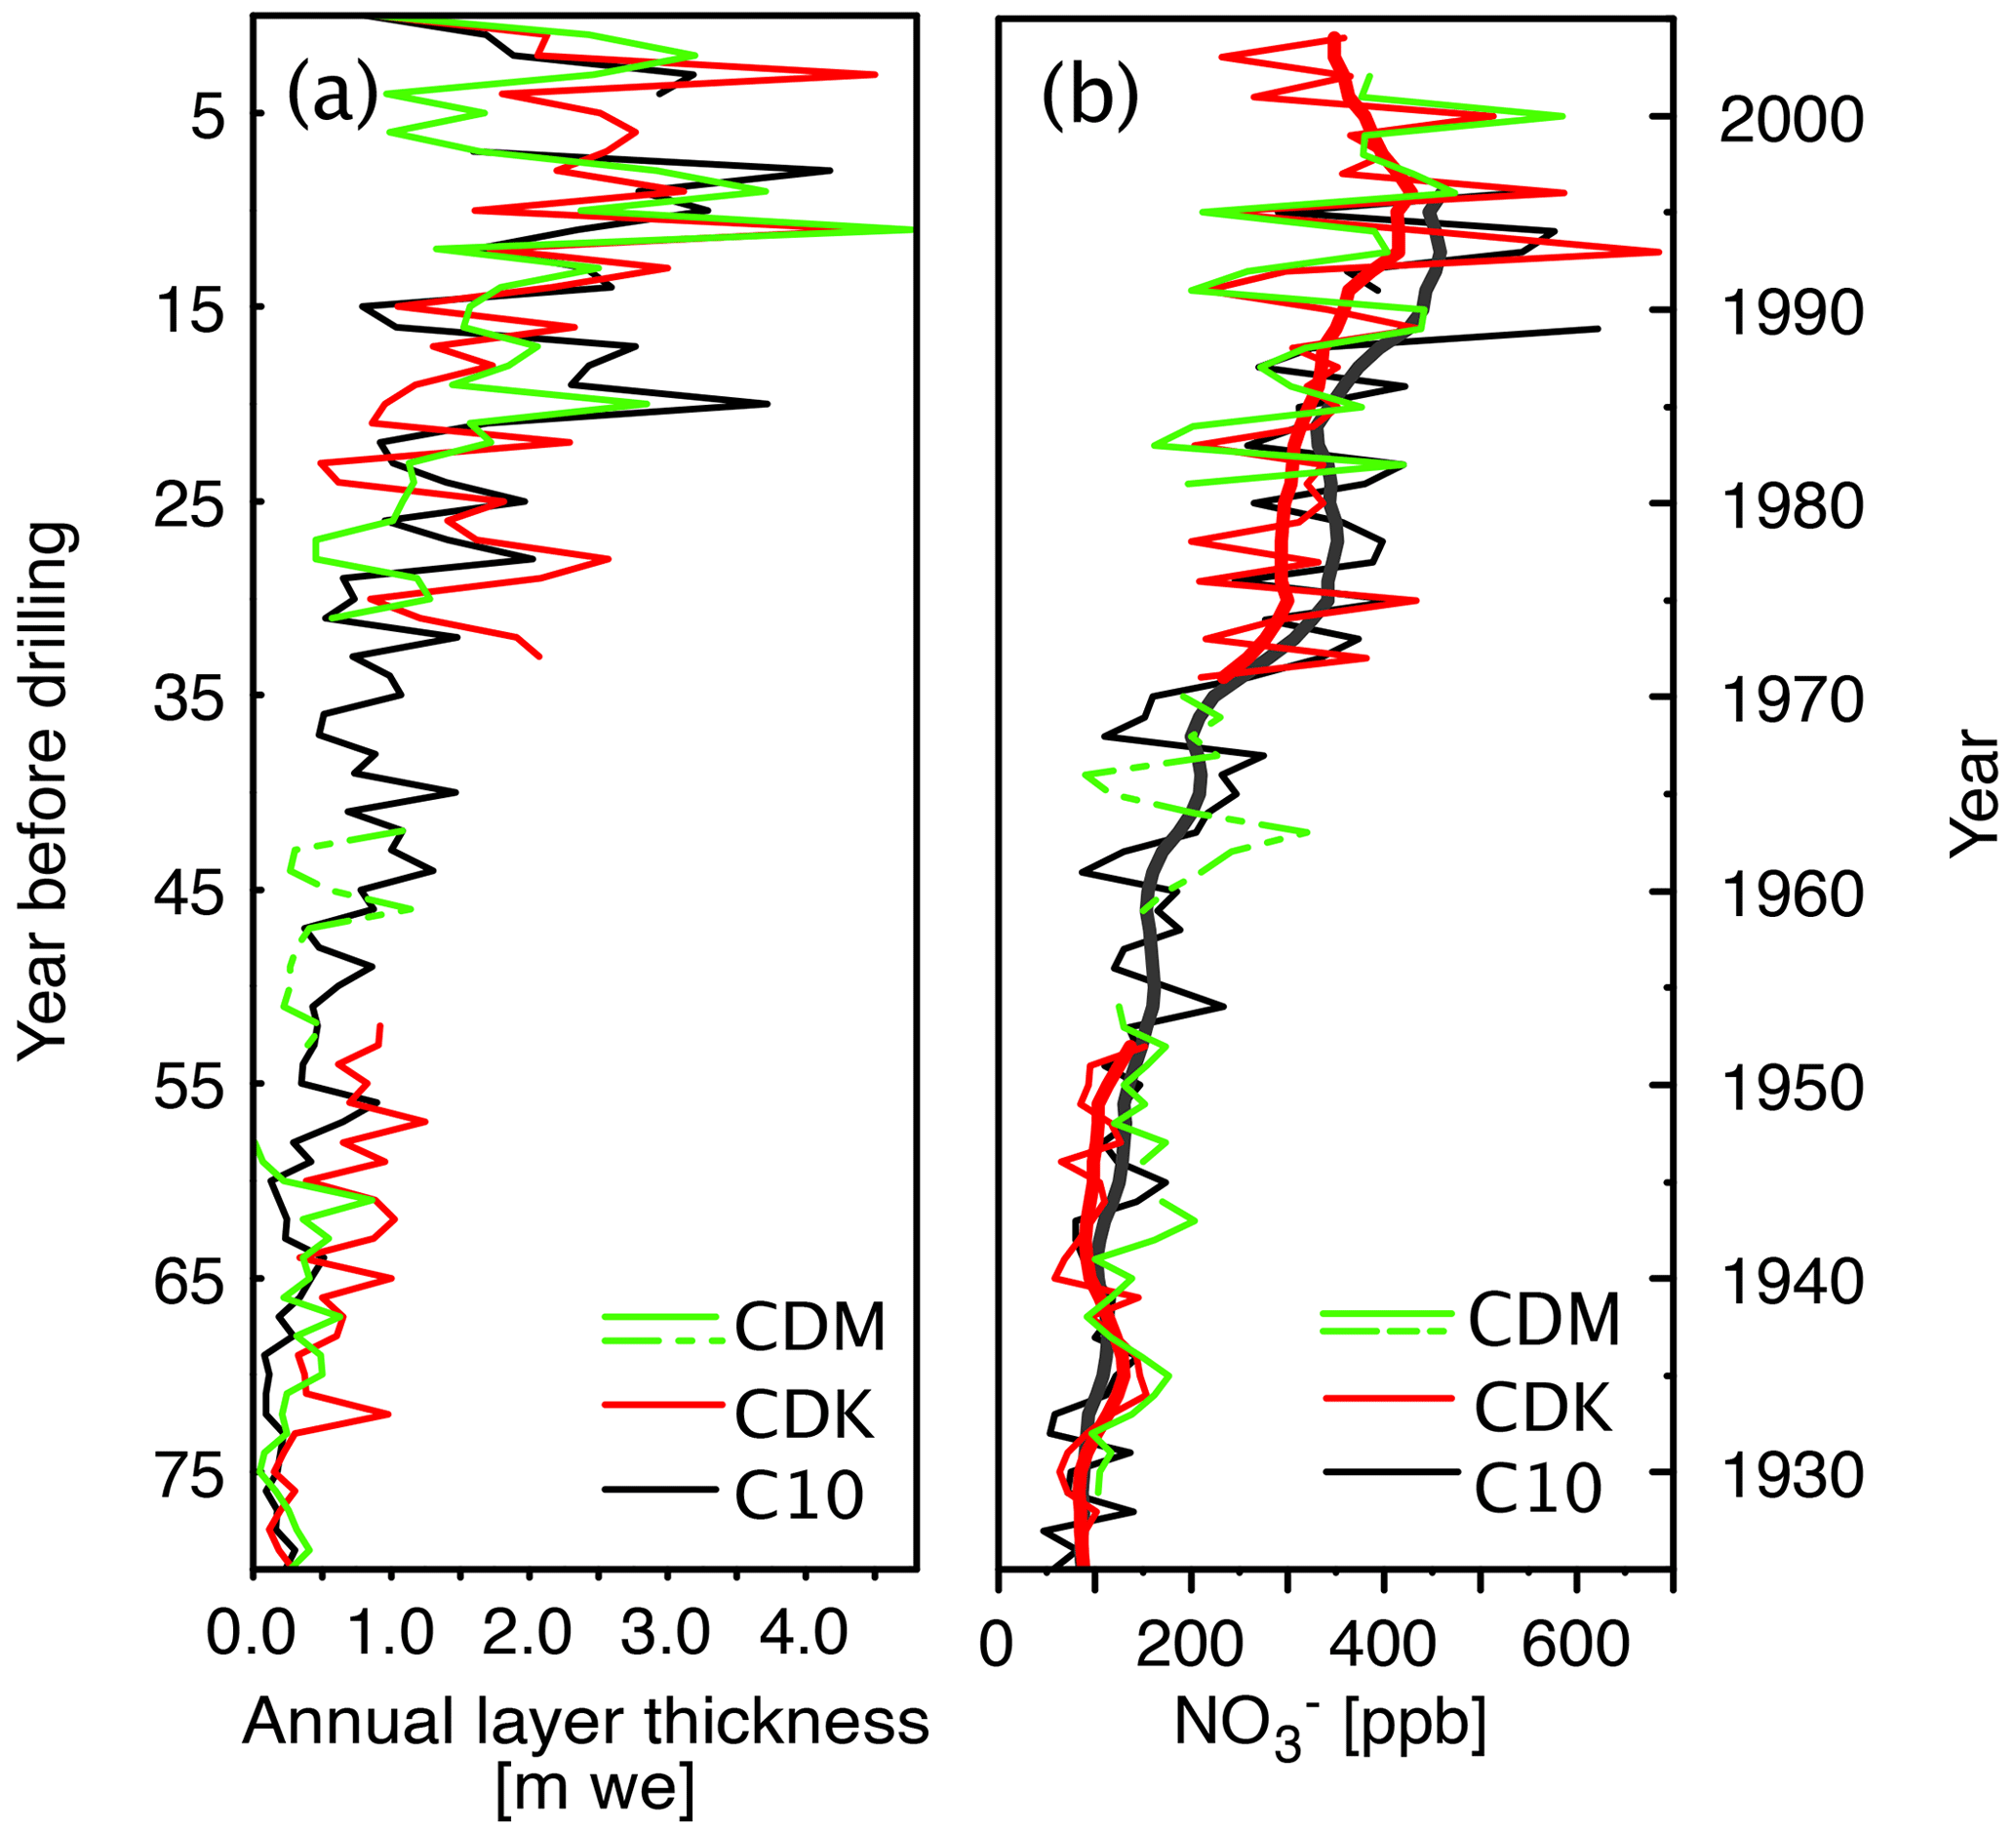
Figure 5(a) Annual layer thickness of C10 (adapted from Preunkert et al., 2000), CDK (adapted from Legrand et al., 2013), and CDM. For CDM, the annual layer thickness is estimated via ammonium stratigraphy back to 1980 and via nitrate (and ammonium) stratigraphy further back in time (Sect. 3.1.3). (b) Comparison of nitrate summer half-year means of C10 (adapted from Preunkert et al., 2003), CDK (adapted from Legrand et al., 2013), and CDM. The thick solid lines for C10 and CDK refer to the smoothed profiles (single-spectrum analysis; see Legrand et al., 2013). CDM depth intervals for which the dating is uncertain (Sect. 3.1.3) are marked with dashed lines.
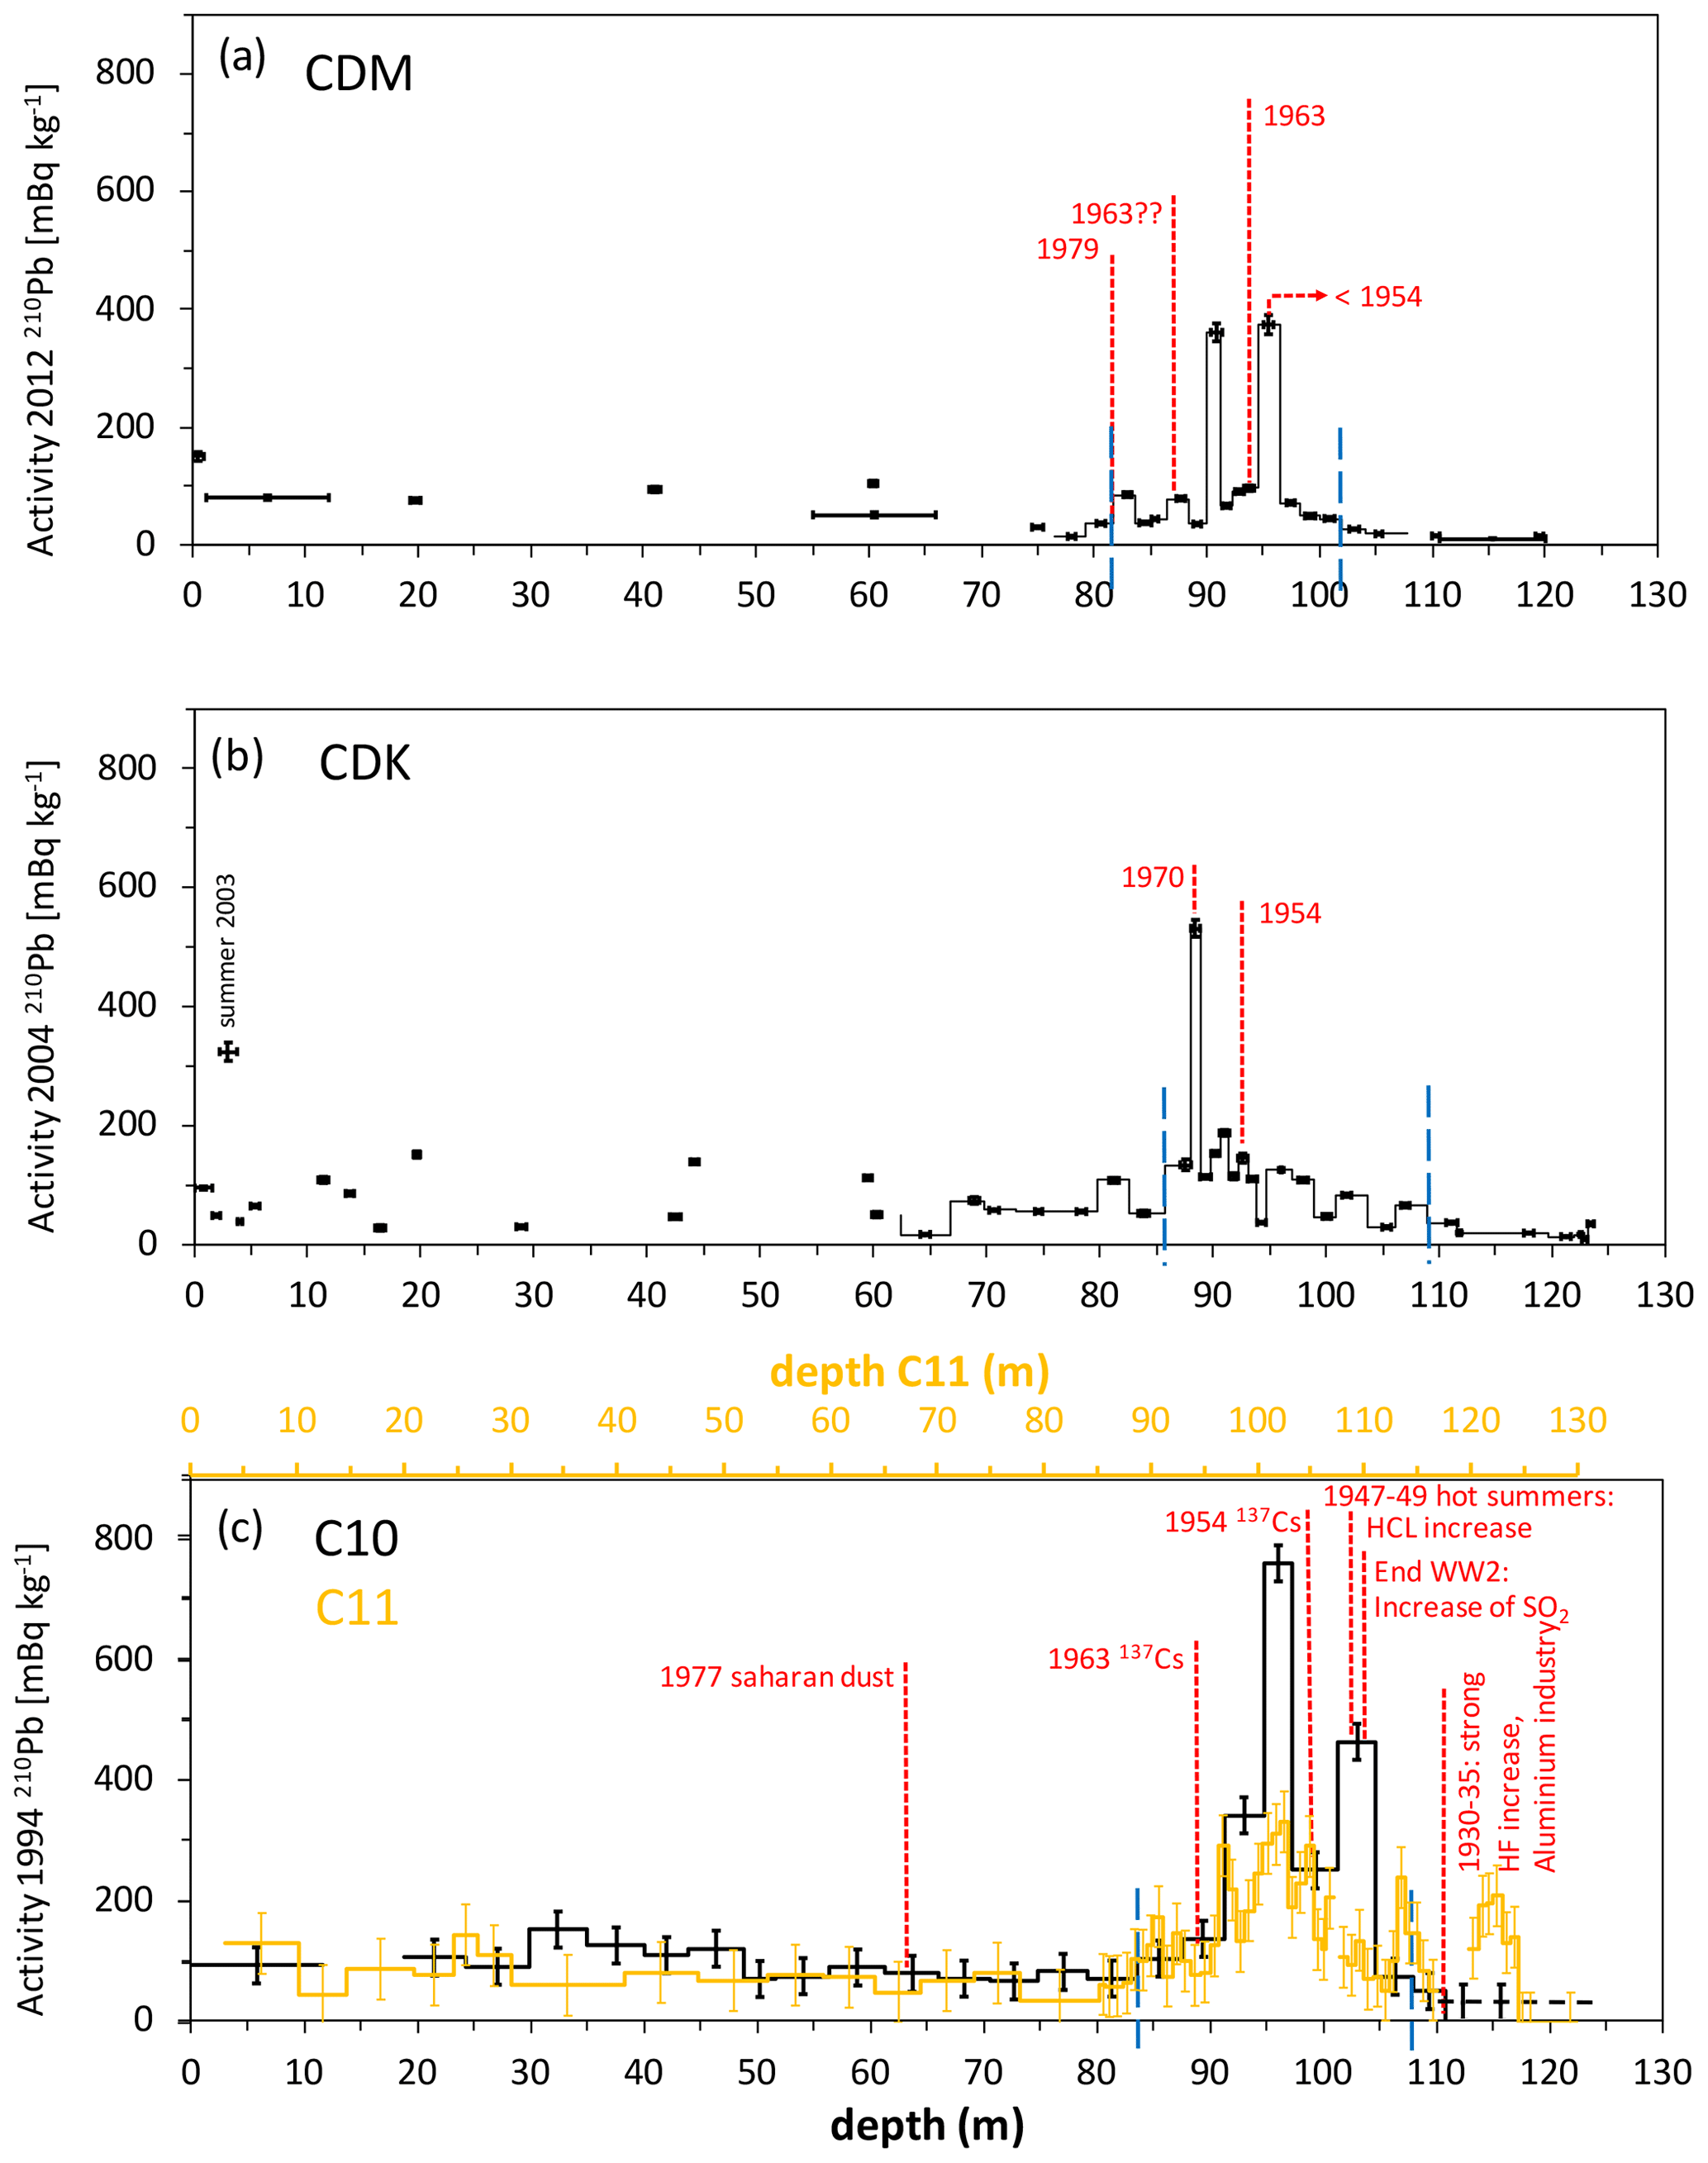
Figure 6210Pb profiles of the CDM (a), CDK (b), and C10 (c) ice cores. The 210Pb activity (only corrected for the decay of 210Pb between the drilling and analysis dates and not for the travel time from the crevasse to the drill site) is shown. For CDM (a) and CDK (b), the depths covered by the samples are plotted in thick black lines, whereas the thin lines are given to guide the eye and were used to calculate the 210Pb inventories. C10 210Pb data (c) (lower x axis; black) from Vincent et al. (1997) and this study are compared to those from a 140 m long ice core extracted 30 m away from C10 also in 1994 (labeled as ice core 2 in Vincent et al., 1997, and denoted here as C11, in orange on the upper x axis in panel c). The depth scale of C11 was aligned to achieve a match in depth in 1963 and 1954 of the respective 137Cs signals. Vertical dashed blue lines indicate the approximate boundaries of the anomaly (see also Fig. 7). When available, absolute time markers detected over the 210Pb perturbed depth zones are also reported.
The updated C10 chronology is reported in Fig. 1. The agreement between the results of the annual layer counting and several time markers in C10 shows that the depth–age relation is continuous and age increases monotonically with depth. The dating of the C10 core was found to be in excellent agreement with several pronounced atmospheric changes or events that occurred during the 20th century such as the 137Cs peak caused by the fallout of nuclear weapon testing (Vincent et al., 1997), the well-marked increase in fluoride after 1930 resulting from the rapid growth of the aluminum industry (Preunkert et al., 2001b), the large increase in sulfate after World War II (Preunkert et al., 2001a), and hydrochloric acid (HCl) peaks during the unusually hot summers from 1947 to 1949 caused by large forest fires (Legrand et al., 2002). Several of these events are recorded within the C10 depth interval where increased 210Pb values were observed (Vincent et al., 1997; Fig. 6; and Sect. 3.2). Thus, we can assume that the depth–age relation of the C10 core was not disturbed (i.e., by more than the dating uncertainty estimated to be ±5 years at a depth of 90 m; Preunkert et al., 2000).
3.1.2 The CDK core
As done for the C10 core, the dating of the CDK ice core was primarily achieved by annual layer counting. However, the seasonality of ammonium, as well as that of other major ions such as nitrate and sulfate, cannot be discerned below 89.5 m but recovers at depths lower than 92 m (Legrand et al., 2013). Since the CDK 3H profile does not show a clear bomb maximum of similar magnitude as in the other cores, Legrand et al. (2013) previously hypothesized that net snow accumulation corresponding to a few years around 1963 is missing due to the existence of an upstream crevasse but suggested neither a reasonable glaciological mechanism for this effect nor an explanation for which reason it appeared in CDK and not in C10. The comparison of ammonium, nitrate, and sulfate mean summer concentrations in the CDK core with those in C10 layers deposited above 89 m and below 92.0 m depths, however, suggests a reliable CDK record for the time interval 2004–1970 and for a few decades prior to ∼1954 (see Legrand et al., 2013, and Figs. 4 and 5). Analogous to C10 (see Sect. 3.1.1), the CDK dating was updated in the lower part on the basis of additional measurements of trace metals such as lead and cadmium without significantly changing the original dating of Legrand et al. (2013) back to 1935 (Preunkert et al., 2019a).
A closer look at the NO and NH raw data in CDK shows that the depth interval from 80 to 89 m appears to correspond to 72 to 79 m depth in C10 and may be attributed to the years 1976–1971, as done by Legrand et al. (2013). However, this 5-year period spans 2 m more in CDK than in C10, corresponding to a relative thickening of layers by a factor of 1.28. Such an anomaly in the thinning curve cannot be explained by the systematic layer thinning at the drill site caused by undisturbed upstream inflow of ice (see also Fig. 3) along the same flowline for CDK and C10. However, refilling the void of the crevasse by the inflow of ice from upstream may explain such a thickening.
3.1.3 The CDM core
Ionic species were analyzed as discrete samples using ion chromatography along the upper 35 m of the CDM core at IGE. From 45 to 86 m depth, sections were measured using CFA at DRI (Legrand et al., 2018). These previous data were complemented by CFA measurements (NO and NH) performed at CEP. Figure 4 shows sequences of the CDM depth profile for nitrate in comparison with those from CDK and C10. Down to 81 m depth, the nitrate CDM stratigraphy matches those from C10 and CDK, where this depth is dated to 1979 based on annual layer counting, very well. For the interval 1992–1979, the annual layer thickness in CDM is approximately half of that in CDK, which is expected since the corresponding ice layers are deeper in the CDM core than in the CDK one (hence more thinned by glacier flow and deposited further upstream of the drill site). Below 81 m depth, the CDM depth profile differs from those of the two other cores. The three NO peaks between 81 and 88 m depth in the CDM core (Fig. 4) could potentially be attributed to those seen between 73.2 and 78 m depth in CDK, but this would imply an annual layer thickness 1.75 times larger in the CDM than the CDK core. Again, this could only be explained by anomalous thinning (relative thickening of layers at great depth) caused by some crevasse-induced flow anomaly. In addition, the preceding assumption that the three nitrate peaks between 81 and 88 m depth in CDM date to 1978, 1977, and 1976 is in conflict with the 3H level found in this core (see Fig. 4). Interestingly, although a winter-to-summer layer thickness ratio of ∼0.55 is expected at ∼80–100 m depth from the C10 core (see Sect. 3 and Preunkert et al., 2000), a very high winter-to-summer layer contribution (>2) is observed in the CDM core between 81 and 88 m depth. Such an unexpectedly high winter-to-summer contribution was also observed in CDK between 89.5 and 92 m depth (i.e., where the NH seasonal cycle vanished). In summary, an anomaly in the ice stratigraphy occurs between 81 and at least 88 m depth in the CDM core.
The inset in Fig. 4 (top panel) shows the 3H profile measured on CDM ice core samples. Ages were assigned according to the expected 3H concentrations based on comparison with values obtained in a high-resolution ice core from Fiescherhorn, Switzerland (Schotterer et al., 1998). Strikingly, we find not one but two distinct peaks of 183.1±9.7 TU and 162.7±8.8 TU (one tritium unit, TU, being equal to 0.12 Bq L−1) less than 6 m apart in the depth intervals 87.29 to 88.2 m and 93.29 to 94.1 m depth, respectively. Both maxima are close to the 3H peak value normally reached in 1963. Note that analytical or sample handling errors can be excluded since this anomaly has been confirmed by independent measurements made on different aliquots. Measurements on drill chips of the ice core at 87–88 m depth made at IUP indeed revealed 212 TU compared to 183.1 TU measured at CEP.
Based on the undisturbed depth–age scale of core C10 drilled 18 years before CDM, the 1963 maximum would be expected at about 105 m depth in CDM (49 years before the 2012 drilling year). Below 96.3 m depth, the 3H profile of CDM shows low values, suggesting the ice is older than 1954. Relative to the disturbed depth–age relation in CDK, drilled 8 years before CDM, a 49-year-old ice layer should be located at 92 m depth (i.e., close to the deeper 3H peak observed in CDM). We therefore assume at this stage that the 3H peak observed between 93.29 and 94.1 m depth in CDM ice corresponds to 1963 but that this 1963 layer is part of a disturbed stratigraphy in both CDM and CDK. In addition, the equally high 3H value at around 87.5 m depth in the CDM core may point to a doubling of the same ice section in the disturbed stratigraphy.
Following what is expected from the Fiescherhorn depositional record, a mean TU value around the 1963 peak should be 10 to 40 TU in the years 1958–1975. This is consistent with the observed value in CDM ice above and below the deeper 3H peak (which is around 93.5 m depth). Since the 3H profile is available only at a coarse resolution (75 cm long samples), it is not possible to be more accurate in dating the bomb test period (1954 to ∼1976). Further arguments as to whether the ice layers around the deeper 3H peak in the CDM core are well preserved were not conclusive. For example, if we assume that the profile is continuous between 93.3 and 96.3 m depth (i.e., 1954 as indicated by 3H data), this would imply an annual layer thickness of 0.28 m w.e. over the 1963–1954 period, which is similar to but (as expected from glacier flow) lower than what is seen in the C10 core (0.4 m w.e.). On the other hand, the NH and NO depth stratigraphies from CDM do not agree with those of C10 for this depth interval. Because of decreasing anthropogenic emissions back in time, we consistently observed a decreasing trend in NH and NO concentrations with age in the C10 ice (mean summer values for the period 1964–1968 – NH: 110 ppb; NO: 178 ppb; for 1963–1954 – NH: 95 ppb; NO 140 ppb). This feature, however, is not detected when comparing summer NH and NO means in CDM ice above and below the 1963 peak at 93.3 m. Over the 88 to 93.3 m depth interval in CDM ice, we observed mean summer NH and NO concentrations of 90 and 175 ppb, respectively, which are lower than those between 93.3 and 96.3 m depth (NH: 116 ppb; NO: 193 ppb; see also Fig. 4 for NO). Finally, annual layer counting based on the CDM nitrate or ammonium profiles suggests only 4 years instead of 9 years for the 93.3–96.3 m depth interval (i.e., from 1963 to 1954). If the shallower 3H peak is considered to be the true 1963 maximum, this would mean that a hiatus of 16 years exists in the CDM record between 1979 at 81 m depth and 1963 in 87.3 m depth. The depth layers between 88 and ∼93.3 m depth would then correspond to years prior to 1963. This assumption is again in contradiction with the mean summer levels of NH and NO observed in C10 for this period (see discussion above). Another stratigraphic perturbation is therefore required to produce the deeper 3H maximum at 93.3 m.
In summary, our results suggest a continuous depth–age relation for the CDM core from the surface back to 1980 and for years prior to ∼1954 (96 m), implying a disturbed interval in between encompassing at least 25 years in this core. However, to confirm the assumption of the recovery of an undisturbed depth–age relation prior to 1954, further investigations of additional absolute time markers (as done in C10 ice; see Sect. 3.1) are needed in the future before the lower part of the CDM core can be used as an archive of past atmospheric changes.
3.2 A 210Pb anomaly in the three records
Figure 6 reports the 210Pb activity depth profiles of C10, CDK, and CDM. A 210Pb activity anomaly is found in all three cores in the depth interval of about 80–105 m below the surface, despite the drilling dates of the three cores differing by 10 years between C10 and CDK and another 8 years between CDK and CDM. Thus, this 210Pb anomaly is not a signal that has been deposited at the glacier surface, as this would require the anomaly to be found at a greater depth in the more recent cores. In contrast, we assume that the ice affected by this 210Pb anomaly comes from the same vertical depth interval of the firn column at or close to the crevasse wall and, thus, flows into the ice core site always at the same depth interval (roughly indicated by the two thick green lines in Fig. 3).
As we do not know the exact time this 210Pb anomaly was imprinted in the firn column, and as the travel time from the crevasse to the drill site differs by a few years depending on the depth of the ice, the 210Pb profiles in Fig. 6 are not corrected for the decay, which has been in progress since the imprint of the anomaly in the firn column, and its recovery in the ice core. As the travel time is a few decades and, thus, on the same order as the decay time of 210Pb (half-life of 22.3 years), this implies that the initially imprinted 210Pb signal at the crevasse was 2–3 times higher than displayed in Fig. 6. We stress that although 210Pb was measured continuously on the C10 ice core, 210Pb measurements on CDK and CDM were focused on the 210Pb anomalies starting below 80 m. Therefore, only a few samples with limited depth and time coverage are available in the upper parts of CDK and CDM. However, comparing 210Pb levels of the shorter CDM samples with the two samples integrating 2 and 4 years and in view of the limited seasonal variation (with the exception of the outstandingly hot summer of 2003) observed in Fig. 7, we assume the sample lengths and coverage are good enough to depict the order of magnitude of 210Pb activities in the upper parts of the cores.

Figure 7210Pb profiles of the CDK ice cores (left y axis; black) together with corresponding SO concentrations (right y axis; red) for the top 6 m (a) and the entire core (b). Note that in panel (b), the CDK 210Pb record is tentatively corrected versus the respective snow deposition dates of the ice layers based on the CDK ice core chronology (see also Fig. 4 and Sect. 3.2). To avoid a potential overestimation of 210Pb activities between 85 and 92 m due to the dating uncertainty, the recent date limits of the uncertainties were assigned to the samples. A thin line is given to guide the eye, whereas the depths covered by the samples are assigned with thick lines. The vertical dashed blue lines in panel (b) indicate the approximate boundaries of the anomaly.
In the following, we discuss how this 210Pb anomaly might have been imprinted in the firn column at or close to the crevasse. 210Pb is produced through radioactive decay of the noble gas 222Rn (half-life of 3.8 d), which is an intermediate product in the normal radioactive decay chain of thorium and uranium, and it is emitted from the ground. 222Rn is almost entirely produced from radium in soils, particularly when granitic rocks are present. 222Rn is released from soils into the atmosphere (Dörr and Münnich, 1990; Turekian et al., 1977), and its atmospheric sink consists of its radioactive decay producing 210Pb, which becomes immediately attached to submicron aerosol particles (Whittlestone, 1990; Sanak et al., 1981). Typical atmospheric background activities at high-elevation Alpine sites are 3–5 Bq m−3 for 222Rn, and typical background 210Pb activities in surface snow samples are 70–100 mB kg−1 (Griffiths et al., 2014; Gäggeler et al., 2020). Accordingly, anomalously high 210Pb activities can be found over the depth interval of 80–105 m in the not-decay-corrected records in Fig. 6 in each core which cannot be explained by 222Rn decay in the atmosphere.
Overall, three common features can be identified in the 210Pb depth profiles in each of the records. First, in the upper core sections down to 80 m, the 210Pb activities are around 100 mBq kg−1 and on the order of magnitude of those expected from atmospheric deposition at high-Alpine sites (Eichler et al., 2000; Gäggeler et al., 2020). Looking at the continuous 210Pb record in C10 (and C11) (Fig. 6), there is a slightly decreasing trend down to 80 m depth; however, it does not account for the full expected decline by radioactive decay of about a factor of 2, which is expected from the travel time as the ice flows from the surface to the drill site and which is of similar order as the 210Pb half-life. The fact that the expected decrease in 210Pb activities is smaller is not surprising since the 210Pb deposition at the glacier surface is not constant in time and space. Based on atmospheric 210Pb measurements performed at high-elevation Alpine sites (see Hammer et al., 2007, for Sonnblick at 3106 m a.s.l., Austria, and Gäggeler, 1995, for Jungfraujoch station at 3450 m a.s.l., Switzerland), it was shown that the intensity of vertical upward transport of 210Pb-rich continental boundary layer air masses strongly impacts 210Pb levels at high-elevation sites. As a consequence, a strong seasonal cycle with 210Pb concentrations 3 to 4 times higher in summer than in winter is observed at high-altitude Alpine sites. As expected, this is also observed in the snow deposition at CDD and shown in Fig. 7 for the summer of 2004 and the unusually hot summer of 2003, for which an extremely enhanced upward transport was reported previously (Legrand et al., 2005). Together with the systematic decrease in the winter-to-summer layer thickness ratio with increasing core depth down to 75 m (from 1 to 0.6) at the drill site (see Sect. 3 and Preunkert et al., 2000), this pronounced 210Pb seasonality at least partly counteracts the expected 210Pb decrease from radioactive decay.
Second, there is a well-marked anomaly characterized by 210Pb enhancements (including 210Pb peaks up to 8 times higher than the values found in the shallower parts of the three cores despite increasing decay time with depth) (Fig. 6). The anomaly extends over the same depth interval in all cores (∼83 to 108 m depth – i.e., ∼26 to 54 years in C10 ice; ∼85 to 108 m – i.e., ∼32 to 70 years – in CDK ice; and ∼82 to 102 m – i.e., ∼33 to more than 58 years – in CDM ice). The 210Pb anomaly observed in CDK and CDM, however, is less pronounced than in C10. Since winter-to-summer snow ratios lie consistently between 0.5 and 0.6 at the C10 core in the depth interval of the 210Pb anomaly (Preunkert et al., 2000), these increases in 210Pb cannot be attributed to changes in seasonal snow deposition.
The starting depths of the CDK and CDM 210Pb anomalies correspond to the 1970s, for which 210Pb enhancements have been reported at other ice core sites (Eichler et al., 2000) and attributed to an enhanced vertical transport related to the temporal maximum of atmospheric sulfate aerosol acting as transport vehicle. To check whether these atmospheric conditions also could be responsible for the enhancement seen in CDK and CDM, we exemplarily report the CDK 210Pb activity, decay-corrected for its respective deposition date, together with the corresponding sulfate concentration in Fig. 7. As mentioned above, a strong seasonality was detected in the uppermost part of the CDK core for a few years, where 210Pb samples are available in seasonal resolution (Fig. 7a). Due to the convective co-transport of sulfate and 210Pb from the low-altitude boundary layer in summer, a covariation of sulfate and 210Pb is expected, which can be seen clearly in the seasonal variation (Fig. 7). Accordingly, if caused by intensified vertical transport into the free troposphere, we also expect higher sulfate concentrations in the depth interval, where we find the 210Pb anomalies. However, as seen in Fig. 7, the interval of highest sulfate peaks is clearly offset from the decay-corrected 210Pb anomaly, and sulfate concentrations sharply decrease at the depth where decay-corrected 210Pb increases. Thus, the mechanism proposed by Eichler et al. (2000) cannot be invoked in this part of the CDD core. For CDM (not shown), a similar picture appears.
Third, below the anomaly, a 210Pb decrease is observed in the (not-decay-corrected) 210 Pb data in Fig. 6, as would be expected from the increasing age and, hence, decay with depth. It is worth noting that, especially in the case of the CDM and CDK cores, 210Pb activity (after blank correction) is above detection limits even in the bottommost core sections, while in C10, levels are below the detection limit. However, since the age of the bottom core sections at CDD exceeds several half-lives of 210Pb (as for example indicated by radiocarbon dating for CDK; Preunkert et al., 2019b), a near-zero 210Pb activity is expected if the 210Pb is only of atmospheric origin.
As indicated above, we attribute the 210Pb perturbations found at the drill site to the granite bedrock at CDD in combination with the presence of the crevasse upstream of the drill site that resulted in elevated 222Rn levels in the crevasse. In line with this assumption, Pourchet et al. (2000) conducted measurements of 222Rn in snow above a crevasse at the Mont Blanc summit, revealing unexpectedly high values of as much as 145 000 Bq m−3 and free atmospheric background values of a few tens of Bq m−3 at this elevation. Accordingly, the authors suggested the existence of convective 222Rn transport in the crevasse from the underlying fractured granitic bedrock and diffusion into the firn to be the reason.
Since the 210Pb anomalies are located at similar depths in the C10, CDK, and CDM cores (Sect. 3.2) and start in the three cores ∼30 years before the drilling year, we assume that the 210Pb perturbations originate from the same area upstream where the crevasse reached bedrock (at least at some time in the past), which allowed for an imprint of an elevated 210Pb signal in the firn close to the crevasse. Furthermore, since the 210Pb anomalies are restricted to a specific depth zone in the cores, we assume that the exchange of the gaseous 222Rn with the atmosphere is restricted or eliminated at the top by the presence of a snow bridge containing low-permeability summer ice layers as have been observed to occur regularly at the site (Preunkert et al., 2000). Above the firn–ice transition of the glacier and below the snow bridge, increased radiogenic Rn levels can then enter the firn surrounding the crevasse that is closed off by the snow bridge at the top.
The impact of the upstream crevasse on the depth–age relation of the ice cores changed, however, between the C10 core (drilled in 1994) and the CDM and CDK cores (drilled after 2000). Although for C10, an excellent agreement between annual layer counting and independent absolute time markers was also found over the depth interval where 210Pb was influenced by the crevasse (Fig. 6), this is not the case for the CDK and CDM ice cores. In the latter two cores, the 210Pb anomaly comprises the layers for which the depth–age relation was found to be disturbed (see Sect. 3 and Fig. 4). Furthermore, the CDK and CDM 210Pb anomaly inventories (Fig. 6) are 4 times lower than in C10, which cannot be explained by analytical differences in the measurement methods (see Sect. 2.2). We stress that the ice originating from the crevasse had essentially the same travel time from the crevasse to the drill site for a given depth in the case of all three cores. Thus, the 210Pb anomaly imprinted in the firn adjacent to the crevasse was imprinted in different absolute years, as the cores were drilled 10 and 8 years apart. Accordingly, the 222Rn concentration in the crevasse leading to the 210Pb anomaly must not have been the same for all three cores, because of either a change in the bedrock exposure at the bottom or an opening of the crevasse at the top, which would have mixed the crevasse air with low-222Rn atmospheric air.
The spatial variability in the 210Pb anomaly inventory at the CDD site can be estimated by examining the 210Pb inventory of the 140 m long C11 ice core also extracted in 1994 almost at the lowest point of the Col du Dôme saddle, ∼30 m southeast from C10 (Vincent et al., 1997; and see Fig. 6). This core revealed a 210Pb anomaly inventory of 80 % of that in C10. Hence, although this 1994 core does not have exactly the same upstream ice flow characteristics as the three cores examined in this study, this difference is small compared to the difference seen between C10 on one side and CDK and CDM on the other. Again, this suggests that the C10 and C11 core saw similar 222Rn concentrations in the crevasse in the year defined by the drilling date (1994) minus the travel time of the ice from the crevasse to the drill site. In contrast, this point in time was different for CDK and CDM, and the respective 222Rn concentration could have been different.
A bedrock-reaching crevasse (see Fig. 3) capped by snow and ice layers at the top, which is situated within the upstream flowline, would lead to a continuous enrichment of 222Rn and 210Pb within the air volume of the crevasse itself as long as the bedrock is exposed and, since there is penetration of 222Rn into the firn, also in the surroundings of the open part of the crevasse (see the shaded areas in Fig. 3b and c). As mentioned above, the 222Rn derived from the bedrock needs to be sealed off from the atmosphere with the presence of an impermeable snow bridge at the top to allow for high 222Rn levels in the crevasse (see the dotted area in Fig. 3b and c). Below the firn–ice transition, no elevated 210Pb activities are expected, as the diffusion of 222Rn into the adjacent solid ice is too slow. Tracing back the arrival depths of the 210Pb disturbance at the drill site, model calculations made by Vincent et al. (1997) and Gilbert et al. (2014) (Fig. 3a, b, and c) suggest that the origin of the 210Pb anomaly should lie more than 100 m upstream of the drill site, which is in good agreement with visual observations of the crevasse obtained via aerial and ground-based photos (see Fig. 2), and at a depth interval of 20 to 50 m below the surface (thick green lines in Fig. 3). This implies that the firn–ice transition at the crevasse must lie at a depth of ∼50 m (i.e., ∼20 years, as indicated in Fig. 2), which is comparable to the firn–ice transition depth of 50–55 m at the drill site. In contrast, the observed firn–ice transition at the summit of Dôme du Gôuter is located at ∼25 m depth (i.e., ∼100 years; Rehfeld, 2009), in line with the much lower net accumulation rates at that location.
Another question pertains to whether the increased 222Rn concentrations in the firn can sufficiently affect the 210Pb activities of the adjacent firn to quantitatively explain the observed 210Pb anomalies. Concerning the entrainment of the bedrock-derived 222Rn into the firn, we assume that air in the crevasse underneath the snow bridge is well mixed with respect to 222Rn and that the entrainment into the firn above the firn–ice transition is controlled by molecular diffusion. Assuming typical diffusivities D of gases in firn on the order of – m2 s−1 (Birner et al., 2018), which decrease with firn density, we can estimate the entrainment length by the diffusion length, λ=(Dt)0.5, where t is the duration of the diffusive transport. The latter is limited by the decay time of 222Rn of 3.8 d, which controls how deep the 222Rn can enter the firn. Hence, typical entrainment lengths of 0.5–2 m are possible during one 222Rn half-life and 2 to 6 m during 10 222Rn half-lives. Over this typical entrainment length, the firn will be loaded with additional 210Pb from the 222Rn decay. Compared to these entrainment velocities (a few meters per a few weeks), we can neglect the horizontal ice flow of the firn of only 4 to 5 m yr−1.
Pourchet et al. (2000) observed mean 222Rn activities of ∼10 000 up to nearly 150 000 Bq m−3 in the firn of Mont Blanc (2 km from Dôme du Gôuter with the same rock mineralogy) and 0.7 Bq kg−1 of 210Pb, on average, at a depth of 0.5 m in the annual snow–firn layer of the measurement year, with both orders of magnitude higher than typical background values in air or snow. They attributed these high levels to Rn emanation from a nearby crevasse. Vincent et al. (1997) reported as much as 28 Bq kg−1 in a firn–ice core at the summit of Dôme du Gôuter, which had contact with a subsurface crevasse. Since snow accumulation and ice flow velocities at the Dôme du Gôuter are lower than at the Mont Blanc summit, we assume that the firn air of the core drilled at Dôme du Gôuter was in much longer contact with the crevasse than the surface snow layer at the Mont Blanc summit.
In the following, we make a rough estimate of whether such 222Rn activities are sufficient to explain the 210Pb anomaly in our cores. To keep the estimation simple, we assume a temporal constant 222Rn activity in the crevasse of 50 000 Bq m−3, which lies in the typical range observed by Pourchet et al. (2000) and is equivalent to a 222Rn number concentration of 2.4×10¹⁰ m−3 in the crevasse. As the half-life of 210Pb is much longer than that of 222Rn we can assume that the amount of 210Pb loaded into the firn is controlled primarily by the total 222Rn entering the firn. We assume that 222Rn loads the adjacent firn by diffusion and that after 10 222Rn half-lives the radiogenic 222Rn entering the firn has essentially decayed to zero, limiting its entrainment length to a few meters (see the diffusion length discussion above). As a first-order estimate, we assume a linear concentration gradient between the 222Rn concentration in the crevasse and zero radiogenic 222Rn at a distance of a diffusion length after 10 222Rn half-lives. We acknowledge that the true concentration gradient is not linear and that some 222Rn atoms will enter deeper into the firn than this diffusion length, but to obtain the order of magnitude loading of the firn with 210Pb, this back-of-the-envelope calculation seems justified. Using the 222Rn concentration in the crevasse as a measure of the concentration gradient driving the diffusive flux, this leads to a diffusive 222Rn atom flux into the firn of 12 000 and 40 000 m−2 s−1 for firn diffusivities of and m−2 s−1, respectively. At an exposure length of the bedrock of 1 year and a firn density of 500 kg m−3, this would result in a loading of the firn by approximately 800×106 to 2500×106 210Pb atoms kg−1, which is equivalent to an initial 210Pb activity on the order of 800 to 2500 mBq kg−1. Given that the ice flows within 1 to 2 210Pb half-lives from the crevasse to the ice core drill site, these numbers are of the same order of magnitude as the activities measured in the firn core. We note that an exposure time of the crevasse of 1 year may be at the upper limit of what is possible (given the stationary position of the crevasse, which requires the healing of the crevasse before ice flow has moved its position significantly), and an exposure time of only 1 month may not be sufficient to explain the measured activities. On the other hand, we only based our estimate on diffusive entrainment of 222Rn into the firn. If there are also pressure differences between the crevasse air and the firn air (for example, induced by synoptic pressure variations at the surface), this would also lead to an advective flux into the firn, which may increase the initial 210Pb activity after 222Rn loading of the firn. In summary, while a more precise estimate would require stringent firn transport modeling in and around the crevasse, which is beyond the scope of this paper, the overall order of magnitude of the 210Pb anomaly can be explained by our simple estimate.
Although speculative, we assume that the upstream crevasse of Figs. 2 and 3 already existed earlier in the 1970s and was capped at the top by the snow bridge. If the crevasse (1) did not intersect with the upstream flowline at the time the 210Pb anomaly was imprinted in the firn reaching C10 from the crevasse in 1994 (implying that the flowline was close enough to the crevasse for 222Rn to diffuse to the flowline) or (2) did intersect with the catchment area of the C10 drill site at that time but was so narrow that the chronology of the C10 ice core was not significantly disturbed before closing again, this could explain the occurrence of the 210Pb anomaly observed in C10 together with an undisturbed depth–age relation. In contrast, the crevasse must have extended into the upstream flowline of cores CDK and CDM at a later date, thus not only elevating the 210Pb levels there, but also disturbing their chronologies. Assuming that the crevasse was wider at that time, the appearance of winter snow-enriched layers and discontinuities (i.e., lacking and/or doubling of ice layers) in the depth–age relationships at CDK and CDM drilled 10 and 18 years after C10 could be explained by a collapse of the snow bridge partly infilling the crevasse or by closing of the crevasse void by glacier flow from upstream. Such filling with ice caused by glacier flow would not necessarily lead to the same stratigraphy and, hence, chronology of the ice of the downstream wall and the inflowing ice. If the crevasse is empty, isochrones could end up at a greater depth than those on the downstream crevasse wall (pink arrow in Fig. 3). This would result in a layer doubling at the drill site in the core, as suggested in CDM. If the bottom of the crevasse is filled with ice from the collapsed bridge before healing, inflowing isochrones could end up at a lower depth than those on the downstream wall (orange arrow in Fig. 3). This would result in missing layers at the drill site in the core, as suggested in CDK.
We stress that although a 210Pb anomaly is visible in all three cores, the 210Pb inventories of CDM and CDK amount to only ∼25 % of the C10 inventory. Thus, the initial 210Pb loading of the firn was likely lower in CDK and CDM. This could be explained by either a shorter or a reduced opening of the crevasse at the bottom at the time the firn was loaded with 210Pb for CDK and CDM or an opening (that was perhaps temporary) of the crevasse to the atmosphere. A partial opening of the crevasse to the atmosphere would allow the bedrock-derived 222Rn in the crevasse to mix with the much lower atmospheric 222Rn concentrations (Pourchet et al., 2000). This would have led to a strong reduction in additional 222Rn accumulation and 210Pb production in the crevasse and in the snow and firn around the crevasse, starting from the moment of the opening to the atmosphere. In addition, disturbed isochrones could also potentially lead to decreased 210Pb inventories since ice layers from the upstream side of the crevasse with enriched 210Pb activities could be missing, as is suggested for CDK but not CDM.
Combining existing and new chemical depth profiles, bomb test time markers, and the 210Pb depth profiles of three ice cores (extracted at the same drill CDD site in 1994, 2004, and 2012) allowed us, for the first time, to highlight changes over time in the depth–age characteristics at an alpine drill site. Because of the granitic bedrock prevailing at the site, the imprint of a crevasse located upstream of the drill site is visible in all three ice cores as a distinct anomaly in their 210Pb profiles, extending over just a few meters in depth and with 210Pb concentrations elevated by up to a factor of 10. The depth–age relationship of the C10 ice core drilled in 1994 does not appear to be disturbed by the crevasse in the upstream region, whereas this is not the case for the CDK and CDM ice cores drilled in 2004 and 2012. For CDK and CDM, the depth–age relationships were found to be disturbed in ice layers deposited ∼30 years before drilling and over a period of around 16 years in CDK and at least 25 years in CDM. We attribute this to a lateral extension of the crevasse over time into the upstream flowline of our drill site. This finding is consistent with long-term glaciological observations that show significant glacier thickness changes in the area surrounding the upstream crevasse.
Although at this stage we can provide only a qualitative explanation for the recently observed stratigraphic discontinuities, our work points towards the need for careful examination of depth–age relationships when using ice cores from this CDD drill site to reconstruct past atmospheric conditions. More generally, since crevasses are often present on steep, non-polar glaciers, such disturbances in the depth–age relation, as observed at CDD, could also appear at other non-polar ice core drill sites but may be undetected, particularly when the bedrock is not granitic and does not allow for the use of the 210Pb imprint caused by 222Rn emanation from the bedrock, when few or no absolute time markers are available and/or when only one core is collected from the site. To identify such depth–age problems, in addition to the commonly used annual layer counting, an extended use of absolute time markers including bomb horizons through 3H, 137Cs, or 239Pu (Arienzo et al., 2016); 39Ar (Feng et al., 2019); and large Saharan dust events or volcanoes (e.g., Plunkett et al., 2022) is mandatory. Furthermore, at other non-polar sites where the net snow accumulation is far lower than at CDD (i.e., with ice as old as several thousands of years located well above the bedrock), additional tools like 14C measurements (Jenk et al., 2006, 2009; Hoffmann et al., 2018) should be applied.
Ice core data are available at the NCEI (National Centers for Environmental Information) database (https://doi.org/10.25921/pxbs-3c02, Preunkert et al., 2023).
SP, PB, and ML performed research and wrote the original paper. SP, HF, and JRM revised the paper. HF, TE, RP, LZ, AW, and JRM analyzed ice samples and data and commented on the original paper. AG did model calculations and commented the original paper.
The contact author has declared that none of the authors has any competing interests.
Publisher's note: Copernicus Publications remains neutral with regard to jurisdictional claims made in the text, published maps, institutional affiliations, or any other geographical representation in this paper. While Copernicus Publications makes every effort to include appropriate place names, the final responsibility lies with the authors.
The ice core drilling operations at CDD were supported by the European Community via contract no. ENV4-CT97 (ALPCLIM), the EU CARBOSOL project (contract no. EVK2-CT-2001-00113), and the Region Rhône-Alpes. The LEFE-CHAT (CNRS) program entitled “Evolution séculaire de la charge et composition de l'aérosol organique au dessus de l'Europe (ESCCARGO)” provided funding for analysis in France with the support of ADEME (Agence de l'Environnement et de la Maîtrise de l'Energie). NSF grant no. 1925417 given to Joseph R. McConnell provided partial support for the analyses and interpretation at DRI. CEP acknowledges the longer-term financial support of ice core research by the Swiss National Science Foundation. Pascal Bohleber gratefully acknowledges funding by the Austrian Science Fund (FWF; grant no. I 5246-N). The authors thank all the colleagues who participated in the drilling campaigns at CDD in 1994, 2004, and 2012 and the laboratory analyses at IUP, CEP, and DRI. We also would like to thank Alison Criscitiello and three anonymous reviewers and the editor Kristin Poinar for their thorough reviews and helpful suggestions. Susanne Preunkert, Pascal Bohleber, Hubertus Fischer, Lars Zipf, and Astrid Waldner thank their late teacher Dietmar Wagenbach for his inspiring ideas on the impact of glaciological and atmospheric processes on ice core records.
This research has been supported by the Centre National de la Recherche Scientifique and the Agence de l'Environnement et de la Maîtrise de l'Energie (project ESCCARGO), the Austrian Science Fund (FWF; grant no. I 5246-N), the NSF (grant no. 1925417), the European Community (contract no. ENV4-CT97 (ALPCLIM)), and the EU CARBOSOL project (contract no. EVK2-CT-2001-00113).
This paper was edited by Kristin Poinar and reviewed by Alison Criscitiello and three anonymous referees.
Arienzo, M. M., McConnell, J. R., Chellman, N., Criscitiello, A., Curran, M., Fritzsche, D., Kipfstuhl, S., Mulvaney, R., Nolan, M. Opel, T., Sigl, M., and Steffensen, J. P.: A method for continuous 239Pu determinations in Arctic & Antarctic ice cores, Environ. Sci. Technol., 7066–7073, https://doi.org/10.1021/acs.est.6b01108, 2016.
Arienzo, M. M., Legrand, M., Preunkert, S., Stohl, A., Chellman, N., Eckhardt, S., Gleason, K. E., and McConnell, J. R.: Alpine ice-core evidence of a large increase in vanadium and molybdenum pollution in Western Europe during the 20th century. J. Geophys. Res.-Atmos., 126, e2020JD033211, https://doi.org/10.1029/2020JD033211, 2021.
Birner, B., Buizert, C., Wagner, T. J. W., and Severinghaus, J. P.: The influence of layering and barometric pumping on firn air transport in a 2-D model, The Cryosphere, 12, 2021–2037, https://doi.org/10.5194/tc-12-2021-2018, 2018.
Bohleber, P.: Alpine Ice Cores as Climate and Environmental Archives, Climate Science, https://doi.org/10.1093/acrefore/9780190228620.013.743, 2019.
Colgan, W., Rajaram, H., Abdalati, W., McCutchan, C., Mottram, R., Moussavi, M., and Grigsby, S.: Glacier Crevasses: Observations, Models and Mass Balance Implications, Rev. Geophys., 54, 119–161, https://doi.org/10.1002/2015RG000504, 2016.
Delmas, R. and Pourchet, M.: Utilisation de filtres échangeurs d'ions pour l'étude de l'activité β globale d'un carottage glaciologique, International Association of Hydrological Sciences Publication 118 (Symposium at Grenoble 1975 – Isotopes and Impurities in Snow and Ice), 159–163, 1977.
Dörr, H. and Münnich, K. O.: 222Rn flux and soil air concentration profiles in West Germany. Soil Rn as tracer for gas transport in the unsaturated soil zone, Tellus B, 42, 20–28, https://doi.org/10.1034/j.1600-0889.1990.t01-1-00003.x, 1990.
Eichler, A., Schwikowski, M., Gäggeler, H. W., Furrer, V., Synal, H. A., Beer, J., and Funk, M.: Glaciochemical dating of an ice core from upper Grenzgletscher (4200 m a.s.l.), J. Glaciol., 46, 507–515, https://doi.org/10.3189/172756500781833098, 2000.
Eichler, A., Legrand, M., Jenk, T. M., Preunkert, S., Andersson, C., Eckhardt, S., Engardt, M., Plach, A., and Schwikowski, M.: Consistent histories of anthropogenic western European air pollution preserved in different Alpine ice cores, The Cryosphere, 17, 2119–2137, https://doi.org/10.5194/tc-17-2119-2023, 2023.
Elsässer, C., Wagenbach, D., Weller, R., Auer, M., Wallner, A., and Christl, M.: Continuous 25-yr aerosol records at coastal Antarctica Part 2: variability of the radionuclides 7Be, 10Be and 210Pb, Tellus B, 63, 920–934, https://doi.org/10.1111/j.1600-0889.2011.00543.x, 2011.
Erhardt, T., Bigler, M., Federer, U., Gfeller, G., Leuenberger, D., Stowasser, O., Röthlisberger, R., Schüpbach, S., Ruth, U., Twarloh, B., Wegner, A., Goto-Azuma, K., Kuramoto, T., Kjær, H. A., Vallelonga, P. T., Siggaard-Andersen, M.-L., Hansson, M. E., Benton, A. K., Fleet, L. G., Mulvaney, R., Thomas, E. R., Abram, N., Stocker, T. F., and Fischer, H.: High-resolution aerosol concentration data from the Greenland NorthGRIP and NEEM deep ice cores, Earth Syst. Sci. Data, 14, 1215–1231, https://doi.org/10.5194/essd-14-1215-2022, 2022.
Fagerli, H., Legrand, M., Preunkert, S., Vestreng, V., Simpson, D., and Cerqueira, M.: Modeling historical long-term trends of sulfate, ammonium, and elemental carbon over Europe: A comparison with ice core records in the Alps, J. Geophys. Res., 112, D23S13, https://doi.org/10.1029/2006JD008044, 2007.
Feng, Z., Bohleber, P., Ebser, S., Ringena, L., Schmidt, M., Kersting, A., Hopkin, P., Hoffmann, H., Fischer, A., Aeschbach, W., and Oberthaler, M. K.: Dating glacier ice of the last millennium by quantum technology, P. Natl. Acad. Sci. USA, 116, 8781–8786, https://doi.org/10.1073/pnas.1816468116, 2019.
Gäggeler, H. W.: Radioactivity in the Atmosphere, Radiochim. Acta, 70/71, 345-35, https://doi.org/10.1524/ract.1995.7071.s1.345, 1995.
Gäggeler, H., Tobler, L., Schwikowski, M., and Jenk, T.: Application of the radionuclide 210 Pb in glaciology – an overview, J. Glaciol., 66, 1–10, https://doi.org/10.1017/jog.2020.19 , 2020.
Gfeller, G., Fischer, H., Bigler, M., Schüpbach, S., Leuenberger, D., and Mini, O.: Representativeness and seasonality of major ion records derived from NEEM firn cores, The Cryosphere, 8, 1855–1870, https://doi.org/10.5194/tc-8-1855-2014, 2014.
Gilbert, A. and Vincent, C.: Atmospheric temperature changes over the 20th century at very high elevations in the European Alps from englacial temperatures, Geophys. Res. Lett., 40, 2102–2108, https://doi.org/10.1002/grl.50401, 2013.
Gilbert, A., Gagliardini, O., Vincent, C., and Wagnon, P.: A 3-D thermal regime model suitable for cold accumulation zones of polythermal mountain glaciers, J. Geophys. Res.-Earth Surf., 119, 1876–1893, https://doi.org/10.1002/2014JF003199, 2014.
Griffiths, A. D., Conen, F., Weingartner, E., Zimmermann, L., Chambers, S. D., Williams, A. G., and Steinbacher, M.: Surface-to-mountaintop transport characterised by radon observations at the Jungfraujoch, Atmos. Chem. Phys., 14, 12763–12779, https://doi.org/10.5194/acp-14-12763-2014, 2014.
Guilhermet, J., Preunkert, S., Voisin, D., Baduel, C., and Legrand, M.: Major 20th century changes of water-soluble HUmic LIke Substances (HULISWS) aerosol over Europe inferred from Alpine ice cores, J. Geophys. Res.-Atmos., 118, 3869–3878, https://doi.org/10.1002/jgrd.50201, 2013.
Hammer, S., Wagenbach, D., Preunkert, S., Pio, C., Schlosser, C., and Meinhardt, F.: Lead-210 observations within CARBOSOL: A diagnostic tool for assessing the spatiotemporal variability of related chemical aerosol species?, J. Geophys. Res., 112, D23S03, https://doi.org/10.1029/2006JD008065, 2007.
Hoffmann, H., Preunkert, S., Legrand, M., Leinfelder, D., Bohleber, P., Friedrich, R., and Wagenbach, D.:, A new sample preparation system for micro-14C dating of glacier ice with a first application to a high alpine ice core from Colle Gnifetti (Switzerland), Radiocarbon, 60, 517–533, https://doi.org/10.1017/rdc.2017.99, 2018.
Jenk, T. M., Szidat, S., Schwikowski, M., Gäggeler, H. W., Brütsch, S., Wacker, L., Synal, H.-A., and Saurer, M.: Radiocarbon analysis in an Alpine ice core: record of anthropogenic and biogenic contributions to carbonaceous aerosols in the past (1650–1940), Atmos. Chem. Phys., 6, 5381–5390, https://doi.org/10.5194/acp-6-5381-2006, 2006.
Jenk, T., Szidat, S., Bolius, D., Sigl, M., Gäggeler, H., Wacker, L., Ruff, M., Barbante, C., Boutron, C. F., and Schwikowski, M.: A novel radiocarbon dating technique applied to an ice core from the Alps indicating late Pleistocene ages, J. Geophys. Res., 114, D14305, https://doi.org/10.1029/2009JD011860, 2009.
Kaufmann, P. R., Federer, U., Hutterli, M. A., Bigler, M., Schüpbach, S., Ruth, U., Schmitt, J., and Stocker, T. F.: An improved Continuous Flow Analysis (CFA) system for high-resolution field measurements on ice cores, Environ. Sci. Technol., 42, 8044–8050, https://doi.org/10.1021/es8007722, 2008.
Legrand, M., Preunkert, S., Wagenbach, D., and Fischer, H.: Seasonally resolved Alpine and Greenland ice core records of anthropogenic HCl Emissions over the 20th century, J. Geophys. Res., 107, D12, https://doi.org/10.1029/2001JD001165, 2002.
Legrand, M., Preunkert, S., Wagenbach, D., Cachier, H., and Puxbaum, H.: A historical record of formate and acetate from a high elevation Alpine glacier: Implications for their natural versus anthropogenic budgets at the European scale, J. Geophys. Res., 108, 4788, https://doi.org/10.1029/2003JD003594, 2003.
Legrand, M., Preunkert, S., Galy-Lacaux, C., Liousse, C., and Wagenbach, D., Atmospheric year-round records of dicarboxylic acids and sulfate at three French sites located between 630 and 4360 m elevation, J. Geophys. Res., 110, D13302, https://doi.org/10.1029/2004JD005515, 2005.
Legrand, M., Preunkert, S., Schock, M., Cerqueira, M., Kasper-Giebl, A., Afonso, J., Pio, C., Gelencsér, A., and Dombrowski-Etchevers, I.: Major 20th century changes of carbonaceous aerosol components (EC, WinOC, DOC, HULIS, carboxylic acids, and cellulose) derived from Alpine ice cores, J. Geophys. Res., 112, D23S11, https://doi.org/10.1029/2006JD008080, 2007.
Legrand, M., Preunkert, S., May, B., Guilhermet, J., Hoffman, H., and Wagenbach, D.: Major 20th century changes of the content and chemical speciation of organic carbon archived in Alpine ice cores: Implications for the long-term change of organic aerosol over Europe, J. Geophys. Res., 118, 3879–3890, https://doi.org/10.1002/jgrd.50202, 2013.
Legrand, M., McConnell, J. R., Preunkert, S., Arienzo, M., Chellman, N., Gleason, K., Sherwen, T., Evans, M. J., and Carpenter, L. J.: Alpine ice evidence of a three-fold increase in atmospheric iodine deposition since 1950 in Europe due to increasing oceanic emissions, P. Natl. Acad. Sci. USA, 115, 12136–12141, https://doi.org/10.1073/pnas.1809867115, 2018.
Legrand, M., McConnell, J. R., Lestel, L., Preunkert, S., Arienzo, M., Chellman, N. J., Stohl, A., and Eckhardt, S.: Cadmium pollution from zinc-smelters up to fourfold higher than expected in western Europe in the 1980s as revealed by alpine ice, Geophys. Res. Lett., 46, e2020GL087537, https://doi.org/10.1029/2020GL087537, 2020.
Legrand, M., McConnell, J. R., Preunkert, S., Chellman, N. J., and Arienzo, M. M.: Causes of enhanced bromine levels in Alpine ice cores during the 20th century: Implications for bromine in the free European troposphere, J. Geophys. Res., 126, e2020JD034246, https://doi.org/10.1029/2020JD034246, 2021.
Legrand, M., McConnell, J. R., Preunkert, S., Bergametti, G., Chellman, N. J., Desboeufs, K., Plach, A., Stohl, A., and Eckhardt, S.: Thallium pollution in Europe over the twentieth century recorded in Alpine ice: Contributions from coal burning and cement production, Geophys. Res. Lett., 49, e2022GL098688, https://doi.org/10.1029/2022GL098688, 2022.
Legrand, M., McConnell, J. R., Bergametti, G., Plach, A., Desboeufs, K., Chellman, N., Preunkert, S., and Stohl, A.: A two-fold increase of phosphorus in Alpine ice over the twentieth century: Contributions from dust, primary biogenic emissions, coal burning, and pig iron production, J. Geophys. Res.-Atmos., 128, e2023JD039236, https://doi.org/10.1029/2023JD039236, 2023a.
Legrand, M., McConnell, J. R., Bergametti, G., Preunkert, S., Chellman, N., Desboeufs, K., Lestel, L., Plach, A., and Stohl, A.: Alpine-ice record of bismuth pollution implies a major role of military use during World War II, Sci. Rep., 13, 1166, https://doi.org/10.1038/s41598-023-28319-3, 2023b.
Moseid, K. O., Schulz, M., Eichler, A., Schwikowski, M., McConnell, J. R., Olivié, D., Criscitiello, A. S., Kreutz, K. J., and Legrand, M.: Using ice cores to evaluate CMIP6 aerosol concentrations over the historical era, J. Geophys. Res., 127, e2021JD036105, https://doi.org/10.1029/2021JD036105, 2022.
Pinglot, J. F. and Pourchet, M.: Radioactivity measurements applied to glaciers and lake sediments, Sci. Total Environ., 173–174, 211–233, https://doi.org/10.1016/0048-9697(95)04779-4, 1995.
Pinglot, J. F., Vaikmae, R., Kamiyama, K., Igarashi, M., Fritzsche, D., Wilhelms, F., Koerner, R., Henderson, L., Isaksson, E., Winther, J. G., van de Wahl, R. S. W., Fournier, M., Bouisset, P., and Meijer, H. A. J.: Ice cores from Arctic sub-polar glaciers: chronology and post-depositional processes deduced from radioactivity measurements, J. Glaciol., 49, 149–158, https://doi.org/10.3189/172756503781830944, 2003.
Plunkett, G., Sigl, M., Schwaiger, H. F., Tomlinson, E. L., Toohey, M., McConnell, J. R., Pilcher, J. R., Hasegawa, T., and Siebe, C.: No evidence for tephra in Greenland from the historic eruption of Vesuvius in 79 CE: implications for geochronology and paleoclimatology, Clim. Past, 18, 45–65, https://doi.org/10.5194/cp-18-45-2022, 2022.
Pourchet, M, Richon, P., and Sabroux, J.-C.: Lead-210 and radon-222 anomalies in Mont Blanc snow, French Alps, J. Environ. Radioact., 48, 349–357, https://doi.org/10.1016/S0265-931X(99)00084-3, 2000.
Preunkert, S., Wagenbach, D., Legrand, M., and Vincent, C.: Col du Dôme (Mt Blanc Massif, French Alps) suitability for ice-core studies in relation with past atmospheric chemistry over Europe, Tellus B, 52, 993–1012, https://doi.org/10.3402/tellusb.v52i3.17081, 2000.
Preunkert, S., Legrand, M., and Wagenbach, D.: Sulfate Trends in a Col du Dôme (French Alps) Ice Core: A Record of Anthropogenic Sulfate Levels in the European Mid-Troposphere over the 20th Century, J. Geophys. Res., 106, 31991–32004, https://doi.org/10.1029/2001JD000792, 2001a.
Preunkert, S., Legrand, M., and Wagenbach, D.: Causes of enhanced fluoride levels in Alpine ice cores over the last 75 years: Implications for the atmospheric fluoride budget, J. Geophys. Res, 106, 12619–12632, https://doi.org/10.1029/2000JD900755, 2001b.
Preunkert, S., Wagenbach, D., and Legrand, M.: A seasonally resolved Alpine ice core Record of Nitrate: Comparison with Anthropogenic Inventories and estimation of Pre-Industrial Emissions of NO from Europe, J. Geophys. Res., 108, 4681, https://doi.org/10.1029/2003JD003475, 2003.
Preunkert, S., Legrand, M., Kutuzov, S., Ginot, P., Mikhalenko, V., and Friedrich, R.: The Elbrus (Caucasus, Russia) ice core record – Part 1: reconstruction of past anthropogenic sulfur emissions in south-eastern Europe, Atmos. Chem. Phys., 19, 14119–14132, https://doi.org/10.5194/acp-19-14119-2019, 2019a.
Preunkert, S., McConnell, J. R., Hoffmann, H., Legrand, M., Wilson, A. I., Eckhardt, S., Stohl, A., Chellman, N., Arienzo, M., and Friedrich, R.: Lead and antimony in basal ice from Col du Dome (French Alps) dated with radiocarbon: A record of pollution during antiquity, Geophys. Res. Lett., 46, 4953–4961, https://doi.org/10.1029/2019GL082641, 2019b.
Preunkert, S., Legrand, M., Bohleber, P., Fischer, H., Erhardt, T., Purtschert, R., Zipf, L., Waldner, A., and McConnell, J. R.: NOAA/WDS Paleoclimatology – Col du Dome, France Ice Core Data of 3H, 210Pb, 137Cs, and Major Ions over the Last Century, NOAA National Centers for Environmental Information [data set], https://doi.org/10.25921/pxbs-3c02, 2023.
Rehfeld, K.: Investigations into Mont Blanc region summit ice cores at seasonal resolution, Institute of Environmental Physics, Diploma thesis, University of Heidelberg, Germany, 2009.
Sanak, J., Gaudry, A., and Lambert, G.: Size distribution of Pb-210 aerosols over oceans, Geophys. Res. Lett., 8, 1067–1069, https://doi.org/10.1029/GL008i010p01067, 1981.
Schotterer, U., Schwarz, P., and Rajner, V.: From pre-bomb levels to industrial times: A complete tritium record from an alpine ice core and its relevance for environmental studies. In Isotope techniques in the study of environmental change, International Atomic Energy Agency (IAEA), ISBN 92-0-100598-9, 1998.
Stanzick, A.: Raum-Zeit-Variationen von Be-10, Pb-210 und Cl-36 in der grönländischen Firndecke: Luft-Firn-Transfer und rezente Trends, PhD thesis, Institute of Environmental Physics, University of Heidelberg, Germany, 2001.
Turekian, K. K., Nozaki, Y., and Benninger, L. K.: Geochemistry of atmospheric radon and radon products, Annu. Rev. Earth Planet. Sci., 5, 227–255, https://doi.org/10.1146/annurev.ea.05.050177.001303, 1977.
Vimeux, F., Angelis, M., Ginot, P., Magand, O., Casassa, G., Pouyaud, B., Falourd, S., and Johnsen, S.: A promising location in Patagonia for paleoclimate and paleoenvironmental reconstructions revealed by a shallow firn core from Monte San Valentín (Northern Patagonia Icefield, Chile), J. Geophys. Res., 113, D16118, https://doi.org/10.1029/2007JD009502, 2008.
Vincent, C., Vallon, M., Pinglot, J. F., Reynaud, L., and Funk, M.:, Snow accumulation and ice flow at Dôme du Goûter (4300 m), Mont Blanc, French Alps, J. Glaciol., 43, 513–521, https://doi.org/10.3189/S0022143000035127, 1997.
Vincent, C., Le Meur, E., Six, D., Possenti, P., Lefebvre, E., and Funk, M.: Climate warming revealed by englacial temperatures at Col du Dôme (4250 m, Mont Blanc area), Geophys. Res. Lett., 34, L16502, https://doi.org/10.1029/2007GL029933, 2007.
Vincent, C., Gilbert, A., Jourdain, B., Piard, L., Ginot, P., Mikhalenko, V., Possenti, P., Le Meur, E., Laarman, O., and Six, D.: Strong changes in englacial temperatures despite insignificant changes in ice thickness at Dôme du Goûter glacier (Mont Blanc area), The Cryosphere, 14, 925–934, https://doi.org/10.5194/tc-14-925-2020, 2020.
Whittlestone, S.: Radon daughter disequilibria in the lower marine boundary layer, J. Atmos. Chem., 11, 27–42, https://doi.org/10.1007/BF00053666, 1990.