the Creative Commons Attribution 4.0 License.
the Creative Commons Attribution 4.0 License.
 | 29 Apr 2024
From snow accumulation to snow depth distributions by quantifying meteoric ice fractions in the Weddell Sea
Nina Maaß
Leonard Rossmann
Marcel Nicolaus
Year-round snow cover is a characteristic of the entire Antarctic sea ice cover, which has significant implications for the energy and mass budgets of sea ice, e.g., by preventing surface melt in summer and enhancing sea ice growth through extensive snow ice formation. However, substantial observational gaps in the seasonal cycle of Antarctic sea ice and its snow cover limit the understanding of important processes in the ice-covered Southern Ocean. They also introduce large uncertainties in satellite remote sensing applications and climate studies.
Here we present results from 10 years of autonomous snow observations from Snow Buoys in the Weddell Sea. To distinguish between actual snow depth and potential snow ice thickness within the accumulated snowpack, a one-dimensional thermodynamic sea ice model is applied along the drift trajectories of the buoys. The results show that potential snow ice formation, with an average maximum thickness of 35 cm, was detected along 41 % of the total track length of the analyzed Snow Buoy tracks, which corresponds to about one-quarter of the snow accumulation. In addition, we simulate the evolution of internal snow properties along the drift trajectories with the more complex SNOWPACK model, which results in superimposed ice thicknesses between 0 and 14 cm on top of the snow ice layer. These estimates will provide an important reference dataset for both snow depth and meteoric ice rates in the Southern Ocean.
- Article
(5119 KB) - Full-text XML
- BibTeX
- EndNote


The role of the snow cover is particularly intriguing for the understanding of sea ice mass budget in the Southern Ocean, as Antarctic snow cover survives potential summer melt and persists during most of the year (Massom et al., 2001). The low thermal conductivity makes snow an effective insulator and thus dampens the thermodynamic ice growth at the bottom (Calonne et al., 2011; Sturm et al., 1997). It also contributes to ice growth from the top through the formation of meteoric ice (Eicken et al., 1994). Snow-to-ice conversion processes, i.e., snow ice formation and superimposed ice formation, are instrumental in comprehending this complex system. Snow ice results from the submergence of the ice surface beneath the seawater level, facilitated by heavy snow loads (e.g., Eicken et al., 1994; Tian et al., 2020). Subsequent flooding and refreezing of the snow / water mixture result in the creation of this unique ice form, a process that is particularly pronounced during the winter months. In contrast, the formation of superimposed ice is driven by internal melting within the snowpack during summer as snowmelt water percolates downward and refreezes at the snow–ice interface (Ackley et al., 2008; Nicolaus et al., 2009; Haas and Eicken, 2001; Arndt et al., 2021).
As such, Arndt (2022a) and Arndt et al. (2021) outline mean snow ice thicknesses of 0.18 ± 0.18 m in the southeastern Weddell Sea and 0.22 ± 0.22 m in the northwestern Weddell Sea during late summer. In the Ross Sea, Kawamura et al. (1997) observed similar ratios of snow ice to total sea ice thickness, with 22 % for first-year ice and 10 % for multi-year ice. Conversely, Ackley et al. (2020) reported snow ice thicknesses of 30 to 35 cm in the Amundsen Sea, attributed to intense bottom melt driven by high ocean heat fluxes and low ice concentration. For the superimposed ice layer, Haas et al. (2001) documented varying thicknesses, with 0.08 ± 0.06 m in the northwestern Weddell Sea, 0.10 ± 0.05 m in the Amundsen Sea and 0.12 ± 0.07 cm in the Bellingshausen Sea.
In addition to its direct effects, snow also hampers the interpretation and retrieval of sea ice parameters, including thickness and volume of sea ice observed using in situ measurements and with satellite remote sensing. The conversion of either ice draft, measured by means of upward-looking sonar, or ice freeboard, measured by means of satellite altimetry (Ricker et al., 2015; Fons and Kurtz, 2019; Kwok et al., 2020), into ice thickness depends heavily on reliable snow depth and density data. As the ratio of snow load to ice thickness is particularly high for Antarctic sea ice, the snow cover has a significant effect on the freeboard of Antarctic sea ice (Worby et al., 2008). Consequently, estimation of ice thickness is particularly reliant on the conversion of freeboard to thickness, resulting in significant uncertainty in Antarctic sea ice thickness retrievals (Paul et al., 2018; Kwok and Kacimi, 2018; Schwegmann et al., 2016).
Despite the fact that snow depth on sea ice is such an essential state variable of the polar climate system, it is still one of the least-known parameters for Antarctic sea ice (Webster et al., 2018). However, attempts have been made to describe it at different spatial scales. Therefore, it is imperative to distinguish between the terminologies of snow accumulation and of snow depth since the two may not always correspond due to the various snow conversion processes outlined above. Snow accumulation refers to all the snow that has fallen or has been redistributed by wind at a certain location during a specified period of time. Snow depth (or thickness), in turn, describes the actual amount of snow present at a specific location and time, which results from the difference between snow accumulation and the thickness of meteoric ice formed up to that point in time. In contrast, snow ablation refers to the process of snow (height) loss due to factors such as melting, metamorphism, sublimation or other forms of erosion.
Measurements with an automated snow depth probe (MagnaProbe), for example, can be used to determine snow depth at a certain point in time at a certain location (Sturm and Holmgren, 2018). To extend these point measurements, in particular, to larger temporal scales, Snow Buoys were developed. These are autonomous measuring systems deployed on the sea ice that measure, among other things, hourly snow accumulation rates along the drift and that transmit them via satellite link (Nicolaus et al., 2021). However, these ice-tethered platforms cannot describe the potential conversion processes of snow into meteoric ice at the snow–ice interface. As a result, snow accumulation from Snow Buoys cannot be taken as a direct measure of snow depth.
To bridge this gap and finally obtain a first approximation of snow depth distributions in the Weddell Sea for different regions and seasons, this study uses a simple thermodynamic sea ice model to quantify potential snow ice formation along the trajectories of Snow Buoys in the Weddell Sea over the last decade. In addition, the snow model SNOWPACK is utilized to estimate superimposed ice formation along the same trajectories. The resulting snow and superimposed layer thicknesses are validated with in situ observations in the southeastern and northwestern Weddell Sea from recent years.
Given that different ice classes experience different contributions from these processes, the reduction in uncertainties varies across the Antarctic sea ice cover. Nevertheless, the results presented reveal distinct variations between regions and seasons, providing a pathway towards improved snow depth datasets. This improvement, in turn, has the potential to reduce uncertainties in sea ice thickness data products derived from satellite remote sensing and from sea ice modeling applications.
2.1 Study area
The Weddell Sea features a distinctive, large-scale cyclonic circulation pattern, the Weddell Gyre, which is driven primarily by mean atmospheric geostrophic forcing (Vernet et al., 2019). This circulation combined with wind stress influences surface ocean currents, resulting in an inflow of sea ice in the eastern region and an outflow in the northwest. Within this drift, parts of the sea ice cover survive the summer melt and eventually become second-year ice. Drift dynamics coupled with the pronounced seasonality of the ice cover contribute to the predominance of seasonal ice in the eastern Weddell Sea and promote the formation of polynyas, particularly along the coast of the Ekström Ice Shelf and the Filchner–Ronne Ice Shelf (e.g., Paul et al., 2015). As a result, sea ice reaches maximum thicknesses of up to 1.5 m near the coast of Dronning Maud Land, while second-year ice in the southwestern and western regions can reach thicknesses exceeding 3 m, representing some of the thickest sea ice in the Southern Ocean (Haas et al., 2008; Harms et al., 2001).

Figure 1(a) Map of all Snow Buoy drift trajectories since 2013 in the Weddell Sea. The trajectories are color-coded by month for the time of valid snow accumulation data. Further buoy drifts without valid snow accumulation data are marked in grey. The black-margined trajectories highlight the paths of Snow Buoys 2016S37, 2018S56, 2018S59 and 2021S114. They are examples of the defined drift patterns in the Weddell Sea (e.g., Sect. 3.1). Colored squares mark additional ice station data from the given expeditions that complement the Snow Buoy data. (b) Snow accumulation measured from the Snow Buoys along their drift trajectories. (c) Estimated snow ice thickness from the one-dimensional thermodynamic ice growth model and (d) resulting calculated snow depth. For all panels, solid black lines mark the four separated regions of the Weddell Sea: southwestern (SW), northwestern (NW), central and southeastern (C/SE) and central and northeastern (C/NE). Background: Advanced Microwave Scanning Radiometer 2 (AMSR2) sea ice concentration from 30 March 2021 (Spreen et al., 2008).
For the purposes of this study, the Weddell Sea has been divided into four regions (Fig. 1a). The southwestern Weddell Sea (SW) includes the compact perennial sea ice located south of 71° S and west of 50° W. The northwestern Weddell Sea (NW) includes the predominantly perennial sea ice and the western marginal ice zone located north of 71° S and west of 50° W. The central and southeastern Weddell Sea (C/SE) corresponds to the highly dynamic, predominantly seasonal sea ice south of 71° S and east of 50° W. Finally, the central and northeastern Weddell Sea (C/NE) represents the marginal sea ice zone consisting of both seasonal and perennial sea ice north of 71° S and east of 50° W.
2.2 Snow Buoys
Snow Buoys are autonomous measuring systems recording snow accumulation hourly using four ultra-sonic sensors as well as recording air temperature and barometric air pressure. Given the height of the sensor mast, a maximum snow accumulation of 1.50 m can be recorded. The systems are deployed on sea ice and transmit their data via satellite connection. For more technical details, see Nicolaus et al. (2021). For this study, all Snow Buoys deployed between 2013 and 2022 on drifting pack ice in the Weddell Sea (27 buoys) or on the fast ice in Atka Bay (9 buoys) close to the German overwintering base Neumayer Station III (Arndt et al., 2020) are considered (Fig. 1a). As the Snow Buoys in the Weddell Sea were deployed during ship-based expeditions, which usually take place in austral summer, most time series start between December and February. All snow accumulation values of the individual Snow Buoys are presented as a daily average of all four ultra-sonic sensors. Monthly accumulation (ablation) rates are then calculated as the sum of the positive (negative) changes in these daily values over each month.
Here we use the buoy names, as introduced in Nicolaus et al. (2021), consisting of the deployment year, the buoy type (S) and a serial counter (Grosfeld et al., 2015).
For the analysis of the Snow Buoy data, we had to take into account the fact that most buoys were deployed on sea ice either during summer or towards the end of summer, making the ice floes at least 1 year old during the deployments. As a result, the mean snow depths primarily represent data from second-year sea ice. Additionally, some Snow Buoys drifted with the sea ice for 2 years or more, resulting in a correspondingly aged snow regime. For example, Snow Buoy 2014S10 remained adrift for almost 3 years, leading to measured snow depths pertaining to the 2-to-4-year snow regime.
2.3 One-dimensional thermodynamic sea ice model
A simple one-dimensional thermodynamic ice growth model based on the number of freezing degree days (Thorndike, 1992) as used in Arndt et al. (2021) is applied to estimate the evolution of the thermodynamic sea ice growth at the bottom of the ice and the resulting ice freeboard. For the latter, a simplified assumption is made that a calculated negative freeboard causes both potential flooding of the snow–ice interface and subsequent snow-to-ice conversion, i.e., snow ice formation, in the same time step. Previous studies by Wever et al. (2021) have demonstrated that such an assumption tends to overestimate actual flooding and snow ice formation on a floe scale, primarily due to the significant spatial heterogeneity of snow and ice thickness. To address and assess this limitation, the results of the model runs are evaluated alongside in situ observations (refer to Sect. 2.5).
Model runs are initialized with the measured initial sea ice thickness during buoy deployment. The atmospheric forcing of the model, i.e., surface temperature and heat fluxes, is based on ERA5 reanalysis data (Copernicus Climate Change Service, 2017), which were extracted for the nearest-neighbor grid points of the daily buoy positions.
Reported values for ocean heat fluxes in the Weddell Sea vary, ranging from 2 to 7 W m−2 (Lytle and Ackley, 1996; Robertson et al., 1995) in the western part to well above 20 W m−2 (McPhee et al., 1999) in the central part. Considering that the buoys primarily drift in the inner pack ice, the ocean heat flux for the simulations in this study is set toward the lower end of the range, at a constant flux of 3 W m−2.
For snow density and thermal conductivity, regionally adjusted parameters following Arndt (2022a) are utilized. Specifically, snow densities of 340 and 264 kg m−3, along with snow thermal conductivities of 0.28 and 0.17 for perennial and seasonal sea ice, respectively, are applied. Further details regarding the model setup can be accessed in the appendix of Arndt et al. (2021).
2.4 Multi-layer snow model SNOWPACK
To estimate the amount of both snow ice and superimposed ice formed during the buoys' lifetimes, we use the multi-layer snow cover model SNOWPACK. In the one-dimensional SNOWPACK model, snow microstructure is represented in detail, and liquid water flow and refreezing processes, those leading to superimposed ice, are taken into account (Bartelt and Lehning, 2002; Lehning et al., 2002a, b; Wever et al., 2015, 2016). SNOWPACK was originally developed to represent physical processes in the snow cover in alpine regions but has been adapted and applied to sea ice environments recently (Wever et al., 2021; Wever et al., 2020). For sea ice applications, snow layers below seawater level are immediately flooded in the simulations and refrozen to form snow ice.
For our simulations, we initialize the model with the initial snow and ice thicknesses measured during buoy deployment. The initial snow and ice temperature profile is determined from the ERA5 surface temperature and a water temperature of 271.35 K, assuming that the snow and ice column is in thermal equilibrium. For the remaining properties, we follow the approach of Wever et al. (2021). For the snow layers, we assume an initial density of 275 kg m−3, corresponding to a volumetric ice content of 0.3 m3 m−3 and a volumetric air content of 0.7 m3 m−3, and set the grain radius to 0.15 mm, the bond radius to 0.09 mm, and sphericity and dendricity to 0. For the ice layers above sea level, we assume the volumetric ice and air content to be 0.95 and 0.05 m3 m−3, respectively (corresponding to an ice density of 871 kg m−3). Ice layers below sea level are assumed to also contain a fraction of water, calculated from the layer temperature and an assumed bulk salinity of 1.75 g kg−1.
Following the approach of Wever et al. (2021), we use the Richards equation combined with the transport equation for salinity to solve liquid water and brine distributions. For 2 out of the 36 Snow Buoys (2017S49 and 2019S88) the simulations are aborted due to numerical instability, and we use a simpler bucket-type approach instead of the Richards equation. In contrast to Wever et al. (2021), we choose an atmospheric stability following Holtslag and De Bruin (1988), as in the SNOWPACK model documentation this was changed to be the new default setting (the effect on the snow depth is minor). As in the simple thermodynamic sea ice model described above, the ocean heat flux is set to a constant value of 3 W m−2, and the atmospheric forcing is based on ERA5 reanalysis data, specifically surface heat fluxes, humidity and surface wind.
Here, we present snow-height-driven simulations, which mean that the SNOWPACK simulations are forced to closely follow the snow height evolution as measured by the Snow Buoy. While snow accumulation as indicated in the Snow Buoy datasets will lead to an instant increase in the SNOWPACK simulation (like a precipitation event), sudden reductions in snow height will only be incorporated within the scope of the model physics. Wind-induced transport of snow is neglected.
To extract the fraction of snow ice from the simulations, we do the following for each simulation time step. In SNOWPACK, each layer is marked as (different types of) snow or ice. A layer is marked as ice when its volumetric ice content is > 0.763; this corresponds to a dry ice density > 700 kg m−3 (i.e., if the remaining volumetric content is air, the layer's bulk density is slightly higher than 700 kg m−3 and even higher if the layer contains a nonzero water fraction). Once a layer is marked as ice, it will stay as ice even when the volumetric ice content decreases below the abovementioned threshold. In each simulation time step, we sum up the heights of the layers marked as ice that are located above the initial Snow Buoy installation height (i.e., the initial snow–ice interface) but below seawater level. This is classified as snow ice. In addition, when there is ocean water flooding simulated in SNOWPACK, the saline water can be transported into the snow above seawater level, which leads to melting and refreezing of the snow. The resulting saline ice is also considered snow ice, and we use a salinity threshold of 1 kg kg−1 to count these layers as snow ice. Once snow ice has formed, it can rise above seawater level (following the hydrostatic equilibrium of the ice floe) or become less saline, and it will still count as snow ice. All other layers above the initial Snow Buoy installation height that are marked as ice in SNOWPACK are considered superimposed ice.
2.5 In situ data of snow and ice properties
To provide comprehensive context for the Snow Buoy measurements and to validate the results of the one-dimensional thermodynamic sea ice model (Sect. 2.3), additional ice station work conducted during expeditions to the Weddell Sea in the late austral summer, i.e., February and March, is presented (Fig. 1a). The ice station work during expedition PS124 of the German icebreaker RV Polarstern in 2021 focused on the southeastern Weddell Sea (Haas et al., 2021). In contrast, the ice stations of expedition PS118 (Haas et al., 2019), also conducted by RV Polarstern, and the expedition Endurance22, carried out by the South African icebreaker S. A. Agulhas II (Rabenstein, 2022), covered the northwestern Weddell Sea.
During these expeditions, snow depth was measured using a GPS-equipped MagnaProbe (Snow Hydro; Sturm and Holmgren, 2018) along transect lines spanning several kilometers across the entirety of the sampled ice floes. Additional analyses of ice cores, focusing on salinity and stable water isotopes, were performed to determine the fractions of superimposed ice and snow ice (e.g., Arndt et al., 2021).
3.1 Drift regimes in the Weddell Sea
As described in Sect. 2.1, a significant proportion of the sea ice in the Weddell Sea forms in the polynyas along the eastern coast and is subsequently transported northward and northwestward by the Weddell Gyre. In addition, the seasonal fast ice near Atka Bay drifts along its eastern coast into the Weddell Sea (e.g., Snow Buoy 2018S56). However, closer examination of the ice drift patterns reveals variations in the drift regimes (Fig. 1a; Schwegmann et al., 2011). Some of the sea ice floes formed in the southeastern Weddell Sea follow a rather pronounced northward trajectory, ending up in the marginal ice zone of the central and eastern Weddell Sea (e.g., 2016S37; Fig. 1a). Other ice floes formed in the southeastern Weddell Sea drift on a longer southerly course, eventually ending up in the northwestern Weddell Sea (e.g., 2021S114; Fig. 1a). However, the exact location of their origin along the eastern Weddell Sea coast and their subsequent drift trajectories do not have a clear geographical assignment. Instead, these trajectories are more influenced by geostrophic winds (Kottmeier et al., 1992), local sea ice–ocean–shelf ice interactions causing currents (Kottmeier and Sellmann, 1996), tides (Robertson et al., 1998), and sea ice thickness and concentration (Vihma et al., 1996).
In addition, polynyas in the southern Weddell Sea, including the Ronne polynya, also produce persistent sea ice (Haas et al., 2008). This ice is frequently transported westward by the Weddell Gyre, which then carries it north along the Antarctic Peninsula towards the northwestern Weddell Sea (e.g., 2018S59).
Considering the literature cited and the diverse drift trajectories observed for the Snow Buoys (Fig. 1a), it is reasonable to assume that these buoys capture the prevailing drift patterns in the Weddell Sea. Therefore, the snow analyses conducted along the buoys' drift trajectories, as presented in the following sections, can be regarded as representative of the region as a whole.

Figure 2(a) Monthly mean snow accumulation rates (upward triangles) and snow ablation (downward triangles) and net accumulation (positive) or ablation (negative) rates (boxplots) of all Snow Buoys, separated by the four regions in the Weddell Sea (see Fig. 1). Data were included if at least 25 d per cycle was available in the respective month and region. Numbers indicate the quantity of annual buoy cycles contributing to the mean value. In the boxplots, boxes span the first and third quartiles. The whiskers display the 10th and 90th percentiles; the circles indicate mean values, which may include contributions from both accumulation and ablation. Panels (b) and (c) display the calculated layer thicknesses of snow ice and snow, respectively, from the applied one-dimensional thermodynamic sea ice growth model. Small dots represent individual point calculations for the specific month and region, while the large filled circles represent monthly regional means. Considering the transparency of the individual small dots, the higher the transparency, the fewer points are overlaid here, whereas the lower the transparency, the more points are overlaid. For snow ice, mean values are calculated by taking the overall mean (filled) as well as the pure mean snow ice thickness, i.e., averaging only over the cases where snow ice is actually present (open circles).
3.2 Spatial and seasonal variability in snow accumulation rates
The Snow Buoy results underline the fact that sea ice in the Weddell Sea is characterized by year-round snow cover, highlighting the dynamic nature of snow processes. The Weddell Sea region shows remarkable differences in annual net accumulation and ablation patterns. In the central/northeastern (C/NE) Weddell Sea, an average net accumulation of 57 cm is observed, whereas in the northwestern (NW) Weddell Sea a significantly lower accumulation of only 8 cm is observed (Figs. 1b and 2a). However, when considering the annual mean of the actual snow accumulation rate, which includes potential snow-to-ice conversion, the mean values range from 52 ± 31 cm yr−1 in the southeastern (C/SE) region to 66 ± 41 and 68 ± 33 cm yr−1 in the C/NE and NW regions, respectively, and increase further to 74 ± 41 cm yr−1 in the southwestern (SW) region (Fig. 1b).

Figure 3(a) Time series of 2 m air temperature measured by the presented Snow Buoys and results from (b) the applied one-dimensional thermodynamic sea ice growth model. Time series of the snow model SNOWPACK for (d) layer thicknesses of the snow accumulation retrieved from the Snow Buoys (dashed lines), the calculated snow depth (solid lines), snow ice thickness (filled areas) and (c) the superimposed ice layer thickness. The colors represent the four example Snow Buoys: 2016S37 (red), 2018S56 (yellow), 2018S59 (blue) and 2021S114 (green) (Fig. 1). The data are plotted for the corresponding months, with the buoy deployment year indicated by the buoy name (e.g., buoy 2016S37 was deployed in 2016). The dashed box across all panels indicates the time frame of the corresponding field data (Fig. 1). Figure A1 additionally shows the modeled thermodynamically grown sea ice thickness of both model approaches.
Examining individual time series of snow accumulation recorded by the Snow Buoys (Fig. 3b and d) reveals that snow accumulation takes place throughout the year driven by both continuous deposition and occasional events. Overall, the seasonal cycle of net snow accumulation/ablation is generally modest for most regions (Fig. 2a), which is in agreement with the seasonal cycle of precipitation derived from reanalysis data in the region (e.g., Boisvert et al., 2020). However, the SW region is dominated by perennial sea ice, and the associated limitations on buoy deployments, and thus data availability, hinder a comprehensive seasonal analysis (Fig. 1a).
For the C/NE Weddell Sea, the period from May to December shows the largest monthly net snow accumulation (Fig. 2a), which can be attributed to its closer proximity to the ice edge along with typical eastward-moving cyclone paths causing precipitation in the region (Boisvert et al., 2020). Also, the C/SE Weddell Sea experiences above-average net snow accumulation in October, which may be due to local topographic effects associated with, for example, the grounded iceberg A23a. The iceberg acts as a barrier blocking the westward movement of sea ice in the area and thus causes snow accumulation patterns with significantly higher accumulation rates, as observed by Snow Buoys 2014S10 and 2014S12 (Nicolaus et al., 2021).
In contrast, significant snow depth reduction or melt is mainly observed during the summer months in the marginal ice zone (MIZ), with monthly net snow mass loss and/or melt occurring exclusively in December and January (Fig. 2a). Here, a maximum snow loss of 15 cm per month is observed in the NW Weddell Sea in December, while the C/NE Weddell Sea experiences a loss of 4 cm in January. The C/SE region, however, exhibits a relatively low ablation period between May and August compared to other regions, with an average loss of up to 3 cm per month. This phenomenon could be linked to snow compaction and redistribution caused by katabatic winds originating from the eastern coast of the Weddell Sea (Venegas and Drinkwater, 2001).
The observed latitudinal patterns of snow mass loss in the Weddell Sea region are consistent with satellite radiometric analyses of seasonal snowmelt processes, indicating a consistent latitudinal gradient in the timing and intensity of snowmelt (Arndt et al., 2016; Willmes et al., 2009).
Based on the data from the 36 Snow Buoys, the Weddell Sea shows spatial and temporal variability in snow accumulation and ablation, with particularly high accumulation rates in the predominantly perennial sea ice areas of the southern and western regions. Therefore, considering the hydrostatic equilibrium of sea ice, the questions of how much of the initially accumulated snow remains as snow until the end of the ice floe or buoy drift and how much has been transformed into meteoric ice over time arise, which are addressed in the following section.

Figure 4(a) Daily maximum layer thickness over the whole time series (circles) and mean layer thickness (triangles) over the February-to-March period of superimposed ice as a function of latitude. (b) Correlation of snow depth estimates obtained by the one-dimensional sea ice model (x axis) and SNOWPACK (y axis). The diagonal line represents perfect agreement between the two models. Grey markers represent the respective calculations for all Snow Buoys, while colored markers represent the four exemplary Snow Buoys: 2016S37 (red), 2018S56 (yellow), 2018S59 (blue) and 2021S114 (green) (Fig. 1).
3.3 Seasonal transition of snow into snow ice
Considering the often high snow accumulation rates presented in Sect. 3.2 and the hydrostatic equilibrium of sea ice, it becomes clear that not all of the snow that has fallen on sea ice remains snow. Instead, the snow is transformed into snow ice at the snow–ice interface. Thus, snow accumulation does not equal snow depth but has to be corrected for the snow ice fraction. To achieve this, a one-dimensional thermodynamic sea ice model is applied along the drift trajectory of each Snow Buoy, yielding both the thermodynamic sea ice growth or melt at the bottom and the snow ice formation at the top (Figs. 3b and 4). The model is forced with the sea ice thickness at the time of buoy deployments, the daily-averaged snow accumulation retrieved from the Snow Buoys and the surface heat fluxes obtained from the ERA5 reanalysis data. For the subsequent analysis, it is important to note that the snow ice thickness may be overestimated as negative freeboards are directly translated into flooding and subsequent snow ice formation, which may not always be the case (see, e.g., Wever et al., 2021).
The results show that the model detects potential snow ice formation along 41 % of the total track length of the analyzed Snow Buoy tracks, with the snow ice layer observed in 16 of the analyzed buoys (Fig. 1c). This was particularly the case for buoys deployed on the fast ice at the northeastern edge of the Weddell Sea that then drifted with the Weddell Gyre and for buoys in the western Weddell Sea, i.e., in the perennial ice regime. The mean maximum thickness of snow ice for these 16 ice floes was 35 cm, which accounts for 27 % of the snow accumulation. Taking the whole dataset including ice floes without snow ice, the mean maximum snow ice thickness is 16 cm for the Weddell Sea (Fig. 2b).
3.3.1 Eastern Weddell Sea
In the C/SE region, the maximum monthly mean snow ice thickness is reached in late spring, i.e., October, with an average of 35 ± 10 cm. This value coincides well with the time of maximum snow accumulation in the region as shown in Fig. 2a. Furthermore, the calculated snow ice thickness in February and March was found to be 23 ± 15 cm, which is reasonably consistent with the observed snow ice thickness of 21 ± 18 cm, ranging from 0 to 58 cm, obtained from ice cores taken on 19 different ice floes in the same region in 2021 (Fig. 1a; Arndt, 2022a). However, while only 14 % of the Snow Buoy data points indicate potential snow ice formation in February/March (Fig. 2b), 84 % of the analyzed ice cores in the southeastern Weddell Sea (16 out of 19) confirm the presence of snow ice (Arndt, 2022a).
Correcting the snow accumulation for the calculated snow ice thickness reveals an even weaker seasonal cycle in snow depth compared to the snow accumulation rates discussed before (Sect. 2.2), especially in the C/NE Weddell Sea. Here, the highest monthly mean snow depth of 62 cm is observed in December and the lowest monthly mean snow depth of 45 cm in July (Fig. 2c). In contrast, the C/SE Weddell Sea shows the highest snow depth in November and the lowest in February, with mean values of 70 and 30 cm, respectively (Fig. 2c). For the months of February/March, the corrected mean snow depth values of 33 ± 22 cm agree well with the measured snow depths of 35 ± 23 cm on average from the RV Polarstern expedition PS124 in 2021.
The substantial layers of snow ice in the eastern Weddell Sea, along with the insulating snow cover on top, contribute to a notable reduction in thermodynamic growth during winter months (see Fig. A1). This highlights the crucial role of the Antarctic snow cover in shaping the sea ice mass budget within this area.
3.3.2 Western Weddell Sea
For the SW Weddell Sea, the highest snow ice layer thicknesses are obtained in October and November, at 29 ± 11 and 36 ± 8 cm, respectively (Fig. 2c). For the NW Weddell Sea, the maximum monthly mean snow ice thickness is observed in July, at 35 cm.
However, these monthly mean values for the region are not statistically significant as they are based on only 29 and 24 (SW) and 4 data points (NW) from a single buoy, respectively (Fig. 2c). Nevertheless, the data are important to demonstrate the potential for the thickest snow ice layers to occur in the western Weddell Sea, i.e., that most snow is converted to snow ice in the predominantly perennial sea ice regime. This is also supported by observations made in February and March 2022 in the region during the Endurance22 expedition (Rabenstein, 2022). Using ice core data, from which snow, meteoric ice and thermodynamically grown ice can be distinguished by salinity and stable water isotope analyses, snow ice thicknesses between 2 and 89 cm were determined, with a mean value of 38 ± 24 cm, which aligns well with the modeled snow ice thicknesses.
However, when considering the snow ice thicknesses calculated along the trajectory of Snow Buoy 2021S114 in February/March 2022 (Fig. 1c), which was approximately 100 km away from the ice stations of the concurrent Endurance22 expeditions, the sea ice model gives a mean snow ice thickness of only 12 cm (Fig. 3b), i.e., one-third of the measured layer thickness during the Endurance22 expedition as mentioned above. This discrepancy can be attributed to two possible causes. First, Nicolaus et al. (2021) showed that snow accumulation rates can vary considerably on spatial scales smaller than 250 km. This variation in snow accumulation rates can be reassessed for the Endurance22 expedition using the measured snow and snow ice thicknesses under the assumption of a 1 : 3 ratio between snow and snow ice densities. Accordingly, an estimated snow accumulation of approximately 120 cm is derived for the sampled ice floes during the Endurance22 expedition, while Snow Buoy 2021S114 had accumulated only approximately 70 cm of snow by February 2022. These variations in snow accumulation may be due to the fact that Snow Buoys were usually deployed on level ice and therefore do not account for snow drifting and accumulating in ice ridges. Thus, the Snow Buoy data may have a bias towards underestimating snow accumulation and consequently also underestimating snow ice formation. Additionally, the hydrostatic balance appears to be primarily determined at the scale of individual floes, whereas the measurements obtained from Snow Buoys represent specific points and may not fully capture the heterogeneity of the entire ice floe. Consequently, this discrepancy could result in elevated freeboards and subsequently reduced occurrences of flooding and snow ice formation. Second, the thermodynamic sea ice model used here assumes a constant ocean heat flux. During spring and summer 2022, the sea ice edge was further south than usual (e.g., Turner et al., 2022), raising the possibility of a higher ocean heat flux resulting in more bottom sea ice melting and subsequently more potential for flooding and snow ice formation. This assumption is supported by observational data on sea ice thickness in the Weddell Sea. During the Endurance22 expedition conducted in the northwestern Weddell Sea in February 2022, a predominant sea ice thickness of 1.05 m was recorded (Rabenstein, 2022). Contrarily, data from the previous summer in the southeastern Weddell Sea, in February/March 2021, indicated a modal sea ice thickness of 1.5 m (Arndt, 2022a), highlighting the associated significant bottom melt and related flooding and snow ice formation processes in the region. Thus, when doubling the ocean heat flux from 3 to 6 W m−2, the modeled snow ice thickness for the ice floe of Snow Buoy 2021S114 increases by 6 cm, highlighting the high sensitivity of the calculations to the ocean heat flux, especially in the marginal ice zone. However, for the inner ice pack, highly heterogeneous patterns of snow accumulation appear to be the major contributor to the variability in snow ice formation as shown above.
This discrepancy continues in the actual snow depths calculated. While the model calculates a mean snow depth in the NW Weddell Sea of 35 ± 19 and 33 ± 18 cm for February and March (Fig. 2d), respectively, the field measurements reveal a snow depth of 15 ± 11 cm (Rabenstein, 2022). It is important to highlight that the ice floes and Snow Buoys present in the region are at least 3, and in some cases, even 4 years old. As a result, the measured snow depths represent the corresponding perennial snow layers, a common occurrence in the region (Melsheimer et al., 2023). This is evident from the calculated maximum snow depths of 81 and 93 cm observed between August and November in the western Weddell Sea (Fig. 2d). Therefore, in order to compile a complete snow climatology for the region, the snow depth values presented here must be assigned to corresponding ice age classes, which is beyond the scope of this study.
The calculated snow depths presented here correct the snow accumulation only for snow ice formation but do not consider other snow-to-ice conversion processes such as superimposed ice formation or sublimation. These additional processes decrease snow depth even more in this relatively northern region with elevated surface energy fluxes (Nicolaus et al., 2006; Arndt et al., 2021) and will be discussed in detail in the following section.
3.4 Quantitative impact of snow metamorphism on the actual snow depth
The one-dimensional thermodynamic sea ice model used allows the description of the snow-to-ice conversion process by adjusting the snow–ice interface, maintaining the hydrostatic equilibrium of the sea ice and its snow cover. However, air temperature measurements from the analyzed Snow Buoys show temporary occurrences of temperatures around the freezing point (Fig. 3a), especially during the summer season. This suggests the possibility of internal snow melting followed by refreezing, leading to the formation of superimposed ice. In order to quantitatively assess the contribution of superimposed ice, the snow model SNOWPACK was used in a simplified configuration, excluding wind-driven snowdrift processes.
In this context, 34 % of the analyzed buoy data points have superimposed ice thicknesses calculated, which are characterized by an average maximum layer thickness of 4 ± 4 cm per buoy track (Fig. 4a). However, the analysis excludes Snow Buoy 2014S12 due to its maximum superimposed ice thickness of 24 cm, which is an outlier caused by an extended period spent at high northern latitudes. For all other buoys, the thickness of the maximum superimposed ice layer ranges between 0 and 14 cm, with a tendency towards thicker layers at more northern latitudes and thinner layers or no superimposed ice south of 70° S (Fig. 4a). The latter can be attributed to the high southern latitudes, the proximity to the continent and associated cold katabatic winds (Ebner et al., 2014). Hence, it can be inferred that the snow depth values obtained for the C/SE Weddell Sea in this study accurately reflect the actual conditions and that the model parameters utilized seem to be applicable to this region.
Overall, the findings presented here agree with superimposed ice observations during recent expeditions to the Weddell Sea. Although the ice core analysis from the PS124 expedition conducted in March 2021 did not detect any superimposed ice in the southeastern Weddell Sea, the same ice regime that moved into the northwestern Weddell Sea in March 2022 showed an average superimposed ice thickness of 8 ± 5 cm, varying from 0 to 17 cm (Haas et al., 2021; Rabenstein, 2022). Also the ice regime in the northwestern Weddell Sea originating from the southwest shows a mean superimposed ice thickness of 11 ± 11 cm at the end of summer 2019 (Arndt et al., 2021). Both observations and snow model results indicate that the thickness of the superimposed ice layer displays a latitude-dependent gradient. This is in agreement with the internal snowmelt onset calculated using passive and active microwave satellite data. The results show that the detection of seasonal internal melt–freeze cycles occurs earlier at more northern locations: the more northern the location, the earlier the detection of seasonal internal melt–freeze cycles (Arndt and Haas, 2019; Arndt et al., 2016). These processes correlate with the latitude-dependent surface energy fluxes.
The latitude-dependent superimposed ice formation is also reflected in the comparison of snow depths between the one-dimensional sea ice model and the SNOWPACK model (Fig. 4b), where the actual snow depth tends to be thinner because not only snow ice formation but also superimposed ice formation is taken into account. This is particularly the case for buoy 2021S114 that has been drifting for a long time in more northern latitudes and has therefore experienced more melting. In addition, SNOWPACK allows the snow above the flooded layer to be saturated, thus allowing more snow ice formation compared to the simple one-dimensional thermodynamic ice growth model. These results demonstrate the potential of using snow models to reduce uncertainties in estimating snow depth from snow accumulation data on Antarctic sea ice. However, processes such as snow redistribution by drift processes are not yet included – a requirement that, in combination with the snow-to-ice conversion processes discussed here, will play an important role in the development of future snow models on sea ice in order to be able to close the snow mass budget of Antarctic sea ice.
In this study, we used a comprehensive snow accumulation dataset acquired from Snow Buoys deployed on level ice drifting in the Weddell Sea over the last decade. Our primary objective was to derive the actual snow depth from snow accumulation and surface elevation data. This was achieved by assessing potential snow ice layer thicknesses along the drift trajectories using a one-dimensional thermodynamic sea ice model. In addition, we used the snow model SNOWPACK to account for key snow metamorphism processes, including the formation of superimposed ice.
Our results highlight that snow ice formation takes place primarily in the eastern Weddell Sea. In this region, the combination of sea ice growth at the snow–ice interface through snow-to-ice conversion processes and the insulating properties of snow act as a barrier to significant thermodynamic growth during the winter months. Thus, as it drifts towards the northwestern Weddell Sea, the sea ice that is rather thick from both thermodynamic and meteoric ice growth limits the formation of additional snow ice during the winter season. However, the potential for snow ice formation returns in summer driven by the onset of bottom melt and increased snowfall, particularly in response to the influx of warmer, moister air masses towards the ice edge. As a result, our analysis suggests that the thickest snow ice layers within the perennial sea ice zones of the northwestern Weddell Sea are primarily sourced from the southeastern Weddell Sea, owing to the sequential snow ice formation process occurring first in the southeastern region and then extending to the northwestern Weddell Sea. This phenomenon is due to the balancing effects of hydrostatic equilibrium, which maintain a consistent snow layer thickness even in regions characterized by high snow accumulation rates such as the southwestern Weddell Sea or during localized instances of intense snowfall where large amounts of snow ice are formed.
The evidence of current declining sea ice extent and concentration in the Southern Ocean suggests the possibility of increased ocean heat fluxes in the coming years and decades (e.g., Eayrs et al., 2021; Purich and Doddridge, 2023). These changes could lead to increased rates of bottom sea ice melt, increasing the likelihood of flooding and associated snow ice formation. At the same time, warmer air temperatures are expected to allow for higher moisture content, leading to increased snowfall and hence increased potential for flooding and snow ice formation. Concurrently, however, warming air temperatures and the associated shift in the surface energy fluxes above the sea ice may also increase snow mass loss through surface melting. This metamorphic wet snow reduces the albedo, ultimately initiating ice–albedo feedback due to conditions resembling those observed in the Arctic, which is referred to as “Arctification” of the Antarctic sea ice (Arndt et al., 2021).
We acknowledge that our assumption about ocean heat flux does not take into account its regional and temporal variability, potentially causing ocean heat flux and thus the potential for snow ice formation to be underestimated. Additionally, the immediate assumption of snow ice formation with negative freeboard may result in an overestimation of actual flooding and snow ice formation. While these processes may balance each other out, future research could enhance process understanding at the snow–ice and ice–ocean interface, for instance, through the deployment of autonomous thermistor string buoys, aiming for improved evaluation of the presented results.
In conclusion, this study underscores the critical importance of understanding snow transformation processes, not only under current conditions but also in anticipation of future changes in the coupled Antarctic sea ice system. These hidden processes, i.e., the formation of snow ice and superimposed ice, will remain hidden while large-scale analyses will have increasing importance based on model data and satellite remote sensing data. It is imperative to further develop and refine existing snow models to better reflect Antarctic sea ice conditions. This will enable us to close the Antarctic snow mass budget and improve the estimates of Antarctic sea ice thickness derived from both sea ice modeling and satellite remote sensing applications. A full understanding of these processes is essential to capture the complex dynamics of the Antarctic sea ice environment and its response to ongoing climate change.
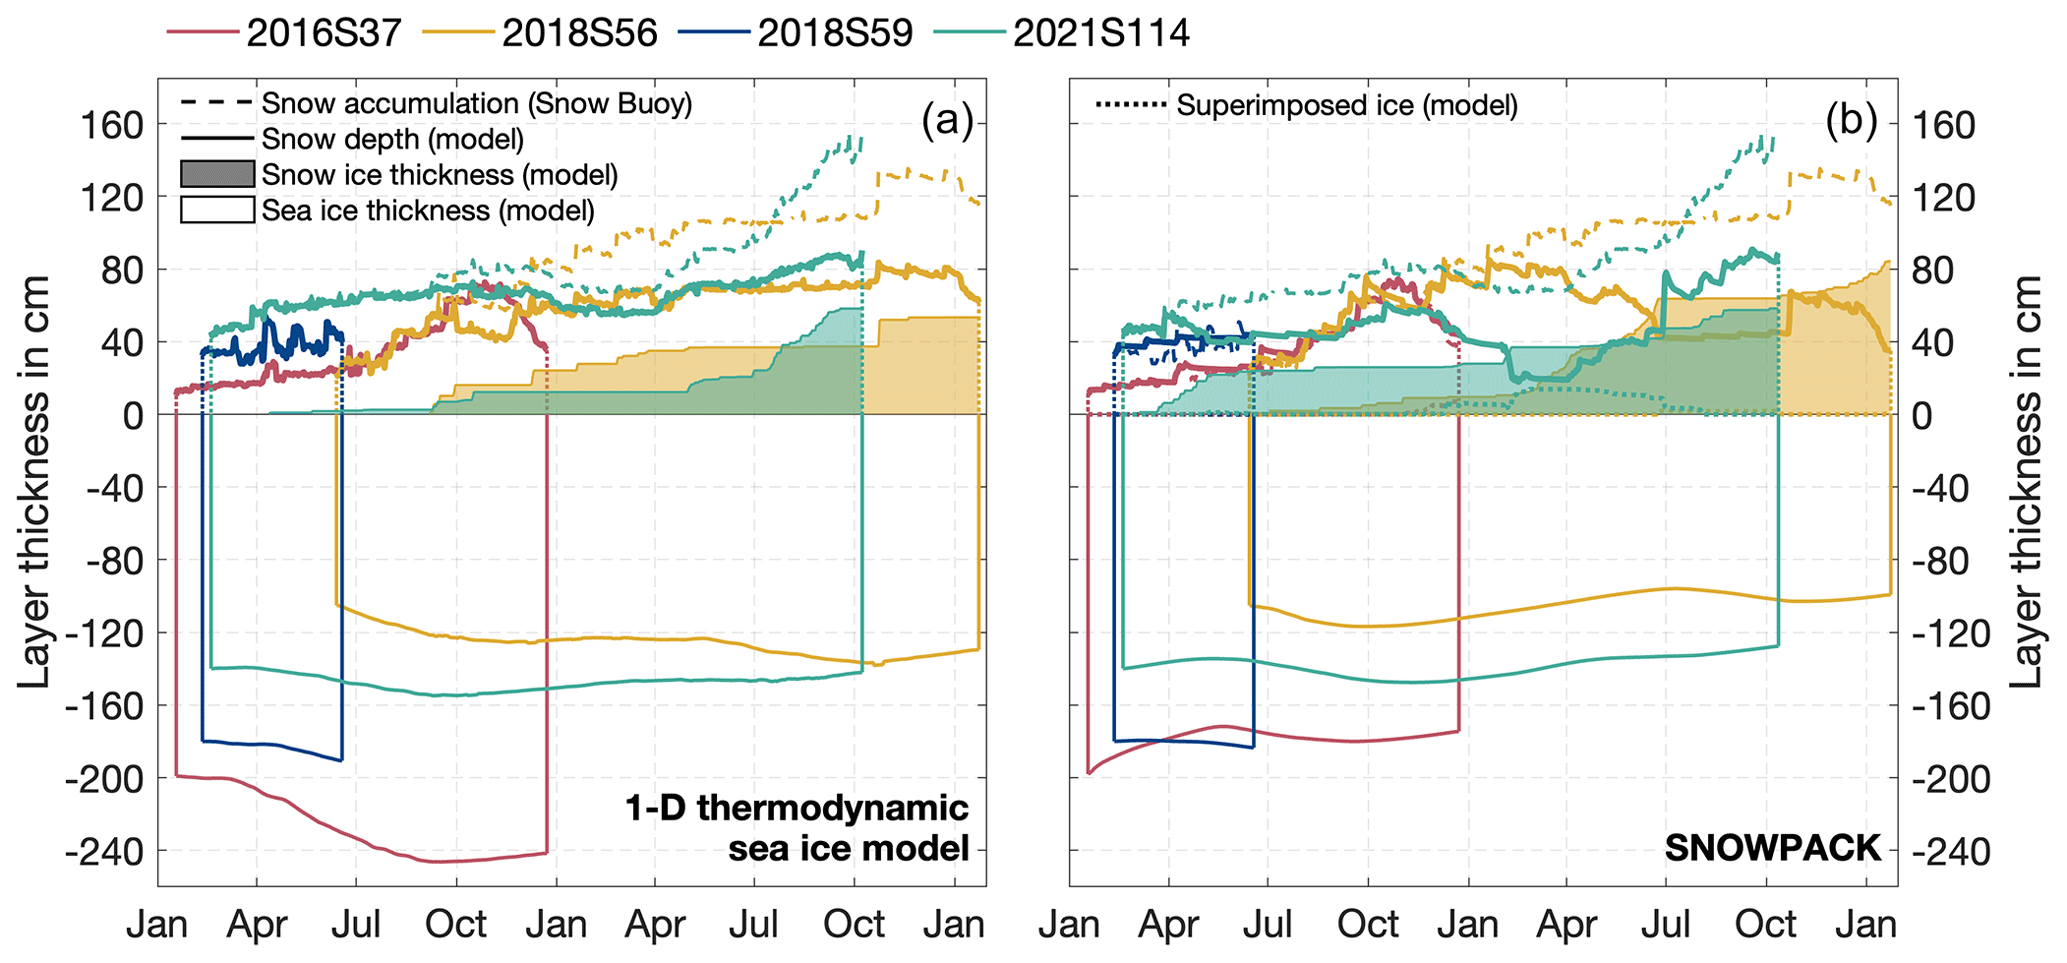
Figure A1Time series of layer thicknesses of the snow accumulation retrieved from the Snow Buoys (dashed lines) and the calculated snow depth (solid lines), snow ice thickness (filled areas) and thermodynamically grown sea ice thickness (negative values, solid lines) for (a) the one-dimensional thermodynamic sea ice model and (b) the snow model SNOWPACK. For the latter, the superimposed ice thickness is additionally denoted as dotted lines. The colors represent the four example Snow Buoys: 2016S37 (red), 2018S56 (yellow), 2018S59 (blue) and 2021S114 (green) (Fig. 1). The data are plotted for the corresponding months, with the buoy deployment year indicated by the buoy name (e.g., buoy 2016S37 was deployed in 2016).
Snow accumulation measurements from Snow Buoys were obtained from https://www.meereisportal.de (last access: 26 February 2024) (grant: REKLIM-2013-04) and are stored on the PANGAEA Data Publisher for Earth and Environmental Science website (Nicolaus et al., 2017, 2021, https://doi.org/10.1594/PANGAEA.875638).
All ERA5 data from ECMWF can be accessed and downloaded from the Copernicus Climate Change Service (last access: 29 September 2023) at https://doi.org/10.24381/cds.adbb2d47 (Hersbach et al., 2023).
All snow depth data from ice station work are available at https://doi.org/10.1594/PANGAEA.946183 (Arndt, 2022a, b), https://doi.org/10.1594/PANGAEA.928966 (Arndt and Haas, 2021) and https://doi.org/10.1594/PANGAEA.946177 (Arndt and Haas, 2022).
SNOWPACK (https://snowpack.slf.ch, Bavay et al., 2024a) and MeteoIO (https://meteoio.slf.ch, Bavay et al., 2024b) are software published under a GNU LGPLv3 license by the WSL Institute for Snow and Avalanche Research SLF.
SA and MN coordinated the deployment of the Snow Buoys in the Weddell Sea. SA set up and performed the one-dimensional thermodynamic sea ice model, while NM and LR set up and performed the SNOWPACK model runs. SA performed all analyses and prepared the figures for the paper. All authors contributed to discussions and to the actual writing.
The contact author has declared that none of the authors has any competing interests.
Publisher's note: Copernicus Publications remains neutral with regard to jurisdictional claims made in the text, published maps, institutional affiliations, or any other geographical representation in this paper. While Copernicus Publications makes every effort to include appropriate place names, the final responsibility lies with the authors.
We gratefully acknowledge the support of the cruise leaders, all involved scientists, the helicopter teams on board, and the captains and crews of RV Polarstern during expeditions PS81, PS82, PS89, PS96, PS103, PS111 and PS124 (grant numbers AWI_PS81_00, AWI_PS82_02, AWIPS89_02, AWI_PS96_01, AWI_PS103_02, AWI_PS111_00 and AWI_PS124_08). In the same way, we acknowledge the work of all people involved in the Endurance22 expedition with the S. A. Agulhas II. Furthermore, we acknowledge all wintering teams at Neumayer Station III supporting the regular deployment of buoys in Atka Bay near the base. We highly appreciate the work of the http://www.meereisportal.de (last access: 26 February 2024) team for building and maintaining the online platform and database for all Snow Buoy data (REKLIM-2012-04).
This work received funding from the German Research Foundation (DFG) projects fAntasie (AR1236/3-1), SnowCast (AR1236/1-1), Snow Covers impact on Antarctic Sea Ice (SCASI; NI1096/5-1) and SCASI-RS (MA 5056/2-1) within its priority program “Antarctic research with comparative investigations in the Arctic ice areas” (SPP1158). Additional funding comes from the DFG Emmy Noether Programme project SNOWflAke (project number 493362232); the University of Hamburg; and the Alfred-Wegener-Institut, Helmholtz-Zentrum für Polar- und Meeresforschung. All buoys were funded by the Helmholtz infrastructure programs Advanced Remote Sensing – Ground Truth Demo and Test Facilities (ACROSS) and Frontiers of Arctic Marine Monitoring (FRAM) with data transmission contributions from the German Weather Service (DWD) and the International Arctic Buoy Program (IABP).
This paper was edited by Chris Derksen and reviewed by two anonymous referees.
Ackley, S., Lewis, M., Fritsen, C., and Xie, H.: Internal melting in Antarctic sea ice: Development of “gap layers”, Geophys. Res. Lett., 35, L11503, https://doi.org/10.1029/2008GL033644, 2008.
Ackley, S., Perovich, D., Maksym, T., Weissling, B., and Xie, H.: Surface flooding of Antarctic summer sea ice, Ann. Glaciol., 61, 117–126, https://doi.org/10.1017/aog.2020.22, 2020.
Arndt, S.: Sensitivity of Sea Ice Growth to Snow Properties in Opposing Regions of the Weddell Sea in Late Summer, Geophys. Res. Lett., 49, e2022GL099653, https://doi.org/10.1029/2022GL099653, 2022a.
Arndt, S.: Snow thickness measurements at ice stations during RV POLARSTERN cruise PS111, Alfred Wegener Institute, Helmholtz Centre for Polar and Marine Research, Bremerhaven, PANGAEA [data set], https://doi.org/10.1594/PANGAEA.946183, 2022b.
Arndt, S. and Haas, C.: Spatiotemporal variability and decadal trends of snowmelt processes on Antarctic sea ice observed by satellite scatterometers, The Cryosphere, 13, 1943–1958, https://doi.org/10.5194/tc-13-1943-2019, 2019.
Arndt, S. and Haas, C.: Snow thickness measurements at ice stations during POLARSTERN cruise PS118, PANGAEA [data ste], https://doi.org/10.1594/PANGAEA.928966, 2021.
Arndt, S. and Haas, C.: Snow thickness measurements at ice stations during RV POLARSTERN cruise PS124, PANGAEA [data set], https://doi.org/10.1594/PANGAEA.946177, 2022.
Arndt, S., Willmes, S., Dierking, W., and Nicolaus, M.: Timing and regional patterns of snowmelt on Antarctic sea ice from passive microwave satellite observations, J. Geophys. Res.-Oceans, 121, 5916–5930, https://doi.org/10.1002/2015JC011504, 2016.
Arndt, S., Hoppmann, M., Schmithüsen, H., Fraser, A. D., and Nicolaus, M.: Seasonal and interannual variability of landfast sea ice in Atka Bay, Weddell Sea, Antarctica, The Cryosphere, 14, 2775–2793, https://doi.org/10.5194/tc-14-2775-2020, 2020.
Arndt, S., Haas, C., Meyer, H., Peeken, I., and Krumpen, T.: Recent observations of superimposed ice and snow ice on sea ice in the northwestern Weddell Sea, The Cryosphere, 15, 4165–4178, https://doi.org/10.5194/tc-15-4165-2021, 2021.
Bartelt, P. and Lehning, M.: A physical SNOWPACK model for the Swiss avalanche warning: Part I: numerical model, Cold Reg. Sci. Technol., 35, 123–145, 2002.
Bavay, M., Fierz, C., Hirashima, H., Wever, N., Richter, B., Michel, A., and Ebner, P.: SNOWPACK source code, https://snowpack.slf.ch (last access: 1 March 2024), 2024a.
Bavay, M., Egger, T., Michel, A., and Reisecker, M.: MeteoIO source code, https://meteoio.slf.ch (last access: 1 March 2024), 2024b.
Boisvert, L. N., Webster, M. A., Petty, A. A., Markus, T., Cullather, R. I., and Bromwich, D. H.: Intercomparison of precipitation estimates over the Southern Ocean from atmospheric reanalyses, J. Climate, 33, 10627–10651, 2020.
Calonne, N., Flin, F., Morin, S., Lesaffre, B., du Roscoat, S. R., and Geindreau, C.: Numerical and experimental investigations of the effective thermal conductivity of snow, Geophys. Res. Lett., 38, L23501, https://doi.org/10.1029/2011gl049234, 2011.
Copernicus Climate Change Service: ERA5: Fifth generation of ECMWF atmospheric reanalyses of the global climate, https://cds.climate.copernicus.eu/cdsapp#!/home (last access: 1 March 2024), 2017.
Eayrs, C., Li, X., Raphael, M. N., and Holland, D. M.: Rapid decline in Antarctic sea ice in recent years hints at future change, Nat. Geosci., 14, 460–464, https://doi.org/10.1038/s41561-021-00768-3, 2021.
Ebner, L., Heinemann, G., Haid, V., and Timmermann, R.: Katabatic winds and polynya dynamics at Coats Land, Antarctica, Antarct. Sci., 26, 309–326, 2014.
Eicken, H., Lange, M. A., Hubberten, H. W., and Wadhams, P.: Characteristics and distribution patterns of snow and meteoric ice in the Weddell Sea and their contribution to the mass balance of sea ice, Ann. Geophys., 12, 80–93, https://doi.org/10.1007/s00585-994-0080-x, 1994.
Fons, S. W. and Kurtz, N. T.: Retrieval of snow freeboard of Antarctic sea ice using waveform fitting of CryoSat-2 returns, The Cryosphere, 13, 861–878, https://doi.org/10.5194/tc-13-861-2019, 2019.
Grosfeld, K., Treffeisen, R., Asseng, J., Bartsch, A., Bräuer, B., Fritzsch, B., Gerdes, R., Hendricks, S., Hiller, W., and Heygster, G.: Online sea-ice knowledge and data platform www.meereisportal.de, Polarforschung, 85, 143–155, 2015.
Haas, C. and Eicken, H.: Interannual variability of summer sea ice thickness in the Siberian and central Arctic under different atmospheric circulation regimes, J. Geophys. Res.-Oceans, 106, 4449–4462, 2001.
Haas, C., Thomas, D. N., and Bareiss, J.: Surface properties and processes of perennial Antarctic sea ice in summer, J. Glaciology, 47, 613–625, https://doi.org/10.3189/172756501781831864, 2001.
Haas, C., Nicolaus, M., Willmes, S., Worby, A., and Flinspach, D.: Sea ice and snow thickness and physical properties of an ice floe in the western Weddell Sea and their changes during spring warming, Deep-Sea Res Pt II, 55, 963–974, https://doi.org/10.1016/J.Dsr2.2007.12.020, 2008.
Haas, C., Arndt, S., Peeken, I., and Allhusen, E.: Sea Ice, Chapter in: The Expedition PS118 of the Research Vessel POLARSTERN to the Weddell Sea in 2019, Berichte zur Polar-und Meeresforschung – Reports on polar and marine research, 735, 97–123, https://doi.org/10.2312/BzPM_0735_2019, 2019.
Haas, C., Arndt, S., Peeken, I., Eggers, S. L., and Neudert, M.: Chapter Sea Ice Geophysics and Biogeochemistry in: The Expedition PS124 of the Research Vessel POLARSTERN to the Weddell Sea in 2021, Berichte zur Polar-und Meeresforschung – Reports on polar and marine research, Bremerhaven, Alfred Wegener Institute for Polar and Marine Research, 755, p. 237, https://doi.org/10.48433/BzPM_0755_202, 2021.
Harms, S., Fahrbach, E., and Strass, V. H.: Sea ice transports in the Weddell Sea, J. Geophys. Res.-Oceans, 106, 9057–9073, https://doi.org/10.1029/1999JC000027, 2001.
Hersbach, H., Bell, B., Berrisford, P., Biavati, G., Horányi, A., Muñoz Sabater, J., Nicolas, J., Peubey, C., Radu, R., Rozum, I., Schepers, D., Simmons, A., Soci, C., Dee, D., and Thépaut, J.-N.: ERA5 hourly data on single levels from 1940 to present, Copernicus Climate Change Service (C3S) Climate Data Store (CDS) [data set], https://doi.org/10.24381/cds.adbb2d47, 2023.
Holtslag, A. and De Bruin, H.: Applied modeling of the nighttime surface energy balance over land, J. Appl. Meteorol. Clim., 27, 689–704, https://doi.org/10.1175/1520-0450(1988)027<0689:AMOTNS>2.0.CO;2, 1988.
Kawamura, T., Ohshima, K., Takizawa, T., and Ushio, S.: Physical, structural, and isotopic characteristics and growth processes of fast sea ice in Lützow-Holm Bay, Antarctica, J. Geophys. Res.-Oceans, 102, 3345–3355, 1997.
Kottmeier, C. and Sellmann, L.: Atmospheric and oceanic forcing of Weddell Sea ice motion, J. Geophys. Res.-Oceans, 101, 20809–20824, 1996.
Kottmeier, C., Olf, J., Frieden, W., and Roth, R.: Wind forcing and ice motion in the Weddell Sea region, J. Geophys. Res.-Atmos., 97, 20373–20383, 1992.
Kwok, R. and Kacimi, S.: Three years of sea ice freeboard, snow depth, and ice thickness of the Weddell Sea from Operation IceBridge and CryoSat-2, The Cryosphere, 12, 2789–2801, https://doi.org/10.5194/tc-12-2789-2018, 2018.
Kwok, R., Kacimi, S., Webster, M., Kurtz, N., and Petty, A.: Arctic snow depth and sea ice thickness from ICESat-2 and CryoSat-2 freeboards: A first examination, J. Geophys. Res.-Oceans, 125, e2019JC016008, https://doi.org/10.1029/2019JC016008, 2020.
Lehning, M., Bartelt, P., Brown, B., and Fierz, C.: A physical SNOWPACK model for the Swiss avalanche warning Part III: meteorological forcing, thin layer formation and evaluation, Cold Reg. Sci. Technol., 35, 169–184, 2002a.
Lehning, M., Bartelt, P., Brown, B., Fierz, C., and Satyawali, P.: A physical SNOWPACK model for the Swiss avalanche warning: Part II. Snow microstructure, Cold Reg. Sci. Technol., 35, 147–167, 2002b.
Lytle, V. and Ackley, S.: Heat flux through sea ice in the western Weddell Sea: Convective and conductive transfer processes, J. Geophys. Res.-Oceans, 101, 8853–8868, 1996.
Massom, R., Eicken, H., Haas, C., Jeffries, M. O., Drinkwater, M. R., Sturm, M., Worby, A. P., Wu, X. R., Lytle, V. I., Ushio, S., Morris, K., Reid, P. A., Warren, S. G., and Allison, I.: Snow on Antarctic Sea ice, Rev. Geophys, 39, 413–445, https://doi.org/10.1029/2000rg000085, 2001.
McPhee, M. G., Kottmeier, C., and Morison, J. H.: Ocean heat flux in the central Weddell Sea during winter, J. Phys. Oceanogr., 29, 1166–1179, 1999.
Melsheimer, C., Spreen, G., Ye, Y., and Shokr, M.: First results of Antarctic sea ice type retrieval from active and passive microwave remote sensing data, The Cryosphere, 17, 105–126, https://doi.org/10.5194/tc-17-105-2023, 2023.
Nicolaus, M., Haas, C., Bareiss, J., and Willmes, S.: A model study of differences of snow thinning on Arctic and Antarctic first-year sea ice during spring and summer, Ann. Glaciol., 44, 147–153, https://doi.org/10.3189/172756406781811312, 2006.
Nicolaus, M., Haas, C., and Willmes, S.: Evolution of first-year and second-year snow properties on sea ice in the Weddell Sea during spring-summer transition, J. Geophys. Res., 114, D17109, https://doi.org/10.1029/2008JD011227, 2009.
Nicolaus, M., Hoppmann, M., Arndt, S., Hendricks, S., Katlein, C., König-Langlo, G., Nicolaus, A., Rossmann, L., Schiller, M., Schwegmann, S., Langevin, D., and Bartsch, A.: Snow height and air temperature on sea ice from Snow Buoy measurements, Alfred Wegener Institute, Helmholtz Centre for Polar and Marine Research, Bremerhaven, PANGAEA [data set], https://doi.org/10.1594/PANGAEA.875638, 2017.
Nicolaus, M., Hoppmann, M., Arndt, S., Hendricks, S., Katlein, C., Nicolaus, A., Rossmann, L., Schiller, M., and Schwegmann, S.: Snow Depth and Air Temperature Seasonality on Sea Ice Derived From Snow Buoy Measurements, Frontiers in Marine Science, 8, 655446, https://doi.org/10.3389/fmars.2021.655446, 2021.
Paul, S., Willmes, S., and Heinemann, G.: Long-term coastal-polynya dynamics in the southern Weddell Sea from MODIS thermal-infrared imagery, The Cryosphere, 9, 2027–2041, https://doi.org/10.5194/tc-9-2027-2015, 2015.
Paul, S., Hendricks, S., Ricker, R., Kern, S., and Rinne, E.: Empirical parametrization of Envisat freeboard retrieval of Arctic and Antarctic sea ice based on CryoSat-2: progress in the ESA Climate Change Initiative, The Cryosphere, 12, 2437–2460, https://doi.org/10.5194/tc-12-2437-2018, 2018.
Purich, A. and Doddridge, E. W.: Record low Antarctic sea ice coverage indicates a new sea ice state, Communications Earth & Environment, 4, 314, https://doi.org/10.1038/s43247-023-00961-9, 2023.
Rabenstein, L. (Ed.): Endurance22, Cruise Scientific Report, 1–95, https://endurance22.org/uploads/2022/06/Science_Report_Endurance22_final_version.pdf (last access: 10 June 2022), 2022.
Ricker, R., Hendricks, S., Perovich, D. K., Helm, V., and Gerdes, R.: Impact of snow accumulation on CryoSat-2 range retrievals over Arctic sea ice: An observational approach with buoy data, Geophys. Res. Lett., 42, 4447–4455, 2015.
Robertson, R., Padman, L., and Levine, M. D.: Fine structure, microstructure, and vertical mixing processes in the upper ocean in the western Weddell Sea, J. Geophys. Res.-Oceans, 100, 18517–18535, 1995.
Robertson, R., Padman, L., and Egbert, G. D.: Tides in the Weddell Sea, Ocean, Ice and Atmosphere: Interactions at the Antarctic Continental Margin, Antarct. Res. Ser., 75, 341–369, 1998.
Schwegmann, S., Haas, C., Fowler, C., and Gerdes, R.: A comparison of satellite-derived sea-ice motion with drifting-buoy data in the Weddell Sea, Antarctica, Ann. Glaciol., 52, 103–110, https://doi.org/10.3189/172756411795931813, 2011.
Schwegmann, S., Rinne, E., Ricker, R., Hendricks, S., and Helm, V.: About the consistency between Envisat and CryoSat-2 radar freeboard retrieval over Antarctic sea ice, The Cryosphere, 10, 1415–1425, https://doi.org/10.5194/tc-10-1415-2016, 2016.
Spreen, G., Kaleschke, L., and Heygster, G.: Sea ice remote sensing using AMSR-E 89-GHz channels, J. Geophys. Res.-Oceans, 113, C02S03, https://doi.org/10.1029/2005jc003384, 2008.
Sturm, M. and Holmgren, J.: An automatic snow depth probe for field validation campaigns, Water Resour. Res., 54, 9695–9701, 2018.
Sturm, M., Holmgren, J., Konig, M., and Morris, K.: The thermal conductivity of seasonal snow, J. Glaciology, 43, 26–41, 1997.
Thorndike, A.: A toy model linking atmospheric thermal radiation and sea ice growth, J. Geophys. Res.-Oceans, 97, 9401–9410, 1992.
Tian, L. J., Gao, Y. L., Weissling, B., and Ackley, S. F.: Snow-ice contribution to the structure of sea ice in the Amundsen Sea, Antarctica, Ann. Glaciol., 61, 369–378, https://doi.org/10.1017/aog.2020.55, 2020.
Turner, J., Holmes, C., Caton Harrison, T., Phillips, T., Jena, B., Reeves-Francois, T., Fogt, R., Thomas, E. R., and Bajish, C.: Record low Antarctic sea ice cover in February 2022, Geophys. Res. Lett., 49, e2022GL098904, https://doi.org/10.1029/2022GL098904, 2022.
Venegas, S. A. and Drinkwater, M. R.: Sea ice, atmosphere and upper ocean variability in the Weddell Sea, Antarctica, J. Geophys. Res.-Oceans, 106, 16747–16765, https://doi.org/10.1029/2000jc000594, 2001.
Vernet, M., Geibert, W., Hoppema, M., Brown, P. J., Haas, C., Hellmer, H., Jokat, W., Jullion, L., Mazloff, M., and Bakker, D.: The Weddell Gyre, Southern Ocean: present knowledge and future challenges, Rev. Geophys., 57, 623–708, 2019.
Vihma, T., Launiainen, J., and Uotila, J.: Weddell Sea ice drift: Kinematics and wind forcing, J. Geophys. Res.-Oceans, 101, 18279–18296, https://doi.org/10.1029/96JC01441, 1996.
Webster, M., Gerland, S., Holland, M., Hunke, E., Kwok, R., Lecomte, O., Massom, R., Perovich, D., and Sturm, M.: Snow in the changing sea-ice systems, Nat. Clim. Change, 8, 946–953, https://doi.org/10.1038/s41558-018-0286-7, 2018.
Wever, N., Schmid, L., Heilig, A., Eisen, O., Fierz, C., and Lehning, M.: Verification of the multi-layer SNOWPACK model with different water transport schemes, The Cryosphere, 9, 2271–2293, https://doi.org/10.5194/tc-9-2271-2015, 2015.
Wever, N., Würzer, S., Fierz, C., and Lehning, M.: Simulating ice layer formation under the presence of preferential flow in layered snowpacks, The Cryosphere, 10, 2731–2744, https://doi.org/10.5194/tc-10-2731-2016, 2016.
Wever, N., Rossmann, L., Maaß, N., Leonard, K. C., Kaleschke, L., Nicolaus, M., and Lehning, M.: Version 1 of a sea ice module for the physics-based, detailed, multi-layer SNOWPACK model, Geosci. Model Dev., 13, 99–119, https://doi.org/10.5194/gmd-13-99-2020, 2020.
Wever, N., Leonard, K., Maksym, T., White, S., Proksch, M., and Lenaerts, J. T. M.: Spatially distributed simulations of the effect of snow on mass balance and flooding of Antarctic sea ice, J. Glaciol., 67, 1055–1073, https://doi.org/10.1017/jog.2021.54, 2021.
Willmes, S., Haas, C., Nicolaus, M., and Bareiss, J.: Satellite microwave observations of the interannual variability of snowmelt on sea ice in the Southern Ocean, J. Geophys. Res.-Oceans, 114, C03006, https://doi.org/10.1029/2008jc004919, 2009.
Worby, A. P., Geiger, C. A., Paget, M. J., Van Woert, M. L., Ackley, S. F., and DeLiberty, T. L.: Thickness distribution of Antarctic sea ice, J. Geophys. Res.-Oceans, 113, C05S92, https://doi.org/10.1029/2007jc004254, 2008.