the Creative Commons Attribution 4.0 License.
the Creative Commons Attribution 4.0 License.
 | 23 Apr 2024
Millennial-scale fluctuations of palaeo-ice margin at the southern fringe of the last Fennoscandian Ice Sheet
Wojciech Wysota
Vincent Rinterknecht
Piotr Moska
Aleksandra Bielicka-Giełdoń
The paper presents the first terrestrial record of millennial-scale palaeo-ice margin oscillations at the southern fringe of the last Fennoscandian Ice Sheet (FIS) during the last glacial cycle. The study area is located in northern Poland close to the last FIS maximum limit. The chronology and dynamics of palaeo-ice margin oscillations at the southern fringe of the FIS are based on combined luminescence and 10Be surface exposure dating. Optically stimulated luminescence (OSL) was used to date sandy deposits (fluvioglacial sediments and aeolian deposits filling fossil periglacial wedges) intercalating basal till layers. The most likely age of the tills was constrained by Bayesian modelling of the sequence of OSL ages and lithostratigraphy. 10Be surface exposure dating was used on erratic boulders left during the final retreat of the last FIS and resting on the surface of glacial landforms. Our results, which are mainly based on OSL chronology and Bayesian modelling, indicate millennial-scale oscillations of the last FIS in northern Poland between ∼19 and ∼17 ka. The last FIS retreated and re-advanced over a relatively short period of time (2–3 ka), leaving lithostratigraphic records (basal tills) of three ice re-advances over a millennial-scale cycle: 19.2±1.1, 17.8±0.5 and 16.9±0.5 ka. Despite 10Be surface exposure ages obtained for 14 erratic boulders being poorly clustered, the main mode of age distribution occurs at ∼18 ka and indicates a possible signal of the ice sheet retreat after one of the re-advances. We explore the dynamics of these oscillations and compare the proposed cycles of the southern FIS advances and retreats with existing patterns of the last deglaciation and millennial-scale fluctuations of the last FIS inferred from marine records.
- Article
(12069 KB) - Full-text XML
- BibTeX
- EndNote


Ice sheets and glaciers are key components of a cryosphere coupled to climate, global sea level and ocean circulation (e.g. Clark et al., 1999; Greve and Blatter, 2009; Fyke et al., 2018). Ice sheet fluctuations are good indicators of climate changes because they tend to stay in equilibrium with regional climate, and they react to any long-term variations of temperature and precipitation by their mass balance adjustment. However, interactions between ice sheets and climate are complex. Cooling and warming affect expansion and shrinkage of glaciated areas, but on the other hand, the extent of areas with permanent ice cover has a significant impact on the climatic system, e.g. by controlling the magnitude of albedo, by delivering large amounts of freshwater into oceans or by diverting the jet stream circulation. Thus, ice sheets and glaciers are strongly linked to climate, and they are as such a key element of the cryosphere–climate system (e.g. Hahn et al., 2018; Noble et al., 2020). In the era of global warming, a lot of attention is given to understand their past and current trends and to feed models simulating their future behaviour. Our knowledge about interactions of the Pleistocene palaeo-ice sheets with past climate changes is however much more limited, as glacial geological records are fragmentary and in many cases difficult to date (e.g. Fuchs and Owen, 2008; King et al., 2014; Davis, 2022). In order to explore interactions between palaeo-ice sheets, such as the Fennoscandian or Laurentide ice sheets, with Pleistocene climate fluctuations, it is key to link available geological records with the timing of palaeo-ice sheet advances and retreats. Chronologies enable spatial fluctuations to be correlated with palaeo-climatic records available from ice cores, marine sediments, loess sequences or other lacustrine archives, for example (Levy et al., 2018; Rea et al., 2018; Nawrocki et al., 2019). Dating terrestrial glacial records is however challenging, mainly due to the very dynamic nature of the glacial environment, resulting in great lateral and vertical variations of sediments, the presence of erosional gaps and deformations as well as post-depositional reworking (Brodzikowski and van Loon, 1987; Kurjański et al., 2020).
Here, we present a study reconstructing the chronology and dynamics of palaeo-ice margin oscillations based on combined optically stimulated luminescence (OSL) and 10Be surface exposure dating. The study was conducted in northern Poland at the southern fringe of the last Fennoscandian Ice Sheet (FIS). The OSL method was used to date sandy deposits intercalating basal till layers, and the most likely age of the tills was constrained by Bayesian modelling incorporating the sequence of OSL ages and lithostratigraphy. 10Be surface exposure dating was used to date erratic boulders left by the last FIS and resting on a surface of conspicuous glacial landforms. The paper presents the first terrestrial record of millennial-scale palaeo-ice margin oscillations at the southern fringe of the FIS during the last glacial cycle. We explore the dynamics of these oscillations, and we compare the proposed cycles of the southern FIS advances and retreats with existing patterns of the last deglaciation and millennial-scale fluctuations of the last FIS inferred from marine records.
2.1 Location
The study area is located in northern Poland in the region covered by the last FIS, in very close vicinity to its maximum limit (Fig. 1a). It covers the region of a fresh glacial landscape shaped in the Late Pleistocene during the last ice sheet advance and retreat, which in this part of the northern Polish Lowland occurred around 22–18 ka BP (Tylmann et al., 2019; Hughes et al., 2022; Marks et al., 2022). The area is located within the Lubawa Upland, an elevated morainic upland, where the highest elevations exceed 300 m a.s.l. and are located up to 200 m higher than the surrounding lowlands and valleys (Fig. 1b). The topography of this region is highly diversified with conspicuous moraine hillocks and deeply incised valleys creating local relief up to 50–70 m. Variability of such fresh glacial relief is a result of glaciotectonic deformations that repeatedly occurred over several Pleistocene glaciations in this region (Marks, 1979; Gałązka et al., 2009) and of intensive meltwater erosion of the ice bed and ice sheet foreland during the last deglaciation (Tylmann, 2014).
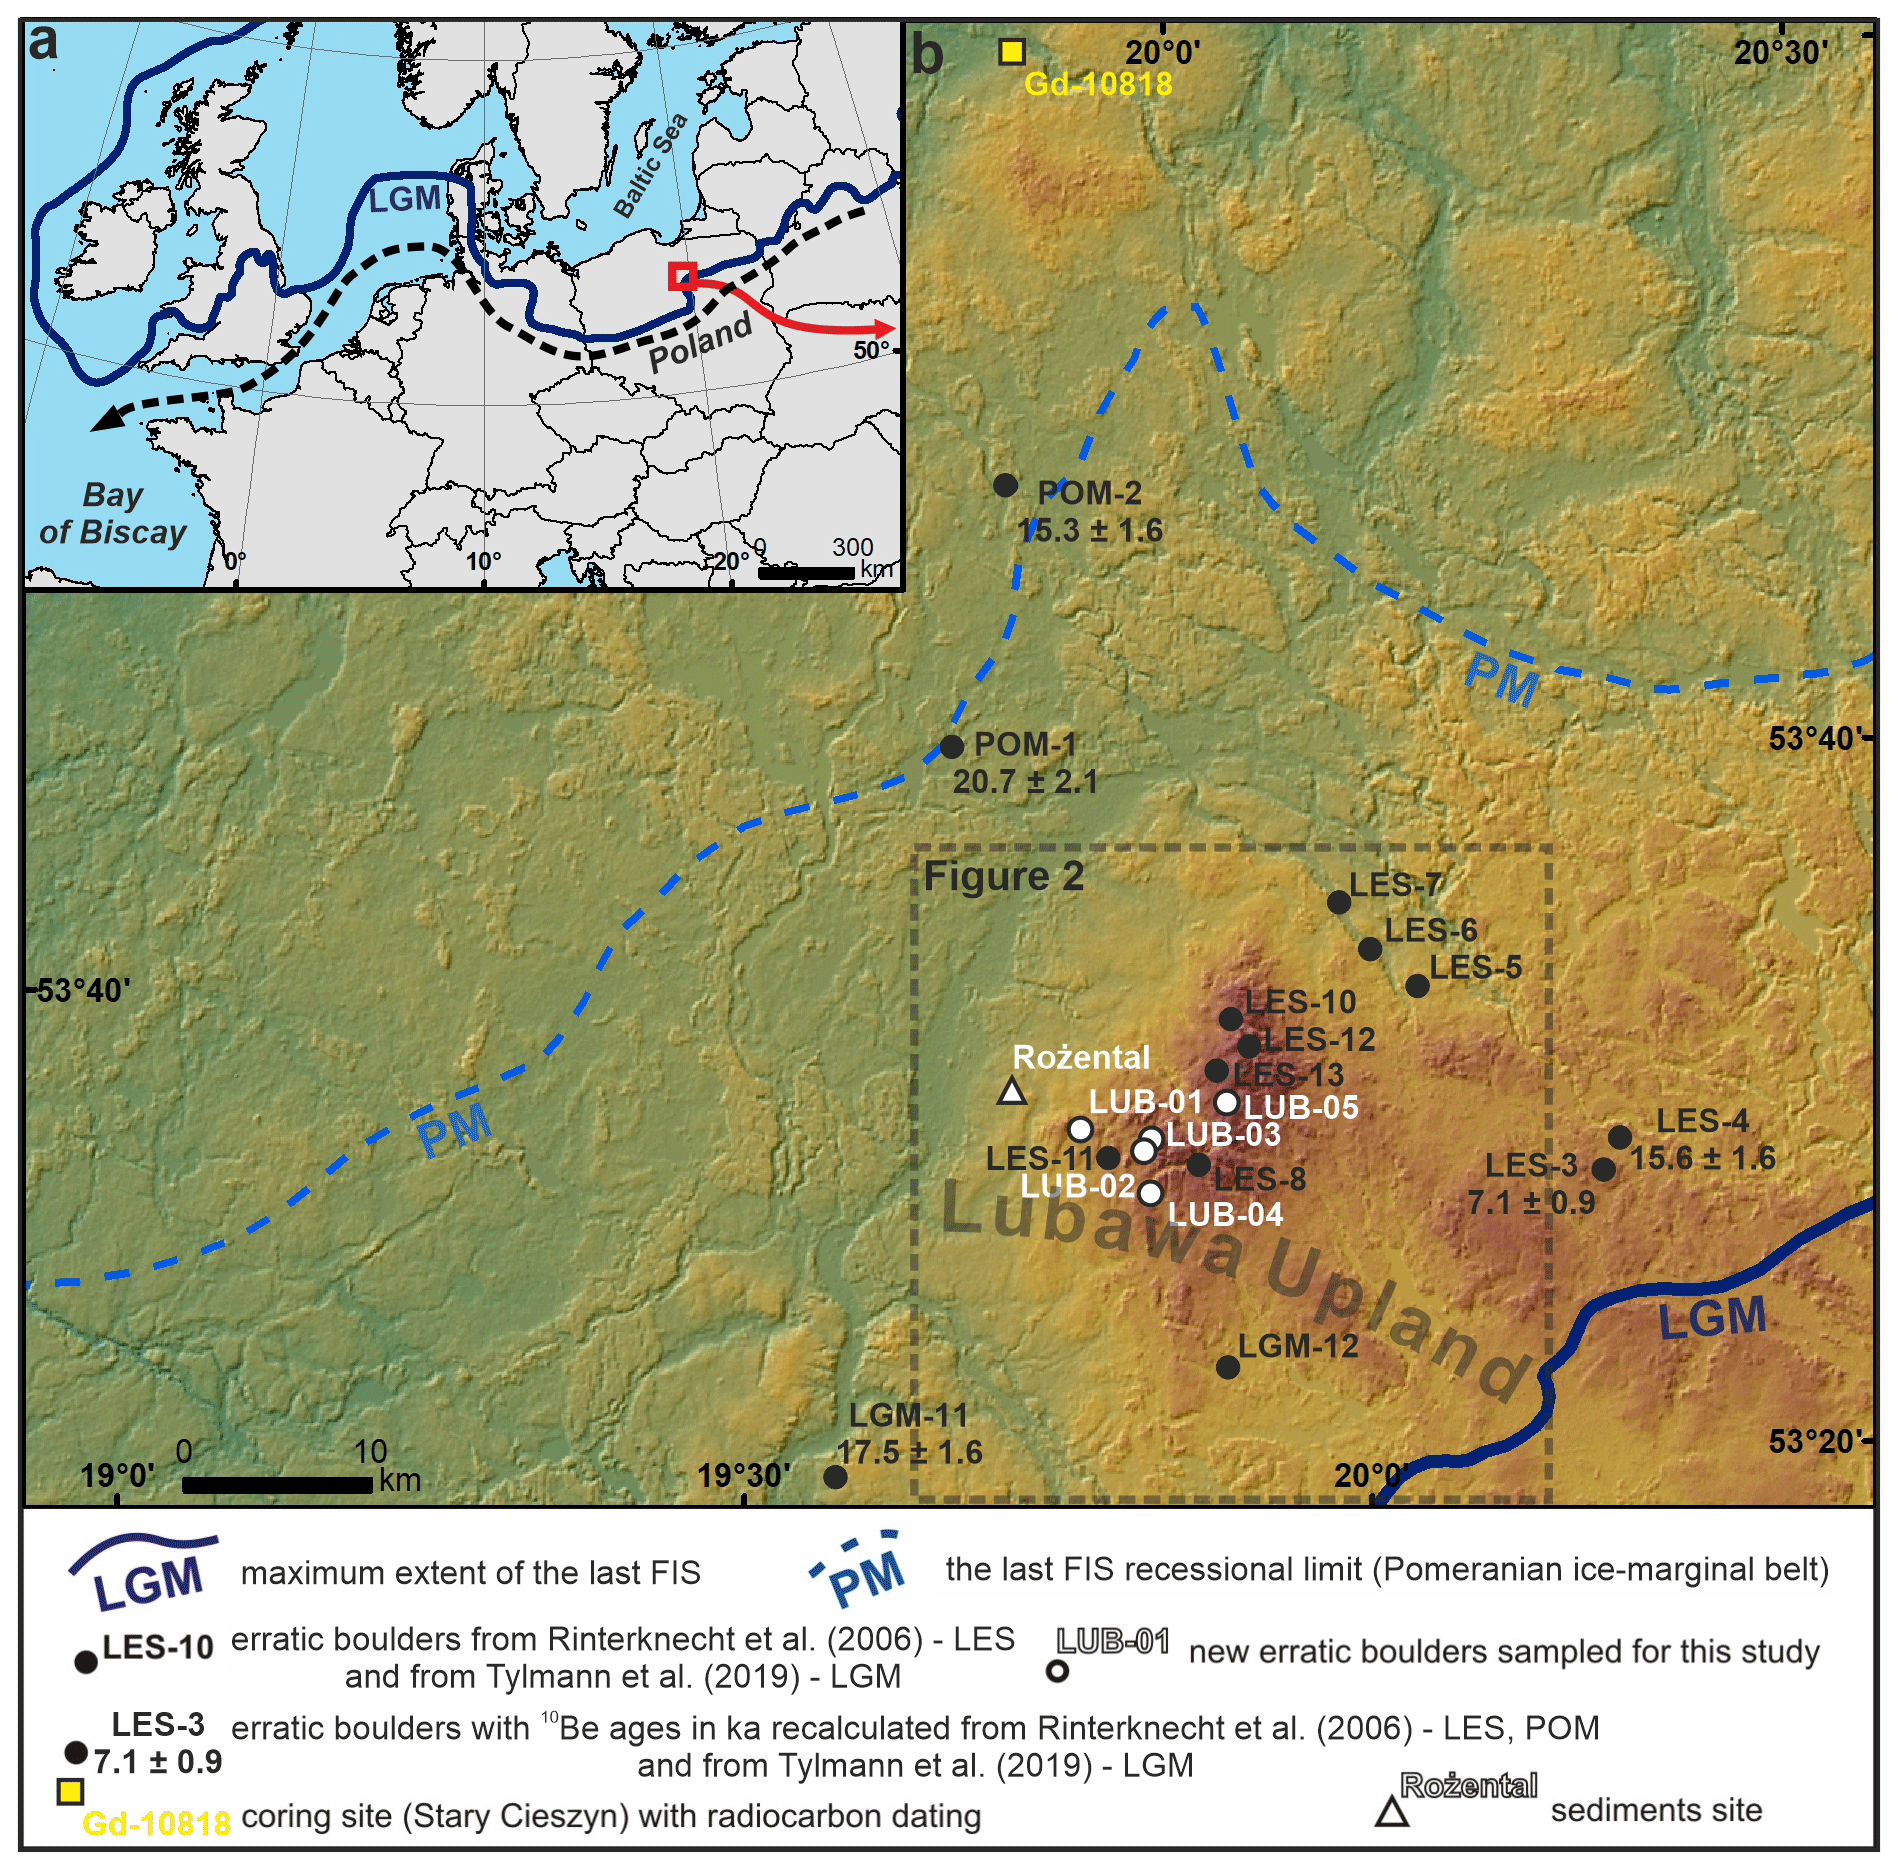
Figure 1(a) Study area against the maximum extent of the last FIS in Europe. The Channel River route during the Last Glacial Maximum (LGM) is marked with black dashed line (Toucanne et al., 2015). (b) Digital elevation model (Shuttle Radar Topography Mission – SRTM) of northern Poland with the location of the sediment site (Rożental), large erratic boulders (LES-3 – 13, LGM-11 – 12, LUB-01 – 05 and POM-1 – 2) and a coring site where radiocarbon dating has been done (Niewiarowski, 2003). Black dots with sample symbols indicate the locations of boulders in the study area, while black dots with sample symbols and re-calculated ages indicate the locations of boulders in the surroundings. The main limits of the last FIS (LGM and PM – Pomeranian Phase) according to the Geological Map of Poland 1:500 000 (Marks et al., 2006). The SRTM digital elevation model with 30 m pixel size was downloaded from https://dwtkns.com/srtm30m/ (last access: 31 January 2023).
The sediment outcrop where luminescence dating was conducted is located on the north-western slope of the Lubawa Upland within one of the moraine hillocks which occur in this area (Figs. 1b and 2b). The site is a gravel pit in Rożental, where the sequence of up to 10 m thick Pleistocene glacial deposits is exposed (Fig. 3). The origin of this sedimentary sequence was described in detail elsewhere (Tylmann and Wysota, 2011; Tylmann et al., 2014). Here, we focus on a brief description of the main sedimentary units and luminescence dating of glaciofluvial deposits and fossil periglacial sand wedges. 10Be surface exposure dating was applied to large erratic boulders resting on glacial landforms. The locations of the dated boulders are presented in Figs. 1b and 2b.
2.2 Glacial record
2.2.1 Landforms
The most characteristic elements of the glacial relief in the study area are numerous ridges of well-preserved terminal moraines and deeply incised valleys of various origins (Fig. 2a). The elevations of the terminal moraine ridge range from about 160 to above 300 m a.s.l., and the elevations of the valley floors range from 90 to about 280 m a.s.l. Terminal moraines occur mainly in the central, relatively highly elevated part of the Lubawa Upland as well as on its western and eastern slopes. On the western slope of the Lubawa Upland, most terminal moraines are oriented NE–SW, while on the eastern slope the moraine orientation is much more diversified (Fig. 2a). Most terminal moraines have a typical asymmetric morphological cross-profile.
Valley systems are also clearly visible in the topography of the Lubawa Upland, especially in its relatively highly elevated central part, and consist of three types of glacial valleys: subglacial, ice-marginal and proglacial valleys (sensu Greenwood et al., 2007). Subglacial valleys are almost entirely oriented NW–SE, and most of them are currently occupied by rivers or lakes. Some of them have undulating longitudinal profiles, and others, cutting elevated morainic areas, have convex longitudinal profiles. The spatial distribution of these valleys indicates that they are mostly perpendicular or oblique to the terminal moraine ridges (Fig. 2a). The largest landforms have complex morphology, and they may be classified as subglacial tunnel valleys, while others with simpler morphology are probably subglacial valleys (sensu Clayton et al., 1999). Ice-marginal valleys are oriented NE–SW, and they mostly occur on western and north-western slopes of the Lubawa Upland. These valleys are mostly parallel or oblique to the terminal moraine ridges, and they are perpendicular or oblique to subglacial valleys. On the western slope of the Lubawa Upland, ice-marginal valleys occur in a “step-like” morphological sequence with parallel valleys running along the slope (Fig. 2a). A few valleys which might be classified as routes of former proglacial meltwater outflow can be found on the southern and south-eastern slopes of the highest-elevation central part of the Lubawa Upland (Fig. 2a). Proglacial valleys are oriented N–S and NW–SE, and they run downslope towards outwash plains which occur in the southern and south-eastern parts of the study area.
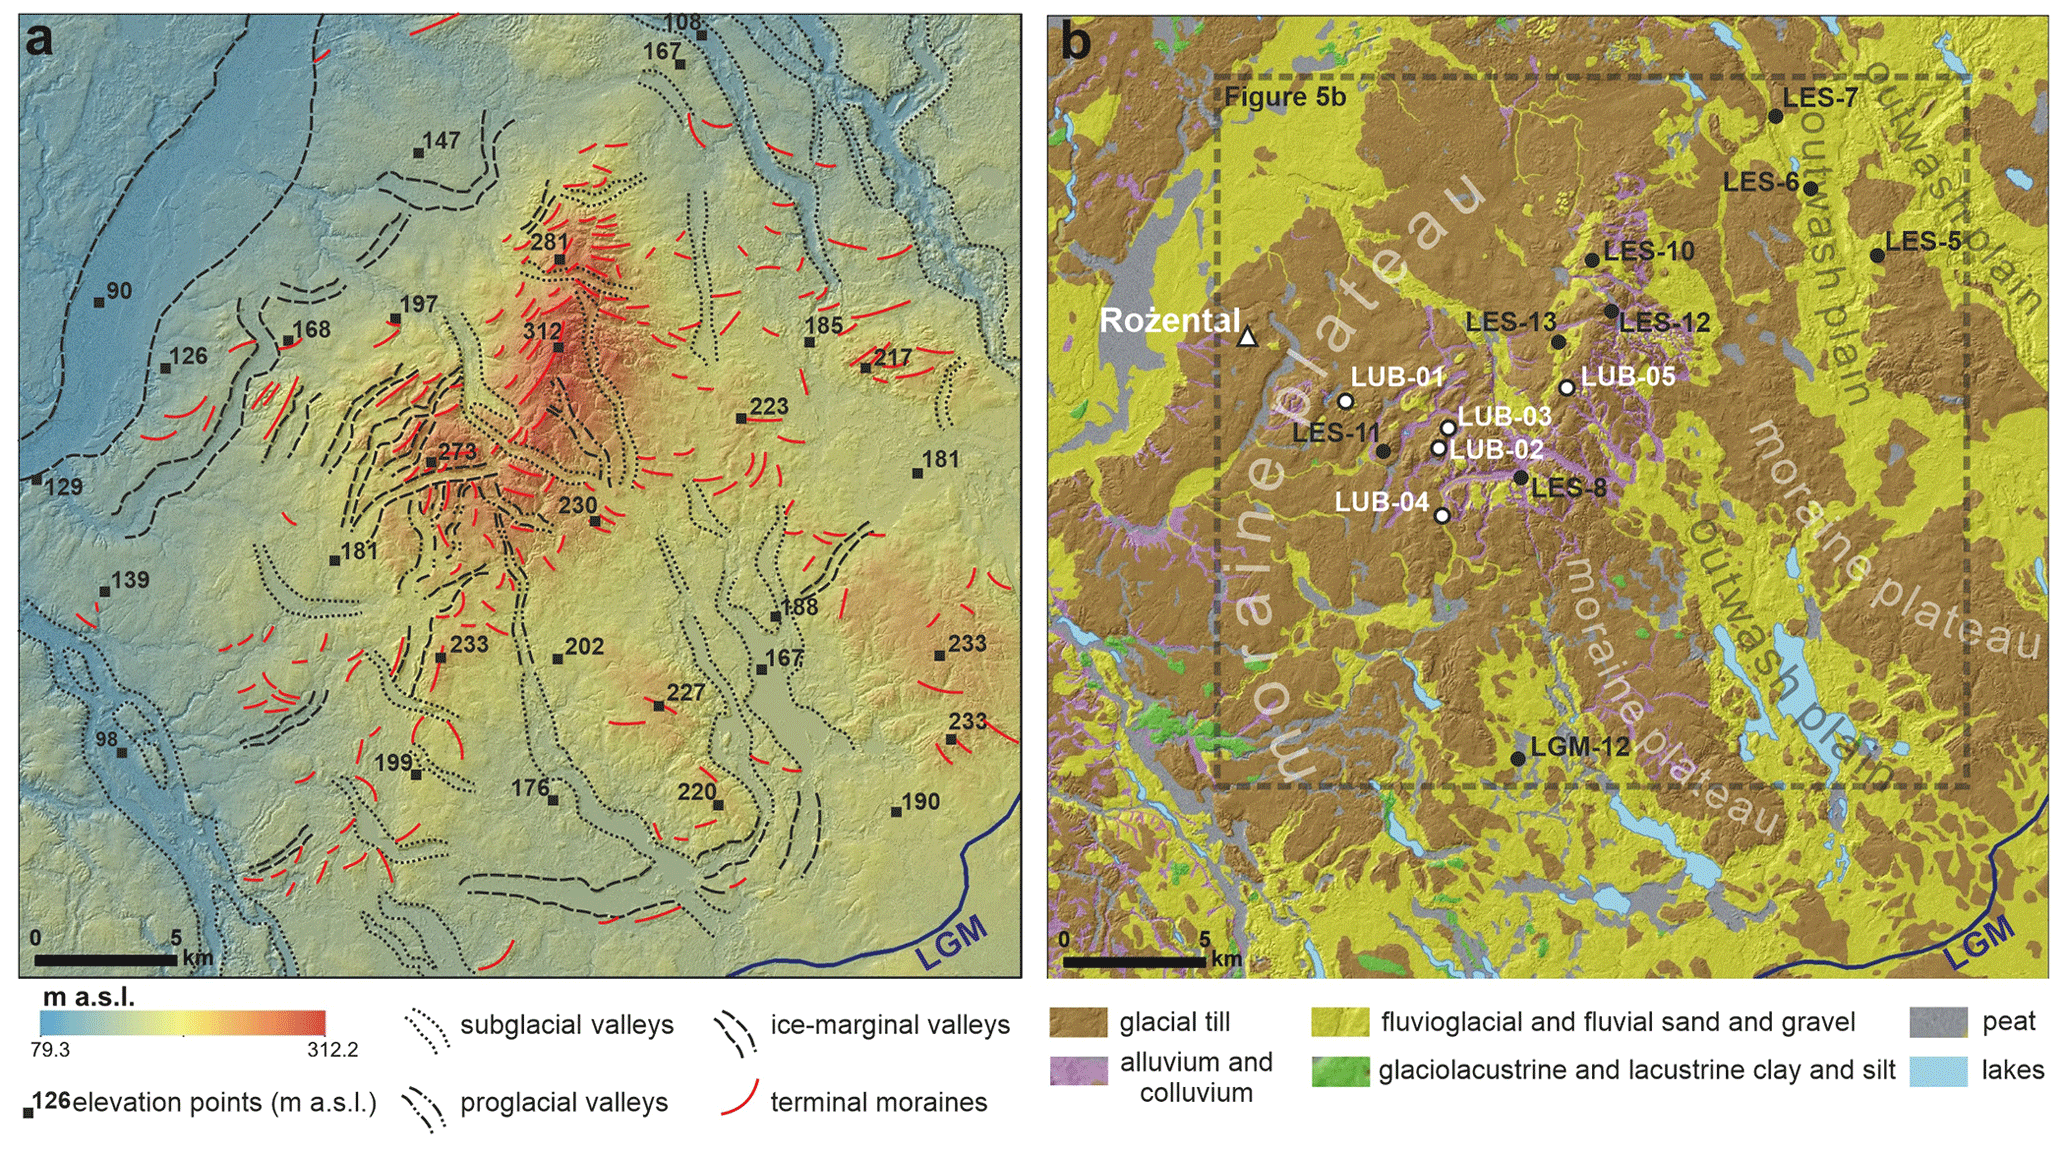
Figure 2(a) High-resolution (1 m) digital elevation model (lidar) of the study area with the main glacial landforms. Lidar data come from the resources of the Head Office of Geodesy and Cartography in Poland freely available at https://www.geoportal.gov.pl/ (last access: 21 November 2022). (b) Surface sediments of the study area draped over the digital terrain model. The distribution of surface sediments was compiled based on the detailed Geological Map of Poland (Gałązka and Marks, 1997; Gałązka, 2003, 2006, 2009; Wełniak, 2002). The main moraine plateaux and outwash plains are indicated as well as the locations of the Rożental site and sampled erratic boulders.
2.2.2 Sediments
Glacial till and fluvioglacial or fluvial sand and gravel dominate the surface lithology of the Lubawa Upland. Till and related deposits (unsorted “dirty” gravels with boulders) are associated with moraine plateaux and terminal moraines and occur mainly in the south-western, western and north-western sectors, in the elevated central sector as well as in the south-eastern and eastern sectors of the study area. Fluvioglacial sand and gravel are associated with outwash plains, which occur mostly on the southern, south-eastern and eastern slopes of the Lubawa Upland as well as in association with terraces within wide ice-marginal valleys found in the north-western sector of the study area and with large subglacial valleys (Fig. 2b). Outwash plains in the south-eastern and eastern parts of the study area are usually narrow, elongated tracks of glacial meltwater runoff located in between the higher moraine uplands and oriented NW–SE. Besides glacial till and fluvioglacial or fluvial sand and gravel, glaciolacustrine and lacustrine silt and clay also occur, mainly as a few isolated patches in the south-western and southern parts of the region. The spatial distribution of most surface sediments is a result of the last FIS dynamics in the Lubawa Upland and the process of its deglaciation (Tylmann, 2014). This region is rich in massive (perimeter ≥1 m) erratic boulders and extensive boulder fields located on the moraine plateau, on moraine hillocks or within glacial valleys. The largest of them were the subject of 10Be dating (this study; Rinterknecht et al., 2005, 2006; Tylmann et al., 2019) (Figs. 1b and 2b). Fluvial sand and gravel are associated with river channels, while valleys and lake basins are filled with Late Glacial and Holocene peat as well as alluvium and colluvium (Fig. 2b).
The sequence of Pleistocene glacial deposits exposed at the gravel pit in Rożental consists of fluvioglacial sand and gravel covered by glacial till layers (Fig. 3a). The fluvioglacial unit (Rz1) is dominated by medium- to large-scale sandy–gravelly and gravelly–sandy beds with horizontal stratification. Most of these beds show normal grading, and contacts between particular lithofacies are erosional. Occasionally, sand beds and lithofacies with through-cross bedding also occur. Within sandy and sandy–gravelly beds, oversized clasts are very common. Fluvioglacial unit Rz1 is covered by a 2.5 m thick massive till (unit Rz2) with fossil periglacial structures (sand wedges) occurring in two separate horizons – K1 and K2 (Fig. 3b). This indicates that unit Rz2 consists of three separate till subunits: Rz2a, Rz2b and Rz2c. Distinct features of tills such as (1) sharp planar contact with underlying deposits (Fig. 3c), (2) embedded clasts with flat upper-surface and ploughing marks (Fig. 3d) and (3) glacial striations on clast surfaces (Fig. 3e) indicate that these are subglacial traction tills – a lithostratigraphic record of at least three ice re-advances and retreats post-dating sedimentation of fluvioglacial unit Rz1 (Fig. 3b; Tylmann, 2014; Tylmann et al., 2014).
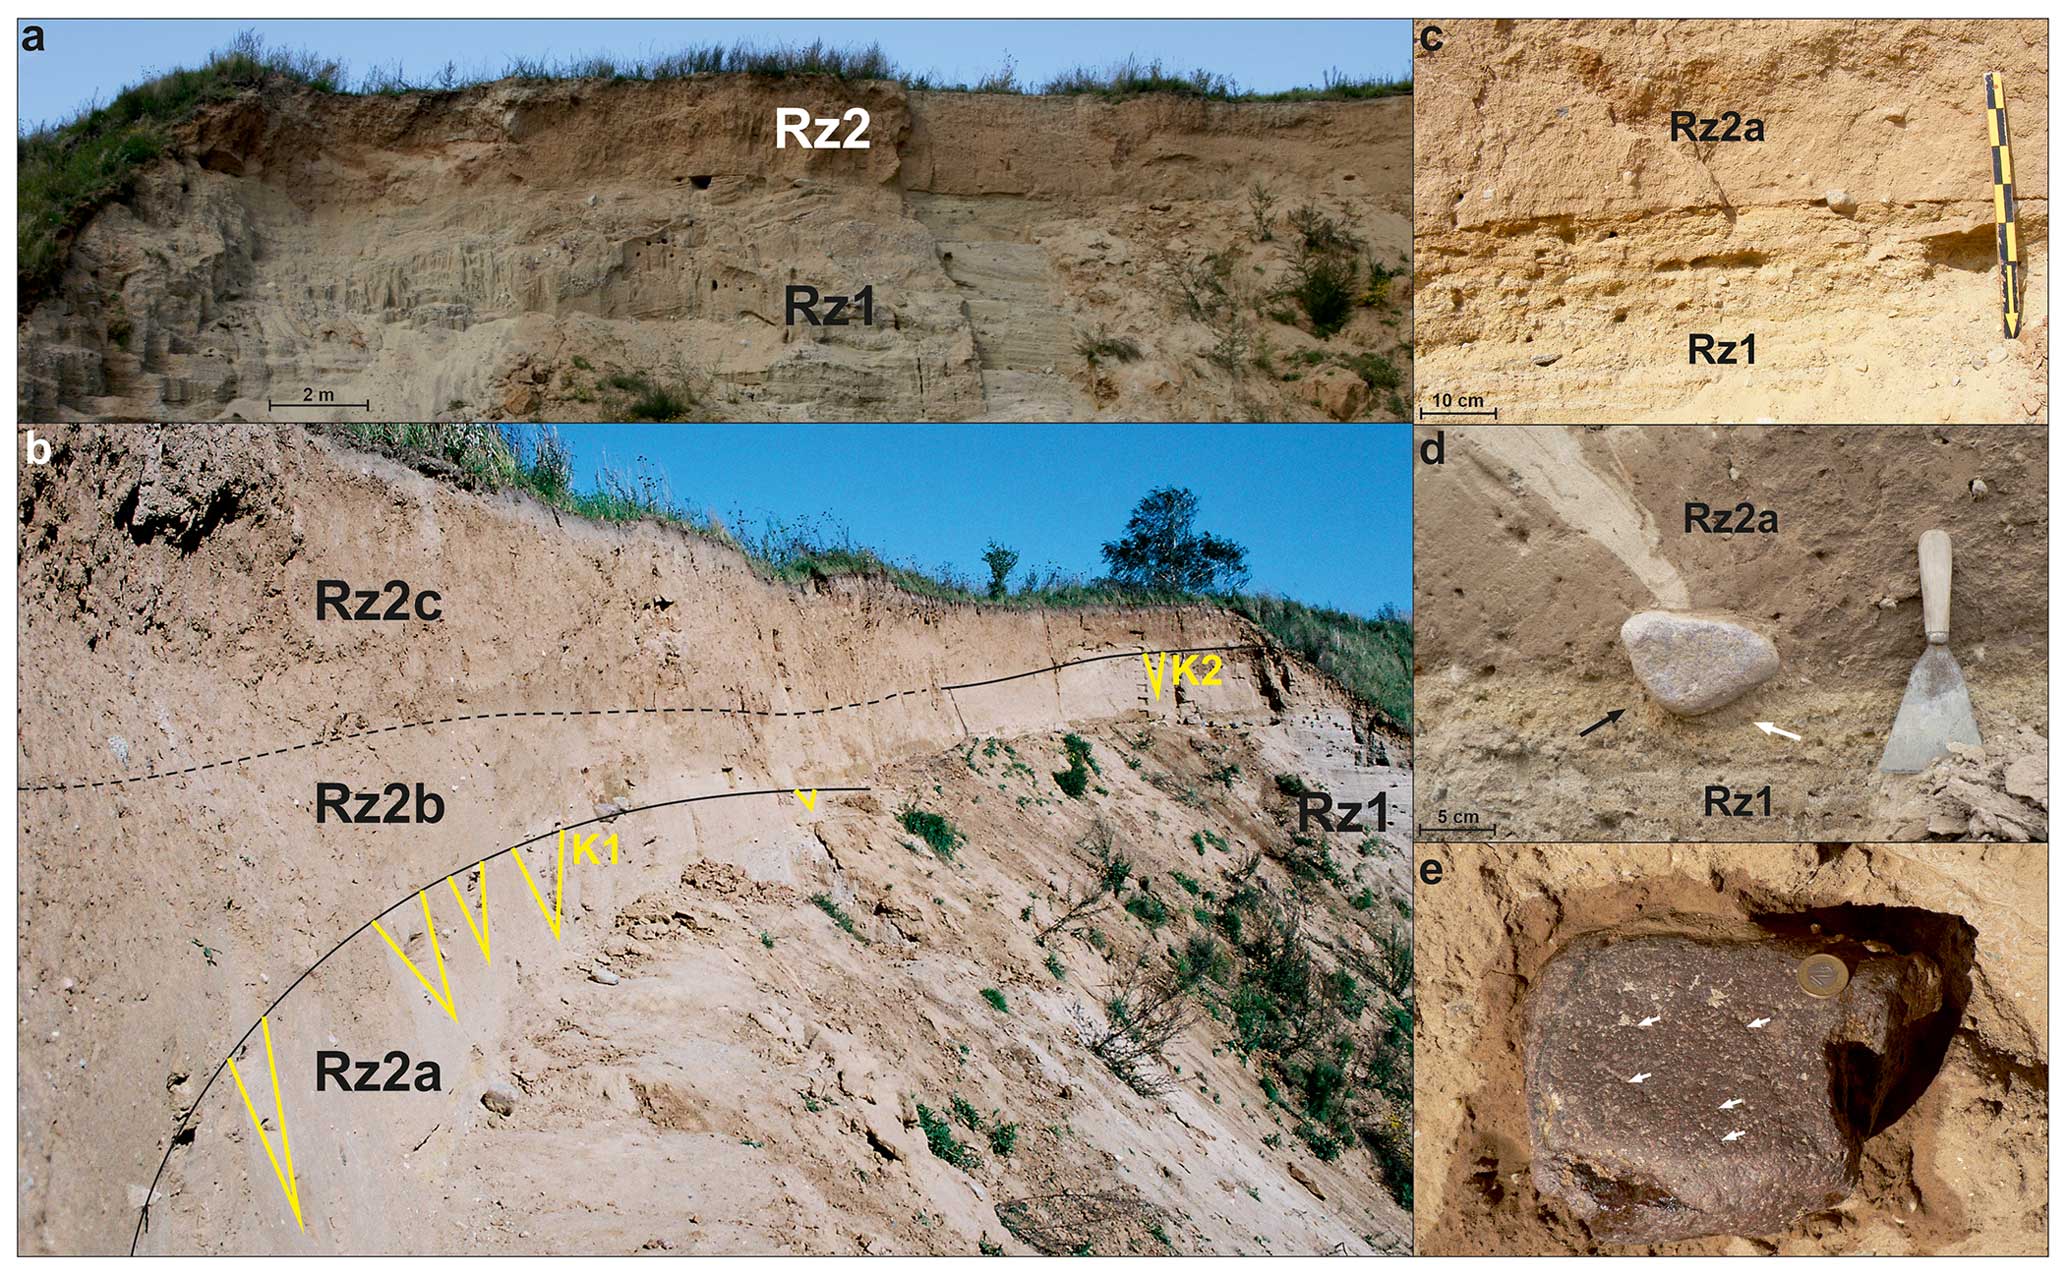
Figure 3Sequence of the Pleistocene deposits exposed at the Rożental site. (a) Panoramic picture of the sequence with two main lithostratigraphic units indicated: fluvioglacial sand and gravel (unit Rz1) and basal till (unit Rz2). (b) Upper part of the sequence with periglacial horizons K1 and K2 (yellow wedges) and till subunits Rz2a, Rz2b and Rz2c. (c) Sharp, planar contact between units Rz1 and Rz2a. (d) Clast with a flattened upper surface embedded at the contact between units Rz1 and Rz2a. A ploughing mark (black arrow) and a diamictic injection (white arrow) are visible below the clast. (e) Flattened upper surface of the clast embedded at the bottom of unit Rz2b; glacial striations are marked with white arrows.
3.1 Luminescence dating and Bayesian analysis
Samples for OSL dating were taken from sandy beds of fluvioglacial unit Rz1 (three samples) and from aeolian sand filling fossil periglacial wedges of horizons K1 and K2 (eight samples). Sediments were sampled with plastic tubes pressed into the vertical section of deposits and secured with black PVC tape in order to protect samples from sunlight (Fig. 4a). Samples were analysed at the Gliwice Luminescence Laboratory (Moska et al., 2021), and only material taken from the middle parts of the plastic tubes was processed. For OSL measurements, grains of quartz (45–63 µm) were extracted from the sediments by routine treatment with 20 % hydrochloric acid (HCl) and 20 % hydrogen peroxide (H2O2) to remove carbonates and organic matter formed in the samples. The final step of preparation was a treatment with concentrated (40 %) hydrofluoric acid (HF) for 40 min to remove all other non-quartz minerals and the outer layer of the quartz grains (∼10 µm, responsible for absorbing the alpha radiation; Aitken, 1985). All OSL measurements were performed using an automated Daybreak 2200 TL/OSL reader (Bortolot, 2000) fitted with a calibrated 90Sr/90Y beta source delivering about 2.7 Gy min−1 to grains at sample positions. Daybreak 2200 uses blue diodes (470±4 nm) delivering about 60 mW cm−2 at the sample position after passing through BG39 filters. Equivalent doses were determined using the single-aliquot regenerative-dose (SAR) protocol (Murray and Wintle, 2000). The SAR dose response curves were best represented by a single-saturating exponential function. Final equivalent-dose (De) values were calculated using the Minimum Age Model (MAM) or the Central Age Model (CAM) (Galbraith et al., 1999). To determine the most adequate statistical model for equivalent-dose calculation, the overdispersion parameter (σOD) was calculated using the R package Luminescence (Kreutzer et al., 2012). We applied the CAM in calculations when σOD was below 20 %, while the MAM was applied when σOD did not meet this criterion. In order to assess the dose rates (Dr) that arise from decay chains of potassium, we used high-resolution Canberra gamma spectrometry, calibrated with IAEA-RGU-1, IAEARGTh-1, and IAEA-RGK-1 obtained from International Atomic Energy Agency reference materials. The dry dose rates (Guerin et al., 2011) were adjusted for water content following Aitken (1985). The cosmic-ray dose rate to the site follows the calculations suggested by Prescott and Stephan (1982). The calculated OSL ages are reported (ka) with 1σ uncertainties in the Appendices (Table A1) as well as values of measured equivalent doses for individual aliquots in each sample (Table A2).
OSL ages were analysed with the Bayesian approach to modelling the chronology of the sediment sequence, which uses the lithostratigraphic record and the numerical ages of the sediments. The prior model consists of the sequence of sediment units arranged in stratigraphic order and inferred from lithostratigraphy. Numerical dating controls (OSL age probability distributions) constrain the possible time of sediment deposition. In Bayesian analysis, they represent the likelihood that any one sample has a particular age. Bayesian age modelling was performed using Sequence algorithms in OxCal (Bronk Ramsey, 2009a) ver. 4.4. The algorithms use Markov chain Monte Carlo (MCMC) sampling to build a distribution of possible solutions and to generate a probability called the posterior density estimate for each sample. It is a combination of both the prior model and the likelihood probability. These density estimates take into account the lithostratigraphic order (prior) and typically reduce the uncertainty range in comparison to likelihood probabilities. The Sequence model in OxCal was divided into a series of Phases, each representing the stages of sediment deposition which may be correlated with particular dating controls. Thus, each Phase consists of a group of dating controls and is separated by Boundary commands, which delimit the duration of each Phase and generate an age posterior density estimate. Moreover, we used the Before (terminus ante quem) command to constrain the chronology when stages evidently pre-dated a particular event. The whole Sequence is constrained by the Boundary commands, which delimit the start and end of the model. The Sequence begins with the Boundary “Start” command and the Phase “MIS 6”, which consists of three OSL ages of the Rz1 fluvioglacial sediments. Then, the “Rz2a till” command was introduced with a Boundary command, and subsequently the Phase “I periglacial phase”, consisting of a group of five OSL dating controls from aeolian sand filling fossil periglacial wedges of horizon K1, was defined. The next stage is the Boundary command “Rz2b till”, and above that the Phase “II periglacial phase”, consisting of three OSL dating controls from aeolian sand filling fossil periglacial wedges of horizon K2, was introduced. The uppermost till layer was defined with the Boundary command “Rz2c till”, and the constraint was that it had to pre-date (Before) the radiocarbon age of sample Gd-10818 (16 190±330 cal yr BP – calibrated with the IntCal20 curve in OxCal ver. 4.4) of organic deposits at the Stary Cieszyn coring site, because these deposits were very likely formed after deglaciation (Niewiarowski, 2003). The Sequence is closed with the Boundary “End” command. The notation of the commands used to process the algorithms is available in the Appendices (Table A3).
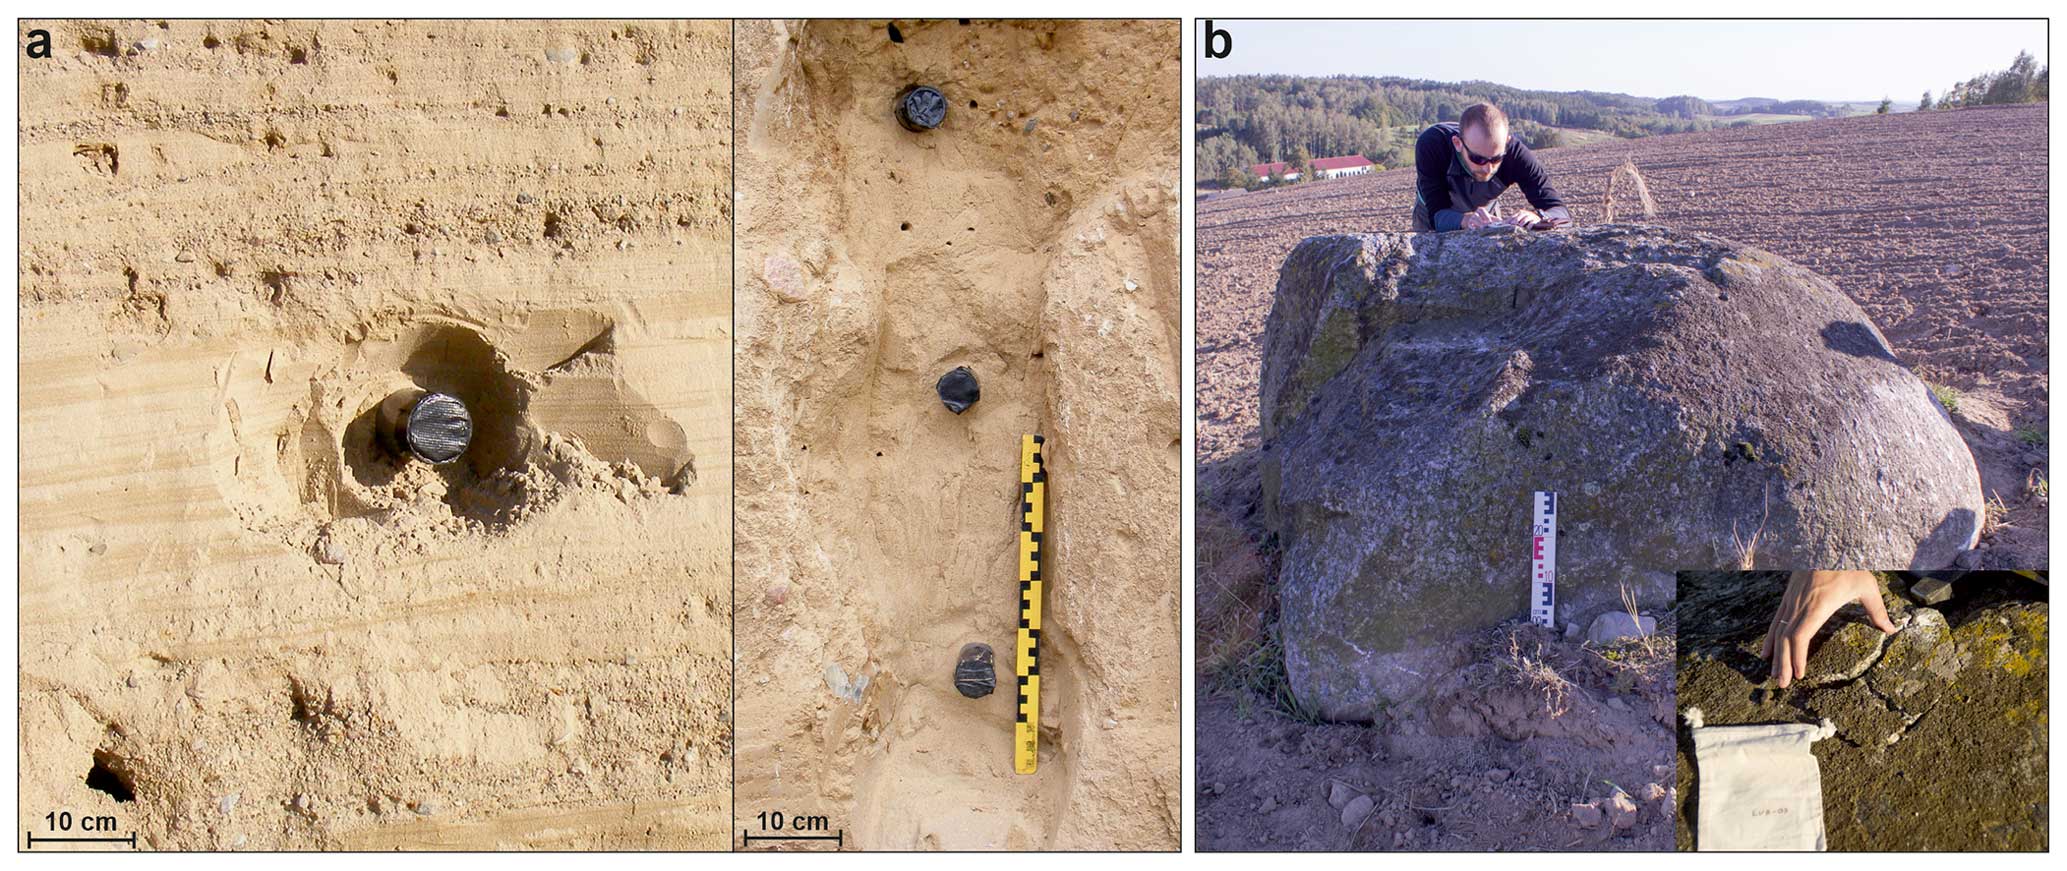
Figure 4(a) Sampling for OSL dating in the Rz1 unit (left picture) and the K2 periglacial wedge (right picture). Sandy deposits were sampled with plastic tubes protected with black PVC tape. (b) Sampling for 10Be surface exposure dating. The upper surface of the erratic boulder was sampled with a hammer and chisel.
3.2 10Be surface exposure dating
Samples for 10Be surface exposure dating were collected from massive (perimeter ≥1 m) and intact boulders resting on glacial landforms. Sampled boulders are large and stable (embedded in the ground) granitic rocks protruding above the ground surface (Fig. 4b). We selected the biggest erratic boulders which are available in the study area. Eleven out of 14 boulders are located on moraine surfaces, while 3 boulders are located in subglacial and proglacial valleys (Table A4 in the Appendices). We preferred the exposed position of boulders on moraine plateau and/or terminal moraines as the best location for the surface exposure dating. A detailed geomorphological position of each boulder is presented in Fig. A1 in the Appendices. Samples were taken with a manual jackhammer or with a hammer and chisel from the upper surface of the boulders. All the boulders are characterized by quartz-rich lithologies such as granitoids, granite gneisses and gneisses, and 150–200 g of material per sample was enough for further preparation.
3.2.1 New samples
The first stages of LUB sample (n=5) preparation were conducted at the laboratory of the University of Gdańsk, Poland. Samples were crushed and sieved; the 0.25–0.71 mm quartz fraction was separated by heavy-liquid (SPT) separation (to remove heavy minerals) and froth flotation (to remove feldspars). Several acid leachings (2 % HF + HNO3) in a hot ultrasonic bath were applied in order to purify the quartz. The quartz purity was checked by ICP-OES analysis for Al content. The next stages of preparation were conducted at the CALM laboratory (Cosmonucléides Au Laboratoire de Meudon) at the Laboratoire de Géographie Physique (LGP), France. Purified quartz was spiked systematically with ∼460 mg of a commercial 9Be carrier solution (concentration of 998 mg L mg L−1) and then dissolved with concentrated HF. Beryllium was separated from the remaining metals and purified in three stages: (1) an anion column to remove Fe(III); (2) a cation column to remove Ti, alkalis and separate Be from Al; and (3) hydroxide precipitation to remove residual alkalis, Mg and Ca. Samples were then dried, oxidized and mixed with niobium powder before being pressed in cathodes for AMS measurements. The ratios were measured by accelerator mass spectrometry (AMS) at the French national AMS facility ASTER, Aix-en-Provence (Arnold et al., 2010). The measured ratios were normalized relative to the in-house standard STD-11 using an assigned ratio of (1.191±0.013) (Braucher et al., 2015) and a 10Be half-life of (1.387±0.012) years (Chmeleff et al., 2010; Korschinek et al., 2010). Analytical 1σ uncertainties include uncertainties in AMS counting statistics, uncertainty in the standard , an external AMS error of 0.5 % (Arnold et al., 2010) and a chemical blank measurement.
10Be ages were calculated using the most recent global production rate (Borchers et al., 2016) and the time-dependent scaling scheme for spallation according to Lal (1991) and Stone (2000) (the “Lm” scaling scheme). We used the 10Be production rate from Borchers et al. (2016) as the most recent global production rate, because we do not have any regionally calibrated 10Be production rate in Poland or in the vicinity of Poland. However, because the production rate for a specific cosmogenic nuclide is a critical and very important parameter in surface exposure dating, we also calculated ages according to the primary and secondary production rate calibration data sets from Borchers et al. (2016) and, according to the Scandinavian reference 10Be production rate of Stroeven et al. (2015), in order to check the differences. We corrected the 10Be production rate for sample thickness according to an exponential function (Lal, 1991) and assuming an average density of 2.7 g cm−3 for granitoid, granite gneiss and gneiss. An appropriate correction for self-shielding (boulder geometry) was applied when the surface of the sampled boulder had a slope of more than 10°. No correction for surface erosion of boulders was applied, as we interpret the 10Be results as minimum ages. All the calculations were performed using the online exposure age calculator formerly known as the CRONUS-Earth online exposure age calculator version 3 (http://hess.ess.washington.edu/math/; last access: 10 May 2023.), which is an updated version of the online calculator described by Balco et al. (2008). Ages are reported with 1σ uncertainties (including analytical uncertainties and the production rate uncertainty) in Tables A4 and A5 in the Appendices.
3.2.2 Recalculated samples
We recalculated 10Be ages already published for the study area (n=9) based on data available in Rinterknecht et al. (2005, 2006) and Tylmann et al. (2019). We followed the same procedure of exposure age calculations as described in the above section. Recalculated 10Be exposure ages are also reported with 1σ uncertainties (including analytical uncertainties and the production rate uncertainty) in Tables A4 and A5 (see the Appendices).
4.1 OSL ages
Three OSL samples from unit Rz1 reveal various distributions of equivalent doses measured for individual aliquots. Sample GdTL-1351 has the most clustered, unimodal distribution with σOD =12 %. Samples GdTL-1352 and GdTL-1353 have bimodal and trimodal distributions respectively, with σOD parameters over 20 % (Fig. 5a). For all three samples the MAM was applied to calculate the De value, as the Rz1 unit consists of poorly sorted fluvioglacial sediments which may contain populations of partially bleached grains. This is especially visible in the aliquot distributions of samples GdTL-1352 and GdTL-1353. Given the OSL ages calculated for Rz1 sediments 148.9±7.2 (GdTL-1351), 143.9±9.1 (GdTL-1352) and 126.8±11.0 ka (GdTL-1353), deposition of the Rz1 unit during the cold Marine Isotope Stage (MIS) 6 is the most likely one.
Deposits filling two fossil periglacial wedges of horizon K1 were sampled for OSL dating. Two samples (Gd-TL-1349 and GdTL-1350) were taken from one wedge, and three samples (GdTL-1879, GdTL-1880 and GdTL-1881) were taken from another one (Fig. 5a). Distributions of equivalent doses measured for individual aliquots in these samples are well clustered with σOD parameters below 20 % (from 5 % to 16 %). Unimodal distributions dominate, and only one sample (GdTL-1350) shows a bimodal probability curve. De values were determined with the CAM, and OSL ages calculated for aeolian sand-filling K1 wedges are 18.7±1.0 (GdTL-1349), 14.5±0.8 (GdTL-1350), 19.1±0.9 (GdTL-1879), 18.2±0.8 (GdTL-1880) and 17.4±0.9 ka (GdTL-1881). Therefore, the most likely timing of sand deposition within K1 periglacial wedges is around 20–17 ka, and it may be correlated with MIS 2. The whole succession of the sedimentary units (Fig. 3b) shows clearly that periglacial wedges of horizon K1 must have been formed after deposition of the Rz2a till and before deposition of the Rz2b till.
Three OSL samples were taken from the fossil periglacial sand wedge K2 (GdTL-1346, GdTL-1347 and GdTL-1348). Distributions of equivalent doses measured for individual aliquots in these samples are also well clustered and unimodal, with the σOD parameter from 9 % to 11 % (Fig. 5a). De values were determined with the CAM, and OSL ages calculated for the aeolian sand filling K2 wedge are 18.5±0.9 (GdTL-1346), 16.4±0.8 (GdTL-1347) and 17.3±0.8 ka (GdTL-1348). The most likely timing of sand deposition is around 19–16 ka, and it may be correlated with MIS 2. Periglacial wedge K1 must have been formed after deposition of the Rz2b till and before deposition of the Rz2c till.
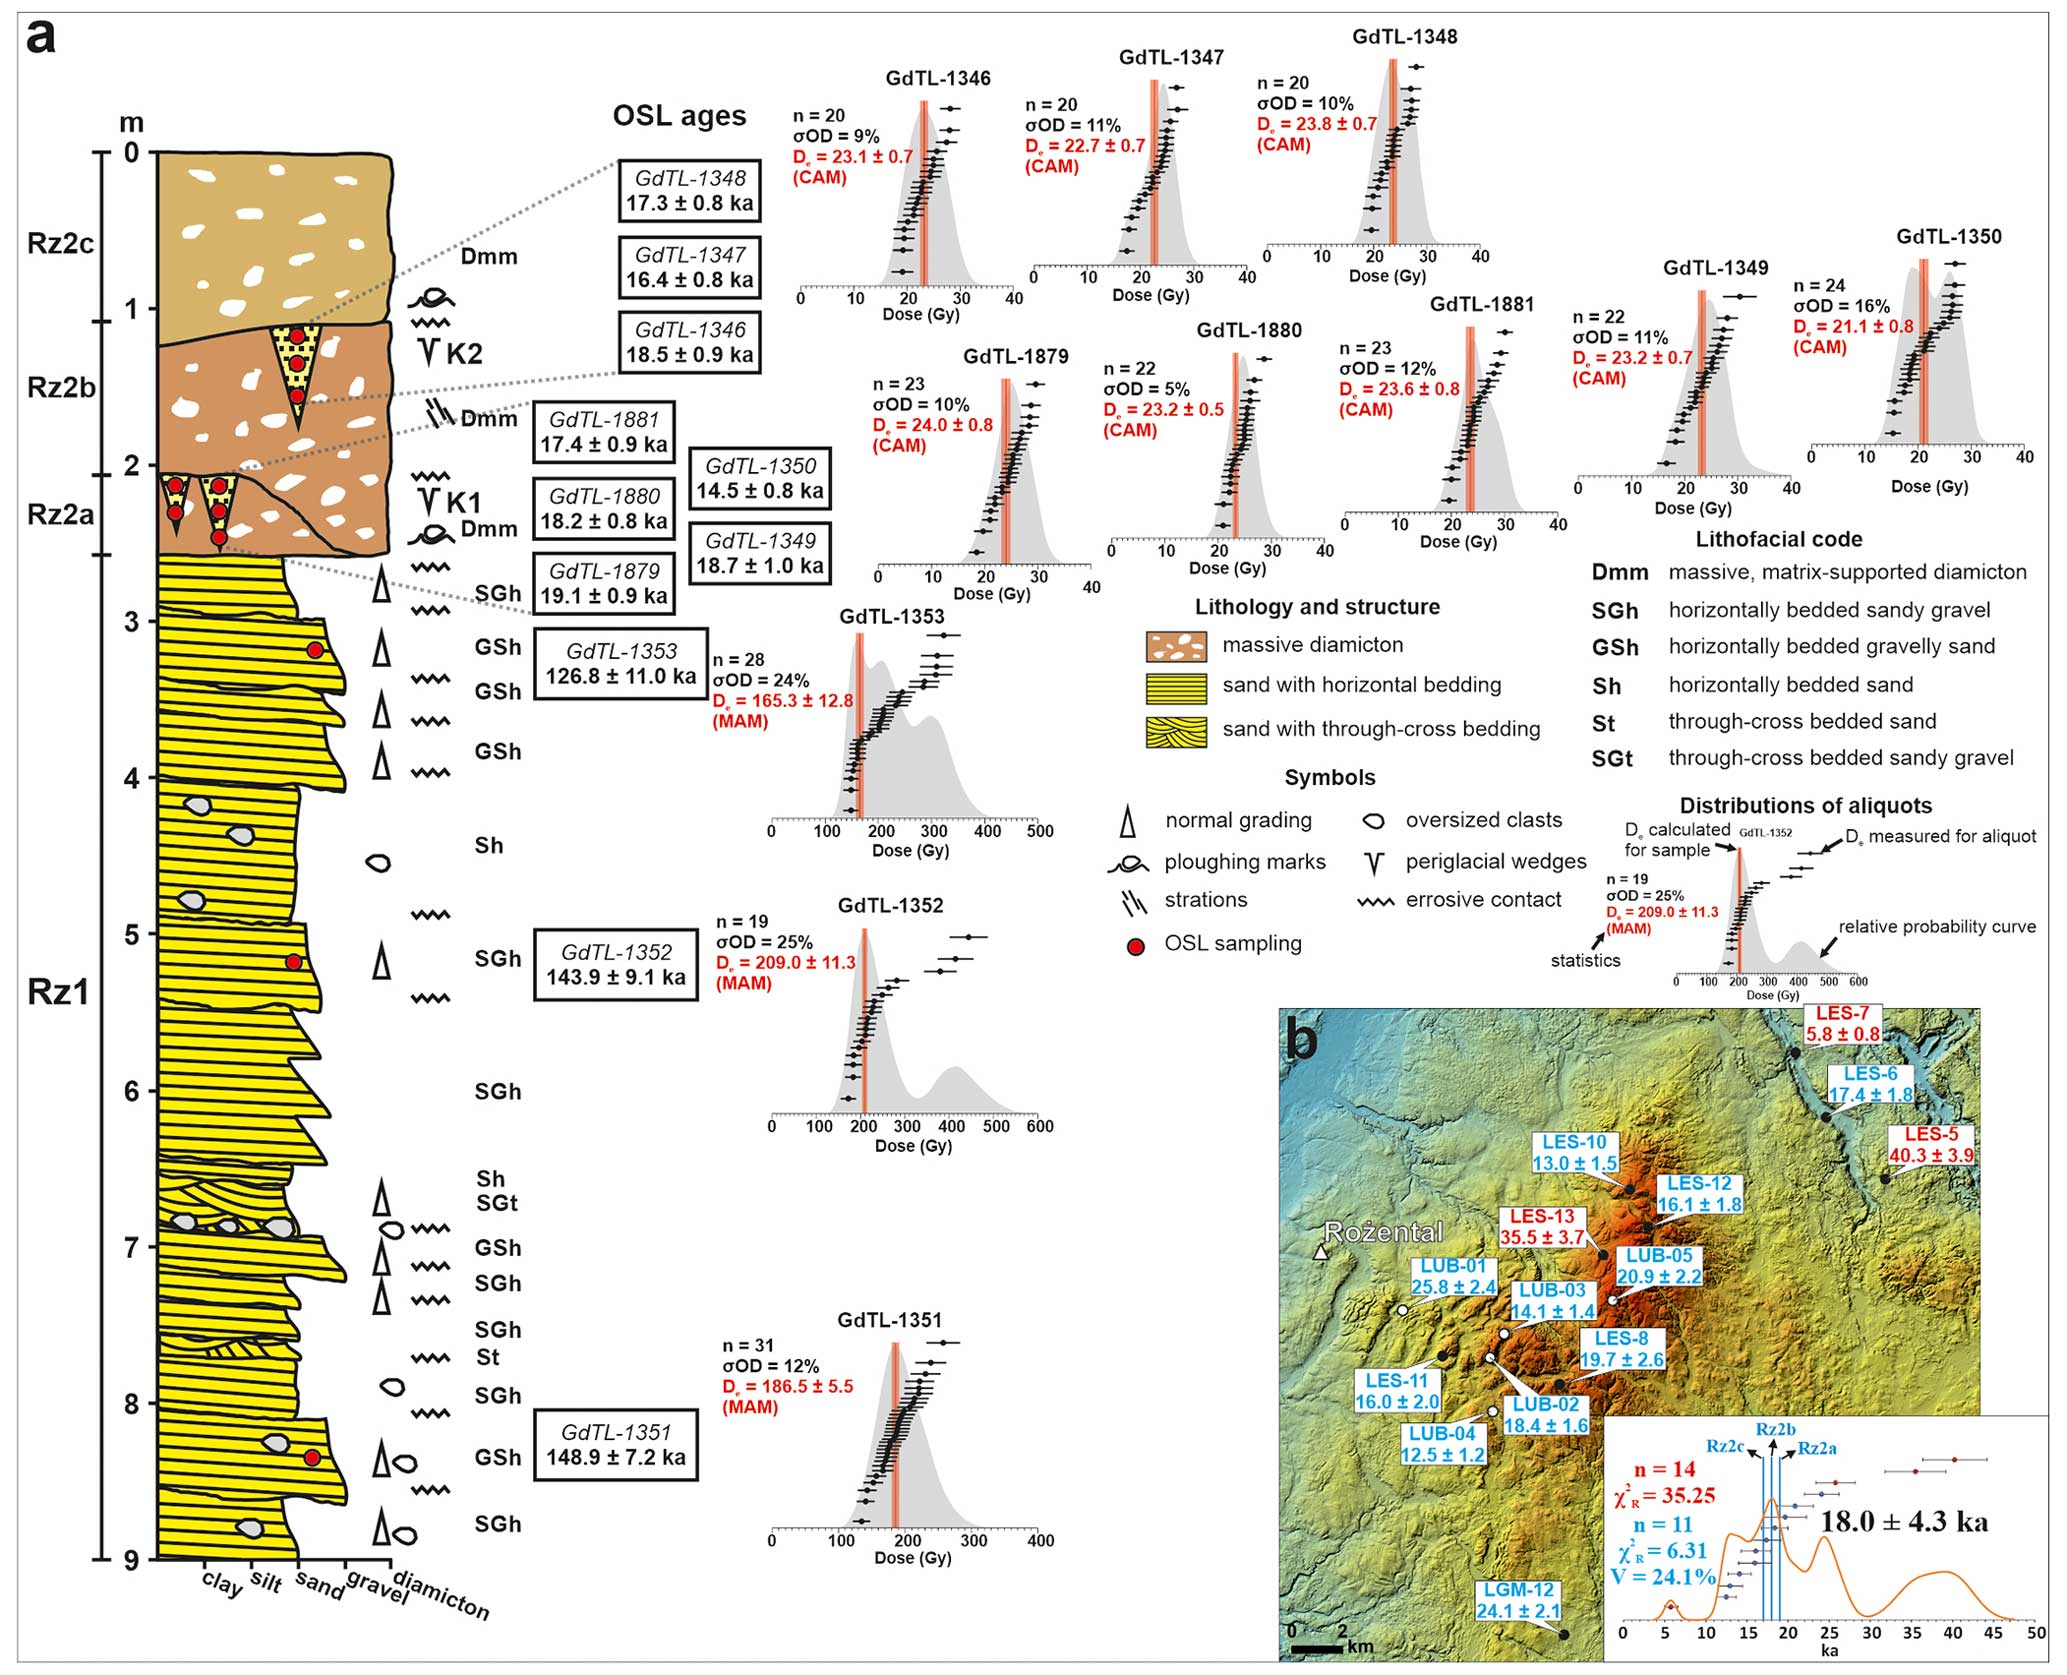
Figure 5(a) Sediment profile of the entire exposed sequence with sedimentary features, OSL ages and distributions of equivalent doses measured for individual aliquots. (b) Spatial distribution of sampled boulders with 10Be ages. New samples are indicated with white dots, while recalculated samples are indicated with dark dots. Ages identified as outliers are marked in red, and accepted ages are marked in blue. All ages are given in kiloannum. The digital elevation model with 1 m pixel size is based on lidar data from the resources of the Head Office of Geodesy and Cartography in Poland freely available at https://www.geoportal.gov.pl/ (last access: 21 November 2022). The inset graph shows the distribution of 10Be ages with a kernel density estimate curve and statistics before (red) and after (blue) excluding outliers. Bayesian ages of till layers Rz2a, Rz2b and Rz2c are also marked (blue lines) for comparison with 10Be ages.
4.2 Bayesian modelling
The run of the Sequence model was conducted in the Outlier mode, which assumes that outliers are distributed according to a Student's T distribution with 5 degrees of freedom; the scale is allowed to lie anywhere between 100 and 104 years (Bronk Ramsey, 2009b). In the initial model, the dating controls were all entered with a prior probability of 0.05 of being an outlier. Ages having an agreement index with the initial model <60 % and exceeding the 0.05 threshold of probability of being outliers in the initial model results were down-weighted by being assigned an adequate higher prior probability of being outliers. Then, a re-run of the same Sequence model was conducted for the chronological sequence with down-weighted ages. Finally, the agreement index for the re-run model (Amodel) was used to evaluate the reliability of the chronological sequences obtained (Chiverrell et al., 2013). Both input ages and modelled ages were reported with 1σ uncertainty (68.2 % probability).
The initial model based on the assumed sequence of events and all dating controls shows a rather poor agreement index (41.3%), which suggests that the results of the initial Sequence are not reliable and that problematic ages must occur among the dating controls. We identified an outlier with the individual agreement index <10 %. One OSL age belonging to the Phase “I periglacial phase” (sample GdTL-1350) shows a low agreement index of 4.6 %, and the probability of being an outlier is estimated at 85% by the model. The age of this sample is 14.5±0.8 ka, and it is most probably too young for the periglacial horizon K1. Thus, it was down-weighted by being assigned a prior probability of 0.85 of being an outlier in the re-run model, which shows a much better agreement index (103.4 %). The individual agreement index for the modelled ages ranges between 75.2 % and 128.2 %, which means that the model is consistent and reliable. The modelled age distribution for the Rz2a till is 19.2±1.1 ka, for the Rz2b till it is 17.8±0.5 ka, and for the Rz2c till it is 16.9±0.5 ka (Table A6 in the Appendices). Bayesian modelling based on OSL chronology and lithostratigraphy suggests that the timing of the ice advances associated with the Rz2a, Rz2b and Rz2c basal tills may be constrained to millennial-scale cycles of the palaeo-ice margin fluctuations at ∼19, ∼18 and ∼17 ka.
4.3 10Be ages
Surface exposure ages of boulders located in the study area range between 5.8±0.8 and 40.3±3.9 ka (Fig. 5b). Distribution of ages (n=14) is polymodal, with the main mode occurring at ∼18 ka. The reduced chi-squared test indicates that the ages are poorly clustered: . We identify two of the oldest ages (40.3±3.9 and 35.5±3.7 ka) and one of the youngest ages (5.8±0.8 ka) as deviating the most from the main mode. They do not fall into a confidence interval arithmetic average IQR (interquartile range, which is the range between the third quartile, Q3, and the first quartile, Q1, of the population) and are thus identified as outliers. For the boulders that are “too old”, they most probably contain beryllium inherited from episodes of exposure pre-dating the last deglaciation, and for the boulder that is “too young”, it may be a result of boulder exposure after deglaciation. Relatively high relief of the study area promotes post-glacial erosional processes, i.e. rainfall washing and/or mass movements along slopes, degradation of the moraine surfaces and possible exhumation of erratics from eroded deposits. This could affect the scatter of the obtained ages, despite the fact that most of them were selected as boulders resting on moraine surfaces, in a stable geomorphological position (Fig. A1). After excluding these outliers, the remaining 11 ages range between 12.5±1.2 and 25.8±2.4 ka, and a reduced chi-squared test shows a much improved cluster: . However, the variability of the remaining ages is 24.1%, and with a , the data set can be described as poorly clustered (Blomdin et al., 2016). The arithmetic mean and the standard deviation for these 11 surface exposure ages is 18.0±4.3 ka (Fig. 5b), and it could represent the minimum deglaciation age of the study area. However, geomorphological processes could have had a large impact on the spread of exposure ages (Heyman et al., 2011).
5.1 Timing and dynamics of the last FIS oscillations
The first ice sheet advance which deposited Rz2a till of the most likely age constrained to 19.2±1.1 ka corresponds to the local Last Glacial Maximum (LGM) ice advance associated with the maximum expansion of the last FIS in this region (Fig. 6a). The age of the local LGM in northern–central and north-eastern Poland was recently estimated at ∼19.0–18.5 ka based on OSL dating and re-interpretation of available cosmogenic ages (Wysota et al., 2009; Marks, 2012) or at the most likely time interval 22–18 ka, based on a new cosmogenic chronology interpreted together with available radiocarbon and luminescence ages (Tylmann et al., 2019). After maximum expansion of the last FIS, the ice margin retreated and periglacial conditions with frost contraction of the exposed ground surface and aeolian deposition of sand occurred, leading to the formation of periglacial horizon K1 at the Rożental site (Fig. 6b). Moreover, mass movements and denudation processes were also active at this stage, which is indicated by a partly eroded Rz2a till layer and the gravitational deformation of fossil sand wedges of horizon K1 (Tylmann et al., 2014).
The second ice advance deposited the Rz2b till of the most likely age constrained to 17.8±0.5 ka. The extent of this ice advance is not unequivocally determined. However, the ice most likely covered the locality of the Rożental site. Based on the spatial distribution of glacial landforms and sediments, i.e. outlets of subglacial valleys and proximal edges of narrow outwash plains located on the southern and south-eastern slopes of the Lubawa Upland (Fig. 2), we argue that this ice advance could have covered the highly elevated central part of the study area. The ice margin probably reached the south-eastern and eastern slopes of the Lubawa Upland (Fig. 6c). After ∼18 ka, the ice sheet retreated again, and the minimum deglaciation age of the study area inferred from surface exposure dating of boulders (18.0±4.3 ka) probably represents this stage of the ice margin oscillations. The comparison between exposure ages calculated with various production rates shows that the differences are negligible and are much smaller than the uncertainties of individual ages (Table A5 in the Appendices). The difference between the arithmetic means and the standard deviations for the 11 surface exposure ages is also negligible: 18.0±4.3 ka using the default production rate data set in the CRONUS-Earth online exposure age calculator, 18.1±4.4 ka using the primary data set of Borchers et al. (2016), 18.0±4.3 ka using the secondary data set of Borchers et al. (2016) and 18.2±4.4 ka using the Scandinavian reference 10Be production rate (Stroeven et al., 2015). However, the scatter of 10Be ages is large (from 12.5±1.2 to 25.8±2.4 ka after excluding outliers), and various factors, such as the inherited 10Be signal, redeposition of boulders and degradation of moraine surfaces, may have had a significant impact on the spread of the reported exposure ages (Heyman et al., 2011; Blomdin et al., 2016). The 10Be surface exposure age of a boulder located in the vicinity of the study area and most likely in the same morpho-stratigraphic zone (sample LGM-11, 17.5±1.6 ka) also suggests ice margin recession in this region immediately after ∼18 ka (Fig. 1b). The ice margin retreated to the north and north-west of the Rożental site, and periglacial conditions occurred again, at least in the locality of the Rożental site, where the periglacial wedge K2 was formed (Fig. 6d).
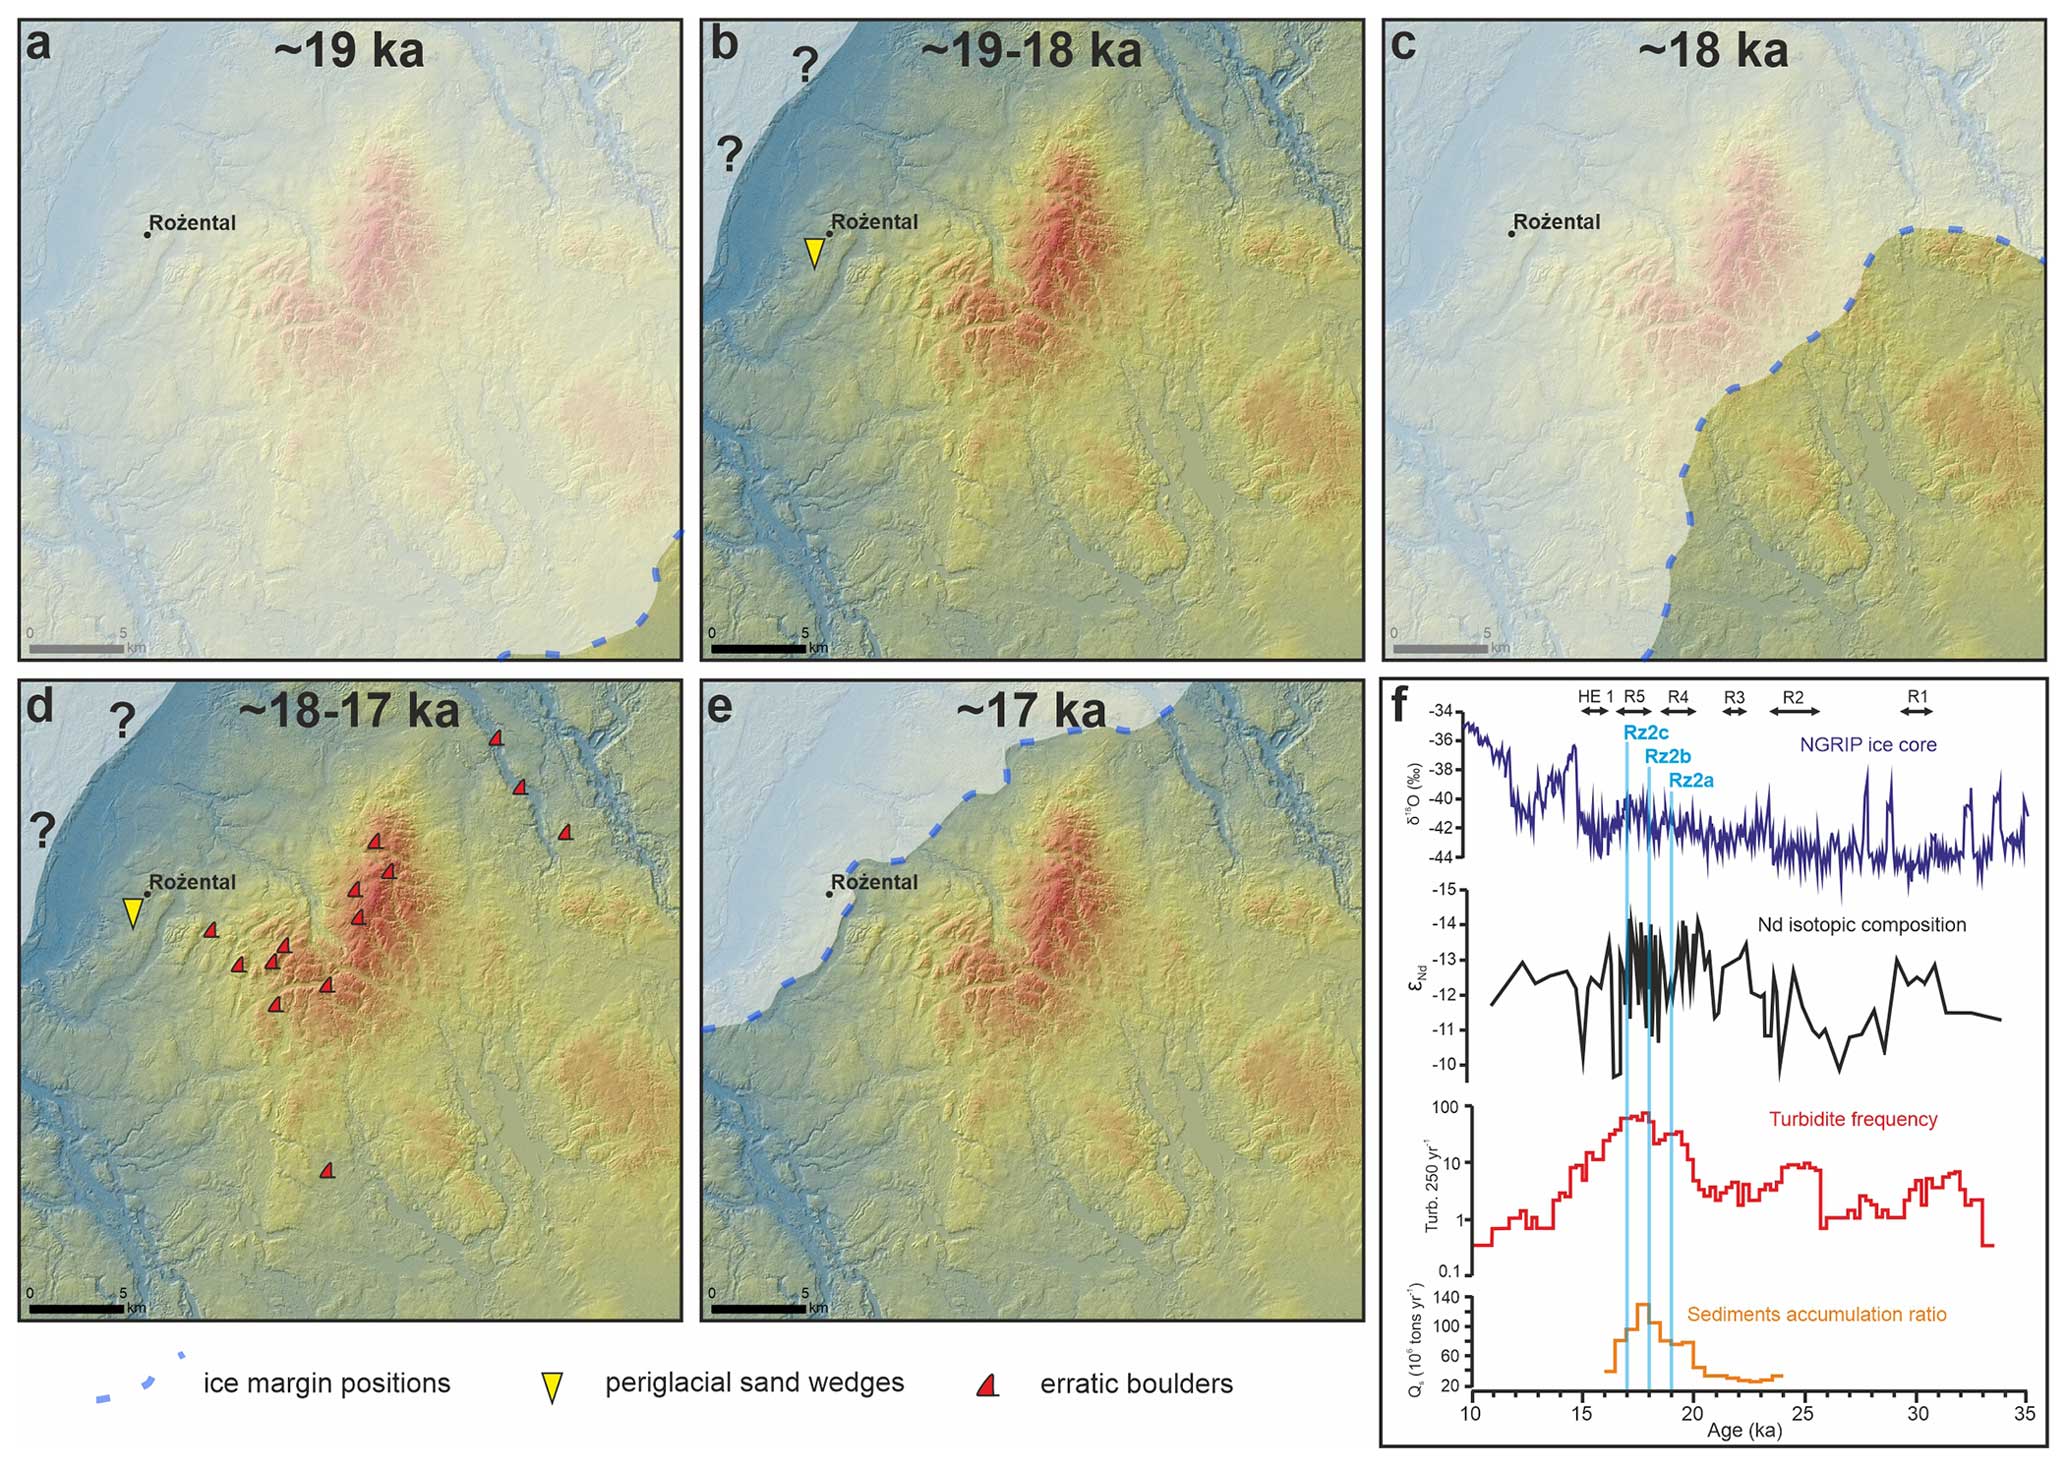
Figure 6Reconstruction of palaeo-ice margin oscillations in the study area and millennial cycles recorded in marine sediments from the eastern North Atlantic and in the ice core record from Greenland. (a) Maximum extent of the last FIS around 19 ka. (b) Ice-free conditions around 19–18 ka. (c) Ice sheet advance around 18 ka. (d) Ice-free conditions around 18–17 ka. (e) Ice sheet advance around 17 ka. (f) Variations of the δ18O signature in the NGRIP ice core (NGRIP-members, 2004), the εNd isotopic composition, the turbidite frequency and the sediment load in marine sediments from the Bay of Biscay (for details, see Toucanne et al., 2008, 2010 and 2015). Episodes of the Channel River large meltwater discharge (R events) are marked as well as Heinrich event 1 (HE 1) and the most likely till ages for Rz2a, Rz2b and Rz2c. The digital elevation model with 1 m pixel size (maps a–e) is based on lidar data from the resources of the Head Office of Geodesy and Cartography in Poland freely available at https://www.geoportal.gov.pl/ (last access: 21 November 2022).
The third ice advance which deposited the Rz2c till of the most likely age constrained to 16.9±0.5 ka was probably the least extensive (Fig. 6e). The ice sheet covered only the north-western edge of the Lubawa Upland, and the ice margin was probably located along the ice-marginal valleys (Fig. 2a), which drained glacial meltwater south-westwards. The final deglaciation of the study area occurred after ∼17 ka.
5.2 Correlation with regional glacial phases
Our results suggest millennial-scale oscillations of the last FIS in northern Poland between ∼19 and ∼17 ka. These cycles of ice sheet advances and retreats probably occurred in the late stage of the local LGM and during the subsequent deglaciation of this region. The timing of the maximum extent of the last FIS in its southern sector was recently constrained to ∼24–23 ka in western Poland and north-eastern Germany during the Brandenburg (Leszno) Phase and to ∼19 ka in northern–central and north-eastern Poland during the Frankfurt (Poznań) Phase (Wysota et al., 2009; Ehlers et al., 2011; Marks, 2012; Marks et al., 2022). Based on the recent 10Be surface exposure dating and comparison to the available radiocarbon and luminescence chronologies, the most likely time intervals for the local LGM are 25–21 ka in western Poland and 22–18 ka in north-eastern Poland (Tylmann et al., 2019). The Rz2a till dated based on our Bayesian modelling at 19.2±1.1 ka may thus be correlated with the local LGM ice advance. In northern–central Poland, the timing of the ice advance which reached the maximum limit of the last FIS was constrained based on OSL dating of the Upper Weichselian glacial sequence to ∼18.5 ka (Wysota et al., 2009), which could also be correlated with our age constraint for the Rz2a till (19.2±1.1 ka). However, based on apparent OSL ages obtained for the Rz1 unit and periglacial wedges of horizon K1, the possible time window for deposition of the Rz2a till is wide, as it ranges between ∼150 and ∼19–17 ka (Fig. 5a). This suggests that the Rz2a basal till may be correlated with an MIS 6 ice advance (the Late Saalian glaciation) or with MIS 4 or MIS 2 ice advances occurring before 19–17 ka. We argue that sediments of the Rz1 unit most likely represent a recession phase of the MIS 6 ice sheet, as they consist of relatively coarse-grained, horizontally bedded lithofacies associated with intensive ablation cycles. In our opinion, a deposition of the Rz2a till after MIS 6 is the most likely scenario. This is supported by our Bayesian modelling, which takes into account the whole sedimentary sequence and which provides the most probable age of the till correlated with MIS 2 (19.2±1.1 ka).
The second ice advance, constrained with our modelling to 17.8±0.5 ka, is comparable to one of the ice-marginal formations that formed during the last deglaciation in the north-eastern region of Poland: the Łopuchowo 2 and Gulbieniszki moraines that are dated at 17.9±1.3 ka using cosmogenic 36Cl (ages reported in Dzierżek and Zreda, 2007). This ice advance may also be related to a regional sub-phase distinguished in northern Poland based on the geomorphology between the maximum extent of the last FIS and the Pomeranian Phase – the Kujawy-Dobrzyń sub-phase (Kozarski, 1995; Niewiarowski et al., 1995). However, a broad correlation along the palaeo-ice margin over large distances is speculative and uncertain, as various sections of ice-marginal formations at the southern fringe of the last FIS were usually formed asynchronously (e.g. Dzierżek and Zreda, 2007; Lüthgens and Böse, 2012; Tylmann et al., 2022).
The last ice advance in the study area was dated with our Bayesian modelling at 16.9±0.5 ka and may be correlated with the Pomeranian Phase of the last deglaciation, whose age was recently constrained to 17–16 ka (e.g. Marks, 2012; Marks et al., 2022) or 18–17 ka (Stroeven et al., 2016). However, new studies showed that the age of ice-marginal formations at the southern fringe of the last FIS was traditionally correlated with a discrete time interval during the Pomeranian Phase, in fact covering a wide time window between 20 and 15 ka (Tylmann et al., 2022). We thus argue that ∼17 ka ice re-advance occurred on the north-western slope of the Lubawa Upland, and this re-advance could be correlated with ice advances and/or ice margin stillstands within the Mazury Ice Stream which are dated at 18–17 ka (Tylmann et al., 2022).
5.3 Millennial-scale fluctuations of the last FIS
Our results suggest very dynamic oscillations of one particular segment of the FIS's southern front. The last FIS advanced and retreated over a relatively short period of time (2–3 ka), leaving lithostratigraphic records (basal tills) of three ice advances, most likely at a millennial-scale cycle: ∼19, ∼18 and ∼17 ka. Millennial-scale fluctuations of the southern fringe of the last FIS have already been explored by linking properties of marine deposits from the eastern North Atlantic and precisely constrained by a radiocarbon chronology, with dynamics of the terrestrial palaeo-ice sheet margin in Europe (e.g. Zaragossi et al., 2001, 2006; Toucanne et al., 2008, 2010, 2015). During the last deglaciation, meltwater from the southern front of the FIS transported terrigenous deposits along the Channel River network (including an ice-marginal valley system – urstromtal – in the North European Plain) towards the Bay of Biscay. It was a key depocentre for far-travelled sediments released from the European ice sheets, including the southern FIS. Properties of sediment sequences deposited in the Bay of Biscay, such as turbidite frequency (Zaragossi et al., 2006; Toucanne et al., 2008) or sediment accumulation ratio (Toucanne et al., 2010), indicate increased meltwater discharge and enhanced ice sheet decay between ∼20 and ∼17 ka. After 20 ka sediment loading within the Bay of Biscay, the depocentre rose significantly in comparison to a lower sediment accumulation ratio and turbidity activity between ∼30 and ∼20 ka (Fig. 6f). Between ∼19 and 18.5 ka there is a sudden reduction in turbidity activity (Fig. 6f). However, this could be a result of the first well-known abrupt sea level rise–meltwater pulse at ∼19 ka – the 19 ka meltwater pulse (MWP) (Clark et al., 2004). This could correspond to a significant retreat of the southern FIS ice margin after the LGM period (Rinterknecht et al., 2006), which in our results is indicated after the first ice advance dated at 19.2±1.1 ka. Maximum turbidity activity and sediment load, which occurred at ∼18.3–17.0 ka, correspond to the main phase of the FIS melting in the North European Plain (Toucanne et al., 2008). The latter could be roughly correlated with an ice margin retreat after the second ice advance in our study area dated at 17.8±0.5 ka. After ∼17.5–17.0 ka the meltwater discharge from the southern FIS significantly decreased in response to the initiation of a deglacial pause and a global re-advance of glaciers and ice sheets in Europe corresponding to Heinrich event 1 (HE1) (Zaragossi et al., 2001; Toucanne et al., 2009). This event might be recorded in our results as the last ice advance which deposited the Rz2c till dated at 16.9±0.5 ka (Fig. 6f).
Coupling between the southern FIS fluctuations and the Channel River meltwater discharge was also investigated by Toucanne et al. (2015). They used the neodymium isotopic composition of sediments, a powerful tracer for terrigenous sediment geographical provenance, cored from the Bay of Biscay seafloor and sampled from moraines, ice-marginal valleys and proglacial lakes alongside the FIS southern margin. They found that episodes of the Channel River large meltwater discharges (R events) could be identified and correlated with the FIS dynamics (Fig. 6f). The first ice advance in our study area (19.2±1.1 ka) probably corresponds to the millennial-scale intervals of Channel River shutdowns (i.e. pauses in deglaciation) between 21.3±0.2 (i.e. the end of the R3 event) and 20.3±0.2 ka (i.e. the onset of the R4 event) or between 18.7±0.3 (i.e. the end of the R4 event) and 18.2±0.2 ka (i.e. the onset of the R5 event). The second ice advance in our study area, constrained to 17.8±0.5 ka, falls within an episode of substantial ice-marginal retreat recorded by Toucanne et al. (2015) between 18.2±0.2 and 16.7±0.2 ka (R5 event, just before HE1). Finally, the third ice advance in our study area (16.9±0.5 ka) potentially correlates well with a pause in the overall ice-marginal retreat between 16.7±0.2 and 15.7±0.3 ka (HE1) according to Toucanne et al. (2015) or between 17.2±0.4 and 15.7±0.3 ka according to the reconstruction of the FIS dynamics in the East European Plain (Soulet et al., 2013).
Our results suggest millennial-scale oscillations of the last FIS in northern Poland between ∼19 and ∼17 ka. Based on OSL chronology and Bayesian modelling, supplemented with 10Be surface exposure dating, we show that the last FIS advanced and retreated over a relatively short period of time (2–3 ka), leaving lithostratigraphic records (basal tills) of three ice re-advances over a millennial-scale cycle: 19.2±1.1, 17.8±0.5 and 16.9±0.5 ka. This is the first terrestrial record of possible millennial-scale palaeo-ice margin oscillations at the southern fringe of the FIS during the last glacial cycle. Cycles of ice sheet re-advances and retreats occurred most likely in the late stage of the local LGM and during the subsequent deglaciation of this region. The first ice re-advance deposited the Rz2a till (19.2±1.1 ka) and might be correlated with the local LGM ice advance. The second ice re-advance constrained to 17.8±0.5 ka (Rz2b till) is comparable to one of the ice-marginal formations deposited in the north-eastern region of Poland and dated at 17.9±1.3 ka using cosmogenic 36Cl. The last ice re-advance dated at 16.9±0.5 ka (Rz2c till) could be correlated with ice advances and/or ice margin stillstands of the Mazury Ice Stream during the Pomeranian Phase.
Possible millennial-scale palaeo-ice margin oscillations at the southern fringe of the FIS inferred from the terrestrial record were linked to cycles recorded in marine deposits from the eastern North Atlantic and precisely constrained radiocarbon chronologies. The first ice advance (19.2±1.1 ka) could be correlated with a sudden reduction in turbidity activity between ∼19 and 18.5 ka recorded in marine sediments from the Bay of Biscay. The subsequent ice margin retreat might be connected to the first well-known abrupt sea level rise–meltwater pulse at ∼19 ka (19 ka MWP). The timing of a second ice re-advance in our study area was constrained at 17.8±0.5 ka. The following ice margin retreat is roughly correlated with the maximum turbidity activity and sediment load at ∼18.3–17.0 ka in the Bay of Biscay. The third and last ice re-advance recorded in our study area (16.9±0.5 ka) may potentially correspond to a significant drop in meltwater discharge from the southern FIS, reflecting a pause in the overall deglaciation dynamics and a global re-advance of glaciers and ice sheets in Europe related to HE1.
Table A1OSL samples with laboratory data and parameters used during OSL age calculation.
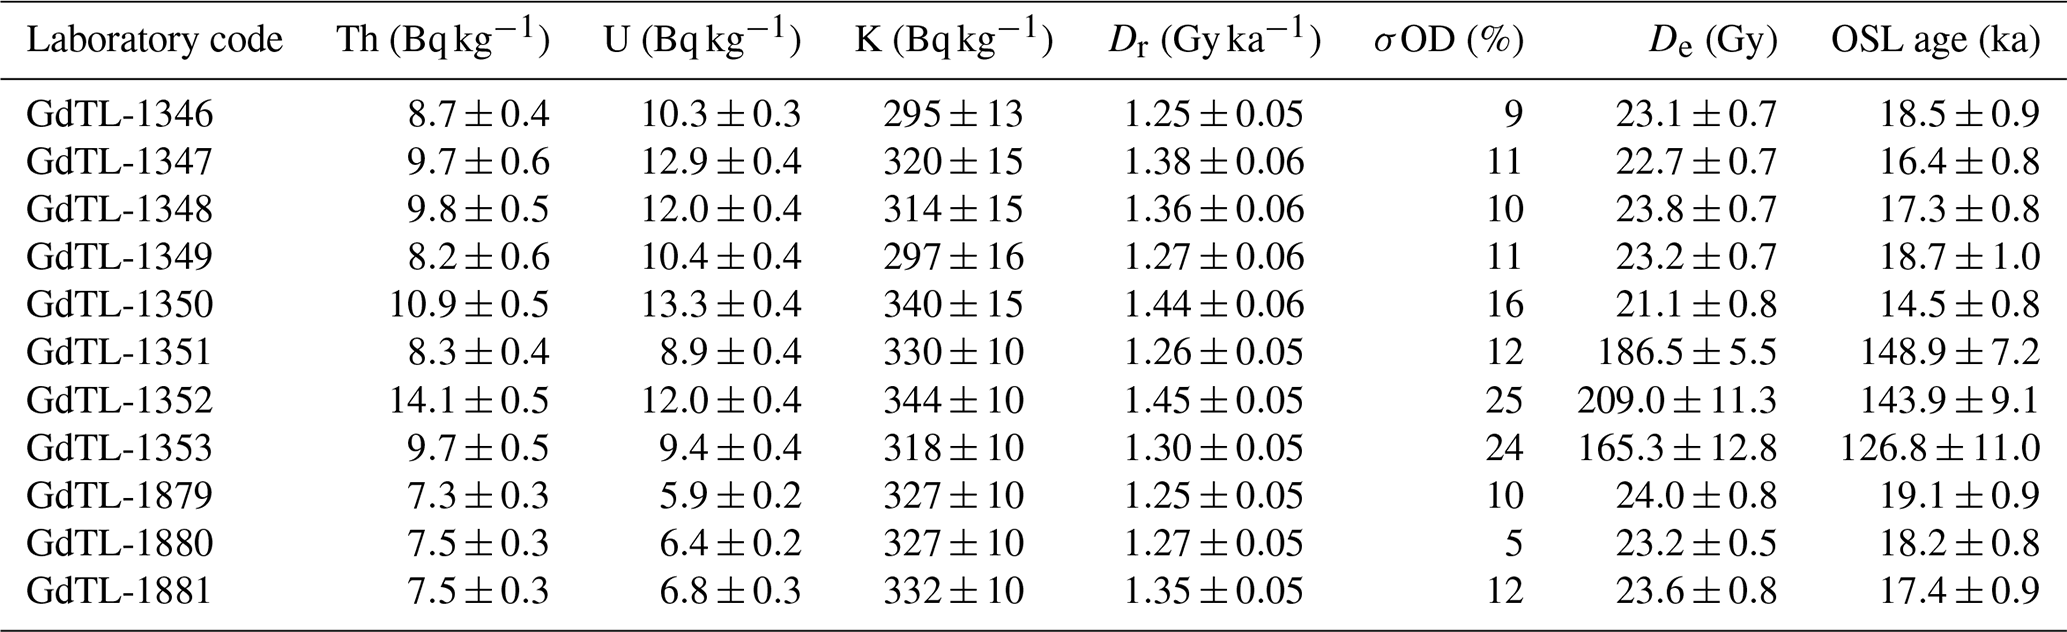
Table A2Equivalent doses (De) measured for individual aliquots in OSL samples. All values are given in giga-years.
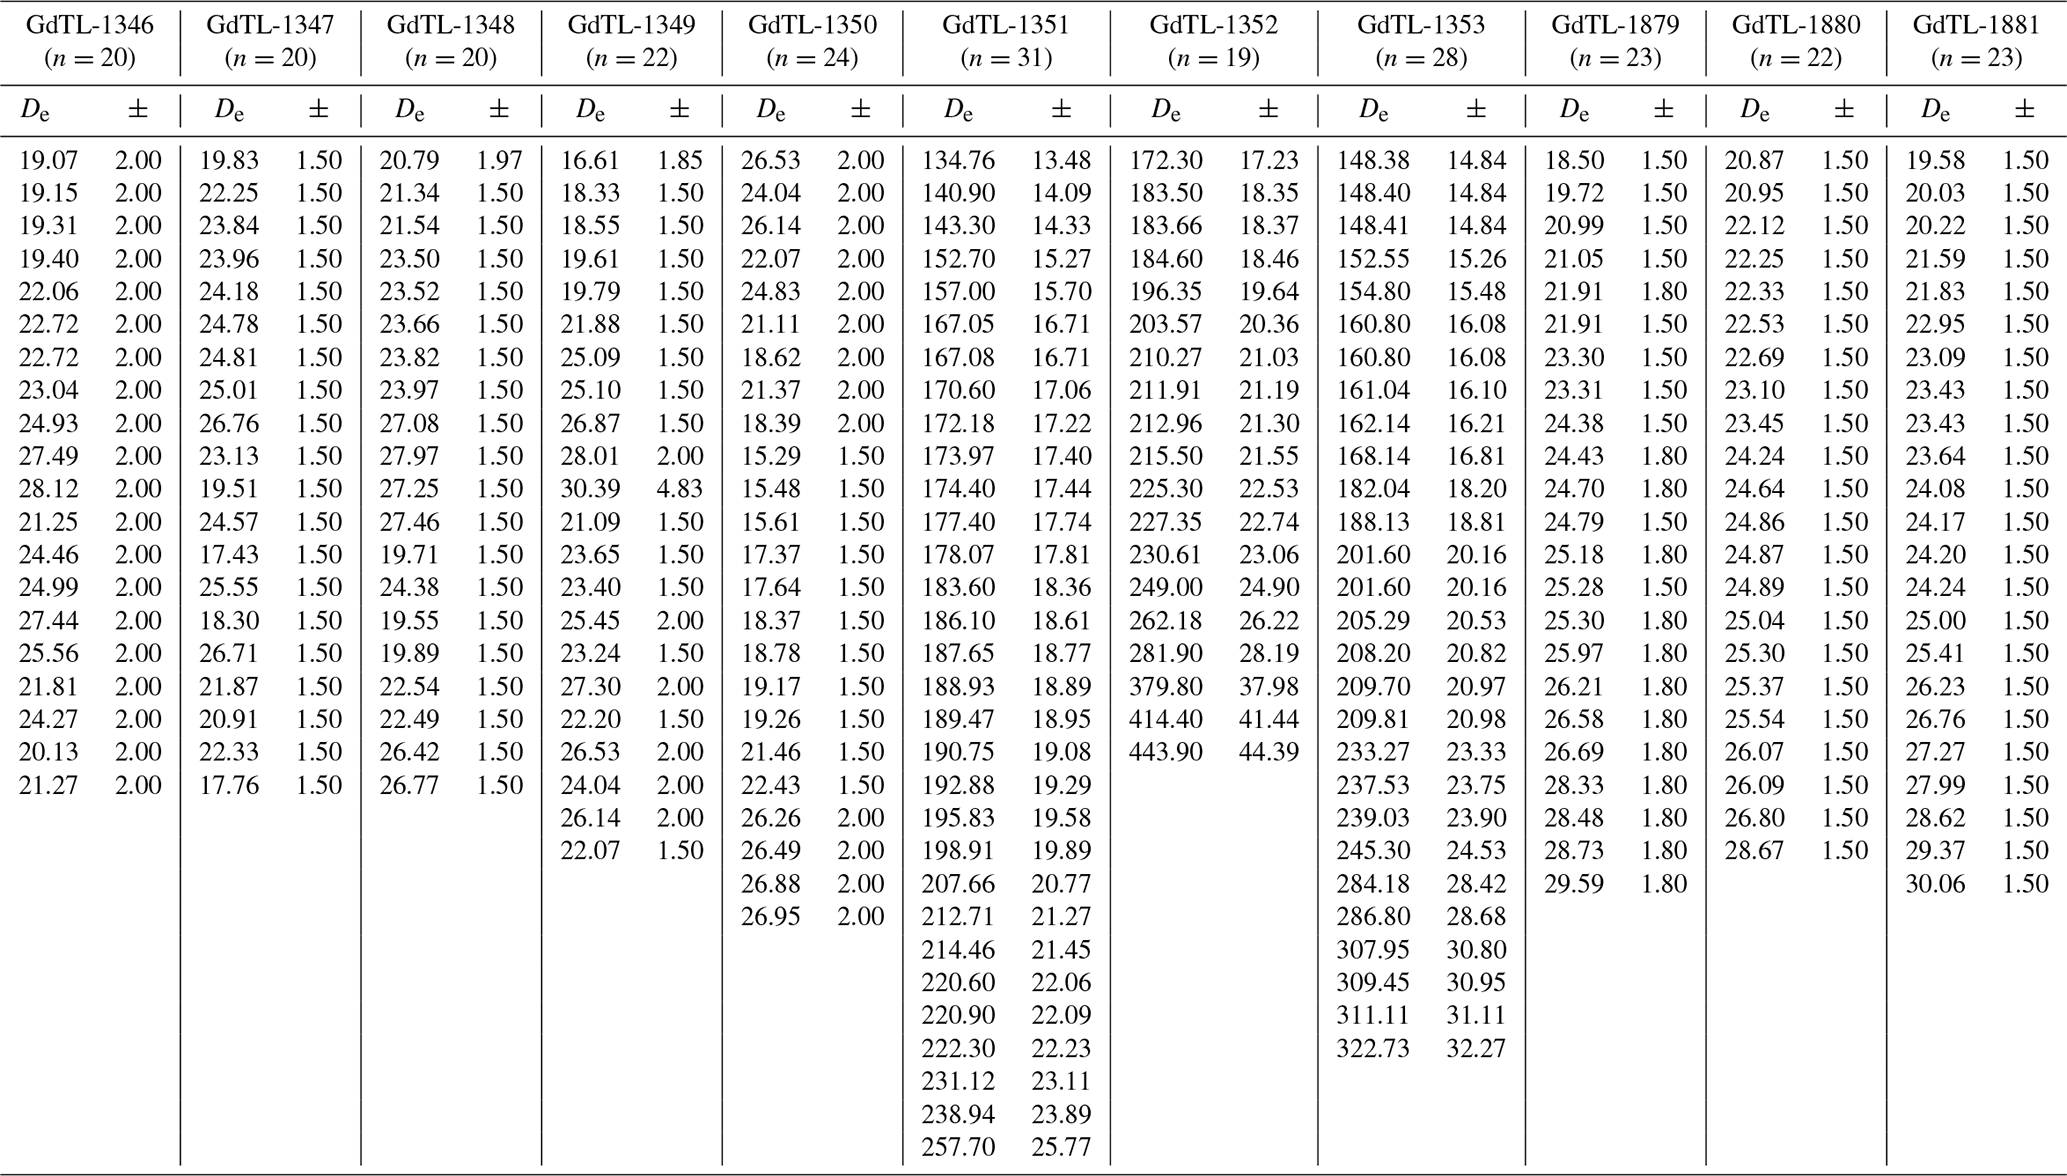
Table A3The notation of commands used to process the Sequence algorithms in OxCal.
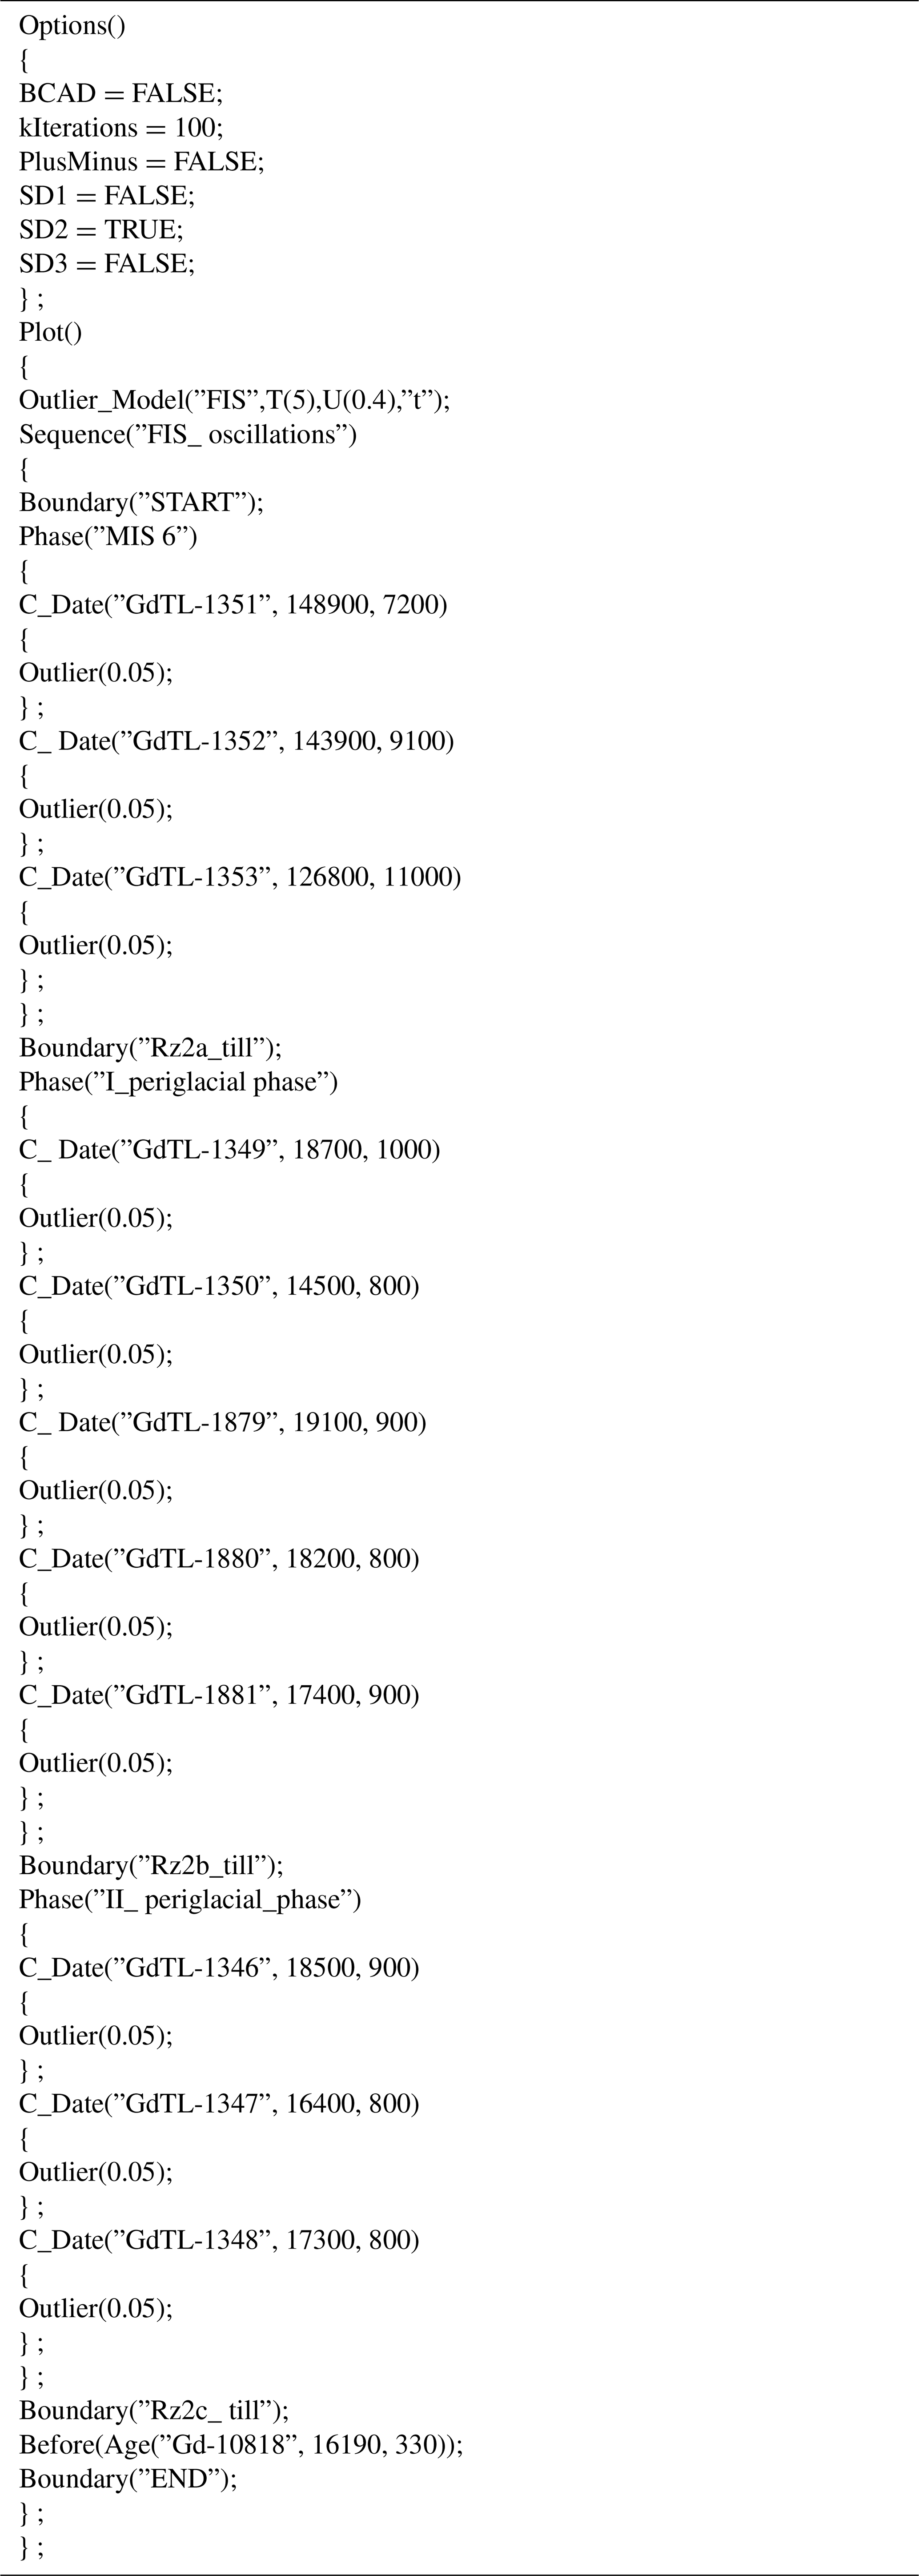
Table A4Surface exposure 10Be ages of erratic boulders. The list consists of five new 10Be ages (LUB samples) and nine ages recalculated from the original data of Rinterknecht et al. (2006) and Tylmann et al. (2019). All 10Be exposure ages are calculated with the “Lm” time-dependent scaling scheme for spallation according to Lal (1991) and Stone (2000) and the global production rate according to Borchers et al. (2016).
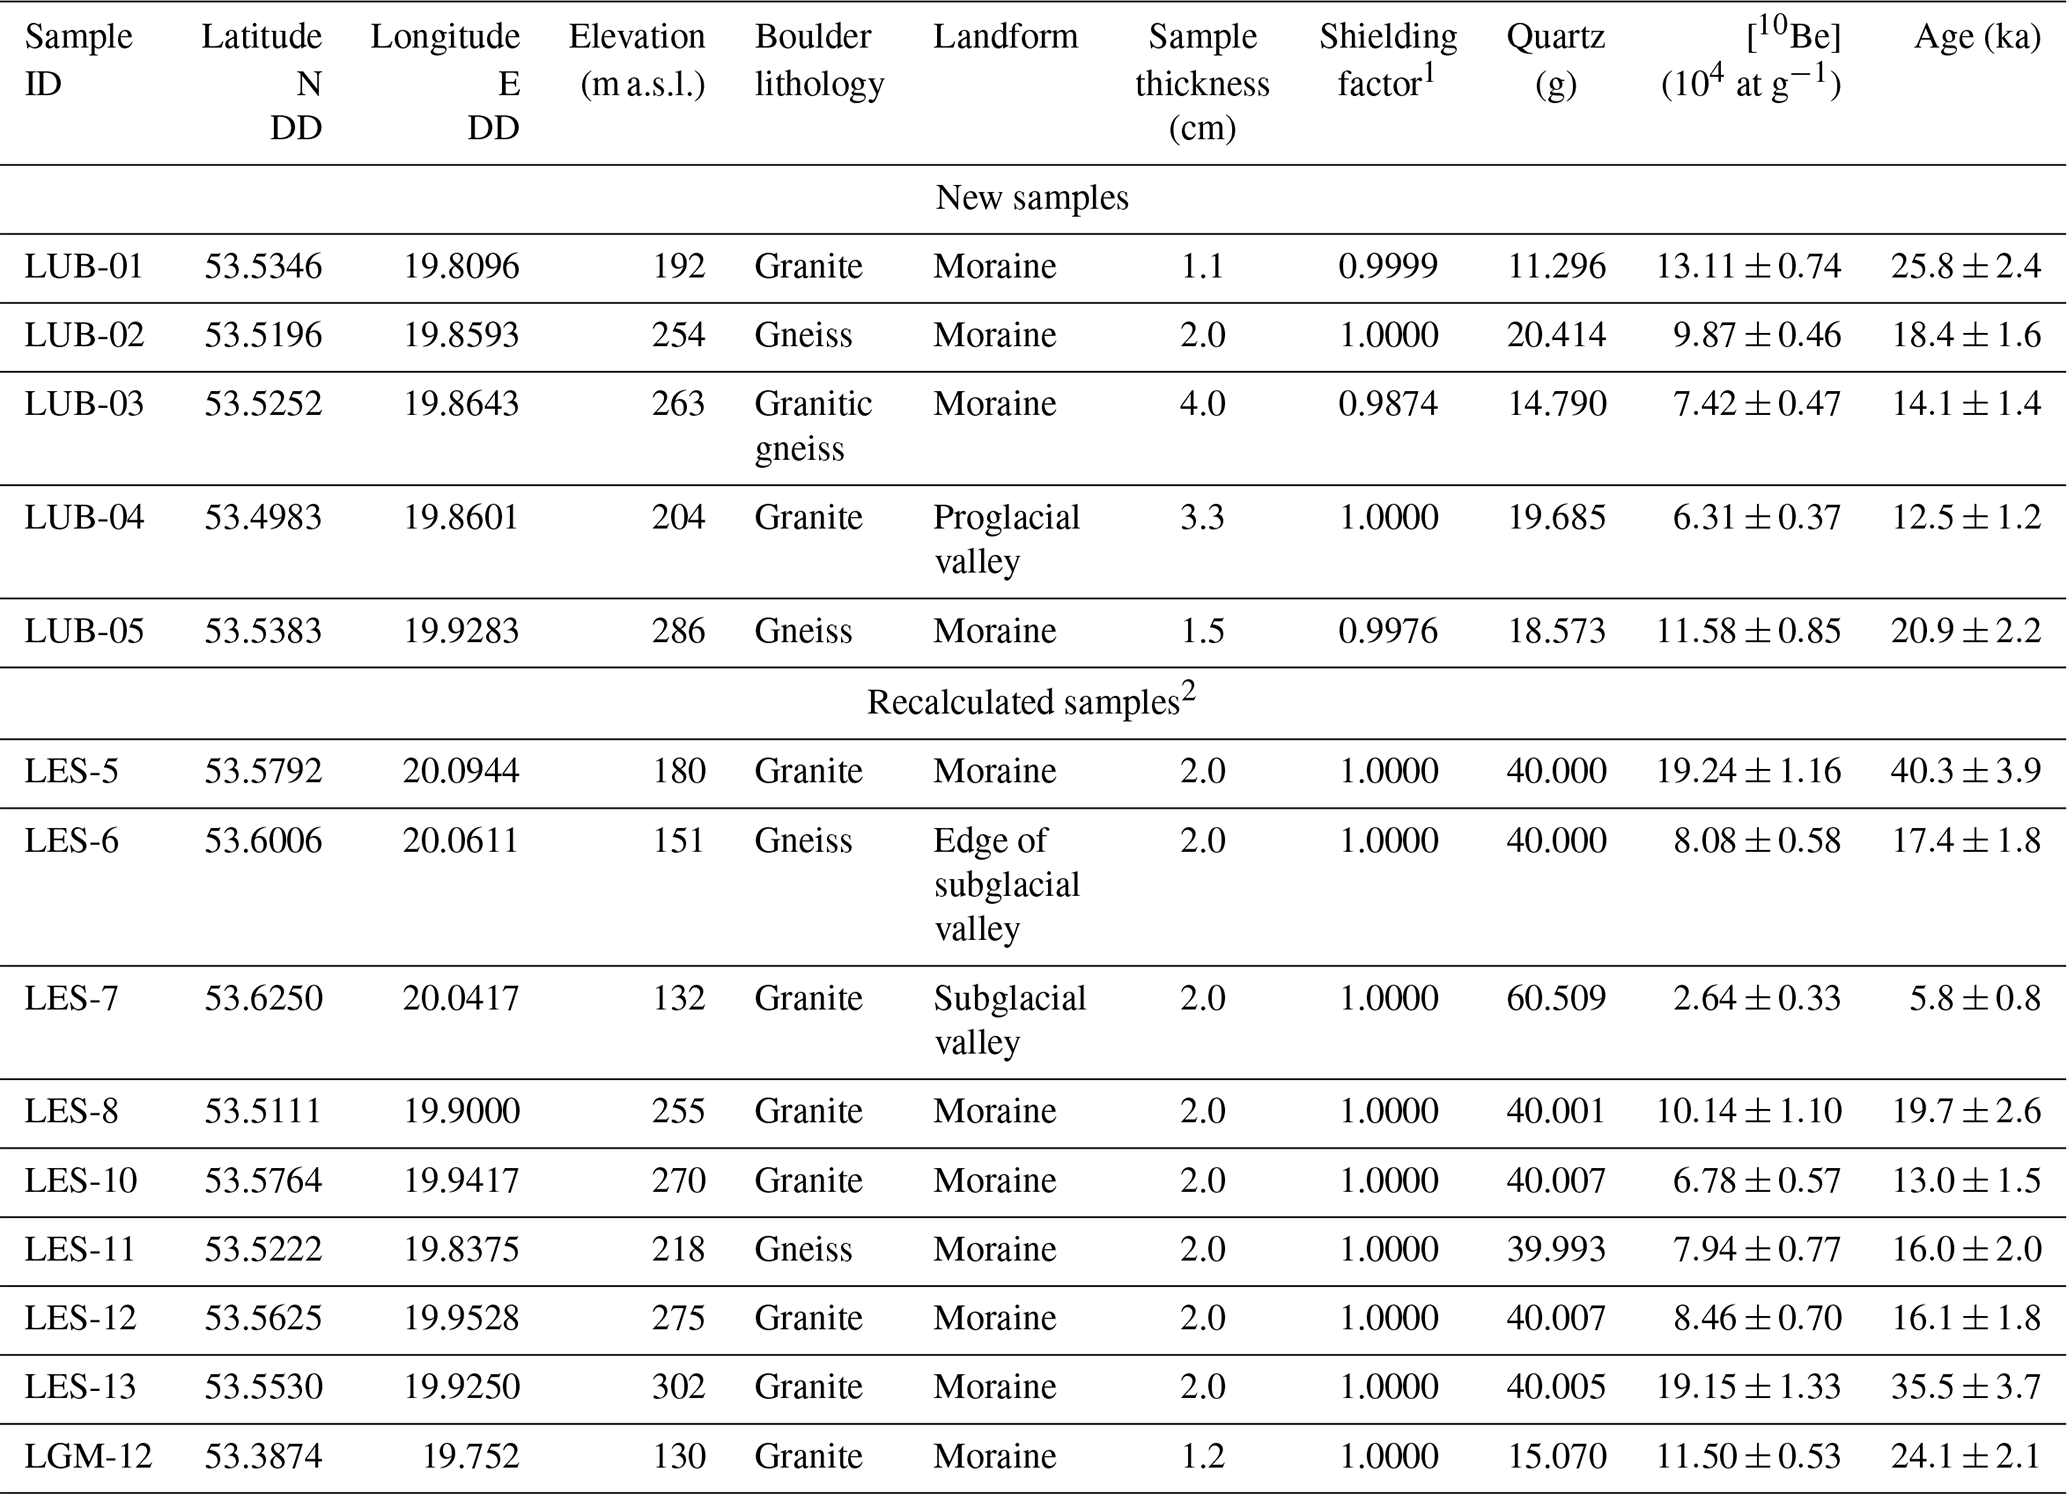
AMS results are standardized to NIST SRM 4325 (sample LES) and STD-11 (sample LUB). ratios were corrected for process blank values of (sample LES), (sample LGM-12) and (sample LUB). 1 corresponds to self-shielding (direction and angle of surface dip). 2 is based on original data from Rinterknecht et al. (2005, 2006) and Tylmann et al. (2019).
Table A510Be concentrations for analysed samples and surface exposure ages calculated according to various 10Be production rates.
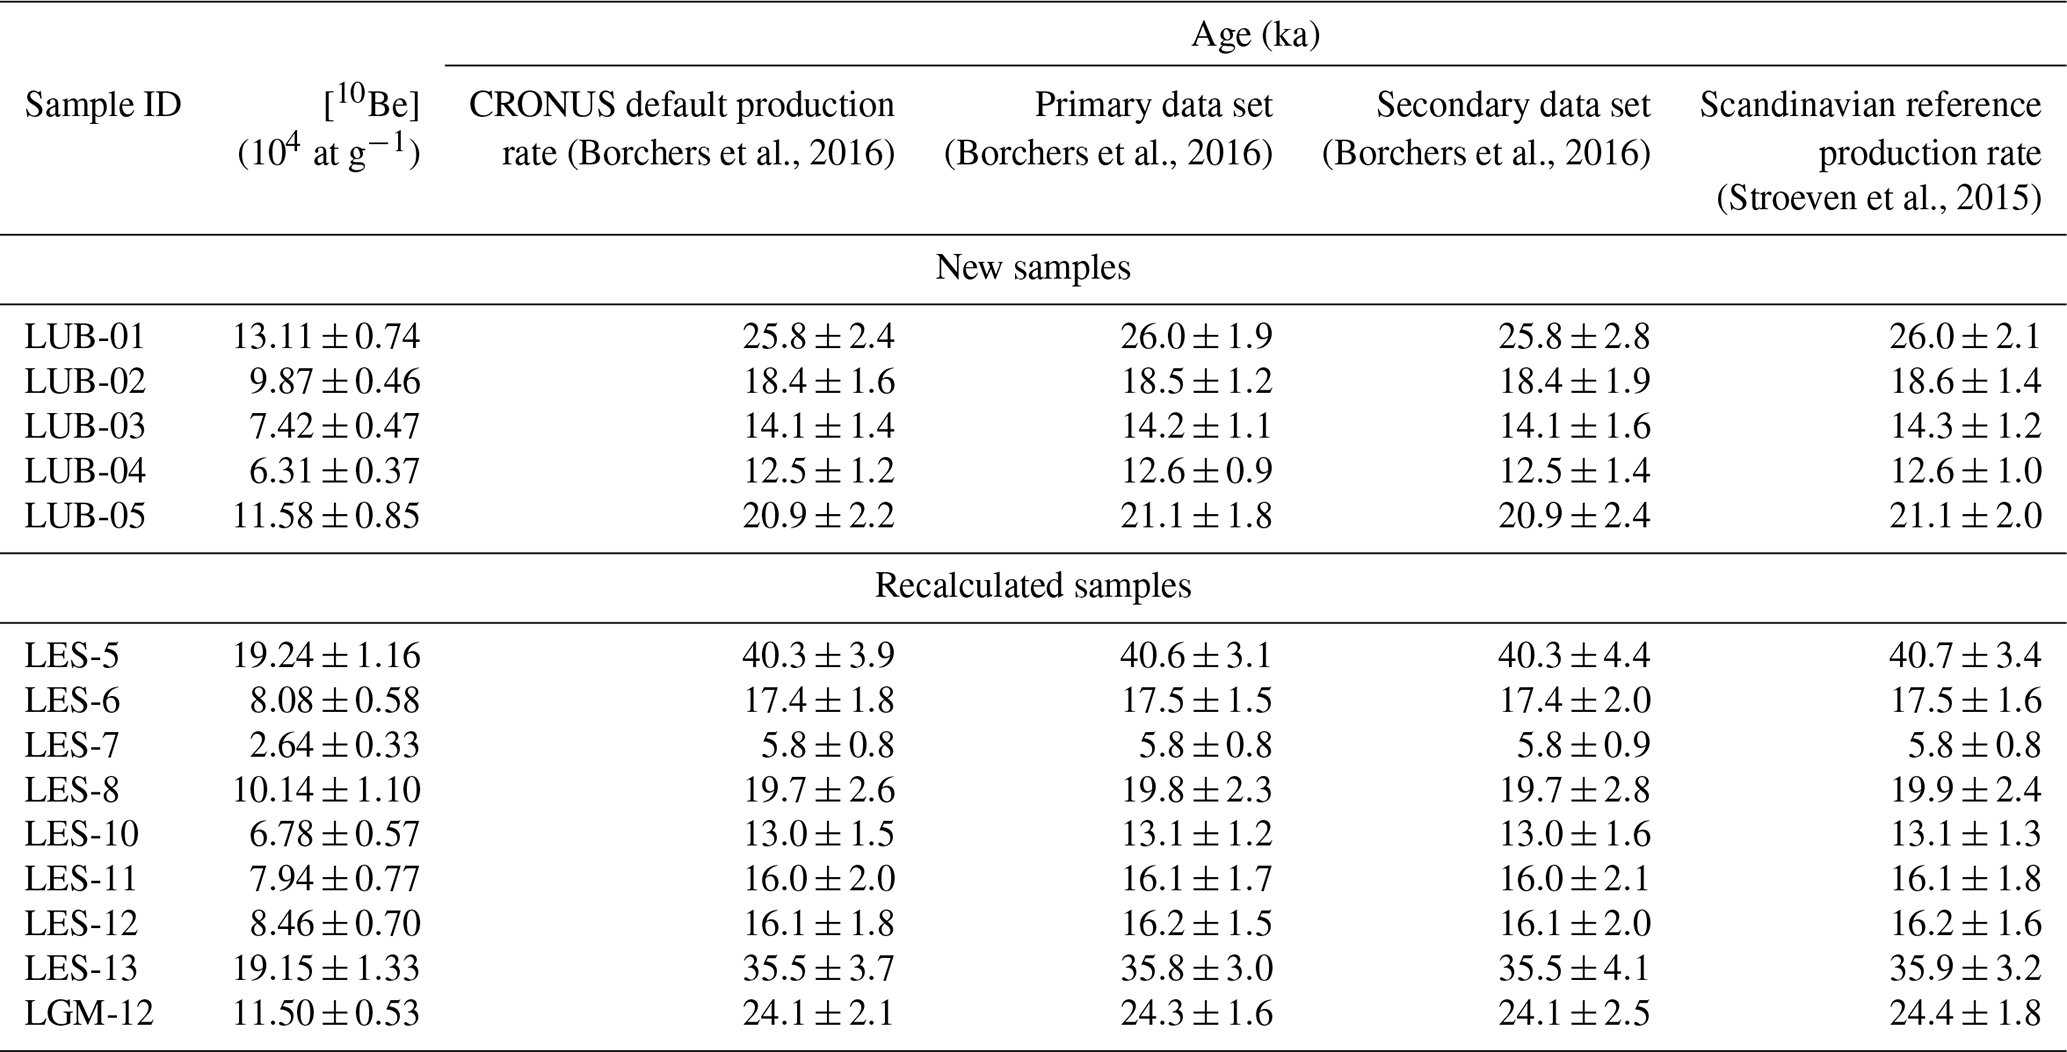
Table A6OSL dating controls and results of the Bayesian age modelling.
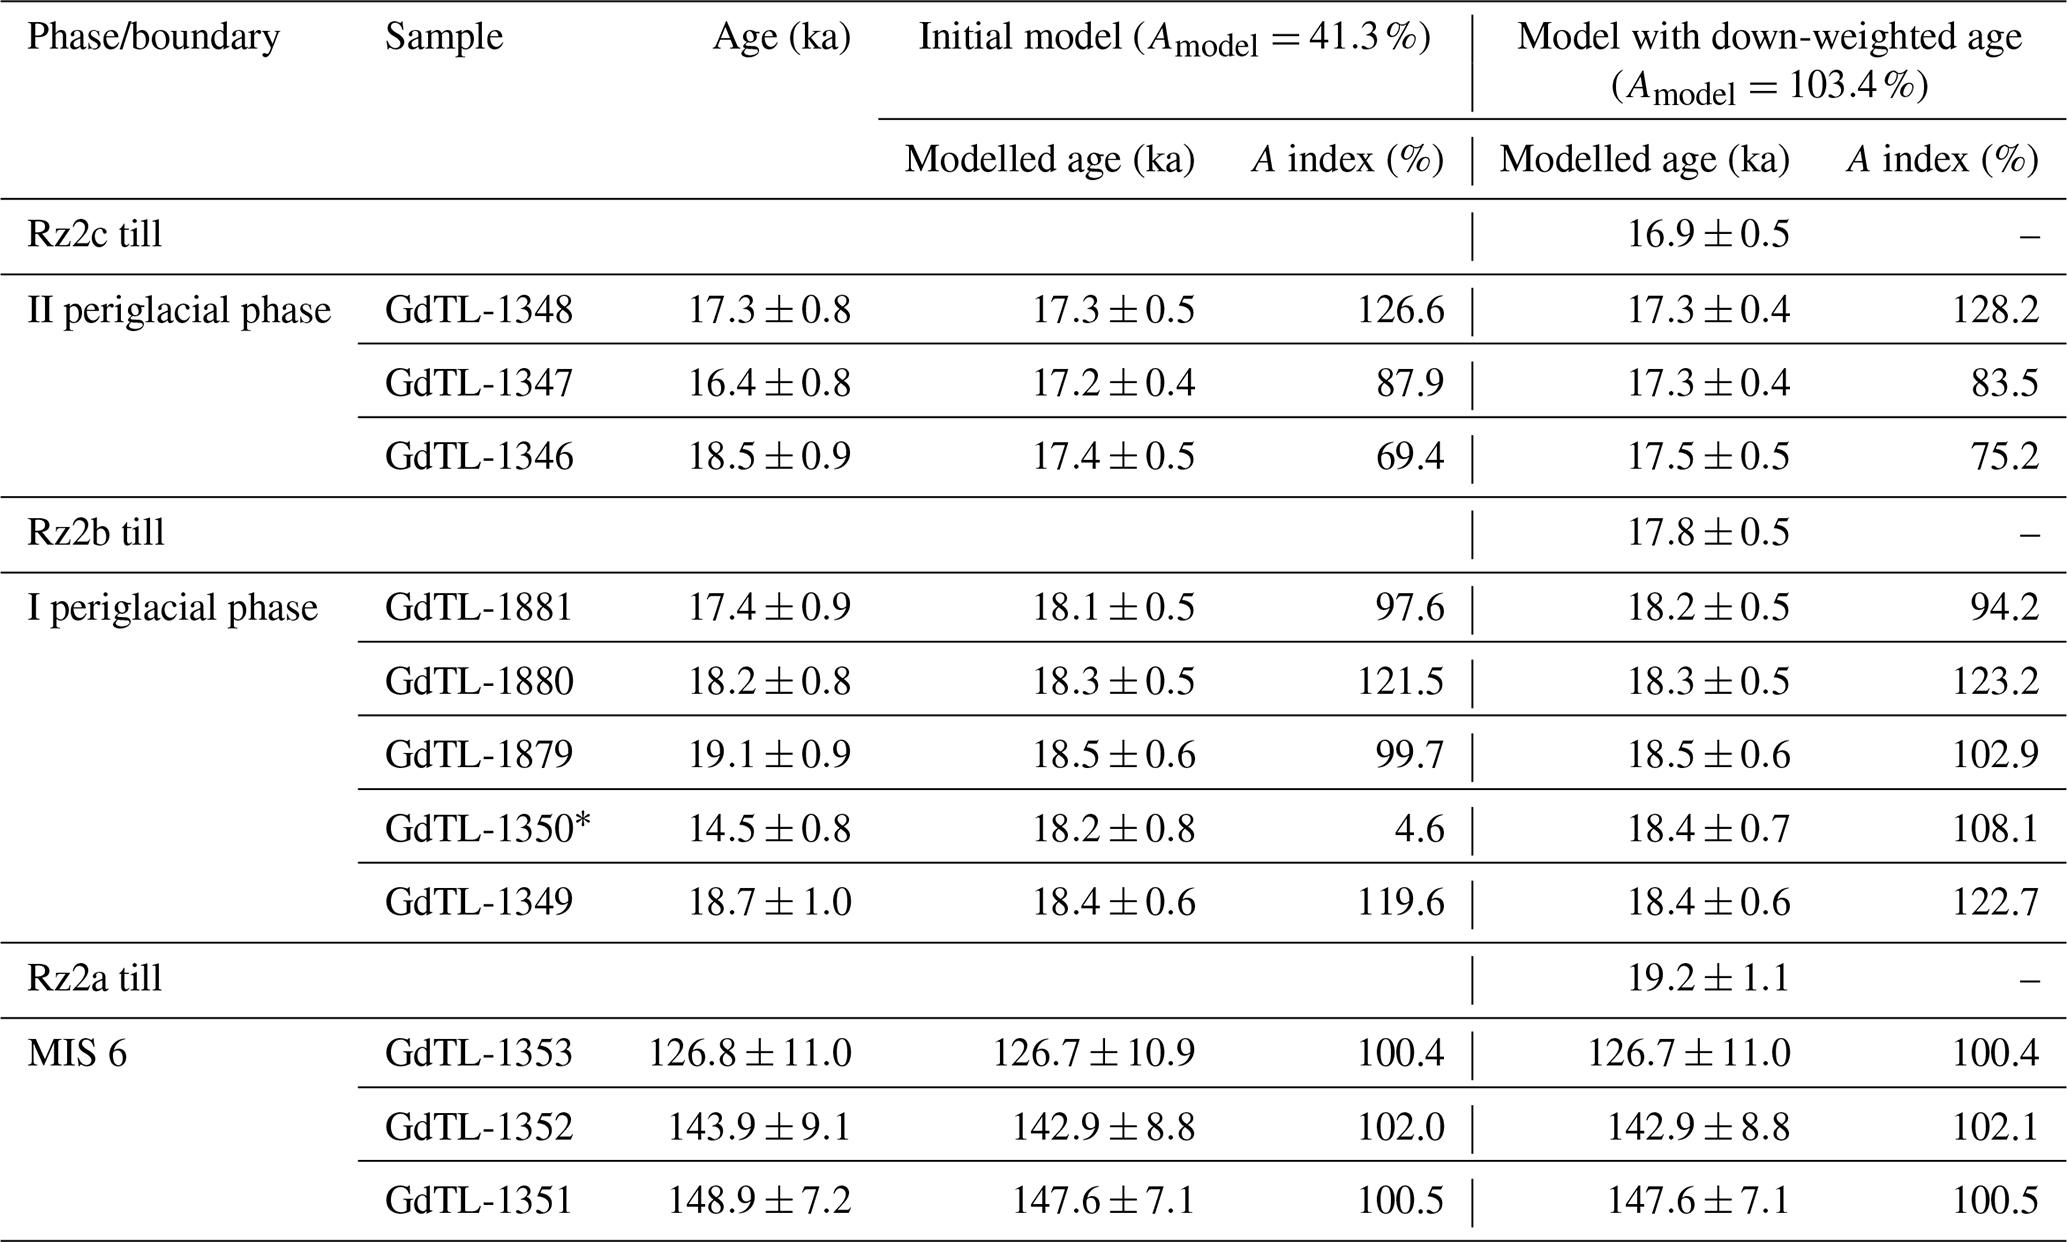
* Age identified in the initial Sequence as an outlier; the age was down-weighted in the re-run Sequence to a prior probability of 0.85 of being an outlier.
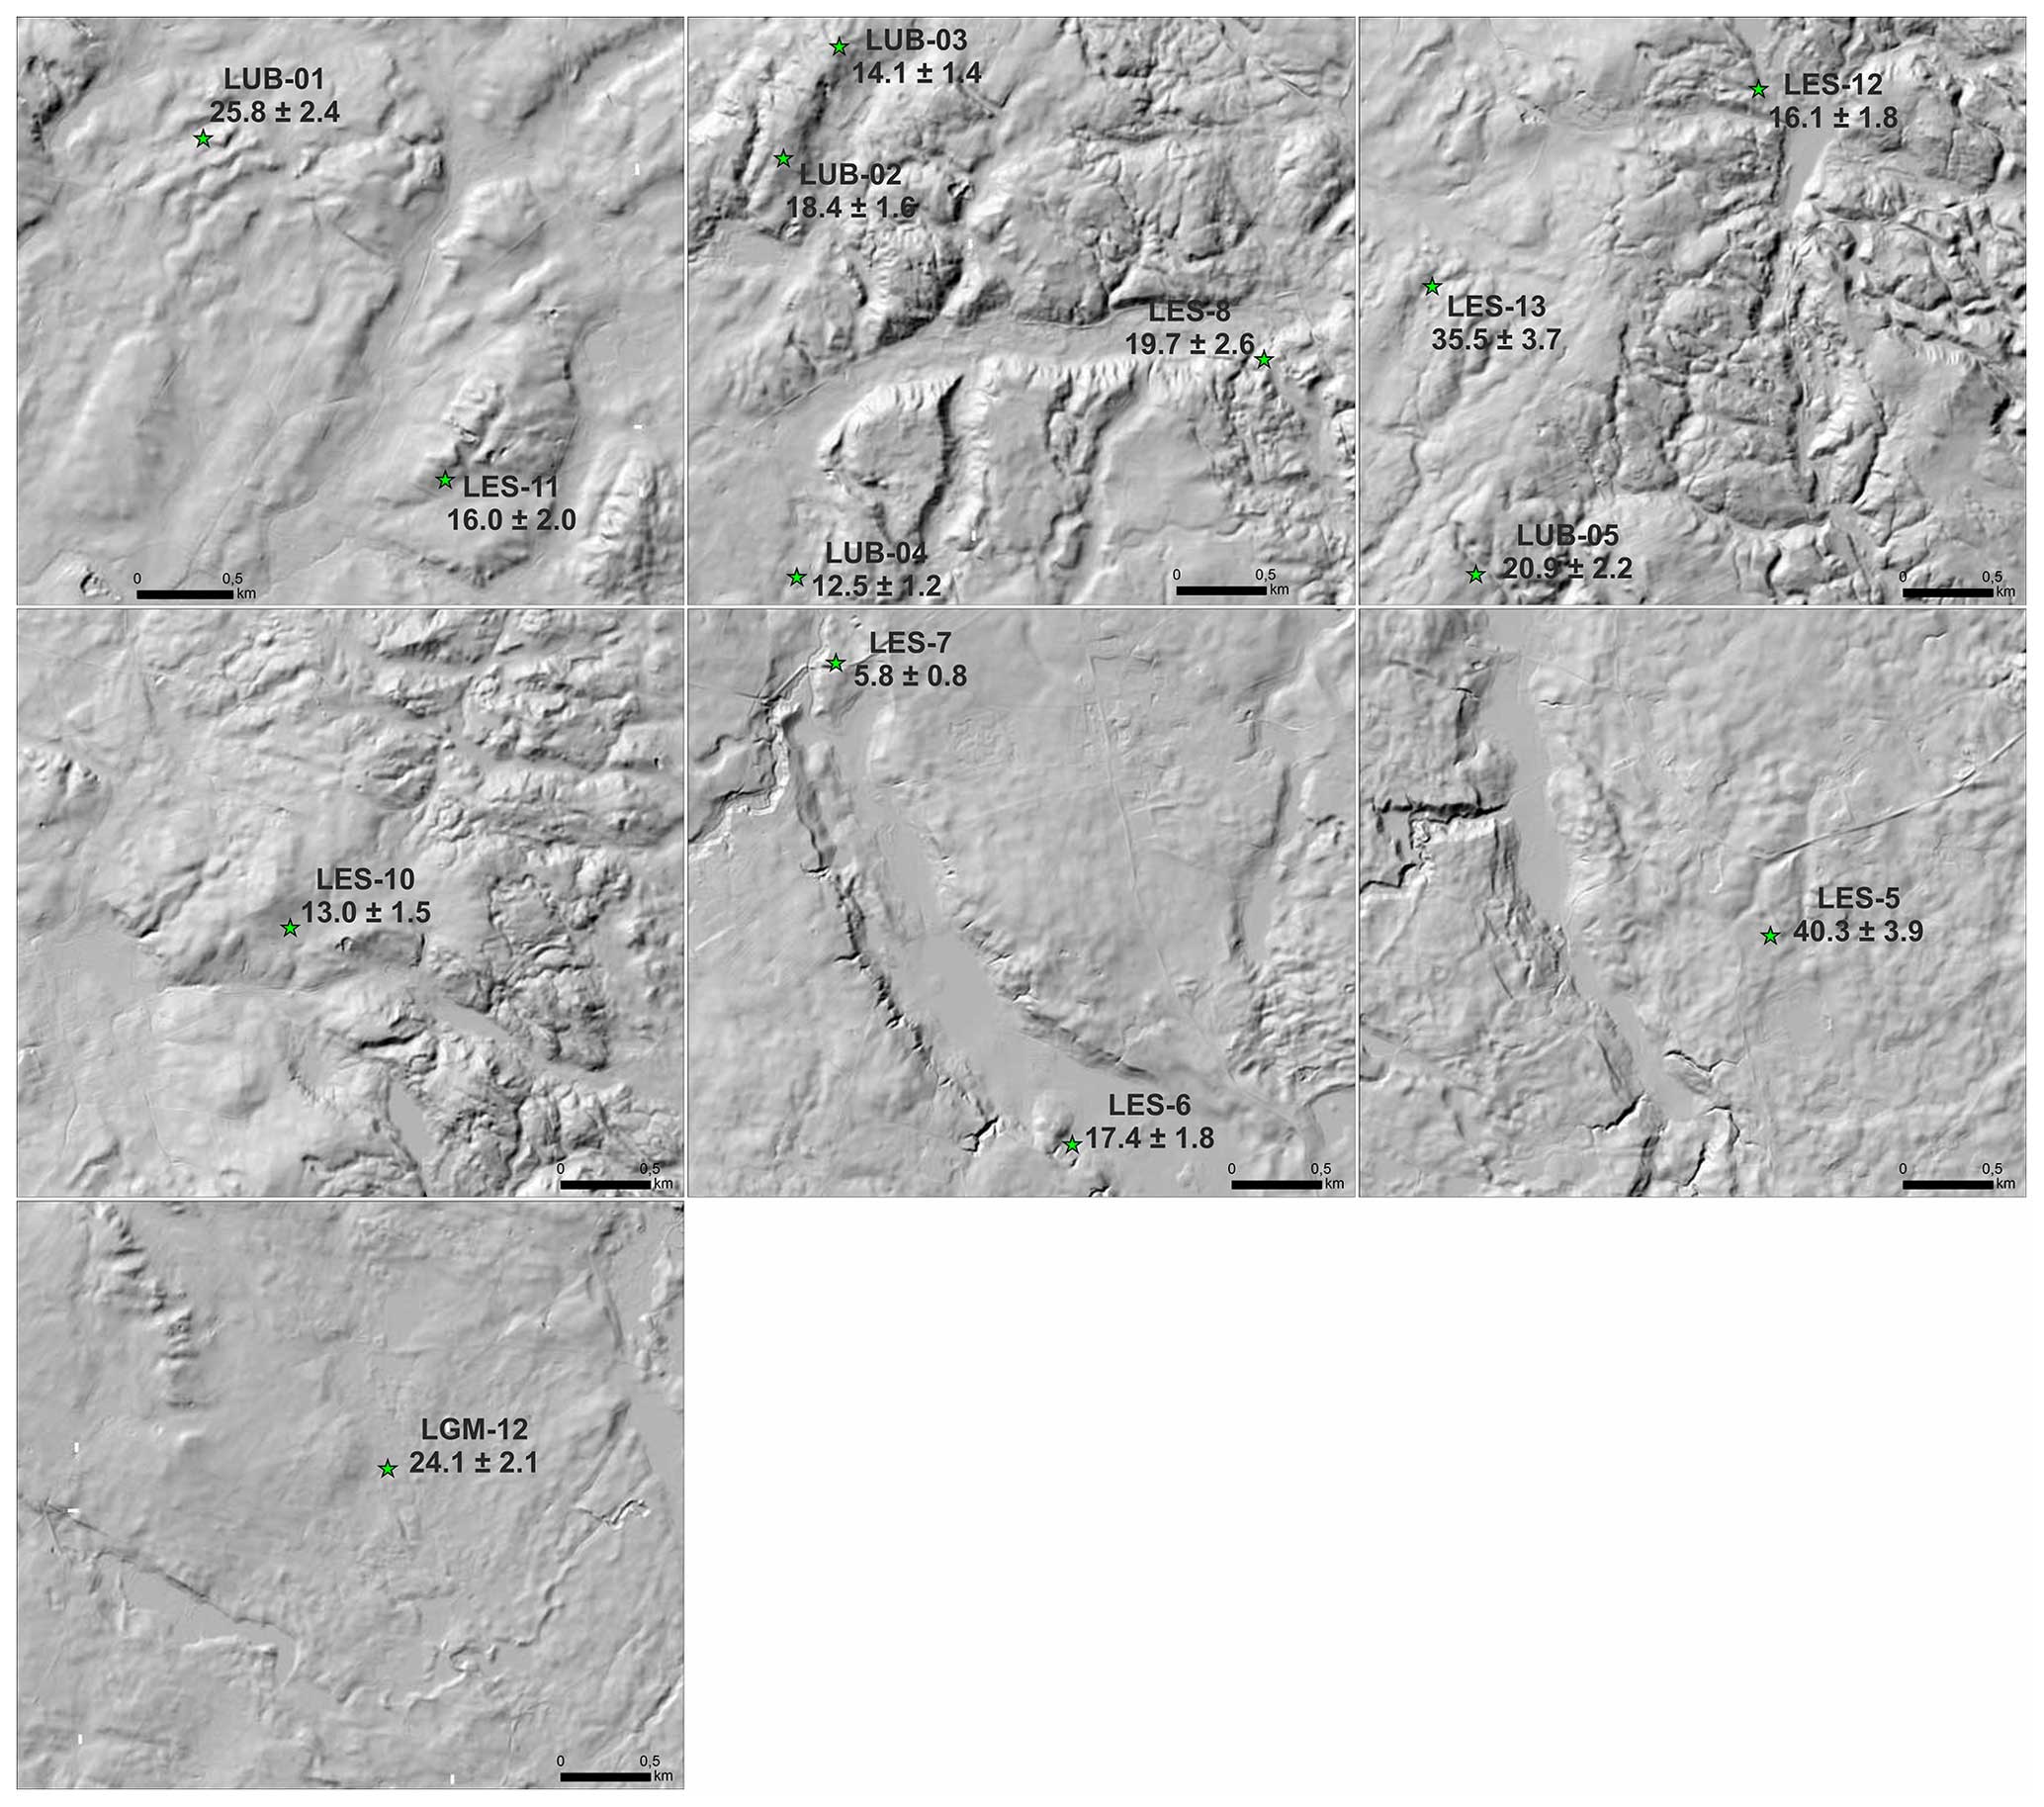
Figure A1Locations of erratic boulders used in this study against the high-resolution digital elevation model. Green stars indicate the positions of boulders, and sample symbols and surface exposure ages (ka) are also given. The digital elevation model with 1 m pixel size is based on lidar data from the resources of the Head Office of Geodesy and Cartography in Poland freely available at https://www.geoportal.gov.pl/ (last access: 21 November 2022).
The data that support the findings of this study are available upon reasonable request.
Georges Aumaître, Didier L. Bourlès, and Karim Keddadouche (Aix Marseille University, CNRS, IRD, INRAE, CEREGE, Aix-en-Provence, 13545, France)
KT was responsible for the conceptualisation of the study, fieldwork, sample preparation for 10Be dating, data analysis and interpretation, figure preparation as well as writing and editing of the manuscript. WW contributed to the fieldwork, sampling for OSL dating, analysing and interpreting the data as well as editing and proofreading of the manuscript. VR was responsible for sample preparation for the 10Be dating and contributed to editing and proofreading of the manuscript. PM was responsible for OSL dating and contributed to data analysis and proofreading of the manuscript. ABG was responsible for ICP-OES analysis. The ASTER team preformed AMS measurements of the ratios.
The contact author has declared that none of the authors has any competing interests.
Publisher’s note: Copernicus Publications remains neutral with regard to jurisdictional claims made in the text, published maps, institutional affiliations, or any other geographical representation in this paper. While Copernicus Publications makes every effort to include appropriate place names, the final responsibility lies with the authors.
This work was supported by the Polish National Science Centre (grant no. 2011/01/N/ST10/05880 to Karol Tylmann), the Polish Ministry of Science and Higher Education (grant no. N N306 316835 to Wojciech Wysota) and funding from the Faculty of Oceanography and Geography, University of Gdańsk. Karol Tylmann was also supported by a scholarship from the French Embassy in Poland and Campus France to conduct a 1-month research stay in Meudon. The ASTER AMS national facility (CEREGE, Aix-en-Provence) is supported by the INSU/CNRS, the ANR through the Projets thématiques d'excellence programme for the Equipements d'excellence ASTER-CEREGE action and IRD. We are grateful to the anonymous reviewers whose feedback significantly improved this work.
This research has been supported by the Narodowe Centrum Nauki (grant no. 2011/01/N/ST10/05880); the Ministerstwo Edukacji i Nauki (grant no. N N306 316835); the Statutory Research of the Faculty of Oceanography and Geography, University of Gdańsk; and a French Government Scholarship.
This paper was edited by Florence Colleoni and reviewed by two anonymous referees.
Aitken, M. J.: Thermoluminescence Dating, Academic Press, London., 359 pp., ISBN 0120463806, 1985.
Arnold, M., Merchel, S., Bourlès, D. L., Braucher, R., Benedetti, L., Finkel, R. C., Aumaître, G., Gottdang, A., and Klein, M.: The French accelerator mass spectrometry facility ASTER: Improved performance and developments, Nucl. Instrum.Meth. B, 268, 1954–1959, https://doi.org/10.1016/j.nimb.2010.02.107, 2010.
Balco, G., Stone, J. O., Lifton, N. A., and Dunai, T. J.: A complete and easily accessible means of calculating surface exposure ages or erosion rates from 10Be and 26Al measurements, Quat. Geochronol., 3, 174–195, https://doi.org/10.1016/j.quageo.2007.12.001, 2008.
Blomdin, R., Stroeven, A. P., Harbor, J. M., Lifton, N. A., Heyman, J., Gribenski, N., Petrakov, Caffee, M. W., Ivanov, M. N., Hättestrand, C., Rogozhina, I., and Usubaliev, R.: Evaluating the timing of former glacier expansions in the Tian Shan: A key step towards robust spatial correlations, Quaternary Sci. Rev., 153, 78–96, https://doi.org/10.1016/j.quascirev.2016.07.029, 2016.
Borchers, B., Marrero, S., Balco, G., Caffee, M., Goehring, B., Lifton, N., Nishiizumi, K., Philips, F., Schaefer, J., and Stone, J.: Geological calibration of spallation production rates in the CRONUS-Earth project, Quat. Geochronol., 31, 188–198, https://doi.org/10.1016/j.quageo.2015.01.009, 2016.
Bortolot, V. J.: A new modular high capacity OSL reader system, Radiat. Meas., 32, 751–757, https://doi.org/10.1016/S1350-4487(00)00038-X, 2000.
Braucher, R., Guillou, V., Bourlès, D. L., Arnold, M., Aumaître, G., Keddadouche, K., and Nottoli, E.: Preparation of ASTER in-house 10Be/9Be standard solutions, Nucl.Instrum. Meth. B, 361, 335–340, https://doi.org/10.1016/j.nimb.2015.06.012, 2015.
Brodzikowski, K. and van Loon, A. J.: A systematic classification of glacial and periglacial environments, facies and deposits, Earth Sci. Rev., 24, 297–381, https://doi.org/10.1016/0012-8252(87)90061-4, 1987.
Bronk Ramsey, C.: Bayesian analysis of radiocarbon dates, Radiocarbon, 51, 337–360, https://doi.org/10.1017/S0033822200033865, 2009a.
Bronk Ramsey, C.: Dealing with outliers and offsets in radiocarbon dating, Radiocarbon, 51, 1023–1045, https://doi.org/10.1017/S0033822200034093, 2009b.
Chmeleff, J., von Blanckenburg, F., Kossert, K., and Jakob, D.: Determination of the 10Be half-life by multicollector ICP-MS and liquid scintillation counting, Nucl. Instrum. Meth. B, 268, 192–199, https://doi.org/10.1016/j.nimb.2009.09.012, 2010.
Chiverrell, R. C., Thrasher, I. M., Thomas, G. S. P., Lang, A., Scourse, J. D., van Landeghem, K. J. J., Mccarroll, D., Clark, C. D., O'Cofaigh, C., Evans, D. J. A., and Ballantyne, C. K.: Bayesian modelling the retreat of the Irish Sea Ice Stream, J. Quaternary Sci., 28, 200–209, https://doi.org/10.1002/jqs.2616, 2013.
Clark, C. D., Sejrup, H. P., Bigg, G., Stocker, M., Lonergan, L., Raunholm, S., and Haflidason, H.: Did the punctuated demise of glacial ice in the North Sea affect thermohaline circulation of the ocean?, Eos Trans. AGU, 85, 293, https://doi.org/10.1029/2004EO310006, 2004.
Clark, P. U., Alley, R. B., and Pollard, D.: Northern Hemisphere Ice-Sheet Influences on Global Climate Change, Science, 286, 1104–1111, https://doi.org/10.1126/science.286.5442.1104, 1999.
Clayton, L., Attig, J. W., and Mickleson, D. M.: Tunnel channels formed in Wisconsin during the last glaciations, inn: Glacial Processes Past and Present, edited by: Mickelson, D. M. and Attig, J. W., Geological Society of America Special Paper, 337, 69–82, 1999.
Davis, B. J.: Cryospheric Geomorphology: Dating Glacial Landforms II: Radiometric Techniques, in: Treatise on Geomorphology (Second Edition), edited by: Shroder, J. F., Academic Press, 249–280, https://doi.org/10.1016/B978-0-12-818234-5.00040-7, 2022.
Dzierżek, J. and Zreda, M.: Timing and style of deglaciation of north-eastern Poland from cosmogenic 36Cl dating of glacial and glaciofluvial deposits, Geol. Q., 51, 203–216, 2007.
Ehlers, J., Grube, A., Stephan, H.-J., and Wansa, S.: Pleistocene glaciations of north Germany – new results, in: Quaternary Glaciations – Extent and Chronology: A Closer Look, edited by: Ehlers, J., Gibbard, P. L., and Hughes, P. D., Elsevier, Amsterdam, 149–162, https://doi.org/10.1016/B978-0-444-53447-7.00013-1, 2011.
Fuchs, M. and Owen, L. A.: Luminescence dating of glacial and associated sediments: review, re-commendations and future directions, Boreas, 37, 636–659, https://doi.org/10.1111/j.1502-3885.2008.00052.x, 2008.
Fyke, J. G., Sergienko, O. V., Lofverstrom, M., Price, S. F., and Lenaerts, J.: An overview of interactions and feedbacks between ice sheets and the Earth system, Rev. Geophys., 56, 361–408, https://doi.org/10.1029/2018RG000600, 2018.
Galbraith, R. F., Roberts, R. G., Laslett, G. M., Yoshida, H., and Olley, J. M.: Optical dating of single and multiple grains of quartz from Jinminum Rock Shelter, Northern 12 Australia. Part I, experimental design and statistical models, Archaeometry, 41, 1835–1857, https://doi.org/10.1111/j.1475-4754.1999.tb00988.x, 1999.
Gałązka, D.: Detailed Geological Map of Poland at the scale 1:50 000, sheet Iława, CAG PIG-PIB, Warszawa, ISBN 978-83-7538-937-1, 2003.
Gałązka, D.: Detailed Geological Map of Poland at the scale 1:50 000, sheet Lubawa, CAG PIG-PIB, Warszawa, ISBN 978-83-7538-963-0, 2006.
Gałązka, D.: Detailed Geological Map of Poland at the scale 1:50,000, sheet Rybno, CAG PIG-PIB, Warszawa, ISBN 978-83-7863-810-0, 2009.
Gałązka, D. and Marks, L.: Detailed Geological Map of Poland at the scale 1:50 000, sheet Dąbrówno., CAG PIG-PIB, Warszawa, ISBN 978-83-7863-101-9, 1997.
Gałązka, D., Rychel, J., and Krysiak, Z.: Glaciotectonic structures and dynamics of Weichselian ice-sheet, western slope of Lubawa Hummock, Prace Państwowego Instytutu Geologicznego, 194, 27–34, 2009 (in Polish).
Greenwood, S. L., Clark, C. D., and Hughes, A. L. C.: Formalising an inversion methodology for reconstructing ice-sheet retreat patterns from meltwater channels: application to the British Ice Sheet, J. Quaternary Sci., 22, 637–645, https://doi.org/10.1002/jqs.1083, 2007.
Greve, R. and Blatter, H.: Dynamics of Ice Sheets and Glaciers. Advances in Geophysical and Environmental Mechanics and Mathematics, Springer, Berlin, Heidelberg, https://doi.org/10.1007/978-3-642-03415-2, 2009.
Guerin, G., Mercier, N., and Adamiec, G.: Dose-rate conversion factors: update, Ancient TL, 29, 5–8, 2011.
Hahn, L., Ummenhofer, C. C., and Kwon Y.-O.: North Atlantic Natural Variability Modulates Emergence of Widespread Greenland Melt in a Warming Climate, Geophys. Res. Lett., 45, 9171–9178, https://doi.org/10.1029/2018GL079682, 2018.
Heyman, J., Stroeven, A. P., Harbor, J. M., and Caffee, M. W.: Too young or too old: Evaluating cosmogenic exposure dating based on an analysis of compiled boulder exposure ages, Earth Planet. Sc. Lett., 302, 71–80, https://doi.org/10.1016/j.epsl.2010.11.040, 2011.
Hughes, A. L. C., Winsborrow, M. C. M., and Greenwood, S. L.: European Ice Sheet Complex evolution during the Last Glacial Maximum (29–19 ka), in: European Glacial Landscapes, edited by: Palacios, D., Hughes, P. D., García-Ruiz, J. M., and Andrés, N., Maximum Extent of Glaciations, Elsevier, 361–372, https://doi.org/10.1016/B978-0-12-823498-3.00038-8, 2022.
King, G. E., Robinson, R. A. J., and Finch, A. A.: Towards successful OSL sampling strategies in glacial environments: deciphering the influence of depositional processes on bleaching of modern glacial sediments from Jostedalen, Southern Norway, Quaternary Sci. Rev., 89, 94–107, https://doi.org/10.1016/j.quascirev.2014.02.001, 2014.
Korschinek, G., Bergmaier, A., Faestermann, T., Gerstmann, U. C., Knie, K., Rugel, G., Wallner, A., Dillmann, I., Dollinger, G., and von Gostomski, C. L.: A new value for the half-life of 10Be by Heavy-Ion Elastic Recoil Detection and liquid scintillation counting, Nucl. Instrum. Meth. B, 268, 187–191, https://doi.org/10.1016/j.nimb.2009.09.020, 2010.
Kozarski, S.: Deglaciation of northwestern Poland: environmental conditions and geosystem transformation (20 ka–10 ka BP), Dokumentacja Geograficzna, 1, 1–82, 1995 (in Polish with English summary).
Kreutzer, S., Schmidt, C., Fuchs, M. C., Dietze, M., Fischer, M., and Fuchs, M.: Introducing an R package for luminescence dating analysis, Ancient TL, 30, 1–8, 2012.
Kurjański, B., Rea, B. R., Spangnolo, M., Cornwell, D. G., Howell, J., and Archer, S.: A conceptual model for glaciogenic reservoirs: from landsystems to reservoir architecture, Mar. Petrol. Geol., 115, 104205, https://doi.org/10.1016/j.marpetgeo.2019.104205, 2020.
Lal, D.: Cosmic ray labeling of erosion surfaces: In situ nuclide production rates and erosion models, Earth Planet. Sc. Lett., 104, 424–439, https://doi.org/10.1016/0012-821X(91)90220-C, 1991.
Levy, L. B., Kelly, M. A., Applegate, P. A., Howley, J. A., and Virginia, R. A.: Middle to late Holocene chronology of the western margin of the Greenland Ice Sheet: A comparison with Holocene temperature and precipitation records, Arct. Antarct. Alp. Res., 50, S100004, https://doi.org/10.1080/15230430.2017.1414477, 2018.
Lüthgens, C. and Bose, M.: From morphostratigraphy to geochronology – on the dating of ice marginal positions, Quaternary Sci. Rev., 44, 26–36, https://doi.org/10.1016/j.quascirev.2010.10.009, 2012.
Marks, L.: Foreland influence on Ice-Sheet Movement during the Vistulian (Würn) Glaciation: the Case of the Lubawa Elevation (Mazury Lakeland), Bulletin de L'academe Polonaise des Sciences, 26, 203–213, 1979.
Marks, L.: Timing of the Late Vistulian (Weichselian) glacial phases in Poland, Quaternary Sci. Rev., 44, 81–88, https://doi.org/10.1016/j.quascirev.2010.08.008, 2012.
Marks, L., Ber, A., Gogołek, W., and Piotrowska, K. (Eds.): Geological Map of Poland 1:500 000, Ministerstwo Środowiska, PIG-PIB, Warszawa, ISBN 83-7372-853-8, 2006.
Marks, L., Bitinas, A., Błaszkiewicz, M., Börner, A., Guobyte, R., Rinterknecht, V., and Tylmann, K.: Northern Central Europe: glacial landforms from the Last Glacial Maximum, in: European Glacial Landscapes, edited by: Palacios, D., Hughes, P. D., García-Ruiz, J. M., and Andrés, N., Maximum Extent of Glaciations, Elsevier, 381–388, https://doi.org/10.1016/B978-0-12-823498-3.00054-6, 2022.
Moska, P., Bluszcz, A., Poręba, G., Tudyka, K., Adamiec, G., Szymak, A., and Przybyła, A.: Luminescence dating procedures at Gliwice luminescence dating laboratory, Geochronometria, 48, 1–15, https://doi.org/10.2478/geochr-2021-0001, 2021.
Murray, A. S. and Wintle, A. G.: Luminescence dating of quartz using an improved single-aliquot regenerative-dose protocol, Rad. Meas., 32, 57–73, https://doi.org/10.1016/S1350-4487(99)00253-X, 2000.
Nawrocki, J., Bogucki, A. B., Gozhik, P., Łanczont, M., Pańczyk, M., Standzikowski, K., Komar, M., Rosowiecka, O., and Tomeniuk, O.: Fluctuations of the Fennoscandian Ice Sheet recorded in the anisotropy of magnetic susceptibility of periglacial loess from Ukraine, Boreas, 48, 940–952, https://doi.org/10.1111/bor.12400, 2019.
NGRIP-members: High resolution climate record of the northern hemisphere reaching into the last interglacial period, Nature 431, 147–151, https://doi.org/10.1038/nature02805, 2004.
Niewiarowski, W.: Pleni- and Late Vistulian glacial lakes, their sediments and landforms: a case study from the young glacial landscape of Northern Poland, Prace Geograficzne, 128, 133–142, 2003.
Niewiarowski, W., Olszewski, A., and Wysota, W.: The role of subglacial features in glacial morphogenesis of Kujawy-Dobrzyń subphase area in the southern and eastern part of the Chełmno-Dobrzyń Lakeland, Quaternary Studies in Poland, 13, 65–76, 1995.
Noble, T. L., Rohling, E. J., Aitken, A. R. A., Bostock, H. C., Chase, Z., Gomez, N., Jong, L. M., King, M. A., Mackintosh, A. N., McCormack, F. S., McKay, R. M., Menviel, L., Phipps, S. J., Weber, M. E., Fogwill, C. J., Gayen, B., Golledge, N. R., Gwyther, D. E., Hogg, A. McC., Martos, Y. M., Pena-Molino, B., Roberts, J., van de Flierdt, T., and Williams, T.: The Sensitivity of the Antarctic Ice Sheet to a Changing Climate: Past, Present, and Future, Rev. Geophys., 58, e2019RG000663, https://doi.org/10.1029/2019RG000663, 2020.
Prescott, J. R. and Stephan, L. G.: The contribution of cosmic radiation to the environmental dose for thermoluminescence dating, Latitude, altitude and depth dependencies, Pact, 6, 17–25, 1982.
Rea, B. R., Newton, A. M. W., Lamb, R. M., Harding, R., Bigg, G. R., Rose, P., Spagnolo, M., Huuse, M., Cater, J. M. L., Archer, S., Buckley, F., Halliyeva, M., Huuse, J., Cornwell, D. G., Brocklehurst, S. H., and Howell, J. A.: Extensive marine-terminating ice sheets in Europe from 2.5 million years ago, Sci. Adv., 4, eaar8327, https://doi.org/10.1126/sciadv.aar8327, 2018.
Rinterknecht, V. R., Marks, L., Piotrowski, J. A., Raisbeck, G. M., Yiou, F., Brook, E. J., and Clark, P. U.: Cosmogenic 10Be ages on the Pomeranian moraine, Poland, Boreas, 34, 186–191, https://doi.org/10.1111/j.1502-3885.2005.tb01014.x, 2005.
Rinterknecht, V. R., Clark, P. U. M., Raisbeck, G. M., Yiou, F., Bitinas, A., Brook, E. J., Marks, L., Zelcs, V., Lunkka, J. P., Pavlovskaya, I. E., Piotrowski, J. A., and Raukas, A.: The last deglaciation of the southeastern sector of the Scandinavian Ice Sheet, Science, 311, 1449–1452, https://doi.org/10.1126/science.1120702, 2006.
Soulet, G., Menot, G., Bayon, G., Rostek, F., Ponzevera, E., Toucanne, S., Lericolais, G., and Bard, E.: Abrupt drainage cycles of the Fennoscandian Ice Sheet, P. Natl. Acad. Sci. USA, 110, 6682–6687, https://doi.org/10.1073/pnas.1214676110, 2013.
Stone, J.: Air pressure and cosmogenic isotope production, J. Geophys. Res., 105, 23753–23760, https://doi.org/10.1029/2000JB900181, 2000.
Stroeven, A. P., Heyman, J., Fabel, F., Björck, S., Caffee, M. W., Fredin, O., and Harbor, J. M.: A new Scandinavian reference 10Be production rate, Quat. Geochronol., 29, 104–115, https://doi.org/10.1016/j.quageo.2015.06.011, 2015.
Stroeven, A. P., Hattestrand, C., Kleman, J., Heyman, J., Fabel, D., Fredin, O., Goodfellow, B. W., Harbor, J. M., Jansen, J. D., Olsen, L., Caffee, M. W., Fink, D., Lundqvist, J., Rosqvist, G. C., Stromberg, B., and Jansson, K. N.: Deglaciation of Fennoscandia, Quaternary Sci. Rev., 147, 91–121, https://doi.org/10.1016/j.quascirev.2015.09.016, 2016.
Toucanne, S., Zaragosi, S., Bourillet, J. F., Naughton, F., Cremer, M., Eynaud, F., and Dennielou, B.: Activity of the turbidite levees of the Celtic-Armorican margin (Bay of Biscay) during the last 30,000 years: imprints of the last European deglaciation and Heinrich events, Mar. Geol., 247, 84–103, 2008.
Toucanne, S., Zaragosi, S., Bourillet, J. F., Cremer, M., Eynaud, F., Turon, J. L., Fontanier, C., Van Vliet Lanoë, B., and Gibbard, P.: Timing of massive “Fleuve Manche” discharges over the last 350 kyr: insights into the European Ice Sheet oscillations and the European drainage network from MIS 10 to 2, Quaternary Sci. Rev., 28, 1238–1256, https://doi.org/10.1016/j.quascirev.2009.01.006, 2009.
Toucanne, S., Zaragosi, S., Bourillet, J.-F., Marieu, V., Cremer, M., Kageyama M., Van Vliet-Lanoë, B., Eynaud, F., Turon, J.-F., and Gibbard, P. L.: The first estimation of Fleuve Manche palaeoriver discharge during the last deglaciation: evidence for Fennoscandian ice sheet meltwater flow in the English Channel ca 20-18 ka ago, Earth Planet. Sc. Lett., 290, 459–473, https://doi.org/10.1016/j.epsl.2009.12.050, 2010.
Toucanne, S., Soulet, G., Freslon, N., Jacinto, R. S., Dennielou, B., Zaragosi, S., Eynaud, F., Bourillet, J.-F., and Bayon, G.: Millennial-scale fluctuations of the European Ice Sheet at the end of the last glacial, and their potential impact on global climate, Quaternary Sci. Rev., 123, 113–133, https://doi.org/10.1016/j.quascirev.2015.06.010, 2015.
Tylmann, K.: Dynamics of glacial processes in the area of the Lubawa Upland, PhD thesis, Nicolaus Copernicus University Archive, Toruń, 156 pp., 2014.
Tylmann, K. and Wysota, W.: Origin and transformation of morainic landscape in NW part of Lubawa Upland (north Poland), Przegląd Geologiczny, 59, 739–750, 2011 (in Polish).
Tylmann, K., Wysota, W., and Piotrowski, J. A.: Palimpsest terminal moraines in NW part of Lubawa Upland – structure and mechanisms of formation, Landform Analysis, 25, 143–157, https://doi.org/10.12657/landfana.025.013, 2014.
Tylmann, K., Rinterknecht, V. R., Woźniak, P. P., Bourlès, D., Schimmelpfennig, I., Guillou, V., and ASTER Team: The Local Last Glacial Maximum of the southern Scandinavian Ice Sheet front: Cosmogenic nuclide dating of erratics in northern Poland, Quaternary Sci. Rev., 219, 36–46, https://doi.org/10.1016/j.quascirev.2019.07.004, 2019.
Tylmann, K., Rinterknecht, V., Woźniak, P. P., Guillou, V., and ASTER Team: Asynchronous dynamics of the last Scandinavian Ice Sheet along the Pomeranian ice-marginal belt: A new scenario inferred from surface exposure 10Be dating, Quaternary Sci. Rev., 294, 107755, https://doi.org/10.1016/j.quascirev.2022.107755, 2022.
Wełniak, A.: Detailed Geological Map of Poland at the scale 1:50 000, sheet Nowe Miasto Lubawskie, CAG PIG-PIB, Warszawa, ISBN 83-7372-832-5, 2002.
Wysota, W., Molewski, P., and Sokołowski, R. J.: Record of the Vistula ice lobe advances in the Late Weichselian glacial sequence in north-central Poland, Quatern. Int., 207, 26–41, https://doi.org/10.1016/j.quaint.2008.12.015, 2009.
Zaragosi, S., Eynaud, F., Pujol, C., Auffret, G. A., Turon, J. L., and Garlan, T.: Initiation of the European deglaciation as recorded in the northwestern Bay of Biscay slope environments (Meriadzek Terrace and Trevelyan Escarpment): a multi-proxy approach, Earth Planet. Sc. Lett., 188, 493–507, https://doi.org/10.1016/S0012-821X(01)00332-6, 2001.
Zaragosi, S., Bourillet, J. F., Eynaud, F., Toucanne, S., Denhard, B., Van Toer, A., and Lanfumey, V.: The impact of the last European deglaciation on the deep-sea turbidite systems of the Celtic–Armorican margin (Bay of Biscay), Geo-Mar. Lett., 26, 317–329, https://doi.org/10.1007/s00367-006-0048-9, 2006.