the Creative Commons Attribution 4.0 License.
the Creative Commons Attribution 4.0 License.
 | 18 Apr 2024
Temperature-dominated spatiotemporal variability in snow phenology on the Tibetan Plateau from 2002 to 2022
Jiahui Xu
Yao Tang
Linxin Dong
Shujie Wang
Bailang Yu
Jianping Wu
Zhaojun Zheng
Yan Huang
A detailed understanding of snow cover and its possible feedback on climate change on the Tibetan Plateau (TP) is of great importance. However, spatiotemporal variability in snow phenology (SP) and its influencing factors on the TP remain unclear. Based on the daily gap-free snow cover product (HMRFS-TP) with 500 m resolution, this study investigated the spatiotemporal variability in snow cover days (SCDs), snow onset date (SOD), and snow end date (SED) on the TP from 2002 to 2022. A structural equation model was used to quantify the direct and indirect effects of meteorological factors, geographical location, topography, and vegetation greenness on SP. The results indicate that the spatial distribution of SP on the TP was extremely uneven and exhibited temporal heterogeneity. SP showed vertical zonality influenced by elevation (longer SCD, earlier SOD, and later SED at higher elevations). A total of 4.62 % of the TP area had a significant decrease in SCDs, at a rate of −1.74 d yr−1. The SOD of 2.34 % of the TP area showed a significant delayed trend, at a rate of 2.90 d yr−1, while the SED of 1.52 % of the TP area had a significant advanced trend, at a rate of at −2.49 d yr−1. We also found a strong elevation dependence for the trend in SCDs (). Air temperature, precipitation, wind speed, and shortwave radiation can directly affect SP as well as indirectly affect it by influencing the growth of vegetation, whereas the direct effect was much greater than the indirect effect. Geographical location (latitude and longitude) and topographic conditions (elevation and slope) indirectly affected SP by modulating meteorological conditions and the growth of vegetation. Vegetation primarily influences SP by intercepting the snow and regulating the balance of the solar radiation budget. Regarding the total effect, air temperature was found to be the dominant factor. This study contributes to the understanding of snow variation in response to global warming over the past 2 decades by providing a basis for predicting future environmental and climate changes and their impacts on the TP.
- Article
(13117 KB) - Full-text XML
- BibTeX
- EndNote


The rapid accumulation and melting of snow make it one of the most active natural materials on the Earth's surface (Gutzler and Rosen, 1992; Ma et al., 2023). The Tibetan Plateau (TP) is one of the most sensitive regions to climate change because of its unstable alpine ecosystems and fragile natural environment (Huang et al., 2017). In the past 50 years, temperature has risen at a rate of about 0.37 °C per decade on the TP (You et al., 2021). Rising temperatures inevitably affect snow accumulation and melting processes, exemplified by variations in snow phenology (SP), including snow cover days (SCDs), snow onset date (SOD), and snow end date (SED) (Chen et al., 2015; Ma et al., 2020). Variations in SP can in turn affect terrestrial ecosystems and feedback on regional climate (Cherkauer and Sinha, 2008). Early snowmelt also causes substantial variability in the onset date and amount of snowmelt runoff, increasing the incidence of disasters (e.g., floods) (Fyfe et al., 2017). A detailed understanding of the variability in SP and its possible feedback on climate change is of great significance to the hydrological cycle (Kraaijenbrink et al., 2021), ecological balance (Keyser et al., 2022), and societal security (Wang et al., 2017) on the TP.
There are typical interannual variations in the SP on the TP. Ground-measured measurements and remote sensing data have been extensively used in recent decades to better understand these changes (Ma et al., 2022; Notarnicola, 2020). Remote sensing is beneficial in high-elevation areas where few ground-measured measurements are obtainable (Huang et al., 2022a). Passive microwave satellite (e.g., SMMR, SSM/I, and AMSE-R) and multispectral satellite (e.g., Landsat, Sentinel-2, and MODIS) data are widely used to retrieve snow information and reveal its variability (Chen et al., 2018). Although passive microwave data are available over an extended period, the spatial resolution (∼ 10–25 km) is relatively coarse (Huang et al., 2017). Landsat and Sentinel-2 have a high spatial resolution (∼ 10–30 m) but a relatively coarse temporal resolution (10 or 16 d), inadequate for monitoring temporal variability in SP (Huang et al., 2022a). Currently, the most widely available snow data used for the TP are the daily MODIS snow product (Hall et al., 1995), which has revealed that the SP on the TP has undergone changes in the last 2 decades (Ma et al., 2023; Tang et al., 2022; Wang et al., 2017). In addition, owing to the complex topography of the TP, elevation may have a particular impact on SP. However, it is still unclear whether trends in SP are elevation-dependent (Ma et al., 2023; Wang et al., 2021). Moreover, since the original daily MODIS images have data gaps due to cloud cover and relatively low estimation accuracy due to the complex topography of the TP (Huang et al., 2022b), most previous studies used relatively simple methods to fill data gaps and did not consider topographic effects. Using snow products without topographic corrections may result in inaccurate extraction of SP, further affecting the analysis result of interannual variations. Huang et al. (2022b) generated a daily gap-free snow product on the TP by employing a hidden Markov random field (HMRF) framework to the MODIS product (HMRFS-TP). The data gaps were filled by optimally integrating spatiotemporal, spectral, and environmental information. The accuracy of HMRFS-TP was significantly improved over the complex topography, providing spatiotemporally continuous information on snow distribution over an extended period with high accuracy.
Regarding the influencing factors on SP of the TP, previous studies have highlighted a complex and heterogeneous situation in which SP is driven by meteorological factors, topographic conditions, geographical location, and vegetation greenness (Pulliainen et al., 2020; Qi et al., 2021; You et al., 2020). The impact of air temperature and precipitation on snow cover has been extensively studied (Li et al., 2022; Tarca et al., 2022). However, SP is also closely associated with other meteorological factors, such as wind and humidity. But their quantitative influence on SP on the TP has not been discussed further (Ma et al., 2022; Xie et al., 2017). Topographic characteristics (Guo et al., 2022) and vegetation greenness (Qi et al., 2021) are also considered responsible for SP. Elevation is an essential factor that influences SP because snow accumulates more at higher elevations. Steeper slopes may receive less snow than flatter ones due to gravitational pull (Li et al., 2011). Vegetation greenness changes the snow redistribution process by intercepting snow and affects the spatial pattern and melt rate of surface snow by regulating the solar radiation budget balance (Barrere et al., 2018).
Although much research has examined the variability in the SP and its influencing factors on the TP, uncertainties and limitations remain. Previous studies have mainly focused on the response of SP to temperature and precipitation, but few studies have quantitatively explored other associated factors influencing SP. Additionally, many analyses have primarily focused on examining the relationship between SP and individual influencing factors, without taking into account the interrelationships among these factors. Associated factors may have both direct and indirect impacts on SP. For example, temperature can affect SP directly, as well as indirectly by influencing the growth of vegetation (Qi et al., 2021). The specific process by which each factor influences SP (i.e., directly or indirectly) has not been elucidated. The structural equation model (SEM) is a suitable method for studying such a coupling relationship, which can quantitatively explain the direct and indirect relationships between factors (Grace et al., 2010; Shen et al., 2022; Zhang et al., 2022). Here we adopt this approach to explore the mediating effects between SP and associated factors.
In this study, we conducted a comprehensive investigation on the spatiotemporal variability in SP on the TP over the past 2 decades (2002–2022), based on the daily gap-free HMRFS-TP dataset, and further quantified the influence of associated factors on SP. The main goals are to (1) calculate SP parameters (SCD, SOD, and SED) and analyze their spatiotemporal variability, (2) examine whether the trends in SP are elevation-dependent, and (3) quantify the direct and indirect effects of associated factors on SP.
2.1 Study area
The TP (26°00′12′′ N–39°46′50′′ N, 73°18′52′′ E–104°46′59′′ E; Fig. 1) is the largest snow cover area in the middle latitudes of the Northern Hemisphere, with 105 km2 of glaciers and an annual snowfall of 41.9 × 10⁹ m3 (Yao et al., 2012). The southeastern TP is warm and moist, while the northwestern TP is cold and dry. The average annual temperature ranges from −6 to 20 °C and the average annual precipitation ranges from 150 to 800 mm (Wang et al., 2023). Temperature in its permafrost region is rising at about 3 times the speed of global warming (Wang et al., 2022). As a topographic barrier, the TP forces air masses up and produces cooling effects (Wu et al., 2015) and further influences the thermodynamic properties of atmospheric circulation, strength, and duration of Asian monsoon systems, global climate, and energy budget (Fan et al., 2019). It is the source of several prominent Asian rivers (e.g., the Yellow River, Yangtze, Indus, and Mekong), which are primarily fed and regulated by meltwater from glaciers and snow (Chen et al., 2022).
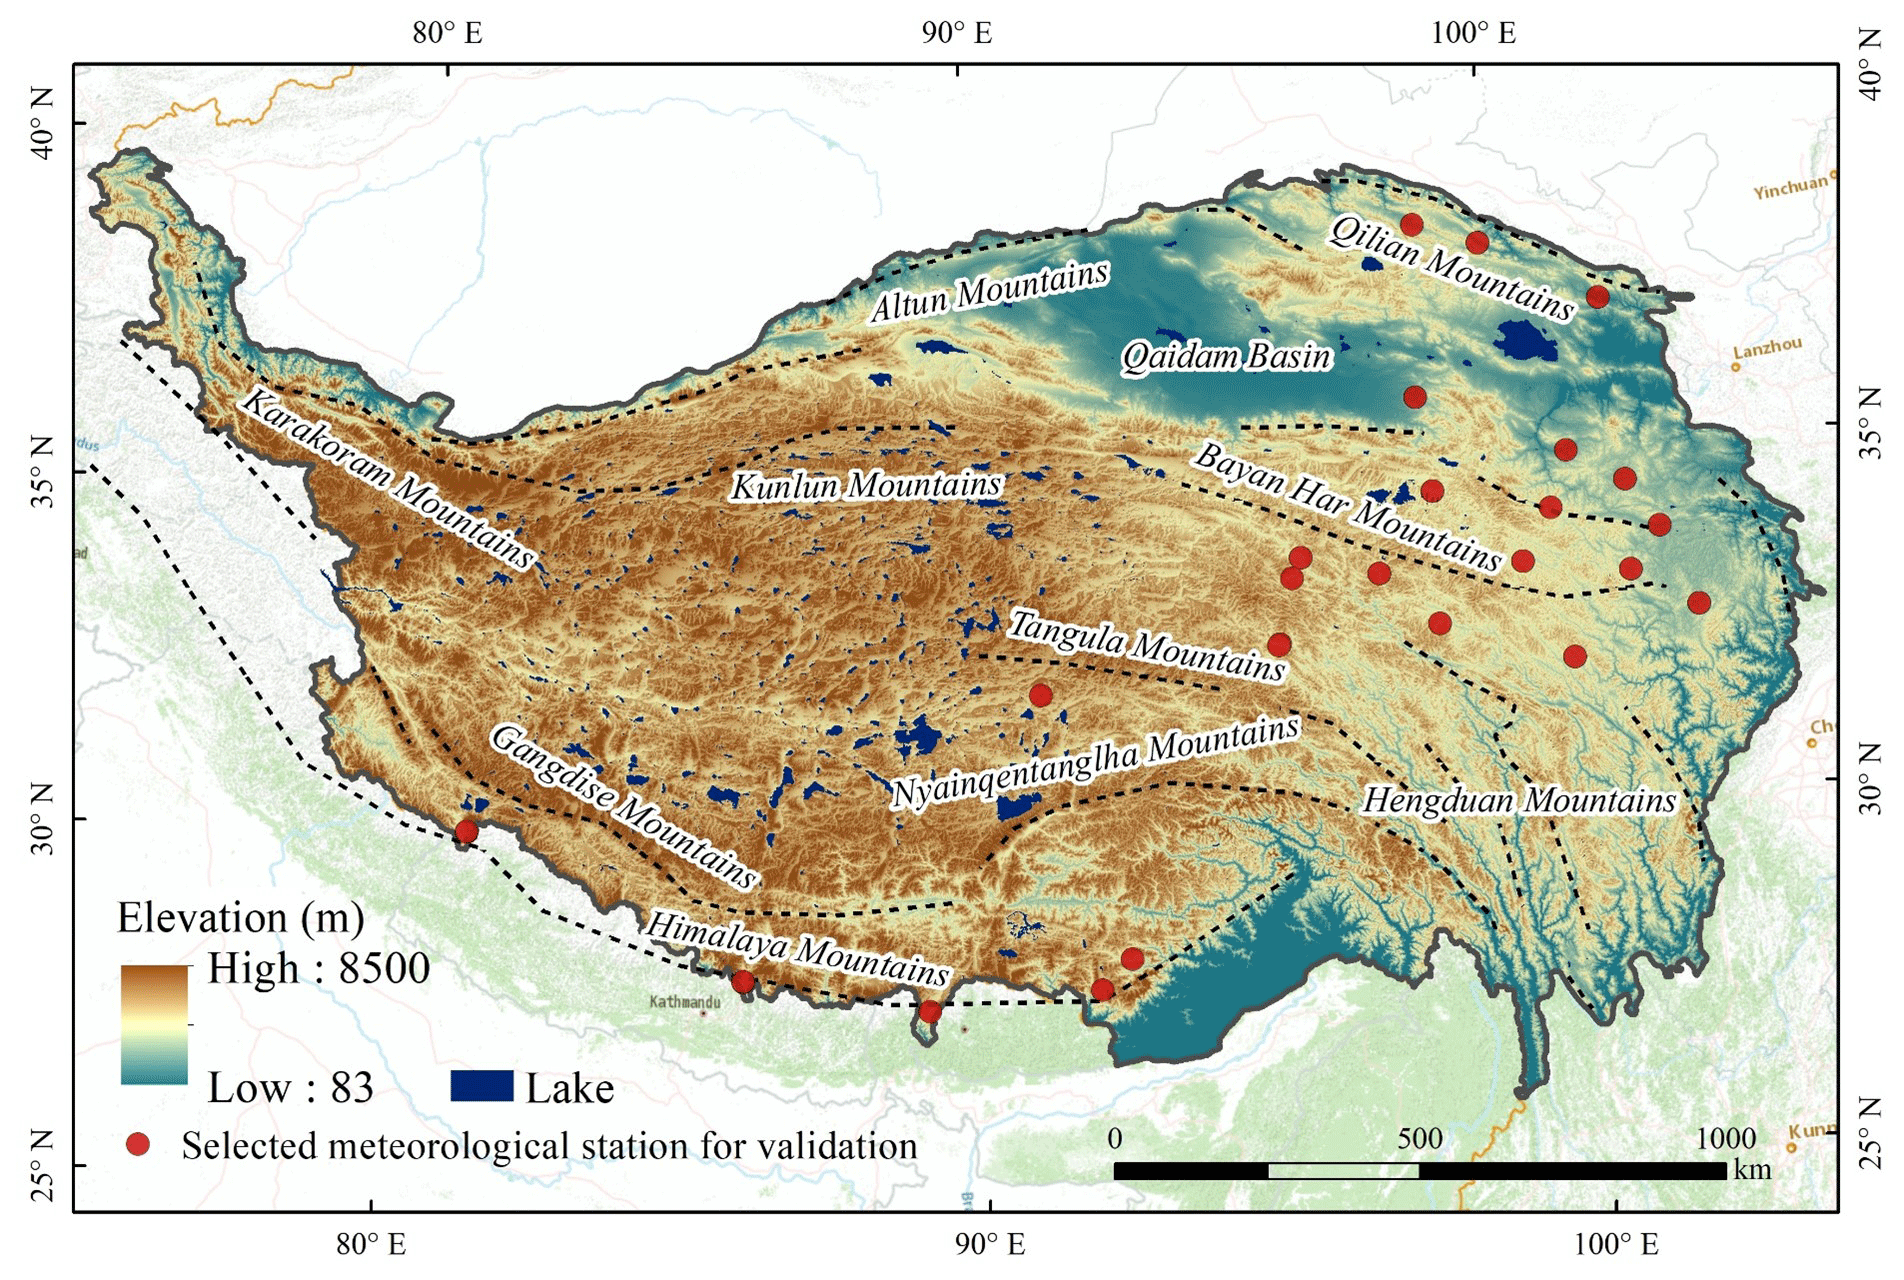
Figure 1Topography, lakes, and distribution of selected meteorological stations for validation on the Tibetan Plateau (TP) (base map from ESRI).
2.2 Datasets
2.2.1 Snow cover product
The daily gap-free HMRFS-TP at 500 m resolution from 2002 to 2022 was used to extract SP (Huang et al., 2022b). The HMRF technique produces a dataset (Huang et al., 2018) that optimally couples spatiotemporal, spectral, and environmental information to fill data gaps in original MODIS images. The accuracy of the HMRFS-TP is 91.36 % and 98.29 % based on snow maps derived from Landsat images and in situ observations, respectively. The estimation accuracy is notably improved in snow transitional periods and complex topography with higher elevations and sunny conditions. To determine the SP (including SCD, SOD, and SED), we specify the snow season from 1 September of the previous year to 31 August of the current year (Tang et al., 2022). The snow accumulation season is defined as from 1 September of the previous year to 28 (or 29) February of the current year, and the snowmelt season is from 1 March to 31 August of the current year (Ma et al., 2023). The SP for 20 snow seasons from 1 September 2002 to 31 August 2022 was extracted based on the long-term HMRFS-TP dataset.
2.2.2 Meteorological data
We used a daily meteorological dataset at ° resolution from 2002 to 2022 to investigate the impact of meteorological factors on SP, including air temperature, precipitation, specific humidity, wind speed, and downward shortwave radiation. This dataset was generated by integrating in situ observations, remote sensing, and a reanalysis dataset (He et al., 2020; Yang et al., 2023). All daily meteorological data were resampled to 500 m to maintain consistency with the MODIS snow product. We calculated average air temperature, average humidity, average wind speed, total precipitation, and total shortwave radiation for each snow season, snow accumulation season, and snowmelt season to examine their relationship with SCD, SOD, and SED, respectively (Chen et al., 2018; Ma et al., 2023).
2.2.3 Digital elevation model (DEM)
The 30 m DEM data, available from the USGS Earth Explorer (https://earthexplorer.usgs.gov, last access: 21 March 2023), were resampled to 500 m resolution. Topographical parameters including elevation, slope, and aspect were calculated from it.
2.2.4 Land surface reflectance product
Compared with other vegetation indexes, the normalized difference greenness index (NDGI) (Yang et al., 2019) has been proven to more accurately represent the vegetation greenness growth status in snow-covered areas such as the TP (Xu et al., 2022a, b). Here, we calculated the NDGI based on MODIS Terra surface reflectance MOD09A1 with 500 m resolution and an 8 d repeat cycle from 2002 to 2022 (Vermote, 2021). The bands 4, 1, and 2 of MOD09A1 were used to calculate the NDGI. The maximum complex method was implemented to filter noise and fill data gaps owing to cloud and atmosphere in NDGI series (Xu et al., 2022b). The average NDGI was calculated for each snow season, snow accumulation season, and snowmelt season.
2.2.5 Auxiliary data
Snow depth recorded from meteorological stations was used as the reference value (ground-observed SP) to validate the accuracy of the satellite-derived SP parameters. Due to instrument machine failure or human-made errors, not all meteorological stations (approximately 137) on the TP recorded snow depth values every day. This resulted in many data gaps during the snow season, which were not sufficiently continuous to extract ground-observed SP. Therefore, 24 meteorological stations with daily records were selected for validation (Fig. 1).
Figure 2 illustrates the workflow of this study. The SP parameters (SCD, SOD, and SED) were first extracted from the daily HMRFS-TP dataset, and their spatiotemporal variability were analyzed. We then adopted SEM to quantify the direct and indirect effects of associated factors on SP. The impact of relatively important factors on SP was discussed in further depth.

Figure 2Flowchart to reveal the spatiotemporal variability in snow phenology (SP) and the direct and indirect effects of associated factors on the TP from 2002 to 2022. SEM refers to the structural equation model.
3.1 Snow phenology extraction and accuracy assessment
Three parameters, SCD, SOD, and SED, were derived to describe SP in each snow season and were calculated from the daily HMRFS-TP dataset at the pixel level. SCD is the sum of days when a pixel is covered by snow across the snow season. SOD is the first date when a pixel is covered with snow and stays at least 5 d in a snow season. SED is the last date on which a pixel was identified as snow for 5 consecutive days (Tang et al., 2022). Using a threshold value of 5 d can reduce the influence of frequent short-term variability (e.g., snowmelt and accumulation in early spring and late autumn), which has been a widely used threshold on the extraction of SOD and SED (Guo et al., 2022; Wang et al., 2017; Xu et al., 2022b). Calculations of SP were excluded from regions containing lakes.
The accuracy of the extracted SP was validated using ground-observed SP from snow depth measured by meteorological stations. The ground-observed SP was calculated as follows. First, all recorded snow depth values were reclassified as snow or no snow based on a 3 cm threshold (Huang et al., 2022a, b). For each snow season, meteorological stations that recorded more than 200 d of snow depth were selected (Hao et al., 2022; Zhao et al., 2022). Days without snow depth records at the selected stations were supplemented with remote sensing images (Landsat series, Sentinel-2, etc.) of these days. Stations with fewer than 20 snow-covered days and fewer than 5 consecutive snow-covered days during the snow season were excluded. After applying these criteria, a total of 56 ground-observed SP instances from 24 stations were used for accuracy validation.
3.2 Trend analysis
To explore the interannual variation trend and trend significance in SP from 2002 to 2022, the Theil–Sen nonparametric regression (Sen, 1968) and Mann–Kendall (M–K) tests (Hirsch et al., 1982) were applied to each pixel. The Theil–Sen method has the advantage of dealing with non-normally distributed data and is robust against outliers compared with traditional linear regression (Theil, 1992).
where β is the trend slope; a positive value denotes the trend of SP as a delay/extension, and a negative value assumes SP is advanced/reduction. n=20, and xi is the ith value in 20 years, the same as xj and jth.
The M–K test is a nonparametric approach for monotonic trend that has been used for trend detection of hydrological and meteorological time series (Qi et al., 2021). The Z value assumes the temporal trend is statistically significant:
When |Z|>1.28, 1.64, and 2.32, the tests were significant at levels of 0.1, 0.05, and 0.01, respectively.
Since snow cover may not be present each year, to avoid unnatural results caused by a small amount of data, only the pixels with at least 6 recorded years for the SP were used for the interannual trend evaluation (Xu et al., 2022b).
3.3 Structural equation model
We used SEM to quantify the direct and indirect effects of various factors on SP. It is a multivariate collection of methods that can simulate the interaction between various factors at the same time, supplying a framework for extrapolating cause–effect relationships and revealing direct and indirect relations between independent and dependent variables (Grace et al., 2010). SEM includes a covariance-based structural equation model (CB-SEM) and the partial least-square structural equation model (PLS-SEM) (Venturini and Mehmetoglu, 2019). Contrasted with CB-SEM, PLS-SEM focuses on mining sample information and can reflect the nature and structural characteristics of objects as much as possible, making it more suitable for exploring newly constructed structural models (Hair et al., 2011; Ringle et al., 2012). More importantly, PLS-SEM is a nonparametric model that does not require a normal distribution of samples and has considerable potential for remote sensing applications (Lopatin et al., 2019; Zhang et al., 2022). Therefore, we adopted PLS-SEM for further exploration.
When using PLS-SEM with normalized factors, multicollinearity diagnosis and model fit evaluation are essential for model quality evaluation. Multicollinearity diagnosis (Cenfetelli and Bassellier, 2009), which relies mainly on the variance inflation factor (VIF), is an important issue in model quality evaluation. High multicollinearity between factors may cause inaccurate path coefficient, leading to these factors being misinterpreted as unimportant or invalid (Hair et al., 2010). The model fit evaluation uses approximate fit indices like SRMR (standardized root mean square residual) and NFI (normed fit index). A desirable PLS-SEM is characterized by SRMR less than 0.08 and NFI greater than 0.90. To interpret the SEM results, a standardized path coefficient implies the direct effect of one factor on another, and its significance (p<0.05) can be evaluated by resampling procedures (Hair et al., 2011). The path coefficient was solved iteratively using ordinary least squares, and the significance (p<0.05) of each path coefficient was obtained by bootstrapping (5000 iterations). The indirect effect of one factor on another can be calculated through multiplying all indirect path coefficients, and the total effect is the sum of the indirect and direct effects.
4.1 Accuracy assessment of the extracted snow phenology
Figure 3 shows the accuracy of the satellite-derived SP parameters compared with the ground-observed SP. The satellite-derived SCD, SOD, and SED values were in line with ground-observed ones, with R of 0.77, 0.95, and 0.97 (p<0.01), respectively. The biases of ground-observed and satellite-derived SCD, SOD, and SED were −1.75, −2.39, and 3.43 d, indicating that the satellite-derived SCD was less than the actual SCD, and the satellite-derived SOD was earlier than the actual SOD. In contrast, satellite-derived SED occurred later than the actual SED. Relevant studies have shown the bias of satellite-derived SP parameters ranges from 0 to 10 d (Chen et al., 2018; Hao et al., 2022; Wang et al., 2021). The biases (−2.39, 3.43, and −1.75 d) in our study were within this range.

Figure 3The accuracy of SP parameters of (a) SCD, (b) SOD, and (c) SED evaluated by ground-observed values from 2002 to 2022. Note that SCD, SOD, and SED denote snow cover days, snow onset date, and snow end date, respectively. DOS represents the day of the snow season. indicates significance at the level of 0.01.
4.2 Spatial patterns and temporal trends of snow phenology
The spatial patterns and temporal trends of SP at the pixel level are shown in Figs. 4 and 5, respectively. Figure 4a indicates the spatial distribution of the multiyear-averaged SCDs from 2002 to 2022, showing a highly uneven snow cover distribution across the plateau. Areas with an SCD of more than 60 d are considered stable snow cover areas and sources of water (Tang et al., 2022), accounting for approximately 17.07 % of the total TP and being primarily distributed in high-elevation mountain ranges. Some high-elevation areas had an SCD exceeding 180 d, accounting for approximately 7.40 % of the entire TP, distributed primarily in the western Kunlun, Himalaya, and Nyainqêntanglha mountains. Areas of low SCD (<20 d) accounted for 55.95 % of the total TP, mainly concentrated in low-elevation areas and the hinterland of the plateau. Overall, the pattern of SCD was in line with topography in a visual sense, displaying the regularity of a high SCD in high-elevation mountains and low SCD in the low-elevation plains. We also examined the temporal trend in SCD and its significance. As Fig. 5a shows, the SCD decreased in 50.59 % of the TP during the 20-year period and significantly decreased by 4.62 % of the total TP at a mean rate of −1.74 d yr−1 (p<0.1), primarily in the west Kunlun, east-central Himalaya, and south Nyainqêntanglha mountains. In contrast, areas with significantly increased SCD accounted for 2.45 % of the total TP at a mean rate of 1.12 d yr−1 (p<0.1) and were mainly scattered in the east-central part of the TP.

Figure 4The spatial pattern of the multiyear-averaged SP of (a) SCD, (b) SOD, and (c) SED on the TP from 2002 to 2022. Note that pixels not detected for 20 years or identified as lake area were considered snow-free pixels (i.e., the white area in the figure).
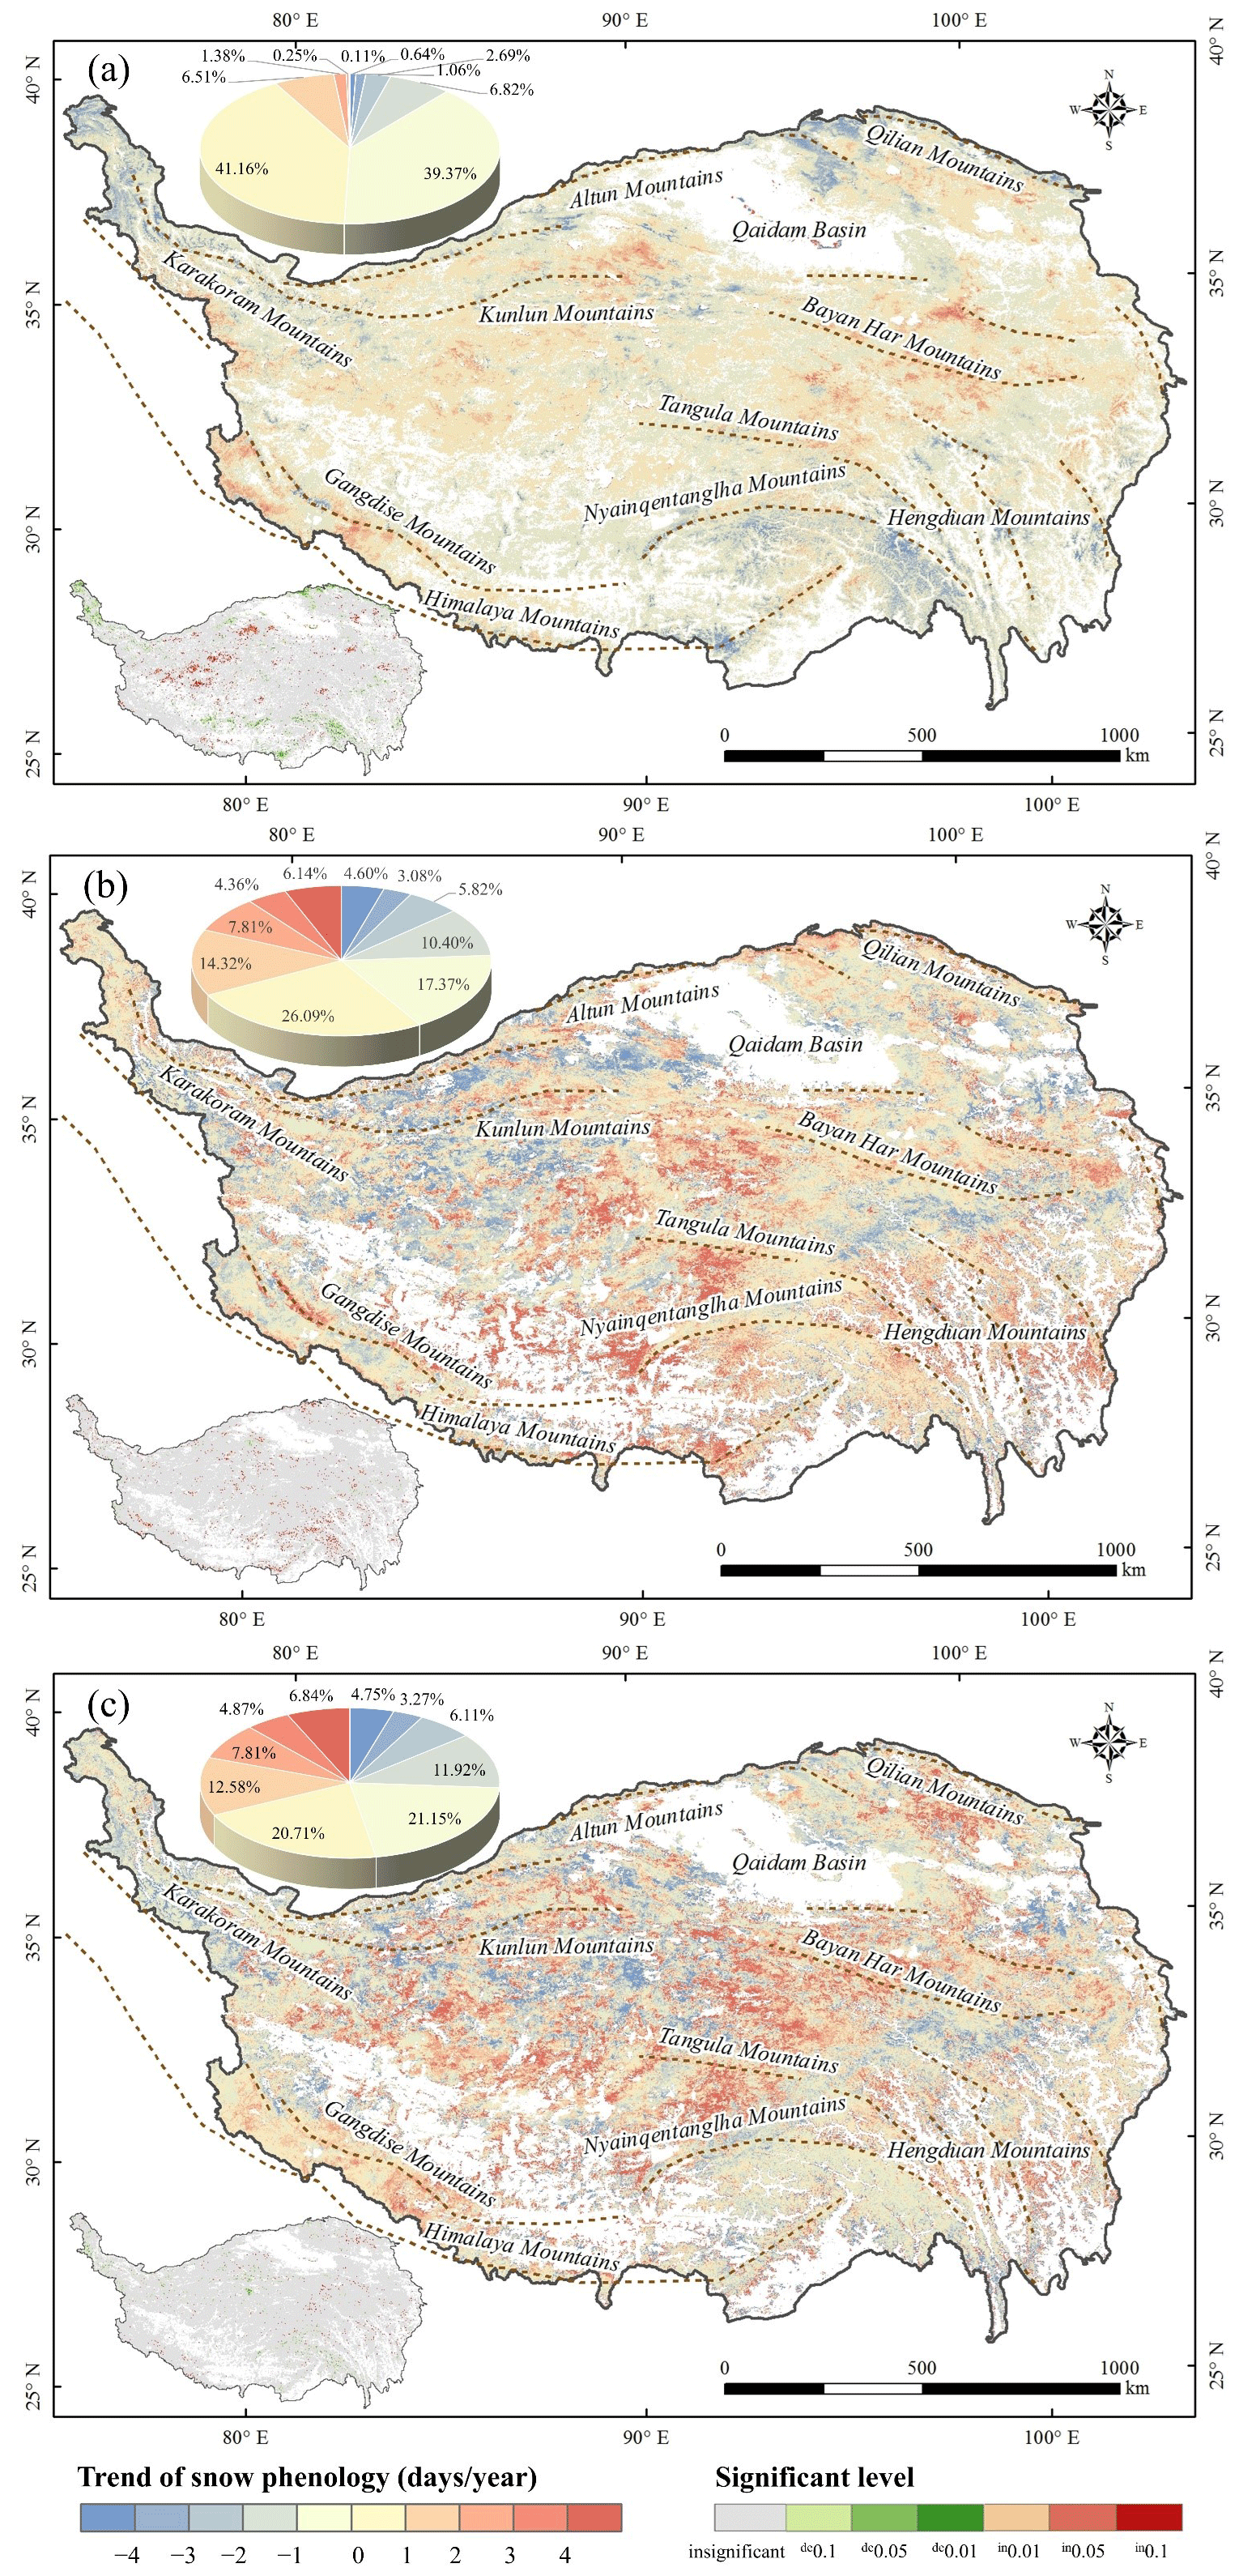
Figure 5Trends in SP of (a) SCD, (b) SOD, and (c) SED on the TP from 2002 to 2022. Note that the map at the bottom left of each panel indicates the significant level. The symbol “de” in the legend indicates a significantly decreased trend, and “in” indicates a significantly increased trend.
Distribution of SOD and SED over the TP also presented extreme spatial heterogeneity, which was visually consistent with elevation (Fig. 4b and c). DOS (day of the snow season) 1 is equivalent to 1 September of the previous year. SOD was mainly concentrated in DOS 90–180 (December–February), whereas SED was concentrated primarily in DOS 150–240 (February–April). In high-elevation mountain ranges, SOD appears earlier in general, whereas SED starts later. But in low-elevation areas such as the hinterland of the TP, SOD starts later and SED appears earlier. Not only are the variations in SOD and SED spatially complicated, but they also exhibited significant temporal heterogeneity (Fig. 5b and c). A total of 58.56 % of the total TP had delayed SOD, and 2.34 % of the TP had a statistically significant (p<0.1) delayed SOD at a mean rate of 2.90 d yr−1 (Fig. 5b). In contrast, areas with significantly advanced SOD only accounted for 0.46 % of the total area at a mean rate of −3.69 d yr−1 (p<0.1) and were sparsely distributed in the northwestern and eastern TP. For SED, 98.41 % of the TP showed no significant trend, 1.52 % showed a significant advanced trend at a rate of −2.49 d yr−1 (p<0.1), and 0.07 % showed a significant delayed trend (p<0.1) (Fig. 5c).
4.3 Direct and indirect effects of important factors on snow phenology
Based on the related literature (Guo et al., 2022; Huang et al., 2020; Qi et al., 2021), 11 initial associated factors in four categories were selected: meteorological factors (air temperature, precipitation, wind speed, humidity, and shortwave radiation), geographical location (latitude and longitude), topography (elevation, slope, and aspect), and vegetation greenness (NDGI). First, multicollinearity diagnosis was performed on all initial factors, among which humidity did not pass the multicollinearity diagnosis (VIF = 10.8) and was excluded. Then, we constructed a SEM using the remaining factors and established multiple paths in the model. Non-significant and low coefficient paths were removed, and the total effect (TE) of each factor was calculated based on the final paths (Fig. 6). Factors with a small absolute TE should be removed because of their small contribution and limited explanations. An appropriate threshold was selected as the basis for factor elimination. Hair et al. (2011) indicated that there is no uniform standard for selecting thresholds in different research fields. Considering the rationality of factor selection and referring to the relevant literature (Shen et al., 2022; Zhang et al., 2022), we used 0.01 as the threshold for factor elimination. Aspect was eliminated for all SP (Fig. 6), and the final SEMs were constructed to discuss the direct and indirect effects of the remaining nine factors.
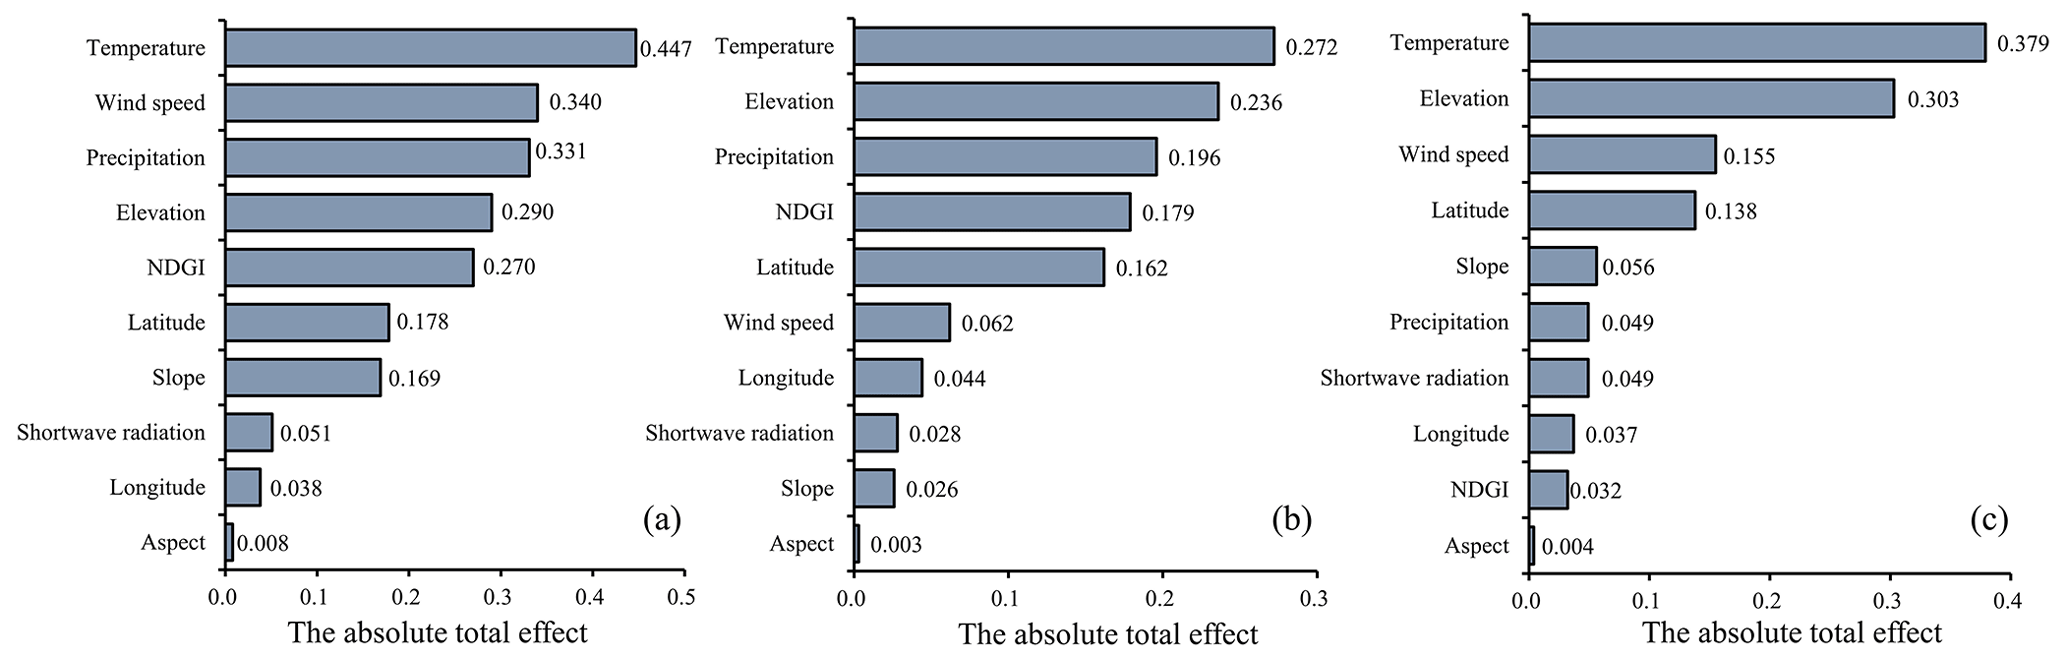
Figure 6The absolute total effect of associated factors affecting SP of (a) SCD, (b) SOD, and (c) SED based on SEM.
Figure 7 presents the results of the final SEM and its standardized regression path coefficient (PC) (p<0.05). It indicates that there are complex interactions between SP and associated factors on the TP. Temperature, wind speed, NDGI, and shortwave radiation had negative effects on SCD and positive effects on SOD, while the other factors had positive effects on SCD and negative effects on SOD. Furthermore, temperature, wind speed, and shortwave radiation had negative effects on SED, while the remaining factors had positive effects on SED. Meteorological factors (air temperature, precipitation, wind speed, and shortwave radiation) exerted both direct and indirect effects on SP, whereas vegetation greenness (NDGI) mainly had a direct impact, and geographical location (latitude and longitude) and topography (elevation and slope) had an indirect effect on SP (Fig. 7). Meteorological factors were the dominant factors affecting SP, especially the temperature, which had the strongest effect on SCD, SOD, and SED, with the TE values of −0.447, 0.272, and −0.379, respectively. The influences of precipitation on SCD and SOD were also relatively significant (absolute value of TE >0.19). However, its impact on SED was limited (TE = 0.049). Wind speed exhibited a strong effect on SCD and SED (absolute value of TE >0.15), while its effect on SOD was relatively limited (TE = 0.062). The effect of NDGI on SCD and SOD was strongest (absolute value of TE >0.17). Geographical location and topographic conditions affected SP by determining meteorological conditions and the growth of vegetation. For example, elevation indirectly affected SCD by assessing the distribution of temperature (PC = −0.805), precipitation (PC = −0.261), shortwave radiation (PC = 0.330), wind speed (PC = 0.418), and NDGI (PC = −0.649); hence, the TE of elevation on the SCD was 0.290 (Fig. 7a). The influence of latitude on all SP parameters was greater than that of longitude.
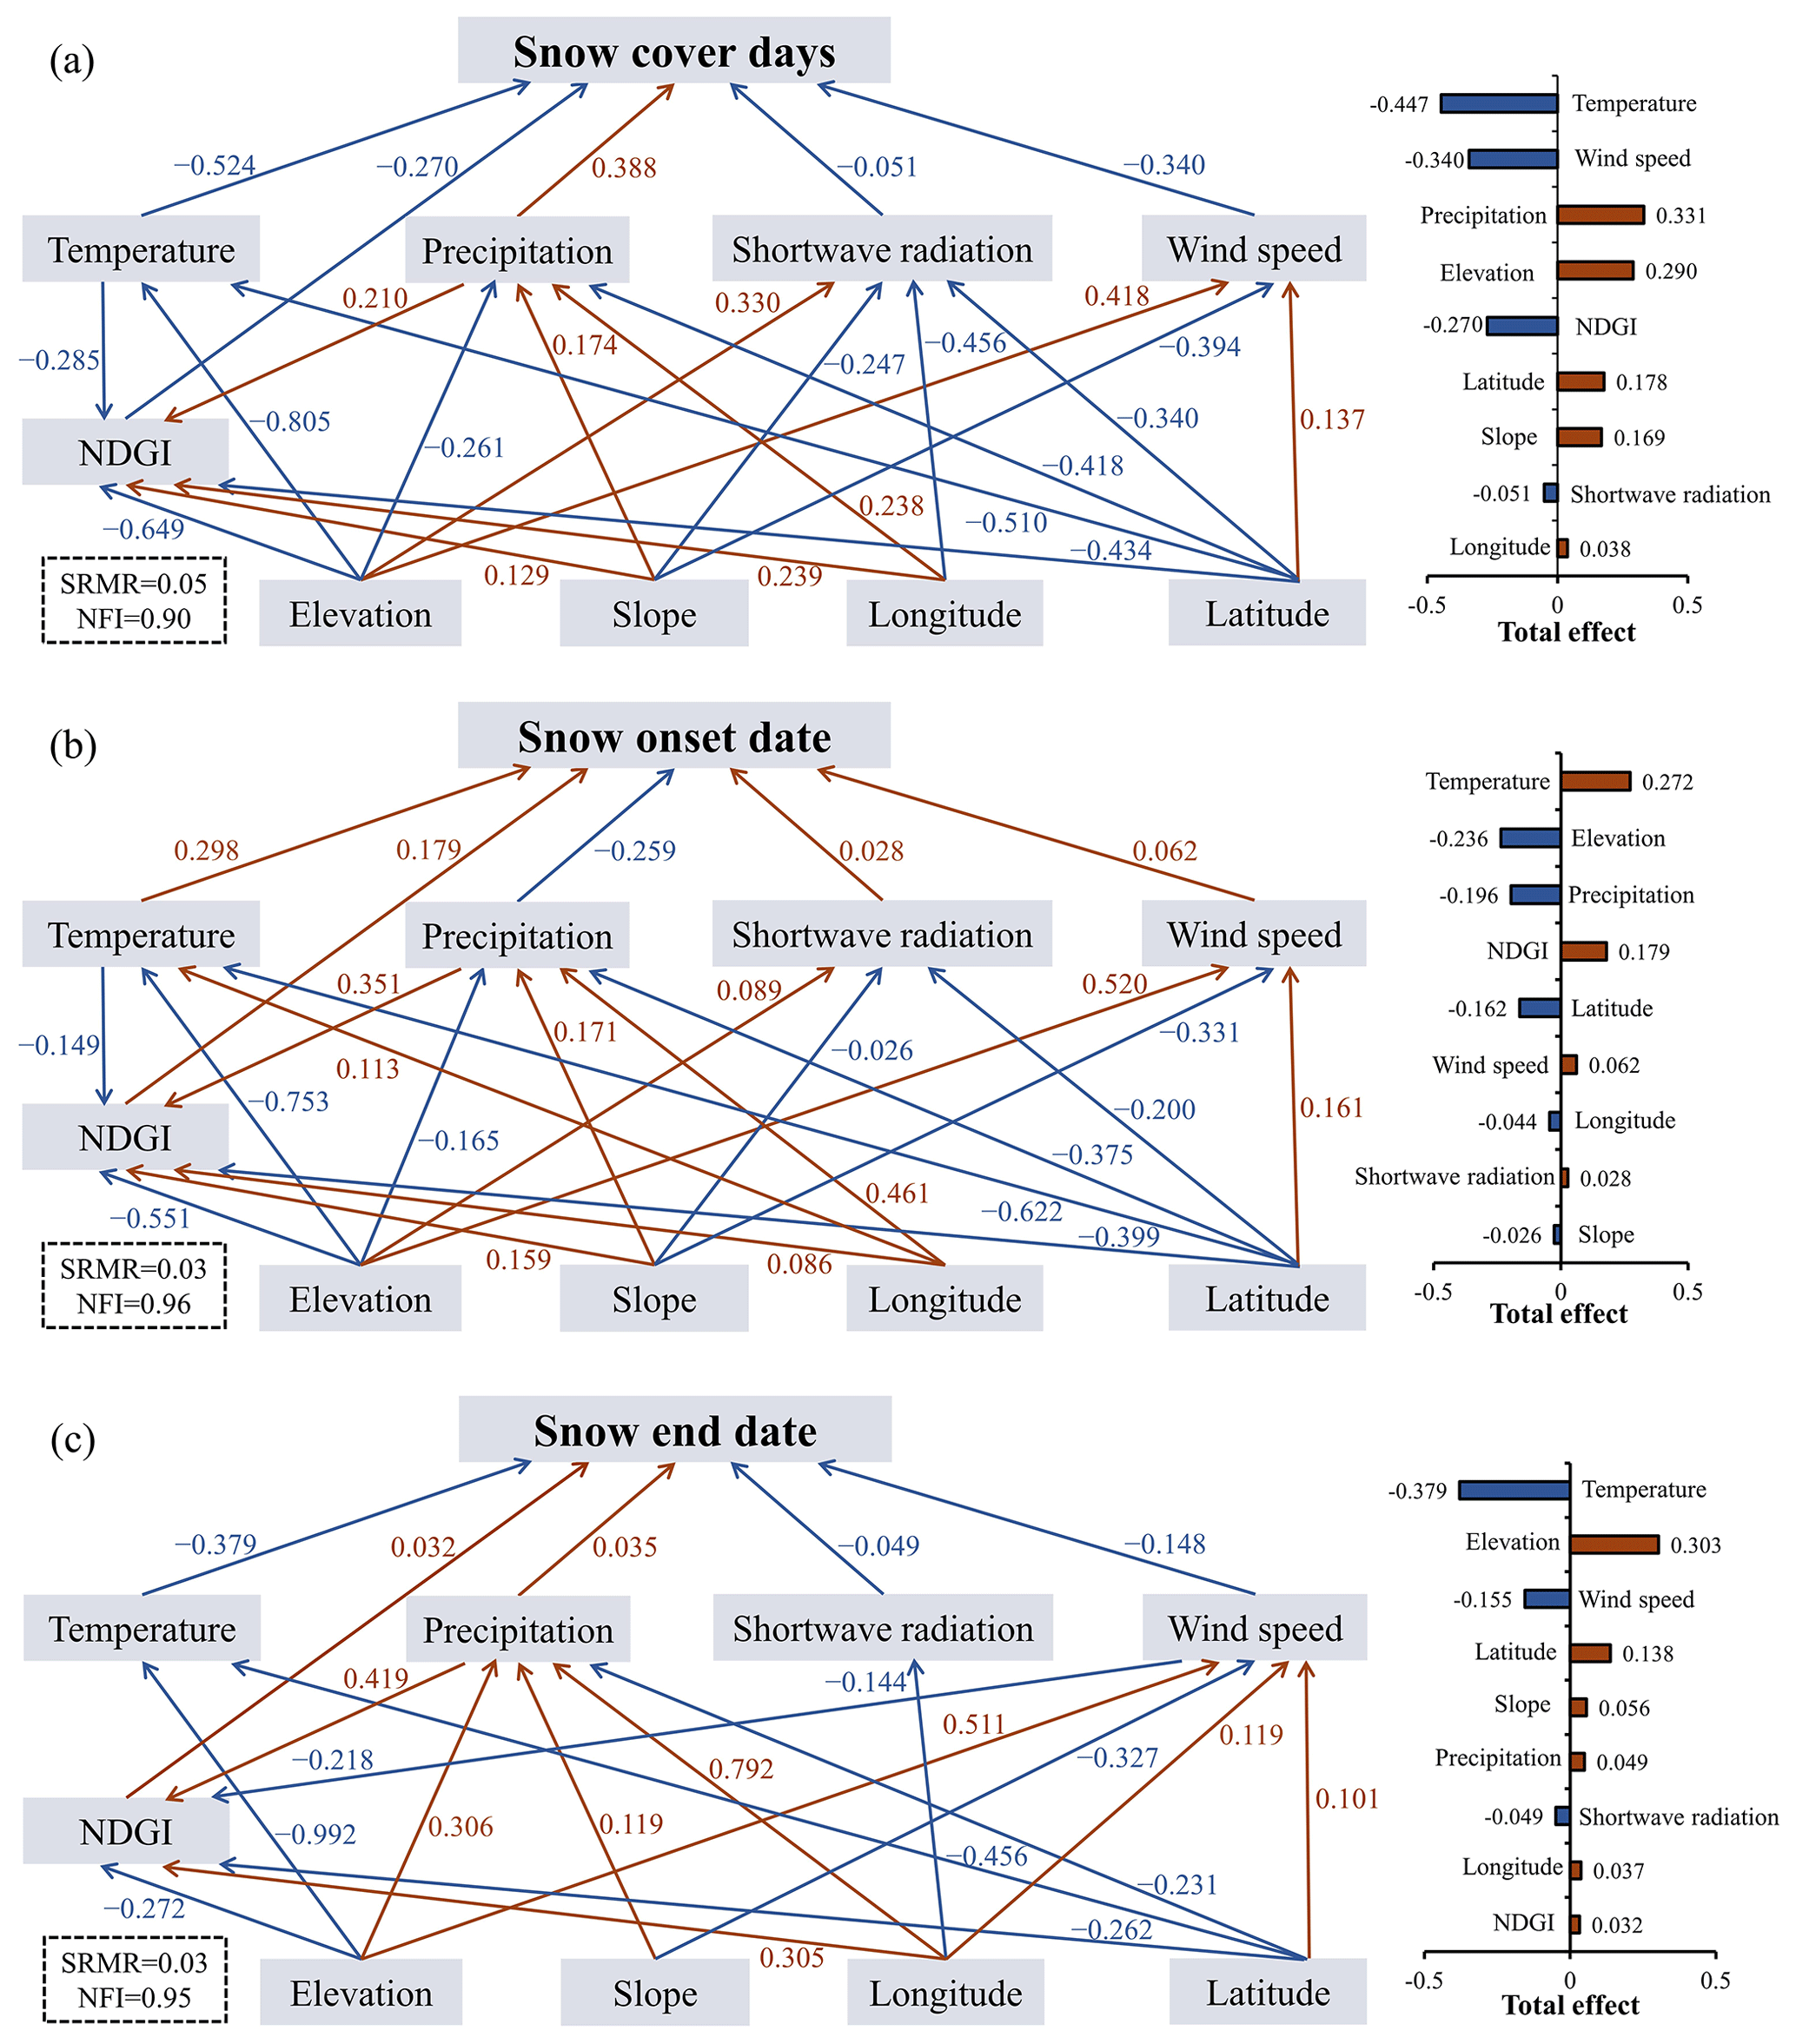
Figure 7The SEM of each SP parameter of (a) SCD, (b) SOD, and (c) SED. Note that the red line implies a positive effect, while the blue line denotes a negative effect. All path coefficients are statistically significant (p<0.05).
Compared to traditional statistical methods, the SEM adopted in this study can accurately quantify the direct and indirect relationships between SP and associated factors. This makes it particularly well-suited for understanding the mediating effects of these factors. Based on the results of this model, the influences of relatively important factors are discussed below.
5.1 Response of snow phenology to meteorological factors
Meteorological factors (air temperature, precipitation, wind speed, and shortwave radiation) can directly affect SP as well as indirectly affect it by influencing the growth of vegetation, whereas the direct effect was much greater than the indirect effect. Among these factors, air temperature was the dominant meteorological factor. A temperature below 0 °C is conducive to the increase and maintenance of snow cover, resulting in longer SCD, earlier SOD, and later SED (Moran-Tejeda et al., 2013; Scalzitti et al., 2016). As another important factor, precipitation has been indicated by prior research to have a comparatively lower contribution to SP (Guo et al., 2022; Huang et al., 2020; Wang et al., 2021), which is inconsistent with the results of our research (Fig. 7). This discrepancy may be caused by the different resolutions of precipitation data. The spatial resolution of the precipitation data we used was approximately 3 km, while the resolution in previous studies was relatively rough (25 km or data from meteorological stations). The 3 km resolution precipitation data we used reveal greater details of precipitation distribution and provide more accurate precipitation information, thus obtaining a more reliable correlation between precipitation and SP.
To further explore the response mechanisms of SP to temperature and precipitation, their relationship was analyzed at the pixel level using Pearson's correlation coefficients (Fig. 8). SCD and SED exhibited a negative correlation with temperature across the majority of regions, accounting for 88.09 % and 73.81 % of the TP, respectively (Fig. 8a and e). Conversely, they demonstrated a positive correlation with precipitation in 59.67 % and 61.02 % of the areas of the TP (Fig. 8b and f). SOD was positively correlated with temperature in 78.02 % of the TP (Fig. 8c) and displayed a negative correlation with precipitation in 70.90 % of the TP (Fig. 8d). We also calculated the correlation coefficients of SP with temperature and precipitation for each elevation range (Fig. 8g, h, and i). The role of temperature and precipitation in SP varies with elevation. In areas with low elevation (<1500 m) and high elevation (>6700 m), the relationships between SP and temperature and precipitation were complex, with neither factor dominating significantly. For SCD, the influence of precipitation exceeded that of temperature and became more important in 1500–5400 m (Fig. 8g). However, temperature played a more crucial role in 5400–6700 m. Similarly, the effect of precipitation on SED was more significant in 1800–5400 m, after which the effect of temperature was more important in 5400–6700 m. The correlation between SOD and precipitation was stronger than its correlation with temperature across 4700–5500 m. Overall, we identified that the relative importance of temperature and precipitation shifts with elevation. Our findings differ from previous studies, where researchers generally found an elevation threshold where the importance of each changed. For instance, Moran-Tejeda et al. (2013) discovered a threshold elevation of approximately 1400 m, below which temperature was the primary explanatory variable of snow cover in Switzerland, and above which precipitation was a better predictor. Scalzitti et al. (2016) found a range of threshold elevations (1580–2181 m) that separated the importance of temperature from that of precipitation in the western United States. The reasons for such difference with our research could be as follows: (1) the complex terrain and different climate conditions of the TP and (2) the unique changes in temperature and precipitation at different elevations on the TP. The confounding influence of warming temperatures and varying precipitation remains a challenge in explaining the observed variations in the SP.

Figure 8Correlation between temperature and SP of (a) SCD, (c) SOD, and (e) SED at pixel level; correlation between precipitation and SP of (b) SCD, (d) SOD, and (f) SED; and correlation coefficient between both temperature and precipitation and SP of (g) SCD, (h) SOD, and (i) SED under different elevation ranges.
This study still has some limitations in exploring the effect of meteorological factors on SP. We calculated the average (or total) metrics of each meteorological factor during the snow accumulation season to explore their relationship with SOD using SEM. Similarly, we calculated the average (or total) metrics of each meteorological factor during the snowmelt season to investigate their relationship with SED (Chen et al., 2018; Ma et al., 2023). The purpose of this is to address the time dependence of meteorological factors. In the future, we intend to explore more methods for effectively separating the time dependence of meteorological factors when studying their effects on snow phenology. Additionally, previous studies suggested potential lagging effects of meteorological factors on the SP of the TP. For instance, Li et al. (2019) found that anomalous precipitation could lead to subsequent snow cover variations on the TP with a delay of approximately 5 d. Ren and Liu (2018) observed a strong negative correlation between snow cover and the average temperature of 1 to 4 months prior to snow accumulation. Despite the potential importance of lagging effects on the snow cover of the TP, our SEM model requires concurrent observations of dependent and independence variables for accurate quantification of the causal relationships between them. Therefore, the lagging effects were neglected in this study.
5.2 Topography control on snow phenology
Previous studies have demonstrated the effect of complex topography on SP (Guo et al., 2022; Jain et al., 2008; Ma et al., 2020). Still, they did not reveal the specific action processes (direct or indirect) of various topographic factors affecting SP. This study indicated that topographic conditions indirectly affected SP by modulating meteorological conditions and the growth of vegetation using SEM. Elevation is the primary factor due to its vital effect on local microclimates, particularly in mountainous regions. In high-elevation mountains, the temperature and specific humidity are lower and snowfall is higher, creating favorable conditions for snowfall and maintenance. Owing to the strong blocking effect from large mountains, most areas of the hinterland of the TP have relatively scarce snow (Wang et al., 2017). Snow is more likely to slide on a steeper slope, which prevents snow accumulation, whereas a flatter slope is conducive to snow deposition. As shown in Fig. 7, slope had little effect on SOD (compared with SCD and SED), indicating that the snow accumulation was mainly influenced by climate and less by slope.
Elevation had a significant effect on SP, but whether the trends in SP from 2002 to 2022 on the TP was elevation-dependent was unknown. To investigate the elevation effect, we divided elevation into 50 m intervals, and the average trend values of statistically significant pixels (p<0.1) were calculated for each elevation category. Then, we selected elevation categories with more than 50 samples to analyze the correlation between trends in SP and elevation. Our finding reveals a strong negative correlation between trend in SCD and elevation, with a correlation coefficient of −0.73 (Fig. 9a). This negative correlation was strongest in 0–4000 and 4900–5900 m. A moderate positive correlation exists between the trend in SOD and elevation (R=0.59), and this positive correlation was most significant in 4100–5800 m (Fig. 9b). The correlation between SED and elevation was 0.33, which was not significant (Fig. 9c). Therefore, there exists a strong elevation dependence for the trend in SCD (), a moderate elevation dependence for the trend in SOD (R=0.59), and no significant elevation dependence for the trend in SED (R=0.33) from 2002 to 2022. The elevation dependence of the SCD trend is consistent with the previous study of Ma et al. (2023). However, Ma et al. (2020) found no elevation dependence for both SOD and SED trends. This discrepancy is very likely because the meteorological data used in their study were mainly distributed in the eastern TP, while the western TP was much less considered. This further highlights the high spatial heterogeneity of SP in the TP.
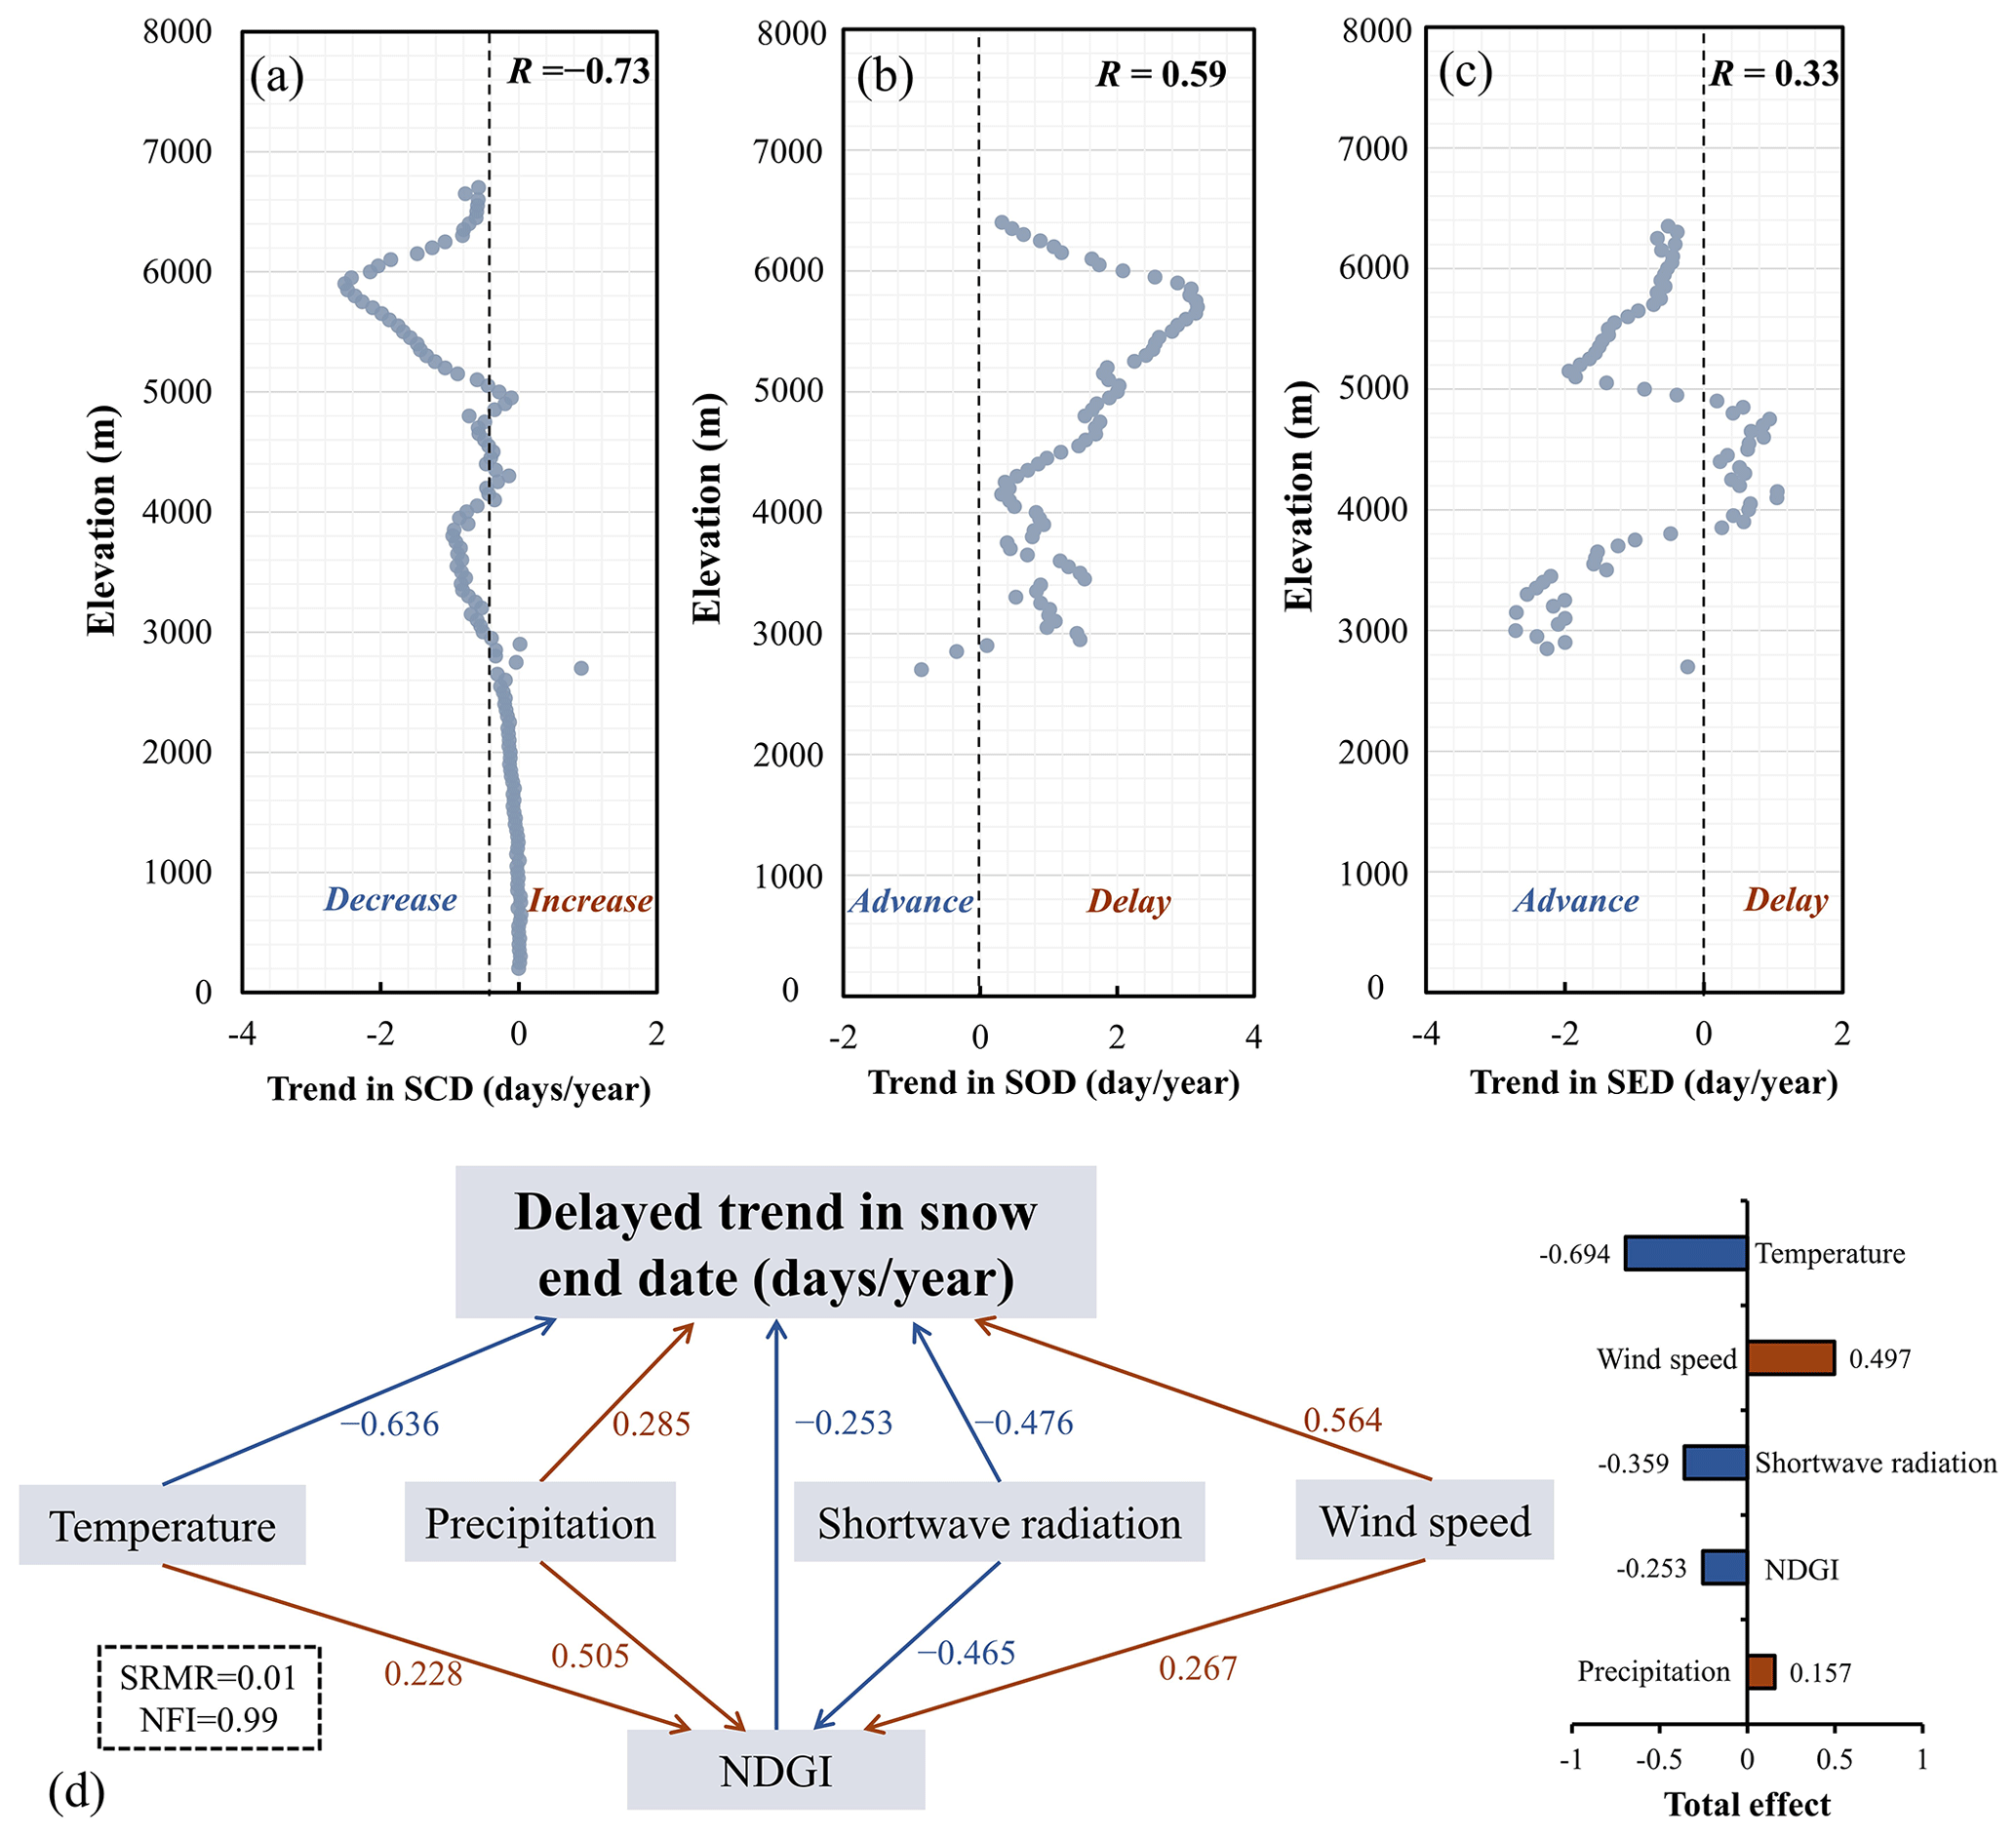
Figure 9Trends in SP of (a) SCD, (b) SOD, and (c) SED under different elevation ranges on the TP from 2002 to 2022 and the SEM based on delayed trend in SED and influencing factors (d).
The non-significant elevation dependence of SED is due to the competing effects of the delayed trend within 3800–4900 m elevation and the advanced trend of other elevation ranges (Fig. 9c). To explain the counterintuitive delayed trend in the context of regional warming, we further applied a structural equation model to explore the causal relationships. The results indicate that wind speed significantly influences the delayed trend in SED, exhibiting a strong positive correlation with a total effect of 0.497 (Fig. 9d). The delayed trend in SED becomes more pronounced as wind speed increases. This effect of wind speed on snow cover is mainly through the blowing snow process, which leads to increased snow accumulation through snow redistribution and thus a delayed trend in SED regionally. Li et al. (2012) also found a distinct occurrence of blowing snow at an elevation of 4146 m, where pronounced redistribution of snow cover occurred.
5.3 Other factors affecting snow phenology
The TP has a vast territory spanning multiple longitude and latitude zones, and longitude and latitude cannot be ignored in snow cover research. A greater longitude (i.e., further east) caused a shorter SCD, later SOD, and earlier SED (Fig. 4). From east to west, SCD decreased by 123 d, SOD was delayed by 77 d, and SED advanced by 48 d. The elevation of the TP decreases from west to east, resulting in a correlation between elevation and longitude (R=0.532; Fig. 10a). This correlation can cause the effect of longitude on SP folded under the effect of elevation on SP. However, controlling the influence of elevation, we still find the longitudinal dependency of snow cover. Taking the SCD as an example, at a fixed elevation (e.g., 5000 m), a correlation still exists between longitude and SCD (R=0.356; Fig. 10b). This implies that longitude could be interacting with additional factors to shape the spatial and temporal distribution of snow cover on the plateau. Vegetation greenness can change snow redistribution by intercepting the snow and regulating the balance of the solar radiation budget (Domine et al., 2016), and vice versa, the processes and patterns of snow accumulation and melting affect vegetation greenness, species distribution, and community structure (Barrere et al., 2018). Most previous studies explored the response of vegetation greenness to snow cover, and the role of vegetation greenness on snow cover has rarely been investigated (Qi et al., 2021; Xu et al., 2022b). Our study showed that vegetation had mainly direct effects on snow cover, with particularly pronounced effects on SCD and SOD.
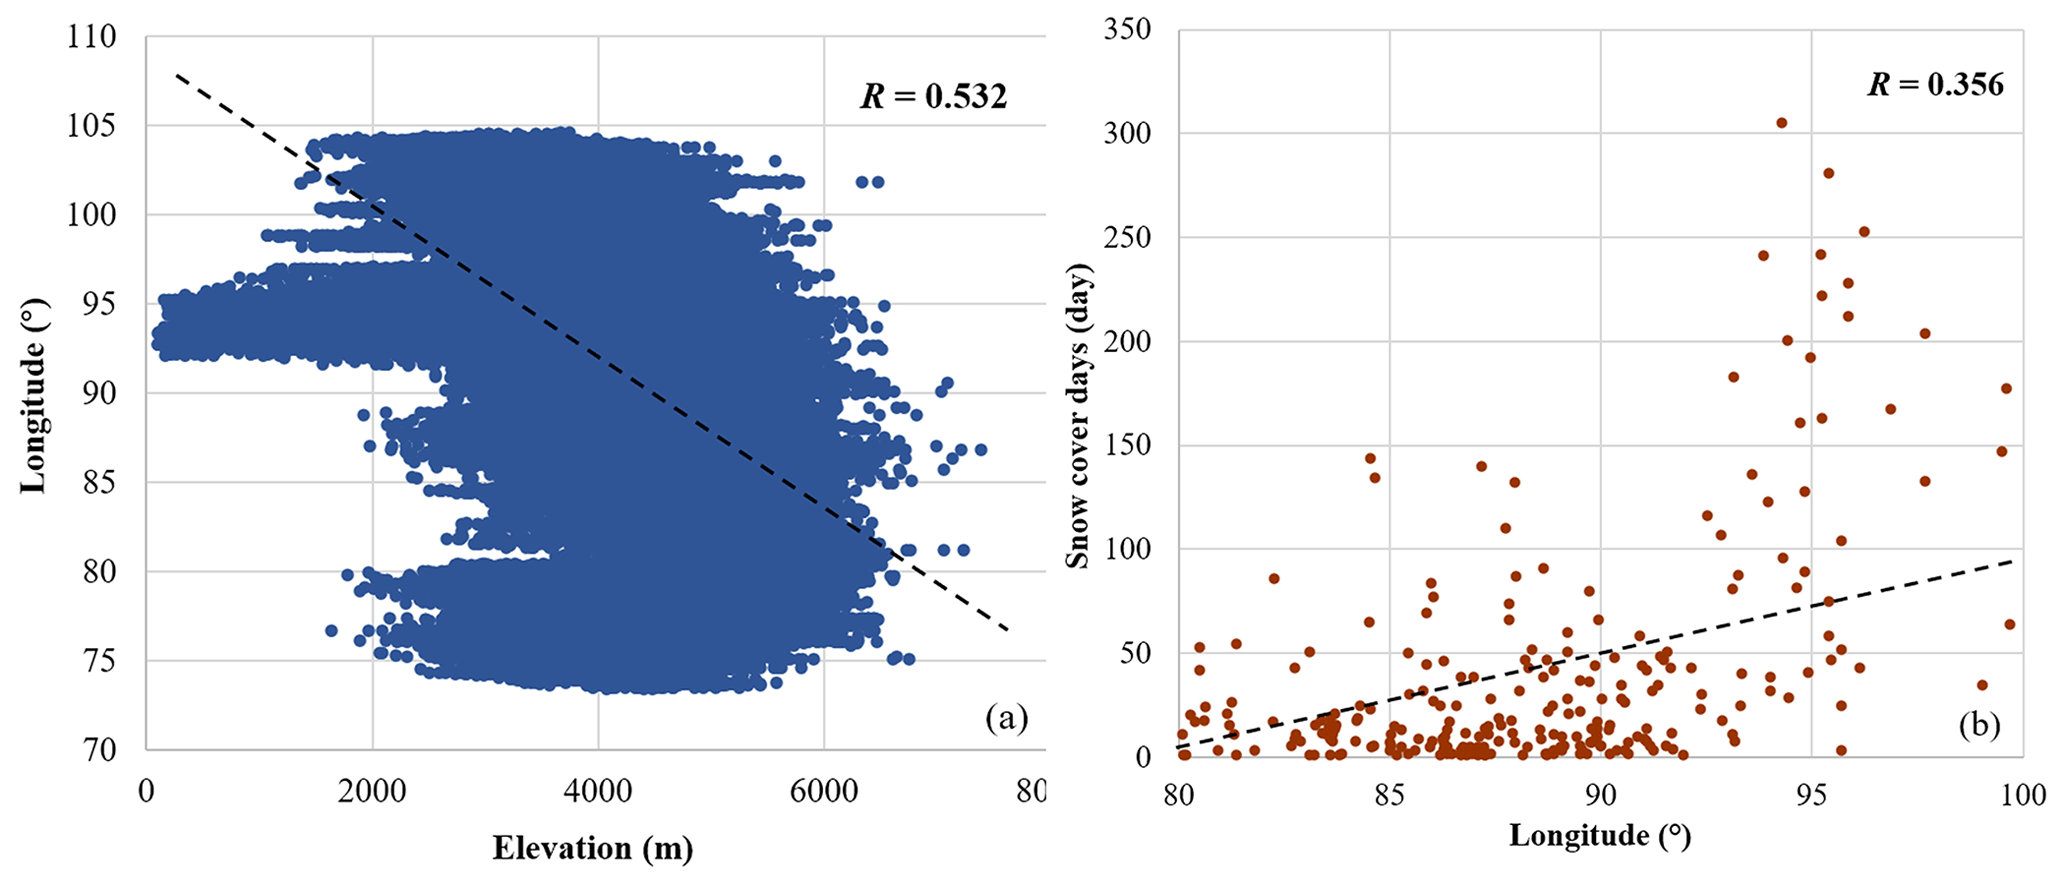
Figure 10Scatter plot of (a) elevation and longitude and (b) longitude and snow cover days (at a fixed elevation of 5000 m).
The dynamics of snow accumulation and melting are influenced by various factors. In addition to the factors analyzed in this paper, other factors may also play important roles in SP. Ground temperature primarily influences the structure and stability of snowpack by regulating energy exchange at the soil–snow interface (Rixen et al., 2022). As the ground temperature increases, the substrate absorbs additional thermal energy, which is conveyed to the base of the accumulated snow through heat conduction, resulting in melting of the lower snow layers. The heat from the warmer soil in the snow-free area can be transferred to the colder soil below the snow-covered area. Liquid water can also be transferred from the snow-free soil to the snow-covered soil, thus melting snow (Fassnacht et al., 2006). Therefore, soil properties (e.g., soil moisture) can also affect snow cover. In addition, atmospheric pollutants, especially those referred to as light-absorbing aerosols, such as black carbon, brown carbon, and dust, can warm the atmosphere (Kang et al., 2019; Ji et al., 2015). After being deposited onto snowpack, these light-absorbing particles can reduce the surface albedos of snowpack and promote its melting (Zhang et al., 2018; Lau and Kim, 2018). Despite the potential importance of these factors to the SP of the TP, they were not analyzed in this study due to limited data availability of these factors over extended spatial and temporal scales. Developing continuous high-resolution, spatiotemporal datasets for these factors will be useful in future efforts to comprehensively quantify the response of SP to changing climate conditions.
In this study, we investigated the spatiotemporal variability in SP on the TP from 2002 to 2022 based on the daily gap-free HMRFS-TP dataset. We also quantified the direct and indirect effects of the associated factors on SP. The spatial patterns of SP were vertically zonal, with higher elevations having a longer SCD, earlier SOD, and later SED. SCD had a statistically significant (p<0.1) decreased trend in 4.62 % of the TP at a mean rate of −1.74 d yr−1. SOD was significantly delayed in 2.34 % of the TP at a mean rate of 2.90 d yr−1 (p<0.1), while SED was significantly advanced in 1.52 % of the TP at a rate of −2.49 d yr−1 (p<0.1). Additionally, there exists a strong elevation dependence for the trend in SCD (), a moderate elevation dependence for the trend in SOD (R=0.59), and no significant elevation dependence for the trend in SED (R=0.33). Meteorological factors can directly affect SP as well as indirectly affect it by influencing the growth of vegetation, whereas the direct effect was much greater than the indirect effect. Geographical location and topographic conditions indirectly affected SP by modulating meteorological conditions and the growth of vegetation. Vegetation primarily influences SP by intercepting the snow and regulating the balance of the solar radiation budget. As two rather important factors, we identified that neither temperature nor precipitation showed consistently high importance as elevation increased.
This study explored the dynamic variation in snow cover and revealed the mediating effects of multiple factors in its changing process, which contributed to providing a strategic basis for predicting and solving the problems of climate change, hydrological cycle, and ecological balance in the future in the context of global warming on the TP.
The MATLAB code for snow phenology extraction, trend analysis, and M–K test can be accessed at https://github.com/jiahuixu0826/TP_SP.git (last access: 16 April 2024; DOI: https://doi.org/10.5281/zenodo.10974477, Xu, 2024). The structural equation model was constructed based on the SmartPLS 4 software, and the detailed information for model setup as well as the parameters can be found in Sect. 3.3.
The long-term daily gap-free HMRFS-TP snow cover dataset can be freely accessed from the National Tibetan Plateau Data Center at https://doi.org/10.11888/Cryos.tpdc.272204 (Huang and Xu, 2022; Huang et al., 2022b).
JX and YH designed and performed the experiments. YT and LD performed the extraction of snow phenology. SW, BY, and JW processed the validation experiments. ZZ performed data curation. All the authors contributed to the analysis and writing of this paper.
The contact author has declared that none of the authors has any competing interests.
Publisher’s note: Copernicus Publications remains neutral with regard to jurisdictional claims made in the text, published maps, institutional affiliations, or any other geographical representation in this paper. While Copernicus Publications makes every effort to include appropriate place names, the final responsibility lies with the authors.
We would like to thank the National Meteorological Centre of China for providing the in situ observations over the Tibetan Plateau. We are also grateful for the valuable suggestions of the two anonymous reviewers.
This research has been supported by the National Natural Science Foundation of China (grant no. 42071306).
This paper was edited by Patricia de Rosnay and reviewed by two anonymous referees.
Barrere, M., Domine, F., Belke-Brea, M., and Sarrazin, D.: Snowmelt events in autumn can reduce or cancel the roil warming effect of snow–vegetation interactions in the Arctic, J. Climate, 31, 9507–9518, https://doi.org/10.1175/jcli-d-18-0135.1, 2018.
Cenfetelli, R. and Bassellier, G.: Interpretation of formative measurement in information systems research, MIS Quarterly, 33, 689–707, https://doi.org/10.2307/20650323, 2009.
Chen, W., Yao, T., Zhang, G., Li, F., Zheng, G., Zhou, Y., and Xu, F.: Towards ice-thickness inversion: an evaluation of global digital elevation models (DEMs) in the glacierized Tibetan Plateau, The Cryosphere, 16, 197–218, https://doi.org/10.5194/tc-16-197-2022, 2022.
Chen, X., Liang, S., Cao, Y., He, T., and Wang, D.: Observed contrast changes in snow cover phenology in northern middle and high latitudes from 2001-2014, Scientific Reports, 5, 16820, https://doi.org/10.1038/srep16820, 2015.
Chen, X., Long, D., Liang, S., He, L., Zeng, C., Hao, X., and Hong, Y.: Developing a composite daily snow cover extent record over the Tibetan Plateau from 1981 to 2016 using multisource data, Remote Sens. Environ., 215, 284–299, https://doi.org/10.1016/j.rse.2018.06.021, 2018.
Cherkauer, K. A. and Sinha, T.: Time series analysis of soil freeze and thaw processes in Indiana, J. Hydrometeorol., 9, 936–950, https://doi.org/10.1175/2008jhm934.1, 2008.
Domine, F., Barrere, M., and Morin, S.: The growth of shrubs on high Arctic tundra at Bylot Island: impact on snow physical properties and permafrost thermal regime, Biogeosciences, 13, 6471–6486, https://doi.org/10.5194/bg-13-6471-2016, 2016.
Fan, X., Gu, Y., Liou, K.-N., Lee, W.-L., Zhao, B., Chen, H., and Lu, D.: Modeling study of the impact of complex terrain on the surface energy and hydrology over the Tibetan Plateau, Clim. Dynam., 53, 6919–6932, https://doi.org/10.1007/s00382-019-04966-z, 2019.
Fassnacht, S. R., Yang Z. L., Snelgrove, K. R., Soulis, E. D., and Kouwen, N.: Effects of Averaging and Separating Soil Moisture and Temperature in the Presence of Snow Cover in a SVAT and Hydrological Model for a Southern Ontario, Canada, Watershed, J. Hydrometeorol., 7, 298–304, https://doi.org/10.1175/JHM489.1, 2006.
Fyfe, J. C., Derksen, C., Mudryk, L., Flato, G. M., Santer, B. D., Swart, N. C., Molotch, N. P., Zhang, X., Wan, H., Arora, V. K., Scinocca, J., and Jiao, Y.: Large near-term projected snowpack loss over the western United States, Nat. Commun., 8, 14996, https://doi.org/10.1038/ncomms14996, 2017.
Grace, J. B., Anderson, T. M., Olff, H., and Scheiner, S. M.: On the specification of structural equation models for ecological systems, Ecol. Monogr., 80, 67–87, https://doi.org/10.1890/09-0464.1, 2010.
Guo, H., Wang, X., Guo, Z., and Chen, S.: Assessing snow phenology and its environmental driving factors in Northeast China, Remote Sensing, 14, 262, https://doi.org/10.3390/rs14020262, 2022.
Gutzler, D. S. and Rosen, R. D.: Interannual variability of wintertime snow cover across the Northern Hemisphere, J. Climate, 5, 1441–1447, https://doi.org/10.1175/1520-0442(1992)005<1441:IVOWSC>2.0.CO;2, 1992.
Hair, J. F., Black, W. C., Babin, B. J., and Anderson, R. E.: Multivariate data analysis, 7th edn., Pearson Prentice Hall, New Jersey, ISBN 978-0138132637, 2010.
Hair, J. F., Sarstedt, M., Ringle, C. M., and Mena, J. A.: An assessment of the use of partial least squares structural equation modeling in marketing research, J. Acad. Market. Sci., 40, 414–433, https://doi.org/10.1007/s11747-011-0261-6, 2011.
Hall, D. K., Riggs, G., and Salomonson, V. V.: Development of methods for mapping global snow cover using Moderate Resolution Imaging Spectroradiometer (MODIS) data, Remote Sens. Environ., 54, 127–140, https://doi.org/10.1016/0034-4257(95)00137-P, 1995.
Hao, X., Zhao, Q., Ji, W., Wang, J., and Li, H.: A dataset of snow cover phenology in China based on AVHRR from 1980 to 2020, China Scientific Data, 7, 1–10, https://doi.org/10.11922/11-6035.ncdc.2021.0026.zh, 2022.
He, J., Yang, K., Tang, W., Lu, H., Qin, J., Chen, Y., and Li, X.: The first high-resolution meteorological forcing dataset for land process studies over China, Scientific Data, 7, 25, https://doi.org/10.1038/s41597-020-0369-y, 2020.
Hirsch, R. M., Slack, J. R., and Smith, R. A.: Techniques of trend analysis for monthly water-quality data, Water Resour. Res., 18, 107–121, https://doi.org/10.1029/WR018i001p00107, 1982.
Huang, X., Deng, J., Wang, W., Feng, Q., and Liang, T.: Impact of climate and elevation on snow cover using integrated remote sensing snow products in Tibetan Plateau, Remote Sens. Environ., 190, 274–288, https://doi.org/10.1016/j.rse.2016.12.028, 2017.
Huang, X., Liu, C., Zheng, Z., Wang, Y., Li, X., and Liang, T.: Snow cover variations across China from 1951–2018, The Cryosphere Discuss. [preprint], https://doi.org/10.5194/tc-2020-202, 2020.
Huang, Y. and Xu, J.: HMRFS-TP: long-term daily gap-free snow cover products over the Tibetan Plateau (2002–2022), National Tibetan Plateau/Third Pole Environment Data Center [data set], https://doi.org/10.11888/Cryos.tpdc.272204, 2022.
Huang, Y., Liu, H., Yu, B., Wu, J., Kang, E. L., Xu, M., Wang, S., Klein, A., and Chen, Y.: Improving MODIS snow products with a HMRF-based spatio-temporal modeling technique in the Upper Rio Grande Basin, Remote Sens. Environ., 204, 568–582, https://doi.org/10.1016/j.rse.2017.10.001, 2018.
Huang, Y., Song, Z. C., Yang, H. X., Yu, B. L., Liu, H. X., Che, T., Chen, J., Wu, J. P., Shu, S., Peng, X. B., Zheng, Z. J., and Xu, J. H.: Snow cover detection in mid-latitude mountainous and polar regions using nighttime light data, Remote Sens. Environ., 268, 112766, https://doi.org/10.1016/j.rse.2021.112766, 2022a.
Huang, Y., Xu, J., Xu, J., Zhao, Y., Yu, B., Liu, H., Wang, S., Xu, W., Wu, J., and Zheng, Z.: HMRFS–TP: long-term daily gap-free snow cover products over the Tibetan Plateau from 2002 to 2021 based on hidden Markov random field model, Earth Syst. Sci. Data, 14, 4445–4462, https://doi.org/10.5194/essd-14-4445-2022, 2022b.
Jain, S. K., Goswami, A., and Saraf, A. K.: Role of elevation and aspect in snow distribution in Western Himalaya, Water Resour. Manag., 23, 71–83, https://doi.org/10.1007/s11269-008-9265-5, 2008.
Ji, Z., Kang, S., Cong, Z., Zhang, Q., and Yao, T.: Simulation of carbonaceous aerosols over the third pole and adjacent regions: distribution, transportation, deposition, and climatic effects, Clim. Dynam., 45, 2831–2846, https://doi.org/10.1007/s00382-015-2509-1, 2015.
Kang, S., Zhang, Q., Qian, Y., Ji, Z., Li, C., Cong, Z., Zhang, Y., Guo, J., Du, W., Huang, J., You, Q., Panday, A. K., Rupakheti, M., Chen, D., Gustafsson, O., Thiemens, M. H., and Qin, D.: Linking atmospheric pollution to cryospheric change in the Third Pole region: current progress and future prospects, Natl. Sci. Rev., 6, 796–809, https://doi.org/10.1093/nsr/nwz031, 2019.
Keyser, S. R., Fink, D., Gudex-Cross, D., Radeloff, V. C., Pauli, J. N., and Zuckerberg, B.: Snow cover dynamics: an overlooked yet important feature of winter bird occurrence and abundance across the United States, Ecography, 2023, e06378, https://doi.org/10.1111/ecog.06378, 2022.
Kraaijenbrink, P. D. A., Stigter, E. E., Yao, T., and Immerzeel, W. W.: Climate change decisive for Asia's snow meltwater supply, Nat. Clim. Change, 11, 591–597, https://doi.org/10.1038/s41558-021-01074-x, 2021.
Lau, W. and Kim, K.-M.: Impact of Snow Darkening by Deposition of Light-Absorbing Aerosols on Snow Cover in the Himalayas–Tibetan Plateau and Influence on the Asian Summer Monsoon: A Possible Mechanism for the Blanford Hypothesis, Atmosphere, 9, 438, https://doi.org/10.3390/atmos9110438, 2018.
Li, H., Wang, J., and Hao, X.: Influence of Blowing Snow on Snow Mass and Energy Exchanges in the Qilian Mountainous, Journal of Glaciology and Geocryology, 34, 1084–1090, 2012 (in Chinese).
Li, K., Li, H., Wang, L., and Gao, W.: On the relationship between local topography and small glacier change under climatic warming on Mt. Bogda, Eastern Tian Shan, China, J. Earth Sci.-China, 22, 515–527, https://doi.org/10.1007/s12583-011-0204-7, 2011.
Li, W., Qiu, B., Guo, W., Zhu, Z., and Hsu, P. C.: Intraseasonal variability of Tibetan Plateau snow cover, Int. J. Climatol., 40, 3451–3466, https://doi.org/10.1002/joc.6407, 2019.
Li, W., Chen, J., Li, L., Orsolini, Y. J., Xiang, Y., Senan, R., and de Rosnay, P.: Impacts of snow assimilation on seasonal snow and meteorological forecasts for the Tibetan Plateau, The Cryosphere, 16, 4985–5000, https://doi.org/10.5194/tc-16-4985-2022, 2022.
Lopatin, J., Kattenborn, T., Galleguillos, M., Perez-Quezada, J. F., and Schmidtlein, S.: Using aboveground vegetation attributes as proxies for mapping peatland belowground carbon stocks, Remote Sens. Environ., 231, 111217, https://doi.org/10.1016/j.rse.2019.111217, 2019.
Ma, H., Zhang, G., Mao, R., Su, B., Liu, W., and Shi, P.: Snow depth variability across the Qinghai Plateau and its influencing factors during 1980–2018, Int. J. Climatol., 43, 1094–1111, https://doi.org/10.1002/joc.7883, 2022.
Ma, N., Yu, K., Zhang, Y., Zhai, J., Zhang, Y., and Zhang, H.: Ground observed climatology and trend in snow cover phenology across China with consideration of snow-free breaks, Clim. Dynam., 55, 2867–2887, https://doi.org/10.1007/s00382-020-05422-z, 2020.
Ma, Q., Keyimu, M., Li, X., Wu, S., Zeng, F., and Lin, L.: Climate and elevation control snow depth and snow phenology on the Tibetan Plateau, J. Hydrol., 617, 128938, https://doi.org/10.1016/j.jhydrol.2022.128938, 2023.
Moran-Tejeda, E., Lopez-Moreno, J. I., and Beniston, M.: The changing roles of temperature and precipitation on snowpack variability in Switzerland as a function of altitude, Geophys. Res. Lett., 40, 2131–2136, https://doi.org/10.1002/grl.50463, 2013.
Notarnicola, C.: Hotspots of snow cover changes in global mountain regions over 2000–2018, Remote Sens. Environ., 243, 111781, https://doi.org/10.1016/j.rse.2020.111781, 2020.
Pulliainen, J., Luojus, K., Derksen, C., Mudryk, L., Lemmetyinen, J., Salminen, M., Ikonen, J., Takala, M., Cohen, J., Smolander, T., and Norberg, J.: Patterns and trends of Northern Hemisphere snow mass from 1980 to 2018, Nature, 581, 294–298, https://doi.org/10.1038/s41586-020-2258-0, 2020.
Qi, Y., Wang, H., Ma, X., Zhang, J., and Yang, R.: Relationship between vegetation phenology and snow cover changes during 2001–2018 in the Qilian Mountains, Ecol. Indic., 133, 108351, https://doi.org/10.1016/j.ecolind.2021.108351, 2021.
Ren, Y. and Liu, S.: Different influences of temperature on snow cover and sea ice area in the Northern Hemisphere, Geogr. Res., 37, 870–882, 2018 (in Chinese).
Ringle, M., Sarstedt, M., and Straub, W.: Editor's comments: a critical look at the use of PLS-SEM in “MIS Quarterly”, MIS Quarterly, 36, 3–14, https://doi.org/10.2307/41410402, 2012.
Rixen, C., Høye, T. T., Macek, P., Aerts, R., Alatalo, J. M., Anderson, J. T., Arnold, P. A., Barrio, I. C., Bjerke, J. W., Björkman, M. P., Blok, D., Blume-Werry, G., Boike, J., Bokhorst, S., Carbognani, M., Christiansen, C. T., Convey, P., Cooper, E. J., Cornelissen, J. H. C., Coulson, S. J., Dorrepaal, E., Elberling, B., Elmendorf, S. C., Elphinstone, C., Forte, T. a. G. W., Frei, E. R., Geange, S. R., Gehrmann, F., Gibson, C., Grogan, P., Halbritter, A. H., Harte, J., Henry, G. H. R., Inouye, D. W., Irwin, R. E., Jespersen, G., Jónsdóttir, I. S., Jung, J. Y., Klinges, D. H., Kudo, G., Lämsä, J., Lee, H., Lembrechts, J. J., Lett, S., Lynn, J. S., Mann, H. M. R., Mastepanov, M., Morse, J., Myers-Smith, I. H., Olofsson, J., Paavola, R., Petraglia, A., Phoenix, G. K., Semenchuk, P., Siewert, M. B., Slatyer, R., Spasojevic, M. J., Suding, K., Sullivan, P., Thompson, K. L., Väisänen, M., Vandvik, V., Venn, S., Walz, J., Way, R., Welker, J. M., Wipf, S., and Zong, S.: Winters are changing: snow effects on Arctic and alpine tundra ecosystems, Arctic Science, 8, 572–608, https://doi.org/10.1139/as-2020-0058, 2022.
Scalzitti, J., Strong, C., and Kochanski, A.: Climate change impact on the roles of temperature and precipitation in western U.S. snowpack variability, Geophys. Res. Lett., 43, 5361–5369, https://doi.org/10.1002/2016gl068798, 2016.
Sen, P. K.: Estimates of the regression coefficient based on Kendall's Tau, J. Am. Stat. Assoc., 63, 1379–1389, https://doi.org/10.1080/01621459.1968.10480934, 1968.
Shen, M., Wang, S., Jiang, N., Sun, J., Cao, R., Ling, X., Fang, B., Zhang, L., Zhang, L., Xu, X., Lv, W., Li, B., Sun, Q., Meng, F., Jiang, Y., Dorji, T., Fu, Y., Iler, A., Vitasse, Y., Steltzer, H., Ji, Z., Zhao, W., Piao, S., and Fu, B.: Plant phenology changes and drivers on the Qinghai–Tibetan Plateau, Nature Reviews Earth & Environment, 3, 633–651, https://doi.org/10.1038/s43017-022-00317-5, 2022.
Tang, Z., Deng, G., Hu, G., Zhang, H., Pan, H., and Sang, G.: Satellite observed spatiotemporal variability of snow cover and snow phenology over high mountain Asia from 2002 to 2021, J. Hydrol., 613, 128438, https://doi.org/10.1016/j.jhydrol.2022.128438, 2022.
Tarca, G., Guglielmin, M., Convey, P., Worland, M. R., and Cannone, N.: Small-scale spatial–temporal variability in snow cover and relationships with vegetation and climate in maritime Antarctica, Catena, 208, 105739, https://doi.org/10.1016/j.catena.2021.105739, 2022.
Theil, H.: A rank-invariant method of linear and polynomial regression analysis, Springer Netherlands, https://doi.org/10.1007/978-94-011-2546-8_20, 1992.
Venturini, S. and Mehmetoglu, M.: plssem: a stata package for structural equation modeling with partial least squares, J. Stat. Softw., 88, 1–35, https://doi.org/10.18637/jss.v088.i08, 2019.
Vermote, E.: MODIS/Terra Surface Reflectance 8-Day L3 Global 500m SIN Grid V061, NASA EOSDIS Land Processes Distributed Active Archive Center [data set], https://doi.org/10.5067/MODIS/MOD09A1.061, 2021.
Wang, H., Zhang, X., Xiao, P., Zhang, K., and Wu, S.: Elevation-dependent response of snow phenology to climate change from a remote sensing perspective: A case survey in the central Tianshan mountains from 2000 to 2019, Int. J. Climatol., 42, 1706–1722, https://doi.org/10.1002/joc.7330, 2021.
Wang, X., Wu, C., Wang, H., Gonsamo, A., and Liu, Z.: No evidence of widespread decline of snow cover on the Tibetan Plateau over 2000-2015, Scientific Reports, 7, 14645, https://doi.org/10.1038/s41598-017-15208-9, 2017.
Wang, X., Zhong, L., and Ma, Y.: Estimation of 30 m land surface temperatures over the entire Tibetan Plateau based on Landsat-7 ETM+ data and machine learning methods, Int. J. Digit. Earth, 15, 1038–1055, https://doi.org/10.1080/17538947.2022.2088873, 2022.
Wang, Z., Huang, L., and Shao, M. A.: Spatial variations and influencing factors of soil organic carbon under different land use types in the alpine region of Qinghai-Tibet Plateau, Catena, 220, 106706, https://doi.org/10.1016/j.catena.2022.106706, 2023.
Wu, G., Duan, A., Liu, Y., Mao, J., Ren, R., Bao, Q., He, B., Liu, B., and Hu, W.: Tibetan Plateau climate dynamics: recent research progress and outlook, Natl. Sci. Rev., 2, 100–116, https://doi.org/10.1093/nsr/nwu045, 2015.
Xie, Z., Hu, Z., Gu, L., Sun, G., Du, Y., and Yan, X.: Meteorological forcing datasets for blowing snow modeling on the Tibetan Plateau: evaluation and intercomparison, J. Hydrometeorol., 18, 2761–2780, https://doi.org/10.1175/jhm-d-17-0075.1, 2017.
Xu, J.: Snow phenology extraction, trend analysis, and M–K test for Tibetan plateau, Zenodo [code and data set], https://doi.org/10.5281/zenodo.10974477, 2024.
Xu, J., Tang, Y., Xu, J., Chen, J., Bai, K., Shu, S., Yu, B., Wu, J., and Huang, Y.: Evaluation of vegetation indexes and green-up date extraction methods on the Tibetan Plateau, Remote Sensing, 14, 3160, https://doi.org/10.3390/rs14133160, 2022a.
Xu, J., Tang, Y., Xu, J., Shu, S., Yu, B., Wu, J., and Huang, Y.: Impact of snow cover phenology on the vegetation green-up date on the Tibetan Plateau, Remote Sensing, 14, 3909, https://doi.org/10.3390/rs14163909, 2022b.
Yang, K., Jiang, Y., Tang, W., He, J., Shao, C., Zhou, X., Lu, H., Chen, Y., Li, X., Shi, J.: A high-resolution near-surface meteorological forcing dataset for the Third Pole region (TPMFD, 1979–2022), National Tibetan Plateau/Third Pole Environment Data Center [data set], https://doi.org/10.11888/Atmos.tpdc.300398, 2023.
Yang, W., Kobayashi, H., Wang, C., Shen, M., Chen, J., Matsushita, B., Tang, Y., Kim, Y., Bret-Harte, M. S., Zona, D., Oechel, W., and Kondoh, A.: A semi-analytical snow-free vegetation index for improving estimation of plant phenology in tundra and grassland ecosystems, Remote Sens. Environ., 228, 31–44, https://doi.org/10.1016/j.rse.2019.03.028, 2019.
Yao, T., Thompson, L. G., Mosbrugger, V., Zhang, F., Ma, Y., Luo, T., Xu, B., Yang, X., Joswiak, D. R., Wang, W., Joswiak, M. E., Devkota, L. P., Tayal, S., Jilani, R., and Fayziev, R.: Third Pole Environment (TPE), Environmental Development, 3, 52–64, https://doi.org/10.1016/j.envdev.2012.04.002, 2012.
You, Q., Wu, T., Shen, L., Pepin, N., Zhang, L., Jiang, Z., Wu, Z., Kang, S., and AghaKouchak, A.: Review of snow cover variation over the Tibetan Plateau and its influence on the broad climate system, Earth-Sci. Rev., 201, 103043, https://doi.org/10.1016/j.earscirev.2019.103043, 2020.
You, Q., Cai, Z., Pepin, N., Chen, D., Ahrens, B., Jiang, Z., Wu, F., Kang, S., Zhang, R., Wu, T., Wang, P., Li, M., Zuo, Z., Gao, Y., Zhai, P., and Zhang, Y.: Warming amplification over the Arctic Pole and Third Pole: trends, mechanisms and consequences, Earth-Sci. Rev., 217, 103625, https://doi.org/10.1016/j.earscirev.2021.103625, 2021.
Zhang, H., Immerzeel, W. W., Zhang, F., de Kok, R. J., Chen, D., and Yan, W.: Snow cover persistence reverses the altitudinal patterns of warming above and below 5000 m on the Tibetan Plateau, Sci. Total Environ., 803, 149889, https://doi.org/10.1016/j.scitotenv.2021.149889, 2022.
Zhang, Y., Kang, S., Sprenger, M., Cong, Z., Gao, T., Li, C., Tao, S., Li, X., Zhong, X., Xu, M., Meng, W., Neupane, B., Qin, X., and Sillanpää, M.: Black carbon and mineral dust in snow cover on the Tibetan Plateau, The Cryosphere, 12, 413–431, https://doi.org/10.5194/tc-12-413-2018, 2018.
Zhao, Q., Hao, X., Wang, J., Sun, X., and Li, H.: A dataset of snow cover phenology in China based on MODIS during 2000–2020, China Scientific Data, 7, 1–10, https://doi.org/10.11922/11-6035.ncdc.2021.0027.zh, 2022.