the Creative Commons Attribution 4.0 License.
the Creative Commons Attribution 4.0 License.
 | 17 Apr 2024
InSAR-measured permafrost degradation of palsa peatlands in northern Sweden
Samuel Valman
Matthias B. Siewert
Doreen Boyd
Martha Ledger
David Gee
Betsabé de la Barreda-Bautista
Andrew Sowter
Sofie Sjögersten
Climate warming is degrading palsa peatlands across the circumpolar permafrost region. Permafrost degradation may lead to ecosystem collapse and potentially strong climate feedbacks, as this ecosystem is an important carbon store and can transition to being a strong greenhouse gas emitter. Landscape-level measurement of permafrost degradation is needed to monitor this impact of warming. Surface subsidence is a useful metric of change in palsa degradation and can be monitored using interferometric synthetic-aperture radar (InSAR) satellite technology. We combined InSAR data, processed using the ASPIS algorithm to monitor ground motion between 2017 and 2021, with airborne optical and lidar data to investigate the rate of subsidence across palsa peatlands in northern Sweden. We show that 55 % of Sweden's eight largest palsa peatlands are currently subsiding, which can be attributed to the underlying permafrost landforms and their degradation. The most rapid degradation has occurred in the largest palsa complexes in the most northern part of the region of study, also corresponding to the areas with the highest percentage of palsa cover within the overall mapped wetland area. Further, higher degradation rates have been found in areas where winter precipitation has increased substantially. The roughness index calculated from a lidar-derived digital elevation model (DEM), used as a proxy for degradation, increases alongside subsidence rates and may be used as a complementary proxy for palsa degradation. We show that combining datasets captured using remote sensing enables regional-scale estimation of ongoing permafrost degradation, an important step towards estimating the future impact of climate change on permafrost-dependent ecosystems.
- Article
(8823 KB) - Full-text XML
-
Supplement
(2968 KB) - BibTeX
- EndNote


Permafrost regions are critical components in the climate system due to their essential carbon (C) storage service (Harris et al., 2022). The circumpolar permafrost region in particular stores around 1300±200 Pg of organic C, corresponding to around 50 % of the global terrestrial C pool (Hugelius et al., 2020; Köchy et al., 2015). It covers around 21×106 km2 (or 22 %) of the Northern Hemisphere's exposed land surface (Obu, 2021). Northern peatlands themselves store an estimated 415±150 Pg of C in an area covering around 3.7×10⁶ km2; approximately 1.7×10⁶ km2 of this area is permafrost within the circumpolar permafrost region in discontinuous and sporadic permafrost zones (Hugelius et al., 2020). Permafrost in these peatlands raises the surface above the water table forming so-called palsas or, in extended form, peat plateaux (Seppälä, 2011). These account for substantial areas of global permafrost, including in northern Fennoscandia (Ballantyne, 2018; Gisnås et al., 2017; Tarnocai et al., 2009). In northern Sweden, 137 km2 of these palsas have been recorded from field reports (Backe, 2014). Climate warming, and the associated alteration in the precipitation regime, is increasingly recognised to be a particular threat to permafrost (Biskaborn et al., 2019), with the subarctic Fennoscandian permafrost region, and the palsa within, being particularly vulnerable (Christiansen et al., 2010; Farbrot et al., 2013).
Modelling studies project unsuitable conditions for permafrost within the coming century, with the most pessimistic estimates projecting unsuitability even sooner – by 2040 in Fennoscandia (Chadburn et al., 2017; Fewster et al., 2022; Leppiniemi et al., 2023). As palsas are often found in the sporadic or discontinuous permafrost zone (Zuidhoff and Kolstrup, 2000), they are particularly sensitive to climate warming and any resultant permafrost thaw and disappearance. Their sensitivity mainly results from alterations to the thermal insulation effect of peat deposits and snow as the climate changes (Seppälä, 2011; Smith and Riseborough, 1996). Specifically, organic peat has a high thermal conductivity when wet and frozen but a low conductivity when dry and thawed. Moreover, snow has a highly insulating effect on ground temperature. Thus, extended periods of air temperatures below 0 °C and thin snow cover in winter are beneficial to maintain or grow the perennial frozen core of palsas and peat plateaux. Low summer precipitation, which reduces the thermal conductivity of peat, also helps to preserve the frozen cores in palsas. In contrast, increased snowfall has been linked to permafrost degradation, as it increases winter insulation. Further, high summer precipitation leads to higher thermal conductivity of peat and, when combined with warm summer temperatures, can degrade permafrost by increasing permafrost temperatures and the subsequent thawing of the frozen peat core of palsas. The strong insulating properties of peat allow the occurrence of permafrost at the southern extent of the northern permafrost region and valley bottoms, in areas otherwise too warm for permafrost (Johansson et al., 2013; Seppälä, 2011; Smith and Riseborough, 1996).
Warming of the permafrost in palsas typically leads to top-down thaw at the surface, i.e. thickening of the active layer, and eventual subsidence of the surface as well as to lateral thaw, sometimes called abrupt thaw or thermokarst, which occurs at the margin of peat plateaux and palsa edges (Seppälä, 2011; Smith and Riseborough, 1996; Zuidhoff, 2002). This is often associated with water-logged conditions and, as a result, increased methane (CH4) emissions (Glagolev et al., 2011; Hugelius et al., 2020; Matthews et al., 1997; Miglovets et al., 2021; Schuur et al., 2009; Turetsky et al., 2020; Varner et al., 2022), which are a central theme for permafrost research (Sjöberg et al., 2020). A subsequent impact of this permafrost degradation is an alteration in vegetation cover, its hydrology, and human use of the landscape (e.g. infrastructure and reindeer husbandry) (Markkula et al., 2019; Ramage et al., 2021). Given the potentially large impacts of permafrost thaw on the global climate, ecosystem function, and human activity, quantification and monitoring of the subsidence in peat deposits affected by permafrost thaw and degradation, as well as an understanding of their sensitivity to changing climatic parameters, is urgently required (IPCC, 2021).
The degradation of the permafrost of palsas has been observed right across the circumpolar permafrost region in a number of studies, including in northern Scandinavia (Åkerman and Johansson, 2008; de la Barreda-Bautista et al., 2022; Luoto and Seppälä, 2003; Olvmo et al., 2020; Sannel et al., 2016; Varner et al., 2022); Russia (Glagolev et al., 2011; Miglovets et al., 2021; van Huissteden et al., 2021), the USA (Douglas et al., 2021, 2015; Sannel, 2020), and Canada (Mamet et al., 2017; Sannel and Kuhry, 2011; Short et al., 2014; Vallée and Payette, 2007). Although rapid degradation in response to short-term climatic events has been observed, permafrost degradation has typically been investigated via long-term monitoring at decadal timescales in response to changes in temperature and precipitation conditions (Åkerman and Johansson, 2008; de la Barreda-Bautista et al., 2022; Olvmo et al., 2020; Sannel et al., 2016). These longer-term studies have shown strong relationships between permafrost degradation and summer temperatures, length of the thaw period, winter precipitation, and snow depth (Smith et al., 2022). These types of analyses are very useful for quantifying how much of the landscape has already transitioned and understanding the climate change drivers behind these changes, but they do not capture the initial stages of permafrost degradation in palsas and the lower rates of subsidence that have yet to result in observable changes in the vegetation or thermokarst formation. The latter is crucial to understand the ongoing response of palsas to climate warming and to predict when pulses of greenhouse gases to the atmosphere and other impacts (e.g. on infrastructure) are likely to occur. Thus, we need approaches that detect early signs of degradation at landscape scales, with repeated observations.
Due to the vast extent and remoteness of permafrost areas, there is no current complete annual degradation rate measurements. Therefore, we looked to satellite remote sensing to underpin the measurement and monitoring assessment of permafrost peatlands, their degradation, and resultant climate impacts (Hugelius et al., 2020; Swingedouw et al., 2020). Optical remote-sensing approaches can be augmented with radar remote-sensing methods, including interferometric synthetic-aperture radar (InSAR), to capture the early response of permafrost to warming. These methods can detect vertical land surface motion at millimetre precision across a range of natural landscapes, with greater confidence in the direction of surface motion than the absolute magnitude (Alshammari et al., 2020, 2018; Bartsch et al., 2016; de la Barreda-Bautista et al., 2022; Short et al., 2014; van Huissteden et al., 2021). The regular sampling frequency, insensitivity to cloud, and (in the case of Sentinel-1) low cost mean that InSAR from Sentinel-1 should be well suited to measure and monitor ongoing changes in permafrost affected by climate change. Further, Sentinel-1 for InSAR is effective at both local and regional scales: the 20 m×20 m spatial resolution enables measurement of surface motion within local sites (de la Barreda-Bautista et al., 2022) as well as over entire and complex landscapes, such as the circumpolar permafrost region (Reinosch et al., 2020).
The overall aim of this study was to carry out a regional-scale analysis of permafrost degradation across the palsas of northern Sweden, principally using Sentinel-1 InSAR-derived subsidence as an indication of degradation. Pertinent to this is that any InSAR-detected changes can be associated with known and delineated targets in the wider landscape. Further, it is also important to understand any within-site dynamics of permafrost degradation. Therefore, this paper has the following specific objectives: (i) measure the subsidence rate of all major palsa complexes in the region of northern Sweden between 2017 and 2021, (ii) determine the palsa complexes in which subsidence is greatest, and (iii) assess if the spatial patterns of degradation can be linked to climatic variables and properties of the different sites across the region. To achieve these objectives, we combined large-scale regional analysis with higher-resolution site-specific analysis of patterns in subsidence, using a combination of datasets: satellite (Sentinel-1) InSAR; occupied airborne optical and lidar data; and snow depth, precipitation, and temperature time series from meteorological stations across the region.
2.1 Study area
This study focused on a region containing palsas that is located between 68.84–67.64° N and 18.71–21.19° E in the northern part of Sweden. The palsas of the region are confined predominantly to valley bottoms in an elevation range of between ca. 350 and 590 m a.s.l. (metres above sea level; Fig. 1). The rest of the study area is comprised of forests and/or mountain land covers (Siewert, 2018; Åkerman and Johansson, 2008). Of all of the palsas in the region, the eight largest concentrated palsa complexes range between 50 and 273 ha in area (Table 1). These were located across the region, which covers a ca. 20 000 km2 area, with the largest palsa sites located in the north-west. Smaller palsas occur scattered in distribution right across the region. The climate varies from north to south (https://www.smhi.se, last access: 3 February 2024). The mean January and July temperatures in Karesuando in the northern part of the region are −16 and 12.8 °C, respectively, whereas in Kiruna, slightly further south, the mean respective January and July temperatures are −11.6 and 13.4 °C (1991–2020 average). Mean annual precipitation is 443 and 560 mm in Karesuando and Kiruna, respectively.

Figure 1Map of the palsas in Sweden that were investigated in this study, focusing on the eight named palsa complexes. The black regions show all of the palsas that have been reported to exist (Backe, 2014), with the larger defined areas displaying the 250 m buffers around the palsa areas that have created continuous expanses. Meteorological station positions used in the study are also indicated.
A previous national palsa mapping dataset provided raster cells at a spatial resolution of 100 m, with the percentage of palsa cover computed and a 250 m buffered output to provide continuous palsa area outputs (Backe, 2014). This afforded analyses at a spatial resolution suitable for comparison with Sentinel-1 while also providing a practical representation of the condition of the palsas in this region. All of these data were analysed in this study, but the eight largest continuous areas of these palsas (Backe, 2014) were focused on, hereafter referred to as palsa complexes – a term reflecting their mosaic nature of raised palsas and/or peatland plateaux interspersed with lower-lying fen or thermokarst areas. These eight sites account for the majority of the palsa areas in Sweden; the sites are listed in Table 1 along with some associated information on their status and total and raised palsa plateaux areas.
Table 1Information on the major palsa complexes analysed in this paper (Backe, 2014). The protection status means no or limited direct anthropogenic activities that may influence palsa degradation. Total site area is calculated from the total number of 100 m×100 m palsa pixels at each site; these pixels have associated percentages regarding how much of the 100 m×100 m area is palsas. The average of these percentages for each site displays the palsa density at each site. These percentages are then used to calculate the “total palsa area” for each site based on the original report estimates.

* SPA is a “Special Protection Area ”, SAC is a “Special Area of Conservation”, and SCI denotes a “Site of Community Importance”.
2.2 Datasets
The InSAR-derived dataset of surface motion over this northern Sweden region of study was calculated for the period from 2017 to 2021, from Single Look Complex (SLC) C-band SAR data that were captured in Interferometric Wide (IW) swath mode by the Sentinel-1 constellation (European Union's Copernicus Programme; Torres et al., 2012). SAR data input were from the thaw season, during which there was minimal snow and ice cover (i.e. between April and October in each year). Data from descending tracks 168 and 66 were used to cover the target area. Four stacks were processed independently, with one from track 168 and three from track 66, the latter of which was split into a northern, middle, and southern subset. The APSIS (formerly ISBAS) method (Sowter et al., 2013, 2016) was used to characterise surface motion; this relaxes the need for consistent phase stability and, therefore, enables near-complete spatial and temporal coverage over vegetated surfaces (Alshammari et al., 2020, 2018; Bradley et al., 2022; Cigna and Sowter, 2017; Gee et al., 2017; Sowter et al., 2016), including those found across snow-free permafrost regions.
InSAR processing of Sentinel-1 IW SLC imagery involved a series of steps, as summarised in Fig. 2. Firstly, deburst and merging involved combining individual sub-swaths into a single wide-area SLC product. Secondly, the process of deramping produced a product where the problem of an ambiguous and rapidly changing phase with azimuth was solved for; a specific deramping function is available for Sentinel-1 data (ESA, 2015). The next step involved the coregistration of each Sentinel-1 image to a common slant range coordinate system and multilooking of data by factors of 5 m in range and 20 m by azimuth. This produced a dataset with an approximate spatial resolution of 20 m×20 m. Using a perpendicular baseline of 250 m and maximum temporal baseline of 183 d, ∼2100 interferograms were generated per stack. The temporal baseline was chosen to balance the need to reduce the baseline to minimise phase ambiguities and best maintain coherence across the region, whilst also using a baseline long enough to generate season-to-season pairs over consecutive years. This is required over permafrost regions to capture more subtle trends in surface motion during the thaw period (de la Barreda-Bautista et al., 2022; Liu et al., 2010). The interferograms were unwrapped using a modified version of the SNAPHU algorithm (Chen and Zebker, 2001), which converts circular phase data into a linear measure of deformation. The algorithm was modified in order to allow for the ability to parallelise and to spread the calculation across multiple cores (Chen and Zebker, 2001). The multi-annual average velocity was calculated for pixels that maintained a coherence greater than 0.45 in a minimum of ∼650 interferograms, with respect to stable reference points located in the town of Kautokeino (69.00° N, 23.04° E) for track 168 and the towns of Narvik (68.44° N, 17.42° E), Kvikkjokk (66.95° N, 17.72° E), and Rognan (67.09° N, 15.39° E) for the subsets of track 66. The line-of-sight measurements were converted to vertical surface displacement using a cosine correction and finally mosaicked into a single deformation product. Localised UAV studies at sites in Sweden have verified the ability to use InSAR as a tool to monitor permafrost degradation (de la Barreda-Bautista et al., 2022).

Figure 2A flowchart summarising the steps undertaken in the InSAR processing using the APSIS method to create a surface motion product from Sentinel-1 IW SLC imagery. Boxes shaded grey represent datasets, whereas boxes with dotted borders represent processing steps. The figure is modified from Sowter et al. (2016).
In order to interpret the resultant surface motion dataset produced by the ASPIS InSAR method, two sets of additional data were sourced: (i) higher-resolution remote-sensing data and (ii) meteorological data. The former included orthophotos captured of the eight target areas by occupied airborne surveys commissioned by the Swedish Mapping, Cadastral and Land Registration Authority (https://www.lantmateriet.se, last access: 10 February 2024; © Lantmäteriet). The orthophotos (Lantmäteriet, 2021) have scenes covering a 5 km×5 km area, at a 0.5 m spatial resolution, and the majority were captured in 2021, although gaps were filled with imagery from 2018 for two sites. The Swedish national digital elevation model (DEM) was also used in this study. The DEM was derived via occupied airborne lidar data capture between 2013 and 2018 (Table 1) and processed to compute elevation at a 2 m spatial resolution across Sweden (https://www.lantmateriet.se, last access: 10 February 2024; © Lantmäteriet). The orthophotos and DEM provided elevation and landscape characteristics (geomorphic features) for use in this study. The meteorological data were captured by the Swedish Metrological and Hydrological Institute (https://www.smhi.se, last access: 3 February 2024) at meteorological stations across the region. Specifically, the air temperature, precipitation, and snow depth data were sourced and used from specific stations, i.e. those located closest to the palsa complexes under investigation, namely, at Abisko, Kiruna, Karesuando, Saarikoski, and Naimakka (Fig. 1).
2.3 Data analyses
2.3.1 Surface motion statistics
The ASPIS InSAR surface motion dataset was clipped to the 100m×100 m spatial resolution of the whole palsa dataset and separately to the eight palsa complexes (Backe, 2014). From this, the frequency distributions of ASPIS InSAR surface motion at these eight palsa complexes and over all individual palsa peatland raster cells in the region were produced. Using these data, the maximum and minimum rates of surface motion at each site were determined, as well as the sum of the pixels with palsas that showed subsidence. These derived data relating to surface motion were further interpreted using the orthophotos and DEMs, supported by the meteorological data.
2.3.2 Roughness thresholds
The DEM tiles were joined together and clipped to the eight palsa complexes. Following this, the degree of elevation roughness was calculated, via the native topographic roughness index function (Riley et al., 1999). This roughness index was thresholded at >0.5 to provide a visual depiction of palsa landform edges in the otherwise typically even terrain of the valley bottoms where the palsas occur. The roughness data were visually compared to the orthophotos from a subset of areas to assess their potential for delineating palsas, and this allowed us to determine a threshold value that connected these continuous terrain variables to the specific features of the palsa complexes, such as the raised mound structure of the palsas – so-called palsa mounds (Franklin, 2020). Hillshade was also calculated via the native QGIS function using the default formula, which uses a lighting effect to visualise the roughness of the terrain from differences in local elevation (QGIS, 2022). The roughness, hillshade, and elevation outputs were overlaid on the mapped palsa tiles to provide a higher-resolution visual interpretation.
2.3.3 Causes of surface motion
To test for the causes of surface motion, the palsa ASPIS InSAR surface motion was compared against the roughness, elevation, and palsa percentage provided with the palsa raster cells (Backe, 2014). The roughness, elevation, and InSAR outputs were resampled to the resolution of the mapped palsa tiles (100 m×100 m) to enable statistical comparison. The Zonal Statistics tool was used to extract mean average values from the resulting roughness and elevation outputs for the 100 m spatial resolution mapped palsa tiles.
To analyse the relationships between surface motion, roughness, and the palsa percentage in each 100 m×100 m pixel stratified by palsa complex, scipy stats (Virtanen et al., 2020) was used to obtain the Pearson correlation statistics, with an α value of 0.05 employed to test for significance. The pandas (McKinney, 2011) and NumPy (Harris et al., 2020) packages were used for data management. All scripts are available from GitHub (https://github.com/SamValman/Permafrost_Sweden, last access: 28 March 2024).
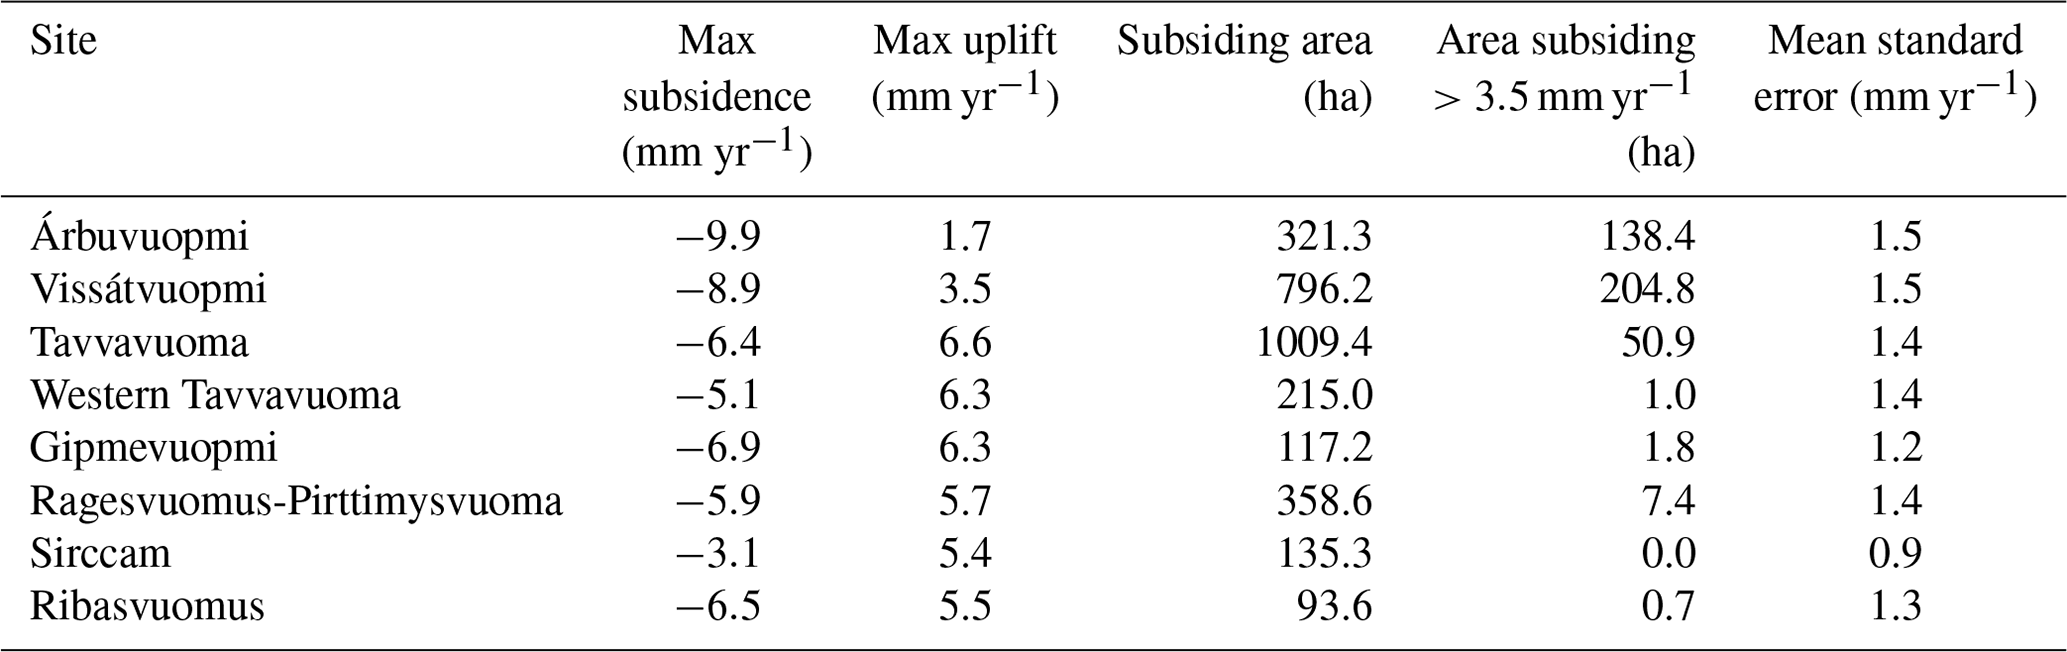
Table 2InSAR subsidence and uplift measurements of the palsa complexes defined in Fig. 1 and Table 1. The total palsa area was used to isolate and extract ASPIS InSAR measurements of surface motion at each of the eight sites.
2.3.4 Climatic factors
Mean annual, maximum, and minimum daily air temperature, precipitation, and depth of ground snow for the period from 2000 to 2022 from the meteorological station nearest to a correspondent palsa complex were extracted and analysed. Naimakka station did not record snow depth and Saarikoski station did not record air temperature; however, it was deemed that, at the regional scale of this study, these sites were sufficiently close together (18 km) to be interchangeable. Subsequently, data were averaged to provide an annual measurement of each meteorological variable for each station/palsa complex. Due to incomplete meteorological datasets, a longer-term record of the meteorological variables was not possible for all sites. However, long-term climate data (>100 years) were available from three meteorological stations in the region: Karesuando, Kiruna, and Abisko. These data were used to assess temporal variability in annual, winter (December–January–February, DJF), and summer (June–July–August, JJA) temperature, precipitation, and snowfall since the start of records across the region. Descriptive statistics (mean, minimum, maximum, and interquartile range) were produced to express the regional differences between these sites. Lastly, to complement the point-based meteorological (both weather and climate) data, we used modelled permafrost probabilities based on climatic conditions to explore relationships between climatic conditions (Obu et al., 2018) and subsidence rates. In this context, it is worth noting that there may be a mismatch between the modelled permafrost distribution and permafrost in palsa areas, as this can, in some areas, be a relic of cooler climatic conditions. We used the mean values from the roughness and InSAR data to resample to a 100 m spatial resolution, in line with the permafrost raster cells, and spatially joined the permafrost probability layer, taking the mean value where the 100 m cell straddled multiple permafrost probability cells.
The relationships between the meteorological variables, both over the last 2 decades at the weather stations closest to the palsa complexes and over the duration of the climate record at the three weather stations with the longest data series, were assessed using linear regression analysis in Genstat (VNS International Ltd.). Assumptions regarding normality and homogeneity of variance of the residuals were assessed using residual plots in Genstat. Some of the time series were incomplete; in these instances, the analysis was conducted using the slightly shorter time series (see Fig. 8).
3.1 Surface motion
The ASPIS InSAR-derived surface motion outputs for the time period of interest (2017–2021) ranged between −9.9 and 7.7 mm yr−1 across all of the palsa raster cells measured in northern Sweden, with a mean of 0.05, median of 0.2, and range of 17.7 mm yr−1. Focusing solely on the eight palsa complexes provided greater insight and excluded the most extreme uplift values from scattered individual palsas (Table 2). A total of 69 % of results were within the mean standard error (MSE) of changing ground motion direction.
The spatial plots of surface motion for each palsa complex (displayed in Fig. 3) illustrate patterns of surface motion (both subsidence and uplift and associated variance) across this northern Sweden region. This is evident both within the palsa complexes and between the complexes.
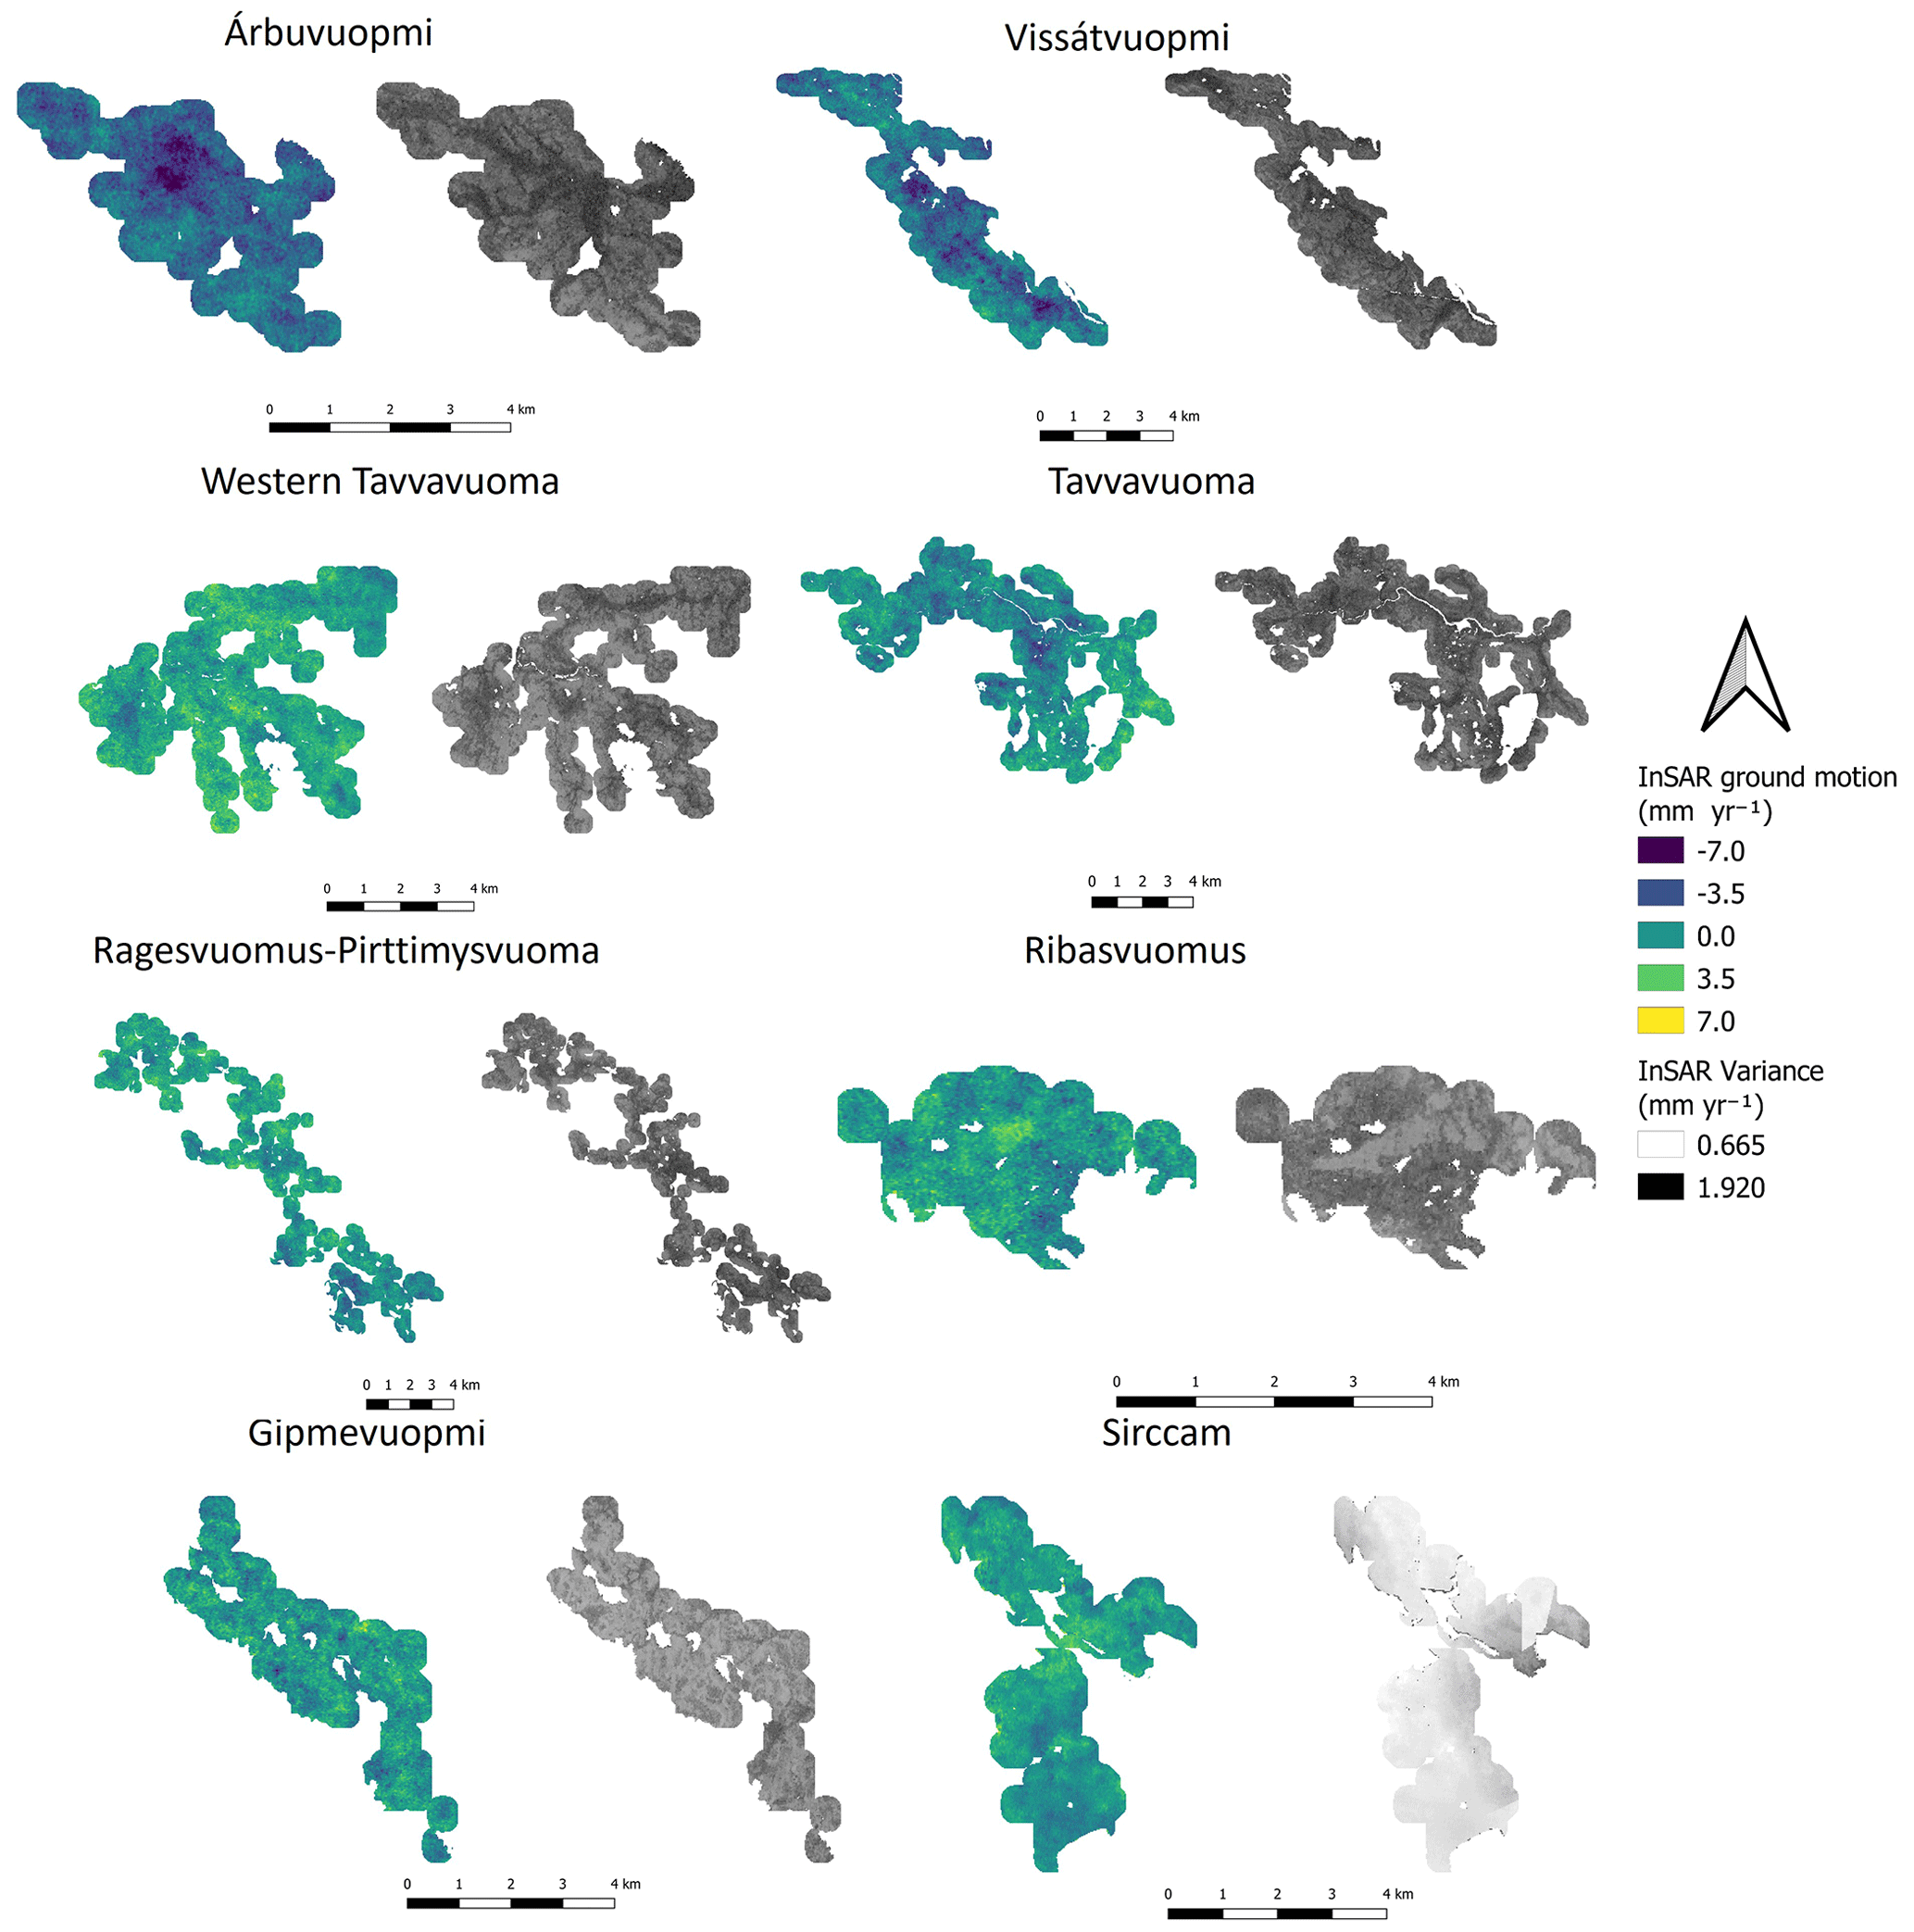
Figure 3Palsa ground motion measured using satellite InSAR from 2017 to 2021, showing differing levels of degradation across the eight study sites. Sites are ordered by their latitudinal position. Negative values correspond to subsidence. Note that, in order to plot continuous areas, the scenes shown are the palsa area and a 250 m buffer around each 100 m×100 m raster cell that covers a minimum of 1 % palsa (Backe, 2014). This means that areas of non-palsa peatland and some areas with mineral soil are included in the figure. ASPIS InSAR variance was less than 1.5 mm yr−1 in over 90 % of pixels.
Across the target sites, 3046.6 ha (Table 2) out of the total site area of 5523 ha (Table 1) was subsiding, which equates to ca 55 % of the total palsa complexes' area. Out of the subsiding parts of the palsa complexes, 405 ha was subsiding at rates of >3.5 mm yr−1 at a near-Gaussian distribution. However, it is evident from the frequency distribution plots that it is in the palsa complexes in the far north of the region that subsidence dominated the surface motion measured (Table 2, Fig. 4). At Vissátvuopmi and Árbuvuopmi, 98 % and 92 % of the palsa complexes were subsiding with maximum subsidence rates of −9.9 and −8.9 mm yr−1, respectively. The measured area affected by high subsidence rates (>3.5 mm yr−1) were 204.8 and 138.4 ha at Vissátvuopmi and Árbuvuopmi, respectively. This means that ca. 30 % of the total combined area of these two sites (1194 ha) is in the highest range of subsidence. The high degree of palsa subsidence at Vissátvuopmi and Árbuvuopmi was confirmed by field observations at these sites (Sofie Sjogersten, personal observation, 2022): both sites showed signs of active lateral erosions, large-scale subsidence, and thermokarst formation. The more southerly sites also showed subsidence, although ground motion rates were much more stable, with the −1 and 1 mm yr−1 range being most common (Fig. 4). Areas further to the south and west showed signs of uplift, particularly the western parts of Tavvavuoma and Ribasvuomus, with maximum rates of uplift of 6.3 mm across some smaller parts of these sites. However, all sites have some degree of subsidence, albeit at a lower rate compared with the heavily subsiding northern sites.
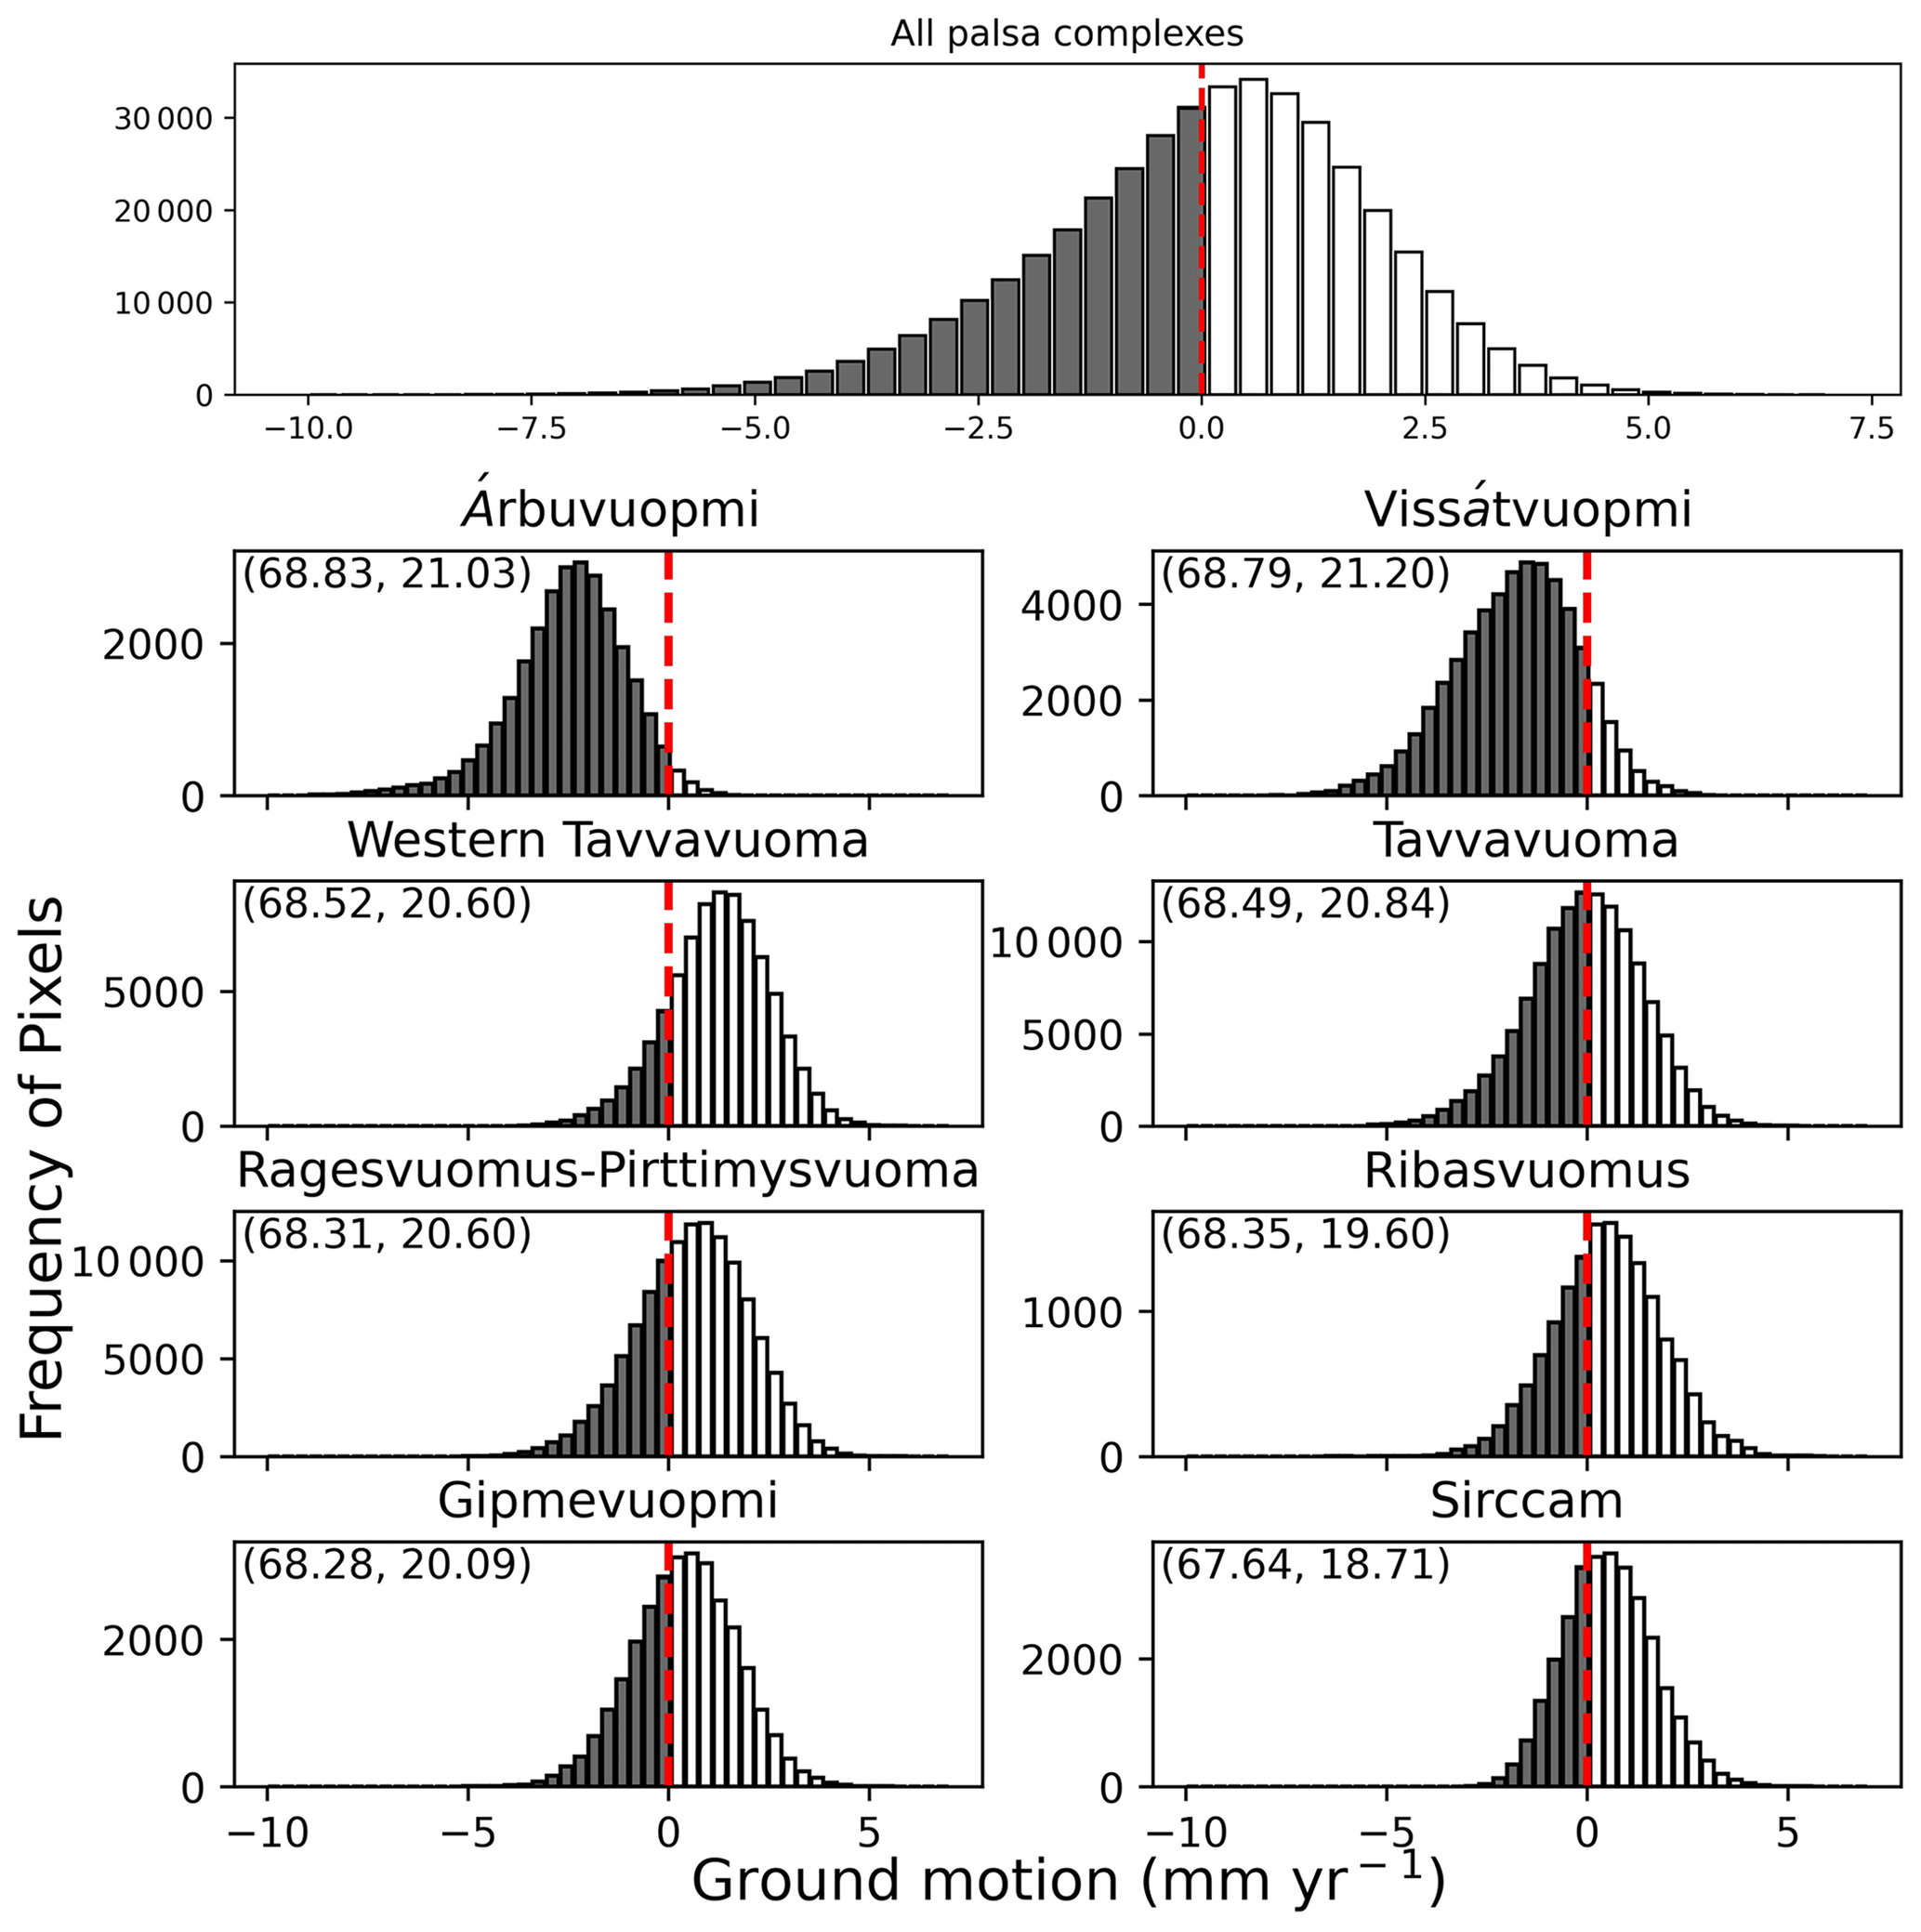
Figure 4Distribution of 20 m×20 m ASPIS InSAR pixels within each of the palsa complexes in this study and the overall trend of the dataset according to the distribution of pixel moving in a particular direct and at a given rate. Shaded areas with negative values correspond to subsidence. The dashed central lines indicate pixels in stable areas with no motion. The central points of latitude and longitude are provided in parentheses for each site.
3.2 Topographic drivers and indicators
Calculating the roughness index from the DEMs at each palsa complex enabled the differentiation of palsas from surrounding lower-lying and flat fen areas. Representative example complexes are shown in Figs. 5 and 6 for Vissátvuopmi and Western Tavvavuoma, respectively. Overall, the palsa complexes to the north (e.g. Fig. 5b, c) displayed a more pronounced topography across the focus areas than the more south-westerly ones (e.g. Fig. 6b, c). There was clear correspondence between the density of palsas and subsidence, i.e. areas with more palsas showed more subsidence (Fig. 5a, d). Further, the palsa complexes showed greater elevation variation compared with surrounding fen areas and were more densely clustered to the north than in the more south-westerly sites. These features spatially coincided with higher subsidence. Substantial within-site variability in subsidence was evident: the pixels with the highest subsidence rates were clustered together and followed landscapes features, e.g. palsa plateaux edges. It was evident that many separate palsa complexes in an area resulted in a high degree of elevation change, causing a high roughness index. In turn, areas with high roughness had the greatest subsidence (Figs. 5, 6). Visual comparison between orthophotos and roughness showed that areas of high roughness corresponded well with areas of severe permafrost degradation (as indicated by lateral erosion and thermokarst formation).
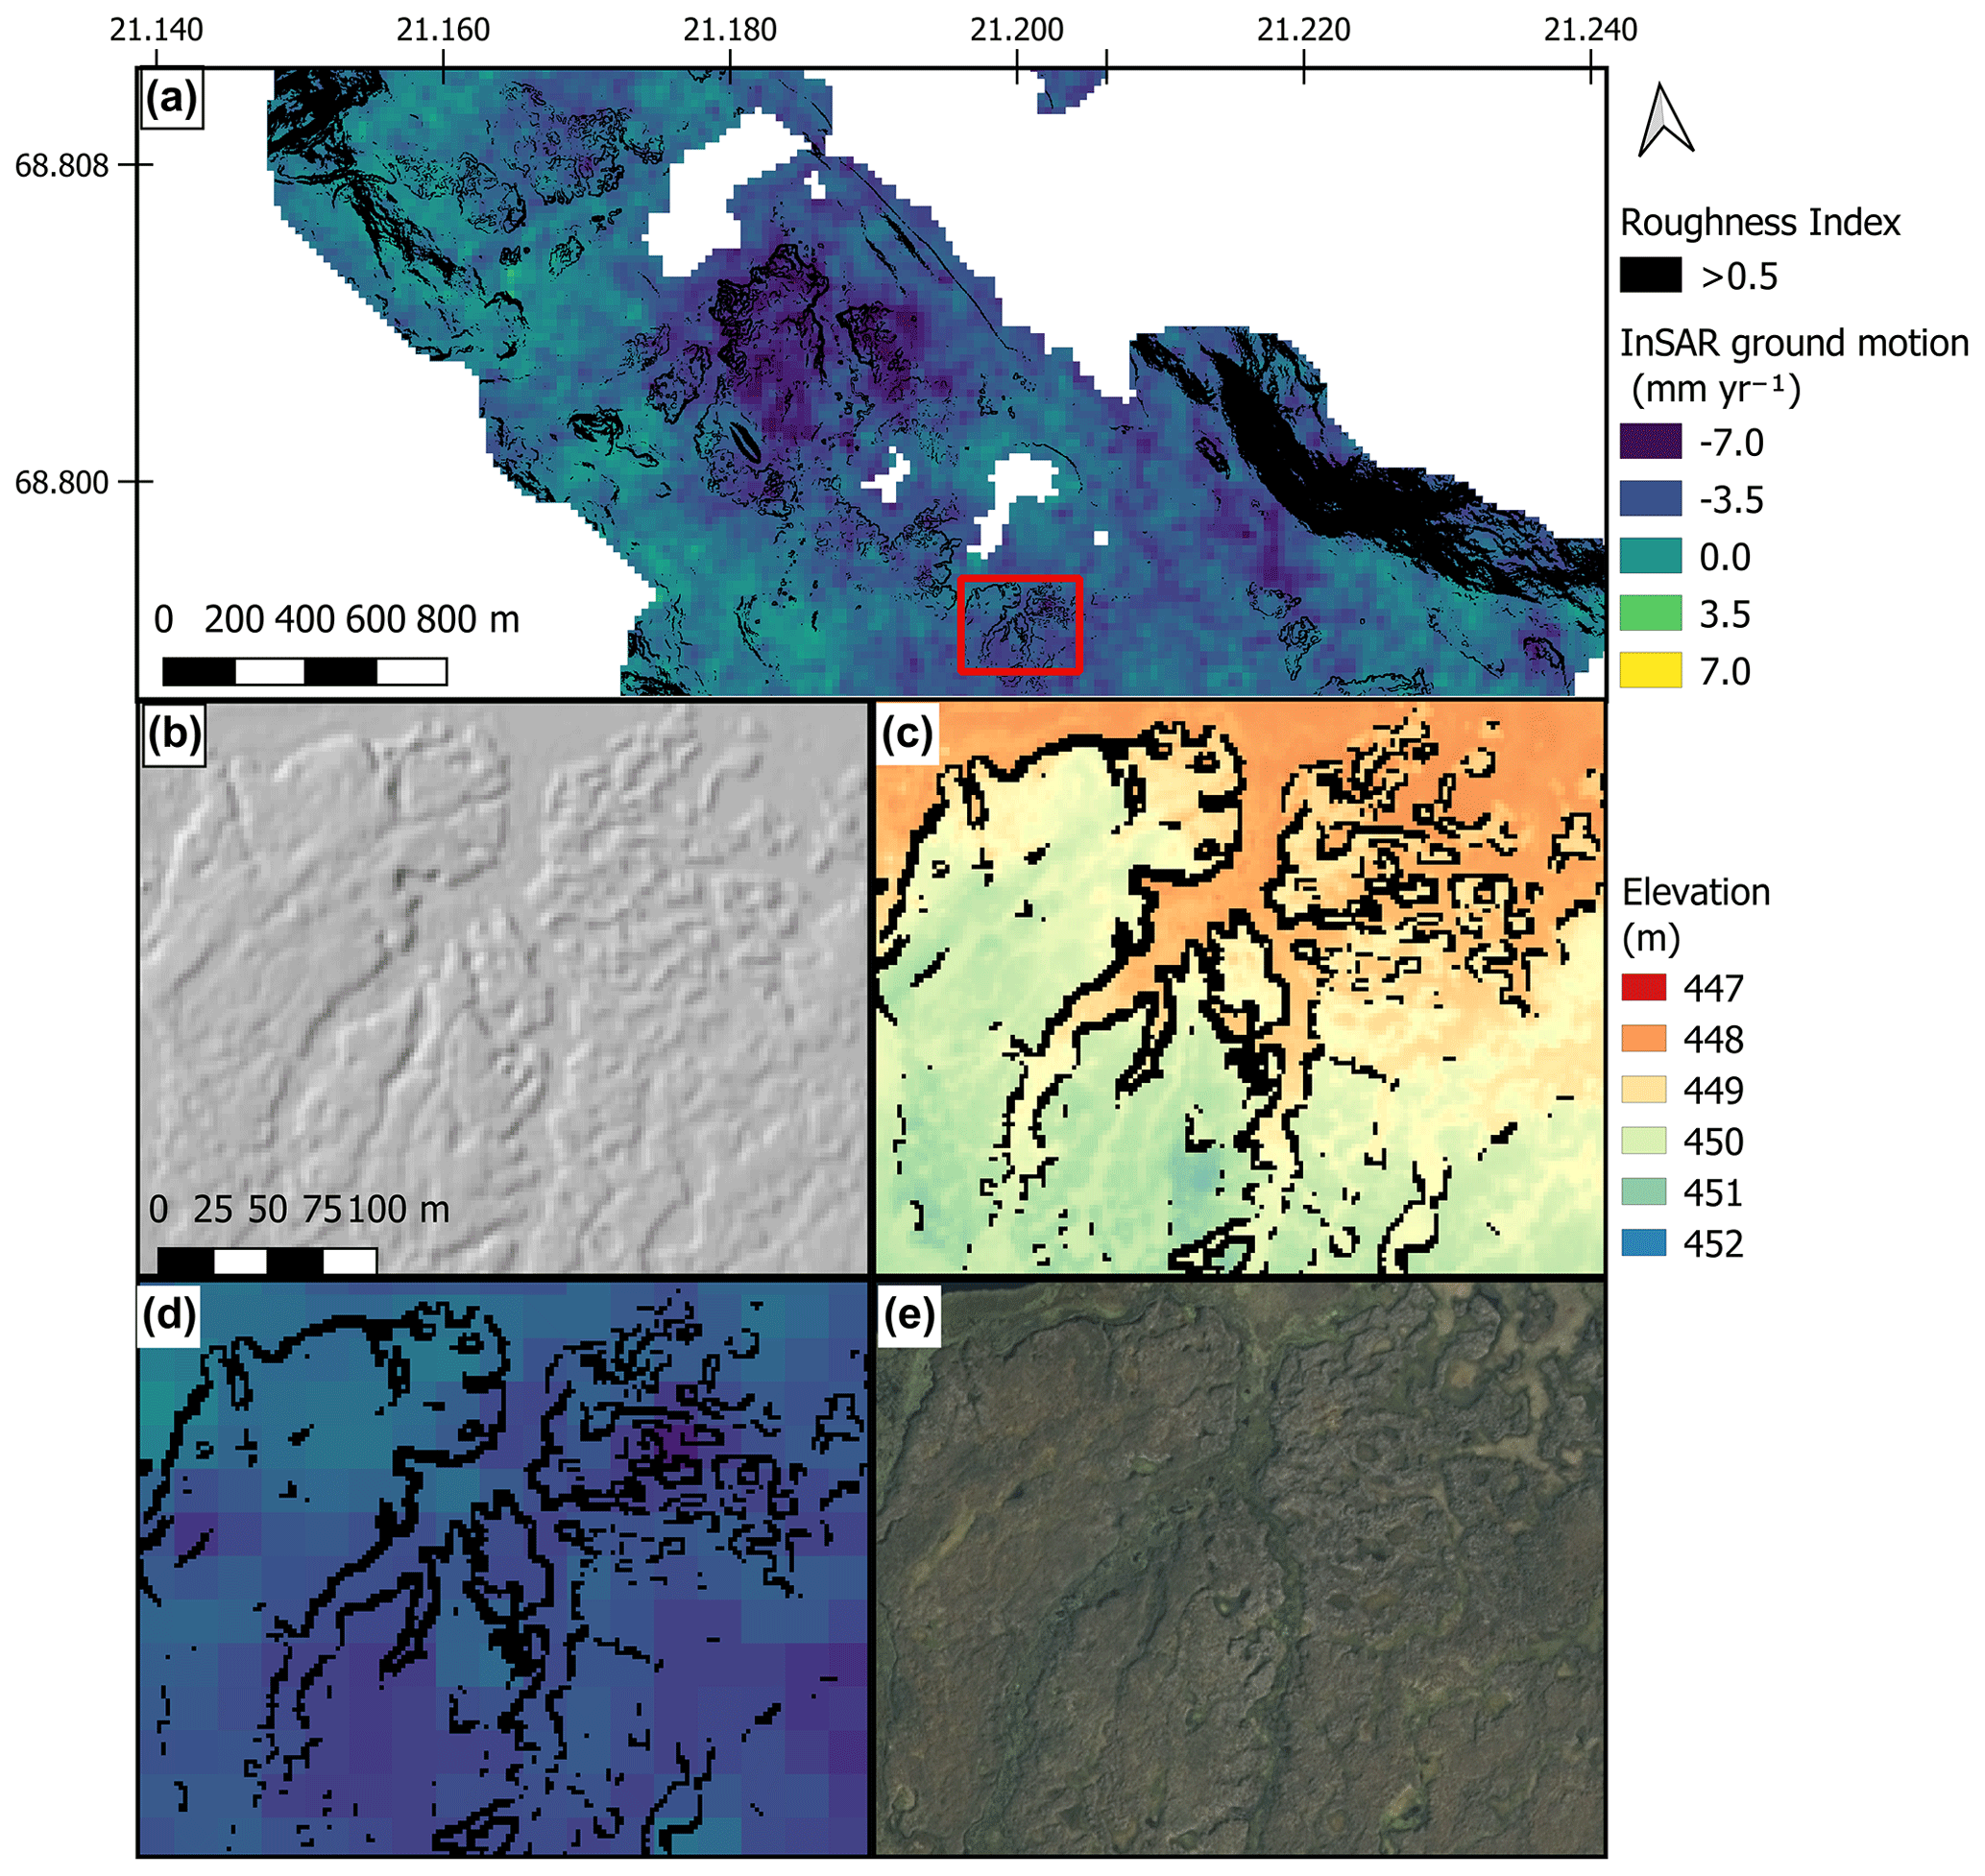
Figure 5Visual analysis of Vissátvuopmi, one of the sites where the most subsidence was found to be occurring. Evaluation of the correspondence of the hillshade DEM (b), DEM (c), and a close look at InSAR subsidence (d) with palsa complexes suggested by roughness overlays and aerial imagery (e). The positioning of panels (b), (c), and (d) within the larger site in panel (a) shows bands of subsidence proximal to roughness patches suggesting palsas.

Figure 6Visual analysis of Tavvavuoma, which was found to have much lower levels of subsidence in comparison to more northern sites. Evaluation of the correspondence of the hillshade DEM (b), DEM (c), and InSAR subsidence (d) with palsa complexes suggested by roughness overlays and aerial imagery (e). The positioning of panels (b), (c) and (d) within the larger site in panel (a) shows many less “bands” (linear arrangements of palsas across the image) of subsidence and potential palsas than in Fig. 4.
Regression analysis showed a relationship between roughness and subsidence, as sites with greater subsidence were also found to have greater roughness (Fig. 7a). A higher palsa percentage in a location was linearly related to subsidence, with the greatest subsidence found in areas with the highest palsa cover percentage (Fig. 7b). It was also clear that the modelled permafrost probability did not correspond to the palsa percentage, i.e. pixels with 100 % palsa are, in some instances, predicted to have no permafrost (Fig. 7b).
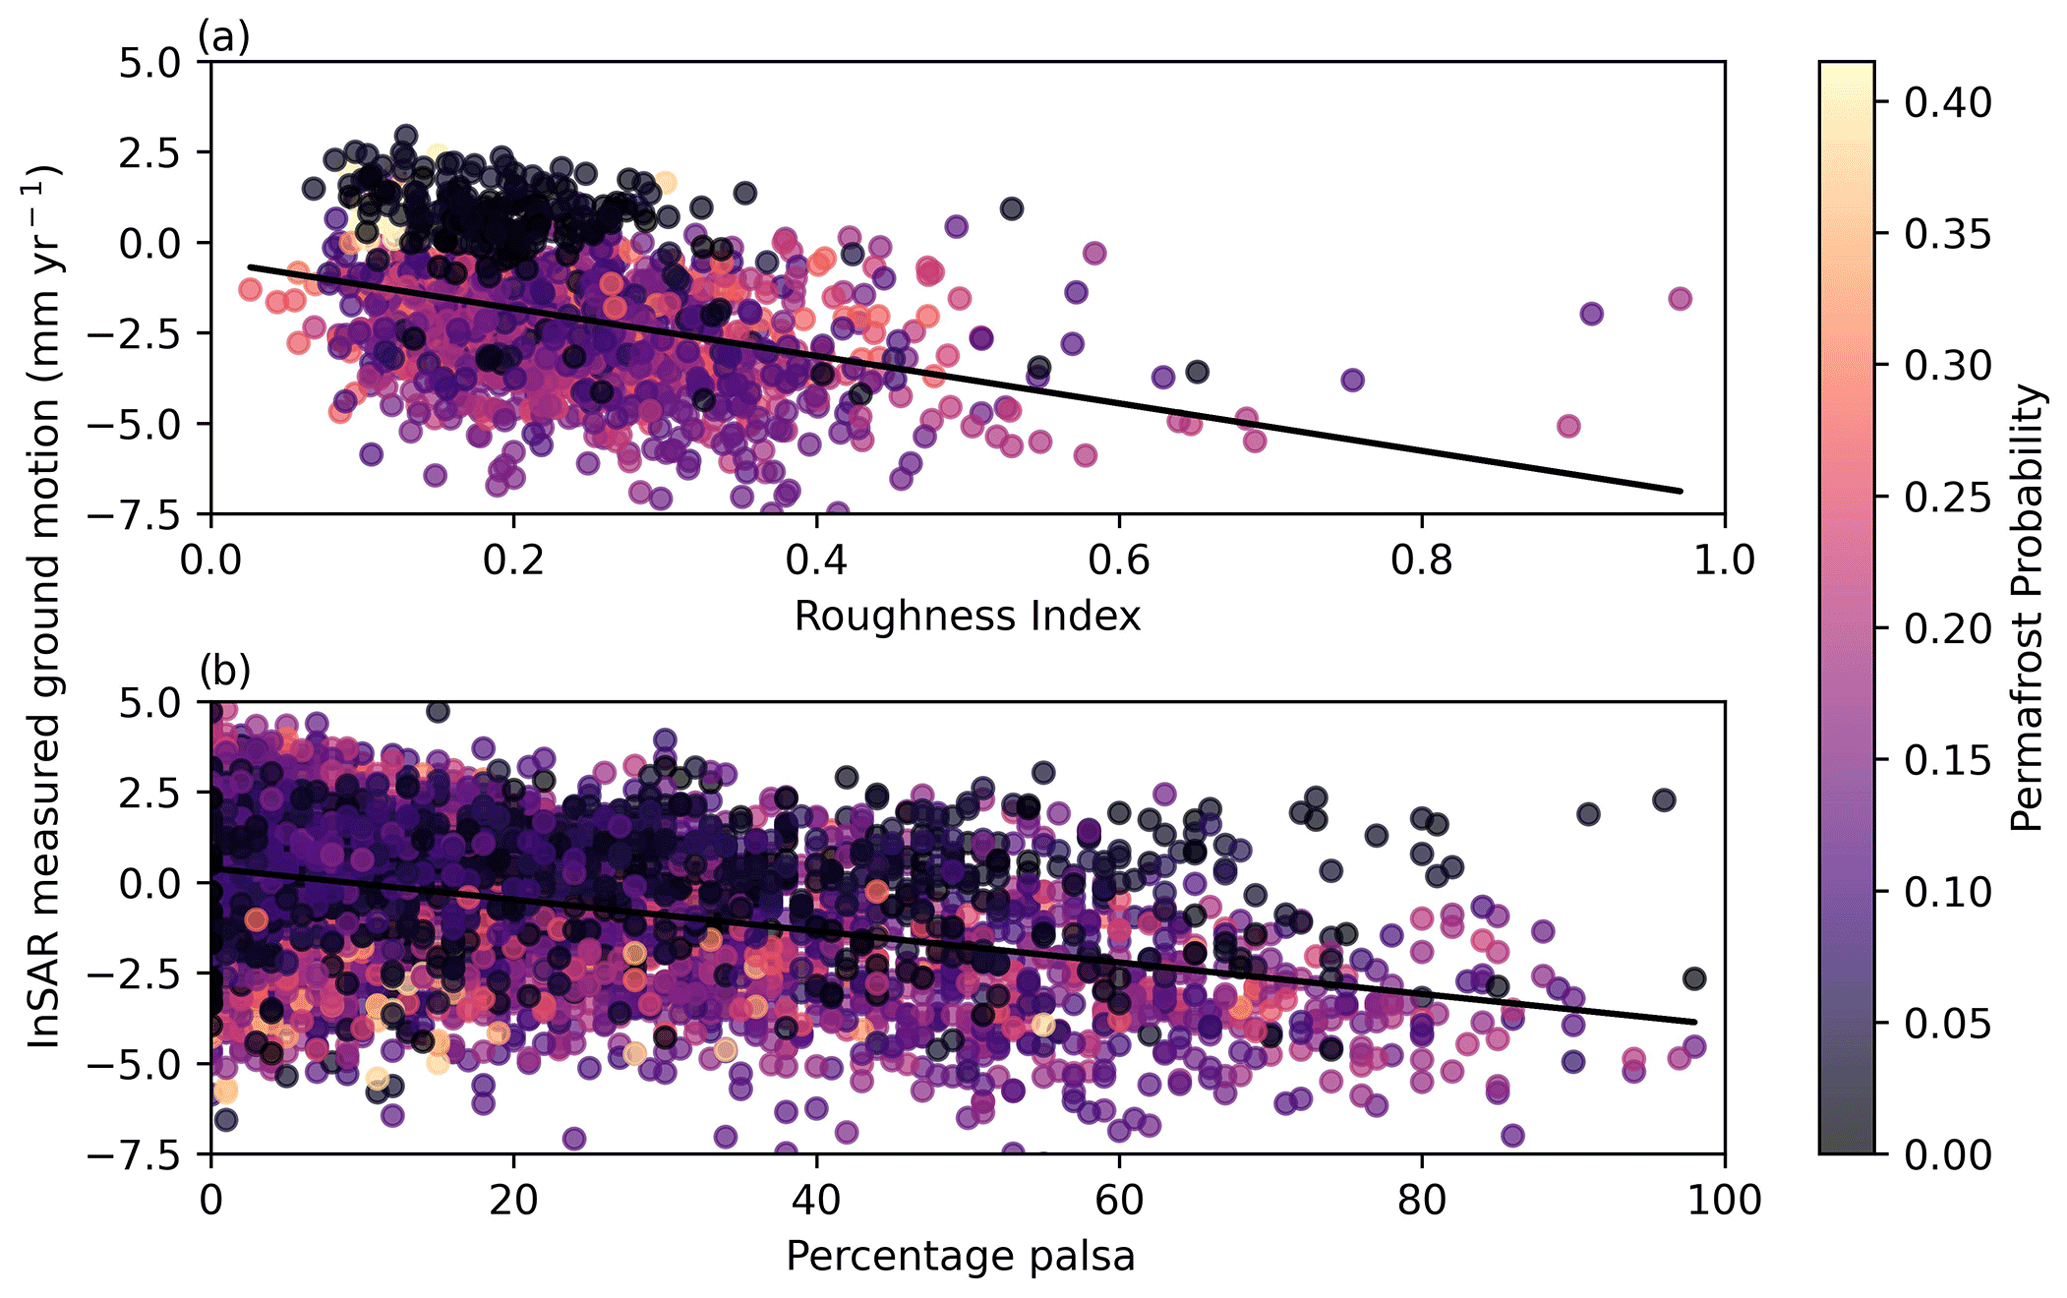
Figure 7Relationship of (a) the roughness index (p<0.001, R2=0.35) and (b) palsa percentage in a pixel (p<0.001, R2=0.41) with InSAR-measured ground motion. The colours indicated for each data point are the analysed probability (on a scale from 0 to 1) that an area would include permafrost (Obu et al., 2018). Note that there are fewer data for the analysis of roughness, as the roughness was characterised only for the eight study sites and not all palsa raster cells from Backe (2014). Roughness values from valley sides (which, at the time, were included in the buffer areas) are not used in the figure.
3.3 Meteorological trends
The analysis of the meteorological data showed variability in both weather and climate across the study region, in part reflecting the patterns in the subsidence data. The warmest minimum and maximum temperatures, −29.2 and 32.8 °C, respectively, were recorded for the palsa complexes north of Lake Torneträsk, i.e. Gipmevuopmi and Ribasvuomus (Abisko weather station) (Fig. 1). The temperature in the area of the Árbuvuopmi, Vissátvuopmi, and Tavvavuoma palsa complexes (Saarikoski, Naimakka, and Karesuando weather stations) ranged between −39.4 and 30.5 °C (Table 3, Fig. 8a). The sites had a comparable annual snow depth, with a mean of 20–30 cm (Table 3, Fig. 8b).

Figure 8Mean annual (a) daily maximum temperature, (b) snow depth on the ground, and (c) daily precipitation at the meteorological stations in the study region (SMHI, 2022).
Table 3Temperature and snowfall descriptive statistics. The snow depth data are estimated from days with snow on the ground. Mean annual temperature and precipitation are averaged from 2000 to 2021. The maximum, minimum, and the interquartile range (IQR) of daily maximum temperature and daily precipitation since 2000 are also shown. Some weather stations lack certain years but were considered to have adequate coverage for this task, while two sites did not have sufficient data collection during the time period to be reliable and were shaded out.

There was no detectable difference in climatic trends among the meteorological weather stations since 2001 for any of these sites (p>0.05). In contrast, the longer-term climate records show a strong increase in winter precipitation over the last 140 years at Karesuando, the northernmost weather station of the three with long-term records available (, p<0.001; σ2=47.0 %; Fig. 9a). This long-term trend was also evident, albeit less strong, in Kiruna (, p<0.001; σ2=19.7 %; Fig. 9b). In Abisko, the pattern of increasing winter (DJF) precipitation was less clear (, p<0.01; σ2=6.3 %; Fig. 9c). Mean annual snow depth, temperature, and summer (JJA) precipitation did not show clear temporal trends (see Supplement).

Figure 9Mean winter (DJF) precipitation over time at (a) Karesuando, (b) Kiruna, and (c) Abisko; significant trend lines are shown.
By way of satellite ASPIS InSAR-derived surface motion and associated spatial and statistical analyses, we have demonstrated ongoing subsidence in the palsas of northern Sweden driven by a warming climate. Based on the compelling agreement of subsidence with palsa landforms and their roughness, we interpret this as permafrost degradation, i.e. thaw of the permafrost core within palsas and disintegration of these landforms. This is in line with a wide range of literature (see Sect. 1) and concurs with the local-scale studies in the area undertaken using both satellite- and field-based methods (de la Barreda-Bautista et al., 2022; Olvmo et al., 2020; Sannel, 2020; Sannel et al., 2016; Sannel and Kuhry, 2011). The findings also agree with what is expected from the severe climate warming impacts on temperatures and precipitation noted in the region (Hänsel, 2020; Irannezhad et al., 2017; Vikhamar-Schuler et al., 2016) and the modelled predictions of total loss of permafrost across the region within decades (Fewster et al., 2022). We suggest that the surface subsidence of the sample palsa complexes measured in this study, together with complementary work in Norway (Borge et al., 2017), can be taken as evidence of substantial permafrost degradation in many palsa areas across northern Sweden and, therefore, likely also across northern Fennoscandia.
The processes driving the degradation of the permafrost, as measured by the ASPIS InSAR-derived subsidence data, are complex. Although permafrost degradation was observed in all of the palsa complexes, rates varied both within and among palsa complexes (Table 2; Figs. 3, 4). Overall, the InSAR subsidence data demonstrate a south to north gradient in increasing degradation. This indicates that local factors, such as local climate warming responses or permafrost temperature, determine the sensitivity of particular areas and that regional climatic gradients play a role in the long-term trajectory of these ecosystems (Johansson et al., 2011; Olvmo et al., 2020). In particular, winter precipitation is generally considered a strong predictor of permafrost degradation due to the highly insulating properties of snow, preventing heat dissipation during winter (Olvmo et al., 2020; Seppälä, 2011). This points to increased winter precipitation in the northernmost part of the study areas as a driver of the higher subsidence rates in the northernmost palsa complexes (Table 2, Fig. 8a). Interestingly, climate data from the last 2 decades did not reveal strong differences in climatic conditions over the area. This suggests that long-term trends combined with a buffered system reaction to change are driving regional patterns of permafrost degradation.
It could also be the case that the observed north to south gradient of subsidence rates reflects different phases of progression in an ongoing trend of permafrost degradation across the study region of northern Sweden. It is plausible that the degradation process has progressed further at the more southern sites, reflecting higher permafrost temperatures, and that, as a result, subsidence rates have now slowed. All the while, the northern sites, which still have a high cover of palsa (26.3 % and 31.6 % at Árbuvuopmi and Vissátvuopmi, respectively), show high subsidence rates. This is supported by research showing rapid permafrost degradation in the southernmost palsa complexes in Sweden (Zuidhoff, 2002; Zuidhoff and Kolstrup, 2000) and in the area around and to the south of Torneträsk since the 1960s (Åkerman and Johansson, 2008; de la Barreda-Bautista et al., 2022; Varner et al., 2022). However, permafrost degradation in palsas has progressed over longer time periods, even in northern Fennoscandia. Here, palsas have decreased in areal extent by 33 %–71 % over ca. 60 years, with more rapid contraction in recent years, in Finnmarksvidda, Norway; by 54 % in Vissátvuopmi, northernmost Sweden (Borge et al., 2017; Olvmo et al., 2020); and total loss of palsa complexes has been recorded in the far north-eastern parts of Norway (Vorren, 2017).
Although there are differences in subsidence rates among sites, the region-wide permafrost degradation reflects ongoing climatic trends (Figs. 3, 7). Since 1901, Fennoscandia's climate has become wetter as well as warmer, with a greater proportion of the precipitation falling as rain relative to snow (Hänsel, 2020; Irannezhad et al., 2018, 2017; Vikhamar-Schuler et al., 2016). These trends are reflected in the far north, where higher air temperatures and greater precipitation and snow depths have already shifted climatic conditions in parts of the region away from those that support permafrost in peatlands, e.g. since the 1940s (Åkerman and Johansson, 2008; Borge et al., 2017; Olvmo et al., 2020). Further, deep permafrost boreholes show decadal signals of increasing temperatures in the Scandes, suggesting that warmer temperatures have been impacting permafrost since the 1920s (Isaksen et al., 2007). Hence, is seems that climate warming has been impacting permafrost in Fennoscandia for at least 100 years.
As a result of the ongoing trend of increasing permafrost temperatures in palsas in Fennoscandia, their permafrost temperatures are now close to 0 °C, making them especially vulnerable to decay in response to further increases in temperatures (Christiansen et al., 2010; Farbrot et al., 2013). Palsa formation is closely linked to the mean annual temperature, with temperatures below −1 to −2 °C and limited insulating snow cover over consecutive years needed as a threshold for palsas to form (Vorren, 2017). In this context, it is important to note that the mean annual temperature in the area has been between 0.53 and −1.4 °C since 2000, suggesting that climatic conditions no longer support the formation of palsas in parts of the study area, while conditions are marginal for palsa preservation in the entire region.
Although subsidence dominated in the northern sites, uplift was also noted in the study region. Mechanisms that may explain the patterns of uplift are the formation of new palsas as well as short-lived frost mounds that can form temporarily in the palsa system (Zuidhoff, 2002). Further mechanisms that may result in uplift are changes in the water level of the flooded parts of the peatlands as well as the accumulation of plant residues from the productive fen vegetation parts of the study sites on the peatland surface, reflecting the adaptation of the local ecosystem to degraded palsa mounds evidenced by changes in remotely sensed terrain surface.
In addition to demonstrating regional permafrost degradation in northern Fennoscandia, this work also provides a proof of concept for circumpolar assessments of permafrost degradation using ASPIS InSAR. It enables the detection of areas with rapidly degrading permafrost and deepening active layers as well as peat consolidation in areas that have already lost their permafrost (de la Barreda-Bautista et al., 2022). The fact that InSAR data are integrated over 20 m×20 m pixels means that the signal of local-level degradation may be somewhat dampened (de la Barreda-Bautista et al., 2022). However, the high precision of the change in vertical position means that InSAR is an important tool to employ to detect the initial stages of large-scale permafrost degradation. In concurrence with the literature (Alshammari et al., 2020, 2018; Bartsch et al., 2016; de la Barreda-Bautista et al., 2022; Short et al., 2014; van Huissteden et al., 2021), we found that the majority (69 %) of our results were within the MSE of the direction of ground motion change, providing confidence in our ability to locate where permafrost is degrading. Currently, the study of long-term trends and drivers using InSAR is somewhat limited by the short collection period of Sentinel-1, but as more data continue to be collected, methods such as non-linear time series creation will become viable to compare subsidence directly to longer climatic drivers. However, our large-scale assessment of permafrost subsidence provides a baseline to direct, and compare against, future fieldwork monitoring in northern Sweden.
As a complement to the ASPIS-InSAR data, the novel roughness thresholding method used here, along with contextual data, proved to be a powerful tool to map and monitor changes (Franklin, 2020; Konig et al., 2019; Otto et al., 2012). This approach could be developed using machine learning methods to model palsa dynamics in order to better automate the extraction of palsa landform positions (Konig et al., 2019; Luoto and Seppälä, 2002). If accomplished, the operating extent of this tool could be vastly increased using the Arctic 2 m DEM dataset over areas where its quality is high enough to allow high-resolution mapping of the degrading edges of raised palsa plateaux (Morin et al., 2016; Karlson et al., 2021). In turn, this could be used to remove the stable centre of palsa plateaux and exclusively compare palsa edges to the roughness index, where we would expect to find a stronger correlation than that with the current palsa raster cells (Fig. 7a). It has been suggested that small, fragmented, and irregularly shaped palsas are more susceptible to erosion (Borge et al., 2017; Mamet et al., 2017; Beer et al., 2023). We have not gone as far as to estimate this here, but the possible palsa edges inferred from the roughness index could be built upon to explore this hypothesis. Casual analysis of Figs. 5 and 6 and the orthophotos provided in the Supplement would support these expectations. Together, the ASPIS-InSAR- and DEM-derived roughness index metrics offer novel ways to carry out large-scale monitoring of permafrost degradation. This will help to quantify the rate of palsa ecosystem collapse and the transition to a non-permafrost state.
We conclude that permafrost degradation of palsas is occurring across northern Sweden, with the greatest rates of degradation and largest areas impacted being Sweden's two largest palsa complexes in the far north. This raises serious concerns that these systems will lose their permafrost entirely in the coming decades, especially as climatic conditions are approaching the limits of sustaining palsas (Fewster et al., 2022). The implications of this rapid loss of permafrost is ecosystem collapse and loss, as the permafrost core is fundamental to the existence of palsas. Future research should focus on the implications of this collapse on increased CH4 emissions (Glagolev et al., 2011; Turetsky et al., 2020; Varner et al., 2022), carbon loss (Hugelius et al., 2020), and thus the potential for strong climate feedbacks (IPCC, 2021). Further study should also explore using longer time series of InSAR data as they become available to investigate regional variations in climatic drivers of permafrost degradation. Moreover, our study demonstrates that InSAR, along with terrain data, can be applied over continuous natural surfaces at a regional scale to monitor permafrost degradation in palsa regions, offering a tool for circumpolar monitoring of climate warming impact on these systems.
All of the Python scripts used to carry out these analyses are available at the following GitHub repository: https://github.com/SamValman/Permafrost_Sweden (last access: 15 April 2024) and at https://doi.org/10.5281/zenodo.10891198 (Valman, 2024a).
The Sentinel-1 datasets are freely available and can be obtained by searching and downloading the Interferometric Wide (IW) swath mode products for orbit track numbers 168 and 66 through the Copernicus Open Access Hub (https://browser.dataspace.copernicus.eu/, ESA, 2024). The processed interferometric data and deformation maps are commercially sensitive and may be made available upon reasonable request (by email) from the corresponding author. All other datasets produced during this project are uploaded on Zenodo: https://doi.org/10.5281/zenodo.10891489 (Valman, 2024b).
The supplement related to this article is available online at: https://doi.org/10.5194/tc-18-1773-2024-supplement.
SV carried out the majority of the data analysis and made a significant contribution to data interpretation as well as to writing and finalising the manuscript. MBS contributed to the conception of the study; contributed DEM and orthophoto data; carried out fieldwork to assess permafrost degradation; contributed and advised on data analysis and interpretation; and contributed to structuring, writing, and refining the text. Both SV and MBS contributed equally to this work. DB contributed to the conception of the study, advised on the data analysis, and made a significant contribution to finalising the text. ML provided data analysis, supported the InSAR processing and data interpretation, and contributed to writing the text. DG carried out the initial InSAR data processing. BdlBB contributed to the conception of the study and refining the text. AS contributed to the conception of the study and advised on the InSAR data processing. SS conceived and directed the study, contributed to data analysis, carried out fieldwork to assess permafrost degradation, and made a significant contribution to formulating and finalising the text. SS, DB, AS, and MBS secured the funding for the project.
The contact author has declared that none of the authors has any competing interests.
Publisher’s note: Copernicus Publications remains neutral with regard to jurisdictional claims made in the text, published maps, institutional affiliations, or any other geographical representation in this paper. While Copernicus Publications makes every effort to include appropriate place names, the final responsibility lies with the authors.
The authors are grateful for fieldwork support from the Climate Impacts Research Centre (CIRC) at Umeå University, Sweden.
This research has been supported by the UK Research and Innovation, Engineering and Physical Sciences Research Council (grant no. EP/S023577/1), the University of Nottingham School of Biosciences, EU-Interact funding via the InterAccess programme, and the Swedish Research council (grant no. VR-2021-05767).
This paper was edited by Hanna Lee and reviewed by two anonymous referees.
Åkerman, H. J. and Johansson, M.: Thawing permafrost and thicker active layers in sub-arctic Sweden, Permafrost Periglac., 19, 279–292, https://doi.org/10.1002/ppp.626, 2008.
Alshammari, L., Large, D. J., Boyd, D. S., Sowter, A., Anderson, R., Andersen, R., and Marsh, S.: Long-Term Peatland Condition Assessment via Surface Motion Monitoring Using the ISBAS DInSAR Technique over the Flow Country, Scotland, Remote Sens., 10, 1103, https://doi.org/10.3390/rs10071103, 2018.
Alshammari, L., Boyd, D. S., Sowter, A., Marshall, C., Andersen, R., Gilbert, P., Marsh, S., and Large, D. J.: Use of Surface Motion Characteristics Determined by InSAR to Assess Peatland Condition, J. Geophys. Res., 125, e2018JG004953, https://doi.org/10.1029/2018JG004953, 2020.
Backe, S.: Kartering av Sveriges palsmyrar, Länsstyrelsen, oai:DiVA.org:naturvardsverket-2318, 2014.
Ballantyne C. K.: Periglacial geomorphology, John Wiley and Son, ISBN 9781405100069, 2018.
Bartsch, A., Widhalm, B., Kuhry, P., Hugelius, G., Palmtag, J., and Siewert, M. B.: Can C-band synthetic aperture radar be used to estimate soil organic carbon storage in tundra?, Biogeosciences, 13, 5453–5470, https://doi.org/10.5194/bg-13-5453-2016, 2016.
Beer, J. M., Wang, Y., Way, R., Forget, A., and Colyn, V.: Uncrewed aerial vehicle-based assessments of peatland permafrost vulnerability along the Labrador Sea coastline, northern Canada, arXiv [preprint], https://doi.org/10.31223/X5610M, 2023.
Biskaborn, B. K., Smith, S. L., Noetzli, J., Matthes, H., Vieira, G., Streletskiy, D. A., Schoeneich, P., Romanovsky, V. E., Lewkowicz, A. G., Abramov, A., Allard, M., Boike, J., Cable, W. L., Christiansen, H. H., Delaloye, R., Diekmann, B., Drozdov, D., Etzelmüller, B., Grosse, G., and Lantuit, H.: Permafrost is warming at a global scale, Nat. Commun., 10, 264, https://doi.org/10.1038/s41467-018-08240-4, 2019.
Borge, A. F., Westermann, S., Solheim, I., and Etzelmüller, B.: Strong degradation of palsas and peat plateaus in northern Norway during the last 60 years, The Cryosphere, 11, 1–16, https://doi.org/10.5194/tc-11-1-2017, 2017.
Bradley, A. V., Andersen, R., Marshall, C., Sowter, A., and Large, D. J.: Identification of typical ecohydrological behaviours using InSAR allows landscape-scale mapping of peatland condition, Earth Surf. Dynam., 10, 261–277, https://doi.org/10.5194/esurf-10-261-2022, 2022.
Chadburn, S. E., Burke, E. J., Cox, P. M., Friedlingstein, P., Hugelius, G., and Westermann, S.: An observation-based constraint on permafrost loss as a function of global warming, Nat. Clim. Change 7, 340–344, https://doi.org/10.1038/nclimate3262, 2017.
Chen, C. W. and Zebker, H. A.: Two-dimensional phase unwrapping with use of statistical models for cost functions in nonlinear optimization, JOSA A, 18, 338–351, 2001.
Christiansen, H. H., Etzelmüller, B., Isaksen, K., Juliussen, H., Farbrot, H., Humlum, O., Johansson, M., Ingeman-Nielsen, T., Kristensen, L., Hjort, J., Holmlund, P., Sannel, A. B. K., Sigsgaard, C., Åkerman, H. J., Foged, N., Blikra, L. H., Pernosky, M. A., and Ødegård, R. S.: The thermal state of permafrost in the nordic area during the international polar year 2007–2009, Permafrost Periglac., 21, 156–181, https://doi.org/10.1002/ppp.687, 2010.
Cigna, F. and Sowter, A.: The relationship between intermittent coherence and precision of ISBAS InSAR ground motion velocities: ERS-1/2 case studies in the UK, Remote Sens. Environ., 202, 177–198, https://doi.org/10.1016/j.rse.2017.05.016, 2017.
de la Barreda-Bautista, B., Boyd, D. S., Ledger, M., Siewert, M. B., Chandler, C., Bradley, A. V., Gee, D., Large, D. J., Olofsson, J., Sowter, A., and Sjögersten, S.: Towards a Monitoring Approach for Understanding Permafrost Degradation and Linked Subsidence in Arctic Peatlands, Remote Sens., 14, 44, https://doi.org/10.3390/rs14030444, 2022.
Douglas, T. A., Jorgenson, M. T., Brown, D. R. N., Campbell, S. W., Hiemstra, C. A., Saari, S. P., Bjella, K., and Liljedahl, A. K.: Degrading permafrost mapped with electrical resistivity tomography, airborne imagery and LiDAR, and seasonal thaw measurements, Geophysics, 81, WA71–WA85, https://doi.org/10.1190/geo2015-0149.1, 2015.
Douglas, T. A., Hiemstra, C. A., Anderson, J. E., Barbato, R. A., Bjella, K. L., Deeb, E. J., Gelvin, A. B., Nelsen, P. E., Newman, S. D., Saari, S. P., and Wagner, A. M.: Recent degradation of interior Alaska permafrost mapped with ground surveys, geophysics, deep drilling, and repeat airborne lidar, The Cryosphere, 15, 3555–3575, https://doi.org/10.5194/tc-15-3555-2021, 2021.
ESA: Definition of the TOPS SLC deramping function for products generated by the S-1 IPF, European Space Agency, COPE-GSEG-EOPG-TN-14-0025, Issue 1, Revision 2, COPE-GSEG-EOPG-TN-14-0025, 22 April 2015.
ESA: Sentinel-1 Interferometric Wide swath mode. Copernicus Open Access Hub, https://browser.dataspace.copernicus.eu/, last accessed: 28 March 2024.
Farbrot, H., Isaksen, K., Etzelmüller, B., and Gisnås, K.: Ground Thermal Regime and Permafrost Distribution under a Changing Climate in Northern Norway, Permafrost Periglac., 24, 20–38, https://doi.org/10.1002/ppp.1763, 2013.
Fewster, R. E., Morris, P. J., Ivanovic, R. F., Swindles, G. T., Peregon, A. M., and Smith, C. J.: Imminent loss of climate space for permafrost peatlands in Europe and Western Siberia, Nat. Clim. Change, 12, 373–379, https://doi.org/10.1038/s41558-022-01296-7, 2022.
Franklin, S. E.: Interpretation and use of geomorphometry in remote sensing: a guide and review of integrated applications, Int. J. Remote Sens., 41, 7700–7733, https://doi.org/10.1080/01431161.2020.1792577, 2020.
Gee, D., Bateson, L., Sowter, A., Grebby, S., Novellino, A., Cigna, F., Marsh, S., Banton, C., and Wyatt, L.: Ground Motion in Areas of Abandoned Mining: Application of the Intermittent SBAS (ISBAS) to the Northumberland and Durham Coalfield, UK, Geosciences, 7, 85, https://doi.org/10.3390/geosciences7030085, 2017.
Gisnås, K., Etzelmüller, B., Lussana, C., Hjort, J., Sannel, A. B. K., Isaksen, K., Westermann, S., Kuhry, P., Christiansen, H. H., Frampton, A., and Åkerman, J.: Permafrost Map for Norway, Sweden and Finland, Permafrost Periglac., 28, 359–378, https://doi.org/10.1002/ppp.1922, 2017.
Glagolev, M., Kleptsova, I., Filippov, I., Maksyutov, S., and Machida, T.: Regional methane emission from West Siberia mire landscapes, Environ. Res. Lett., 6, 045214, https://doi.org/10.1088/1748-9326/6/4/045214, 2011.
Hänsel, S.: Changes in the Characteristics of Dry and Wet Periods in Europe (1851–2015), Atmosphere, 11, 1080, https://doi.org/10.3390/atmos11101080, 2020.
Harris, C. R., Millman, K. J., van der Walt, S. J., Gommers, R., Virtanen, P., Cournapeau, D., Wieser, E., Taylor, J., Berg, S., Smith, N. J., Kern, R., Picus, M., Hoyer, S., van Kerkwijk, M. H., Brett, M., Haldane, A., del Río, J. F., Wiebe, M., Peterson, P., and Oliphant, T. E.: Array programming with NumPy, Nature, 585, 357–362, https://doi.org/10.1038/s41586-020-2649-2, 2020.
Harris, L. I., Richardson, K., Bona, K. A., Davidson, S. J., Finkelstein, S. A., Garneau, M., McLaughlin, J., Nwaishi, F., Olefeldt, D., Packalen, M., Roulet, N. T., Southee, F. M., Strack, M., Webster, K. L., Wilkinson, S. L., and Ray, J. C.: The essential carbon service provided by northern peatlands, Front. Ecol. Environ., 20, 222–230, https://doi.org/10.1002/fee.2437, 2022.
Hugelius, G. A., Loisel, J. A., Chadburn, S. A., Jackson, R. A., Jones, M. A., MacDonald, G., Marushchak, M., Olefeldt, D. A., Packalen, M., Siewert, M. A, Treat, C. A.-O., Turetsky, M., Voigt, C. A., and Yu, Z. A.: Large stocks of peatland carbon and nitrogen are vulnerable to permafrost thaw, P. Natl. Acad. Sci. USA, 117, 20438–20446, https://doi.org/10.1073/pnas.1916387117, 2020.
IPCC: The Physical Science Basis. Contribution of Working Group I to the Sixth Assessment Report of the Intergovernmental Panel on Climate Change, Cambridge University Press, https://doi.org/10.1017/9781009157896, 2021.
Irannezhad, M., Ronkanen, A.-K., Kiani, S., Chen, D., and Kløve, B.: Long-term variability and trends in annual snowfall/total precipitation ratio in Finland and the role of atmospheric circulation patterns, Cold Reg. Sci. Technol., 143, 23–31, https://doi.org/10.1016/j.coldregions.2017.08.008, 2017.
Irannezhad, M., Moradkhani, H., and Kløve, B.: Spatiotemporal Variability and Trends in Extreme Temperature Events in Finland over the Recent Decades: Influence of Northern Hemisphere Teleconnection Patterns, Adv. Meteorol., 2018, 7169840, https://doi.org/10.1155/2018/7169840, 2018.
Isaksen, K., Sollid, J. L., Holmlund, P., and Harris, C.: Recent warming of mountain permafrost in Svalbard and Scandinavia, J. Geophys. Res.-Earth, 112, F02S04, https://doi.org/10.1029/2006JF000522, 2007.
Johansson, M., Åkerman, J., Keuper, F., Christensen, T. R., Lantuit, H., and Callaghan, T. V.: Past and Present Permafrost Temperatures in the Abisko Area: Redrilling of Boreholes, AMBIO, 40, 558, https://doi.org/10.1007/s13280-011-0163-3, 2011.
Johansson, M., Callaghan, T. V., Bosiö, J., Åkerman, H. J., Jackowicz-Korczynski, M., and Christensen, T. R.: Rapid responses of permafrost and vegetation to experimentally increased snow cover in sub-arctic Sweden, Environ. Res. Lett., 8, 035025, https://doi.org/10.1088/1748-9326/8/3/035025, 2013.
Karlson, M., bastviken, D., and Reese, H.: Error characteristics of pan-arctic digital elevation models and elevation derivatives in northern sweden, Remote Sens., 13, 4653, https://doi.org/10.3390/rs13224653, 2021.
Köchy, M., Hiederer, R., and Freibauer, A.: Global distribution of soil organic carbon – Part 1: Masses and frequency distributions of SOC stocks for the tropics, permafrost regions, wetlands, and the world, SOIL, 1, 351–365, https://doi.org/10.5194/soil-1-351-2015, 2015.
König, S., Schultz, J. A., Schoch, A., Blöthe, J., Schrott, L., and Thonfeld, F.: Mountain Permafrost Distribution Modeling–A Geomorphometry-Remote Sensing Approach for the Hohe Tauern National Park, Austria, Dreiländertagung der DGPF, der OVG und der SGPF in Wien, Österreich–Publikationen der DGPF, 28, 2019.
Lantmäteriet: Orthophoto (Ortofoto), Version 2.7., https://www.lantmateriet.se/globalassets/geodata/geodataprodukter/flyg--och-satellitbilder/e_pb_ortofoto.pdf (last access: 10 January 2024), 2021.
Leppiniemi, O., Karjalainen, O., Aalto, J., Luoto, M., and Hjort, J.: Environmental spaces for palsas and peat plateaus are disappearing at a circumpolar scale, The Cryosphere, 17, 3157–3176, https://doi.org/10.5194/tc-17-3157-2023, 2023.
Liu, L., Zhang, T., and Wahr, J.: InSAR measurements of surface deformation over permafrost on the North Slope of Alaska, J. Geophys. Res.-Earth, 115, F03023, https://doi.org/10.1029/2009JF001547, 2010.
Luoto, M. and Seppälä, M.: Modelling the distribution of palsas in Finnish Lapland with logistic regression and GIS, Permafrost Periglac., 13, 17–28, 2002.
Luoto, M. and Seppälä, M.: Thermokarst ponds as indicators of the former distribution of palsas in Finnish Lapland, Permafrost Periglac., 14, 19–27, https://doi.org/10.1002/ppp.441, 2003.
Mamet, S. D., Chun, K. P., Kershaw, G. G. L., Loranty, M. M., and Kershaw, G. P.: Recent Increases in Permafrost Thaw Rates and Areal Loss of Palsas in the Western Northwest Territories, Canada, Permafrost Periglac., 28, 619–633, https://doi.org/10.1002/ppp.1951, 2017.
Markkula, I., Turunen, M., and Rasmus, S.: A review of climate change impacts on the ecosystem services in the Saami Homeland in Finland, Sci. Total Environ., 692, 1070–1085, https://doi.org/10.1016/j.scitotenv.2019.07.272, 2019.
Matthews, J. A., Dahl, S.-O., Berrisford, M. S., and Nesje, A.: Cyclic Development and Thermokarstic Degradation of Palsas in the Mid-Alpine Zone at Leirpullan, Dovrefjell, Southern Norway, Permafrost Periglac., 8, 107–122, https://doi.org/10.1002/(SICI)1099-1530(199701)8:1<107::AID-PPP237>3.0.CO;2-Z, 1997.
McKinney, W.: Pandas: a Foundational Python Library for Data Analysis and Statistics, 2011.
Miglovets, Ì., Zagirova, S., Goncharova, N., and Mikhailov, Î.: Methane Emission from Palsa Mires in Northeastern European Russia, Russ. Meteorol. Hydrol., 46, 52–59, https://doi.org/10.3103/S1068373921010076, 2021.
Morin, P., Porter, C., Cloutier, M., Howat, I., Noh, M. J., Willis, M., Bates, B., Willamson, C., and Peterman, K.: ArcticDEM; a publically available, high resolution elevation model of the Arctic, EGU General Assembly 2016, 17-22 April 2016, Vienna, Austria, EPSC2016-8396, 2016.
Obu, J.: How Much of the Earth's Surface is Underlain by Permafrost?, J. Geophys. Res.-Earth, 126, e2021JF006123, https://doi.org/10.1029/2021JF006123, 2021.
Obu, J., Westermann, S., Kääb, A., and Bartsch, A.: Ground Temperature Map, 2000–2016, Northern Hemisphere Permafrost, PANGAEA, https://doi.org/10.1594/PANGAEA.888600, 2018.
Olvmo, M., Holmer, B., Thorsson, S., Reese, H., and Lindberg, F.: Sub-arctic palsa degradation and the role of climatic drivers in the largest coherent palsa mire complex in Sweden (Vissátvuopmi), 1955–2016, Sci. Rep.-UK, 10, 8937, https://doi.org/10.1038/s41598-020-65719-1, 2020.
Otto, J. c., Keuschnig, M., Götz, J., Marbach, M., and Schrott, L.: Detection of mountain permafrost by combining high resolution surface and subsurface information–an example from the Glatzbach catchment, Austrian Alps, Geogr. Ann. A, 94, 43-57, https://doi.org/10.1111/j.1468-0459.2012.00455.x, 2012.
QGIS: QGIS User Guide: 24.2.1 Raster Analysis, https://docs.qgis.org/3.16/en/docs/user_manual/processing_algs/gdal/rasteranalysis.html#hillshade (last access: 1 January 2024), 2022.
Ramage, J., Jungsberg, L., Wang, S. N., Westermann, S., Lantuit, H., and Heleniak, T.: Population living on permafrost in the Arctic, Popul. Environ., 43, 22–38, https://doi.org/10.1007/s11111-020-00370-6, 2021.
Reinosch, E., Buckel, J., Dong, J., Gerke, M., Baade, J., and Riedel, B.: InSAR time series analysis of seasonal surface displacement dynamics on the Tibetan Plateau, The Cryosphere, 14, 1633–1650, https://doi.org/10.5194/tc-14-1633-2020, 2020.
Riley, S. J., Degloria, S. D., and Elliot, R.: Index that quantifies topographic heterogeneity, Int. J. Sci., 5, 23–27, 1999.
Sannel, A. B. K.: Ground temperature and snow depth variability within a subarctic peat plateau landscape, Permafrost Periglac., 31, 255–263, https://doi.org/10.1002/ppp.2045, 2020.
Sannel, A. B. K. and Kuhry, P.: Warming-induced destabilization of peat plateau/thermokarst lake complexes, J. Geophys. Res., 116, G03035, https://doi.org/10.1029/2010JG001635, 2011.
Sannel, A. B. K., Hugelius, G., Jansson, P., and Kuhry, P.: Permafrost Warming in a Subarctic Peatland – Which Meteorological Controls are Most Important?, Permafrost Periglac., 27, 177–188, https://doi.org/10.1002/ppp.1862, 2016.
Schuur, E. A. G., Vogel, J. G., Crummer, K. G., Lee, H., Sickman, J. O., and Osterkamp, T. E.: The effect of permafrost thaw on old carbon release and net carbon exchange from tundra, Nature, 459, 556–559, https://doi.org/10.1038/nature08031, 2009.
Seppälä, M.: Synthesis of studies of palsa formation underlining the importance of local environmental and physical characteristics, Quaternary Res., 75, 366–370, https://doi.org/10.1016/j.yqres.2010.09.007, 2011.
Siewert, M. B.: High-resolution digital mapping of soil organic carbon in permafrost terrain using machine learning: a case study in a sub-Arctic peatland environment, Biogeosciences, 15, 1663–1682, https://doi.org/10.5194/bg-15-1663-2018, 2018.
Sjöberg, Y., Siewert, M. B., Rudy, A. C. A., Paquette, M., Bouchard, F., Malenfant-Lepage, J., and Fritz, M.: Hot trends and impact in permafrost science, Permafrost Periglac., 31, 461–471, 2020.
Short, N., LeBlanc, A.-M., Sladen, W., Oldenborger, G., Mathon-Dufour, V., and Brisco, B.: RADARSAT-2 D-InSAR for ground displacement in permafrost terrain, validation from Iqaluit Airport, Baffin Island, Canada, Remote Sen. Environ., 141, 40–51, https://doi.org/10.1016/j.rse.2013.10.016, 2014.
SMHI: Download Meteorological observations, Retrieved from https://www.smhi.se/data/meteorologi/ladda-ner-meteorologiska-observationer#param=airtemperatureInstant,stations=core,stationid=191910 (last access: 10 January 2024), 2022.
Smith, M. W. and Riseborough, D. W.: Permafrost monitoring and detection of climate change, Permafrost Periglac., 7, 301–309, https://doi.org/10.1002/(SICI)1099-1530(199610)7:4<301::AID-PPP231>3.0.CO;2-R, 1996.
Smith, S. L, O'Neill, H. B., Isaksen, K., Noetzli, J., and Romanovsky, V. E.: The changing thermal state of permafrost, Nat. Rev. Earth Environ., 3, 10–23, 2022.
Sowter, A., Bateson, L., Strange, P., Ambrose, K., and Syafiudin, M. F.: DInSAR estimation of land motion using intermittent coherence with application to the South Derbyshire and Leicestershire coalfields, Remote Sens. Lett., 4, 979–987, 2013.
Sowter, A., Bin Che Amat, M., Cigna, F., Marsh, S., Athab, A., and Alshammari, L.: Mexico City land subsidence in 2014–2015 with Sentinel-1 IW TOPS: Results using the Intermittent SBAS (ISBAS) technique, Int. J. Appl. Earth. Obs., 52, 230–242, https://doi.org/10.1016/j.jag.2016.06.015, 2016.
Swingedouw, D., Ifejika Speranza, C., Bartsch, A., Durand, G., Jamet, C., Beaugrand, G., and Conversi, A.: Early Warning from Space for a Few Key Tipping Points in Physical, Biological, and Social-Ecological Systems, Surv. Geophys., 41, 1237–1284, https://doi.org/10.1007/s10712-020-09604-6, 2020.
Tarnocai, C., Canadell, J. G., Schuur, E. A. G., Kuhry, P., Mazhitova, G., and Zimov, S.: Soil organic carbon pools in the northern circumpolar permafrost region, Global Biogeochem. Cy., 23, GB2023, https://doi.org/10.1029/2008GB003327, 2009.
Torres, R., Snoeij, P., Geudtner, D., Bibby, D., Davidson, M., Attema, E., Potin, P., Rommen, B., Floury, N., Brown, M., Traver, I. N., Deghaye, P., Duesmann, B., Rosich, B., Miranda, N., Bruno, C., L'Abbate, M., Croci, R., Pietropaolo, A., and Rostan, F.: GMES Sentinel-1 mission, Remote Sens. Environ., 120, 9–24, https://doi.org/10.1016/j.rse.2011.05.028, 2012.
Turetsky, M. R., Abbott, B. W., Jones, M. C., Anthony, K. W., Olefeldt, D., Schuur, E. A. G., Grosse, G., Kuhry, P., Hugelius, G., Koven, C., Lawrence, D. M., Gibson, C., Sannel, A. B. K., and McGuire, A. D.: Carbon release through abrupt permafrost thaw, Nat. Geosci., 13, 138–143, https://doi.org/10.1038/s41561-019-0526-0, 2020.
Vallée, S. and Payette, S.: Collapse of permafrost mounds along a subarctic river over the last 100 years (northern Québec), Geomorphology, 90, 162–170, https://doi.org/10.1016/j.geomorph.2007.01.019, 2007.
Valman, S.: SamValman/Permafrost_Sweden: InSAR-measured permafrost degradation of palsa peatlands in northern Sweden Github Repo (v1.0.0), Zenodo [code], https://doi.org/10.5281/zenodo.10891198, 2024a.
Valman, S.: InSAR measured permafrost degradation of palsa peatlands in northern Sweden Datasets, In The Cryosphere, Zenodo [data set], https://doi.org/10.5281/zenodo.10891489, 2024b.
van Huissteden, J., Teshebaeva, K., Cheung, Y., Magnússon, R. Í., Noorbergen, H., Karsanaev, S. V., Maximov, T. C., and Dolman, A. J.: Geomorphology and InSAR-Tracked Surface Displacements in an Ice-Rich Yedoma Landscape, Front Earth Sci., 9, ISSN 2296-6463, https://doi.org/10.3389/feart.2021.680565, 2021.
Varner, R. K., Crill, P. M., Frolking, S., McCalley, C. K., Burke, S. A., Chanton, J. P., Holmes, M. E., Saleska, S., and Palace, M. W.: Permafrost thaw driven changes in hydrology and vegetation cover increase trace gas emissions and climate forcing in Stordalen Mire from 1970 to 2014, Philos T. Roy. Soc. A, 380, 6223–6244, https://doi.org/10.1098/rsta.2021.0022, 2022.
Vikhamar-Schuler, D., Isaksen, K., Haugen, J. E., Tømmervik, H., Luks, B., Schuler, T. V., and Bjerke, J. W.: Changes in Winter Warming Events in the Nordic Arctic Region, J. Climate, 29, 6223–6244, https://doi.org/10.1175/JCLI-D-15-0763.1, 2016.
Virtanen, P.: Gommers, R., Oliphant, T. E., Haberland, M., Reddy, T., Cournapeau, D., Burovski, E., Peterson, P., Weckesser, W., and Bright, J.: SciPy 1.0: fundamental algorithms for scientific computing in Python, Nat. Methods, 17, 261–272, 2020.
Vorren, K.-D.: The first permafrost cycle in Færdesmyra, eastern Finnmark, Norway, Norsk Geogr. Tidsskr., 71, 114–121, https://doi.org/10.1080/00291951.2017.1316309, 2017.
Zuidhoff, F. S.: Recent decay of a single palsa in relation to weather conditions between 1996 and 2000 in Laivadalen, northern Sweden, Geogr. Ann. A, 84A, 103–111, https://doi.org/10.1111/j.0435-3676.2002.00164.x, 2002.
Zuidhoff, F. S. and Kolstrup, E.: Changes in palsa distribution in relation to climate change in Laivadalen, northern Sweden, especially 1960–1997, Permafrost Periglac., 11, 55–69, 2000.