the Creative Commons Attribution 4.0 License.
the Creative Commons Attribution 4.0 License.
 | 09 Apr 2024
Fifty years of firn evolution on Grigoriev ice cap, Tien Shan, Kyrgyzstan
Anja Eichler
Margit Schwikowski
Sabina Brütsch
Enrico Mattea
Stanislav Kutuzov
Martin Heule
Ryskul Usubaliev
Sultan Belekov
Vladimir N. Mikhalenko
Martin Hoelzle
Marlene Kronenberg
Grigoriev ice cap, located in the Tien Shan mountains of Kyrgyzstan, has a rich history of firn and ice core drilling starting as early as 1962. Here we extend the exceptional record and describe an 18 m firn core, drilled in February 2018 on the summit of Grigoriev ice cap, at 4600 m a.s.l. The core has been analyzed for firn stratigraphy, major ions, black carbon, water stable isotope ratios and total β activity. We find that the core covers 46±3 years and overlaps by 2 to 3 decades with legacy cores. A good agreement is found in major ion concentrations for the overlapping period. Concentrations of black carbon and major ions are reduced since the early 2000s, indicating the onset of meltwater runoff. Nevertheless, general concentration trends of these species are consistent with observations and Central Asian ice core records, since emissions were highest during periods when melt influence was negligible. The record of water stable isotopes does not reflect the strong increase of air temperatures during the last decades, implying that water stable isotope ratios ceased to be proxies of temperature variations at this site. Apart from runoff evidence, however, the firn's thermal regime appears remarkably unchanged. Firn temperatures in 2018 were the highest on record ( °C at ∼17 m depth). However, temperatures in 2023 are again similar to the early 2000s at °C. Furthermore, we find little change in net accumulation since the 1980s. We hypothesize (i) that firn temperatures are stabilized by the removal of latent heat through lateral meltwater runoff, and (ii) that mass loss by runoff is compensated by an increase in accumulation. Data from a nearby weather station support the latter hypothesis.
- Article
(3592 KB) - Full-text XML
- BibTeX
- EndNote


Grigoriev ice cap has a history as one of Central Asia's reference glaciers for climate reconstruction and firn temperature observations. In 1962 Soviet glaciologists drilled a series of ice and firn cores on the ice cap (Dikikh, 1965). Towards the end of the Soviet Union, Mikhalenko (1989) initiated detailed studies of mass balance and firn structure on the summit of the ice cap. Two firn cores were drilled in 1990 (Thompson et al., 1993, 1997), which became the starting point of further drilling campaigns (Arkhipov et al., 1997; Mikhalenko, 1997; Mikhalenko et al., 2005; Arkhipov et al., 2004; Kutuzov, 2005; Takeuchi et al., 2014, 2019). Recent research on the ice cap has broadened to topics such as glacier dynamics and ice volume estimates (Nagornov et al., 2006; Fujita et al., 2011; Lavrentiev et al., 2018; Van Tricht and Huybrechts, 2022).
Early work on Grigoriev focused on understanding the mass balance of plateau glaciers (Dikikh, 1965; Safonov, 1983; Mikhalenko, 1989). The thermal regime of the glacier and refreezing of meltwater received particular attention. The 1990 shallow drilling aimed at investigating the potential of Grigoriev ice cap to retrieve longer climate records (Thompson et al., 1997). The collapse of the Soviet Union, however, made plans of deep coring largely obsolete. Instead, drilling on Grigoriev continued with a focus on the firn layer, similar to the earliest work by Dikikh (1965). The data from the various cores show that ice and firn are warming (Mikhalenko, 1997), provide insight into net accumulation and indicate a rather dry climate (Mikhalenko, 1989; Thompson et al., 1997; Arkhipov et al., 2004). The data have also been used to study atmospheric pollution (Usubaliev, 2003) as well as to estimate the future evolution of the glacier (Fujita et al., 2011; Van Tricht and Huybrechts, 2022). In 2007 an 87 m core was drilled to bedrock. The core was analyzed to quantify glacier and vegetation changes over several centuries to millennia (Takeuchi et al., 2014, 2019).
Grigoriev's history of ice and firn cores appears to be unique for Central Asia, but it is also remarkable on a global level. Currently, the published record ends with the 2007 core. In February 2018 we visited the ice cap, drilled an 18 m firn core and initiated continuous, automated observations of firn temperatures. The goal of the drilling was (i) to extend the exceptional time series and (ii) to quantify how the firn, as well as the glaciochemical records contained therein, is altered by current atmospheric warming. Grigoriev is an interesting example to study such changes as firn temperatures, while still cold, have been measured relatively close to temperate conditions in 1990 and the early 2000s. Here we present the core analysis and the firn temperature record. We combine new and legacy measurements to quantify changes in net accumulation rates, stratigraphy, archived glaciochemical information and firn temperatures since the cores drilled in 1990. Observed changes could provide insight into how other, currently still colder drill sites, might react to continued future warming.
Grigoriev ice cap (sometimes also transliterated to Gregoriev) is located in northeastern Kyrgyzstan (at 41.975° N, 77.913° E) in the Terskey Alatoo range of the inner Tien Shan mountains (Fig. 1). The ice cap forms a relatively flat glacier plateau of ∼8 km2, reaching from ∼4100 to ∼4600 m a.s.l. The summit of the ice cap forms a flat area of roughly 200 m in diameter. Grigoriev ice cap is retreating and losing mass. Glacier retreat is most obvious at its southern margin. Since 1965, the ice margin has melted back by approximately 300 m or ∼5 m yr−1 (Fig. 1; Mikhalenko et al., 2005; Kutuzov, 2005; Kutuzov and Shahgedanova, 2009).
The area around the ice cap is seasonally inhabited by livestock farmers and herders during summer. The climate is rather dry with annual precipitation of 291 mm (mean 1930–1997) and 350 mm (mean 1998–2009) as measured at the Tien Shan/Kumtor weather station. Precipitation peaks during summer; according to Mikhalenko (1989), only a quarter of annual precipitation on Grigoriev falls during the months of October to April, and Engel et al. (2012) state that 45 % of annual precipitation at the Tien Shan station fell from June to August.
The Tien Shan/Kumtor weather station is located at 3614/3660 m a.s.l., ∼20 km east of Grigoriev (Engel et al., 2012). The meteorological record starts in 1930; in 1997 the station was moved a few kilometres. The two names and two elevations refer to until the year 1997 and since 1997. The moving of the station introduced potential step-changes in the measurements. For example, Engel et al. (2012) caution that it is unclear whether the above-mentioned increase in average annual precipitation is primarily caused by a change in weather conditions or by the moving of the station. Because Tien Shan/Kumtor is the only source of long-term meteorological measurements in the vicinity of Grigoriev, we use the data, qualitatively, to aid interpretation of the ice cores. We emphasize that any conclusions related to the station data need to be considered preliminary.
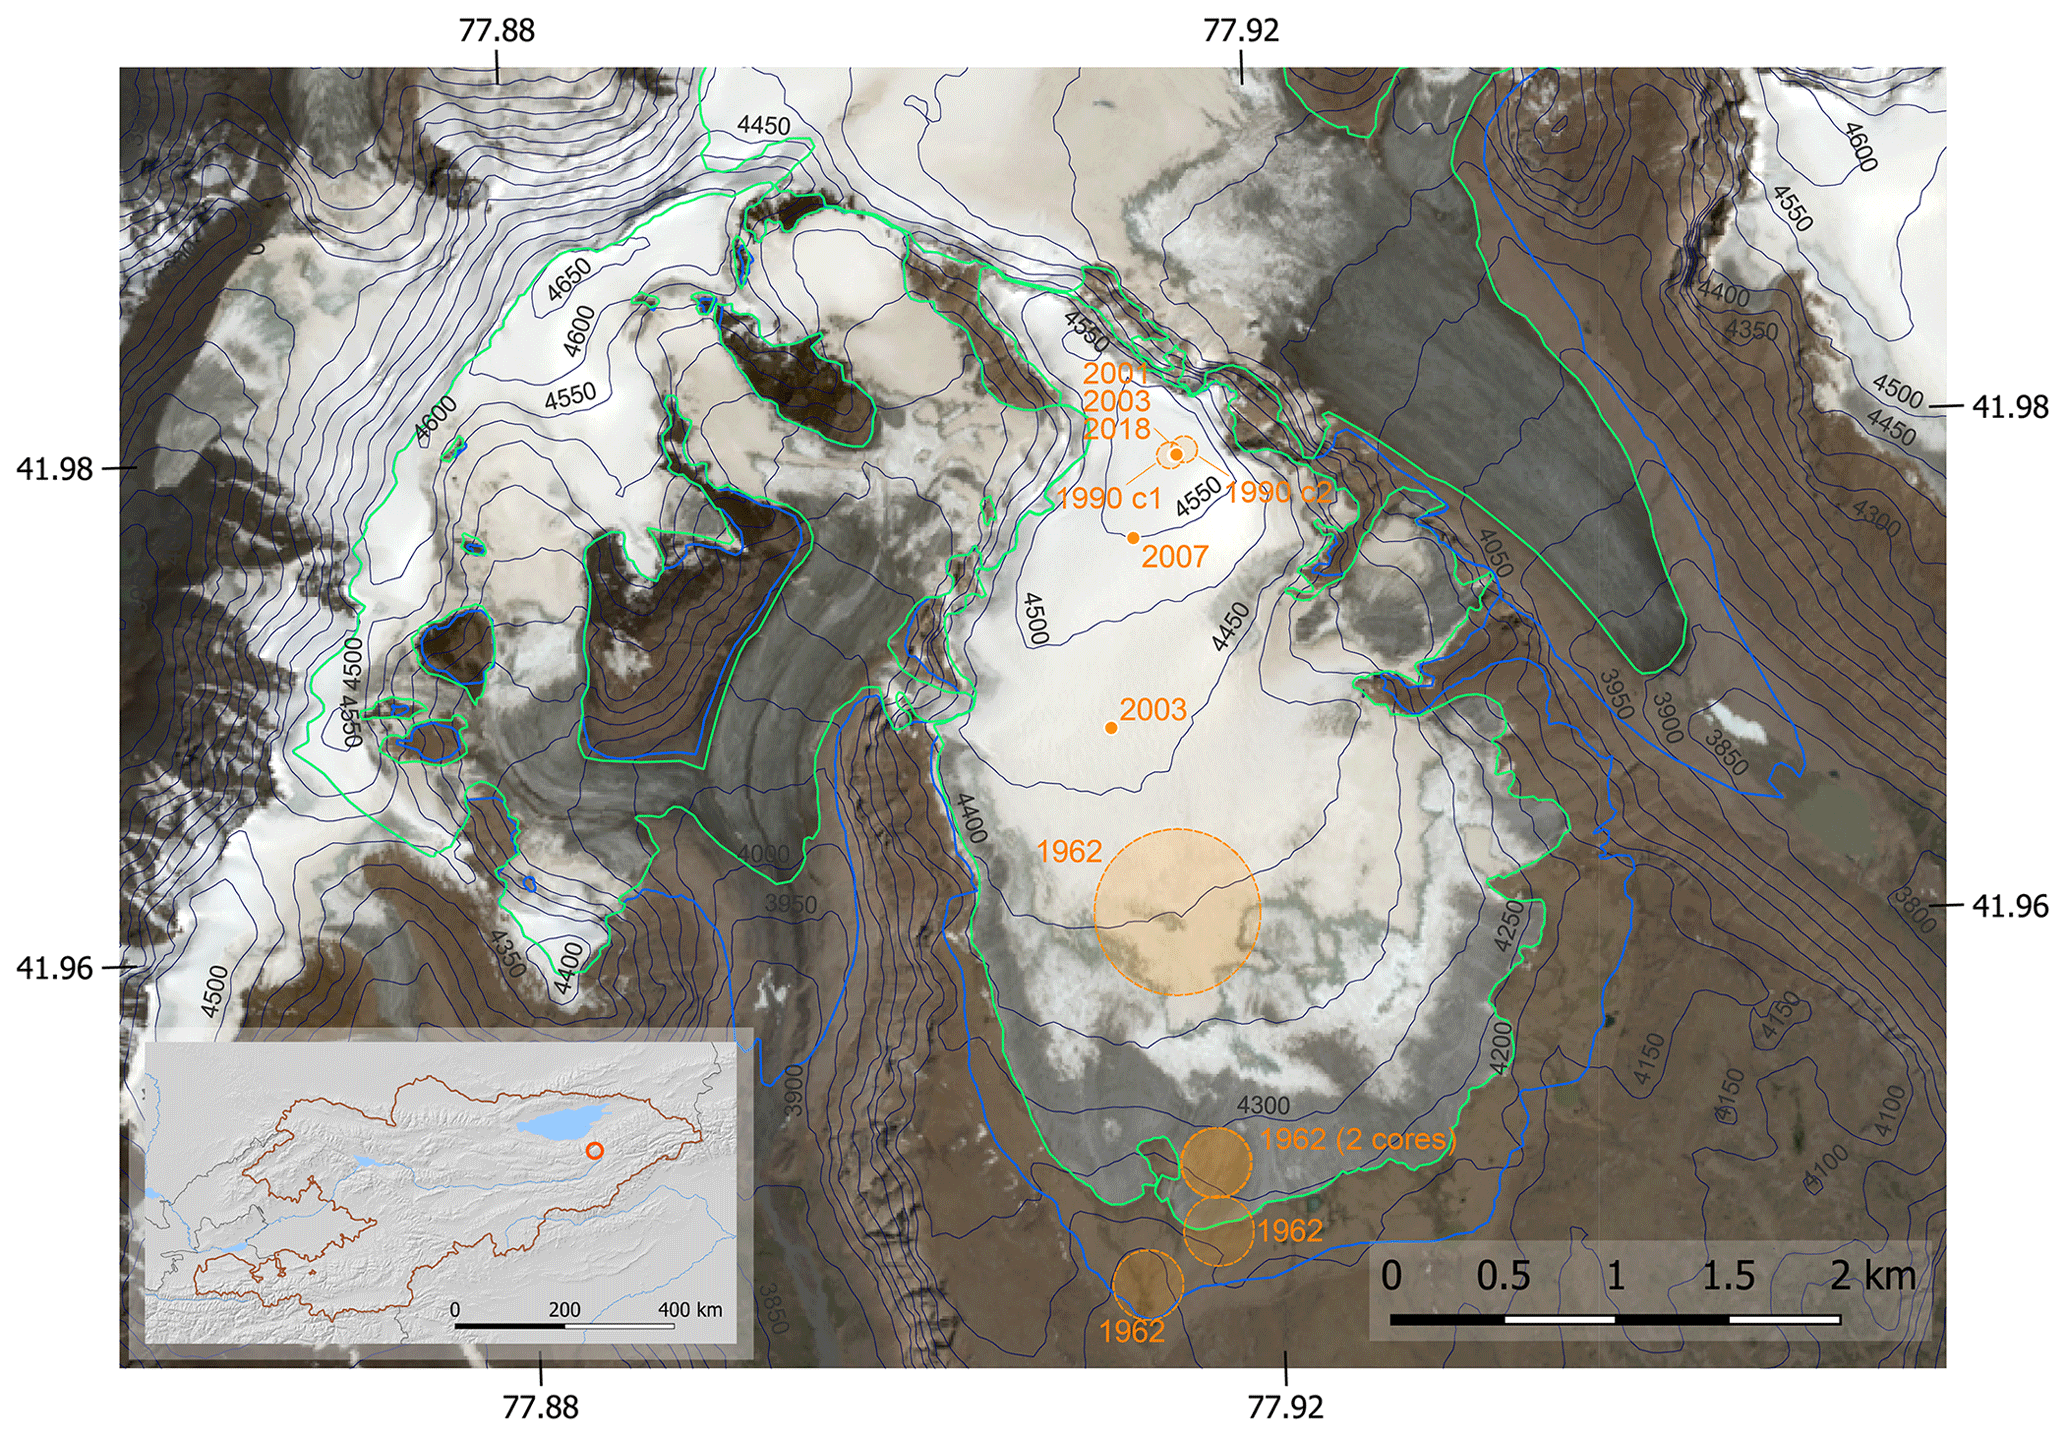
Figure 1Grigoriev ice cap as seen on a Sentinel-2 L2A true color composite from 26 July 2021. The map shows the locations of the drill sites in orange (shown as dots where exact coordinates measured; approximate locations are shown with orange shading) and glacier extent for 1965 (blue) and 2022 (green). Elevation contours are based on SRTM digital elevation model (vertical datum EGM96 geoid), and coordinates are in decimal degree longitude and latitude. The inset map shows Kyrgyzstan with lakes in blue, the red circle denotes the location of Grigoriev ice cap.
3.1 Historical firn and ice core data
Starting in 1962, a total of seven core drilling campaigns provided data from Grigoriev ice cap (Table 1). The available data are diverse. Several cores were drilled on the summit, but other drill locations exist (Fig. 1). Cores reached to depths between 4 m and down to bedrock at almost 87 m. There is strong variability in the level of detail of core analysis. Density profiles and firn temperatures are available most consistently. Not included in Table 1 is a coring expedition during the year 2002 which suffered from challenging weather conditions and obtained little data.
Dikikh (1965)Mikhalenko (1989)Thompson et al. (1993, 1997)Mikhalenko (1997)Arkhipov et al. (2004)Kutuzov (2005)(Table 2, Fig. 2; Usubaliev, 2003)Mikhalenko et al. (2005)Usubaliev (2003)Arkhipov et al. (2004)Mikhalenko et al. (2005)Mikhalenko et al. (2005)Kutuzov (2005)Shun et al. (2012)Takeuchi et al. (2014, 2019)Eichler et al. (2020)Table 1Overview of firn and ice core drilling campaigns that took place on Grigoriev ice cap since 1962. The column “Depth” also indicates whether a core was drilled mechanically “m” or thermally “t”; snow/firn pits are denoted by “p”. Originally reported elevations are listed; elevation and depth of cores drilled on the summit plateau are marked in bold. Elevations of drill sites are of limited accuracy or might refer to different vertical datums. Over the time period 1990 to 2018, the summit plateau was likely always at roughly 4600 m a.s.l.
For the remainder of our study, we mostly focus on the legacy summit cores drilled in the years 1990, 2001 and 2003. We focus on these cores because stratigraphy has been reported for all of them; that is, information about the presence of infiltration ice (i.e. ice lenses and layers) and recrystallization ice (i.e. porous firn) is available at a vertical resolution of 1 cm or higher. Given the high firn ice-content (see Sect. 4.5), studies focused on infiltration ice and less on delicate features such as buried melt-freeze crusts. Temperatures were measured in most summit boreholes. Density records exist with the exceptions of one of the 1990 cores and the 2001 core (Table 1). The existing density data for the other 1990 core are coarsely and irregularly spaced along the depth axis.
Water stable isotopes δ18O and δD were measured in all cores. In the two 1990 cores, NO, SO, Cl− and other impurities were analyzed, and glaciochemical records also exist for the 2001 core (Usubaliev, 2003). Visible dust layers were recorded for most cores.
3.2 Drilling of the 2018 firn core
A firn core of 17.9 m in length was drilled on 7 and 8 February 2018 on the very top of Grigoriev ice cap (41.9791° N, 77.9158° E; ∼4600 m a.s.l.). The core was 9 cm in diameter and drilled using a Mark II Kovacs ice corer. The core was packed in polyethylene bags in segments of 0.16 to 0.57 m length (mean ±1σ = 0.34±0.09 m) and shipped in frozen condition for analysis to Paul Scherrer Institute (PSI) in Villigen, Switzerland.
3.3 Analysis of the 2018 firn core
The core segments were sampled in the cold room of PSI at −20 °C. First, each segment was photographed on a light table with the length, diameter and stratigraphy (melt layers, dust layers) recorded. At a resolution of 1 cm, three classes were distinguished: snow, porous firn and ice. Where the content of a 1 cm interval was mixed, the percentages of the classes involved were estimated and noted down. Then, segments were cut using a modified band-saw setup (stainless-steel saw blade; tabletop and saw guides covered with Teflon). Inner bars of the core segments with a cross section of cm, less prone to potential contamination from drilling and handling procedures in the field, were cut and divided into ∼5 cm samples. After measuring mass and dimensions of each sample for highly resolved density determination, samples were placed into pre-cleaned 50 mL polypropylene tubes. For all core segments, two parallel samples were obtained. One sample was used for the analyses of water stable isotope ratios (WSI, δ18O and δD) and major ion (MI) concentrations and the other one for determination of the refractory black carbon (rBC) concentrations. A total of 2×361 samples was obtained for WSI/MI and rBC analyses. Concentrations of MIs (Na+, NH, K+, Mg2+, Ca2+, F−, HCOO−, CH3COO−, Cl−, NO, SO, (COO)) were analyzed after melting the samples at room temperature using ion chromatography (IC; 850 Professional IC equipped with a 872 extension module liquid handling and a 858 Professional sample processor autosampler, Metrohm) (Avak et al., 2019). The precision of the method is 5 %. Determination of WSI ratios in the molten samples was performed using wavelength-scanned cavity ring-down spectroscopy (WS‐CRDS, L2130‐i Analyzer, Picarro) (Avak et al., 2019). The measurement uncertainty is <0.1 ‰ for δ18O and <0.5 ‰ for δD.
We performed the analyses of rBC in the parallel samples, molten at room temperature and sonicated in an ultrasonic bath for 25 min, using a single-particle soot photometer (SP2, Droplet Measurement Technology, Inc., Boulder, CO, USA) coupled to an APEX-Q jet nebulizer (Elemental Scientific Inc., USA) (Wendl et al., 2014). Precision of the method is ∼10 %.
3.4 Dating of the 2018 firn core and β-activity measurement
Precise dating of firn and ice cores is key to reconstruct past climate and atmospheric conditions. Age–depth scales of cores, covering recent decades, are often based on seasonally varying concentrations of impurities such as NH (Eichler et al., 2000). If the seasonal signal is well preserved, annual layers are counted to establish an age–depth relationship.
For the Grigoriev core, we applied annual layer counting using the seasonality in NH concentrations and density records. The core is too short to reach the year 1963, usually identified by a tritium or 137Cs activity maximum from atomic bomb testing (e.g. Eichler et al., 2000). Instead we aimed to find the 1986 horizon, potentially marked by a maximum in total β activity related to the fallout from the Chornobyl nuclear power station accident in April 1986.
For the total β-activity measurements, 10 core samples covering continuously the range between 7 and 16 m depth and one blank sample (frozen ultrapure water) were prepared. Each sample consisted of 1 kg of ice, acidified in a 1 L plastic container with 0.33 mL of concentrated HCl (Hou et al., 2007; Eichler et al., 2020). Acidified samples were melted at room temperature and filtered using cation exchange filters (Macherey-Nagel MN616 LSA-50). Every sample was filtered three times by filtering the filtrate twice. The filters were dried at 60 °C overnight and analyzed for total β activity. Each sample was measured six times for 1 h at a Berthold LB 790 detector and the results averaged. Final β activities were blank corrected (Eichler et al., 2020) using the blank value of 33 mBq kg−1 of ultrapure water.
3.5 Firn temperatures and auxiliary temperature records
On 8 February 2018, we installed an automatic firn station on the summit plateau. The station's key component is a chain with 15 thermistors (type YSI 4460031), placed inside the borehole. At the time of installation, the uppermost thermistor was located 0.4 m below the surface. Vertical spacing was 0.5 m until 5.4 m depth, followed by thermistors at depths of 7.4, 11.4, 17.4 and 17.9 m. The chain was connected via a multiplexer to a data logger (CR-800, Campbell Scientific) attached to an aluminium pole at >2 m above ground. Furthermore, we installed a sensor measuring air temperature Ta and a sonic ranger (SR-50, Campbell Scientific) to measure changes in surface height. The station was visited on 1 September 2018 and data were retrieved. It was noted that measurements of firn and air temperatures ended on 28 March 2018 because the multiplexer broke. On 16 October 2022, the station was visited again and the multiplexer was replaced. On 1 August 2023, the station was visited, data were downloaded and the mast was extended. The station had been measuring continuously since the replacement of the multiplexer on 16 October 2022.
4.1 Core stratigraphy, density and glaciochemical records
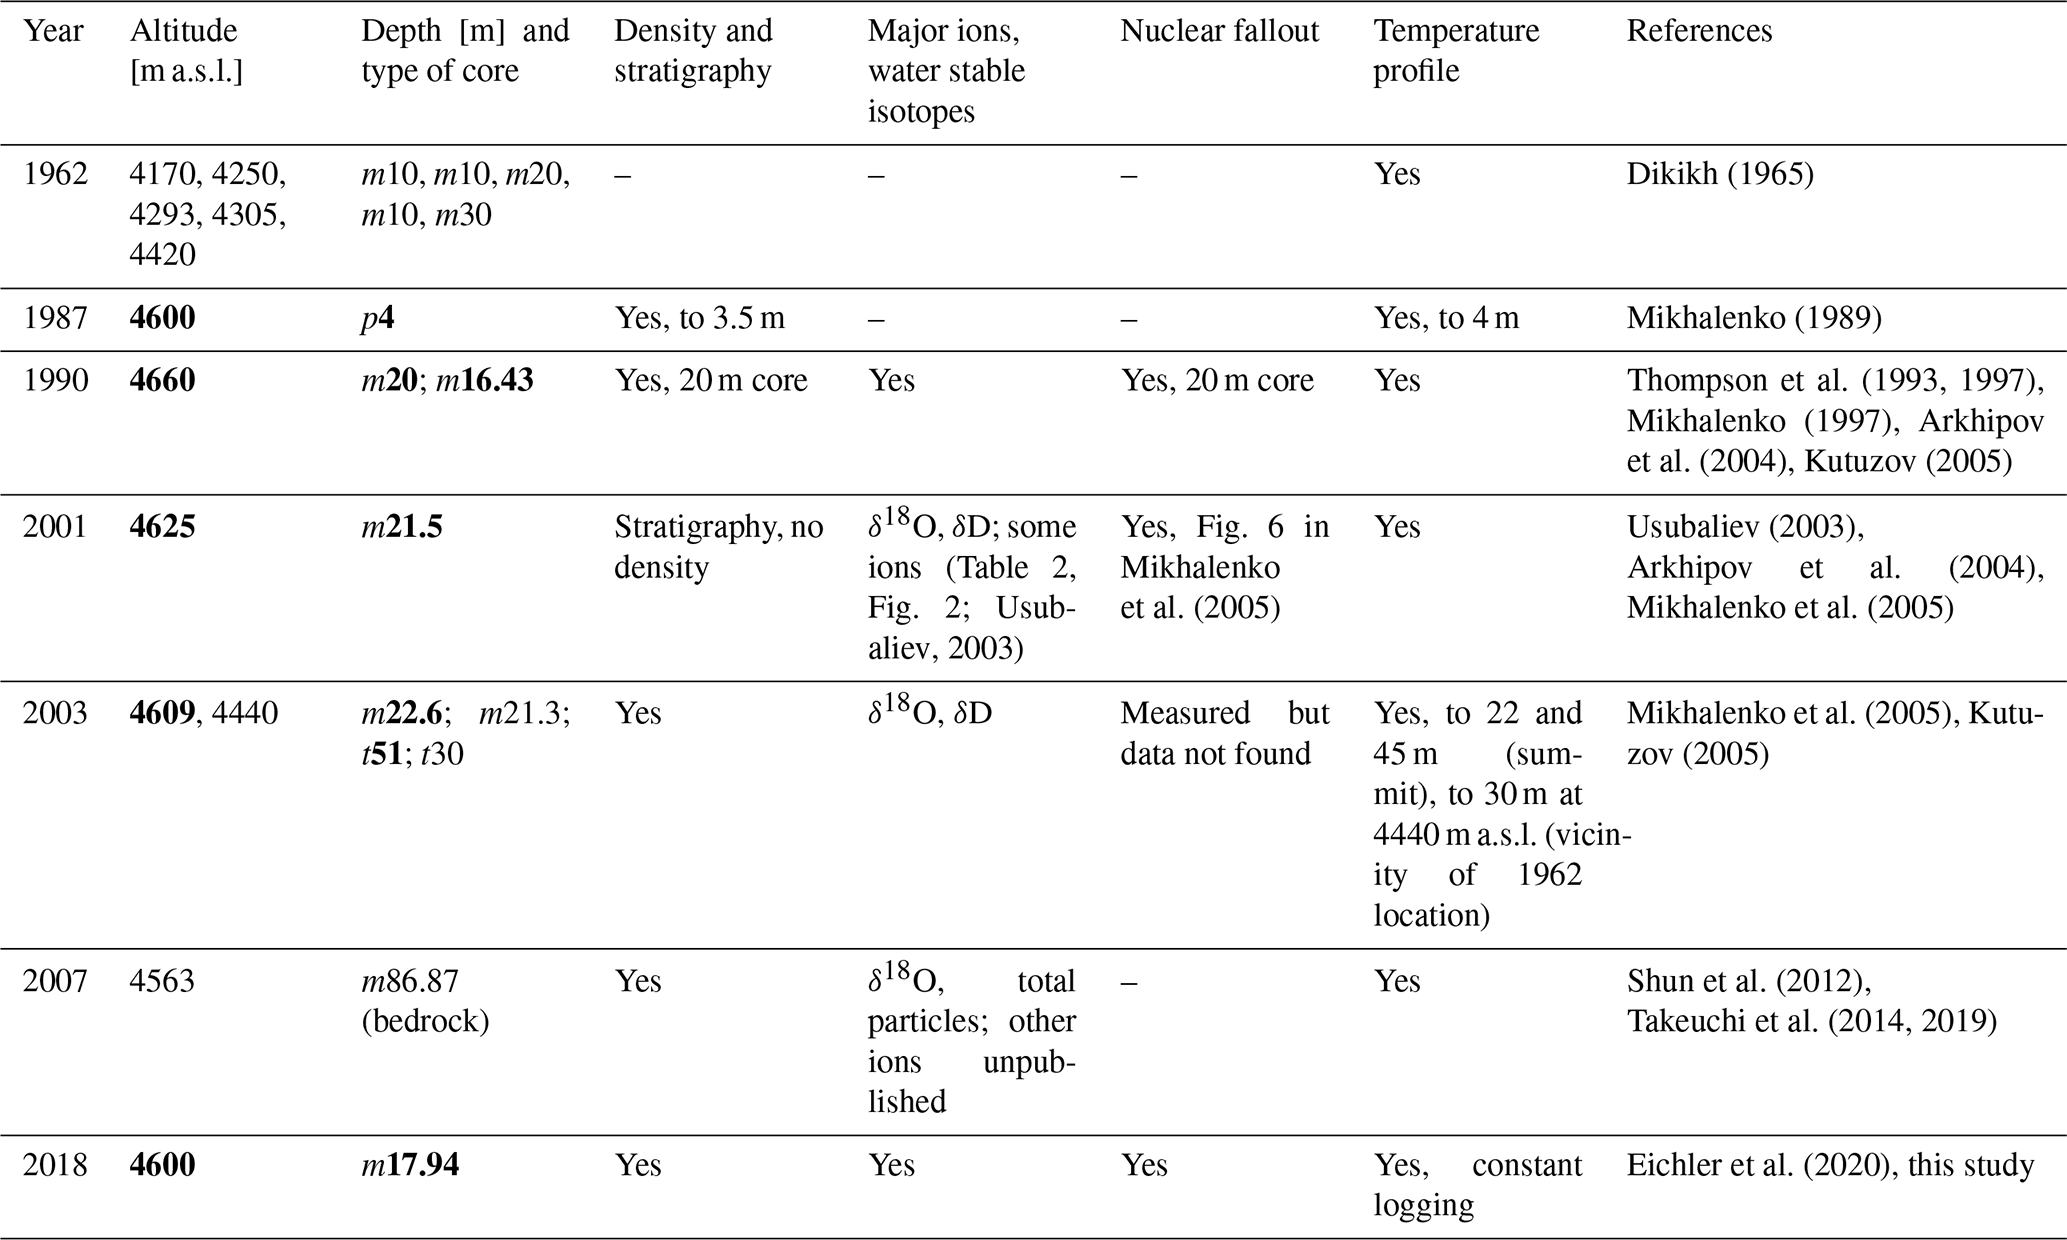
Figure 2 shows stratigraphy, density, measured concentrations of selected major ions, black carbon and δ18O. The core consists to 60.2 % of infiltration ice, the remainder being a ∼65 cm snow layer at the surface and numerous layers of porous firn. The density record indicates a mean density of 789 kg m−3. Given abundant infiltration ice, there is no obvious density gradient with depth. However, layers of porous firn situated near the surface have lower densities than at depth.
Isolated samples show densities higher than the one of pure ice (917 kg m−3, while the maximum measured in the core is 996 kg m−3). These unlikely densities indicate uncertainties in the density measurements. We calculate the latter based on estimated uncertainty of width and height (both 2±0.1 cm) and length (5±0.1 cm) of the small ice cubes whose weight was determined with an uncertainty of 2 % (all uncertainties expressed as 1σ). Following the laws of error propagation and expressing overall uncertainty in percent, this yields 7.6 % as the 1σ uncertainty of individual density measurement.
We attribute fluctuations in major ion and black carbon concentrations to seasonal variations of atmospheric stability. Low values occur in winter due to a decoupling of the high-altitude glacier site from the planetary boundary layer, where the sources are located and which is thus more strongly polluted (e.g. Eichler et al., 2023). This behaviour is the basis for dating by annual layer counting (e.g. Eichler et al., 2000). δ18O values also show fluctuations but no clear seasonality. Observed maxima of these species during the warm season are in accordance with observations of the seasonality of precipitation, which is predominant in summer, and only a quarter occurs from October to April (Mikhalenko, 1989). In addition, surface melting and refreezing of meltwater (relocation of the signal) might have caused a smearing of the signal.
Concentrations of the major ions Cl−, Na+, SO, Ca2+, K+ and Mg2+ are generally highly correlated among each other (), indicating joint transport and/or similar sources such as desert regions. The latter is in accordance with observations of atmospheric dust entrainment occurring in Central Asia primarily between spring and autumn (Grigholm et al., 2017). Remarkable are the common depleted concentrations of major ions in the topmost 7 m (Fig. 2).
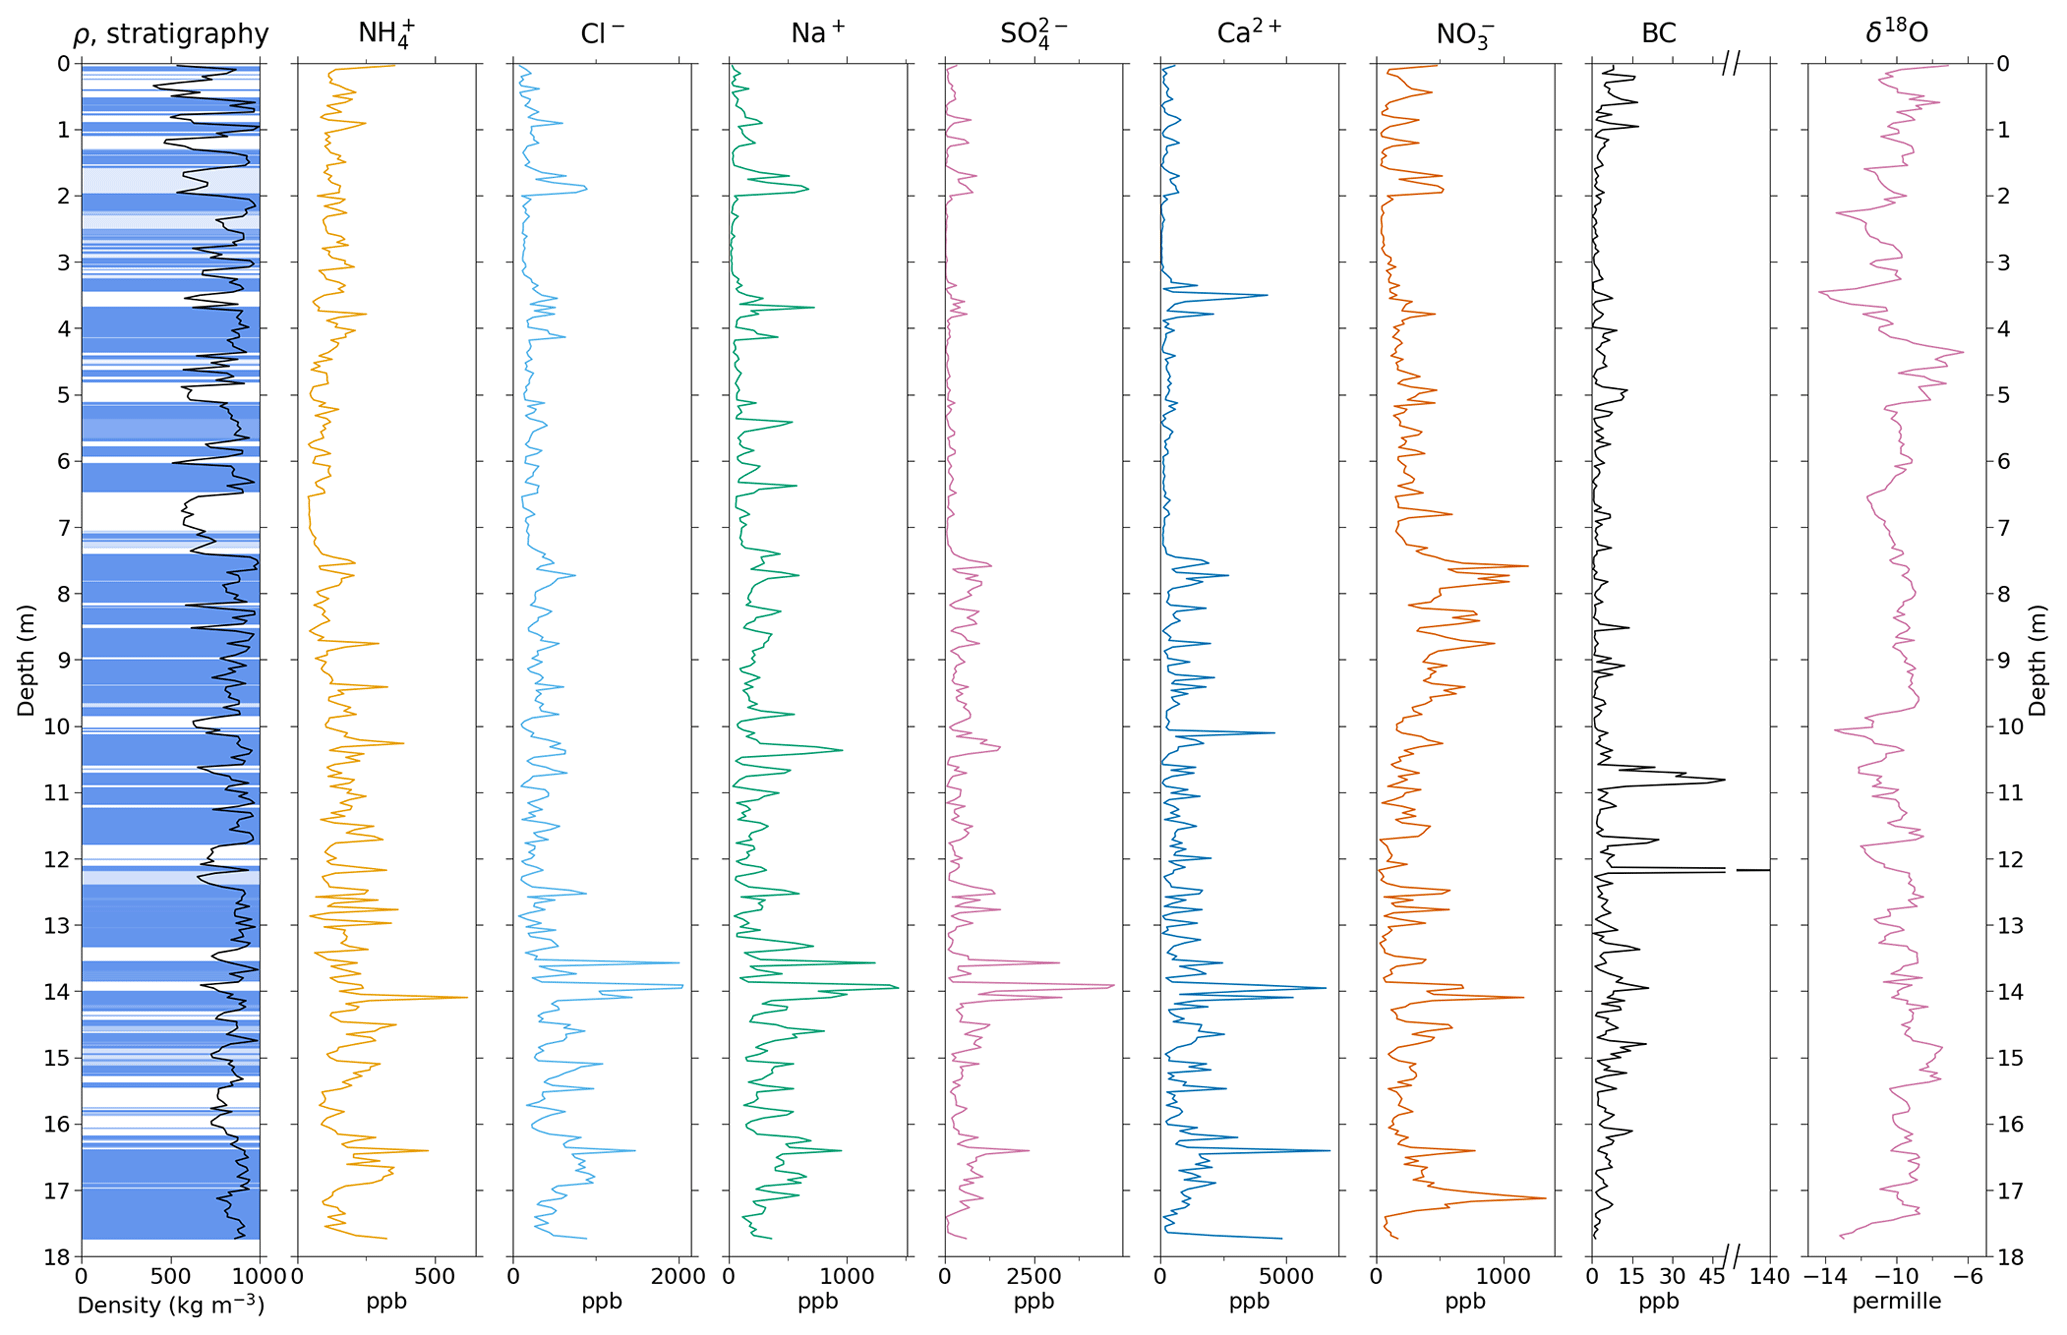
Figure 2Firn stratigraphy, density, concentrations of selected major ions, black carbon and δ18O in the 2018 Grigoriev core. Firn stratigraphy shows ice layers in blue and firn in white. Areas in light blue indicate regions of mixed firn and ice.
4.2 Dating of the 2018 core
Blank-corrected total β activity varies between 18 and 108 mBq kg−1 (Fig. 3a). Two of the samples show maximum total activities of 83 and 108 mBq kg−1. The dust-normalized β activity (ratio of β activity [Ca2+]) also reveals a maximum at the same depth (not shown). Retention of β activity on the filter depends on the total quantity of insoluble matter (Picciotto and Wilgain, 1963). Since we did not measure the latter, we used Ca2+ for normalization, as insoluble particle and Ca2+ concentrations are typically well correlated (Bohleber et al., 2018). Based on measured β activities, we conclude that fallout from the Chornobyl accident is included in two samples (11.3–12 m and 12–12.9 m depth; see Fig. 3a). Thus, the depth of 12 m in between these two samples was assigned to the year 1986.
Initial layer counting was based solely on seasonality of NH concentrations and density and yielded a bottom age of 40 years with an estimated uncertainty of 10 years. Additionally using the Chornobyl 1986 reference horizon, we refined the dating. Accordingly, the 17.8 m core covers the period from 1972 (±3 years) to 2018 and thus 46±3 years.
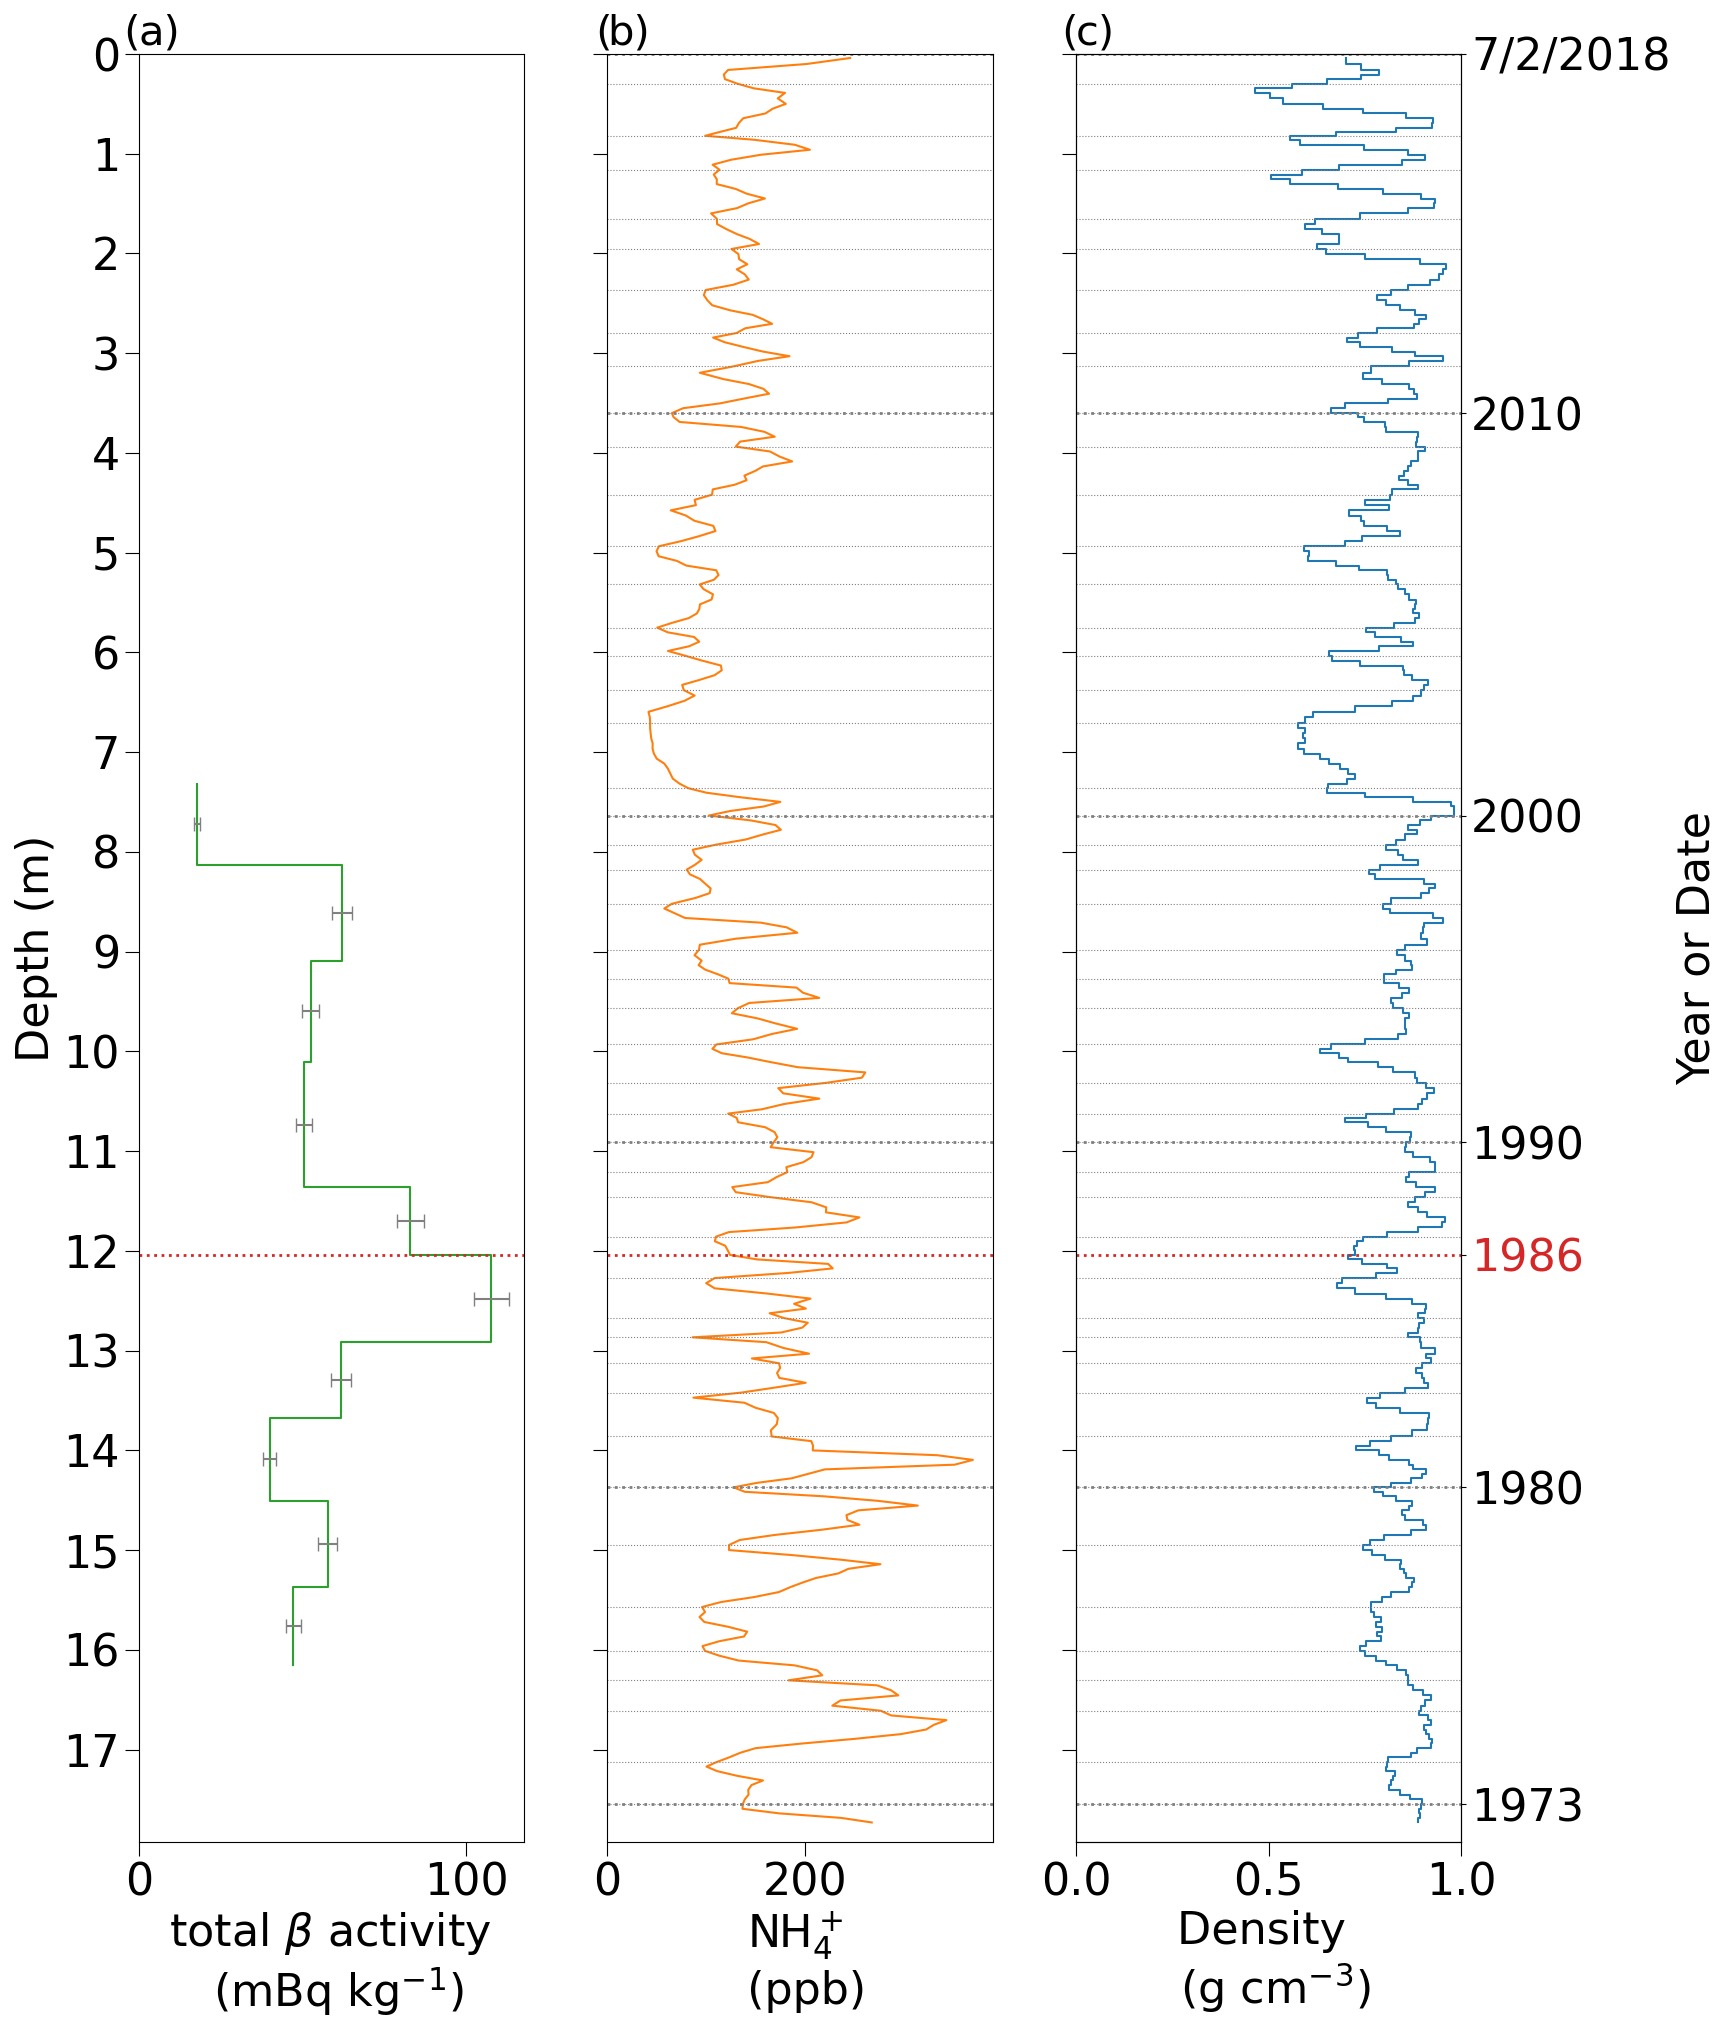
Figure 3Dating of the 2018 Grigoriev firn core, showing depth and age axis. The 1986 reference horizon is highlighted in red. (a) Blank-corrected total β activity with analytical uncertainties. (b) Ammonium (NH) concentration in ppb, 3-point moving average of the measurements in the core. (c) 3-point moving average of density profile measured in the core. Thin horizontal lines in panels (b) and (c) indicate annual layers, thick dotted lines show decadal boundaries.
4.3 Combining the environmental record with earlier cores
We extended the environmental records by combining the records of the glaciochemical parameters analysed in both the 1990 and 2018 cores (δ18O, Cl−, NO, SO). Comparing the records where they overlap also indicates whether the dating of the 2018 core is compatible with the 1990 cores. For all four parameters and considering their bounds of uncertainty, we find good agreement for the overlapping period (Fig. 4a to d).
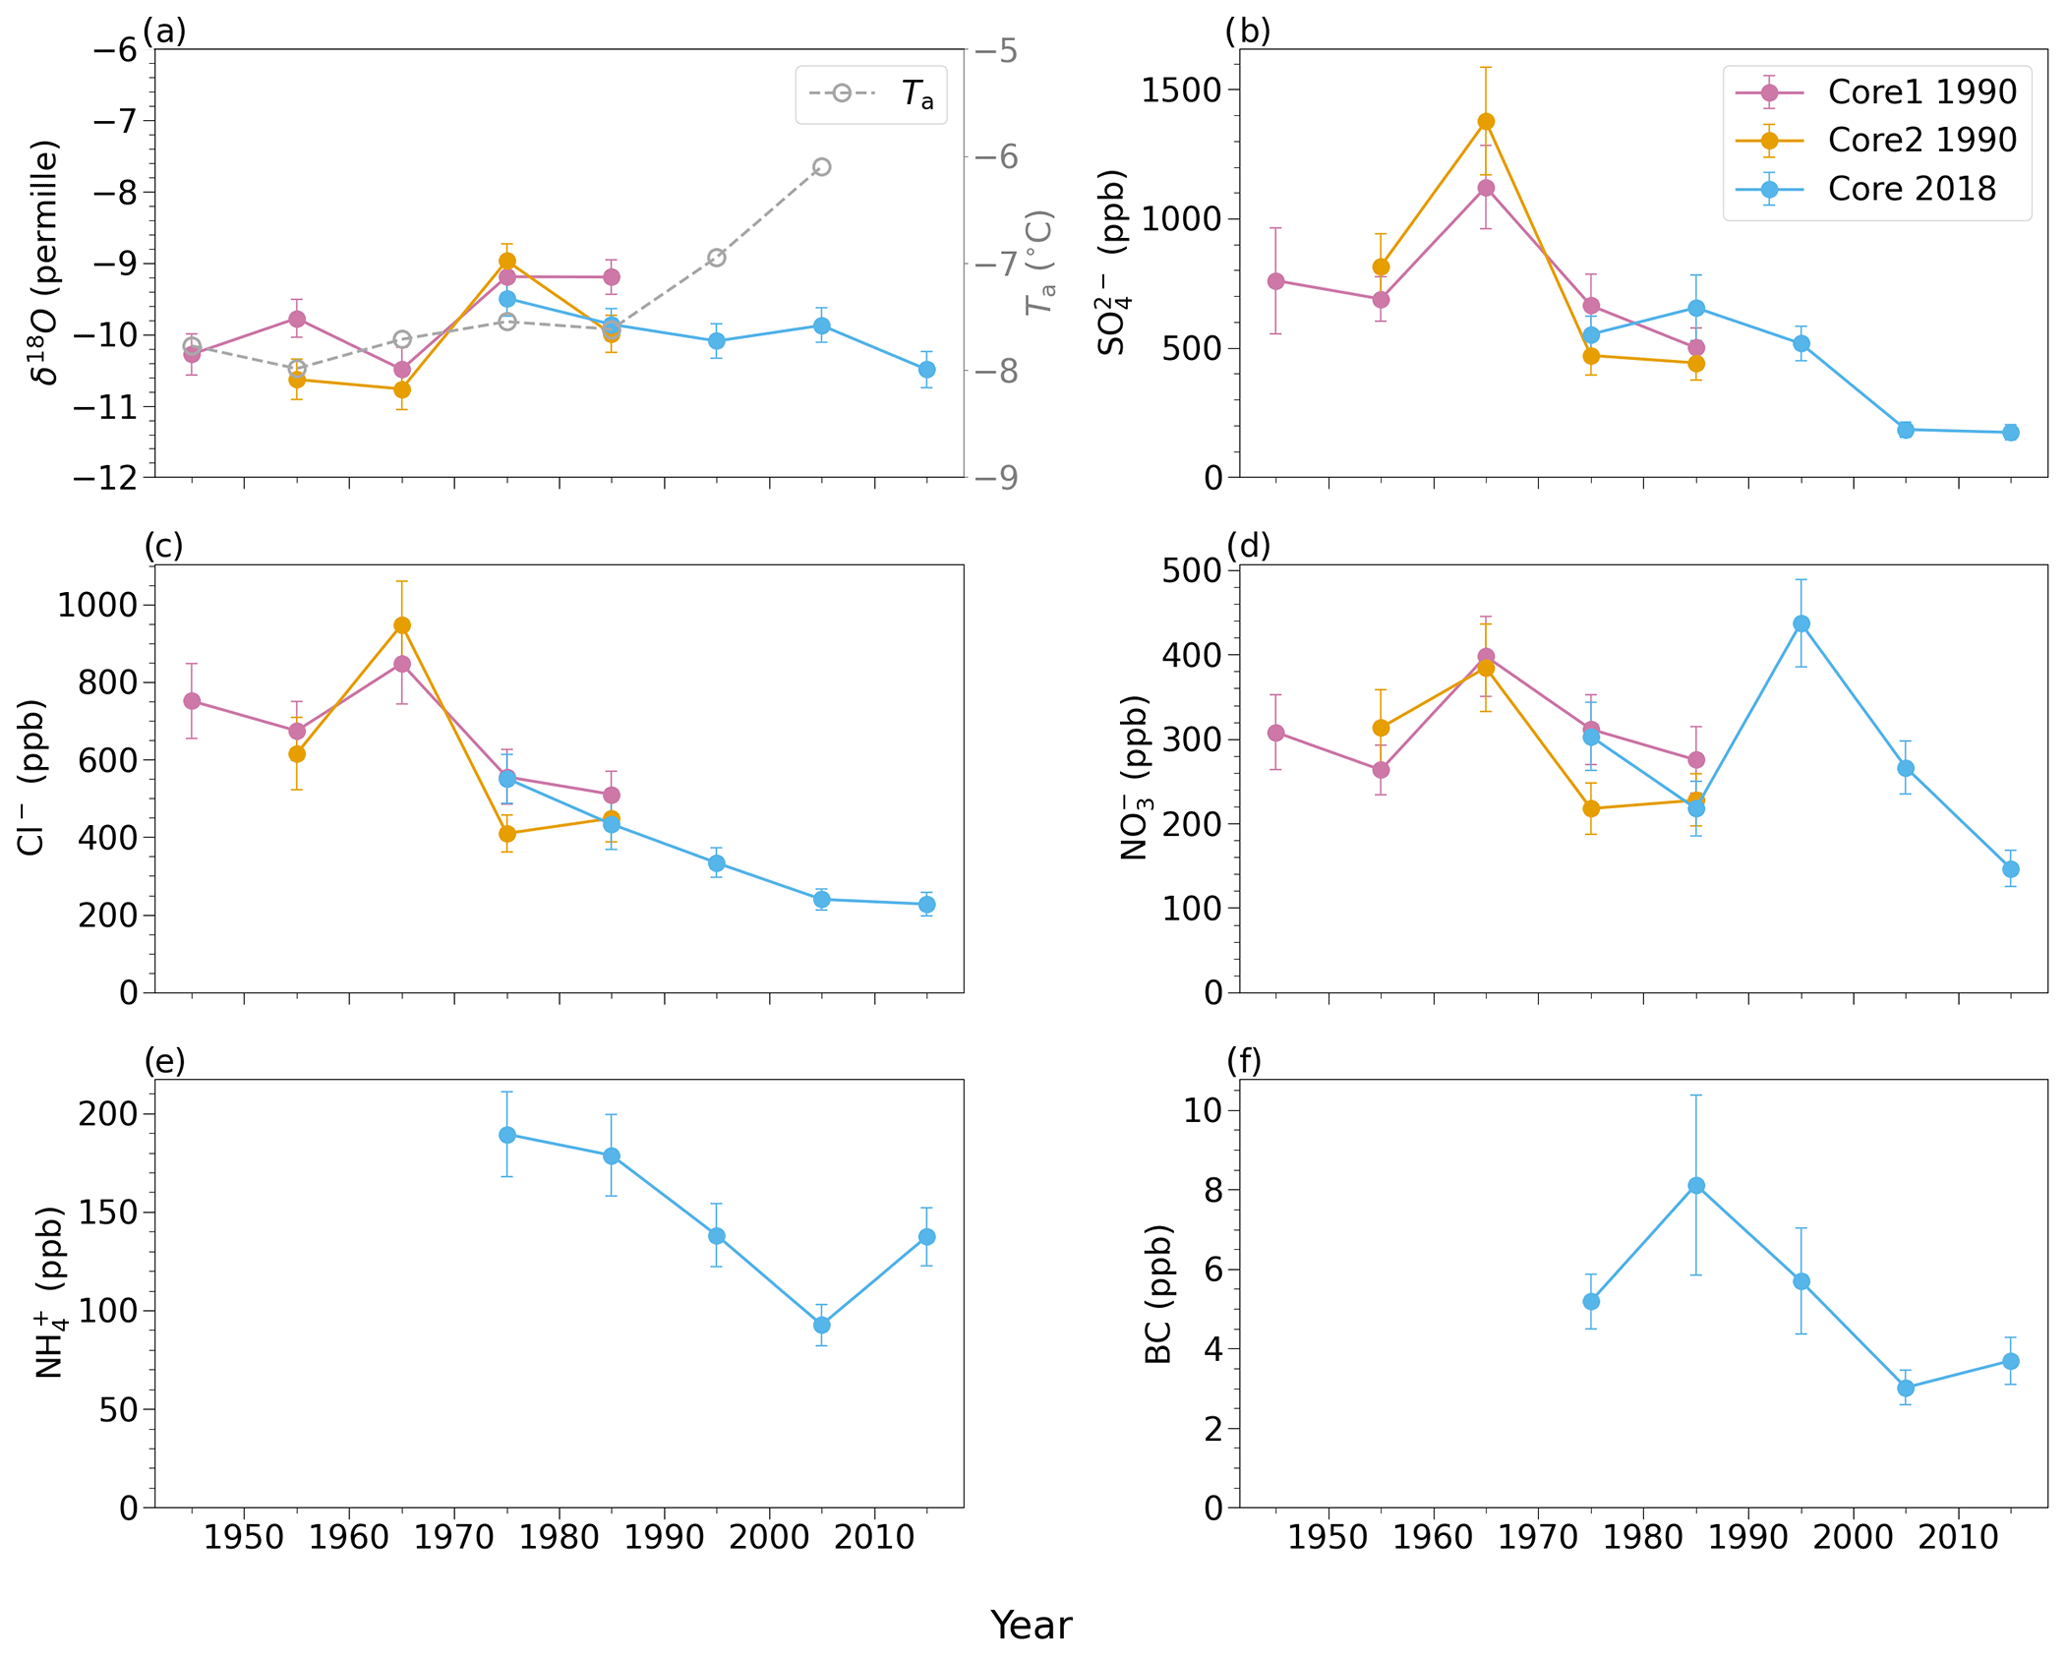
Figure 4Comparison of decadal means in δ18O, major ions and black carbon (BC), measured in the two 1990 cores as well as the 2018 core. Error bars indicate standard errors. Panel (a) also shows decadal means of air temperature Ta (1940s to 2000s) measured at the Tien Shan/Kumtor weather station (data from Engel et al., 2012).
4.4 Accumulation rate and melt proxies
We calculated mean net accumulation of 0.29 m w.e. yr−1 for the 32-year period from 1986 (Chornobyl horizon) to 2018 (surface) and of 0.31±0.02 m w.e. yr−1 for the period from 1972±3 years (end of core) to 2018. We used annual layer dating and densities (Fig. 3) to calculate annual and decadal net accumulation rates (Fig. 5a). Highest rates of net accumulation occurred between 1972 and 1979 (0.36 m w.e. yr−1). Accumulation then dropped and reached a minimum in the 1990s (0.27 m w.e. yr−1). Afterwards, decadal mean net accumulation remained stable at ∼0.3 m w.e. yr−1 for the years 2000 to 2018. As in all other firn-core-based accumulation estimates for Grigoriev (e.g. Thompson et al., 1997; Mikhalenko et al., 2005), we do not consider thinning of layers resulting from ice flow.
Figure 5b shows annual ratios together with SO concentrations. The deposition of sea salt (NaCl) is a dominant source of Na+ and Cl− in snow. Accordingly, firn core parts barely influenced by meltwater percolation show a (mass) ratio of 1.78, corresponding to the sea salt ratio. Because of preferential elution of Na+ compared to Cl−, layers strongly influenced by melting are marked by ratios exceeding the sea salt ratio (Eichler et al., 2001). High ratios after ∼2005 are thus indicative of strong meltwater impact. Similar to Na+, SO is strongly relocated by meltwater, and depleted SO since around the year 2001 suggests strong elution due to melting.
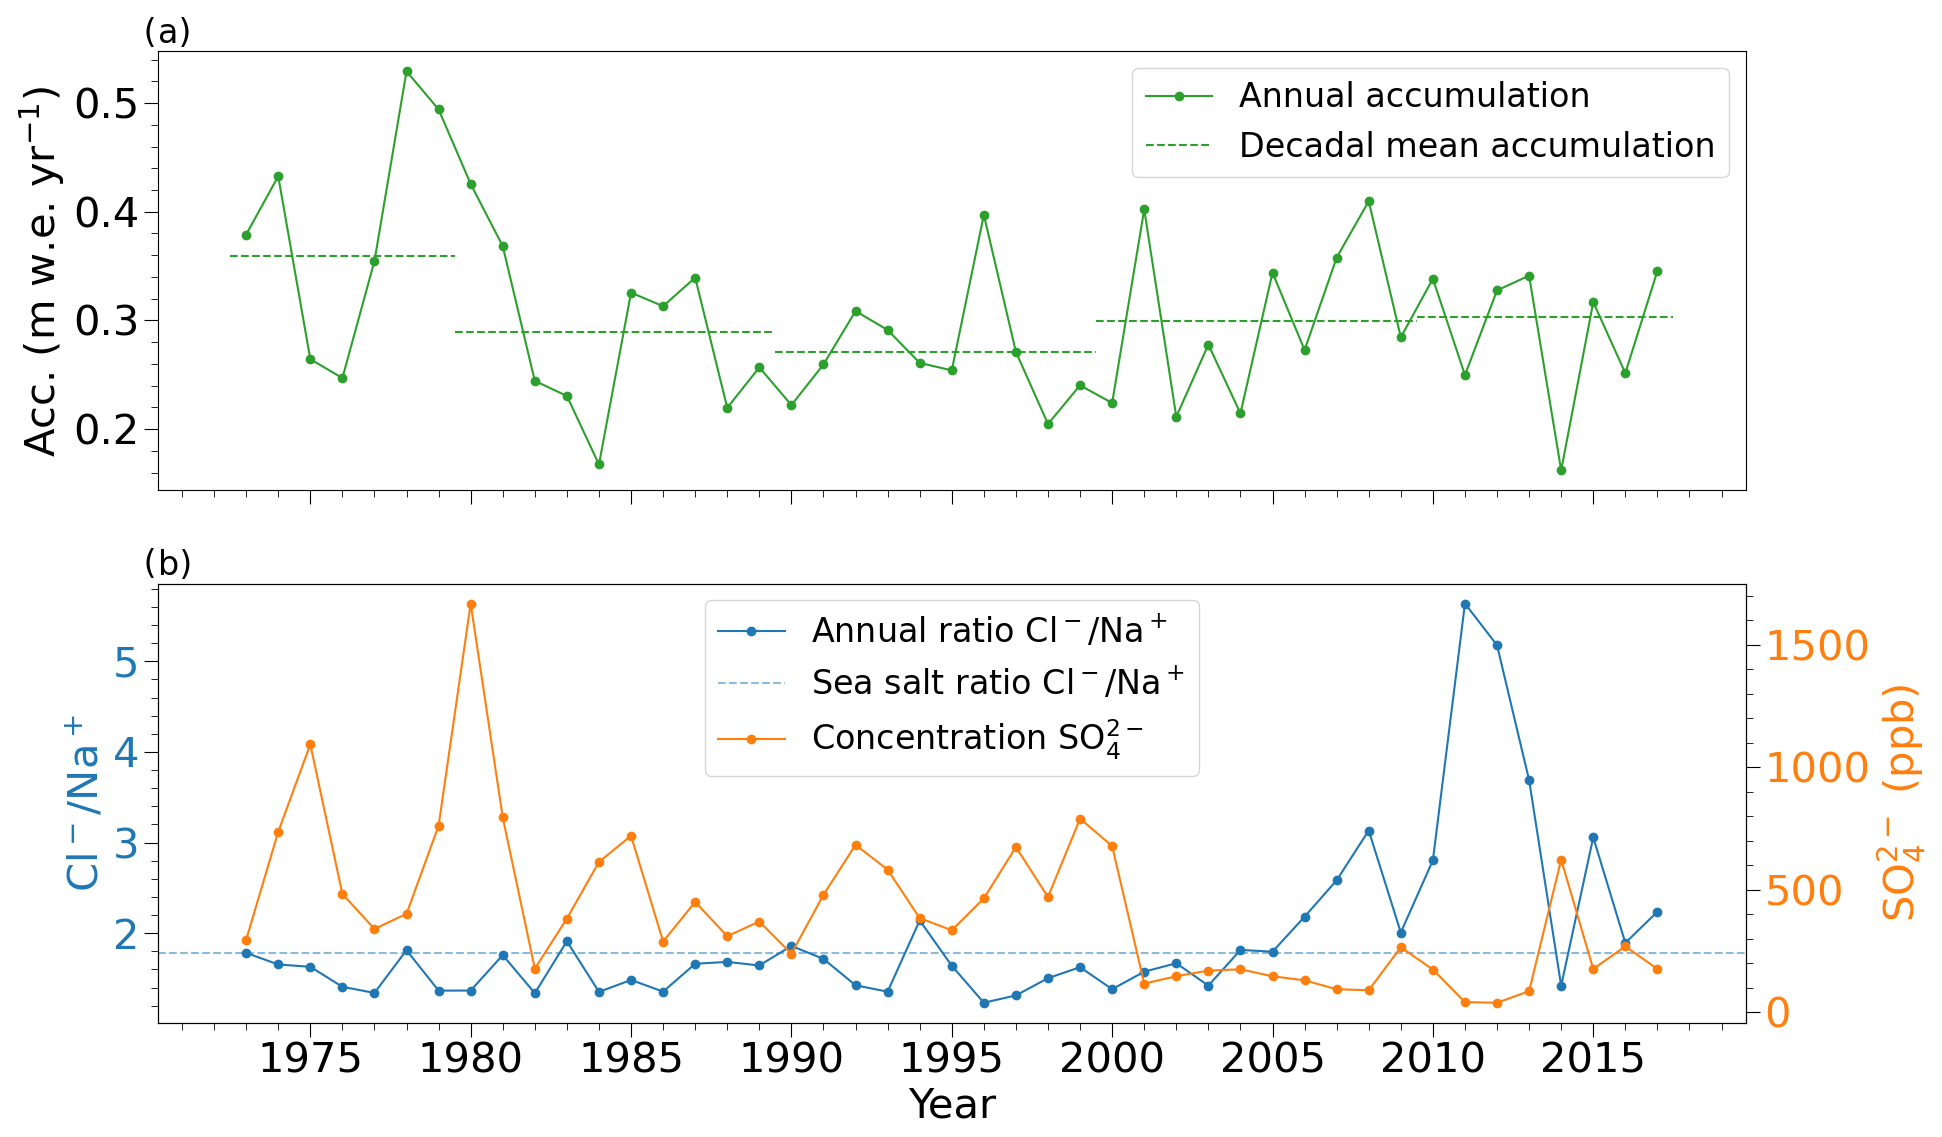
Figure 5Accumulation rates, melt proxy and sulfate. (a) Annual and decadal rates of net accumulation. Note that the first (1972–1979) and last (2010–7 February 2018) “decade” do include fewer than 10 years. (b) Melt proxy ratio and SO concentration. For comparison, the sea salt ratio of is shown.
4.5 Firn temperature (1990–2023) and firn structure (1990–2018)
Figure 6 shows firn temperatures on 28 March 2018 (last measurement before the failure of the multiplexer) and 1 August 2023 (most recent available measurement). The data are shown in the context of all legacy firn temperature measurements on the summit. Also shown are the temperatures measured in the 2007 core that was drilled at 4563 m a.s.l., approx. 400 m southeast of the summit.
Near-surface firn temperatures vary strongly because of measurements being taken at different times of the year. The 2018 data show substantial cooling of the near-surface during the winter months. Below ∼15 m depth, the influence of seasonal temperature fluctuations becomes absent (cf. Zagorodnov et al., 2006). For the remainder of this study, we focus on those depth intervals as they allow for determining long-term trends in firn temperatures. Figure 6 shows that the 2018 firn temperatures are the highest at −1.56 and −1.58 °C (17.4 and 17.9 m depth, respectively). In August 2023, however, we find firn temperatures of −2.53 and −2.46 °C (20.1 and 20.6 m depth, respectively). These firn temperatures fall within values typical for the early 2000s and indicate a cooling of ∼0.9 °C between March 2018 and August 2023. The change in depth is due to ∼2.7 m of snow accumulation between the two dates.
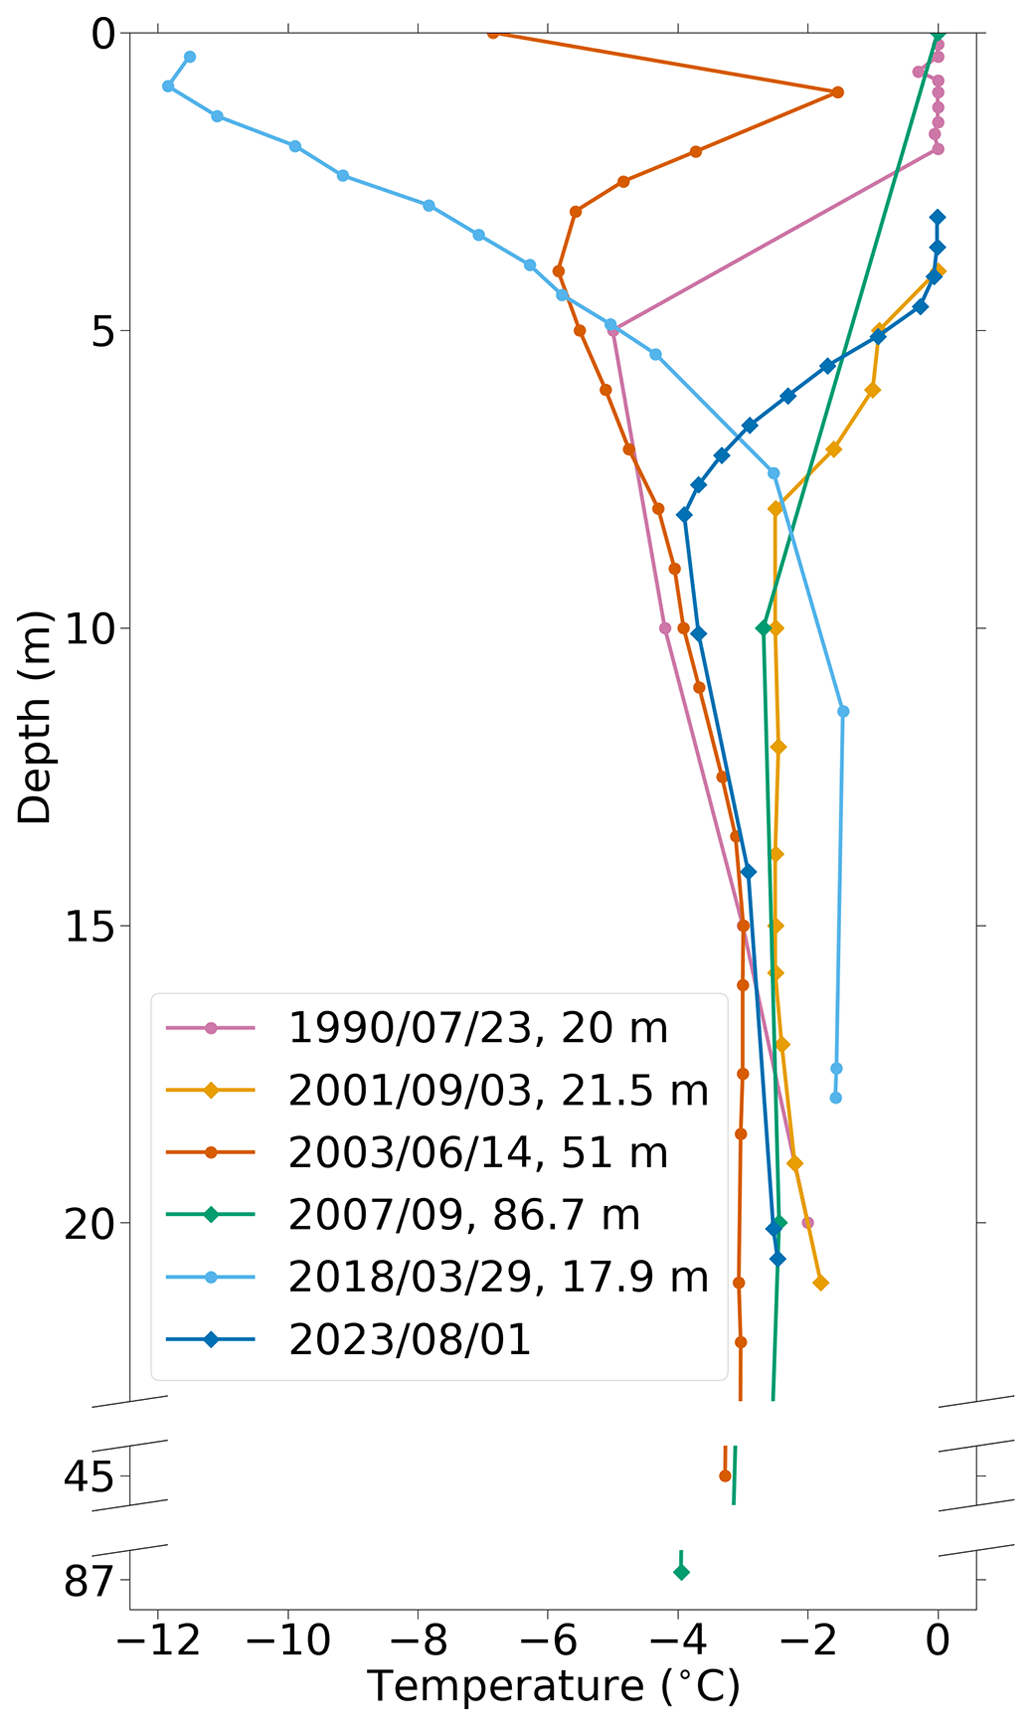
Figure 6Firn temperatures measured on or near the summit of Grigoriev ice cap, 1990 to 2018. Date and depth of the borehole are indicated for each measurement. The 2018 borehole is represented with one measurement for 2018 and one for 2023. Note that the depth axis is broken twice to show bottom temperatures of all temperature records.
We describe firn structure as content of infiltration ice per depth interval. Fig. 7 is designed after Kutuzov (2005) and compares the 2018 content of infiltration ice to the legacy summit cores. The overall percentage of infiltration ice is similar for all cores. Only Core-1 1990 features a substantially higher percentage. The reasons for this are unclear as both 1990 cores were drilled in close vicinity. The difference could be related to Core-1 1990 having been analyzed in situ and Core 2 having been transported in frozen condition to cold room facilities in the USA (Thompson et al., 1997). The 2018 core differs from the other cores mainly in the top ∼2 m where it has the highest ice content. This is also evident from mean densities of the near surface layers. The 2018 core has a mean density of 709 and 774 kg m−3 for the top 2 and 4 m, respectively. The mean densities for the same depth intervals are 424 and 499 kg m−3 in the 2003 core.
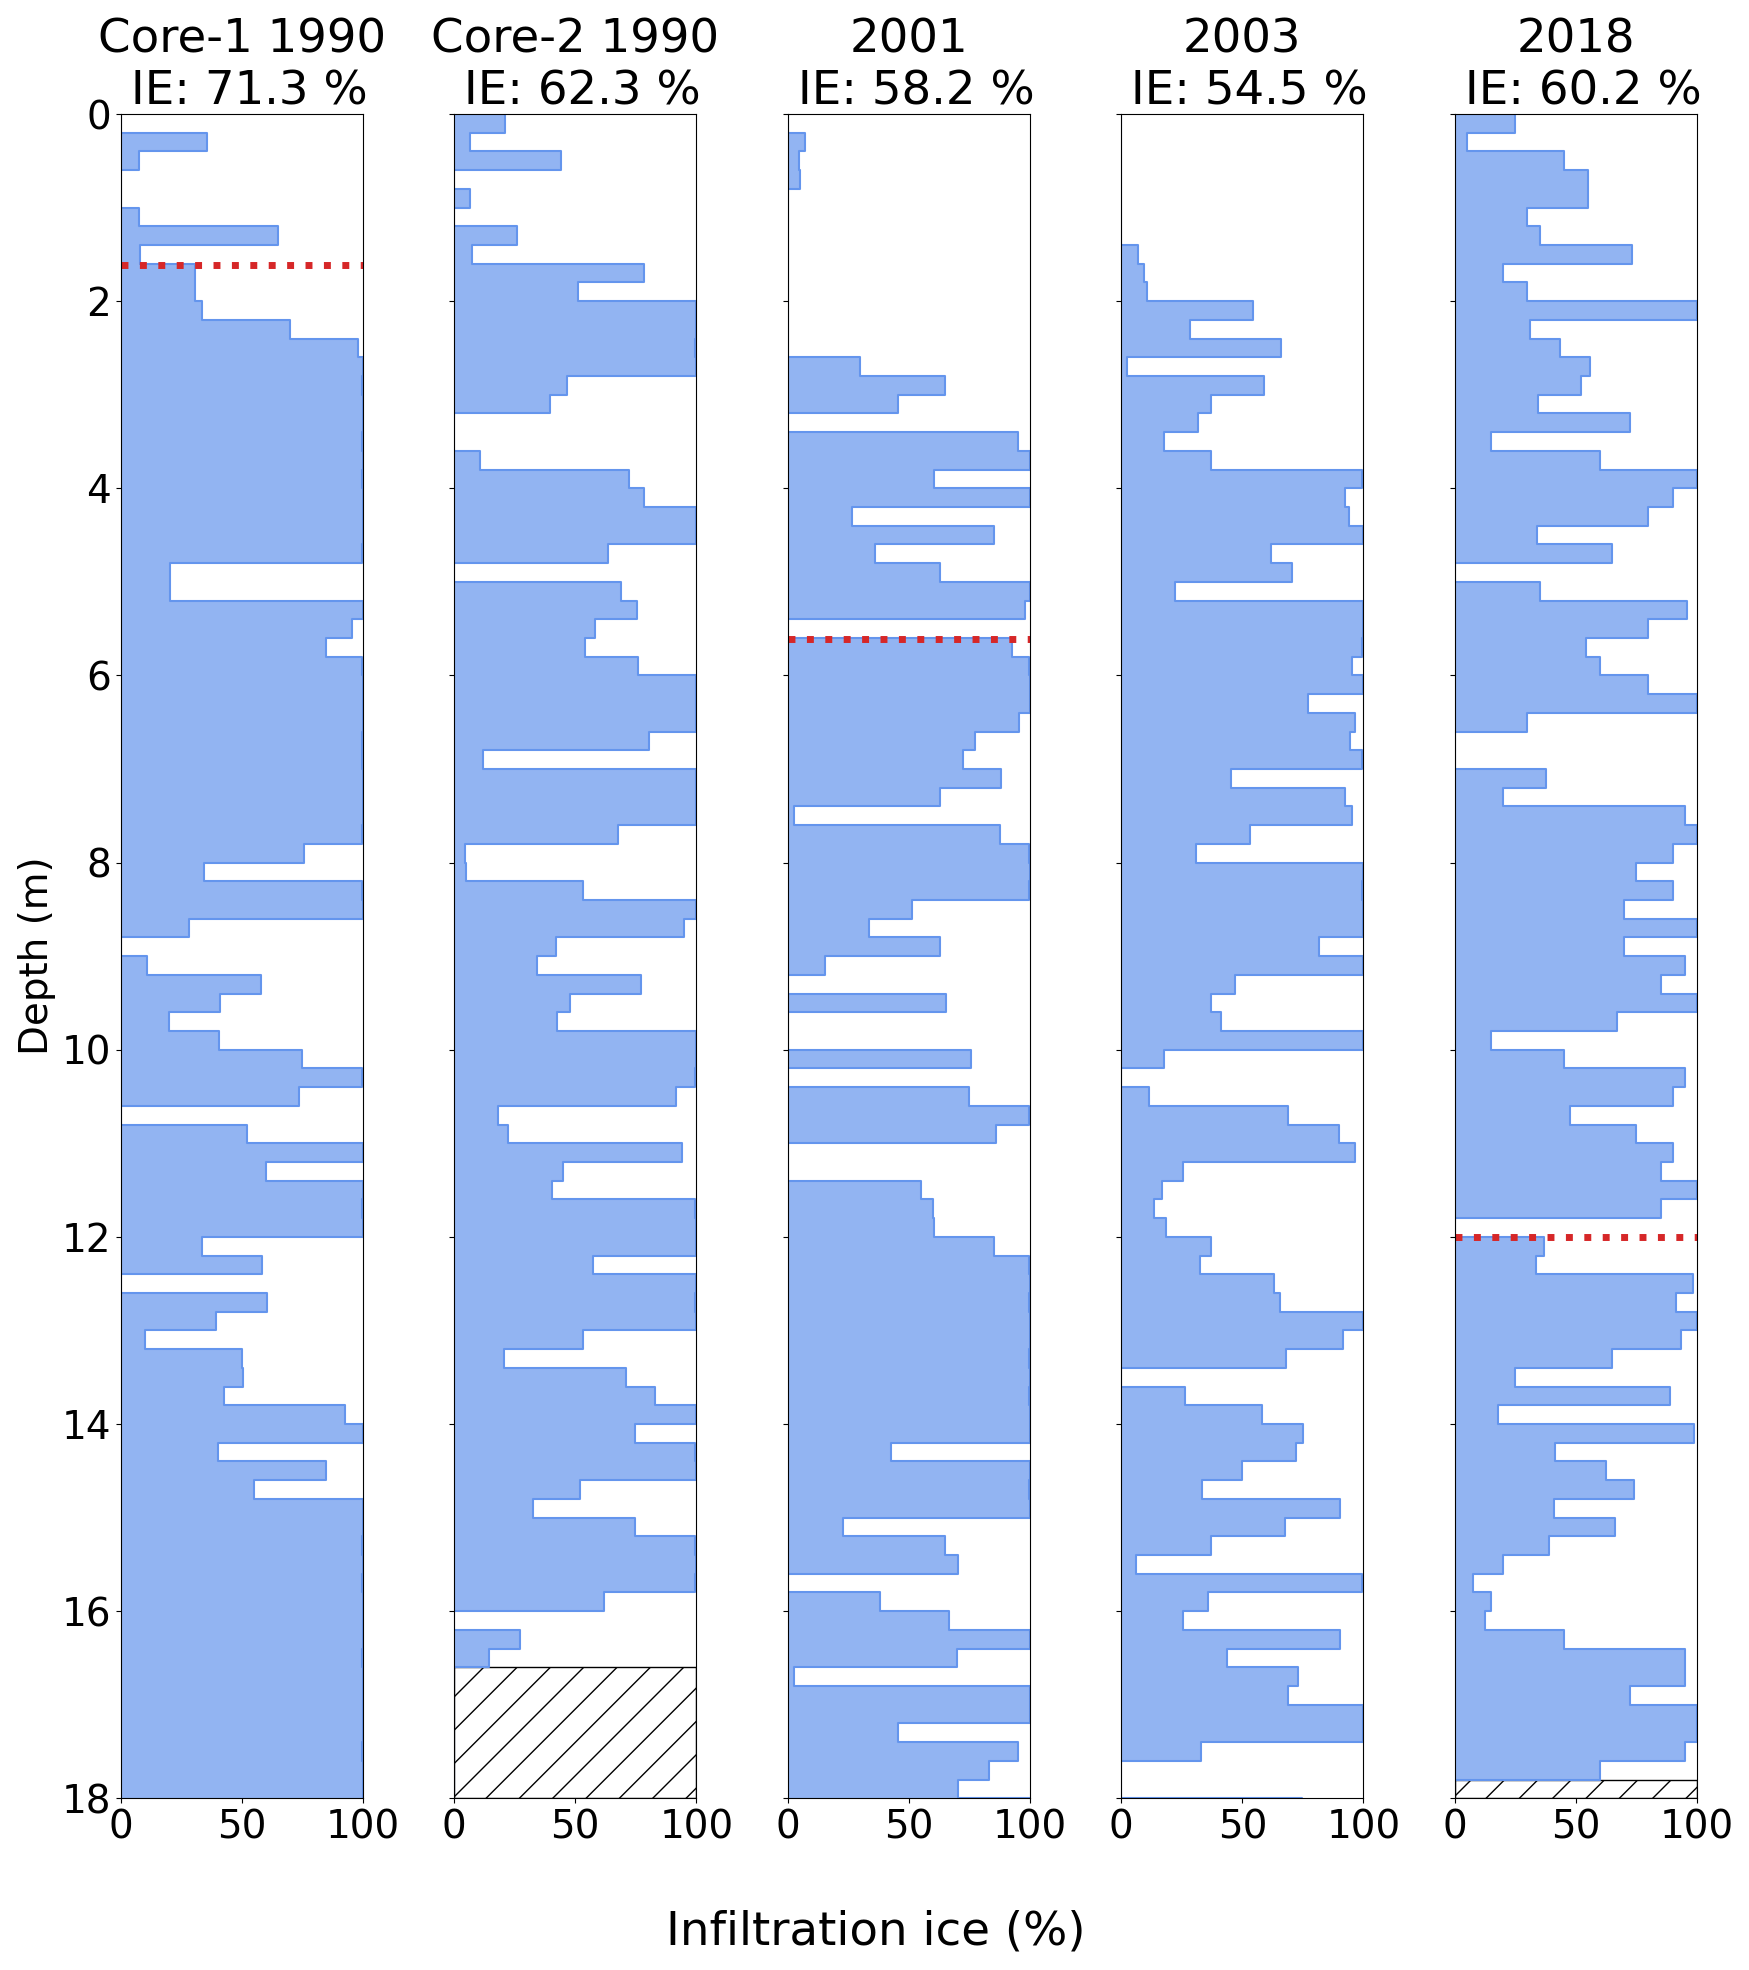
Figure 7Infiltration ice (IE) in cores drilled on the summit of Grigoriev ice cap, 1990–2018. Shown by the blue bars is the percentage of infiltration ice per 20 cm depth intervals. Percentages in the titles indicate average content of infiltration ice for the top 18 m of each core (or total core length for shorter cores). The dotted red horizontal line indicates the depth of the 1986 Chornobyl horizon, where measured (Thompson et al., 1997; Kutuzov, 2005, and this study).
5.1 Accumulation
In 2018 and in the years before, the summit of Grigoriev ice cap was an active accumulation area. The same was the case from 2018 to 2023, as measured automatically by the sonic ranger (not shown; the only device to work without interruption) and manually during station visits. Our interpretation of the 2018 core indicates highest annual net accumulation in the 1970s, followed by a decrease throughout the 1980s and 1990s and a stabilization thereafter (Fig. 5a). Measured rates of net accumulation and changes through time are similar to previous estimates. Thompson et al. (1997) measured 0.33 m w.e. yr−1 for the time period 1962 to 1990. Arkhipov et al. (2004) and Mikhalenko et al. (2005) estimate net accumulation at 0.26 m w.e. yr−1 (1991 to 2001) and 0.32 m w.e. yr−1 (1963 to 1990). Takeuchi et al. (2014) measured 0.273 m w.e. yr−1 (mean 1967–2007) at their drill site, ∼40 m lower than the summit. Arkhipov et al. (2004) and Mikhalenko et al. (2005) state that net accumulation before 1990 was higher (0.41–0.43 m yr−1) and then dropped to 0.35 m yr−1 for the time period 1990–2001.
While runoff was considered absent towards the end of the 1980s (Mikhalenko, 1989), melt proxies, namely ratio and SO concentration, indicate that melt has intensified and led to partial meltwater runoff starting sometime between the years 2000 and 2005. As annual net accumulation appears unchanged since the early 1980s, the loss in meltwater needs to be compensated. Increased refreezing could compensate for runoff. However, stratigraphy and firn temperatures are mostly unchanged, with the exception of the uppermost 2 to 4 m of the 2018 core that shows higher ice content and densities than earlier cores. We assume that compensating processes on the summit of Grigoriev result in mostly unchanged stratigraphy and net accumulation.
Firstly, we hypothesize that increasing snowfall counteracts intensified melt and associated runoff. Indeed, Engel et al. (2012) report a statistically significant change of mean annual precipitation by +60 mm (+20 %), comparing the two time periods 1930–1997 (Tien Shan weather station) and 1998–2009 (Kumtor weather station; see Sect. 2).
Secondly, we hypothesize that strong winter cooling is still relevant and contributes to a sustained refreezing potential and a largely unchanged firn stratigraphy. Mikhalenko (1989) noted that the shallow winter snow cover, together with cold winter Ta, leads to efficient wintertime cooling of the firn. This provides ample cold content to refreeze percolating meltwater. Indeed, our own measurements show cold winter firn temperatures down to at least 5 m depth. However, no legacy wintertime firn temperature measurements exist for Grigoriev, and we cannot assess to what degree winter firn temperatures have warmed.
Thirdly, we note that warmer air and snow temperatures reduce snow erosion by wind (Haeberli and Alean, 1985). Warmer Ta could have reduced snow erosion on the wind-exposed summit of Grigoriev. However, the effect is challenging to quantify, and we emphasize that, already in the past, accumulation took place mainly during the summer months (Mikhalenko, 1989).
Testing the first two hypotheses requires reliable data on the amount of snowfall in concert with a coupled surface energy balance and firn model. Existing modelling studies (Nagornov et al., 2006; Fujita et al., 2011; Van Tricht and Huybrechts, 2022) have not focused closely on Grigoriev firn properties and processes. A suitable approach was demonstrated by Kronenberg et al. (2022b), who modelled firn evolution of the Abramov glacier, located in the Kyrgyz Pamir-Alay, approx. 600 km west-southwest of Grigoriev. The motivation for their study was similar: a 2018 firn core and legacy data suggested a recent increase in net accumulation, seemingly contradicting increased melt and mass loss (Kronenberg et al., 2021).
The modelling study for Abramov glacier showed that increased melt was indeed masked by larger amounts of snowfall. Variations in refreezing played a relatively small role in the temperate accumulation area of Abramov. The study also showed the limits of this mechanism and stated that net accumulation has finally begun to drop as snowfall cannot keep up anymore with ever increasing melt. This point might be close in time on Grigoriev as well, but our data indicate that it has not yet been reached.
5.2 Firn temperatures
Kutuzov (2005) and Mikhalenko et al. (2005) compared Grigoriev firn temperature changes 1962 to 2003 at 4420 m a.s.l. They show that the firn has warmed 1.5 and 0.9 °C at depths of 15 and 20 m, respectively. Arkhipov et al. (2004) analyzed firn temperature changes on the summit until the year 2001. They conclude that the firn on the summit has warmed during the 11 years separating the 1990 and 2001 cores. Temperatures measured in March 2018 are the warmest of all measurements. Temperatures in 2023, however, fall well within earlier measurements. Unchanged firn temperatures stand in contrast to long-term observations from Alpine sites that show, albeit starting from colder firn temperatures, a clear warming over comparable time frames (Vincent et al., 2007; Hoelzle et al., 2011). We do not doubt the data from our thermistor chain. For example, during the 2023 melt period, measured firn temperatures in the top 5 m deviate by <0.05 °C from 0 °C, which is the temperature one expects for firn that is in contact with water. Why have firn temperatures reached a peak in 2018 and then cooled to earlier values? We assume that firn temperatures on Grigoriev are on their way towards a fully temperate state at 0 °C but get temporarily sidetracked by a variety of mechanisms. The available data do not allow for identifying the exact processes behind the observed fluctuations. Consequently, two potential reasons are discussed in the following:
-
The near-surface firn was at its densest and iciest in 2018. As a result, the permeability of the firn is reduced and meltwater might discharge laterally rather than vertically. We have no direct evidence of surface runoff on the summit of Grigoriev, but studies from other firn areas show that lateral runoff starts in the subsurface and becomes visible only after substantial distances (e.g. several kilometres on the gently sloping surface of the Greenland ice sheet: Holmes, 1955; Clerx et al., 2022). Lateral runoff would mean that less latent heat gets released at depth, inside the firn. If the icy firn gets efficiently cooled in winter, this effect can lead to an overall cooling of the firn. Humphrey et al. (2012), for example, show that in the percolation zone of the Greenland ice sheet, firn temperatures can decrease strongly with decreasing elevation. The reason is that vertical percolation, and thus transport of latent heat to depth, is more efficient at higher elevations where the firn is less icy and more porous. Also Arkhipov et al. (2004) argue, for the example of Grigoriev ice cap, that one needs to be cautious when comparing temperatures measured for firn of different ice contents.
-
A number of firn temperature measurements (1990, 2001, 2023; Fig. 6) show a profile where below ∼15 m depth the firn gets warmer with depth. Such a temperature profile is unexpected as Takeuchi et al. (2014) measured a decrease of firn temperatures all the way to the bed where the ice is at −3.95 °C (Fig. 6). The temperature profiles of 1990, 2001 and 2023 could be explained by temporary and relatively deep firn warming, followed by a few years of cooling from the surface. A possible mechanism could be very deep percolation and refreezing of meltwater during exceptionally warm summers. Crevasses could serve as potential pathways for very deep percolation. Given the gentle and uniform warming over larger depth intervals, this would need to happen at a certain distance from the drill sites. Any direct influx of water into or close to a borehole would result in strong and sudden changes to the firn temperature profile (e.g. Machguth et al., 2016). However, this explanation is largely speculative as there are no data to show whether such events actually took place.
5.3 Suitability as environmental archive
5.3.1 δ18O
Based on the 1990 core, Thompson et al. (1997) proposed δ18O as Ta proxy at the study site and interpreted the δ18O increase from 1940–1990 (Fig. 4a) as Ta increase. The long-term δ18O record of the 2018 core does not show a trend, whereas Ta at the close-by Kumtor station increased. Engel et al. (2012) show a particularly pronounced change in Ta towards the end of the 1990s. While the data quality is problematic (Sect. 2), it is clear that Ta at the weather station and δ18O in the Grigoriev ice core do not align after ∼1990 (Fig 4a).
The 1990 and 2018 δ18O data differ on average by 0.3 ‰ (Fig. 4a), maybe due to slightly different locations of the two drilling sites. Differences between the two 1990 cores, drilled ∼50 m apart (Thompson et al., 1997), exceed this value for some decades. The slight decrease in the δ18O values between 1970 and 2018 (measured in the 2018 core) could be related to partial runoff of meltwater which forms mainly from enriched (δ18O less negative) summer snow, resulting in more depleted, that is more negative, δ18O values during the 2000s and 2010s. In conclusion, the strong increase of Ta during the last decades is not reflected in the Grigoriev δ18O record, implying that water stable isotope ratios cannot be used anymore as a proxy of air temperature at this site.
5.3.2 Major ions and black carbon
Contrary to δ18O, seasonality in concentrations of most of the major ions is still visible, since the concentrations are not smoothed during firn metamorphosis as δ18O is. In general, we observe lower concentrations in the topmost 7 m, i.e. from the year 2001 on. Concentration ratios between the periods 2001–2018 and 1974–2000 are 0.31 (SO), 0.36 (Ca2+), 0.38 (Mg2+), 0.46 (BC), 0.48 (Na+), 0.51 (K+), 0.58 (Cl−), 0.6 (NO), 0.68 (NH) and 0.88 (F−). Thus, in all cases, recent concentrations are lower. Potential reasons are (1) meltwater-induced relocation and runoff and (2) changes in the emission source strength.
-
Increased Ta (Engel et al., 2012) likely has caused stronger melting, preferential elution and possibly removal of ions by runoff. This hypothesis is supported by the observation that F−, NH and NO are less depleted. Those ions are known to be less prone to removal by meltwater due to their location in the ice matrix (Eichler et al., 2001; Moser et al., 2023).
-
Concentrations of dust-related and highly correlated ions Na+, K+, Mg2+, Ca2+, Cl− and SO agree well between the 1990 and 2018 cores for the overlapping period (Fig. 4b, c) and generally reveal a strong decrease after the 1960s. This coincides with declining trends of dust storms in Central Asia during that time, established from stations in Xinjiang and the Karakum Desert (Grigholm et al., 2017). Concentrations of pollutants of mainly anthropogenic origin peak between the 1970s and 1980s (NH and BC) or the 1990s (NO) (Fig. 4d–f). Concurrent maxima of these species have been obtained from other Central Asian firn or ice cores, such as Inilchek (Tien Shan, Grigholm et al., 2017) and Belukha (Siberian Altai, Olivier et al., 2003; Eichler et al., 2009) or from an Elbrus core (Caucasus, Preunkert et al., 2019). For SO, all other Central Asian cores reveal a maximum in the 1970s, reflecting the SO2 emission history from different former Soviet Union countries (Olivier et al., 2003; Grigholm et al., 2017). The strong SO decrease at Grigoriev from the 1960s on and the high correlation with dust proxies such as Ca2+ suggest that at this site natural dust sources for SO dominate compared to anthropogenic ones.
In conclusion, despite the influence of melt, the general concentration trends of major ions and BC are consistent with earlier observations and Central Asian ice core records, since emissions were highest during periods when melt influence was negligible.
We analysed black carbon, major ions and water stable isotope ratios in an 18 m firn core, drilled in 2018 on the summit of Grigoriev ice cap, at 4600 m a.s.l. in the inner Tien Shan mountains. Annual layer counting resulted in a core-bottom age of 1972±3 years. Subsequently, we analysed our data in the context of legacy cores drilled at the same location. There is good agreement in major ion concentrations and δ18O where the 2018 record overlaps temporally with legacy cores.
Firn temperatures measured in the borehole are similar to the early 2000s but also show substantial fluctuations over the past 5 years. During the last ∼15 years, the melt index ( ratio) increased, and major ion concentrations became depleted, which we interpret as evidence of accelerated melt and the onset of runoff. The general decrease of mineral-dust-related ions Na+, K+, Mg2+, Ca2+, Cl− and SO, in the period 1972–2018, is in line with declining trends of dust storms in Central Asia. The concentration maxima of anthropogenically derived species NH, NO and BC between the 1970s and 1990s are consistent with other studies carried out in Central Asia. Despite the influence of melt, major ion and BC concentrations still reflect atmospheric emission trends, since emissions were highest during periods when melt influence was negligible. The strong increase of air temperatures during the last decades is not reflected in the Grigoriev δ18O record, implying that water stable isotope ratios have ceased to be reliable proxies of air temperature variations at this site.
The 2018 firn is more icy and more dense in the top 2 to 4 m, compared to cores drilled in the 2000s. Firn stratigraphy at greater depth is largely unchanged. We hypothesize that near-surface infiltration ice might support lateral runoff. The latter might result in the removal of latent heat and thereby contribute to stabilizing firn temperatures. Lateral runoff would also mean that major ions get efficiently removed from the firn rather than deposited again at depth.
Given the onset of runoff, one might expect a decrease in net accumulation rates. However, net accumulation has remained largely unchanged since the 1990s. We hypothesize that mass loss by runoff is compensated by an increase in snowfall and/or reduced wind scouring, resulting in largely unchanged net accumulation. The precipitation record from the Tien Shan/Kumtor weather station supports this hypothesis. We suggest using combined glacier surface mass balance and firn models to explore (i) the possible influence of near-surface stratigraphy on lateral runoff and firn temperatures and (ii) a potential increase in precipitation on net accumulation.
All data used in this paper are accessible at https://doi.org/10.5281/zenodo.10082960 (Machguth et al., 2023). Previous versions of stratigraphy and firn temperatures of the 2018 core are available at https://doi.org/10.5281/zenodo.7113282 (Kronenberg et al., 2022a).
MK and HM organized and led the 2018 drilling campaign to Grigoriev ice cap. AE led the measurements of major ions, water stable isotopes and black carbon with support by SB and MK. The measurements of β activity were planned and carried out by MHe. HM, AE and MK performed data analyses. HM led the overall analysis and interpretation and wrote the manuscript with major contributions by AE and MS. The legacy data were collected by SK, VNM, MK, EM, RU and HM. EM and HM curated the data. EM led the autumn 2022 field campaign with support by MHo; SB obtained the logger data in autumn 2023. Most authors commented on the manuscript.
At least one of the (co-)authors is a member of the editorial board of The Cryosphere. The peer-review process was guided by an independent editor, and the authors also have no other competing interests to declare.
Publisher's note: Copernicus Publications remains neutral with regard to jurisdictional claims made in the text, published maps, institutional affiliations, or any other geographical representation in this paper. While Copernicus Publications makes every effort to include appropriate place names, the final responsibility lies with the authors.
This article is part of the special issue “Ice core science at the three poles (CP/TC inter-journal SI)”. It is not associated with a conference.
Research on Grigoriev ice cap was initiated in 1946 by Grigory A. Avsyuk from the Institute of Geography of the Academy of Sciences of the USSR. Over decades, researchers from the same institution and from the Kyrgyz Academy of Science continued the work and motivated others to join. We are grateful to be able to analyse our recent measurements in the context of their efforts, scientific findings and data.
We greatly acknowledge fieldwork assistance by Jonas Wicky, Philipp Schuppli, Ivan Lavrentiev, David Sciboz, Ruslan Kenzhebaev, Erlan Azisov, Tomas Saks and Martina Barandun as well as radionuclide measurements by Max Rüthi. We thank Lonnie Thompson and Ellen Mosley-Thompson for background information on the 1990 drill campaign and data. We thank Lander van Tricht for sharing photos of our firn station taken during his fieldwork in 2021.
This study is funded by the Swiss National Science Foundation (grant 200021_169453), the project CICADA (Cryospheric Climate Services for improved Adaptation; contract no. 81049674) and CROMO-ADAPT (Cryospheric Observation and Modelling for lmproved Adaptation in Central Asia; contract 81072443) between the Swiss Agency for Development and Cooperation and the University of Fribourg, as well as by the project GEF-UNDP-UNESCO (Strengthening the resilience of Central Asian countries by enabling regional cooperation to assess glacio-nival systems to develop integrated methods for sustainable development and adaptation to climate change; contract 4500484501) between UNESCO Almaty cluster office and the University of Fribourg. Horst Machguth acknowledges support by the European Research Council (ERC) under the European Union's Horizon 2020 research and innovation programme (project acronym CASSANDRA, grant agreement no. 818994).
This paper was edited by Paolo Gabrielli and reviewed by two anonymous referees.
Arkhipov, S. M., Mikhalenko, V. N., and Thompson, L. G.: Structural, stratigraphic and geochemical characteristics of the active layer of the Gregoriev Ice Cap, Tien Shan, Materialy Glyatsiologicheskikh Issledovaniy (Data of Glaciological Studies), 82, 24–32, 1997. a
Arkhipov, S. M., Mikhalenko, V. N., Kunakhovich, M. G., Dikikh, A. N., and Nagornov, O. V.: Termicheskiy reshim, uslovija l'doobrazovanija i akkumulatsija na lednike Grigor'eva (Tyan'-Shan), v 1962–2001 gg. (Thermal regime, types of ice formation and accumulation on the Grigoriev glacier (Tien Shan), 1962–2001), Materialy Glyatsiologicheskikh Issledovaniy (Data of Glaciological Studies), 96, 77–83, 2004. a, b, c, d, e, f, g, h
Avak, S. E., Trachsel, J. C., Edebeli, J., Brütsch, S., Bartels-Rausch, T., Schneebeli, M., Schwikowski, M., and Eichler, A.: Melt-Induced fractionation of major ions and trace elements in an Alpine snowpack, J. Geophys. Res.-Earth Surf., 124, 1647–1657, https://doi.org/10.1029/2019jf005026, 2019. a, b
Bohleber, P., Erhardt, T., Spaulding, N., Hoffmann, H., Fischer, H., and Mayewski, P.: Temperature and mineral dust variability recorded in two low-accumulation Alpine ice cores over the last millennium, Clim. Past, 14, 21–37, https://doi.org/10.5194/cp-14-21-2018, 2018. a
Clerx, N., Machguth, H., Tedstone, A., Jullien, N., Wever, N., Weingartner, R., and Roessler, O.: In situ measurements of meltwater flow through snow and firn in the accumulation zone of the SW Greenland Ice Sheet, The Cryosphere, 16, 4379–4401, https://doi.org/10.5194/tc-16-4379-2022, 2022. a
Dikikh, A. N.: O temperaturnom rezhime lednikov ploskikh wershin (na primere lednika Grigor'yeva) (On the temperature regime of plateau glaciers (on the example of the Grigorev glacier)), in: Gljaziologicheskiye Issledovaniya na Tyan'-Shane, vol. XI of Raboty Tyan'-Shanskoy fizicheskoy-geograficheskoy stantsii, 32–35, Akademya Nauk Kirgizskoy SSR, Izdatel'stvo Ilim, Frunze, 1965. a, b, c, d
Eichler, A., Schwikowski, M., Gäggeler, H. W., Furrer, V., Synal, H.-A., Beer, J., Saurer, M., and Funk, M.: Glaciochemical dating of an ice core from upper Grenzgletscher (4200 m a.s.l.), J. Glaciol., 46, 507–515, https://doi.org/10.3189/172756500781833098, 2000. a, b, c
Eichler, A., Schwikowski, M., and Gäggeler, H. W.: Meltwater-induced relocation of chemical species in Alpine firn, Tellus B, 53, 192, https://doi.org/10.3402/tellusb.v53i2.16575, 2001. a, b
Eichler, A., Olivier, S., Henderson, K., Laube, A., Beer, J., Papina, T., Gäggeler, H. W., and Schwikowski, M.: Temperature response in the Altai region lags solar forcing, Geophys. Res. Lett., 36, L01808, https://doi.org/10.1029/2008GL035930, 2009. a
Eichler, A., Kronenberg, M., Brütsch, S., Rüthi, M., Heule, M., Schwikowski, M., Machguth, H., and Hoelzle, M.: Chernobyl horizon in a Central Asian ice core, Annual Report 2019 – Laboratory of Environmental Chemistry – PSI, p. 31, 2020. a, b, c
Eichler, A., Legrand, M., Jenk, T. M., Preunkert, S., Andersson, C., Eckhardt, S., Engardt, M., Plach, A., and Schwikowski, M.: Consistent histories of anthropogenic western European air pollution preserved in different Alpine ice cores, The Cryosphere, 17, 2119–2137, https://doi.org/10.5194/tc-17-2119-2023, 2023. a
Engel, Z., Šobr, M., and Yerokhin, S. A.: Changes of Petrov glacier and its proglacial lake in the Akshiirak massif, central Tien Shan, since 1977, J. Glaciol., 58, 388–398, https://doi.org/10.3189/2012jog11j085, 2012. a, b, c, d, e, f, g
Fujita, K., Takeuchi, N., Nikitin, S. A., Surazakov, A. B., Okamoto, S., Aizen, V. B., and Kubota, J.: Favorable climatic regime for maintaining the present-day geometry of the Gregoriev Glacier, Inner Tien Shan, The Cryosphere, 5, 539–549, https://doi.org/10.5194/tc-5-539-2011, 2011. a, b, c
Grigholm, B., Mayewski, P. A., Aizen, V., Kreutz, K., Aizen, E., Kang, S., Maasch, K. A., and Sneed, S. B.: A twentieth century major soluble ion record of dust and anthropogenic pollutants from Inilchek Glacier, Tien Shan, J. Geophys. Res.-Atmos., 122, 1884–1900, https://doi.org/10.1002/2016jd025407, 2017. a, b, c, d
Haeberli, W. and Alean, J.: Temperature and accumulation of high altitude firn in the Alps, Ann. Glaciol., 6, 161–163, 1985. a
Hoelzle, M., Darms, G., Lüthi, M. P., and Suter, S.: Evidence of accelerated englacial warming in the Monte Rosa area, Switzerland/Italy, The Cryosphere, 5, 231–243, https://doi.org/10.5194/tc-5-231-2011, 2011. a
Holmes, C. W.: Morphology and hydrology of the Mint Julep area, Southwest Greenland, in: Project Mint Julep Investigation of Smooth Ice Areas of the Greenland Ice Cap, 1953; Part II Special Scientific Reports, Arctic, Desert, Tropic Information Center; Research Studies Institute; Air University, 1955. a
Hou, S., Li, Y., Xiao, C., and Ren, J.: Recent accumulation rate at Dome A, Antarctica, Chinese Sci. Bull., 52, 428–431, https://doi.org/10.1007/s11434-007-0041-3, 2007. a
Humphrey, N. F., Harper, J. T., and Pfeffer, W. T.: Thermal tracking of meltwater retention in Greenland's accumulation area, J. Geophys. Res., 117, F01010, https://doi.org/10.1029/2011JF002083, 2012. a
Kronenberg, M., Machguth, H., Eichler, A., Schwikowski, M., and Hoelzle, M.: Comparison of historical and recent accumulation rates on Abramov Glacier, Pamir Alay, J. Glaciol., 67, 253–268, https://doi.org/10.1017/jog.2020.103, 2021. a
Kronenberg, M., Lavrentiev, I., Machguth, H., Schuppli, P., and Wicky, J.: Gregoriev firn data, Zenodo [data set], https://doi.org/10.5281/zenodo.7113282, 2022a. a
Kronenberg, M., van Pelt, W., Machguth, H., Fiddes, J., Hoelzle, M., and Pertziger, F.: Long-term firn and mass balance modelling for Abramov Glacier in the data-scarce Pamir Alay, The Cryosphere, 16, 5001–5022, https://doi.org/10.5194/tc-16-5001-2022, 2022b. a
Kutuzov, S. and Shahgedanova, M.: Glacier retreat and climatic variability in the eastern Terskey–Alatoo, inner Tien Shan between the middle of the 19th century and beginning of the 21st century, Global Planet. Change, 69, 59–70, https://doi.org/10.1016/j.gloplacha.2009.07.001, 2009. a
Kutuzov, S. S.: Prostranstvennie izmenenija i stroenie lednikov vnutrennogo Tyan'-Shanya za poslednie 150 let (Spatial changes and structure of the glaciers of the inner Tien Shan over the last 150 years), Master's thesis, Lomonossov State University, Moskva, 2005. a, b, c, d, e, f, g
Lavrentiev, I., Machguth, H., and Kronenberg, M.: New data on ice thickness and internal structure of glaciers in Tien-Shan and Pamir-Alay (Kyrgyzstan), in: Practical Geography and XXI century challenges, p. 80, 2018. a
Machguth, H., MacFerrin, M., van As, D., Box, J. E., Charalampidis, C., Colgan, W., Fausto, R. S., Meijer, H. A. J., Mosley-Thompson, E., and van de Wal, R. S. W.: Greenland meltwater storage in firn limited by near-surface ice formation, Nat. Clim. Change, 6, 390–393, https://doi.org/10.1038/nclimate2899, 2016. a
Machguth, H., Eichler, A., Schwikowski, M., Brütsch, S., Mattea, E., Kutuzov, S., Heule, M., Usubaliev, R., Belekov, S., Mikhalenko, V. N., Hoelzle, M., and Kronenberg, M.: Firn core data from Grigoriev Ice Cap, 1962 to present, Zenodo [data set], https://doi.org/10.5281/zenodo.10082960, 2023. a
Mikhalenko, V. N.: Osobennosti massoobmena lednikov ploskikh vershin vnutrennogo Tyan'-Shanja (Properties of mass exchange of plateau glaciers in the inner Tien Shan)), Materialy Glyatsiologicheskikh Issledovaniy (Data of Glaciological Studies), 65, 86–92, 1989. a, b, c, d, e, f, g, h, i
Mikhalenko, V. N.: Changes in Eurasian glaciation during the past century: glacier mass balance and ice-core evidence, An. Glaciol., 24, 283–287, https://doi.org/10.3189/S0260305500012313, 1997. a, b, c
Mikhalenko, V. N., Kutuzov, S. S., Fayzrakhmanov, F. F., Nagornov, . B., Thompson, L. G., Kunakhovich, M. G., Arkhipov, S. M., Dikikh, A. N., and Usubaliev, R.: Sokrashhenie oledenenija Tyan'-Shanja v XIX – nachale XXI vv.: rezul'taty kernovoro burenija i izmerenija temperatury v skvazhinakh (Glacier recession in the Tien Shan from the XIX to the beginning of the XXI century: results from ice core drilling and borehole temperature measurements), Materialy Glyatsiologicheskikh Issledovaniy (Data of Glaciological Studies), 98, 175–182, 2005. a, b, c, d, e, f, g, h, i
Moser, D. E., Thomas, E. R., Nehrbass-Ahles, C., Eichler, A., and Wolff, E.: Review article: Melt-Affected Ice Cores for (Sub-)Polar Research in a Warming World, EGUsphere [preprint], https://doi.org/10.5194/egusphere-2023-1939, 2023. a
Nagornov, O., Konovalov, Y., and Mikhalenko, V.: Prediction of thermodynamic state of the Gregoriev ice cap, Tien Shan, central Asia, in the future, Ann. Glaciol., 43, 307–312, https://doi.org/10.3189/172756406781812221, 2006. a, b
Olivier, S., Schwikowski, M., Brütsch, S., Eyrikh, S., Gäggeler, H. W., Lüthi, M., Papina, T., Saurer, M., Schotterer, U., Tobler, L., and Vogel, E.: Glaciochemical investigation of an ice core from Belukha glacier, Siberian Altai, Geophys. Res. Lett., 30, 2019, https://doi.org/10.1029/2003gl018290, 2003. a, b
Picciotto, E. and Wilgain, S.: Fission products in Antarctic snow, a reference level for measuring accumulation, J. Geophys. Res., 68, 5965–5972, https://doi.org/10.1029/jz068i021p05965, 1963. a
Preunkert, S., Legrand, M., Kutuzov, S., Ginot, P., Mikhalenko, V., and Friedrich, R.: The Elbrus (Caucasus, Russia) ice core record – Part 1: reconstruction of past anthropogenic sulfur emissions in south-eastern Europe, Atmos. Chem. Phys., 19, 14119–14132, https://doi.org/10.5194/acp-19-14119-2019, 2019. a
Safonov, V. I.: Reshim i vodno-ledoviy balans lednika Grigorieva na Tyan'–Shane (Regime and water-ice balance of the Grigriev Glacer in the Tien Shan), Materialy Glyatsiologicheskikh Issledovaniy (Data of Glaciological Studies), 47, 204–208, 1983. a
Shun, A., Takeuchi, N., Sera, S., Fujita, K., Okamoto, S., Naoki, K., and Aizen, V. B.: Dissolved chemical ions in an ice core of Grigoriev ice cap, Kyrgyz Tien Shan, in: AGU Fall Meeting Abstracts, https://ui.adsabs.harvard.edu/abs/2012AGUFMPP41A1979S/abstract (last access: 30 November 2023), 2012. a
Takeuchi, N., Fujita, K., Aizen, V. B., Narama, C., Yokoyama, Y., Okamoto, S., Naoki, K., and Kubota, J.: The disappearance of glaciers in the Tien Shan mountains in Central Asia at the end of Pleistocene, Quaternary Sci. Rev., 103, 26–33, 2014. a, b, c, d, e
Takeuchi, N., Sera, S., Fujita, K., Aizen, V. B., and Kubota, J.: Annual layer counting using pollen grains of the Grigoriev ice core from the Tien Shan Mountains, central Asia, Arct. Antarct. Alp. Res., 51, 299–312, https://doi.org/10.1080/15230430.2019.1638202, 2019. a, b, c
Thompson, L., Mosley-Thompson, E., Davis, M., Lin, P., Yao, T., Dyurgerov, M., and Dal, J.: “Recent warming” ice core evidence from tropical ice cores with emphasis on Central Asia, Global Planet. Change, 7, 145–156, https://doi.org/10.1016/0921-8181(93)90046-Q, 1993. a, b
Thompson, L., Mikhalenko, V., Mosley-Thompson, E., Durgerov, M., Lin, P., Moskalevsky, M., Davis, M., Arkhipov, S., and Dail, J.: Ice core records of recent climatic variability: Grigoriev and It-Tish ice caps in Central Tien Shan, Central Asia, Materialy Glyatsiologicheskikh Issledovaniy (Data of Glaciological Studies), 81, 100–109, 1997. a, b, c, d, e, f, g, h, i, j
Usubaliev, R. A.: Khimitcheskoe zagryaznenie lednikov Tyan'-Shanya (na primere lednika Grigor'eva) (Chemical pollution of Tien Shan glaciers (on the example of Grigoriev Glacier)), Izvestija Natsional'noy Akademii Nauk Kirgizskoy Respubliki (News of the National Academy of Sciences of the Kyrgyz Republic), 4, 154–160, 2003. a, b, c, d
Van Tricht, L. and Huybrechts, P.: Thermal regime of the Grigoriev ice cap and the Sary-Tor glacier in the inner Tien Shan, Kyrgyzstan, The Cryosphere, 16, 4513–4535, https://doi.org/10.5194/tc-16-4513-2022, 2022. a, b, c
Vincent, C., Le Meur, E., Six, D., Possenti, P., Lefebvre, E., and Funk, M.: Climate warming revealed by englacial temperatures at Col du Dôme (4250 m, Mont Blanc area), Geophys. Res. Lett., 34, L16502, https://doi.org/10.1029/2007GL029933, 2007. a
Wendl, I. A., Menking, J. A., Färber, R., Gysel, M., Kaspari, S. D., Laborde, M. J. G., and Schwikowski, M.: Optimized method for black carbon analysis in ice and snow using the Single Particle Soot Photometer, Atmos. Meas. Tech., 7, 2667–2681, https://doi.org/10.5194/amt-7-2667-2014, 2014. a
Zagorodnov, V., Nagornov, O., and Thompson, L.: Influence of air temperature on a glacier's active-layer temperature, Ann. Glaciol., 43, 285–291, https://doi.org/10.3189/172756406781812203, 2006. a