the Creative Commons Attribution 4.0 License.
the Creative Commons Attribution 4.0 License.
 | 28 Mar 2024
Review article: Terrestrial dissolved organic carbon in northern permafrost
Liam Heffernan
Dolly N. Kothawala
Lars J. Tranvik
As the permafrost region warms and permafrost soils thaw, vast stores of soil organic carbon (C) become vulnerable to enhanced microbial decomposition and lateral transport into aquatic ecosystems as dissolved organic carbon (DOC). The mobilization of permafrost soil C can drastically alter the net northern permafrost C budget. DOC entering aquatic ecosystems becomes biologically available for degradation as well as other types of aquatic processing. However, it currently remains unclear which landscape characteristics are most relevant to consider in terms of predicting DOC concentrations entering aquatic systems from permafrost regions. Here, we conducted a systematic review of 111 studies relating to, or including, concentrations of DOC in terrestrial permafrost ecosystems in the northern circumpolar region published between 2000 and 2022. We present a new permafrost DOC dataset consisting of 2845 DOC concentrations, collected from the top 3 m in permafrost soils across the northern circumpolar region. Concentrations of DOC ranged from 0.1 to 500 mg L−1 (median = 41 mg L−1) across all permafrost zones, ecoregions, soil types, and thermal horizons. Across the permafrost zones, the highest median DOC concentrations were in the sporadic permafrost zone (101 mg L−1), while lower concentrations were found in the discontinuous (60 mg L−1) and continuous (59 mg L−1) permafrost zones. However, median DOC concentrations varied in these zones across ecosystem type, with the highest median DOC concentrations in each ecosystem type of 66 and 63 mg L−1 found in coastal tundra and permafrost bog ecosystems, respectively. Coastal tundra (130 mg L−1), permafrost bogs (78 mg L−1), and permafrost wetlands (57 mg L−1) had the highest median DOC concentrations in the permafrost lens, representing a potentially long-term store of DOC. Other than in Yedoma ecosystems, DOC concentrations were found to increase following permafrost thaw and were highly constrained by total dissolved nitrogen concentrations. This systematic review highlights how DOC concentrations differ between organic- or mineral-rich deposits across the circumpolar permafrost region and identifies coastal tundra regions as areas of potentially important DOC mobilization. The quantity of permafrost-derived DOC exported laterally to aquatic ecosystems is an important step for predicting its vulnerability to decomposition.
- Article
(3209 KB) - Full-text XML
-
Supplement
(999 KB) - BibTeX
- EndNote


Persistent freezing temperatures since the late Pleistocene and Holocene have led to the accumulation and preservation of 1460–1600 Pg of organic carbon (C) in northern circumpolar permafrost soils (Hugelius et al., 2014; Schuur et al., 2018). However, in recent decades, there has been an amplified level of warming at high latitudes, occurring at 4 times the speed of the global average (Rantanen et al., 2021). This is leading to widespread and rapid permafrost thawing, which is predicted to continue under various future climate scenarios (Olefeldt et al., 2016). Under the high C emissions' representative concentration pathway (RCP8.5), 90 % loss of near-surface permafrost is projected to occur by 2300, with the majority of the loss occurring by 2100 (McGuire et al., 2018). Increasing temperatures and widespread thaw expose permafrost C to heterotrophic decomposition, potentially leading to enhanced emissions of greenhouse gases into the atmosphere in the form of carbon dioxide (Schuur et al., 2021) and methane (CH4; Turetsky et al., 2020). Additionally, previously frozen soil organic carbon may be mobilized into the aquatic network as dissolved organic carbon (DOC), the quantity and quality of which will likely depend on the local and regional hydrology, and landscape characteristics (Tank et al., 2012; Vonk et al., 2015). At high latitudes (>50° N), lakes and rivers of various sizes cover 5.6 % and 0.47 %, respectively, of the total area (Olefeldt et al., 2021), and the landscape C balance at these high latitudes is highly dependent on aquatic C processing (Vonk and Gustafsson, 2013). The increased leaching of recently thawed DOC from permafrost soils will increase the currently estimated 25–36 Tg DOC yr−1 exported into the freshwater system and subsequently into the Arctic Ocean (Holmes et al., 2012; Raymond et al., 2007). It may also lead to enhanced greenhouse gas emissions from freshwater ecosystems (Dean et al., 2020). However, uncertainty remains as to which terrestrial ecosystems contain the highest concentrations of DOC, laterally transport the greatest quantities of DOC, and represent the store of DOC most vulnerable to mineralization.
Globally, DOC concentrations have been shown to vary across biomes as well as spatial and temporal scales (Guo et al., 2020; Langeveld et al., 2020). It has been suggested that, at such macro scales, hydrology, climate, vegetation type, and soil type are important drivers of DOC concentrations (Langeveld et al., 2020). Hydrology and climate are important factors shaping ecosystem structure and function in permafrost regions (Andresen et al., 2020; Wang et al., 2019), which in turn influences the spatial distribution of vegetation and soil types. Vegetation type has been shown to be the most important driver of DOC concentrations in Arctic lakes (Stolpmann et al., 2021). Carbon uptake by vegetation, via gross primary production, and SOC stocks in the permafrost region have both been shown to vary across vegetation and soil types (Hugelius et al., 2014). This variability across vegetation and soil types has important implications for DOC production, which is associated with plant inputs (Moore and Dalva, 2001) and the decomposition and solubilization of SOC due to soil microbial activity (Guggenberger and Zech, 1993). In permafrost soils, the majority of this production is likely to occur near the soil surface as the microbial production of DOC via input of plant-derived labile substrates has been shown to decrease with depth (Monteux et al., 2018; Hultman et al., 2015; Wild et al., 2016), and 65 %–70 % of the SOC store is found in the top 3 m (Hugelius et al., 2014). The spatial distribution discrepancies observed in DOC concentrations from global assessment efforts (Guo et al., 2020; Langeveld et al., 2020) may be reduced for the circumpolar permafrost region by improving understanding of DOC concentrations in the top 3 m across ecosystem types.
Previous studies have highlighted that the mineralization and lateral transport of DOC, i.e., mobilization, represent a source of terrestrial permafrost C that can potentially play an important role in both the terrestrial and aquatic biogeochemical cycles (Hugelius et al., 2020; Parmentier et al., 2017; Schuur et al., 2022). However, none has quantified DOC mobilization across the permafrost region. Inclusion of DOC mobilization in attempts to determine the permafrost climate feedback (Schaefer et al., 2014) may reduce current uncertainty in the magnitude and location of permafrost C losses (Miner et al., 2022), particularly as permafrost thaws. Warming of near-surface permafrost causes widespread thawing (Camill, 2005; Jorgenson et al., 2006), which can lead to drastic changes in hydrology, vegetation, and soil carbon dynamics (Liljedahl et al., 2016; Pries et al., 2012; Varner et al., 2022), thus impacting both DOC production and mobilization. Several studies have demonstrated that DOC has the potential to be rapidly degraded and mineralized following thermokarst formation (Burd et al., 2020; Payandi-Rolland et al., 2020; Wickland et al., 2018), particularly in higher-latitude ecosystems (Ernakovich et al., 2017; Vonk et al., 2013). However, few have compared this lability across ecosystems (Abbot et al., 2014; Textor et al., 2019), and less have done so across the permafrost region (Vonk et al., 2015). Determining the ecosystems with the greatest store of DOC that is readily mineralized upon thermokarst formation represents a potentially important step in reducing uncertainty in the permafrost climate feedback.
Here, we conduct a systematic review of the literature and compiled 111 studies published between 2000 and 2022 on DOC concentrations in the top 3 m of soil in terrestrial ecosystems found in the northern circumpolar permafrost region. Our aim was to build a database to assess the concentration and mobilization of DOC across terrestrial permafrost ecosystems. We used this database to address the following hypotheses: (i) the highest DOC concentrations would be found in organic-rich wetland ecosystems; (ii) disturbance would lead to increased export and biodegradability of DOC; and (iii) the most biodegradable DOC would be found in the Yedoma and Tundra ecosystems. A quantitative assessment of studies pertaining to DOC concentrations in permafrost soils can identify evidence-based recommendations for future topics, standardization of methods, and areas of research to improve our understanding of terrestrial and aquatic biogeochemical cycling in northern permafrost regions. Our database contains ancillary data describing the geographical and ecological conditions associated with each DOC concentration, allowing us to reveal patterns in DOC concentrations and lability measures for 562 sampling sites across multiple ecosystem types and under varying disturbance regimes. This study represents the first systematic review of DOC concentrations in terrestrial permafrost ecosystems found in the circumpolar north. As such, it provides unique and valuable insights into identifying ecosystems associated with the highest DOC concentrations and thus ecosystems with the greatest potential for DOC mobilization.
This systematic review used a methodological framework proposed by Arksey and O'Malley (2005) and followed five steps: (1) development of research questions and a search query; (2) identification of relevant studies; (3) study selection; (4) data extraction; and (5) data analysis, summary, and reporting. The literature search was guided by four research questions. (1) What are the concentrations of DOC found in terrestrial ecosystems across the northern circumpolar permafrost region? (2) What are the rates of export and/or degradation (mobilization) of DOC in these ecosystems? (3) What are the major controls on DOC concentrations and rates of mobilization? (4) How are concentrations and mobilization rates impacted by thermokarst formation? Mobilization rates represent DOC loss and include the specific discharge of DOC (g DOC m−2), the export rate of DOC per day (g C m−2 d−1) and per year (g C m−2 yr−1), and the biodegradable DOC (BDOC; %).
2.1 Literature search
Based on a priori tests, we used the following search query string to find papers using information found in their title, abstract, and keywords: (“dissolved organic carbon”) AND (permafrost OR thermokarst OR “thaw slump”) AND (soil OR peat) AND (export OR degrad* OR decomposition OR mineralization). We used Web of Science, Science Direct, Scopus, PubMed, and Google Scholar to generate a database of tier-1, peer-reviewed articles published between 2000 and 2022. The search function in Science Direct does not support the use of wildcards such as “*”, so “degrad*” was changed to “degradation”. We removed duplicate references found across multiple databases using the Mendeley©referencing software (v1.17.1, Mendeley Ltd. 2016).
2.2 Systematic screening of peer-reviewed publications
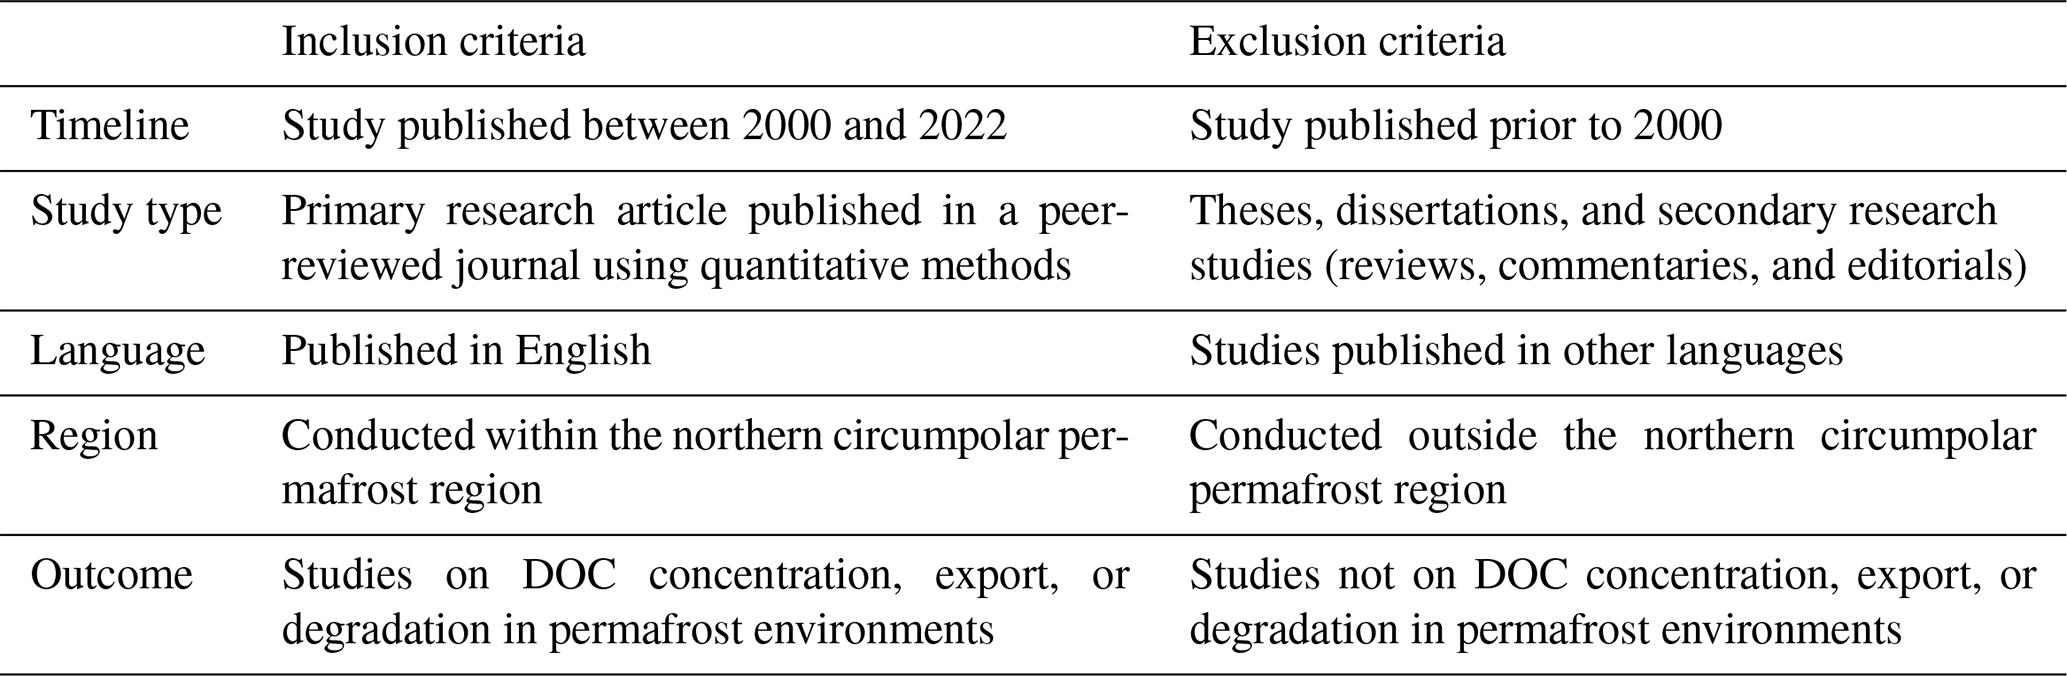
The selection of relevant studies was comprised of inclusion criteria and relevance screening in three steps. In the first step we placed limits on initial study searches in the electronic databases mentioned above. Studies were included in the review if they were primary research, published in English, and published between 2000 and 2022 (Table 1). Only quantitative studies conducted in terrestrial ecosystems in the northern circumpolar permafrost region, as defined by Brown et al. (1997), and reporting DOC concentration and mobilization rates were included. Studies not meeting these criteria were eliminated, and the remaining studies proceeded to the second screening step.
Table 1Summary of criteria used to identify suitable studies in the preliminary screening stage.
In the second step, the primary relevance of articles was screened, based on article titles, abstracts, keywords, and the eligibility criteria provided in Table 2. Studies deemed irrelevant were eliminated, and the remaining studies proceeded to the third and final screening step or secondary screening stage, which was based on more specific eligibility criteria (Table 2) applied to the full text.
Table 2Primary- and secondary-relevance screening tools. Primary screening tool used in the article title, abstract, and keyword screening stage. Secondary screening tool used in the full-text screening stage.
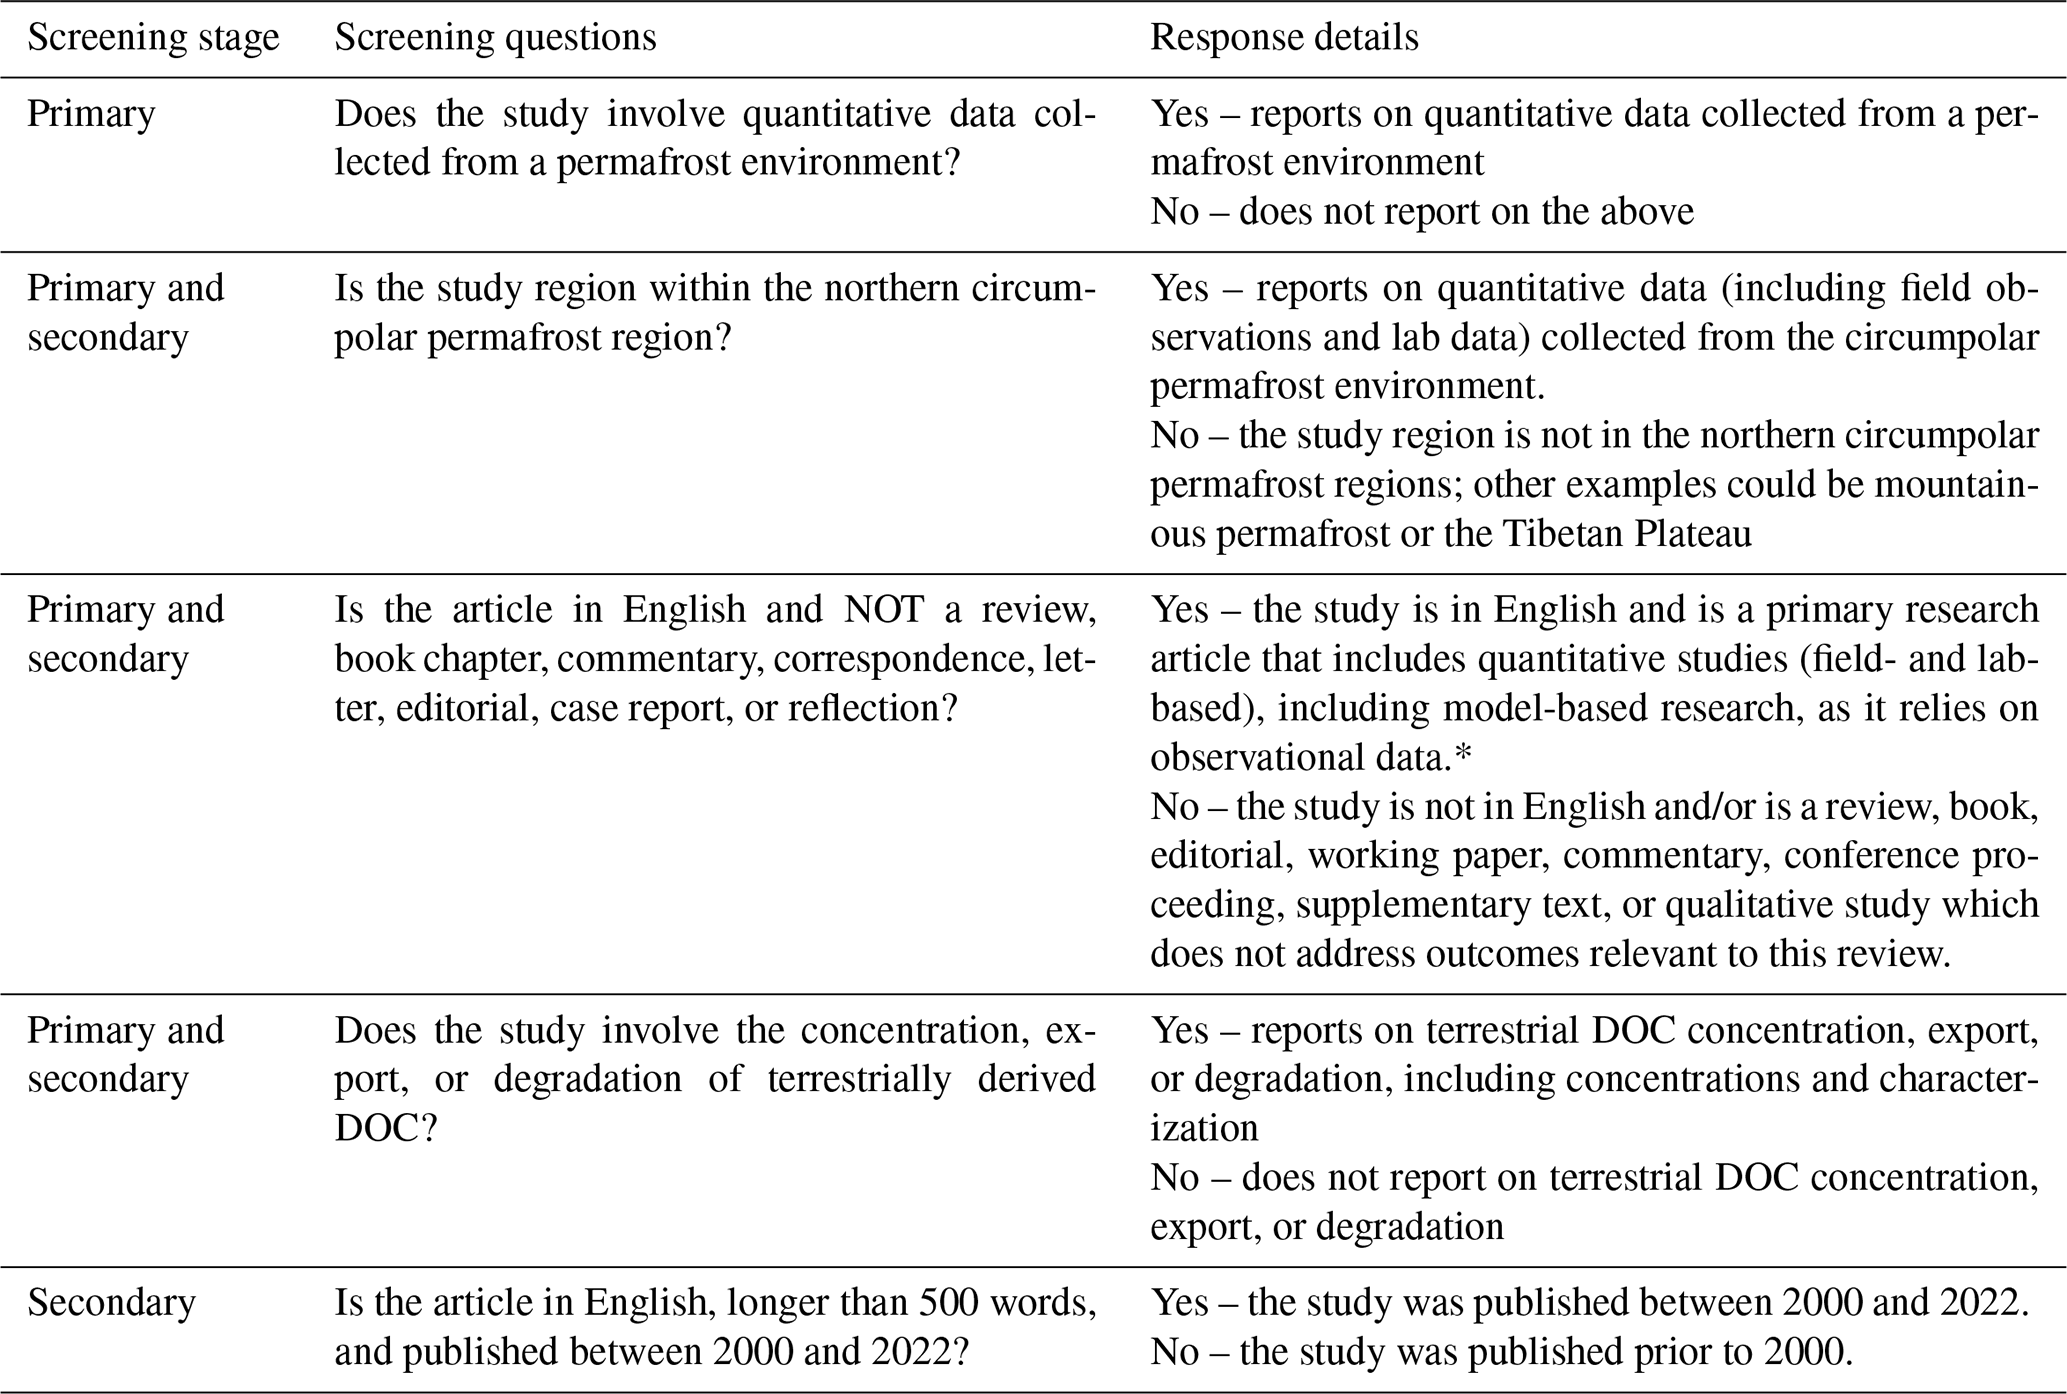
* For model-based studies, the original field or lab data used to parameterize or develop the model were used. If these data were taken from previously published work, those studies were used and the model-based study was removed.
2.3 Database compilation
A database with reported DOC concentrations and mobilization rates, i.e., rates of either DOC export or degradation, was compiled using data from all studies that were deemed relevant following the study selection phase. The database was compiled to compare DOC concentrations and mobilization rates between different sites. We define a site as an area where either soil, water, or ice samples were taken that have a similar vegetation composition, water table position, and permafrost regime and that were either disturbed or pristine. Site descriptions were derived from the text of each study. Where possible, individual daily measurements of DOC concentrations and mobilization rates were taken. When replicates of the same daily measurement were provided, we used the mean of those replicates, which was relevant for 10 studies in the database, representing 72 DOC concentrations. All the data were extracted from data tables, text, the Supplement, or data figures using WebPlotDigitizer (https://automeris.io/WebPlotDigitizer, last access: 15 November 2022).
All the studies reported measuring DOC concentrations collected from either open water, porewater, ice, or soil using a median filter pore size of 0.45 µm, with first and third quartile pore sizes of 0.45 and 0.7 µm. Measurements from all 12 months of the year were included in the database, with the majority occurring during the growing season (May–August), a small portion during the non-growing season, and the remaining sampling times either not reported or averaged over multiple sampling occasions. We included data from studies that were both field- and lab-based. However, any data where a treatment was applied were excluded, except for temperature treatments during incubation experiments when assessing the biodegradability of DOC. When lab-based studies included an incubation, only Day 0 DOC concentrations were used when comparing DOC concentrations across the studies. We chose to remove any DOC concentrations from samples taken below 3 m depth, which represented 3 % of all DOC measurements. These measurements were removed for better comparability with the current best estimation of soil organic carbon stocks in the northern circumpolar permafrost zone (Hugelius et al., 2014). We also removed any DOC concentrations greater than 500 mg L−1, which represented 2 % of all DOC concentrations. Samples that were above 500 mg L−1 and were sampled below 3 m represented 1 % of all DOC concentrations.
Site-averaged daily DOC concentrations (mg L−1) and mobilization rates were estimated from the average concentration and mobilization rates measured within a single day or sampling occasion. Repeated measurements at a site, over either the growing season or the multiyear measurements, were treated as an individual estimate of DOC concentrations and mobilization rates. Other continuous variables that were similarly estimated include soil moisture, water table position, organic layer depth, active-layer depth, bulk density of soil, soil carbon content (%), soil nitrogen content (%), soil carbon:nitrogen (C:N), pH, electrical conductivity (µS cm−1), specific UV absorbance at 254 nm (SUVA; L mg C−1 m−1), total dissolved nitrogen (mg L−1), nitrate (mg L−1), ammonium (mg L−1), chloride (mg L−1), calcium (mg L−1), and magnesium (mg L−1). The aromatic content of organic matter is positively correlated with SUVA (Weishaar et al., 2003), with high SUVA values being used as an indication of high aromatic content (Hansen et al., 2016). Ratios of soil C:N have been shown to be a good proxy for decomposition (Biester et al., 2014), where high C:N values indicate that higher decomposition has previously occurred. Mean annual temperatures and precipitation, sampling depth, filter size, the number of days over which sampling took place, and how many years following disturbance measurements were taken were also recorded. Several continuous variables other than those mentioned above were also recorded in the database but not used for analysis if they represented <20 % of the database. We chose 20 % as the cutoff point for use in comparison of the relationship between DOC concentrations and mobilization with other site-continuous variables.
Categorical variables included in the database (Table S1) were site location in the permafrost zone (continuous, discontinuous, sporadic; Brown et al., 1997) and ecoregion (arctic tundra, sub-arctic tundra, sub-arctic boreal, and continental boreal; Olson et al., 2001). We included site surface permafrost conditions (present or absent), the thermal horizon layer sampled (active layer, permafrost lens, permafrost free, water, and thaw stream), and, if present, the type of disturbance that occurred at the site (fire, active-layer thickening, thermokarst terrestrial, or thermokarst aquatic). An active layer represents the seasonally unfrozen soil layer above the permafrost layer. Permafrost lens represents the permanently frozen (below 0 °C) layer. Permafrost lens DOC concentrations are determined from soil and porewater in the permafrost layer and are extracted via frozen cores, whereas active-layer samples are taken from soil cores or porewater that are unfrozen at the time of sampling. Thaw Stream represents flowing surface waters following permafrost thaw. Permafrost Free represents areas that are not underlain by permafrost. We also included the soil class found at the site (Histel, Histosol, Orthel, and Turbel; USDA, 1999) and the origin of the DOC from organic or mineral soil. Histosols are organic-rich, non-permafrost soils. Histels, Orthels, and Turbels are permafrost-affected soils (Gelisol order). Histels are organic-rich soils, Orthels are non-cryoturbation-affected mineral soils, and Turbels are cryoturbated permafrost soils. Organic-rich Histel and Histosol soils have previously been shown to contain greater SOC stocks in the top 3 m of soil than the mineral-rich Orthel and Turbel soils (Hugelius et al., 2014). To assess the influence of the sampling approach and the method of analysis, we included the method of DOC extraction (centrifugation of the soil sample, leaching and dry leaching of the soil, dialysis, grab sample, ice core extraction, potassium sulfate extraction, lysimeter, piezometer, pump, rhizons) and the DOC measurement method (combustion, persulfate, photometric, or solid-phase extraction).
Sites were classified according to ecosystem type, and these included coastal tundra, forest, peatland, permafrost bog, permafrost wetland, retrogressive thaw slump, upland tundra, and Yedoma. Ecosystem classification is based on the general site description in the article, the provided ecosystem classification in the article, and site data including vegetation composition, permafrost condition, and ecoregion. Coastal tundra sites include typical polygonal tundra features found along the coastline in the permafrost region (Lantuit et al., 2012). Forests include any forested ecosystem, such as a black spruce forest (Kane et al., 2006) or larch forest (Kawahigashi et al., 2011), where the soil is not a wetland soil. Peatlands are sites classified as either fens (Olefeldt and Roulet, 2012) or bogs (Olsrud and Christensen, 2011) that are within the permafrost domain but that are not underlain by permafrost. Permafrost bogs are sites that are bogs and are either underlain by permafrost (O'Donnel et al., 2016) or are thermokarst bogs (Burd et al., 2020) that were previously underlain by permafrost prior to thawing. Permafrost wetland sites include saturated soils that are underlain by permafrost or were previously underlain by permafrost prior to permafrost thaw. They contain sampling locations typical of moist acidic tundra (Trusiak et al., 2018), tundra meadows (Tanski et al., 2017), and high-latitude fens (Nielsen et al., 2017). Retrogressive thaw slumps are areas where substantial ground ice degradation leads to thermokarst and the resulting feature contains a retreating headwall (Abbott et al., 2015). Upland tundra sites are high-latitude, non-wetland, mineral soils that include tundra heath (Stutter and Billett, 2003) and meadows (Hirst et al., 2022). Yedoma sites include pristine forest, upland tundra, and coastal tundra as well as retrogressive thaw slumps and other thermokarst features found within the Yedoma permafrost domain (Strauss et al., 2021). The ecosystem classification retrogressive thaw slump only includes those thermokarst features found outside the Yedoma permafrost domain. Each ecosystem type was further classified based on the type of permafrost thaw or thermokarst formation that occurred there. These thaw or thermokarst types included thermokarst bog, thermokarst wetland, active-layer thickening, retrogressive thaw slump, exposure, thermo-erosion gully, and active-layer detachment.
2.4 Database analysis
All statistical analyses were carried out in R (Version 3.4.4, R Core Team, 2015). We aimed to assess how DOC concentrations differed across study regions and ecosystems. To do this, we used Kruskal–Wallis analysis to test for differences in median DOC concentrations among the various study regions and areas that included permafrost zones, ecoregions, soil classes, thermal horizons, and ecosystems. Post hoc comparisons of median DOC concentrations among these categories were performed using a pairwise Wilcoxon test. Within and between each ecosystem type, we assessed the differences in DOC concentrations found in different thermal horizons (i.e., active layer and permafrost lens). To do this, data were first transformed using a Box–Cox transformation and the optimal λ using the MASS package (Ripley et al., 2019). We then performed an analysis of covariance (ANCOVA) to test for differences in DOC concentrations in different thermal horizons between ecosystem types while controlling for seasonal effects by including the month in which sampling occurred as the covariate.
Following the assessment of differences in DOC concentrations across these study regions and ecosystems, we aimed to assess the influence of the extraction and analysis method on the DOC concentrations. The aim of this was to determine whether the extraction and analysis method was having a greater effect on DOC concentrations than the study region or ecosystem. To do so, we first used ANOVAs and Bonferroni post hoc tests on linear mixed-effects models that include either the extraction method, filter size, or analysis method as a fixed effect and the ecosystem type as a random factor to evaluate significant differences in DOC concentrations between the DOC extraction and measurement methods. We then performed a Kruskal–Wallis analysis to test for differences in median DOC concentrations among the extraction method, filter size, and analysis method in each permafrost zone, ecoregion, soil class, thermal horizon, and ecosystem. Post hoc comparisons of median DOC concentrations among these categories were performed using a pairwise Wilcoxon test.
We used partial least-squares (PLS) regression when assessing the relationship of DOC concentrations with continuous and categorical variables. We performed this analysis to determine how the drivers of DOC concentrations across ecosystems may explain the variability in DOC concentrations. Predictor variables were categorized based on the variable importance in projections (VIP) method in the plsVarSel package (Mehmood et al., 2012), whereby variables with a score of >0.6–1 are deemed to be significant (Chong and Jun, 2005). We ran several PLS regressions including predictor variables with VIPs of >0.6, 0.7, 0.8, 0.9, and 1. The most parsimonious PLS model contained predictor variables with a VIP of >1 and was selected based on the proportion of variability in the predictors explained by the model, significant PLS components, Q2, and background correlation (Andersen and Bro, 2010). PLS was performed using the pls package (Mevik and Wehrens, 2007), and we chose to use PLS as it is tolerant of co-correlations of predictor variables, deviations from normality, and missing values, all of which were found within the database. In the PLS ecosystem, classes were subdivided into pristine or disturbed (i.e., impacted by permafrost thaw). Pristine sites were further subdivided by the thermal horizon in which the DOC concentrations were measured (active layer and permafrost lens). Sites were split into disturbed and pristine to assess whether disturbances have an impact on DOC concentrations. Pristine sites were divided by their thermal horizon to assess whether DOC concentrations were more positively related to the active layer exposed to both microbial decomposition and fresh annual carbon inputs from surface vegetation or to the permafrost lens.
To evaluate the change in ecosystem DOC concentrations following thermokarst formation, based on all studies from the systematic review, we calculated the response ratio using the SingleCaseES package (Pustejovsky et al., 2021). We define thermokarst as the process by which ice-rich permafrost deposits undergo complete thaw, resulting in surface subsidence and the formation of a new thermokarst feature that is ecologically different regarding water table position, redox conditions, and vegetation type from the preceding pristine ecosystem. Very few studies in our database report DOC concentrations for both pristine and thermokarst-affected ecosystems (<20 %). To include as many data as possible, we chose an effect size metric that is unlikely to be influenced by studies with a large sample number and variance. The response ratio is
where XP is the mean DOC concentration of pristine ecosystems and XT is the mean DOC concentration of thermokarst-affected ecosystems (Lajeunesse, 2011). This represents the log-proportional difference in mean DOC concentrations between thermokarst and pristine ecosystems, where a positive response ratio indicates a decrease in DOC concentrations following thermokarst.
The distribution of the data was inspected visually and with a Shapiro–Wilk test. We tested the homogeneity of variances using the car package and Levene's test (Fox and Weisberg, 2011). We report DOC concentrations as the median value with uncertainty as approximately the interquartile range, except for response ratios, which we report as ±95 % confidence intervals. Here we define the statistical significance level at 5 %.
3.1 Database generation
Our initial search using Web of Knowledge, Science Direct, Scopus, PubMed, and Google Scholar returned a total of 577 unique papers published between 2000 and 2022 that assess the concentrations and rates of mobilization of DOC in terrestrial ecosystems within the northern circumpolar permafrost region. Of these initial 577 studies, 111 remained after the systematic screening process (Tables 1 and 2). From these 111 studies, we generated our database. The final database of 111 studies contained a total of 3340 DOC concentrations (mg L−1), with 2845 DOC concentrations between 0 and 500 mg L−1 found within the top 3 m of permafrost soils from field and lab-based studies (using only Day 0 lab-based DOC concentrations). These concentrations were taken from 562 different sampling locations representing eight different ecosystem types (Fig. 1; Table S2) across the northern circumpolar permafrost region. All the studies except for one (Olefeldt et al., 2012) reported DOC concentrations.
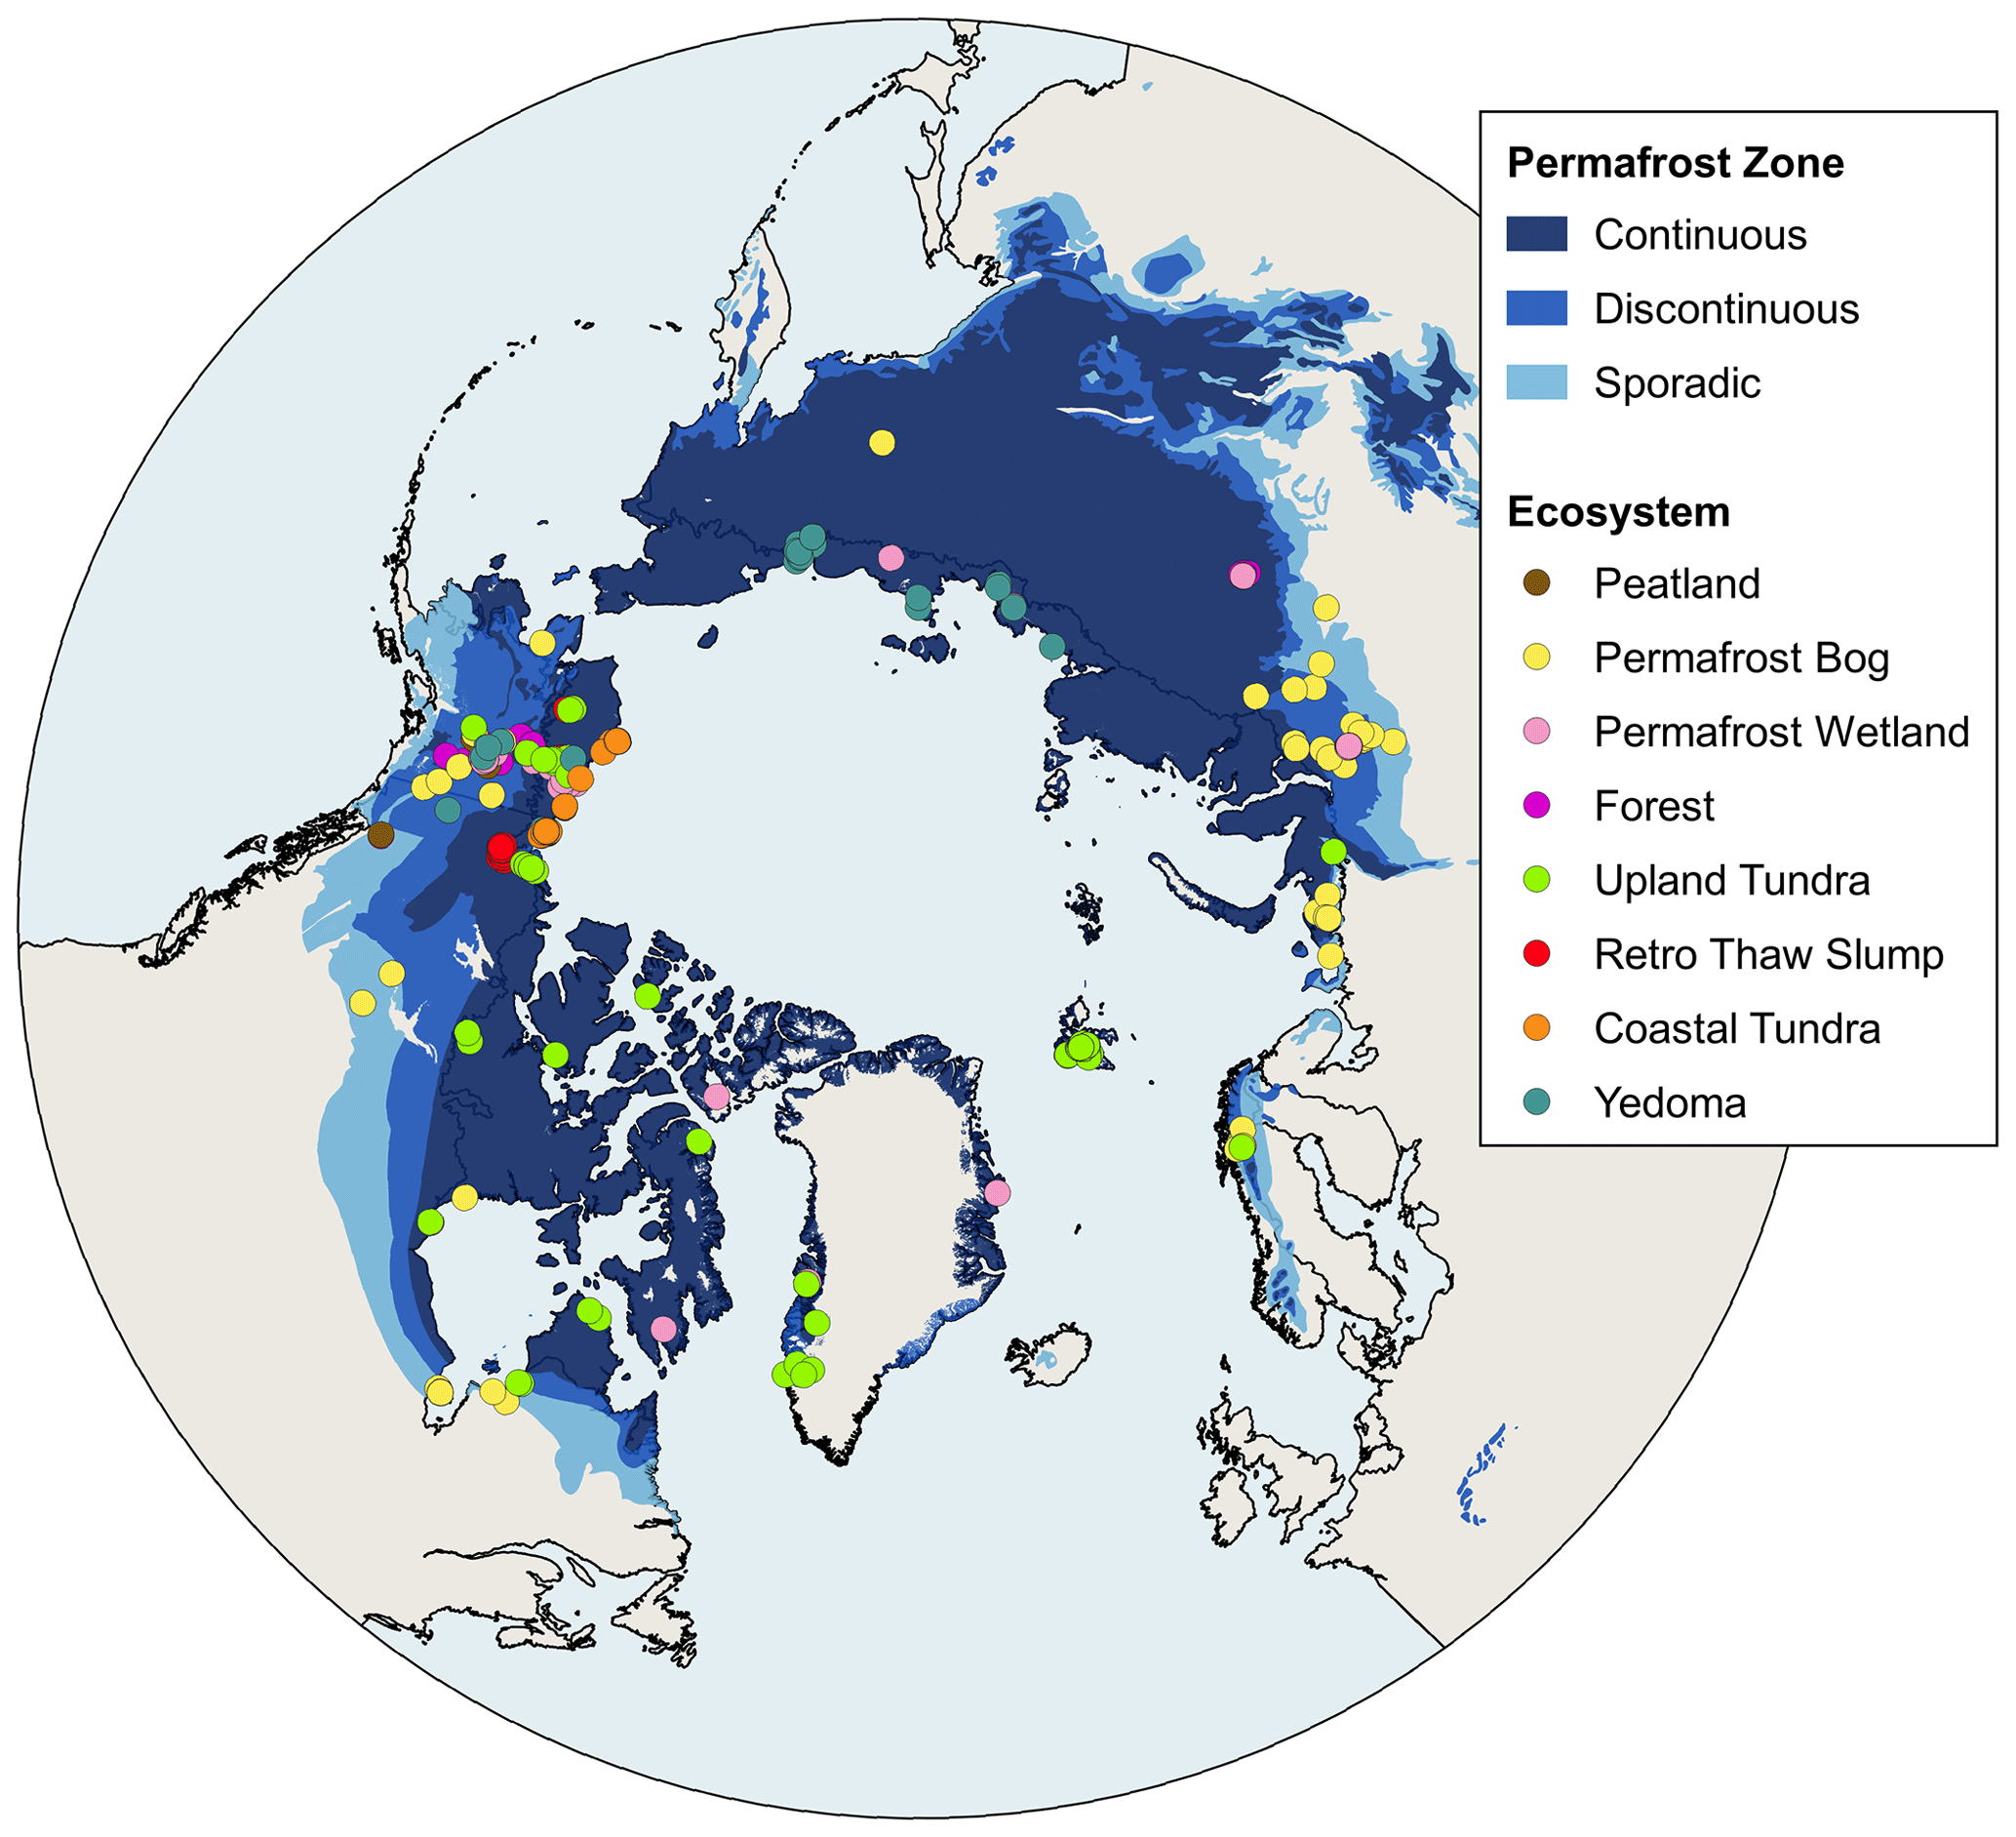
Figure 1Map of sampling locations with DOC measurements (n= 562) from the top 3 m for each ecosystem type. In many cases, the same sampling location was used in multiple studies, leading to some overlap, and therefore the number of sampling sites included in the dataset (562) is not clearly identifiable from this map. Similarly, several points overlay others even when the ecosystems differ. For a full list of the site coordinates, please see the database (https://doi.org/10.17043/heffernan-2024-doc-1, Heffernan et al., 2024). Retro Thaw Slump: Retrogressive Thaw Slump. Blue shading represents permafrost zonation (Brown et al., 1997).
The final database contained a considerably lower number of DOC mobilization measurements. The database includes 16 measurements of specific discharge of DOC (g DOC m−2) from three studies, and nine export rates of DOC per-day (g C m−2 d−1) and per-year (g C m−2 yr−1) measurements were each found in two studies. The amounts of specific discharge, export of DOC per-day measurements, and export of DOC per-year measurements combined were <1 % of the number of DOC concentration measurements. As such, they were not considered for analysis of DOC mobilization. A total of 146 BDOC (%) measurements, 4 % of the total number of DOC concentration measurements, were found in 14 studies. These measurements of BDOC were from the Yedoma (30:5, number of measurements:studies), Upland Tundra (55:5), Forest (18:3), Permafrost Wetland (12:2), and Permafrost Bog (31:5) ecosystems. Given the low number of other forms of DOC mobilization and the relatively comparable spread of BDOC measurements across the ecosystem types, we chose to include BDOC measurements in our analysis despite a low total number of measurements compared to DOC concentrations, and we consider this lower sample size during our interpretation of the results.
The filter size used in the studies ranged from 0.15 to 0.7 µm. The majority of the DOC concentrations reported were determined using a filter size of 0.45 µm (58 %); 0.7 µm was the second most common filter size (21 %), followed by 0.22 µm (14 %). We identified 11 different DOC extraction methods in total from both soils and water that are broadly grouped into the following six extraction types: leaching, suction, grab, centrifuged, dialysis, and potassium sulfate (K2SO4). Leaching includes leaching and dry leaching of soil; suction includes lysimeters, piezometers, pumps, and rhizons; grab includes grab samples and ice core extraction; and centrifuged, dialysis, and (K2SO4) remain on their own. Suction (42 %), leaching (37 %), and grab (14 %) were the three most common extraction methods across all the samples. Leaching and suction extraction methods were used for 66 % and 24 %, respectively, of all the soil samples. For water samples, suction (65 %) and grab (31 %) were the most common extraction methods. The most common measurement method to determine DOC concentrations was the combustion method (89 %), followed by the persulfate (9 %) and photometric (1 %) methods.
3.2 DOC concentrations and study regions
Upon inspection of DOC concentrations in the database, we determined that the data were non-normally distributed. The DOC concentrations were skewed toward the lower end of our 0–500 mg L−1 range; thus, we report the median, upper, and lower quartiles below. Across all the studies, within the top 3 m of soil, the median DOC concentration was 41 ± 74 mg L−1. DOC concentrations were found to differ among the three permafrost zones (chi-square = 32, df = 2, p<0.001; Fig. 2a). The highest median DOC concentrations were found in the sporadic permafrost zone (n= 83; 62 ± 144 mg L−1). The lowest median of 33 ± 77 mg L−1 was found in the continuous permafrost zone (n= 1648), with the greatest density of samples having lower DOC concentrations than observed in the violin plots of both the discontinuous and sporadic ones (Fig. 2a). This change in DOC concentrations along the latitudinal gradient of the permafrost zone was also seen in the latitudinal gradient associated with the ecoregion, where Arctic Tundra and Sub-Arctic Tundra are found at higher latitudes than both boreal ecoregions (chi-square = 78, df = 3, p<0.001; Fig. 2b). The highest DOC concentrations were found in the continental boreal (n= 389; 56 ± 56 mg L−1) and Sub-Arctic Boreal (n= 442; 58 ± 97 mg L−1) ecoregions, and the lowest ones were found in the Arctic Tundra (n= 1,209; 25 ± 75 mg L−1) and Sub-Arctic Tundra (n= 493; 43 ± 61 mg L−1) ecoregions. Inspection of the distribution of DOC concentrations across the ecoregions highlights that the Arctic Tundra ecoregion had the highest density of samples at the lowest DOC concentration (Fig. 2b).
These latitudinal differences are also reflected in the observed differences (chi-square = 20, df = 3, p<0.001) in DOC concentrations found within different soil classes. The highest DOC concentrations are found within organic-rich Histosol (n= 37; 61 ± 39 mg L−1) and Histel (n= 935; 53 ± 72 mg L−1; Fig. 2c) soils, with the distribution of the data from these soil types having a higher density at greater DOC concentrations (Fig. 2c). Histel and Histosol soils are the main types of permafrost soil found within the sporadic and discontinuous permafrost zone and both boreal ecoregions (Hugelius et al., 2014). Mineral-rich Orthels (n= 741; 38 ± 91 mg L−1) and Turbels (n= 820; 31 ± 62 mg L−1), mineral permafrost soils that have experienced cryoturbation, had the lowest DOC concentrations. The median DOC concentrations found within the top 3 m of these soil classes represent <1 % of the soil organic carbon stock found in the top 3 m of each soil class (Hugelius et al., 2014). DOC concentrations also differed within the thermal horizon of these different soil classes (chi-square = 91, df = 3, p<0.001; Fig. 2d). The highest DOC concentrations were found at permafrost-free sites (n= 202; 57 ± 22 mg L−1), which were largely Histosol soils (19 %) or Histel soils (74 %) that have experienced thermokarst formation. In areas where permafrost was present, DOC concentrations were highest in the active layer (n= 1400; 45 ± 74 mg L−1) and the permafrost lens (n= 729; 30 ± 113 mg L−1).
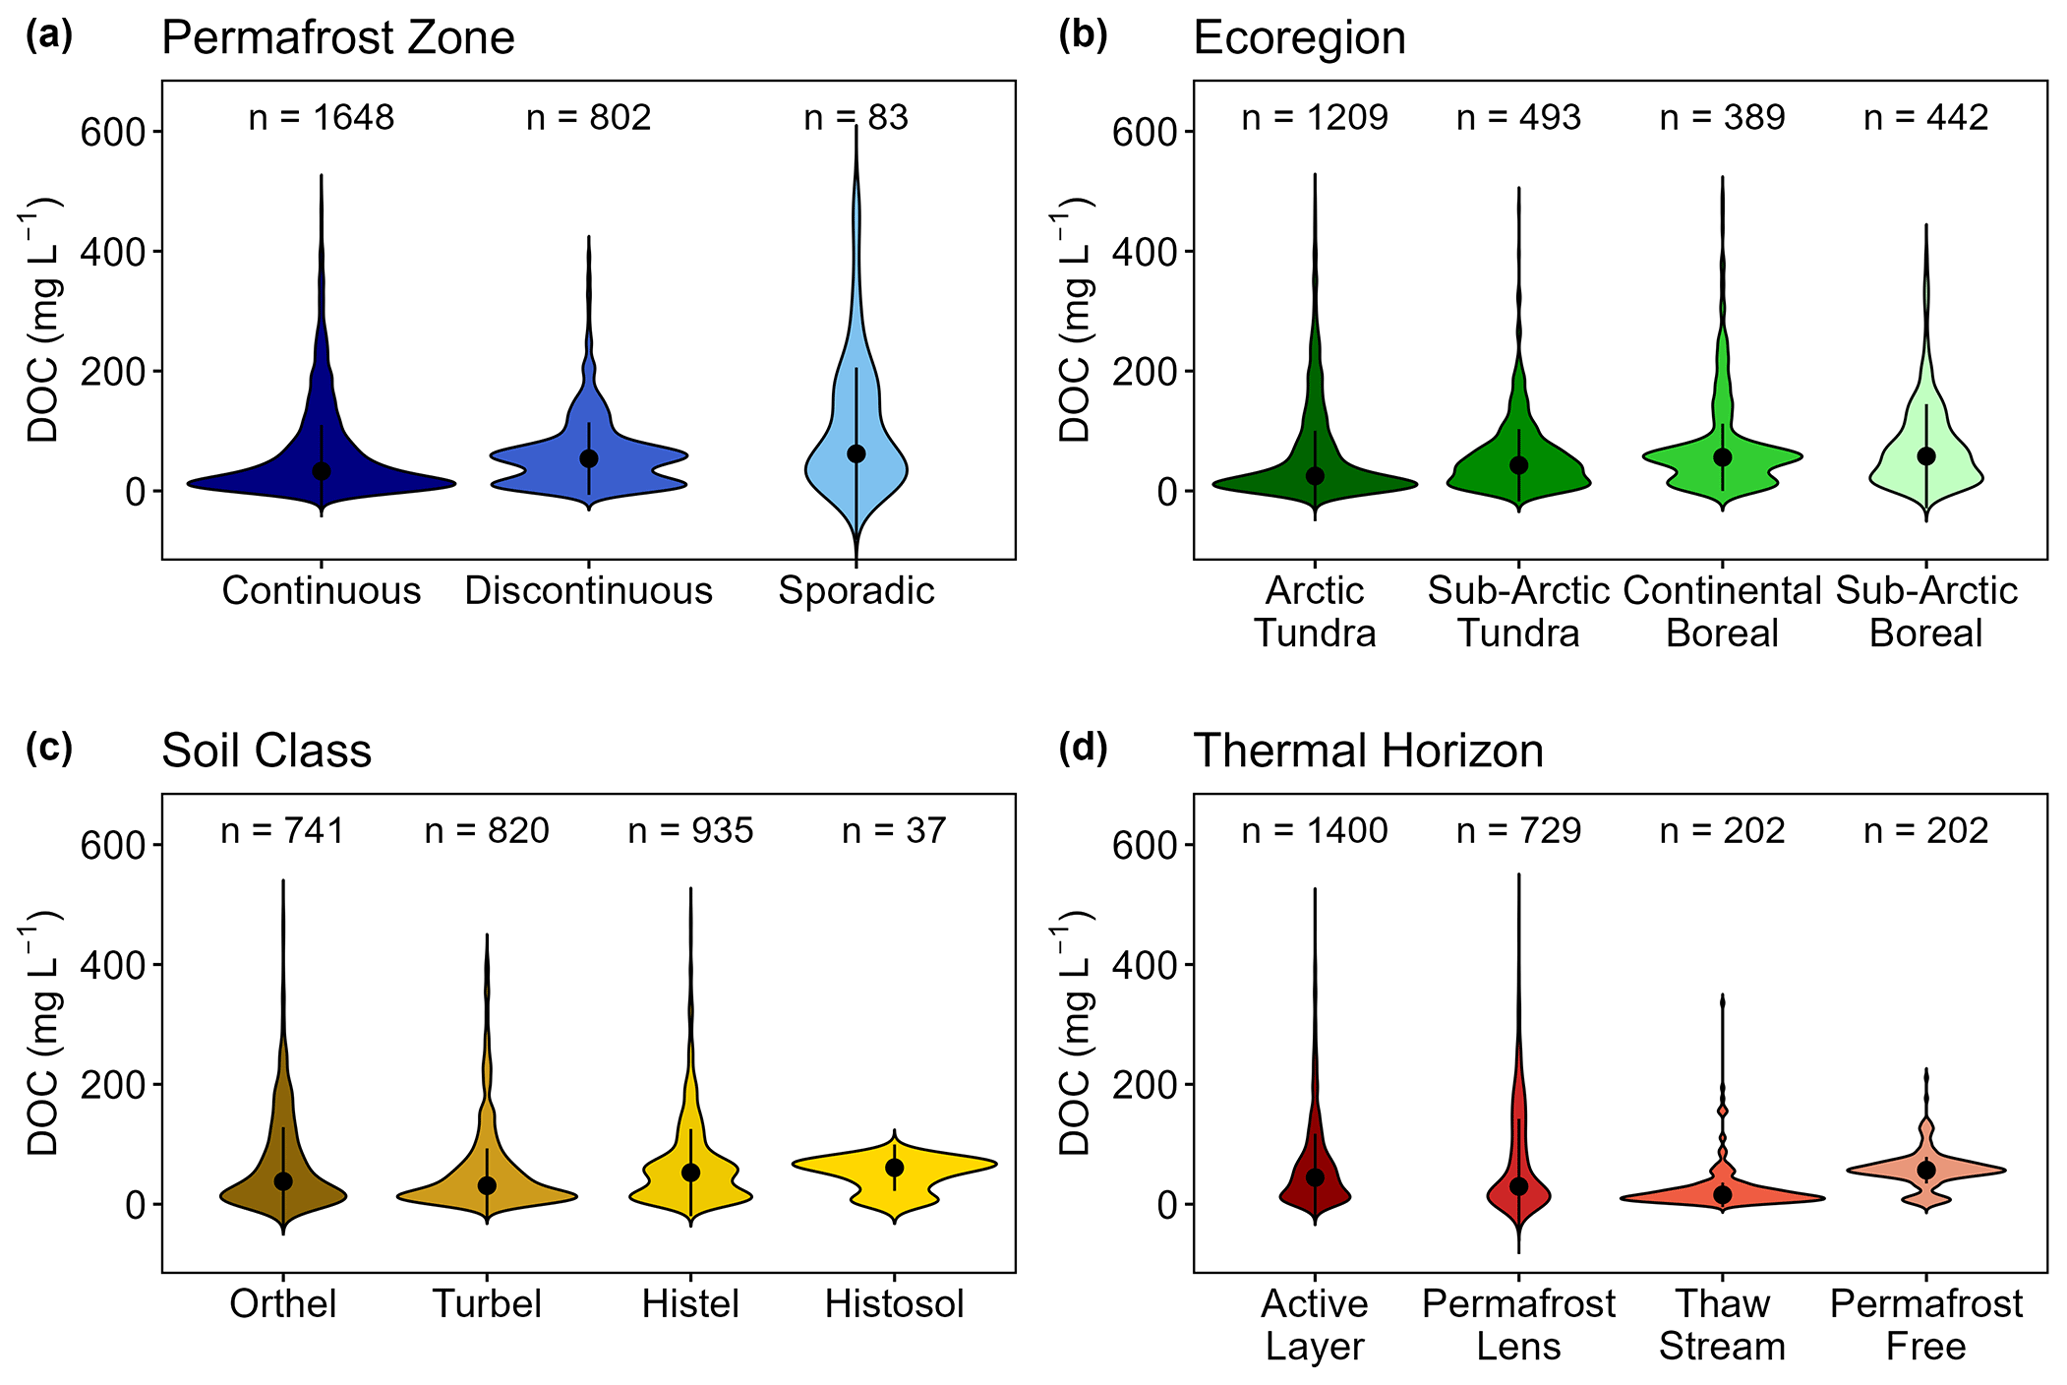
Figure 2Violin plots of DOC concentrations (mg L−1) found in the top 3 m across (a) permafrost zones, (b) ecoregions, (c) soil classes, and (d) thermal horizons. (a) Dark- to light-blue shading represents the permafrost zones Continuous, Discontinuous, and Sporadic, according to Brown et al. (1997). (b) Dark- to light-green shading represents the ecoregions Arctic Tundra, Sub-Arctic Tundra, Continental Boreal, and Sub-Arctic Boreal, according to Olson et al. (2001). (c) Dark- to light-yellow shading represents the soil classes Histosol, Histel, Orthel, and Turbel, according to the USDA Soil Taxonomy (USDA, 1999). (d) Dark- to light-red shading represents the thermal horizons Active Layer, Permafrost Lens, Thaw Stream, and Permafrost Free. The black dots in each violin plot represent the median. Black vertical lines represent the interquartile range, with the upper and lower limits representing the 75th and 25th percentiles, respectively. Either side of the black vertical line represents a kernel density estimation. This shape shows the distribution of the data, with wider areas representing a higher probability that samples within the database will have those DOC concentrations. The number of samples (n) found in each sub-category is found above each corresponding violin plot.
3.3 Trends in DOC concentrations across ecosystems
Similar to other categorical variables (i.e., permafrost zone, ecoregion, soil class, and thermal horizon data), DOC concentrations within each of the eight ecosystem types were found to be non-normally distributed, with median values skewed toward the lower end of the 0–500 mg L−1 range of concentrations (Fig. S1). Permafrost bogs, upland tundra, and permafrost wetlands were the most represented in the database with regards to DOC concentrations (Table S2). The majority of the permafrost bog measurements came from studies with field sites within Canada (Fig. 1; Table S2), as was the case for upland tundra and retrogressive thaw slump DOC concentration data. The majority of the permafrost wetland sample locations were found in Russia, whereas the majority of the 414 coastal tundra sampling locations were in the USA. The least represented ecosystem classes included the peatland ecosystem class, which is not strictly a permafrost ecosystem as the others are, and the Yedoma ecosystem class (145 DOC concentrations from nine studies, Table S2). DOC concentrations differed significantly across the eight ecosystem types (chi-square = 700, df = 7, p<0.001; Fig. 3). The highest DOC concentrations were found in coastal tundra (66 ± 116 mg L−1) and permafrost bog (63 ± 75 mg L−1) ecosystems. The lowest DOC concentrations were found in permafrost wetland (7 ± 20 mg L−1) and Yedoma ecosystems (9 ± 18 mg L−1), both of which had only slightly lower median DOC concentrations than retrogressive thaw slumps (15 ± 21 mg L−1).
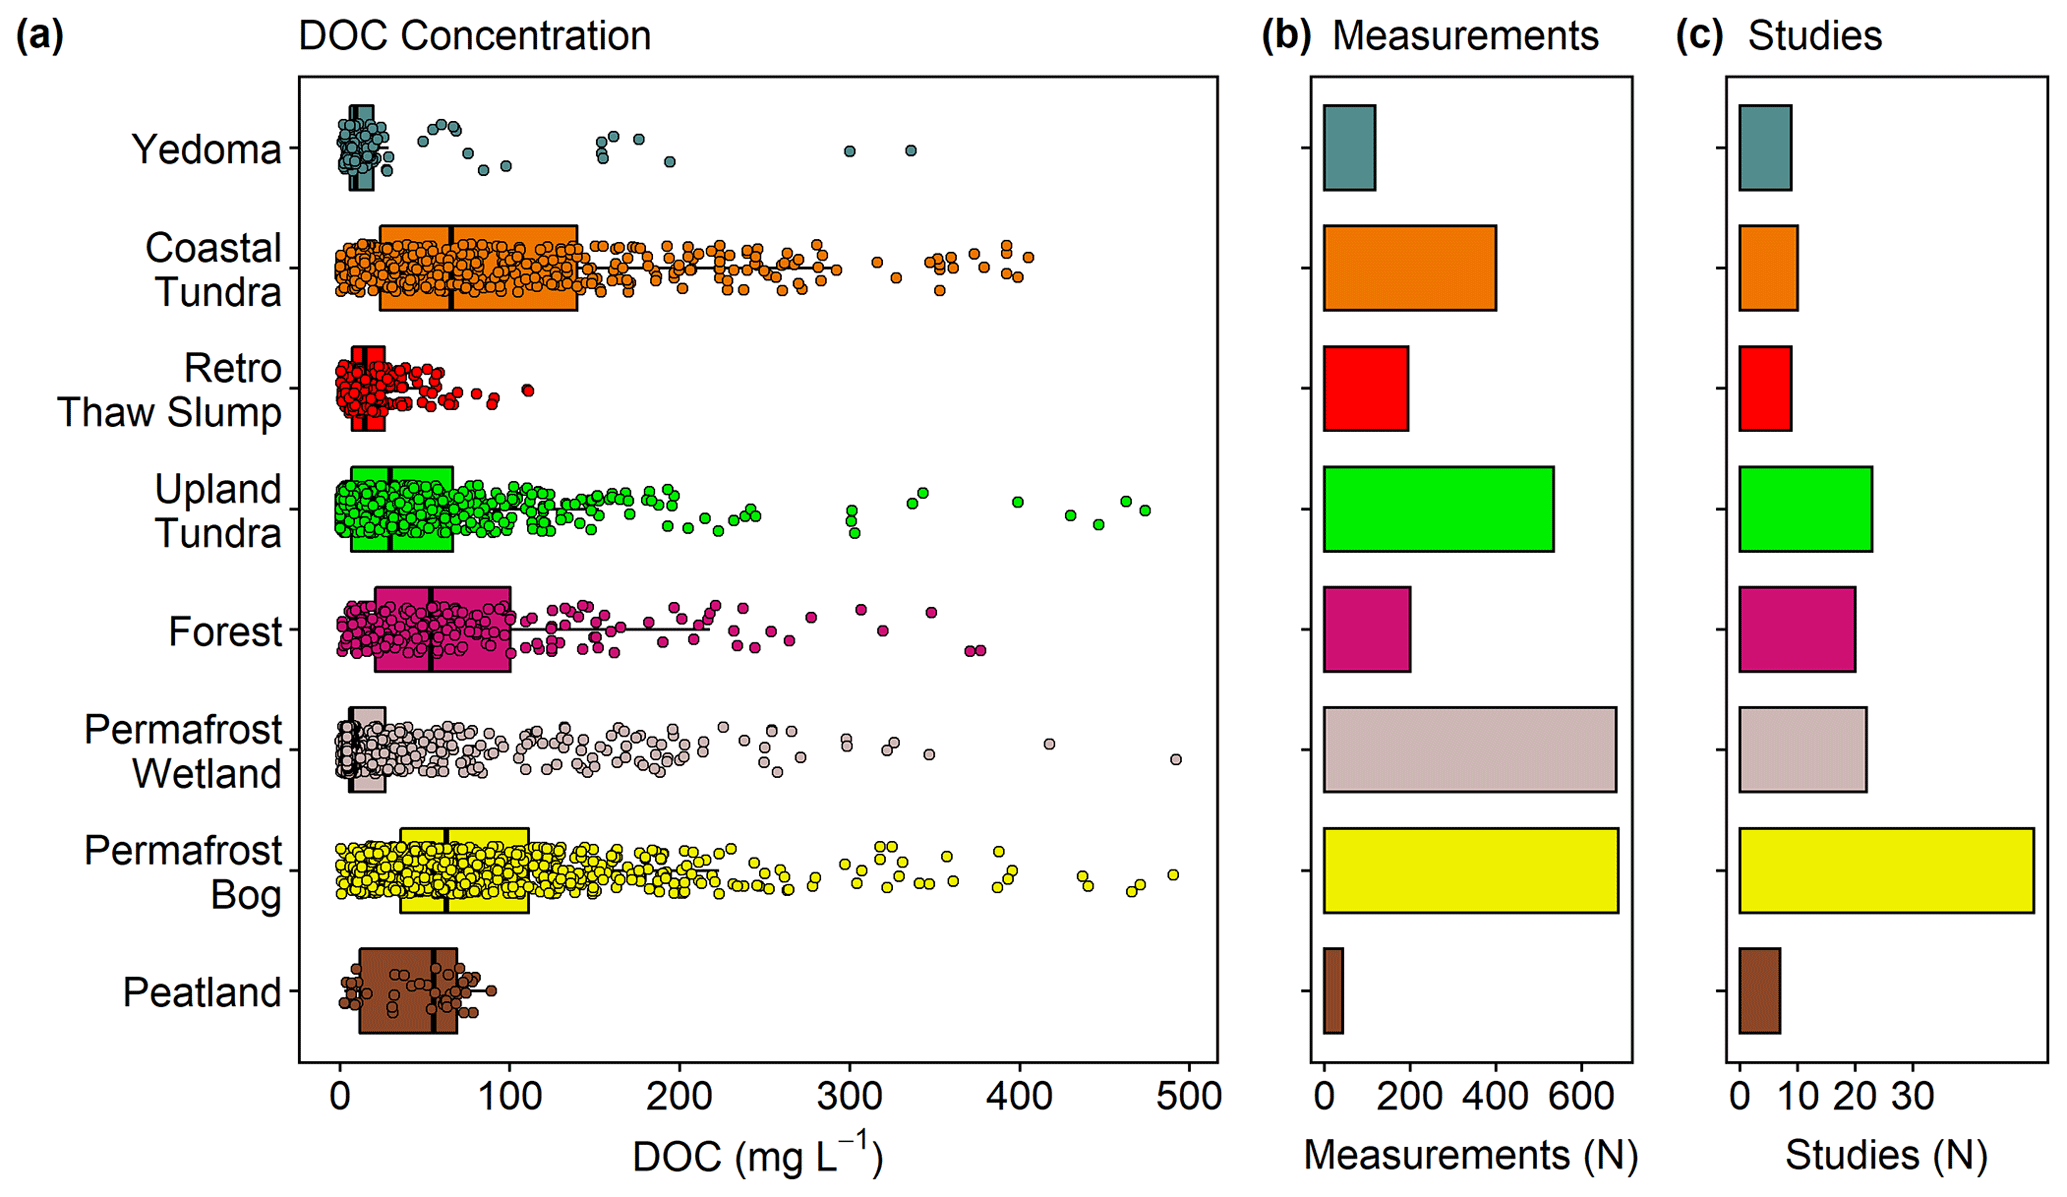
Figure 3Boxplot and jitter plot of (a) DOC concentrations (mg L−1), (b) the number of DOC measurements, and (c) the number of studies including DOC measurements taken from the top 3 m for each ecosystem type. Retro Thaw Slump: Retrogressive Thaw Slump. Boxes represent the interquartile range (25 %–75 %), with the median shown as a black horizontal line. Whiskers extend to 1.5 times the interquartile range (distance between the first and third quartiles) in each direction. Jitter points represent the concentration of each individual DOC measurement, with random variation applied to each point's location vertically in the plot to avoid overplotting. Yedoma: dark teal. Coastal Tundra: orange. Retrogressive Thaw Slump: red. Upland Tundra: green. Forest: purple. Permafrost Wetland: light pink. Permafrost Bog: yellow. Peatland: brown.
When grouping all the DOC concentrations by ecosystem type and differentiating between the active-layer and permafrost lens thermal horizons, we found that DOC concentrations differed between the active layer and permafrost lens for all the ecosystems (ANCOVA: , p<0.001), except for the permafrost bog (chi-square = 0.37, df = 1, p=0.5) and Yedoma (chi-square = 3.5, df = 1, p=0.06) ecosystems (Fig. 4). Within the permafrost lens thermal horizon, the highest DOC concentrations were found at coastal tundra (n= 103; 130 ± 119 mg L−1) and permafrost bog (n= 248; 78 ± 144 mg L−1) sites, and the lowest DOC concentrations were found at Yedoma sites (n= 91; 8 ± 10 mg L−1). The highest active-layer DOC concentrations were at permafrost bog (n= 276; 64 ± 61 mg L−1) and forest (n= 185; 57 ± 84 mg L−1) sites, and the lowest DOC concentrations were found at permafrost wetland sites (n= 274; 10 ± 42 mg L−1).
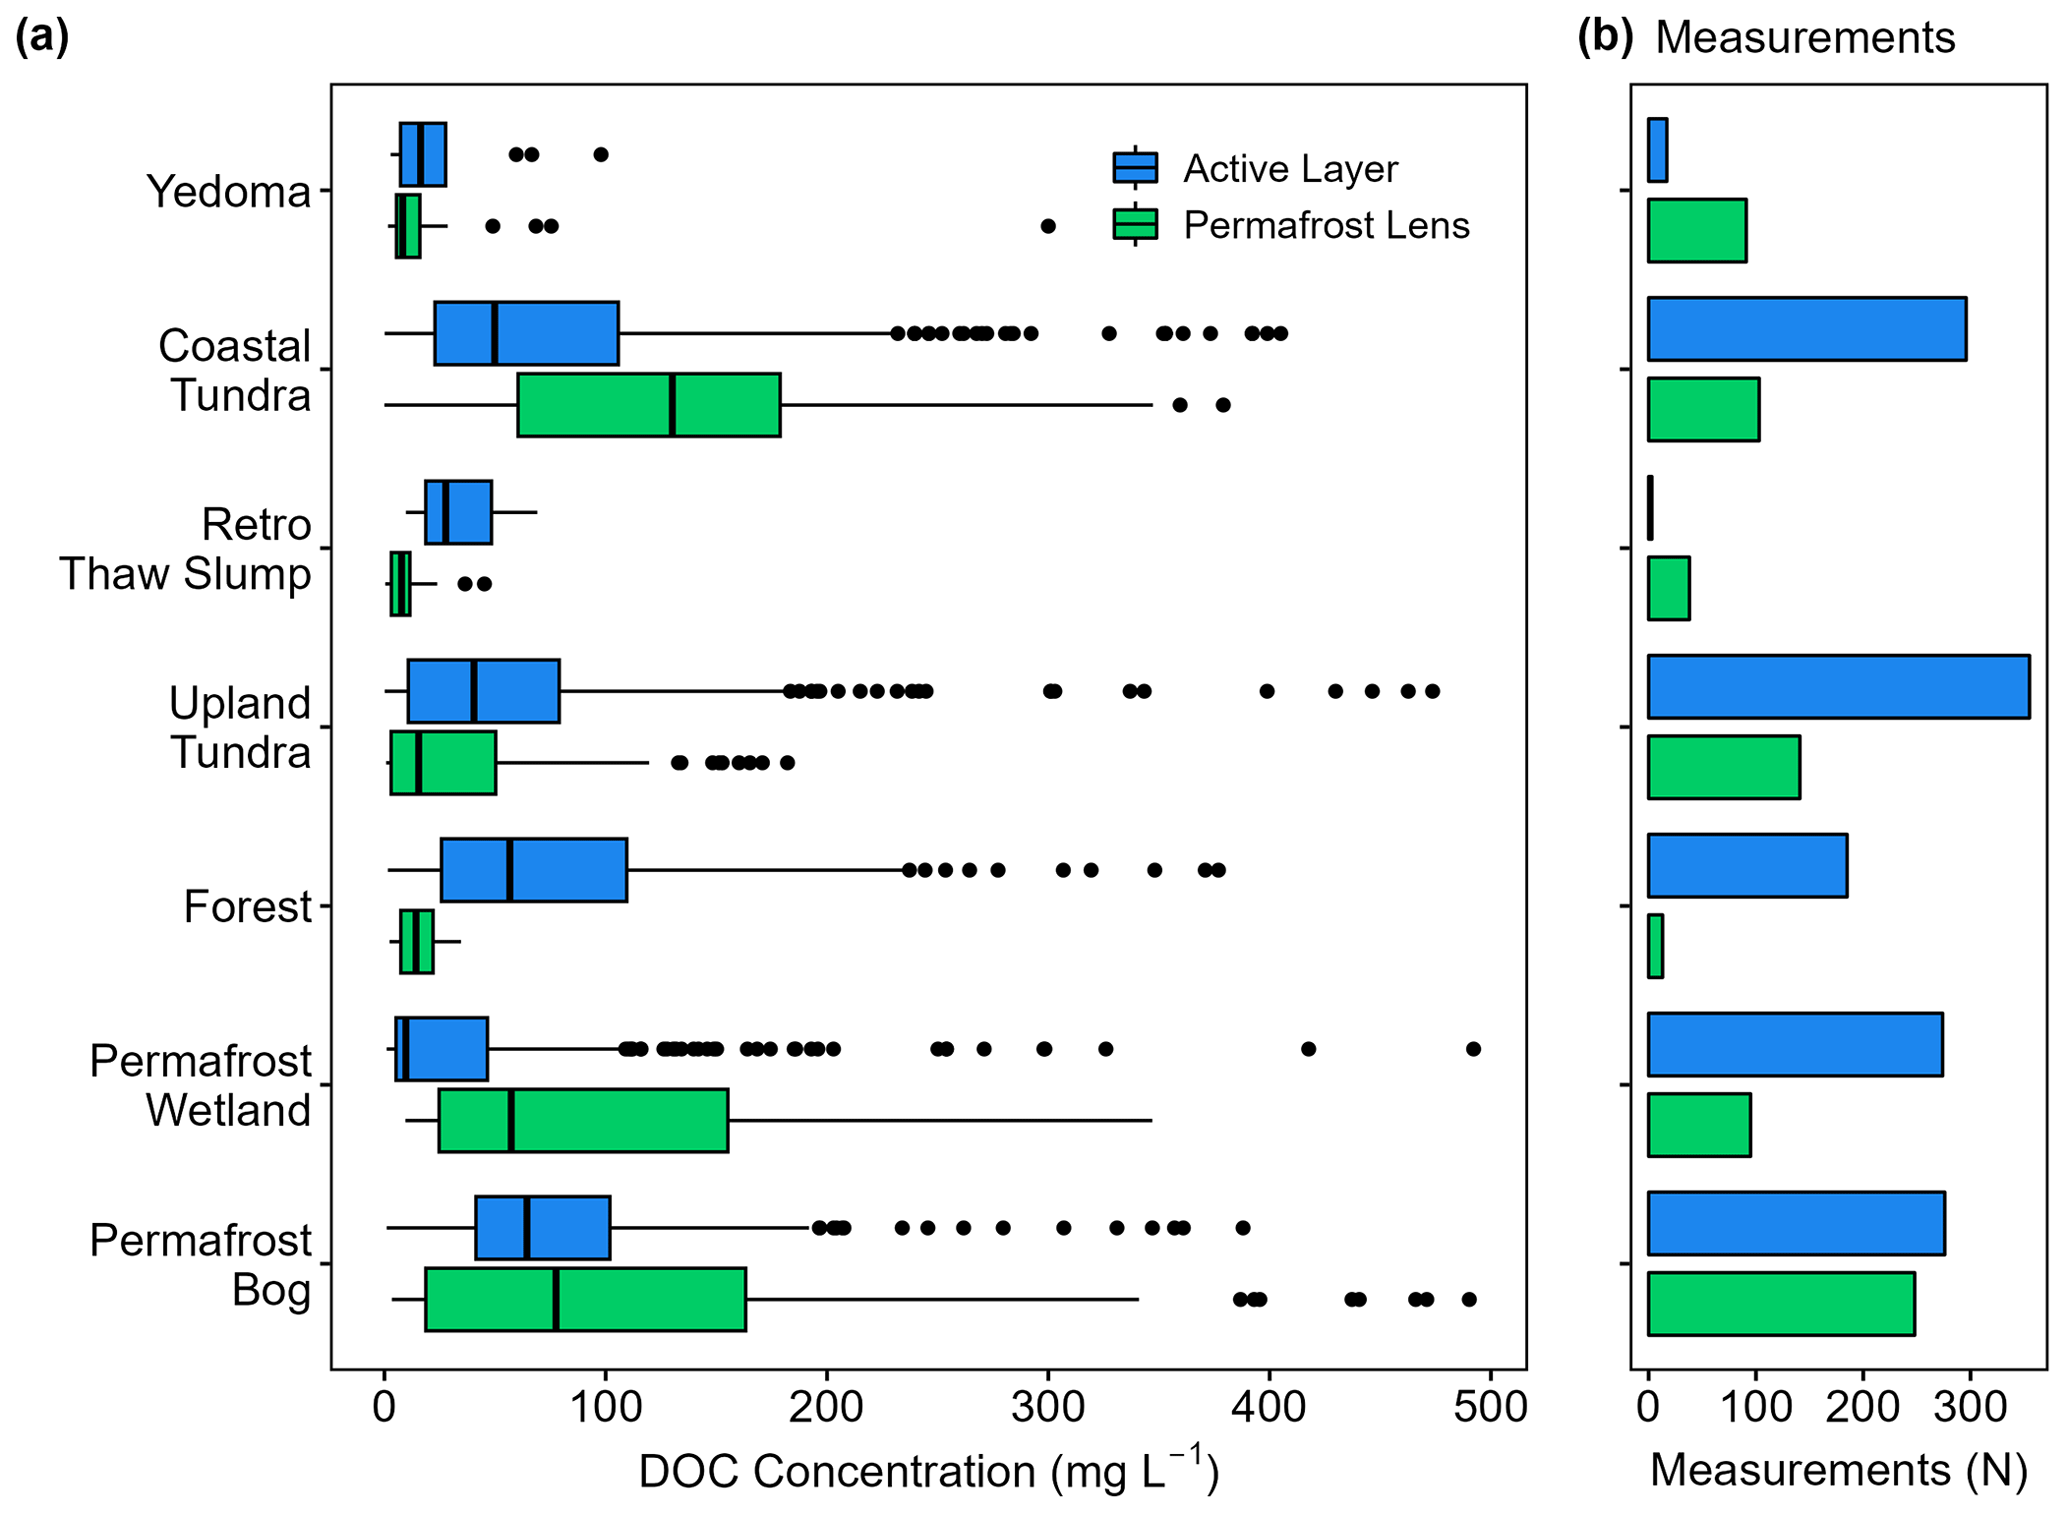
Figure 4Boxplot of (a) DOC concentrations (mg L−1) and (b) the number of DOC measurements in the Active Layer and Permafrost Lens thermal horizons of each ecosystem type. Only DOC concentrations from ecosystems with these thermal horizons present are used, and thus no permafrost-free sites are included. Retro Thaw Slump: Retrogressive Thaw Slump. Boxes represent the interquartile range (25 %–75 %), with the median shown as a black horizontal line. Whiskers extend to 1.5 times the interquartile range (distance between the first and third quartiles) in each direction. Blue boxplots represent DOC concentrations in the active layer. Green boxplots represent DOC concentrations in the permafrost lens.
3.4 Effect of extraction and analysis methods on DOC concentrations
We found that DOC concentrations differed between filter sizes (ANOVA: , p<0.001). The highest DOC median concentrations reported were filtered using 0.45 µm (53 ± 78 mg L−1) and 0.22 µm (42 ± 54 mg L−1) and were lowest using 0.7 µm (17 ± 78 mg L−1). The majority of the DOC concentrations were determined using 0.45, 0.7, and 0.22 µm filter sizes. The trends observed in DOC concentrations across study regions and ecosystems were also found when exploring these trends for the three main filter sizes used (Tables S3, S4). Using the 0.45 and 0.7 µm filter sizes, which represent 79 % of all the reported DOC concentrations, we find that DOC concentrations are generally higher in the discontinuous and sporadic permafrost zone, the two boreal ecoregions, Histel soils, and the active-layer thermal horizons (Table S3). Similarly, the highest DOC concentrations using these two most common filter sizes were highest in the permafrost bog and coastal tundra ecosystems (Table S4). Given these similarities when considering and not considering filter size and the large variation in DOC concentrations within each filter size, we consider the effect of filter size on the trends observed in DOC concentrations across the study regions and ecosystems reported above (Figs. 2, 3) to be minor.
DOC concentrations were found to be significantly different between samples subject to the six broader groups of the extraction method used (ANOVA: , p<0.001) and between water-based and soil (solid)-based extraction methods (ANOVA: , p<0.001). The trends observed in DOC concentrations across study regions (Fig. 2) and ecosystems (Fig. 3) were also found when exploring study region and ecosystem trends for the three main DOC extraction methods used (Tables S5, S6). We found that 93 % of the DOC concentrations were determined using the suction (42 %), leach (37 %), and grab (14 %) extraction methods. Using these three most common approaches, the highest DOC concentrations across the study regions (Table S5) and ecosystems (Table S6) were found in the discontinuous and sporadic permafrost zone, the two boreal ecoregions, Histel soils, the active-layer thermal horizons, and the permafrost bog and coastal tundra ecosystems.
The different methods of measuring DOC concentrations also produced significantly different DOC concentrations (ANOVA: , p<0.001). The three most common accounted for 99 % of all the DOC concentrations and were combustion, persulfate, and photometric. Of these three, combustion was the most common and was used for 89 % of the DOC measurements. The persulfate and photometric methods were not used in all the study regions (Table S7) and ecosystems (Table S8); thus, comparison of all three methods is not complete. Trends in DOC measured using the combustion and persulfate method (Tables S7, S8) were similar to those found across the study regions (Fig. 2) and ecosystems (Fig. 3). This is unsurprising given that both of these methods account for 98 % of all the DOC concentrations.
We consider the effect of the filter size, extraction method, and method of DOC measurement to be minor in determining trends in DOC concentrations across the study regions and ecosystems. We find that trends in DOC concentrations across the study regions and ecosystems are similar when you both consider and do not consider the methods used to determine those concentrations. Also, the variability observed in DOC concentrations for each study region and ecosystem remains high even when considering the filter size, extraction method, and measurement method. Thus, each method or approach similarly impacts DOC concentrations from each study region and ecosystem and cannot explain the DOC concentration variability observed within each one. However, these different approaches did have an impact on DOC concentrations. In this study, we did not focus on systematically testing the effect of filter sizes, extraction methods, or DOC measurement methods. Our goal was to assess the concentration and mobilization of DOC in terrestrial permafrost ecosystems across circumpolar regions and ecosystems. The assessment of the methods is outside the scope of our study. Rather, we compare DOC concentrations collected from samples using a variety of these methods and suggest that future studies use this information to decide on methods to be consistent with compiled measurements thus far.
3.5 Drivers of DOC concentrations
No continuous variables recorded in the dataset were available for all the DOC concentration database entries, with no sites containing data for all the continuous variables. This limited our ability to explore relationships between continuous environmental and ecological data and DOC concentrations across the permafrost region. To address drivers of DOC concentrations across the circumpolar permafrost region, we used PLS as it is tolerant of missing values. Multiple PLS regressions were run using various combinations of continuous and categorical data with similar model performance throughout. We chose the PLS to determine the drivers of DOC concentrations using environmental continuous variables and ecosystem types as this contained the lowest background correlation. The most parsimonious PLS regression extracted nine significant components, captured 79 % variation of the predictor variables, and explained 37 % of the variance in DOC concentrations in the dataset. The majority of the variance in DOC (35 %) is explained along the first two axes of the model. The model was robust and not overfitted, as model predictability was moderate (Q2=0.35) and background correlation was low (0.006).
The PLS plot (Fig. 5a) shows the correlation between DOC concentrations and selected environmental and ecological variables for the first two axes of the model. The two variables with the greatest positive and negative relationships with DOC concentrations were the total dissolved nitrogen content (mg L−1) and C:N ratios, respectively (Fig. 5b). The positive relationship of DOC with the total dissolved nitrogen and soil carbon content (SoilC) and the negative relationship with SUVA at 254 nm may be a result of ecosystem properties. The strong negative relationship with C:N ratios indicates that DOC concentrations decrease with increased decomposition. Other than a higher SoilC in permafrost bogs, there was no clear or obvious observable trend in SoilC, TDN, C:N ratios, and SUVA across ecosystem types (Fig. S3). The PLS demonstrates that ecosystem type strongly affects DOC concentrations, with DOC positively related to the highest ecosystems where the highest DOC concentrations are observed, permafrost bogs, and coastal tundra and negatively related to the lower DOC ecosystems, permafrost wetland, and retrogressive thaw slumps (Fig. 5). This negative relationship may be due to the higher latitudes these ecosystems are generally found at, which is supported by the negative relationship with DOC and the climate indicators mean annual temperature (MAAT) and mean annual precipitation (MAP). Additionally, this may be due to the high number of thermokarst-affected sites found within these ecosystem classes, particularly retrogressive thaw slumps. There is a clear negative relationship between DOC concentrations and disturbed permafrost wetlands, retrogressive thaw slumps, and permafrost bogs.
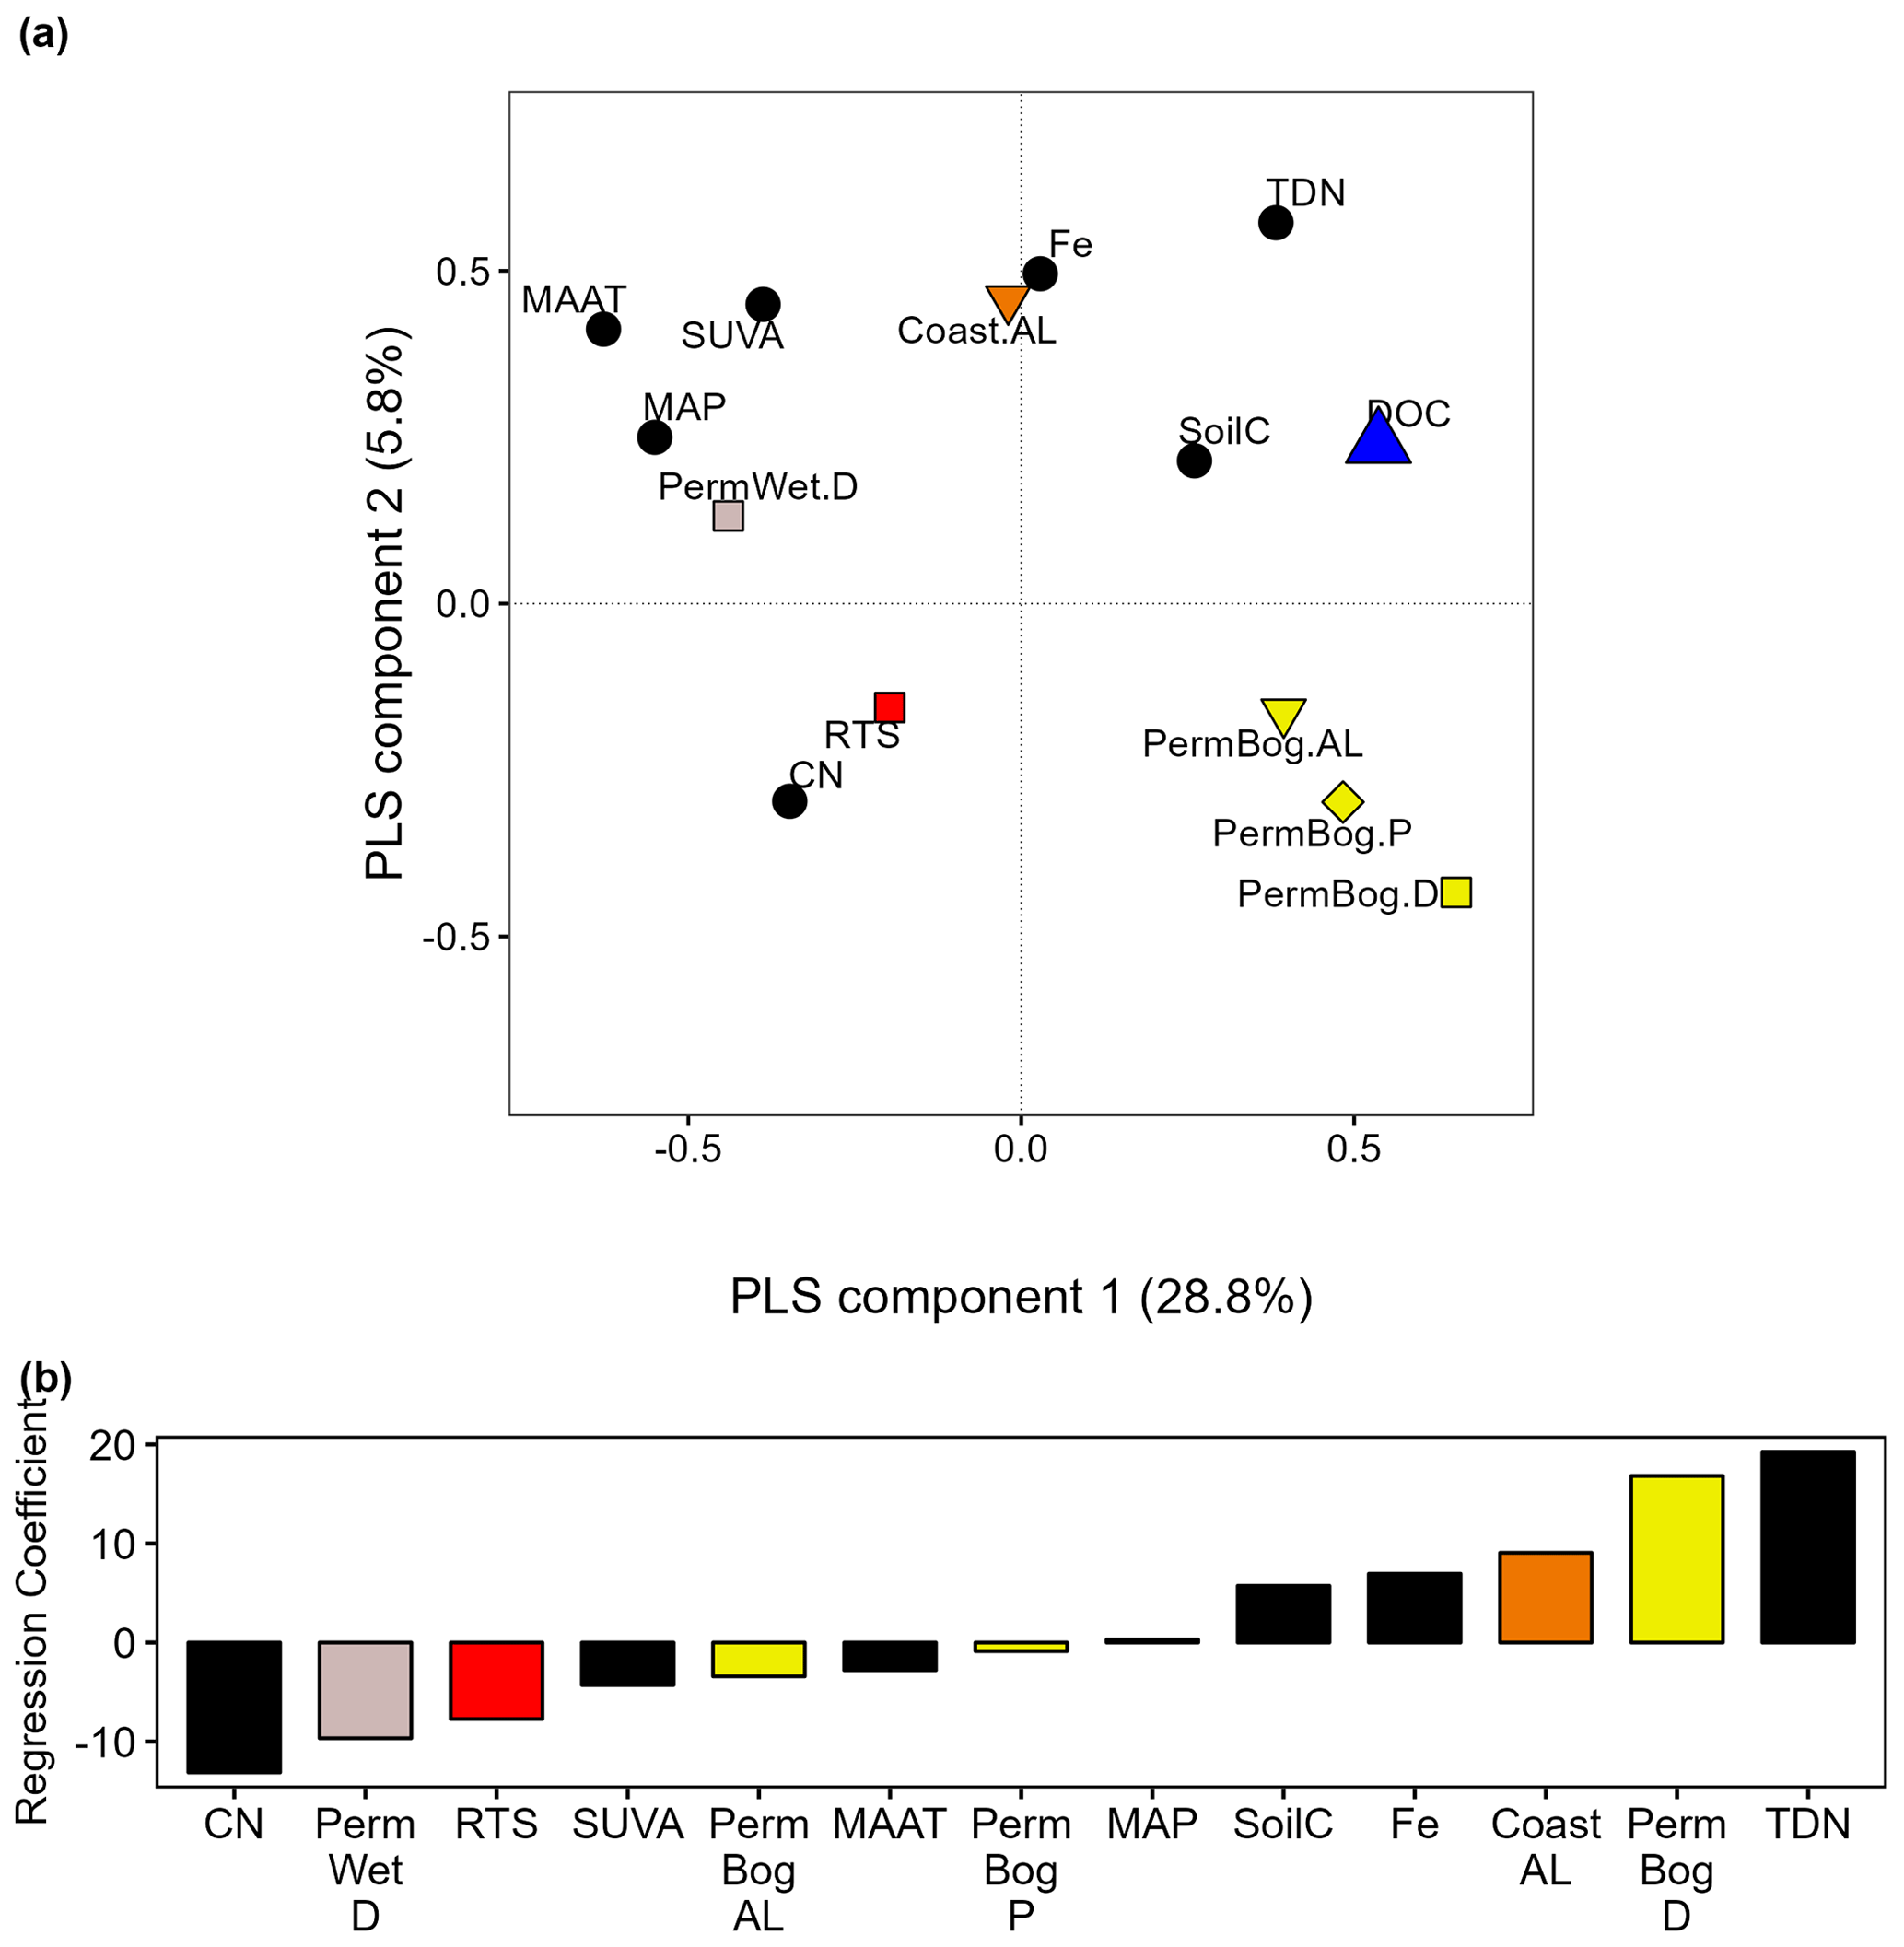
Figure 5Partial least-squares (PLS) regression (a) loadings plot explaining 37 % of the variability observed in the DOC concentrations. (b) Bar plot of PLS regression coefficients showing the relative importance of each variable in predicting DOC concentrations. Regression coefficients on the y axis are normalized so that their absolute sum is 100, with positive and negative values indicating the direction of the relationship. In the loadings plot, squares depict ecosystem classes and the blue triangle represents DOC concentrations. Black circles in the (a) loadings plot and black bars in the (b) bar plot represent continuous environmental data that had at least 20 % coverage of DOC data. Continuous data variables are represented by the color black. CN: carbon:nitrogen ratio. SUVA: specific UV absorbance at 254 nm (L mg C−1 m−1). MAP: mean annal precipitation (mm). MAAT: mean annual temperature. SoilC: carbon content of soil (g C kg−1). TDN: total dissolved nitrogen (mg L−1). Fe: dissolved iron (mg L−1). PermWet. D: disturbed permafrost wetland ecosystem class in light pink (as in Fig. 3) to represent this ecosystem class. RTS: retrogressive thaw slump ecosystem class in red (as in Fig. 3) to represent this ecosystem class. Coast. AL: active layer of the coastal tundra ecosystem class in orange. PermBog. AL: active layer of the permafrost bog ecosystem class in yellow. PermBog. P: permafrost lens of the permafrost bog ecosystem class in yellow. PermBog. D: disturbed permafrost bog ecosystem class in yellow.
3.6 Response and mobilization of DOC and BDOC to thermokarst formation
The highest DOC concentrations were found in pristine permafrost bog (n= 442; 75 ± 112 mg L−1) and coastal tundra ecosystems (n= 427; 72 ± 126 mg L−1; Fig. 6a). No thermokarst-affected coastal tundra ecosystems were recorded within the dataset, whereas, in permafrost bogs, DOC concentrations were found to differ across different thermokarst disturbances (ANOVA: 23.04, p<0.001), with the lowest ones found in thermokarst wetlands (n= 16; 10 ± 21 mg L−1). DOC concentrations were also found to differ between thermokarst-affected and pristine sites in upland tundra ecosystems (ANOVA: 5.91, p<0.001). The highest DOC concentrations in upland tundra ecosystems were found at sites that had experienced active-layer thickening (n= 142; 53 ± 39 mg L−1), whereas the lowest ones were found at sites that had experienced active-layer detachment (n= 6; 4 ± 2 mg L−1). Pristine sites had the highest DOC concentrations in both Yedoma (n= 114; 11 ± 15 mg L−1) and forest (n= 189; 49 ± 64 mg L−1) ecosystems. However, in permafrost wetland ecosystems, pristine sites had the lowest DOC concentrations (n= 766; 7 ± 51 mg L−1), with sites that were affected by both thermokarst wetland formation (n= 17; 21 ± 26 mg L−1) and active-layer thickening (n= 12; 41 ± 13 mg L−1) having higher DOC concentrations.
Our database contained limited data regarding BDOC (n= 146), and thus BDOC results across ecosystems should be interpreted with caution. Due to limited data, we have combined BDOC over all incubation lengths when assessing BDOC between pristine and thermokarst sites (Fig. 6). BDOC was found to differ between thermokarst disturbances within ecosystem types in only Yedoma (ANOVA: , p<0.001) and permafrost wetland (ANOVA: , p<0.001) ecosystems. The highest BDOC was also found in both of these ecosystem types, with 54 % (n= 5) at pristine Yedoma sites and 49 % (n= 8) at thermokarst-wetland-affected permafrost wetland sites (Fig. 6b), with the latter exhibiting the highest BDOC across all permafrost-affected sites, followed by thaw slumps (18 %, n= 11) in Yedoma ecosystems and active-layer thickening (40 %, n= 1) at upland tundra sites. The lowest median BDOC of 4 % was seen in thermokarst bogs (n= 5) and at active-layer-thickening-affected (n= 3) sites, with pristine sites experiencing a BDOC of 9 % (n= 15). However, not all ecosystem types in the database had BDOC data for both pristine and disturbance sites. For example, only pristine site data were available for forests, whereas there were no pristine site data available for upland tundra sites. No BDOC data were available for coastal tundra sites.
All ecosystem types that had BDOC data reported BDOC observed following 40–90 incubation days, and this also corresponded to the highest BDOC values for each ecosystem type (Fig. S4). When comparing the greatest BDOC observed within this incubation length window, we found that values varied across ecosystem type (ANOVA: , p<0.001). The highest loss rates were observed in Yedoma and permafrost wetland ecosystems, whereas the lowest ones were observed in organic-rich forest and permafrost bog ecosystems (Fig. S4). Forest (ANOVA: , p=0.15) and permafrost bog (ANOVA: , p=0.09) BDOC did not differ over incubation length, whereas Yedoma (ANOVA: , p<0.001) and permafrost wetland (ANOVA: , p<0.01) did differ over time, with their maximum occurring during this 40–90 d incubation length. This suggests that, when incubated for the same number of days, we would expect a greater BDOC in Yedoma and permafrost wetland ecosystems. Note that, for this analysis, BDOC values from all thermokarst- and non-thermokarst-affected sites within an ecosystem type were included. Given the limited BDOC data available, we have compared BDOC across ecosystems in two ways. The first is to use data from all the measurement days to assess BDOC across pristine and disturbed ecosystems (Fig. 6b). The second is to assess the maximum BDOC within each ecosystem type, which includes pristine and disturbed sites (Fig. S4). Using both approaches, we find that the highest BDOC is observed at the high-latitude Yedoma and permafrost wetland sites.
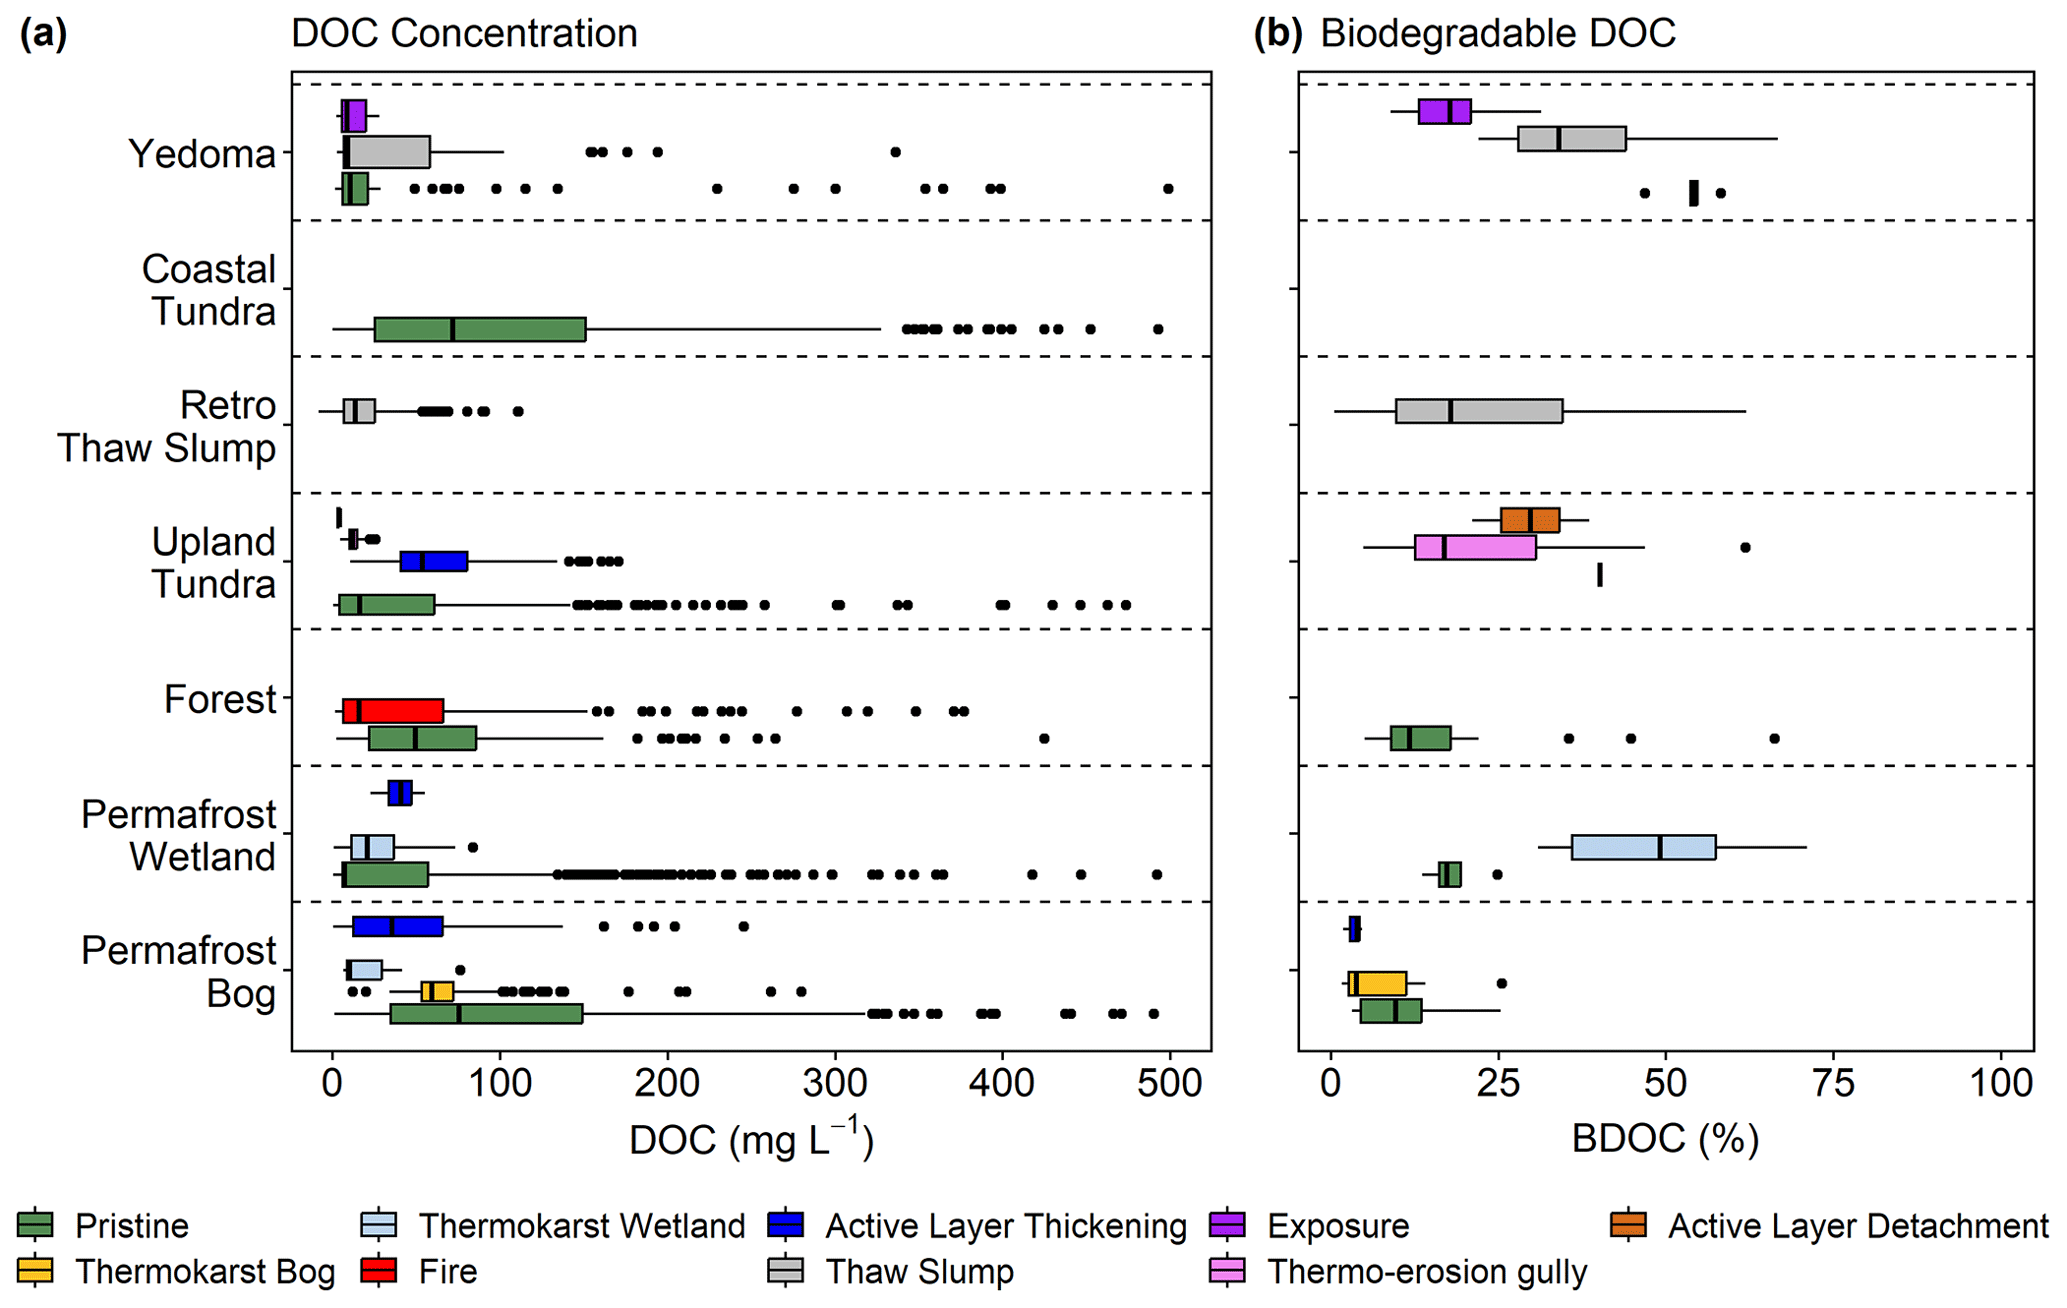
Figure 6DOC concentrations (mg L−1) and biodegradable DOC (BDOC; %) from the top 3 m following disturbance, including data from both field-based and incubation studies. (a) DOC concentrations from each ecosystem type following disturbance where data were available. (b) BDOC from each ecosystem type following disturbance where data were available. BDOC loss was determined following 3–304 d of incubation. Data from different incubation lengths were combined due to low sample size. Retro Thaw Slump: Retrogressive Thaw Slump. Boxes represent the interquartile range (25 %–75 %), with the median shown as black horizontal line. Whiskers extend to 1.5 times the interquartile range (distance between the first and third quartiles) in each direction, with outlier data plotted individually as black dots. Note that the colors associated with the boxplots in this figure are only relevant for this figure.
Response ratios comparing the change in DOC concentrations between pristine and thermokarst-affected sites were calculated from our dataset from 108 studies using Eq. (1) (Fig. 7). Only 17 studies provided data for both pristine and thermokarst-affected ecosystems, with 87 papers providing DOC concentrations from pristine sites and 34 from thermokarst-affected sites. When considering all the ecosystems together, we found that the response ratios were negative, suggesting that DOC concentrations were higher at thermokarst-affected sites compared to pristine sites (Fig. 7). These negative response ratios were most evident in permafrost bogs, which they found throughout the entire column and individual thermal horizons. The greatest increase in DOC concentrations following thermokarsts was seen when comparing DOC concentrations in the permafrost lens of permafrost bogs and, to a lesser extent, permafrost wetlands (Fig. 7). Only in Yedoma ecosystems did we see positive response ratios throughout the entire profile, suggesting a decrease in DOC concentrations following thermokarst formation at Yedoma sites. This was also seen for DOC concentrations within the permafrost lens of upland tundra sites, which include DOC concentrations from retrogressive thaw slumps and thermo-erosion gullies at their thermokarst-affected sites. The large confidence intervals for some response ratios suggest high variability in the response of DOC concentrations to thermokarst formation.
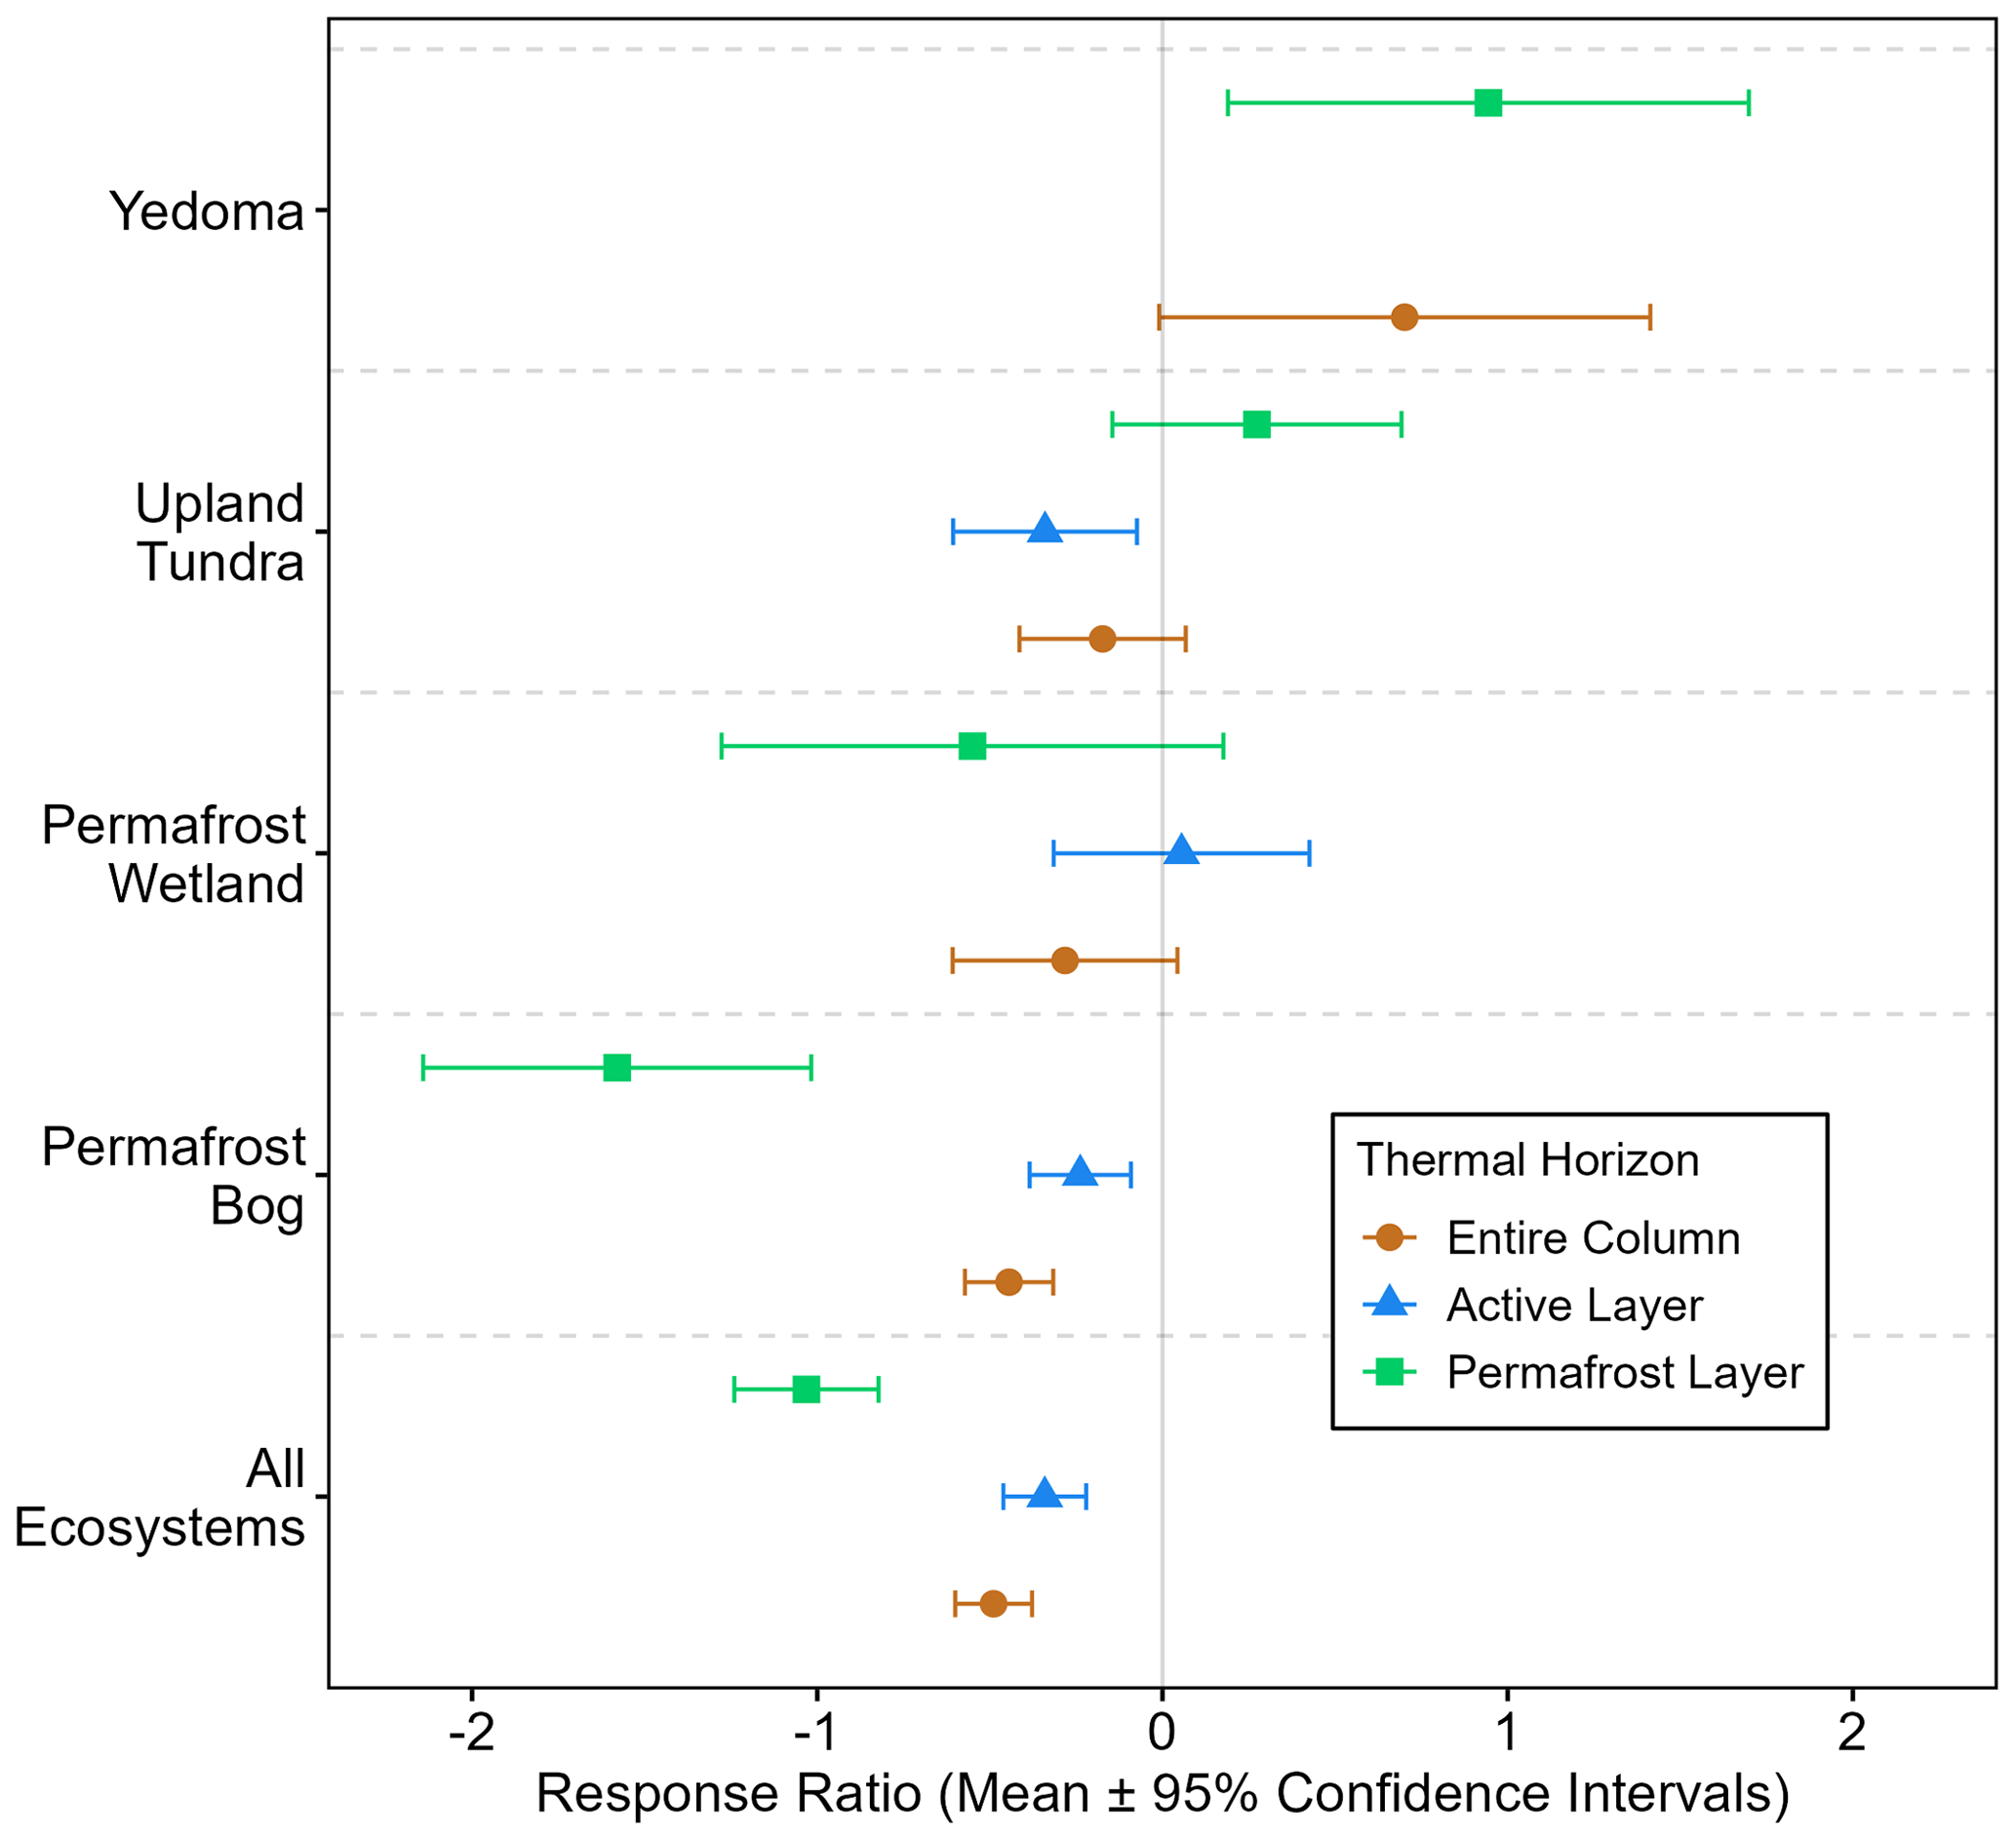
Figure 7Response ratios of DOC concentrations from the top 3 m following thermokarst formation (calculated using Eq. 1). Response ratio means allow for relative comparison of changes in DOC following thermokarst formation between different ecosystem types. Negative values indicate higher DOC concentrations found in pristine ecosystems, whereas positive values indicate a decrease in DOC concentrations following thermokarst. Studies reporting DOC concentrations from Exposures, Retrogressive Thaw Slumps, and Thermo-Erosion Gullies from sites within the continuous permafrost zone were combined into the Upland Tundra ecosystem category. This did not include DOC concentrations from studies within the Yedoma permafrost domain (Strauss et al., 2021). Blue lines represent DOC concentrations in the active layer, as per Fig. 4. Green lines represent DOC concentrations in the permafrost lens, as per Fig. 4. Brown lines represent DOC concentrations from the entire column (i.e., both the active layer and the permafrost lens).
In this systematic review, we evaluated patterns of DOC concentrations in the top 3 m of soil in terrestrial ecosystems across the northern circumpolar permafrost region based on results from 111 studies and 2845 DOC measurements. We focused on comparing concentrations of DOC in soils across various geographical regions, ecological conditions, and disturbance types. Our synthesis shows that median DOC concentrations across ecosystems range from 9 to 61 mg L−1, which represents similar albeit slightly higher DOC concentrations when compared to the median DOC concentrations found in topsoils of other land cover groups below 50° N (Langeveld et al., 2020), globally distributed lakes (Sobek et al., 2007), and lakes across the permafrost region (Stolpmann et al., 2021). In general, we show that organic soils have higher DOC concentrations than mineral soils and that DOC concentrations are positively related to total dissolved nitrogen concentrations and negatively to C:N ratios, which corroborate previous findings of factors correlating with DOC concentrations (Lajtha et al., 2005; Aitkenhead and McDowell, 2000). Overall, we found that properties associated with ecosystem type are the main constraint on DOC concentrations. Furthermore, disturbance through permafrost thaw has little impact on measured DOC concentrations. However, this may be due to the loss of biologically reactive DOC or the loss of an initially larger pulse of DOC having been previously mobilized prior to the timing of sampling.
4.1 Environmental factors influencing DOC
Our database confirmed our first hypothesis that the highest DOC concentrations would be found in organic-rich soils. Previous synthesis efforts estimating global distributions of terrestrial DOC concentrations have presented similar findings (Langeveld et al., 2020; Guo et al., 2020). Both of these previous studies also show that some of the highest terrestrial DOC concentrations are found within the northern circumpolar permafrost region, highlighting that these high DOC concentrations found in organic-rich permafrost soils are of global significance. Concentrations of DOC in the top 3 m of soils closely mirrored stocks of SOC across the circumpolar permafrost region (Hugelius et al., 2014). Organic-rich Histosol and Histel soils contain the greatest SOC per square kilometer, followed by Turbels and Orthels (Hugelius et al., 2014). The leaching of organic C from soils acts as a major source of DOC (Kalbitz et al., 2000; Marschner and Bredow, 2002), and thus it is not surprising that we find the highest DOC concentrations in the soil types with the greatest quantities of SOC (Fig. 2a). While the highest DOC concentrations are found within organic-rich soils, the amount of C found as DOC represents a small amount of the total SOC pool. Using the current best estimates of Histel SOC stocks (Hugelius et al., 2020), the DOC pool represents <1 % of the total C stock in permafrost-affected peatlands, as has been shown for both permafrost and global soils (Guo et al., 2020; Prokushkin et al., 2008).
4.2 Variation in DOC across ecosystems
The accumulation of high DOC concentrations we show in permafrost bogs and permafrost wetlands (Fig. 3) is a result of the prevalence of cold and anoxic conditions throughout the Holocene (Blodau, 2002). This leads to a reduction in microbial decomposition and the accumulation of a large SOC pool (Hugelius et al., 2020) and a large DOC pool. Our results suggest that the pristine permafrost bog and permafrost wetland DOC pool is relatively stable following permafrost thaw (Figs. 6, 7a). The lower DOC pool found in the active layer of permafrost wetland (Fig. 4a) may represent a potentially labile DOC pool (Fig. 7a), but this is likely due to fresh, plant-derived inputs rather than the exposure and mineralization of previously frozen organic matter (Fig. 7a). Peatland vegetation, in particular Sphagnum mosses, produces litter that has anti-microbial properties and is decay-resistant (Limpens et al., 2017; Hamard et al., 2019), limiting the amount of SOC that is degraded and assimilated into the DOC pool (Tfaily et al., 2013). This is further enhanced by the build-up of decomposition end-products and the thermodynamic constraint on decay observed in anoxic soils (Beer et al., 2008). Permafrost has been continuously present in peatlands across the northern circumpolar permafrost region for the past 6000 years, with the greatest rates of permafrost formation occurring within the past 3000 years (Treat and Jones, 2018). Thus, a large proportion of the organic matter found in peatlands and wetlands in this region was present prior to permafrost aggradation (i.e., permafrost formation), which indicates that permafrost formed epigenetically in these areas. Permafrost aggradation impacts soil biogeochemical properties, leading to potentially less decomposed organic matter with higher C:N ratios than non-permafrost-equivalent soils, particularly in permafrost wetlands (Treat et al., 2016). This can lead to the build-up of high DOC concentrations that are vulnerable to potential mobilization following thermokarst. Decomposition in epigenetic permafrost bogs following thermokarst has been shown to be relatively slow (Heffernan et al., 2020; Manies et al., 2021), which further supports our finding (Fig. 6) that the large DOC pool found in these systems is relatively stable following permafrost thaw.
Coastal tundra ecosystems had similarly high DOC concentrations to those found in permafrost bogs (Fig. 3a). Coastal tundra ecosystems represented the highest concentrations of DOC in mineral permafrost soils, with the highest concentrations found in the permafrost lens (Fig. 4a). This is contrary to findings that deeper coastal permafrost consists of low-organic-matter Pleistocene marine sediments (Bristol et al., 2021) and the proximity of the active layer to vegetation inputs, although the productivity and inputs are vulnerable to projected climatic warming and regional “browning” and “greening” (Lara et al., 2018). Recent work has shown that DOC in the active layer within the coastal permafrost is more biodegradable than OC in the permafrost lens (Speetjens et al., 2022), and a substantial proportion of organic carbon derived from thawing coastal permafrost is vulnerable to mineralization upon thawing, particularly when exposed to seawater (Tanski et al., 2021). Export of terrestrial coastal permafrost DOC directly into the Arctic Ocean can significantly influence marine biogeochemical cycles and food webs within the Arctic Ocean (Bruhn et al., 2021). Arctic coasts are eroding at rates of up to 25 m yr−1 (Fritz et al., 2017) and exporting large quantities of terrestrial organic matter export directly to the ocean, which is rapidly mineralized (Tanski et al., 2019). Enhanced DOC export from these coastal tundra ecosystems may disrupt aquatic food webs by altering nutrient and light supply, as has been shown for Swedish coastal systems (Peacock et al., 2022). These coastal tundra sites represent a large DOC pool that is highly vulnerable to enhanced mobilization and deserves further attention.
We found that DOC concentrations increased along a clear latitudinal gradient, from north to south, in the remaining ecosystems characterized by mineral soils with an upper organic layer, i.e., forests, upland tundra, and Yedoma. In forest ecosystems, the upper organic layer and the impact of soil temperature, moisture, and pH on SOC found there strongly influence the production, concentration, and composition of DOC (Neff and Hooper, 2002; O'Donnell et al., 2016; Wickland et al., 2007). Furthermore, the sorption of DOC to charcoal (Guggenberger et al., 2008) and high lignin and phenolic input from vegetation (O'Donnell et al., 2016) produce a difficult-to-degrade DOC pool, leading to the accumulation of the large DOC pool in the active layer (Fig. 4a) of this ecosystem type. This trend with depth has also been observed in the vertical distribution of DOC across global soils, with 50 % of the DOC pool found in the top 0–30 cm (Guo et al., 2020). While not included in the most parsimonious PLS model (Fig. 5), Yedoma and upland tundra ecosystems were found to negatively correlate with DOC concentrations (Fig. S5). The greatest proportions of OC and nutrients used for DOC production in these ecosystems are found in shallow organic layers (Semenchuk et al., 2015; Wild et al., 2013). Beneath the upper organic horizons in these mineral soils, processes such as sorption of DOC to minerals and the formation of Fe–DOC or Al–DOC complexes may remove DOC from the dissolved pool (Kawahigashi et al., 2006) and mechanically protect it from mobilization (Gentsch et al., 2015). The majority of vegetation and its leachates found in the permafrost region produce relatively stable DOC consisting of lignin-derived compounds, highly aromatic polyphenolic compounds, and low-molecular-weight organic acids (Chen et al., 2018; Drake et al., 2015; Ewing et al., 2015; MacDonald et al., 2021; Selvam et al., 2017). While differences in the stability of different DOC source end-members have been shown (MacDonald et al., 2021), differences in redox conditions are likely a major driver of differences in the accumulation and mineralization of DOC across permafrost ecosystem types (Mohammed et al., 2022).
4.3 Vulnerability of DOC to enhanced mobilization following thermokarst
We define DOC mobilization as DOC lost from an ecosystem via either export or degradation. Our second hypothesis that permafrost thaw would lead to enhanced mobilization of DOC cannot be fully supported by the findings from this database. Using our chosen systematic approach and focusing on data from terrestrial ecosystems, our database was limited to three studies which represented <1 % of the DOC concentration data. Several previous studies have detailed the export of DOC in Arctic inland waters: see Table 2 in Ma et al. (2019). These studies were excluded using our systematic approach (Tables 1 and 2) as they do not directly measure DOC export from a terrestrial ecosystem. Rather, they determine the quantity of terrestrial-derived DOC found in inland waters. This is a key distinction, as by not quantifying the export rates for terrestrial ecosystems, the net ecosystem carbon balance and vulnerability to enhanced export may not be assessed. We acknowledge the limitation of our approach regarding the inclusion of DOC export data. Thus, this database cannot be used to determine how permafrost thaw will influence DOC export from terrestrial ecosystems within the northern circumpolar permafrost region. However, we identify this lack of export data from terrestrial permafrost ecosystems as a key knowledge gap in our current understanding of the permafrost carbon pool. Currently, Arctic rivers are estimated to export 25–36 Tg DOC yr−1 (Amon et al., 2012; Holmes et al., 2012), with this being dominated by modern carbon sources (Estop-Aragonés et al., 2020) most likely derived from the top 1 m of terrestrial ecosystems. Using current best estimates of the areal extent and soil organic carbon stores in the top 1 m of Histosols, Histels, Orthels, and Turbels (Hugelius et al., 2014), and if we assume that the DOC pool represents ∼ 1 % of the SOC pool, we estimate that <1 % of the current DOC pool found in the top 1 m of Histosols, Histels, Orthels, and Turbels is exported annually to Arctic rivers. Quantifying the proportion of these DOC pools annually lost, and particularly the proportions lost in headwater streams while being exported to Arctic rivers, is vital for assessing the importance of the mobilization of the terrestrial permafrost DOC pool.
Our calculated response ratios (Fig. 7) for all the ecosystems, indicating the difference in DOC concentrations between pristine and permafrost-thaw-affected sites, partly support our second hypothesis that disturbance would lead to increased export and biodegradability of DOC. The increase in DOC following thaw observed in permafrost bogs is likely due to increased inputs due to increased runoff and shifts in vegetation following permafrost thaw (Burd et al., 2020), enhanced release of DOC (Loiko et al., 2017), a relatively stable soil organic carbon pool at depth due to several millennia of microbial processing (Manies et al., 2021), the prevalence of anoxic conditions, and the potential hydrological isolation of thermokarst bogs (Quinton et al., 2003). While not included in our analysis, DOC found near the surface of the permafrost lens in forest ecosystems has been shown to be more biodegradable than DOC found in the active layer (Wickland et al., 2018) and may represent a decrease in DOC following thermokarst not captured here. Our findings of limited mobilization of permafrost bog DOC upon thawing are supported by the findings that the 14C signature of DOC in Arctic rivers is dominated by modern sources (Estop-Aragonés et al., 2020). However, individual studies have determined that thawing may release a large pool of permafrost peatland DOC into aquatic networks (Lim et al., 2021). We do see a reduction in DOC concentrations at thermokarst-affected sites in the higher-latitude Yedoma, upland tundra, and permafrost wetland ecosystems. This reduction in DOC concentrations in these ecosystems may be due to the greater biodegradability and lability of the DOC found there (Fig. 6b), supporting our third hypothesis that the most biodegradable DOC would be found in higher-latitude ecosystems. Permafrost DOC in higher-latitude ecosystems, particularly Yedoma ecosystems, is characterized by syngenetic permafrost aggradation which has not undergone centuries to millennia of soil formation and microbial processes and which has been shown to contain a greater proportion of low-oxygen, aliphatic compounds and labile substrates (Ewing et al., 2015; MacDonald et al., 2021). This leads to greater bio-lability and rapid mineralization of DOC (Vonk et al., 2015), potentially causing the reduction in DOC concentrations observed following thaw. If this hypothesis is found to be true across all the high-latitude ecosystems with further data, it will further highlight the vulnerability of the large DOC pool found in coastal tundra ecosystems.
In this study, we focus on the dissolved fraction of the OC pool. However, the particulate fraction should also be considered when discussing the mobilization of terrestrial OC in permafrost landscapes. In boreal freshwater networks, particulate organic carbon (POC) represents a small but highly labile fraction of terrestrially derived OC exported to the fluvial network (Attermeyer et al., 2018). The degradation of permafrost-derived POC is much slower than that of POC in the boreal freshwater network and POC derived from younger sources along the riverbank (Shakil et al., 2020). The DOC pool in Arctic freshwaters is dominated by modern terrestrial sources (Estop-Aragonés et al., 2020), whereas the POC pool has been shown to be dominated by older sources in both permafrost-peatland-dominated areas (Wild et al., 2019) following the formation of retrogressive thaw slumps (Keskitalo et al., 2021) and in thermokarst-affected periglacial streams (Bröder et al., 2022). This older POC has been shown to accumulate following export due to low lability and degradation and mineral association, which suggests that, upon thermokarst formation, previously frozen OC exported in the particulate phase is not readily consumed by microbes and that permafrost-derived DOC is the more labile fraction of exported terrestrial OC.
4.4 Future considerations for study design
Determining the fate of mobilized terrestrial DOC in both permafrost-thaw-affected and pristine sites should be prioritized in future studies to constrain current estimates of the permafrost C climate feedback. There are large spatial gaps in the database, particularly in areas with large stocks of permafrost C such as the Hudson Bay Lowlands and the Mackenzie River basin, both in Canada and two of the three largest deposits of permafrost peatland C in the circumpolar permafrost region (Olefeldt et al., 2021). Similarly, coastal tundra sites, which along with permafrost bog represent the ecosystems with the highest DOC concentrations, were sampled only along the northern shoreline of Alaska and the Yukon (USA and Canada, respectively; Table S2). From our analysis of this database, we determine that DOC mobilization is poorly understood for terrestrial permafrost ecosystems. To address this, the two main needs of future studies will be (1) more direct estimates of DOC fluxes and export from terrestrial ecosystems into aquatic ecosystems and (2) more DOC degradation (BDOC) and mineralization studies. Our results suggest that the high concentrations of DOC in permafrost bogs remain relatively stable upon thermokarst formation, although individual studies do indicate that thawing peat may provide a reactive source of DOC (Selvam et al., 2017). The database did not include any studies that reported on the mineralization of DOC from coastal tundra sites; thus, we are unable to comment on the stability of the high DOC concentrations found in this ecosystem type. Further sampling and assessing the mineralization of DOC is required to characterize the potential pool of vulnerable DOC in areas with high DOC concentrations. Overall, our database and systematic approach only included five studies (Beckebanze et al., 2022; Olefeldt and Roulet, 2012, 2014; Olefeldt et al., 2012; Prokushkin et al., 2006, 2005) that explicitly reported rates of DOC discharge, export, or fluxes from terrestrial ecosystems into the fluvial network. Given the importance of terrestrial DOC as a source of CO2 production within the aquatic network (Weyhenmeyer et al., 2012) and the findings that previously frozen DOC is being exported to the freshwater network (Estop-Aragones et al., 2020), improved estimates of the quantity of terrestrial DOC being exported is essential for determining the potential aquatic greenhouse gas fluxes derived from the mineralization of terrigenous organic matter. To improve current estimates of the permafrost C feedback, further studies are needed to determine how much DOC is laterally exported from terrestrial ecosystems and the mineralization potential of this DOC along the terrestrial–freshwater–aquatic continuum.
Lastly, we suggest that future studies should consider a standardization of methods and approaches used to determine DOC concentrations for better comparison across studies. In constructing this database, we identified three different filter sizes, 11 different extraction procedures, and four different measurement methods. The most common filter size used was 0.45 µm, and this has previously been described as the cutoff for separating DOC from colloid materials (Thurman, 1985; Bolan et al., 1999). In extracting DOC concentrations from soils, the mostly commonly used approach (70 % of all the soil samples) was via soil leaching with no chemical treatment of the soils, although some added filtered water to promote leaching. From the seven approaches identified to extract water samples from terrestrial sites in determining DOC, 48 % of the samples were collected using a variety of suction devices, and 46 % was done with grab samples. Of the four DOC measurement methods, the most common approach was by combustion, with 90 % of all the DOC concentrations measured using this approach. As such, in order to continue measuring DOC concentrations in terrestrial permafrost ecosystems using the most consistent approach, we suggest using 0.45 µm filters, extracting porewater via some type of sucking device or soil via leaching, and using a combustion-based method to determine DOC concentrations.
All the data are freely and publicly available at https://doi.org/10.17043/heffernan-2024-doc-1 (Heffernan et al., 2024).
The supplement related to this article is available online at: https://doi.org/10.5194/tc-18-1443-2024-supplement.
LH, DNK, and LJT designed and planned the systematic review approach. LH built the database. LH and DNK analyzed the data. LH wrote the manuscript draft. DNK and LJT edited and reviewed the manuscript.
The contact author has declared that none of the authors has any competing interests.
Publisher’s note: Copernicus Publications remains neutral with regard to jurisdictional claims made in the text, published maps, institutional affiliations, or any other geographical representation in this paper. While Copernicus Publications makes every effort to include appropriate place names, the final responsibility lies with the authors.
We thank Konstantinos Vaziourakis, Mona Abbasi, Elizabeth Jakobsson, Marloes Groeneveld, Sarah Shakil, and Jeffrey Hawkes for helpful discussions throughout the development and writing of this paper.
This research has been supported by the Knut och Alice Wallenbergs Stiftelse (grant no. KAW 2018.0191). Dolly N. Kothawala was funded by the Swedish National Science Foundation (grant no. VR 2020-03249).
This paper was edited by Hanna Lee and reviewed by three anonymous referees.
Abbott, B. W., Jones, J. B., Godsey, S. E., Larouche, J. R., and Bowden, W. B.: Patterns and persistence of hydrologic carbon and nutrient export from collapsing upland permafrost, Biogeosciences, 12, 3725–3740, https://doi.org/10.5194/bg-12-3725-2015, 2015.
Aitkenhead, J. A. and McDowell, W. H.: Soil C:N ratio as a predictor of annual riverine DOC flux at local and global scales, Global Biogeochem. Cy., 14, 127–138, https://doi.org/10.1029/1999GB900083, 2000.
Amon, R. M. W., Rinehart, A. J., Duan, S., Louchouarn, P., Prokushkin, A., Guggenberger, G., Bauch, D., Stedmon, C., Raymond, P. A., Holmes, R. M., McClelland, J. W., Peterson, B. J., Walker, S. A., and Zhulidov, A. V: Dissolved organic matter sources in large Arctic rivers, Geochim. Cosmochim. Ac., 94, 217–237, https://doi.org/10.1016/j.gca.2012.07.015, 2012.
Andersen, C. M. and Bro, R.: Variable selection in regression – a tutorial, J. Chemometrics, 24, 728–737, https://doi.org/10.1002/cem.1360, 2010.
Andresen, C. G., Lawrence, D. M., Wilson, C. J., McGuire, A. D., Koven, C., Schaefer, K., Jafarov, E., Peng, S., Chen, X., Gouttevin, I., Burke, E., Chadburn, S., Ji, D., Chen, G., Hayes, D., and Zhang, W.: Soil moisture and hydrology projections of the permafrost region – a model intercomparison, The Cryosphere, 14, 445–459, https://doi.org/10.5194/tc-14-445-2020, 2020.
Arksey, H. and O'Malley, L.: Scoping studies: Towards a methodological framework, Int. J. Soc. Res. Method., 8, 19–32, https://doi.org/10.1080/1364557032000119616, 2005.
Attermeyer, K., Catalán, N., Einarsdottir, K., Freixa, A., Groeneveld, M., Hawkes, J. A., Bergquist, J., and Tranvik, L. J.: Organic Carbon Processing During Transport Through Boreal Inland Waters: Particles as Important Sites, J. Geophys. Res.-Biogeo., 123, 2412–2428, https://doi.org/10.1029/2018JG004500, 2018.
Beckebanze, L., Runkle, B. R. K., Walz, J., Wille, C., Holl, D., Helbig, M., Boike, J., Sachs, T., and Kutzbach, L.: Lateral carbon export has low impact on the net ecosystem carbon balance of a polygonal tundra catchment, Biogeosciences, 19, 3863–3876, https://doi.org/10.5194/bg-19-3863-2022, 2022.
Beer, J., Lee, K., Whiticar, M., and Blodau, C.: Geochemical controls on anaerobic organic matter decomposition in a northern peatland, Limnol. Oceanogr., 53, 1393–1407, https://doi.org/10.4319/lo.2008.53.4.1393, 2008.
Biester, H., Knorr, K.-H., Schellekens, J., Basler, A., and Hermanns, Y.-M.: Comparison of different methods to determine the degree of peat decomposition in peat bogs, Biogeosciences, 11, 2691–2707, https://doi.org/10.5194/bg-11-2691-2014, 2014.
Blodau, C.: Carbon cycling in peatlands – A review of processes and controls, Environ. Rev., 10, 111–134, https://doi.org/10.1139/a02-004, 2002.
Bolan, N. S., Baskaran, S., and Thiagarajan, S.: Methods of Measurement of Dissolved Organic Carbon of Plant Origin in Soils, Manures, Sludges and Stream Water, in: Analysis of Plant Waste Materials. Modern Methods of Plant Analysis, edited by: Linskens, H. F. and Jackson, J. F., vol. 20, Springer, Berlin, Heidelberg, https://doi.org/10.1007/978-3-662-03887-1_1, 1999.
Bristol, E. M., Connolly, C. T., Lorenson, T. D., Richmond, B. M., Ilgen, A. G., Choens, R. C., Bull, D. L., Kanevskiy, M., Iwahana, G., Jones, B. M., and McClelland, J. W.: Geochemistry of Coastal Permafrost and Erosion-Driven Organic Matter Fluxes to the Beaufort Sea Near Drew Point, Alaska, Front. Earth Sci. (Lausanne), 8, https://doi.org/10.3389/feart.2020.598933, 2021.
Bröder, L., Hirst, C., Opfergelt, S., Thomas, M., Vonk, J. E., Haghipour, N., Eglinton, T. I., and Fouché, J.: Contrasting Export of Particulate Organic Carbon From Greenlandic Glacial and Nonglacial Streams, Geophys. Res. Lett., 49, e2022GL101210, https://doi.org/10.1029/2022GL101210, 2022.
Brown, J., Ferrians Jr., O. J., Heginbottom, J. A., and Melnikov, E. S.: Circum-Arctic map of permafrost and ground ice conditions, USGS Numbered Series, 1, https://doi.org/10.7265/skbg-kf16, 1997.
Bruhn, A. D., Stedmon, C. A., Comte, J., Matsuoka, A., Speetjens, N. J., Tanski, G., Vonk, J. E., and Sjöstedt, J.: Terrestrial Dissolved Organic Matter Mobilized From Eroding Permafrost Controls Microbial Community Composition and Growth in Arctic Coastal Zones, Front. Earth Sci. (Lausanne), 9, https://doi.org/10.3389/feart.2021.640580, 2021.
Burd, K., Estop-Aragonés, C., Tank, S. E., and Olefeldt, D.: Lability of dissolved organic carbon from boreal peatlands: interactions between permafrost thaw, wildfire, and season, Can. J. Soil Sci., 100, 503–515, https://doi.org/10.1139/cjss-2019-0154, 2020.
Camill, P.: Permafrost thaw accelerates in boreal peatlands during late-20th century climate warming, Climatic Change, 68, 135–152, https://doi.org/10.1007/s10584-005-4785-y, 2005.
Chen, H., Yang, Z., Chu, R. K., Tolic, N., Liang, L., Graham, D. E., Wullschleger, S. D., and Gu, B.: Molecular Insights into Arctic Soil Organic Matter Degradation under Warming, Environ. Sci. Technol., 52, 4555–4564, https://doi.org/10.1021/acs.est.7b05469, 2018.
Chong, I. G. and Jun, C. H.: Performance of some variable selection methods when multicollinearity is present, Chemo. Intel. Lab Sys., 78, 103–112, https://doi.org/10.1016/j.chemolab.2004.12.011, 2005.
Dean, J. F., Meisel, O. H., Rosco, M. M., Marchesini, L. B., Garnett, M. H., Lenderink, H., van Logtestijn, R., Borges V, A., Bouillon, S., Lambert, T., Rockmann, T., Maximov, T., Petrov, R., Karsanaev, S., Aerts, R., van Huissteden, J., Vonk, J. E., and Dolman, A. J.: East Siberian Arctic inland waters emit mostly contemporary carbon, Nat. Commun., 11, 1627, https://doi.org/10.1038/s41467-020-15511-6, 2020.
Drake, T. W., Wickland, K. P., Spencer, R. G. M., McKnight, D. M., and Striegl, R. G.: Ancient low-molecular-weight organic acids in permafrost fuel rapid carbon dioxide production upon thaw, P. Natl. Acad. Sci. USA, 112, 13946–13951, https://doi.org/10.1073/pnas.1511705112, 2015.
Ernakovich, J. G., Lynch, L. M., Brewer, P. E., Calderon, F. J., and Wallenstein, M. D.: Redox and temperature-sensitive changes in microbial communities and soil chemistry dictate greenhouse gas loss from thawed permafrost, Biogeochemistry, 134, 183–200, https://doi.org/10.1007/s10533-017-0354-5, 2017.
Estop-Aragonés, C., Olefeldt, D., Abbott, B. W., Chanton, J. P., Czimczik, C. I., Dean, J. F., Egan, J. E., Gandois, L., Garnett, M. H., Hartley, I. P., Hoyt, A., Lupascu, M., Natali, S. M., O'Donnell, J. A., Raymond, P. A., Tanentzap, A. J., Tank, S. E., Schuur, E. A. G., Turetsky, M., Anthony, K. W., Estop-Aragones, C., Olefeldt, D., Abbott, B. W., Chanton, J. P., Czimczik, C. I., Dean, J. F., Egan, J. E., Gandois, L., Garnett, M. H., Hartley, I. P., Hoyt, A., Lupascu, M., Natali, S. M., O'Donnell, J. A., Raymond, P. A., Tanentzap, A. J., Tank, S. E., Schuur, E. A. G., Turetsky, M., and Anthony, K. W.: Assessing the Potential for Mobilization of Old Soil Carbon After Permafrost Thaw: A Synthesis of 14C Measurements From the Northern Permafrost Region, Global Biogeochem. Cy., 34, e2020GB006672, https://doi.org/10.1029/2020GB006672, 2020.
Ewing, S. A., Paces, J. B., O'Donnell, J. A., Jorgenson, M. T., Kanevskiy, M. Z., Aiken, G. R., Shur, Y., Harden, J. W., and Striegl, R.: Uranium isotopes and dissolved organic carbon in loess permafrost: Modeling the age of ancient ice, Geochim. Cosmochim. Ac., 152, 143–165, https://doi.org/10.1016/j.gca.2014.11.008, 2015.
Fox, J. and Weisberg, S.: An R Companion to Applied Regression, Thousand Oaks CA: Sage, Second Edition, 123–173, https://doi.org/10.1016/j.stomax.2010.07.001, 2011.
Fritz, M., Vonk, J. E., and Lantuit, H.: Collapsing Arctic coastlines, 7, 6–7, https://doi.org/10.1038/nclimate3188, 2017.
Gentsch, N., Mikutta, R., Shibistova, O., Wild, B., Schnecker, J., Richter, A., Urich, T., Gittel, A., Šantrůčková, H., Bárta, J., Lashchinskiy, N., Mueller, C. W., Fuß, R., and Guggenberger, G.: Properties and bioavailability of particulate and mineral-associated organic matter in Arctic permafrost soils, Lower Kolyma Region, Russia, Eur. J. Soil Sci., 66, 722–734, https://doi.org/10.1111/ejss.12269, 2015.
Guggenberger, G. and Zech, W.: Dissolved organic carbon control in acid forest soils of the Fichtelgebirge (Germany) as revealed by distribution patterns and structural composition analyses, Geoderma, 59, 109–129, https://doi.org/10.1016/0016-7061(93)90065-S, 1993.
Guggenberger, G., Rodionov, A., Shibistova, O., Grabe, M., Kasansky, O. A., Fuchs, H., Mikheyeva, N., Zrazhevskaya, G., and Flessa, H.: Storage and mobility of black carbon in permafrost soils of the forest tundra ecotone in Northern Siberia, Glob. Change Biol., 14, 1367–1381, https://doi.org/10.1111/j.1365-2486.2008.01568.x, 2008.
Guo, Z., Wang, Y., Wan, Z., Zuo, Y., He, L., Li, D., Yuan, F., Wang, N., Liu, J., Song, Y., Song, C., and Xu, X.: Soil dissolved organic carbon in terrestrial ecosystems: Global budget, spatial distribution and controls, Global Ecol. Biogeogr., 29, 2159–2175, https://doi.org/10.1111/geb.13186, 2020.
Hamard, S., Robroek, B. J. M., Allard, P. M., Signarbieux, C., Zhou, S., Saesong, T., de Baaker, F., Buttler, A., Chiapusio, G., Wolfender, J. L., Bragazza, L., and Jassey, V. E. J.: Effects of Sphagnum Leachate on Competitive Sphagnum Microbiome Depend on Species and Time, Front Microbiol., 10, https://doi.org/10.3389/fmicb.2019.02042, 2019.
Hansen, A. M., Kraus, T. E. C., Pellerin, B. A., Fleck, J. A., Downing, B. D., and Bergamaschi, B. A.: Optical properties of dissolved organic matter (DOM): Effects of biological and photolytic degradation, Limnol. Oceanogr., 61, 1015–1032, https://doi.org/10.1002/lno.10270, 2016.
Heffernan, L., Estop-Aragonés, C., Knorr, K.-H., Talbot, J., and Olefeldt, D.: Long-term impacts of permafrost thaw on carbon storage in peatlands: deep losses offset by surficial accumulation, J. Geophys. Res.-Biogeo., 2011, e2019JG005501, https://doi.org/10.1029/2019JG005501, 2020.
Heffernan, L., Kothawala, D. N., and Tranvik, L. J.: Terrestrial dissolved organic carbon in northern permafrost from 2000–2022, Dataset version 1, Bolin Centre Database [data set], https://doi.org/10.17043/heffernan-2024-doc-1, 2024.
Hirst, C., Mauclet, E., Monhonval, A., Tihon, E., Ledman, J., Schuur, E. A. G., and Opfergelt, S.: Seasonal Changes in Hydrology and Permafrost Degradation Control Mineral Element-Bound DOC Transport From Permafrost Soils to Streams, Global Biogeochem. Cy., 36, e2021GB007105, https://doi.org/10.1029/2021GB007105, 2022.
Holmes, R. M., McClelland, J. W., Peterson, B. J., Tank, S. E., Bulygina, E., Eglinton, T. I., Gordeev, V. V, Gurtovaya, T. Y., Raymond, P. A., Repeta, D. J., Staples, R., Striegl, R. G., Zhulidov, A. V, and Zimov, S. A.: Seasonal and Annual Fluxes of Nutrients and Organic Matter from Large Rivers to the Arctic Ocean and Surrounding Seas, Estuar. Coast., 35, 369–382, https://doi.org/10.1007/s12237-011-9386-6, 2012.
Hugelius, G., Strauss, J., Zubrzycki, S., Harden, J. W., Schuur, E. A. G., Ping, C.-L., Schirrmeister, L., Grosse, G., Michaelson, G. J., Koven, C. D., O'Donnell, J. A., Elberling, B., Mishra, U., Camill, P., Yu, Z., Palmtag, J., and Kuhry, P.: Estimated stocks of circumpolar permafrost carbon with quantified uncertainty ranges and identified data gaps, Biogeosciences, 11, 6573–6593, https://doi.org/10.5194/bg-11-6573-2014, 2014.
Hugelius, G., Loisel, J., Chadburn, S., Jackson, R. B., Jones, M., MacDonald, G., Marushchak, M., Olefeldt, D., Packalen, M., Siewert, M. B., Treat, C., Turetsky, M., Voigt, C., and Yu, Z.: Large stocks of peatland carbon and nitrogen are vulnerable to permafrost thaw, P. Natl. Acad. Sci. USA, 117, 20438–20446, https://doi.org/10.1073/pnas.1916387117, 2020.
Hultman, J., Waldrop, M. P., Mackelprang, R., David, M. M., McFarland, J., Blazewicz, S. J., Harden, J., Turetsky, M. R., McGuire, A. D., Shah, M. B., VerBerkmoes, N. C., Lee, L. H., Mavrommatis, K., and Jansson, J. K.: Multi-omics of permafrost, active layer and thermokarst bog soil microbiomes, Nature, 521, 208–212, https://doi.org/10.1038/nature14238, 2015.
Jorgenson, M. T., Shur, Y. L., and Pullman, E. R.: Abrupt increase in permafrost degradation in Arctic Alaska, Geophys. Res. Lett., 33, L02503, https://doi.org/10.1029/2005GL024960, 2006.
Kalbitz, K., Solinger, S., Park, J.-H. Michalzik, B., and Matzner, E.: Controls on the dynamics of dissolved organic matter in soils: a review, Soil Sci., 165, 277–304, https://doi.org/10.1097/00010694-200004000-00001, 2000.
Kane, E. S., Valentine, D. W., Michaelson, G. J., Fox, J. D., and Ping, C.-L.: Controls over pathways of carbon efflux from soils along climate and black spruce productivity gradients in interior Alaska, Soil Biol. Biochem., 38, 1438–1450, https://doi.org/10.1016/j.soilbio.2005.11.004, 2006.
Kawahigashi, M., Kaiser, K., Rodionov, A., and Guggenberger, G.: Sorption of dissolved organic matter by mineral soils of the Siberian forest tundra, Glob. Change Biol., 12, 1868–1877, https://doi.org/10.1111/j.1365-2486.2006.01203.x, 2006.
Kawahigashi, M., Prokushkin, A., and Sumida, H.: Effect of fire on solute release from organic horizons under larch forest in Central Siberian permafrost terrain, Geoderma, 166, 171–180, https://doi.org/10.1016/j.geoderma.2011.07.027, 2011.
Keskitalo, K. H., Bröder, L., Shakil, S., Zolkos, S., Tank, S. E., van Dongen, B. E., Tesi, T., Haghipour, N., Eglinton, T. I., Kokelj, S. V., and Vonk, J. E.: Downstream Evolution of Particulate Organic Matter Composition From Permafrost Thaw Slumps, Front. Earth Sci.. (Lausanne), 9, https://doi.org/10.3389/feart.2021.642675, 2021.
Lajeunesse, M. J.: On the meta-analysis of response ratios for studies with correlated and multi-group designs, Ecology, 92, 2049–2055, https://doi.org/10.1890/11-0423.1, 2011.
Lajtha, K., Crow, S. E., Yano, Y., Kaushal, S. S., Sulzman, E., Sollins, P., and Spears, J. D. H.: Detrital controls on soil solution N and dissolved organic matter in soils: A field experiment, Biogeochemistry, 76, 261–281, https://doi.org/10.1007/s10533-005-5071-9, 2005.
Langeveld, J., Bouwman, A. F., van Hoek, W. J., Vilmin, L., Beusen, A. H. W., Mogollón, J. M., and Middelburg, J. J.: Estimating dissolved carbon concentrations in global soils: a global database and model, SN Appl. Sci., 2, 1626, https://doi.org/10.1007/s42452-020-03290-0, 2020.
Lantuit, H., Overduin, P. P., Couture, N., Wetterich, S., Aré, F., Atkinson, D., Brown, J., Cherkashov, G., Drozdov, D. S., Forbes, D. L., Graves-Gaylord, A., Grigoriev, M., Hubberten, H.-W., Jordan, J., Jorgenson, T., Ødegård, R. S., Ogorodov, S., Pollard, W. H., Rachold, V., Sedenko, S., Solomon, S., Steenhuisen, F., Streletskaya, I., and Vasiliev, A. A.: The arctic coastal dynamics database: A new classification scheme and statistics on Arctic permafrost coastlines, Estuar. Coast., 35, 383–400, https://doi.org/10.1007/s12237-010-9362-6, 2012.
Lara, M. J., Nitze, I., Grosse, G., Martin, P., and David McGuire, A.: Reduced arctic tundra productivity linked with landform and climate change interactions, Sci. Rep., 8, 2345, https://doi.org/10.1038/s41598-018-20692-8, 2018.
Liljedahl, A. K., Boike, J., Daanen, R. P., Fedorov, A. N., Frost, G. V., Grosse, G., Hinzman, L. D., Iijma, Y., Jorgenson, J. C., Matveyeva, N., Necsoiu, M., Raynolds, M. K., Romanovsky, V. E., Schulla, J., Tape, K. D., Walker, D. A., Wilson, C. J., Yabuki, H., and Zona, D.: Pan-Arctic ice-wedge degradation in warming permafrost and its influence on tundra hydrology, Nat. Geosci., 9, 312–318, https://doi.org/10.1038/ngeo2674, 2016.
Lim, A. G., Loiko, S. V, Kuzmina, D. M., Krickov, I. V, Shirokova, L. S., Kulizhsky, S. P., Vorobyev, S. N., and Pokrovsky, O. S.: Dispersed ground ice of permafrost peatlands: Potential unaccounted carbon, nutrient and metal sources., Chemosphere, 266, 128953, https://doi.org/10.1016/j.chemosphere.2020.128953, 2021.
Limpens, J., Bohlin, E., and Nilsson, M. B.: Phylogenetic or environmental control on the elemental and organo-chemical composition of Sphagnum mosses?, Plant Soil, 417, 69–85, https://doi.org/10.1007/s11104-017-3239-4, 2017.
Loiko, S. V, Pokrovsky, O. S., Raudina, T. V, Lim, A., Kolesnichenko, L. G., Shirokova, L. S., Vorobyev, S. N., and Kirpotin, S. N.: Abrupt permafrost collapse enhances organic carbon, CO2, nutrient and metal release into surface waters, Chem. Geol., 471, 153–165, https://doi.org/10.1016/j.chemgeo.2017.10.002, 2017.
Ma, Q., Jin, H., Yu, C., and Bense, V. F.: Dissolved organic carbon in permafrost regions: A review, Science China Earth Sciences, 62, 349–364, https://doi.org/10.1007/s11430-018-9309-6, 2019.
MacDonald, E. N., Tank, S. E., Kokelj, S. V., Froese, D. G., and Hutchins, R. H. S.: Permafrost-derived dissolved organic matter composition varies across permafrost end-members in the western Canadian Arctic, Environ. Res. Lett., 16, 024036, https://doi.org/10.1088/1748-9326/abd971, 2021.
Manies, K. L., Jones, M. C., Waldrop, M. P., Leewis, M. C., Fuller, C., Cornman, R. S., and Hoefke, K.: Influence of Permafrost Type and Site History on Losses of Permafrost Carbon After Thaw, J. Geophys. Res.-Biogeo., 126, e2021JG006396, https://doi.org/10.1029/2021JG006396, 2021.
Marschner, B. and Bredow, A.: Temperature effects on release and ecologically relevant properties of dissolved organic carbon in sterilised and biologically active soil samples, Soil Biol. Biochem., 34, 459–466, https://doi.org/10.1016/S0038-0717(01)00203-6, 2002.
McGuire, A. D., Lawrence, D. M., Koven, C., Clein, J. S., Burke, E., Chen, G., Jafarov, E., MacDougall, A. H., Marchenko, S., Nicolsky, D., Peng, S., Rinke, A., Ciais, P., Gouttevin, I., Hayes, D. J., Ji, D., Krinner, G., Moore, J. C., Romanovsky, V., Schädel, C., Schaefer, K., Schuur, E. A. G., and Zhuang, Q.: Dependence of the evolution of carbon dynamics in the northern permafrost region on the trajectory of climate change, P. Natl. Acad. Sci. USA, 115, 3882–3887, https://doi.org/10.1073/pnas.1719903115, 2018.
Mehmood, T., Liland, K. H., Snipen, L., and Sæbø, S.: A review of variable selection methods in Partial Least Squares Regression, Chemometr. Intell. Lab., 118, 62–69, https://doi.org/10.1016/j.chemolab.2012.07.010, 2012.
Mevik, B. H. and Wehrens, R.: The pls package: Principal component and partial least squares regression in R, J. Stat. Softw., 18, 1–23, https://doi.org/10.18637/jss.v018.i02, 2007.
Miner, K. R., Turetsky, M. R., Malina, E., Bartsch, A., Tamminen, J., McGuire, A. D., Fix, A., Sweeney, C., Elder, C. D., and Miller, C. E.: Permafrost carbon emissions in a changing Arctic, Nature Reviews Earth & Environment, 3, 55–67, https://doi.org/10.1038/s43017-021-00230-3, 2022.
Mohammed, A. A., Guimond, J. A., Bense, V. F., Jamieson, R. C., McKenzie, J. M., and Kurylyk, B. L.: Mobilization of subsurface carbon pools driven by permafrost thaw and reactivation of groundwater flow: a virtual experiment, Environ. Res. Lett., 17, 124036, https://doi.org/10.1088/1748-9326/ACA701, 2022.
Monteux, S., Weedon, J. T., Blume-Werry, G., Gavazov, K., Jassey, V. E. J., Johansson, M., Keuper, F., Olid, C., and Dorrepaal, E.: Long-term in situ permafrost thaw effects on bacterial communities and potential aerobic respiration, ISME Journal, 12, 2129–2141, https://doi.org/10.1038/s41396-018-0176-z, 2018.
Moore, T. R. and Dalva, M.: Some controls on the release of dissolved organic carbon by plant tissues and soils, Soil Sci., 166, 38–47, https://doi.org/10.1097/00010694-200101000-00007, 2001.
Neff, J. C. and Hooper, D. U.: Vegetation and climate controls on potential CO2, DOC and DON production in northern latitude soils, Glob. Change Biol., 8, 872–884, https://doi.org/10.1046/j.1365-2486.2002.00517.x, 2002.
Nielsen, C. S., Michelsen, A., Strobel, B. W., Wulff, K., Banyasz, I., and Elberling, B.: Correlations between substrate availability, dissolved CH4, and CH4 emissions in an arctic wetland subject to warming and plant removal, J. Geophys. Res.-Biogeo., 122, 645–660, https://doi.org/10.1002/2016JG003511, 2017.
O'Donnell, J. A., Aiken, G. R., Butler, K. D., Guillemette, F., Podgorski, D. C., and Spencer, R. G. M.: DOM composition and transformation in boreal forest soils: The effects of temperature and organic-horizon decomposition state, J. Geophys. Res.-Biogeo., 121, 2727–2744, https://doi.org/10.1002/2016JG003431, 2016.
Olefeldt, D. and Roulet, N. T.: Effects of permafrost and hydrology on the composition and transport of dissolved organic carbon in a subarctic peatland complex, J. Geophys. Res.-Biogeo., 117, G01005, https://doi.org/10.1029/2011JG001819, 2012.
Olefeldt, D. and Roulet, N. T.: Permafrost conditions in peatlands regulate magnitude, timing, and chemical composition of catchment dissolved organic carbon export, Glob. Change Biol., 20, 3122–3136, https://doi.org/10.1111/gcb.12607, 2014.
Olefeldt, D., Roulet, N. T., Bergeron, O., Crill, P., Bäckstrand, K., and Christensen, T. R.: Net carbon accumulation of a high-latitude permafrost palsa mire similar to permafrost-free peatlands, Geophys. Res. Lett., 39, L03501, https://doi.org/10.1029/2011GL050355, 2012.
Olefeldt, D., Goswami, S., Grosse, G., Hayes, D., Hugelius, G., Kuhry, P., Mcguire, A. D., Romanovsky, V. E., Sannel, A. B. K., Schuur, E. A. G., and Turetsky, M. R.: Circumpolar distribution and carbon storage of thermokarst landscapes, Nat. Commun., 7, 1–11, https://doi.org/10.1038/ncomms13043, 2016.
Olefeldt, D., Heffernan, L., Jones, M. C., Sannel, A. B. K., Treat, C. C., and Turetsky, M. R.: Permafrost Thaw in Northern Peatlands: Rapid Changes in Ecosystem and Landscape Functions, in: Ecosystem Collapse and Climate Change, Springer, 27–67, https://doi.org/10.1007/978-3-030-71330-0_3, 2021.
Olson, D. M., Dinerstein, E., Wikramanayake, E. D., Burgess, N. D., Powell, G. V. N., Underwood, E. C., D'amico, J. A., Itoua, I., Strand, H. E., Morrison, J. C., Loucks, C. J., Allnutt, T. F., Ricketts, T. H., Kura, Y., Lamoreux, J. F., Wettengel, W. W., Hedao, P., and Kassem, K. R.: Terrestrial Ecoregions of the World: A New Map of Life on Earth: A new global map of terrestrial ecoregions provides an innovative tool for conserving biodiversity, Bioscience, 51, 933–938, https://doi.org/10.1641/0006-3568(2001)051[0933:TEOTWA]2.0.CO;2, 2001.
Olsrud, M. and Christensen, T. R.: Carbon partitioning in a wet and a semiwet subarctic mire ecosystem based on in situ 14C pulse-labelling, Soil Biol. Biochem., 43, 231–239, https://doi.org/10.1016/j.soilbio.2010.09.034, 2011.
Parmentier, F.-J. W., Christensen, T. R., Rysgaard, S., Bendtsen, J., Glud, R. N., Else, B., van Huissteden, J., Sachs, T., Vonk, J. E., and Sejr, M. K.: A synthesis of the arctic terrestrial and marine carbon cycles under pressure from a dwindling cryosphere, Ambio, 46, 53–69, https://doi.org/10.1007/s13280-016-0872-8, 2017.
Payandi-Rolland, D., Shirokova, L. S., Nakhle, P., Tesfa, M., Abdou, A., Causserand, C., Lartiges, B., Rols, J.-L., Guerin, F., Benezeth, P., and Pokrovsky, O. S.: Aerobic release and biodegradation of dissolved organic matter from frozen peat: Effects of temperature and heterotrophic bacteria, Chem. Geol., 536, 119448, https://doi.org/10.1016/j.chemgeo.2019.119448, 2020.
Peacock, M., Futter, M. N., Jutterström, S., Kothawala, D. N., Moldan, F., Stadmark, J., and Evans, C. D.: Three Decades of Changing Nutrient Stoichiometry from Source to Sea on the Swedish West Coast, Ecosystems, 25, 1809–1824, https://doi.org/10.1007/s10021-022-00798-x, 2022.
Pries, C. E. H., Schuur, E. A. G., and Crummer, K. G.: Holocene Carbon Stocks and Carbon Accumulation Rates Altered in Soils Undergoing Permafrost Thaw, Ecosystems, 15, 162–173, https://doi.org/10.1007/s10021-011-9500-4, 2012.
Prokushkin, A. S., Kajimoto, T., Prokushkin, S. G., McDowell, W. H., Abaimov, A. P., and Matsuura, Y.: Climatic factors influencing fluxes of dissolved organic carbon from the forest floor in a continuous-permafrost Siberian watershed, Can. J. Forest Res., 35, 2130–2140, https://doi.org/10.1139/X05-150, 2005.
Prokushkin, A. S., Gavrilenko, I. V., Abaimov, A. P., Prokushkin, S. G., and Samusenko, A. V.: Dissolved organic carbon in upland forested watersheds underlain by continuous permafrost in Central Siberia, Mitig. Adapt. Strateg. Glob. Chang., 11, 223–240, https://doi.org/10.1007/s11027-006-1022-6, 2006.
Prokushkin, A. S., Kawahigashi, M., and Tokareva, I. V.: Global Warming and Dissolved Organic Carbon Release from Permafrost Soils, in: Permafrost Soils, Springer, 237–250, https://doi.org/10.1007/978-3-540-69371-0_16, 2008.
Pustejovsky, J. E., Chen, M., Grekov, P., and Swan, D. M.: SingleCaseES: A calculator for single-case effect size indices (Version 0.7.2), GitHub [software], https://jepusto.github.io/SingleCaseES/ (last access: 27 March 2024), 2021.
Quinton, W. L., Hayashi, M., and Pietroniro, A.: Connectivity and storage functions of channel fens and flat bogs in northern basins, Hydrol. Process., 17, 3665–3684, https://doi.org/10.1002/hyp.1369, 2003.
Rantanen, M., Karpechko, A., Lipponen, A., Nordling, K., Hyvärinen, O., Ruosteenoja, K., Vihma, T., and Laaksonen, A.: The Arctic has warmed four times faster than the globe since 1980, Commun. Earth Environ., 3, 168, https://doi.org/10.1038/s43247-022-00498-3, 2021.
Raymond, P. A., McClelland, J. W., Holmes, R. M., Zhulidov, A. V., Mull, K., Peterson, B. J., Striegl, R. G., Aiken, G. R., and Gurtovaya, T. Y.: Flux and age of dissolved organic carbon exported to the Arctic Ocean: A carbon isotopic study of the five largest arctic rivers, Global Biogeochem. Cy., 21, GB4011, https://doi.org/10.1029/2007GB002934, 2007.
R Core Team: R: A language and environment for statistical computing, Vienna, Austria, 2014, R Foundation for Statistical Computing, https://doi.org/10.1007/978-3-540-74686-7, 2015.
Ripley, B., Venables, B., Bates, D. M., Hornik, K., Gebhardt, A., and Firth, D.: Package “MASS” (Version 7.3-51.4), Cran-R Project, http://www.stats.ox.ac.uk/pub/MASS4/ (last access: 12 December 2022), 2019.
Schaefer, K., Lantuit, H., Romanovsky, V. E., Schuur, E. A. G., and Witt, R.: The impact of the permafrost carbon feedback on global climate, Environ. Res. Lett., 9, 085003, https://doi.org/10.1088/1748-9326/9/8/085003, 2014.
Schuur, E. A. G., Bracho, R., Celis, G., Belshe, E. F., Ebert, C., Ledman, J., Mauritz, M., Pegoraro, E. F., Plaza, C., Rodenhizer, H., Romanovsky, V., Schädel, C., Schirokauer, D., Taylor, M., Vogel, J. G., and Webb, E. E.: Tundra Underlain By Thawing Permafrost Persistently Emits Carbon to the Atmosphere Over 15 Years of Measurements, J. Geophys. Res.-Biogeo., 126, e2020JG006044, https://doi.org/10.1029/2020jg006044, 2021.
Schuur, E. A. G., Abbott, B. W., Commane, R., Ernakovich, J., Euskirchen, E., Hugelius, G., Grosse, G., Jones, M., Koven, C., Leshyk, V., Lawrence, D., Loranty, M. M., Mauritz, M., Olefeldt, D., Natali, S., Rodenhizer, H., Salmon, V., Schädel, C., Strauss, J., Treat, C., and Turetsky, M.: Permafrost and climate change: Carbon cycle feed-backs from the warming arctic, Annu. Rev. Environ. Resour., 47, 343–371, https://doi.org/10.1146/annurev-environ-012220-011847, 2022.
Schuur, T., McGuire, A. D., Romanovsky, V., Schädel, C., and Mack, M.: Chapter 11: Arctic and Boreal Carbon. Second State of the Carbon Cycle Report, Second State of the Carbon Cycle Report (SOCCR2): A Sustained Assessment Report, 428–468, https://doi.org/10.7930/SOCCR2.2018.Ch11, 2018.
Selvam, B. P., Lapierre, J.-F., Guillemette, F., Voigt, C., Lamprecht, R. E., Biasi, C., Christensen, T. R., Martikainen, P. J., and Berggren, M.: Degradation potentials of dissolved organic carbon (DOC) from thawed permafrost peat, Sci. Rep., 7, 45811, https://doi.org/10.1038/srep45811, 2017.
Semenchuk, P. R., Elberling, B., Amtorp, C., Winkler, J., Rumpf, S., Michelsen, A., and Cooper, E. J.: Deeper snow alters soil nutrient availability and leaf nutrient status in high Arctic tundra, Biogeochemistry, 124, 81–94, https://doi.org/10.1007/s10533-015-0082-7, 2015.
Shakil, S., Tank, S. E., Kokelj, S. V., Vonk, J. E., and Zolkos, S.: Particulate dominance of organic carbon mobilization from thaw slumps on the Peel Plateau, NT: Quantification and implications for stream systems and permafrost carbon release, Environ. Res. Lett., 15, 114019, https://doi.org/10.1088/1748-9326/abac36, 2020.
Sobek, S., Tranvik, L. J., Prairie, Y. T., Kortelainen, P., and Cole, J. J.: Patterns and regulation of dissolved organic carbon: An analysis of 7,500 widely distributed lakes, Limnol. Oceanogr., 52, 1208–1219, https://doi.org/10.4319/lo.2007.52.3.1208, 2007.
Speetjens, N. J., Tanski, G., Martin, V., Wagner, J., Richter, A., Hugelius, G., Boucher, C., Lodi, R., Knoblauch, C., Koch, B. P., Wünsch, U., Lantuit, H., and Vonk, J. E.: Dissolved organic matter characterization in soils and streams in a small coastal low-Arctic catchment, Biogeosciences, 19, 3073–3097, https://doi.org/10.5194/bg-19-3073-2022, 2022.
Stolpmann, L., Coch, C., Morgenstern, A., Boike, J., Fritz, M., Herzschuh, U., Stoof-Leichsenring, K., Dvornikov, Y., Heim, B., Lenz, J., Larsen, A., Walter Anthony, K., Jones, B., Frey, K., and Grosse, G.: First pan-Arctic assessment of dissolved organic carbon in lakes of the permafrost region, Biogeosciences, 18, 3917–3936, https://doi.org/10.5194/bg-18-3917-2021, 2021.
Strauss, J., Laboor, S., Schirrmeister, L., Fedorov, A. N., Fortier, D., Froese, D., Fuchs, M., Günther, F., Grigoriev, M., Harden, J., Hugelius, G., Jongejans, L. L., Kanevskiy, M., Kholodov, A., Kunitsky, V., Kraev, G., Lozhkin, A., Rivkina, E., Shur, Y., Siegert, C., Spektor, V., Streletskaya, I., Ulrich, M., Vartanyan, S., Veremeeva, A., Anthony, K. W., Wetterich, S., Zimov, N., and Grosse, G.: Circum-Arctic Map of the Yedoma Permafrost Domain, Front. Earth Sci. (Lausanne), 9, https://doi.org/10.3389/feart.2021.758360, 2021.
Stutter, M. I. and Billett, M. F.: Biogeochemical controls on streamwater and soil solution chemistry in a High Arctic environment, Geoderma, 113, 127–146, https://doi.org/10.1016/S0016-7061(02)00335-X, 2003.
Tank, S. E., Frey, K. E., Striegl, R. G., Raymond, P. A., Holmes, R. M., McClelland, J. W., and Peterson, B. J.: Landscape-level controls on dissolved carbon flux from diverse catchments of the circumboreal, Global Biogeochem. Cy., 26, GB0E02, https://doi.org/10.1029/2012GB004299, 2012.
Tanski, G., Lantuit, H., Ruttor, S., Knoblauch, C., Radosavljevic, B., Strauss, J., Wolter, J., Irrgang, A. M., Ramage, J., and Fritz, M.: Transformation of terrestrial organic matter along thermokarst-affected permafrost coasts in the Arctic, Sci. Total Environ., 581–582, 434–447, https://doi.org/10.1016/j.scitotenv.2016.12.152, 2017.
Tanski, G., Wagner, D., Knoblauch, C., Fritz, M., Sachs, T., and Lantuit, H.: Rapid CO2 Release From Eroding Permafrost in Seawater, Geophys. Res. Lett., 46, 11244–11252, https://doi.org/10.1029/2019GL084303, 2019.
Tanski, G., Bröder, L., Wagner, D., Knoblauch, C., Lantuit, H., Beer, C., Sachs, T., Fritz, M., Tesi, T., Koch, B. P., Haghipour, N., Eglinton, T. I., Strauss, J., and Vonk, J. E.: Permafrost Carbon and CO2 Pathways Differ at Contrasting Coastal Erosion Sites in the Canadian Arctic, Front. Earth Sci. (Lausanne), 9, https://doi.org/10.3389/feart.2021.630493, 2021.
Textor, S. R., Wickland, K. P., Podgorski, D. C., Johnston, S. E., and Spencer, R. G. M.: Dissolved Organic Carbon Turnover in Permafrost-Influenced Watersheds of Interior Alaska: Molecular Insights and the Priming Effect, Front. Earth Sci. (Lausanne), 7, https://doi.org/10.3389/feart.2019.00275, 2019.
Tfaily, M. M., Hamdan, R., Corbett, J. E., Chanton, J. P., Glaser, P. H., and Cooper, W. T.: Investigating dissolved organic matter decomposition in northern peatlands using complimentary analytical techniques, Geochim. Cosmochim. Ac., 112, 116–129, https://doi.org/10.1016/j.gca.2013.03.002, 2013.
Thurman, E. M.: Organic geochemistry of natural waters, Springer Science & Business Media, 2, 1985.
Treat, C. C. and Jones, M. C.: Near-surface permafrost aggradation in Northern Hemisphere peatlands shows regional and global trends during the past 6000 years, Holocene, 28, https://doi.org/10.1177/0959683617752858, 2018.
Treat, C. C., Jones, M. C., Camill, P., Gallego-Sala, A., Garneau, M., Harden, J. W., Hugelius, G., Klein, E. S., Kokfelt, U., Kuhry, P., Loisel, J., Mathijssen, P. J. H., O'Donnell, J. A., Oksanen, P. O., Ronkainen, T. M., Sannel, A. B. K., Talbot, J., Tarnocai, C., and Väliranta, M.: Effects of permafrost aggradation on peat properties as determined from a pan-Arctic synthesis of plant macrofossils, J. Geophys. Res.-Biogeo., 121, 78–94, https://doi.org/10.1002/2015JG003061, 2016.
Trusiak, A., Treibergs, L. A., Kling, G. W., and Cory, R. M.: The role of iron and reactive oxygen species in the production of CO2 in arctic soil waters, Geochim. Cosmochim. Ac., 224, 80–95, https://doi.org/10.1016/j.gca.2017.12.022, 2018.
Turetsky, M. R., Abbott, B. W., Jones, M. C., Anthony, K. W., Olefeldt, D., Schuur, E. A. G., Grosse, G., Kuhry, P., Hugelius, G., Koven, C., Lawrence, D. M., Gibson, C., Sannel, A. B. K., and McGuire, A. D.: Carbon release through abrupt permafrost thaw, Nat. Geosci., 13, 138–143, https://doi.org/10.1038/s41561-019-0526-0, 2020.
USDA: Soil Taxonomy: A Basic System of Soil Classification for Making and Interpreting Soil Surveys, 2nd edn., ISBN-10 0160608295, ISBN-13 978-0160608292, 1999.
Varner, R. K., Crill, P. M., Frolking, S., McCalley, C. K., Burke, S. A., Chanton, J. P., Holmes, M. E., Saleska, S., and Palace, M. W.: Permafrost thaw driven changes in hydrology and vegetation cover increase trace gas emissions and climate forcing in Stordalen Mire from 1970 to 2014, Philos. T. Roy. Soc. A, 380, https://doi.org/10.1098/rsta.2021.0022, 2022.
Vonk, J. E. and Gustafsson, Ö.: Permafrost-carbon complexities, Nat. Geosci., 6, 675–676, https://doi.org/10.1038/ngeo1937, 2013.
Vonk, J. E., Mann, P. J., Davydov, S., Davydova, A., Spencer, R. G. M., Schade, J., Sobczak, W. V, Zimov, N., Zimov, S., Bulygina, E., Eglinton, T. I., and Holmes, R. M.: High biolability of ancient permafrost carbon upon thaw, Geophys. Res. Lett., 40, 2689–2693, https://doi.org/10.1002/grl.50348, 2013.
Vonk, J. E., Tank, S. E., Mann, P. J., Spencer, R. G. M., Treat, C. C., Striegl, R. G., Abbott, B. W., and Wickland, K. P.: Biodegradability of dissolved organic carbon in permafrost soils and aquatic systems: a meta-analysis, Biogeosciences, 12, 6915–6930, https://doi.org/10.5194/bg-12-6915-2015, 2015.
Wang, C., Wang, Z., Kong, Y., Zhang, F., Yang, K., and Zhang, T.: Most of the Northern Hemisphere Permafrost Remains under Climate Change, Sci. Rep., 9, 3295, https://doi.org/10.1038/s41598-019-39942-4, 2019.
Weishaar, J. L., Aiken, G. R., Bergamaschi, B. A., Fram, M. S., Fujii, R., and Mopper, K.: Evaluation of specific ultraviolet absorbance as an indicator of the chemical composition and reactivity of dissolved organic carbon, Environ. Sci. Technol., 37, 4702–4708, https://doi.org/10.1021/es030360x, 2003.
Weyhenmeyer, G. A., Fröberg, M., Karltun, E., Khalili, M., Kothawala, D., Temnerud, J., and Tranvik, L. J.: Selective decay of terrestrial organic carbon during transport from land to sea, Glob. Change Biol., 18, 349–355, https://doi.org/10.1111/j.1365-2486.2011.02544.x, 2012.
Wickland, K. P., Neff, J. C., and Aiken, G. R.: Dissolved organic carbon in Alaskan boreal forest: Sources, chemical characteristics, and biodegradability, Ecosystems, 10, 1323–1340, https://doi.org/10.1007/s10021-007-9101-4, 2007.
Wickland, K. P., Waldrop, M. P., Aiken, G. R., Koch, J. C., Jorgenson, Mt., and Striegl, R. G.: Dissolved organic carbon and nitrogen release from boreal Holocene permafrost and seasonally frozen soils of Alaska, Environ. Res. Lett., 13, 065011, https://doi.org/10.1088/1748-9326/aac4ad, 2018.
Wild, B., Schnecker, J., Bárta, J., Čapek, P., Guggenberger, G., Hofhansl, F., Kaiser, C., Lashchinsky, N., Mikutta, R., Mooshammer, M., Šantrůčková, H., Shibistova, O., Urich, T., Zimov, S. A., and Richter, A.: Nitrogen dynamics in Turbic Cryosols from Siberia and Greenland, Soil Biol. Biochem., 67, 85–93, https://doi.org/10.1016/j.soilbio.2013.08.004, 2013.
Wild, B., Gentsch, N., Capek, P., Diáková, K., Alves, R. J. E., Bárta, J., Gittel, A., Hugelius, G., Knoltsch, A., Kuhry, P., Lashchinskiy, N., Mikutta, R., Palmtag, J., Schleper, C., Schnecker, J., Shibistova, O., Takriti, M., Torsvik, V. L., Urich, T., Watzka, M., Šantrůčková, H., Guggenberger, G., and Richter, A.: Plant-derived compounds stimulate the decomposition of organic matter in arctic permafrost soils, Sci. Rep., 6, 25607, https://doi.org/10.1038/srep25607, 2016.
Wild, B., Andersson, A., Broder, L., Vonk, J., Hugelius, G., McClelland, J. W., Song, W., Raymond, P. A., and Gustafsson, O.: Rivers across the Siberian Arctic unearth the patterns of carbon release from thawing permafrost, P. Natl. Acad. Sci. USA, 116, 10280–10285, https://doi.org/10.1073/pnas.1811797116, 2019.