the Creative Commons Attribution 4.0 License.
the Creative Commons Attribution 4.0 License.
 | 20 Dec 2023
Annual to seasonal glacier mass balance in High Mountain Asia derived from Pléiades stereo images: examples from the Pamir and the Tibetan Plateau
Daniel Falaschi
Atanu Bhattacharya
Gregoire Guillet
Lei Huang
Owen King
Kriti Mukherjee
Philipp Rastner
Tandong Yao
Tobias Bolch
Glaciers are crucial sources of freshwater in particular for the arid lowlands surrounding High Mountain Asia. To better constrain glacio-hydrological models, annual, or even better, seasonal information about glacier mass changes is highly beneficial. In this study, we evaluate the suitability of very-high-resolution Pléiades digital elevation models (DEMs) to measure glacier mass balance at annual and seasonal scales in two regions of High Mountain Asia (Muztagh Ata in Eastern Pamirs and parts of western Nyainqêntanglha, south-central Tibetan Plateau), where recent estimates have shown contrasting glacier behaviour. The average annual mass balance in Muztagh Ata between 2019 and 2022 was −0.07 ± 0.20 m w.e. a−1, suggesting the continuation of a recent phase of slight mass loss following a prolonged period of balanced mass budgets previously observed. The mean annual mass balance in western Nyainqêntanglha was highly negative for the same period (−0.60 ± 0.15 m w.e. a−1), suggesting increased mass loss rates compared to the approximately previous 5 decades. The 2022 winter (+0.13 ± 0.24 m w.e.) and summer (−0.35 ± 0.15 m w.e.) mass budgets in Muztagh Ata and western Nyainqêntanglha (−0.03 ± 0.27 m w.e. in winter; −0.63 ± 0.07 m w.e. in summer) suggest winter- and summer-accumulation-type regimes, respectively. We support our findings by implementing the Sentinel-1-based Glacier Index to identify the firn and wet-snow areas on glaciers and characterize the accumulation type. The good match between the geodetic and Glacier Index results supports the potential of very-high-resolution Pléiades data to monitor mass balance at short timescales and improves our understanding of glacier accumulation regimes across High Mountain Asia.
- Article
(11830 KB) - Full-text XML
-
Supplement
(945 KB) - BibTeX
- EndNote


Fluctuations in glaciers across High Mountain Asia are at the core of both scientific and public debate due to the glaciers' major relevance as sources of freshwater for human consumption, their regulatory role in river runoff, and their contribution to sea level rise (Bolch et al., 2012; Immerzeel et al., 2020; Vishwakarma et al., 2022; Yao et al., 2022). In addition, reliable information on glacier accumulation regimes is fundamental for a better understanding of the hydrological cycle and glacier sensitivity to climate variability (Sakai et al., 2015). The combination of varying climatic and accumulation regimes (Yao et al., 2012; Huang et al., 2022), debris-cover fraction (Scherler et al., 2018), glacier surges (Farinotti et al., 2020; King et al., 2021; Guillet et al., 2022), the presence of supra-glacial and proglacial lakes (Brun et al., 2019; Maurer et al., 2016; King et al., 2019), and inherent dynamic factors interact with ongoing climate change (Armstrong et al., 2022) and result in spatially and temporally variable mass loss rates and flow velocity (Brun et al., 2019; Dehecq et al., 2019). In recent decades, however, consistent increases in glacier wastage have been observed throughout most of High Mountain Asia (Bhattacharya et al., 2021a; Hugonnet et al., 2021a). The most notable exception to this trend is represented by the glaciers within the “Pamir–Karakorum” anomaly, which further extends into Eastern Pamir and the western Kunlun Shan (Kääb et al., 2015; Liang et al., 2022). In this region, glaciers have been in balance or have had slight mass gains since at least the 1970s (Kääb et al., 2015; Bolch et al., 2017, 2019a; Brun et al., 2017; Berthier and Brun, 2019). Recent research, however, hints at an end to this anomaly (Bhattacharya et al., 2021a; Hugonnet et al., 2021a). Monitoring glacier changes from both remotely sensed and in situ observations has thus been fundamental for an improved understanding of the relation between climate change and glaciers, and has yielded solid evidence of glacier mass loss worldwide (Zemp et al., 2015; Hugonnet et al., 2021a).
The measurement of a glacier mass budget involves the summation of accumulation and ablation over a specific period (Cogley et al., 2011). Presently, the two most widely used methods for determining glacier mass balance are the glaciological and geodetic methods (Cogley, 2009). The glaciological method measures surface mass balance, typically on a seasonal scale, using a combination of distributed snow pits and stakes to measure accumulation and ablation, respectively (Cogley, 2009). The geodetic method consists of the differentiation of multi-temporal and often multi-sourced elevation data (in most cases derived from digital elevation models – DEMs), usually covering longer time intervals (≥5 years) and larger regions compared to the glaciological method (e.g. Braun et al., 2019; Dussaillant et al., 2019; Shean et al., 2020; Davaze et al., 2020; Hugonnet et al., 2021a). In contrast to the glaciological method, the geodetic approach not only includes the surface mass balance but also englacial processes (Zemp et al., 2013; Andreassen et al., 2016). Moreover, although the glaciological and geodetic methods provide independent observations of glacier mass balance, geodetic surveys of variable temporal resolution can potentially serve to reanalyse glaciological records, calibrate and validate glacier mass balance and hydrological models, and reconstruct glacier mass balance time series (Zemp et al., 2013; Xu et al., 2018; Van Tiel et al., 2020; Wagnon et al., 2021; Mukherjee et al., 2023).
The geodetic method has two fundamental limitations when shorter time intervals are considered: (1) the DEM precision in relation to the magnitude of the elevation change signal during an annual to seasonal time interval and (2) the uncertainties in the snow, ice, and firn density and densification linked to the volume-to-mass conversion factor, which are high over short timescales (Huss, 2013; Pelto et al., 2019). This information is, as noted, only available for a restricted glacier sample worldwide.
The increased availability of sub-metre, very-high-resolution (VHR) stereo satellite imagery (e.g. Pléiades, WorldView) and associated DEMs allows for the quantification of small-scale, low-magnitude (metre-scale) changes at the Earth's surface while retaining a suitable level of precision (Berthier et al., 2014). Testing of these DEMs over several mountain sites across the world has confirmed accuracies ranging between 0.2 to 1 m (Berthier et al., 2014; Shean et al., 2016), indicating a high potential for assessing glacier elevation changes over short (<3 years) time intervals. Glaciers with relatively high mass balance amplitude and heavily snowbound areas are particularly suited to this purpose (Belart et al., 2017; Deschamps-Berger et al., 2020). Additionally, other very-high-resolution DEMs and precise elevation information can be derived from aerial photographs, captured by terrestrial surveys, unoccupied aerial vehicles (UAVs) and terrestrial or airborne lidar scanners and spaceborne laser and radar altimetry (e.g. ICESat-2, Cryosat-2) to derive short-term glacier elevation changes (Huss et al., 2013; Fischer et al., 2016; Pelto et al., 2019; Jakob et al., 2021; Wang et al., 2022; Wang and Sun, 2022; Wu et al., 2022).
The major aims of this paper are therefore to investigate the potential and limitations of geodetic mass balance estimates derived from VHR Pléiades satellite data using DEMs over the 3-year period 2020–2022. We obtain annual and seasonal mass changes in order to make inferences about glacier accumulation regimes in the selected sites based on the geodetic results and by the synthetic aperture radar (SAR)-derived glacier index of Huang et al. (2022), supported by climatic data. For these investigations, we have selected two specific regions in High Mountain Asia which have displayed contrasting mass change rates over approximately the last 5 decades: the Muztagh Ata (Eastern Pamir), which is predominantly influenced by mid-latitude westerlies and where glaciers have been close to balanced conditions, and western Nyainqêntanglha (central–eastern Tibet), which is more influenced by the monsoon and has had a strongly negative mass budget (Bhattacharya et al., 2021a). Moreover, we aim to monitor the ongoing mass balance trends in the Muztagh Ata and western Nyainqêntanglha regions.
2.1 Muztagh Ata
The Muztagh Ata massif is situated in Eastern Pamir, west of the Taklimakan Desert in the Xinjiang Uygur Autonomous Region, China (Fig. 1). This mountain range represents an area of anomalously high topography at the northwestern tip of the Tibetan Plateau, rising ∼ 4000 m above the ∼ 3500 m a.s.l. plateau (Seong et al., 2009). The maximum elevation in the area is Mount Muztagh Ata (38∘17′ N, 75∘07′ E; 7546 m a.s.l.). A relevant aspect of the atmospheric circulation over High Mountain Asia is its influence on the glaciers' thermal regime. Glaciers in the arid NW Tibetan Plateau are predominantly continental-type and cold-based (with their basal part entirely below the pressure melting point) and receive little precipitation. Climatically, the Muztagh Ata region is characterized by a semi-arid continental-type regime, said to be one of the driest and coldest glacierized regions in low- to mid-latitude China (Zhou et al., 2014). Precipitation is mainly driven by the mid-latitude westerly flow (Yao et al., 2012) and is concentrated between the spring and summer seasons (April–September) as measured by meteorological stations. Data from the Taxikorgan meteorological station (37∘46′ N, 75∘14′ E; ∼ 50 km south of Muztagh Ata and placed at ∼ 3100 m a.s.l. in a large basin), collected between 1957–2010, indicates a mean annual temperature of +3.4 ∘C (Yan et al., 2013; Yang et al., 2013). Duan et al. (2015) estimated mean annual snow accumulation of 605 mm w.e. a−1 based on an ice core drilled at Muztagh Ata at ∼ 7000 m a.s.l.
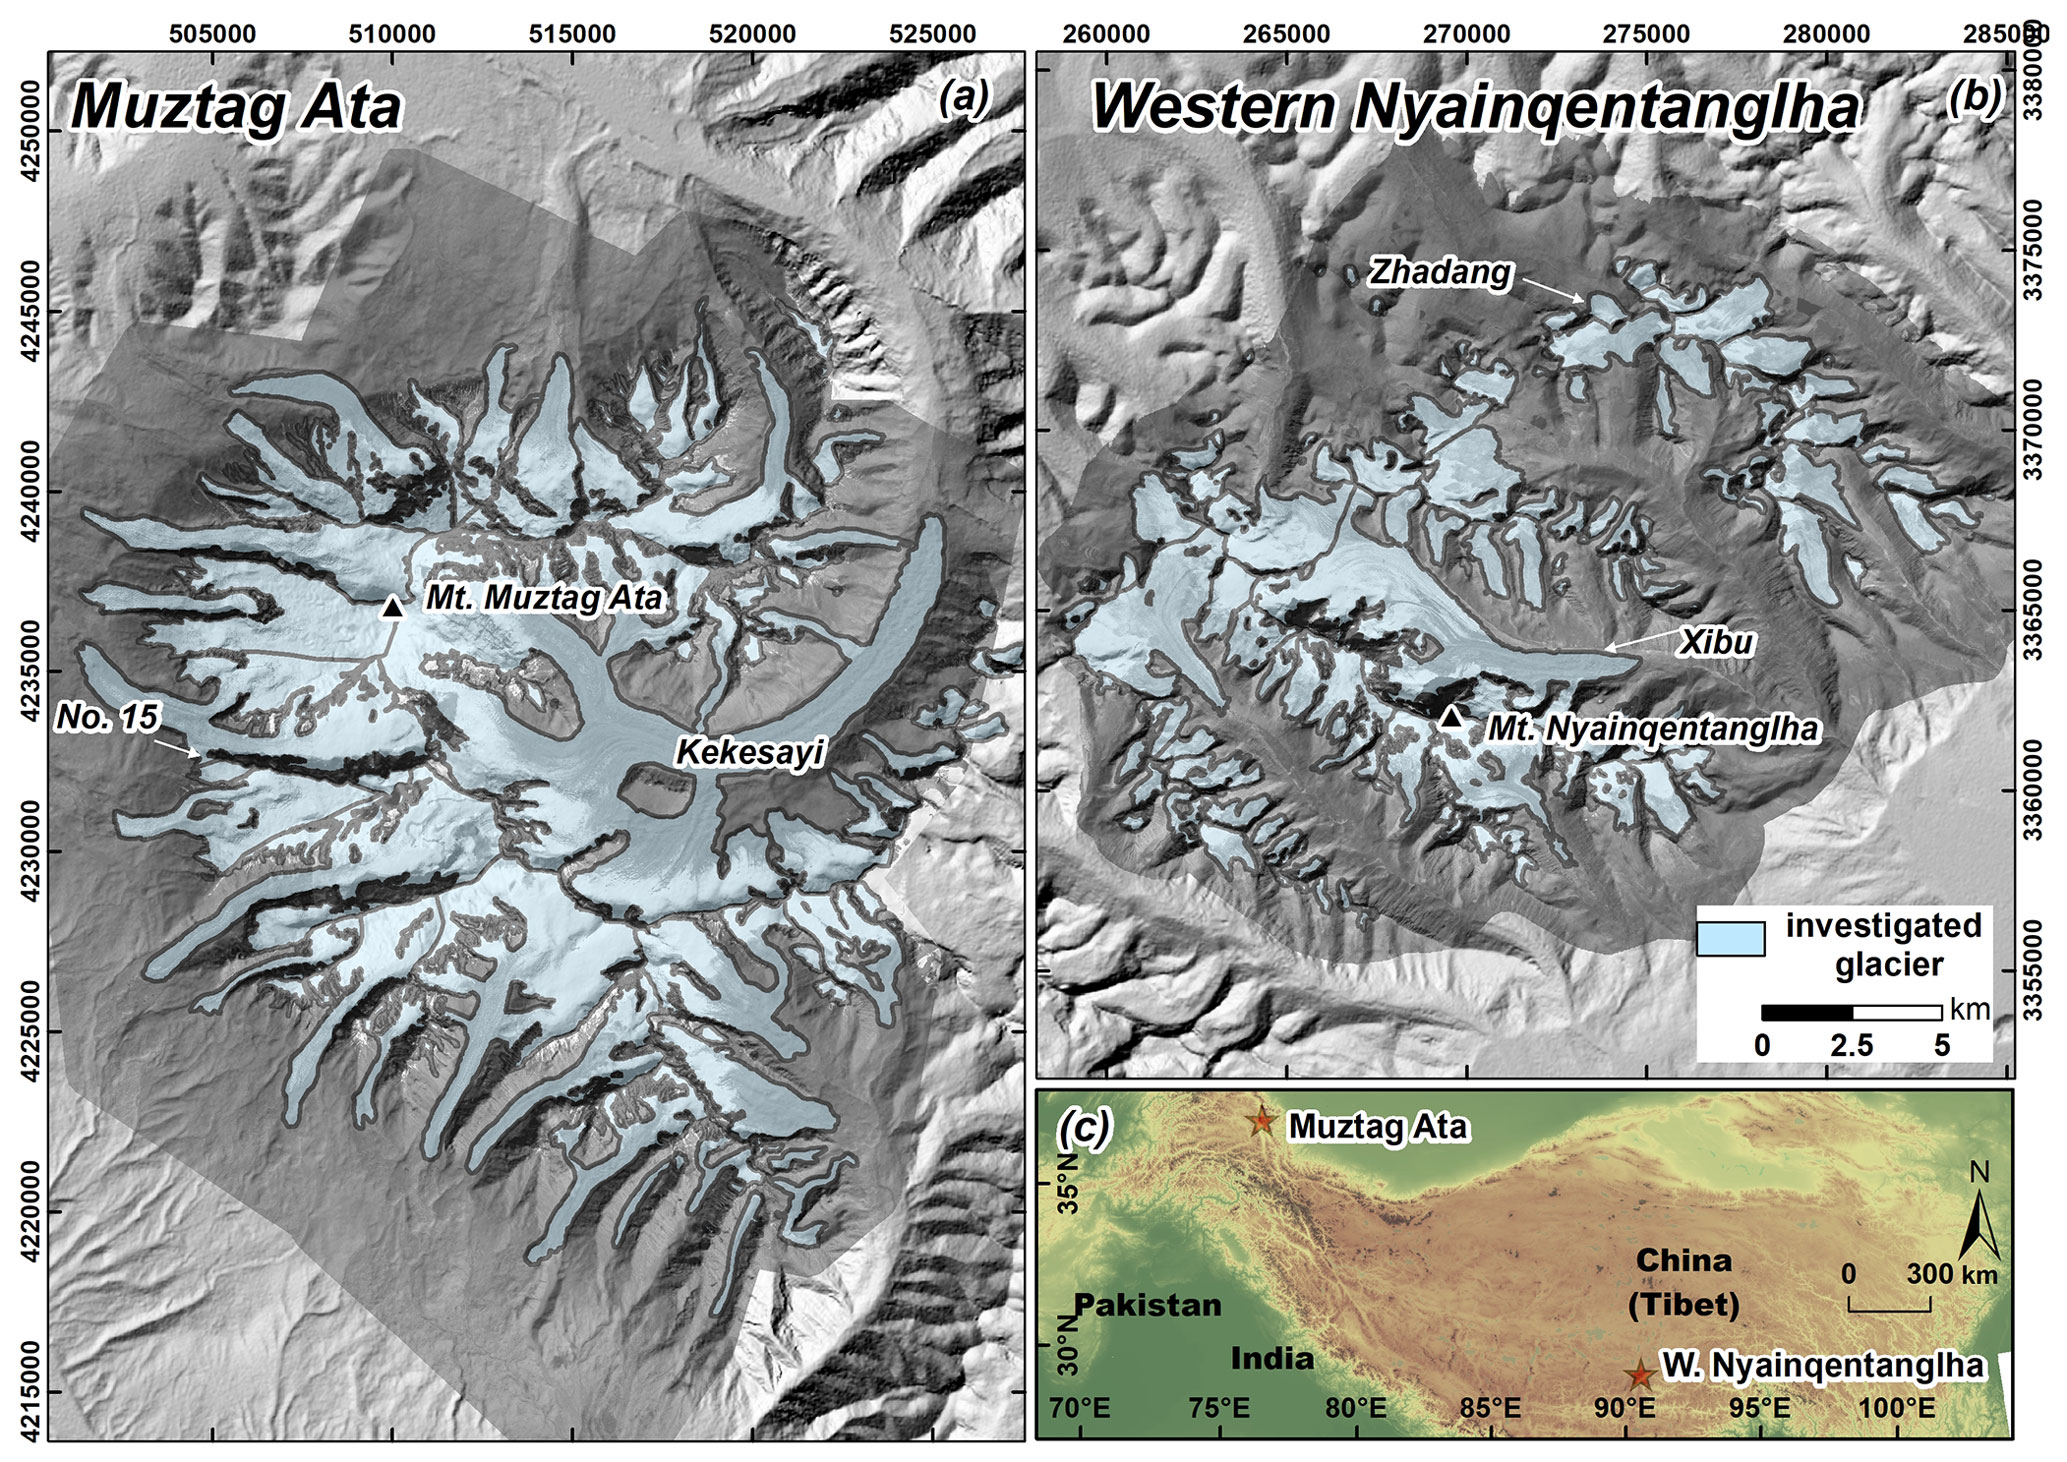
Figure 1Overview of the study sites with specific glaciers mentioned throughout the study and location in High Mountain Asia. Background images are Pléiades 2019 panchromatic band mosaics overlaid on top of Shuttle Radar Topography Mission (SRTM) DEM hill shades.
As per the year 2013, the Muztagh Ata massif contains ∼ 273 km2 of glacierized area; the largest individual glacier is Kekesayi Glacier with an area of ∼ 86 km2 (Holzer et al., 2015). The valley glaciers are cold-based (Zhou et al., 2014), and several of them grade distally from debris-free ice into debris-covered and subsequently ice–debris complexes similar to the landforms in the central Tien Shan (Bolch et al., 2019b).
Previous assessments of glacier mass balance in Muztagh Ata (Yao et al., 2012) had detected balanced conditions and even slight mass gains in the early 2000s, placing the Muztagh Ata area within the Pamir–Karakorum anomaly. More recent studies, however, suggest that although glacier area changes are still negligible, the Muztagh Ata region has recently shifted from approximately balanced conditions prior to the year 2009 to slightly negative glacier mass budgets until 2019 (Bhattacharya et al., 2021a). Overall, Holzer et al. (2015) and Bhattacharya et al. (2021a) found on average slight mass losses since about 1970 (−0.03 m ± 0.33 m w.e. a−1 for 1973–2013) and −0.06 m ± 0.07 m w.e. a−1 for 1967–2019, respectively). The extension of this time series of observations will allow for the further monitoring of this transition.
2.2 Western Nyainqêntanglha
The western Nyainqêntanglha (also known as Nyenchen Tanglha in English) mountains are located in the southeastern centre of the Tibetan Plateau. The SW–NE-oriented mountain range extends over ∼ 230 km in length and reaches a maximum elevation of 7162 m a.s.l. at the top of Mount Nyainqêntanglha (Bolch et al., 2010; Yao et al., 2010). Our study site covers a ∼ 750 km2 portion situated at the centre of the main high mountain range (Fig. 1b, c).
In general, glaciers to the southeast of the Tibetan Plateau are located in a maritime regime under the influence of the summer monsoon with abundant precipitation. However, the location of the western Nyainqêntanglha mountains with respect to major atmospheric circulation patterns in High Mountain Asia results in a highly complex climate setting. The NW slopes lie on the windward side of the western winds (which prevail during the dry season), whereas the SE flank is exposed to the easterly winds of the summer monsoon that dominate in the wet season (Kang et al., 2009). The western Nyainqêntanglha glaciers lie in a transitional zone between the more continental regime to the NW plateau and the maritime regime to the southeast; therefore, polythermal glaciers are common here (Shi and Menenti, 2013). Overall, the climate around these glaciers has been described as a continental summer-precipitation type, with both accumulation and ablation maxima occurring during the summer months (Kang et al., 2009). The mean annual air temperature recorded at the Ambo meteorological station (4820 m a.s.l., ∼ 220 km to the northeast of the Nyainqêntanglha range) is −3.0 ∘C (Bolch et al., 2010). For their energy balance model, Caidong and Sorteberg (2010) estimated the annual precipitation to be between 700 and >900 mm for Xibu Glacier (Fig. 1b).
Bolch et al. (2010) inventoried more than 1000 individual glaciers covering about 800 km2 in 2001, whereas for our specific study site the glacier area accounted for more than 150 km2. The debris-covered Xibu Glacier (∼ 23 km2) is the largest investigated glacier. In contrast to the Muztagh Ata massif, glaciers in the western Nyainqêntanglha region have been rapidly shrinking. Reported glacier area changes range between ∼ 10 % between 1976 and 2009 based on Hexagon KH-9 and Landsat data (Bolch et al., 2010) and 27 % between 1970–2014 based on historical maps and Landsat data (Wu et al., 2016). In addition, glaciers are losing mass at an accelerating rate (from −0.27 ± 0.11 m w.e. a−1 between 1968 and 1976 to −0.47 m w.e. a−1 between 2012 and 2018; Zhang and Zhang, 2017; Luo et al., 2020; Ren et al., 2020; Bhattacharya et al., 2021a). The glaciological (in situ) mass balance has been surveyed on Zhadang Glacier, a debris-free, ∼ 2 km2 mountain glacier located on the northern flank of our study area (Fig. 1). Both the in situ and modelled mass balance between 2001 and 2017 have shown mass loss rates between −0.43 and −1.97 m w.e. a−1 (Yao et al., 2012, and unpublished data; Zhang et al., 2013; Huintjes et al., 2015).
3.1 Geodetic mass balance
To derive annual and seasonal geodetic mass balance estimates, we produced a time series of glacier surface elevation change estimates through DEM differencing. To ensure the robustness of these data, we have considered, and where necessary corrected for, biases related to DEM misalignment, data voids in the elevation change grids, contrasting acquisition dates and seasonal snow conditions. The utilized data and individual processing steps are described in more detail below.
3.1.1 DEMs derived from Pléiades tri-stereo imagery
The commercial Pléiades 1A and 1B twin satellites were launched in December 2011 and 2012, respectively. Images are acquired at 0.7 m pixel resolution and delivered by Airbus Intelligence at a ground sampling distance (GSD) of 0.5 m for the panchromatic band (Gleyzes et al., 2012). In this study, we used Pléiades tri-stereo panchromatic scenes to cover the Muztagh Ata and western Nyainqêntanglha between 2019 and 2022 (Table 1). Because of the limited Pléiades footprint of 20 × 20 km (Berthier et al., 2014), both study areas were covered by two or three acquisitions separated by 2 weeks in the worst case (Table 1). From these images, we generated 4 m resolution DEMs and 0.5 m ortho-images using the NASA Ames Stereo Pipeline (ASP v2.4.0; Shean et al., 2016; Beyer et al., 2018) and the Semi-Global-Matching algorithm (Hirschmuller, 2007; Shean et al., 2020).
Table 1Acquisition dates (dd-mm-yyyy) of the Pléiades imagery.
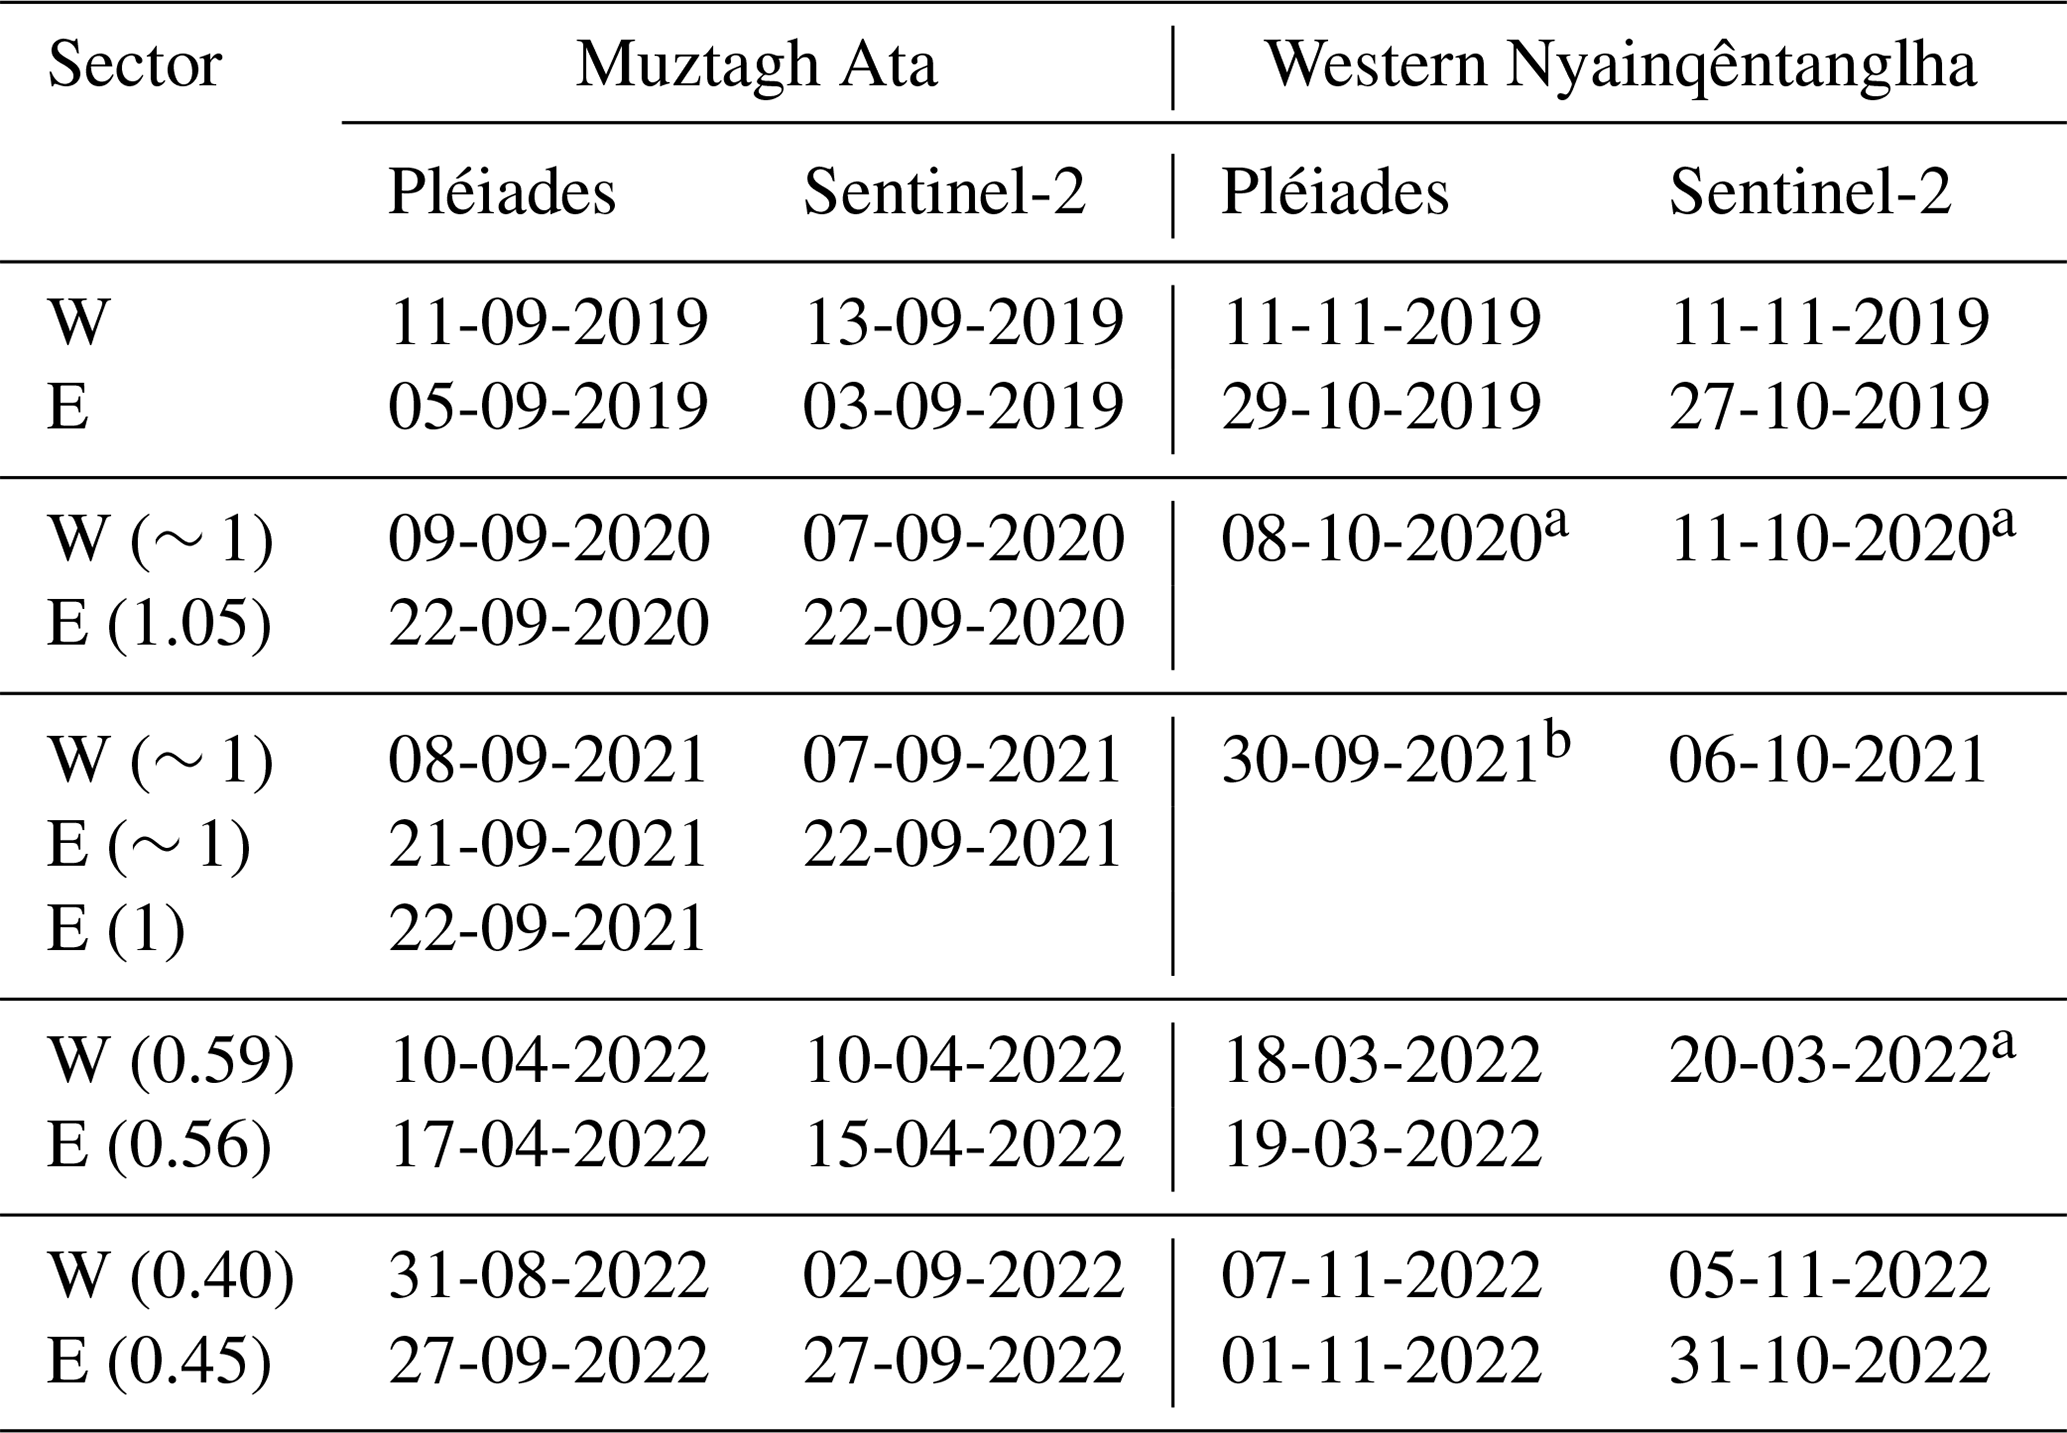
a Full area was covered by two scenes acquired on the same day. b Partial coverage only. W and E are the western and eastern sectors of each study site covered by the Pléiades acquisitions. The values in brackets in the sector column indicate the time interval in years between consecutive acquisitions on each sector.
No field-surveyed ground control points (GCPs) were used in the DEM extraction process. The vertical bias of Pléiades-derived DEMs with no GCPs has been reported to be typically between 1–2 m (occasionally up to 7 m), though this can be reduced to a few decimetres after DEM coregistration (Berthier et al., 2014; Belart et al., 2017; Falaschi et al., 2023a). Despite the higher (12 bit) radiometric resolution of the Pléiades panchromatic bands compared to other sensors used in glaciological applications (e.g. ASTER, SPOT5 HRS), fresh snow that has fallen very shortly before image acquisition can lead to a very high reflection over a large area and a lack of contrast in the images. In such cases, a relatively large number of data voids can be present in the derived DEMs. While the voids in the September 2021 and March 2022 western Nyainqêntanglha and April 2022 Muztagh Ata Pléiades DEMs account for 20 %–23 % of the glacier area, the remaining DEMs contain less than 9 % data voids.
3.1.2 Classification of snow and ice using Sentinel-2 scenes
The European Copernicus Sentinel-2 satellites (A and B), carrying the Multi-Spectral Imaging sensor (MSI), were launched in 2015 and 2017. The instruments onboard Sentinel-2A and Sentinel-2B (swath width: 290 km; orbit repeat rate: 10 d) acquire data in four visible (VIS) and near-infrared (NIR) bands at 10 m spatial resolution and six NIR and short-wave infrared bands (SWIR) at 20 m resolution (Kääb et al., 2016). We used Sentinel-2 imagery to classify surface cover (ice, firn, snow) over Pléiades imagery due to the availability of an automatic, robust method such as the “automated snow mapping on glaciers” tool (ASMAG; Rastner et al., 2019) to identify snow characteristics. The distribution of snow, firn, and ice surfaces is fundamental for a realistic estimation of annual geodetic glacier mass balance (e.g. Pelto et al., 2019). We generated masks that represent the distribution of these components on glacier surfaces to convert volume-to-mass changes (see Sect. 3.1.6). Whilst snow and bare glacier ice are readily identifiable on multispectral satellite imagery using conventional methods (Paul et al., 2015), the distinction between snow, firn, and ice on glacier surfaces can be more difficult. Indeed, several methodological approaches to identify snow line altitudes have shown that firn can be classified as either snow or ice, depending for example on the number of impurities, when using normalized snow indexes or thresholding of single bands or band ratios (e.g. Racoviteanu et al., 2019). Here we implemented the ASMAG algorithm (Rastner et al., 2019; Falaschi et al., 2021), using Sentinel-2 images to distinguish between ice and snow or firn areas. In summary, the algorithm converts the raw digital numbers to top-of-atmosphere reflectance and maps the snow cover ratio (SCR). ASMAG then follows the histogram approach of Bippus (2011) applied to a glacier mask to differentiate ice from snow. To this end, it automatically determines a threshold for the near-infrared (NIR) band values, in turn based on the Otsu (1979) thresholding algorithm (Rastner et al., 2019).
We selected Sentinel-2 scenes acquired as close to the Pléiades imagery as possible. Out of 17 images used for the mapping of snow and ice, the acquisition date of only two Sentinel-2 images differed by more than 2 d (Table 1) from the Pléiades imagery. We inspected ERA5-Land daily temperature and precipitation data to ensure that seasonal snow conditions had not been significantly altered between the Pléiades and corresponding Sentinel-2 scenes, due to snowfall or unusually high-temperature events. According to ERA5-Land daily data (Muñoz-Sabater et al., 2021), 3 cm of fresh snow fell between the acquisition of the 30 September and 6 October 2021 Pléiades and Sentinel-2 images in the western Nyainqêntanglha range. Because seasonal snow is present in the 30 September Pléiades scene, the overall seasonal snow conditions nevertheless appear consistent between the two scenes. As for temperature, the summers of 2019 to 2021 show monthly temperature anomalies of less than 0.6 ∘C, which is far below the historical +2.4 ∘C maximum for the full 1950–2022 series (see Sects. S3.3, S4.3).
Despite the topographic correction featured in the ASMAG algorithm, some glacier parts in cast shadows were initially misclassified as ice in the accumulation regions. To remove these misclassifications, we masked out pixels located above the ASMAG-derived mean snowline altitude (SLA) plus 2 standard deviations and reassigned them to the snow class and implemented a low-pass filter.
3.1.3 Glacier outlines
We used the glacier outlines of the year 2019 available from Bhattacharya et al. (2021a), which were adjusted based on the Randolph Glacier Inventory 6.0 (RGI Consortium, 2017), as the basis for our glacier inventory. For geodetic mass balance studies of a small regional extent, the varying quality of glacier polygons may have a relatively large effect on the final results (Sommer et al., 2020; Falaschi et al., 2023a). Thus, the RGI glacier polygons were manually adjusted (accounting for glacier length changes, removing non-glacierized stable ground, reinterpreting debris-covered ice) to fit the glacier extent on each of the Pléiades acquisition dates (Table 1) by visual interpretation of the 0.5 m orthophotos. The glacier area uncertainty was conservatively calculated using the approach followed by Wagnon et al. (2021), as the product of the glacier outline initial perimeter of each sampled time interval and 2 times the 0.5 m ground sampling distance of the Pléiades panchromatic band.
3.1.4 DEM differencing and generation of elevation change maps
We divided the full 2019–2022 study period into three intervals covering the 2020, 2021, and 2022 hydrological years and two seasonal (2022 winter and summer) time intervals. Before differencing, we coregistered all DEMs to the 2019 DEM following Nuth and Kääb (2011), using the mean value of the elevation changes on stable terrain to correct biases between DEMs. This way, any remaining vertical and horizontal shifts between DEMs are minimized before the dDEM (difference of DEM) grids are generated by subtracting the latter from the initial DEMs.
Elevation change grids derived from Pléiades DEMs often show low-frequency biases in off-glacier elevation change residuals, a phenomenon often termed “undulations” (Hugonnet et al., 2022). These undulations have been attributed to satellite along-track attitude oscillations or jitter (Girod et al., 2017; Deschamps-Berger et al., 2020). We applied a spline fit in the along-track direction (Falaschi et al., 2023a) to remove the low-frequency undulation patterns (Fig. 2a, b).
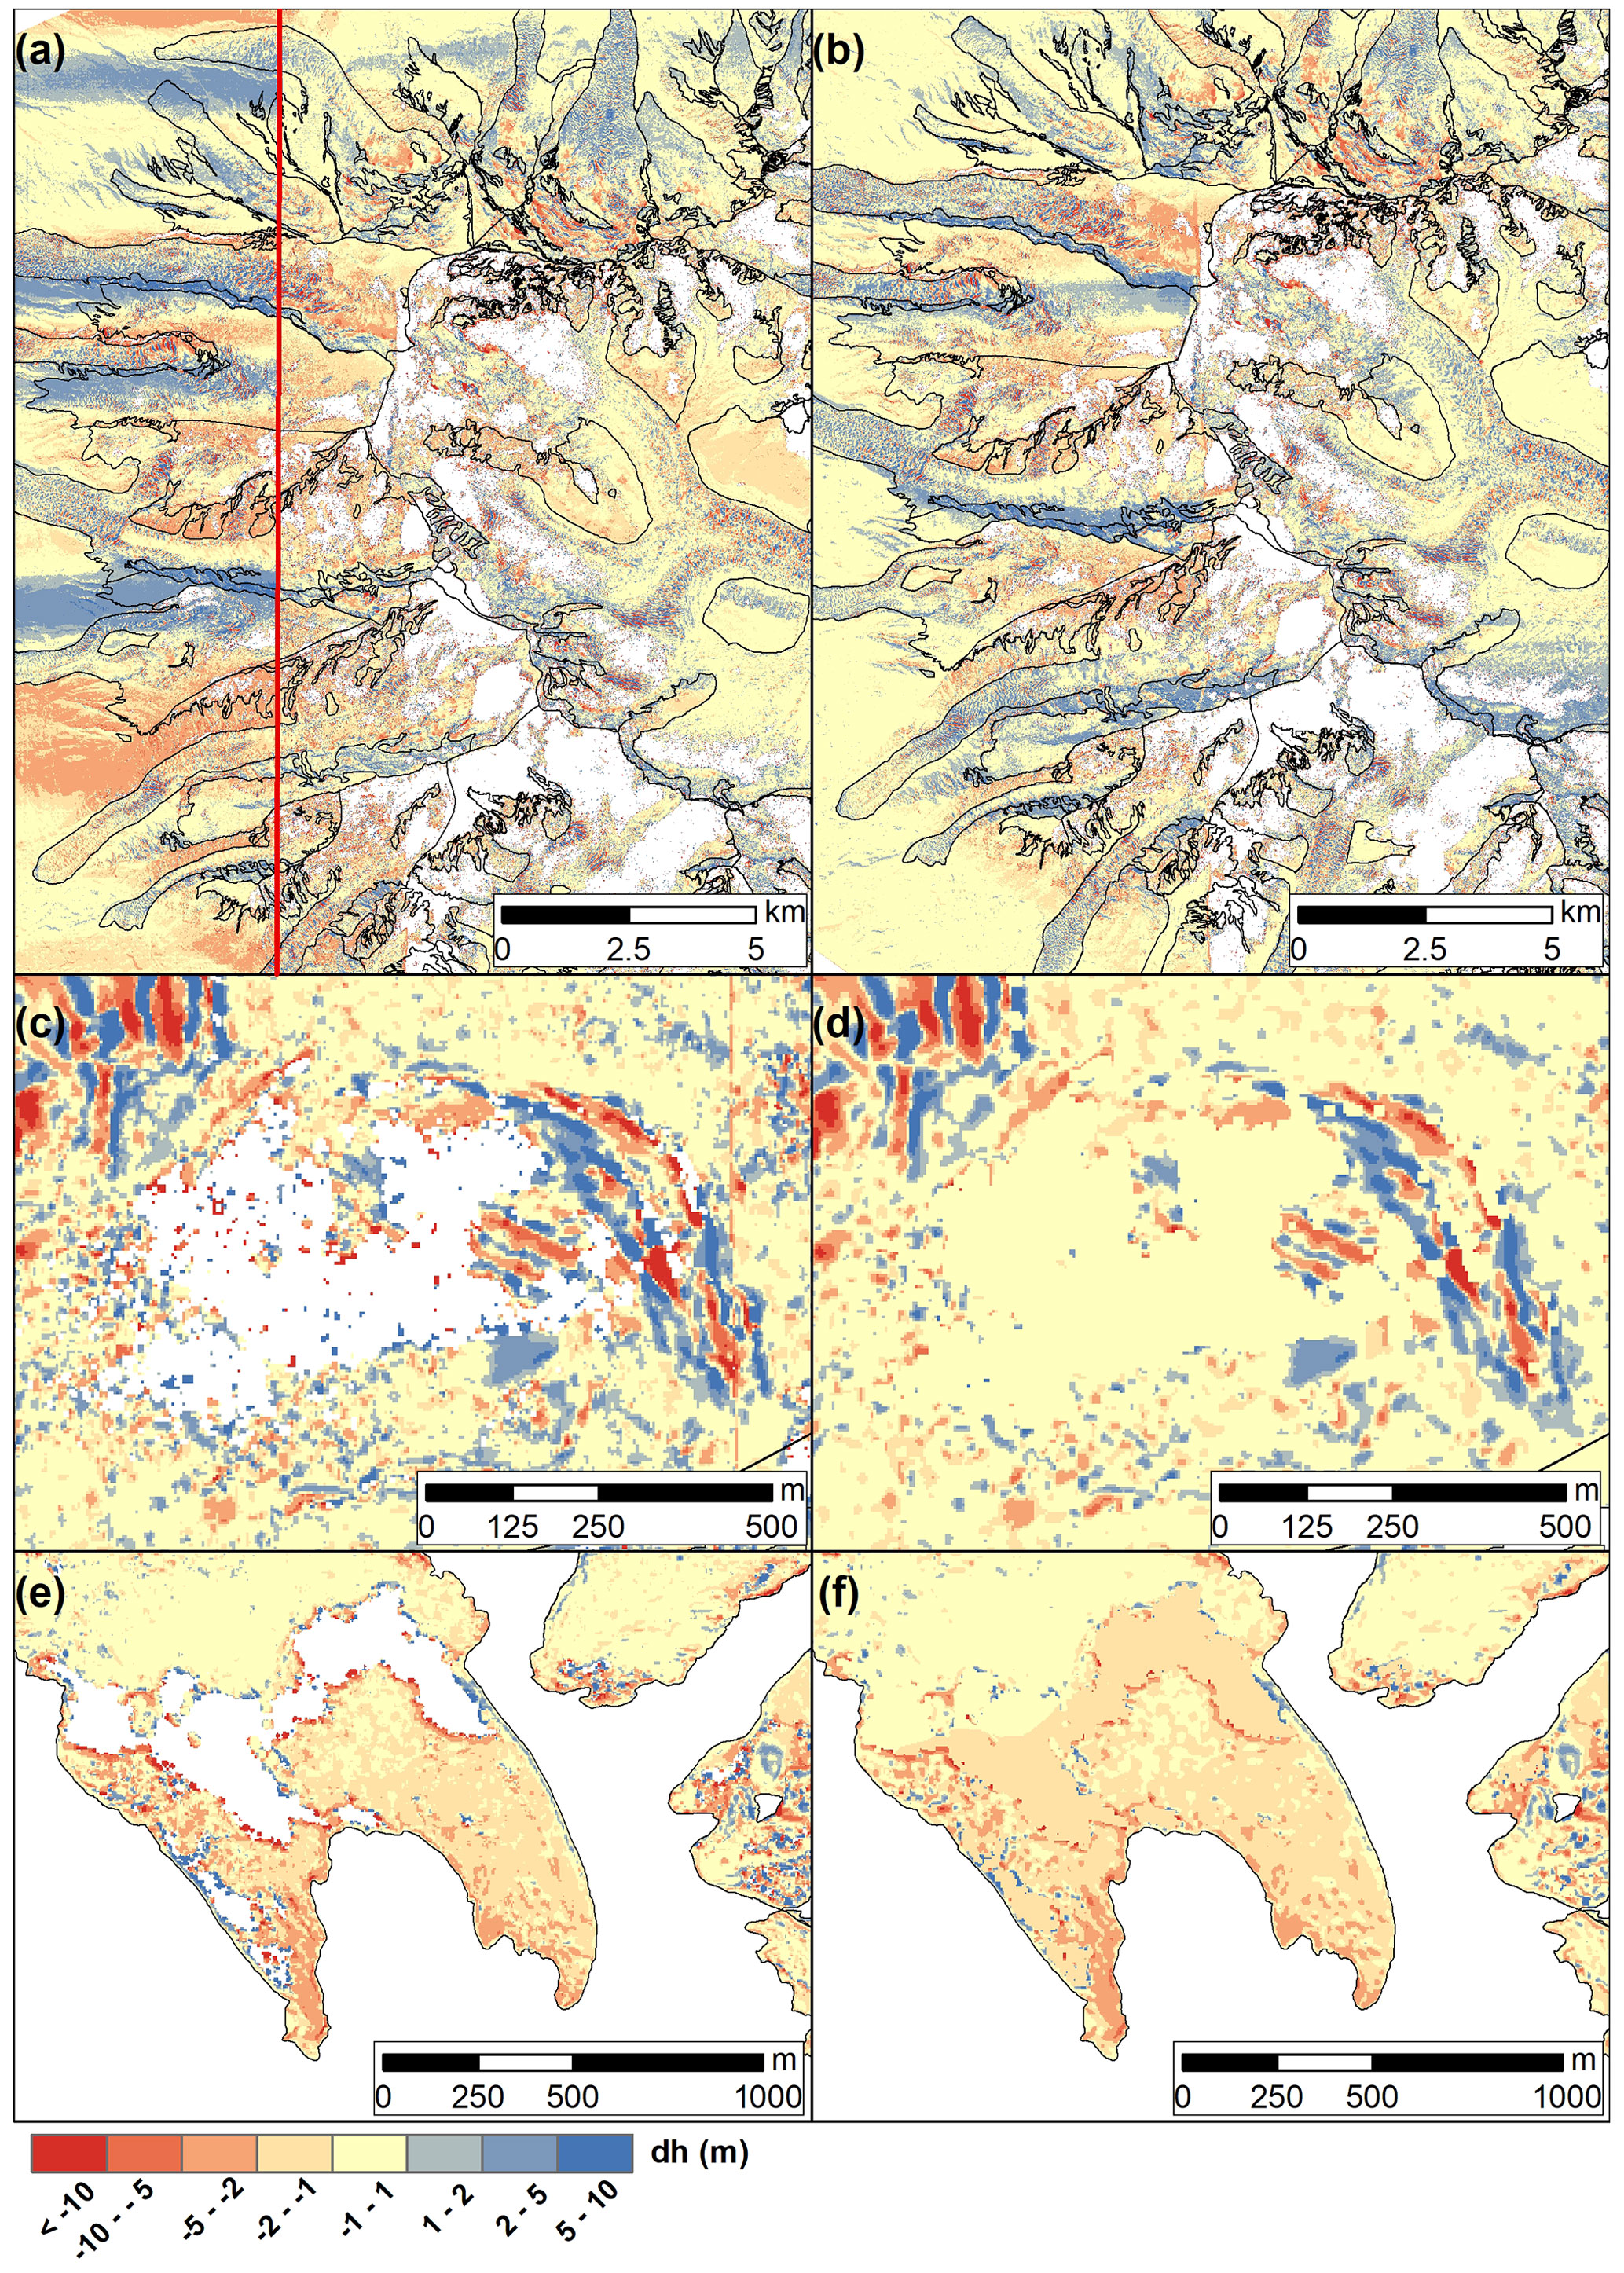
Figure 2Along-track bias removal in Muztagh Ata dDEM grids before (a) and after (b) bias correction. The diverse impact of the jitter effect on individual dDEM grids can be observed left and right of the red line in panel (a). Panels (c), (d), (e), and (f) depict examples of outlier removal and gap filling before and after the implementation of the buffer approach in the accumulation area in Muztagh Ata and the glacier terminus in western Nyainqêntanglha dDEM grids, respectively. Note the crevasse motion captured as alternating blue (elevation gain) and red (elevation loss) in the Muztagh Ata panels.
To eliminate on- and off-glacier anomalous cell values from the dDEM grids, we regarded all values exceeding ±150 m as outliers and removed them. A second outlier removal step was carried out where the neighbouring cells of data gaps in the dDEM grids contained high-magnitude elevation differences, which shared statistical characteristics with real glacier thinning or thickening. To filter this noise, we first implemented a three-cell buffer around the data gaps and removed the cells within the buffered areas. We then followed the approach of Gardelle et al. (2013), excluding cells where absolute elevation differences differed by more than 3 standard deviations from the mean elevation change within each altitude band. Finally, we filled the resulting data gaps using the global mean hypsometric approach of McNabb et al. (2019), fitting a fifth-degree polynomial function to the mean elevation change on 50 m elevation bins (Fig. 2c–f). In the specific case of the western Nyainqêntanglha 2022 winter elevation change grid, data voids were concentrated almost exclusively in the uppermost reaches of the sampled glaciers. At similar elevations, the relatively few valid cells available correspond to crevasse movement and show highly negative elevation changes. The global mean void-filling polynomial fitting thus gives too much weight to these negative values and gives the wrong impression that all of the upper part of the glaciers has significantly thinned at high elevation. Therefore, we removed the few highly negative elevation change values in the uppermost reaches and adjusted a new function. In doing so, we resampled the elevation bins to 25 m, so that sufficient bins are available for a representative fit.
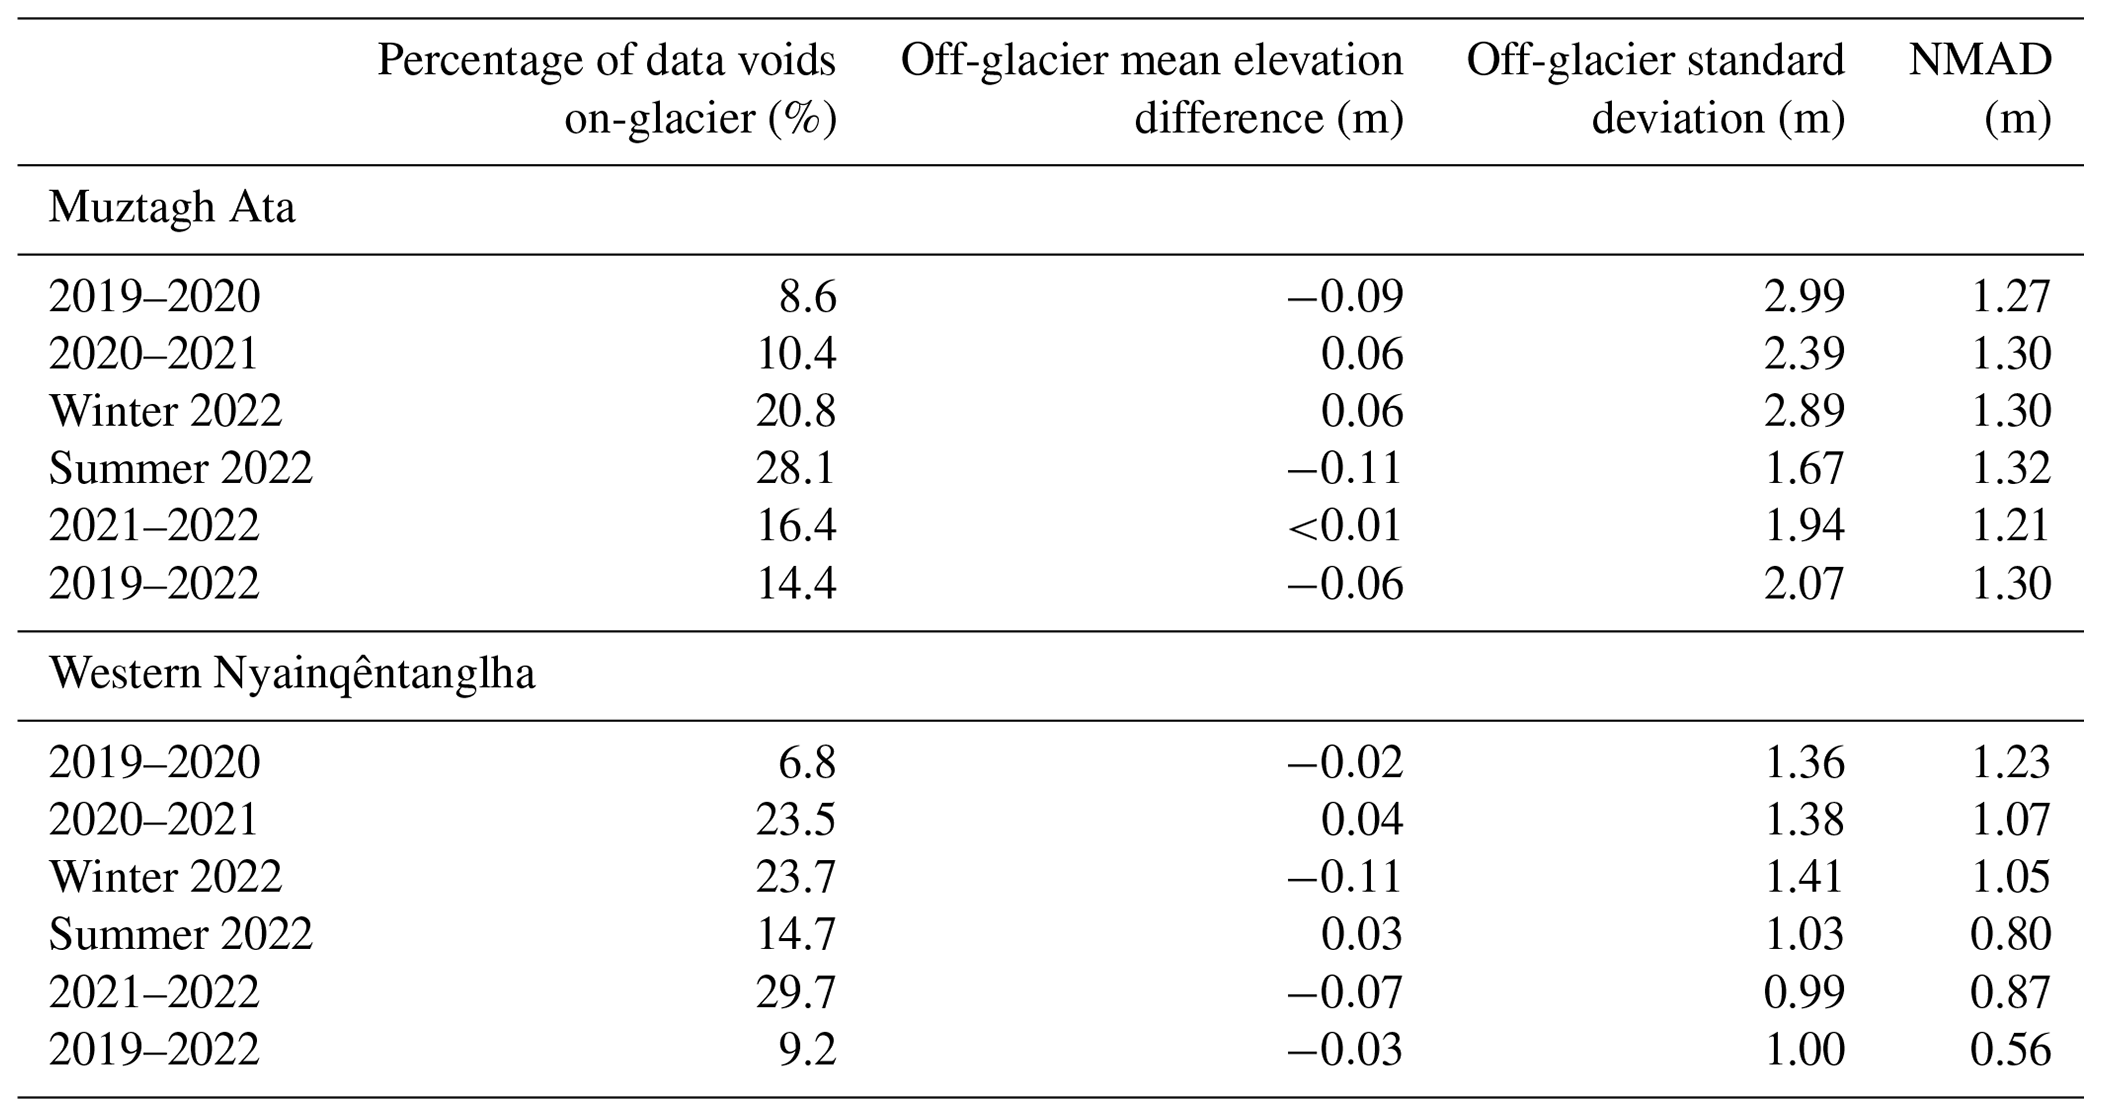
Lastly, we mosaicked the individual tiles to generate the final elevation change maps. Basic statistical parameters of our dDEM grids (Table 2) after coregistration are akin to previously published geodetic mass balance assessments of annual to seasonal scale in other glacierized regions using Pléiades DEMs (e.g. Beraud et al., 2023).
Table 2Statistics of dDEM grids off-glacier after coregistration (SD: standard deviation; SE: standard error; NMAD: normalized median absolute deviation).
3.1.5 Bulk density
Conversion from geodetic volumetric change (in metres) based on the DEM differencing technique to water equivalent (in m w.e.) requires consideration of the densities of the material involved. With no field-surveyed snow density measurements contemporary to our surveyed time periods available, we used the 410 ± 60 kg m−3 snow density value retrieved from snow pits in Muztagh Ata Glacier No. 15 (Zhu et al., 2018a). We assumed a ±60 kg m−3 uncertainty value, which is a standard value used in geodetic mass balance assessments (Huss, 2013). For glacier ice areas, we used a density of 900 kg m−3 and an uncertainty of ±10 kg m−3 (Clarke et al., 2013).
3.1.6 Mass balance calculation
We present annual mass balance estimates for the Muztagh Ata and western Nyainqêntanglha regions starting in the winter of 2019 up to the summer of 2022 but also provide estimates of the 2022 winter and summer seasons. The annual mass balance Ba can be defined as the sum of the winter Bw and summer Bs balances:
The total volume change Δv (m3) over a given time interval dt is then derived from the respective elevation difference dhi of the two grids at pixel i with cell size r of the DEMs, summed over the number of pixels covering the glacier, and is expressed as (cf. Zemp et al., 2013):
Applying the snow and ice masks described in Sect. 3.1.2, we then assessed the annual and seasonal geodetic mass balance Δm (m w.e.) considering the volume change Δv, the density of the involved material ρ, and the snow and ice areas A:
3.1.7 Firn densification correction
Lowering of the annual snowpack on glaciers occurs as a result of firn densification, a process that leads to underestimated volume changes (Sold et al., 2013) and is often neglected in geodetic mass balance studies relying on the dDEM technique. We implemented a simple firn densification approach following Sold et al. (2013) to estimate the annual elevation change due to firn densification dhfirn integrated over the entire firn column applied on a pixel scale:
where bn is the net mass balance averaged over the previous mass balance year or period (in kg m−2) over the accumulation area. bn is positive by definition (Belart et al., 2017). ρfirnu and ρfirnl are the density values at the upper and lower ends of the firn column, set to ρfirnu=470 kg m−3 and ρfirnl=857 kg m−3, as retrieved from a 41 m deep ice core drilled at ∼ 7000 m on Muztagh Ata (Duan et al., 2015). Because some of our Pléiades imagery was acquired around the end of the accumulation season (western Nyainqêntanglha) or contains seasonal snow (Muztagh Ata), “snow” areas do not exactly match “accumulation” areas and can have an overall negative elevation change.
Using the most recent elevation change grids available from Bhattacharya et al. (2021a; Muztagh Ata: 2013–2019; western Nyainqêntanglha: 2018–2019), in combination with the snow areas derived from the 2019 Sentinel-2 scenes to calculate the net mass balance in the accumulation area, leads to a negative signal. Consequently, we considered bn to be the net mass balance of the snow areas as depicted in the September 2021 (Muztagh Ata) and October 2020 (western Nyainqêntanglha) Pléiades scenes, which are those showing the least amount of seasonal snow, and thus snow areas should be representative of accumulation areas. Although topo-climatic factors can make firn lines vary spatially and temporally through time (Guo et al., 2014), for the sake of simplicity we assumed that firn densification did not change over different time periods. Our approach is also based on the accumulation rate retrieved from a single year at each study site, whilst some variability is naturally expected (Duan et al., 2015). We then scaled the firn densification correction linearly according to the length of each time span between consecutive imagery acquisition. Because of the simplifications and assumptions of the firn correction (equal net accumulation through the study period, constant densification rate through the hydrological year), we considered a 50 % uncertainty in the firn correction when quantifying the total mass balance error.
3.1.8 Seasonal correction
Ideally, mass balance observations should be made repeatedly at the end of the ablation season to ensure that the full, annual budget of ablation and accumulation has been captured, although data availability means this is rarely the case. Correction for the impact of such seasonal bias is therefore commonly required (Belart et al., 2017 and 2019; Abdel Jaber et al., 2019).
Neglecting such seasonality corrections can introduce potential biases, since the effect of seasonal signals are particularly strong when short time intervals are considered. A simple approach to account for the seasonal shift in acquired remotely sensed data with respect to the hydrological cycle consists of using the daily mass balance rate for the given period to fill in the deficit of missing days or subtract the input of excess days (Abdel Jaber et al., 2019). The extent of the seasonal bias introduced when using this method therefore depends on the fraction of missing or excess days in relation to the onset of the accumulation and ablation periods. We nevertheless chose this approach since our study sites lie in transitional to continental semi-arid environments where, contrary to glaciers in maritime regions, large annual ice mass turnover is not expected (Duan et al., 2015; Zhu et al., 2015 and 2018a). Moreover, the percentage of missing or excess days relative to the start of the winter (1 October) and summer (1 April) seasons was below 10 % for our Pléiades imagery. We considered that any remaining seasonality-related biases lie within the overall uncertainty range.
3.1.9 Uncertainty
In spite of the coregistration and bias-correction procedures applied, some of the dDEM grids showed systematic residuals on stable terrain (off-glacier) (Table 2). We defined these biases in elevation change off-glacier σsys as the mean difference between two DEMs (Koblet et al., 2010):
with HDEMi and HDEMf being the elevation of the initial and final DEMs and n being the number of cells on stable terrain.
For the calculation of the random uncertainty in the volumetric mass balance estimation (σΔv), we considered the volumetric uncertainties in mean elevation change, snow and ice areas, and firn densification (see Sect. 4.2), which we summed quadratically to propagate the error:
with σAi being the area uncertainty, σdh the uncertainty in the rate of elevation change, dhfirn the annual elevation change owed to firn densification, and σdfirn the uncertainty in firn densification rate. In turn, we calculated σdh using the patch method of Berthier et al. (2016), which evaluates the decay of the mean elevation change error on stable terrain (off-glacier) with the averaging area (Wagnon et al., 2021; Falaschi et al., 2023a). Since we attributed a different density and related uncertainty to the snow and ice area classes (snow: ± 60 kg m−3; ice: ± 10 kg m−3), we calculated the uncertainty in each class separately, by adding the density uncertainty σfΔv of each surface to the volumetric uncertainty in Eq. (5):
with fΔv being the volume-to-mass conversion factor of ice and snow.
Finally, to obtain the overall mass balance uncertainty σm.tot over the total glacier area, we summed the uncertainties in the snow and ice areas quadratically:
The void-filling approach used in the western Nyainqêntanglha 2022 winter elevation change grid (Sect. 3.1.2) affects less than 10 % of the total glacier area. The mass balance value differed by 0.01 m w.e. only when compared to the mass balance estimate using the “standard” approach used in other grids. We thus did not include any additional uncertainty source in this specific case and considered that the void-filling-related uncertainty is contained within the overall one.
Previous geodetic mass balance research, similar in nature to this study, has considered ice dynamics (i.e. vertical ice flow) as an additional uncertainty source. Because the influence of ice dynamics is usually very small (<5 %) on a year-to-year basis (e.g. Mukherjee et al., 2023), we considered the related uncertainty to be beyond the scope of the present study (Sect. S3.1.10).
3.2 Glacier Index: wet-snow and firn area ratios derived from Sentinel-1 and Landsat Operational Land Imager (OLI) imagery
We implemented the Glacier Index of Huang et al. (2022), based on Sentinel-1 SAR data to characterize glacier accumulation regimes and validate our geodetic results. Although other applicable methods to assess glacier accumulation regimes in High Mountain Asia exist (e.g. Maussion et al., 2014), they are often based on climate reanalyses that have shown large disparities (Wortmann et al., 2018). More so, with the Glacier Index we intend to use a satellite-derived method fully independent from reanalysis data to validate our geodetic estimates. To account for different glacier areas between the study sites, we express firn and wet-snow areas in each region as a fraction of the total glacier area (hereafter referred to as firn area ratio and wet-snow area ratio). The snow area ratio can vary to a great extent across different geographic regions through time, whilst interannual variations in the firn area ratio remain relatively small. The Glacier Index I is then defined as the difference between the firn and wet-snow area ratios, calculated in winter and at the end of the summer season, respectively:
where Afirn is the firn zone area, Awet.snow the wet-snow zone area, and Atotal the total glacier area. The index is expected to be positive for winter-accumulation-type glaciers, as summer snowfall is rare and hence Awet.snow<Afirn. In contrast, the index is more likely to be negative (i.e. Awet.snow>Afirn) for summer glaciers due to recurring summer solid precipitation. We classified regions and glaciers as winter-accumulation type where I≥0.05 and summer-accumulation type where I<0.05 following Huang et al. (2022).
To discriminate wet-snow areas in late summer and firn areas in winter over glaciers in our selected study areas, we used Landsat OLI and Sentinel-1 imagery in Google Earth Engine (Gorelick et al., 2017). In the methodology developed by Huang et al. (2022), the spatial resolution of the Sentinel-1 scenes is resampled to 30 m to reduce the speckle effect on SAR images, which may affect the firn and snow identification. Whilst 10 m spatial resolution Sentinel-2 images are available from Google Earth Engine, the method uses 30 m resolution Landsat images to match the resampled SAR images. First, the Landsat scenes are used to identify debris-covered and debris-free areas (ice and snow) on glacier surfaces by applying a threshold to the previously computed Normalized Difference Snow Index (Burns and Nolin, 2014). Then, since the Sentinel-1 C-band is sensitive to snow wetness and roughness (Huang et al., 2013), the backscattering properties between the different glacier facies are sufficiently different to discriminate the frozen firn in winter (here defined as the period between January and March) and wet-snow zone in late summer (defined here as the time interval from 20 July to 10 September) using backscatter coefficients (Fig. 3).
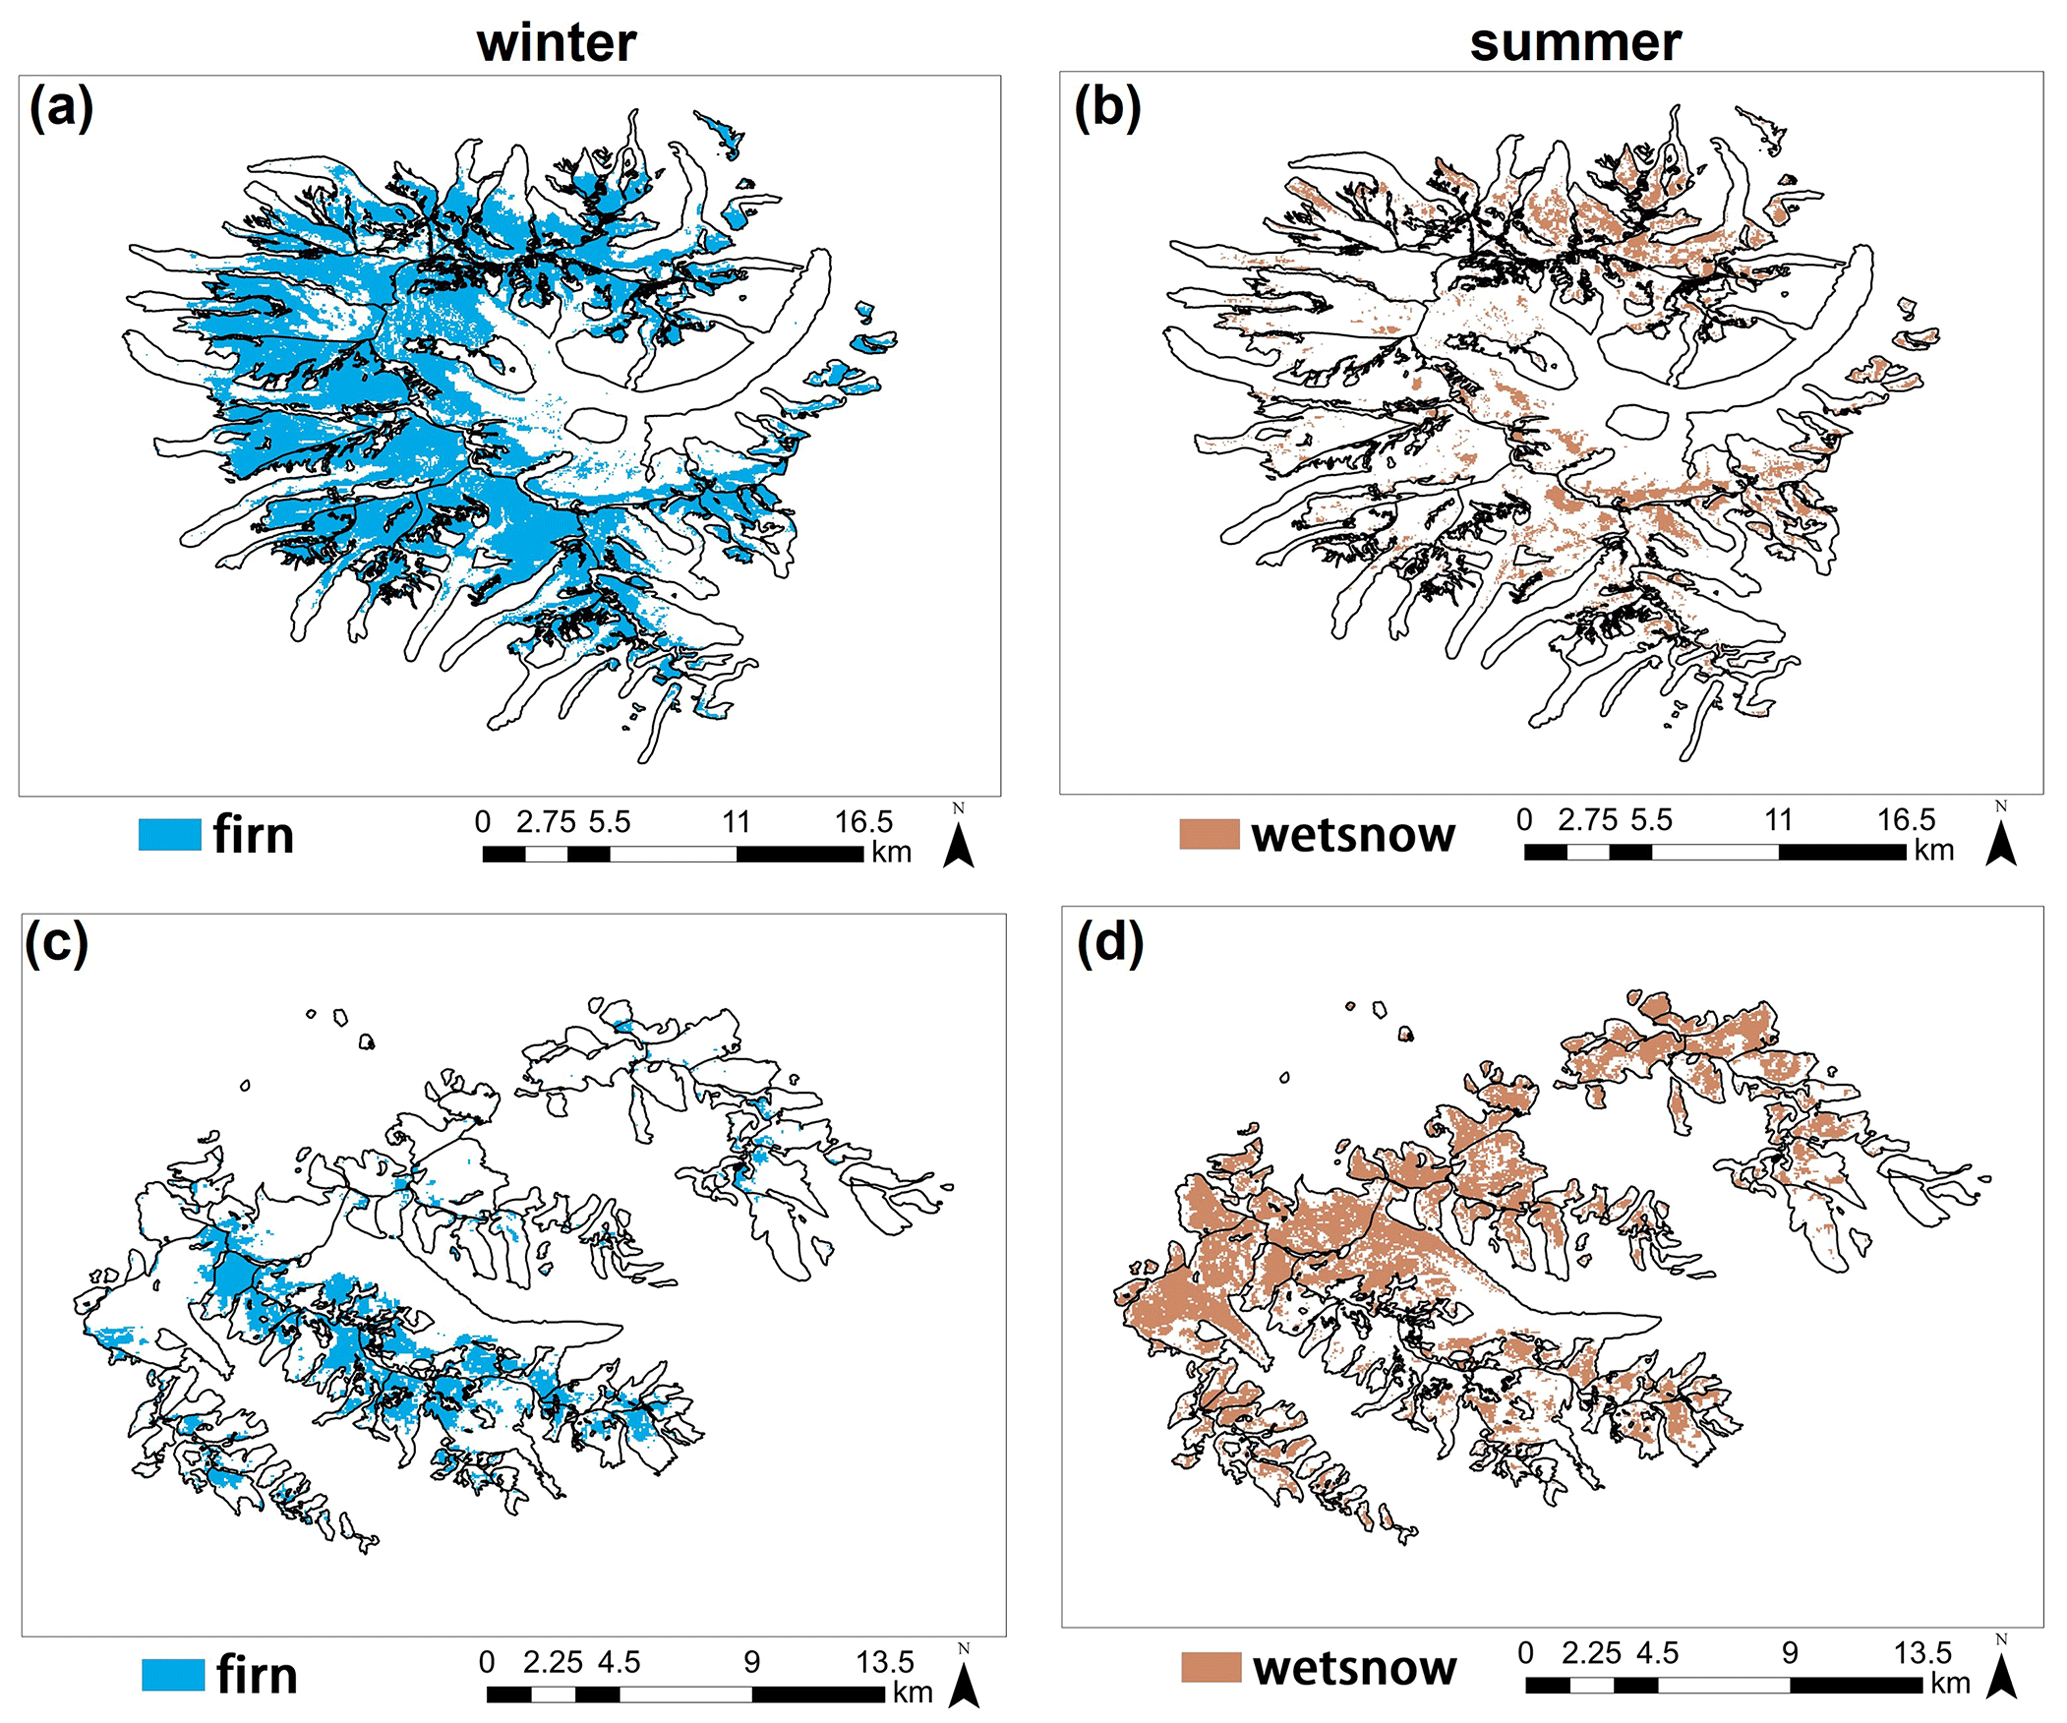
Figure 3Examples of firn and wet-snow cover retrieval in winter and summer 2021 in Muztagh Ata (a, b) and western Nyainqêntanglha (c, d).
To account for overestimations of the firn area ratio (due to thin snow over debris-covered ice and crevasses, acting as corner reflectors), we considered that all pixels >−6 dB are misclassified as firn, whereas pixels <−14 dB are erroneously classified as wet snow (Huang et al., 2022). We corrected the firn and wet-snow areas accordingly in both winter and summer Sentinel-1 scenes.
4.1 Geodetic mass balance in Muztagh Ata and western Nyainqêntanglha
The annual geodetic mass balances in Muztagh Ata varied from moderately negative to slightly positive conditions (Fig. 4; Table 3). Ba estimated from Eq. (3) was negative for the 2020 (when at its most negative, −0.19 ± 0.14 m w.e.) and 2022 glaciological years (−0.17 ±0.22 m w.e.) but was positive in 2021 (+0.15 ± 0.27 m w.e.). In terms of seasonal mass balance, the 2022 winter mass budget was positive, whereas the summer budget was negative (Table 3).
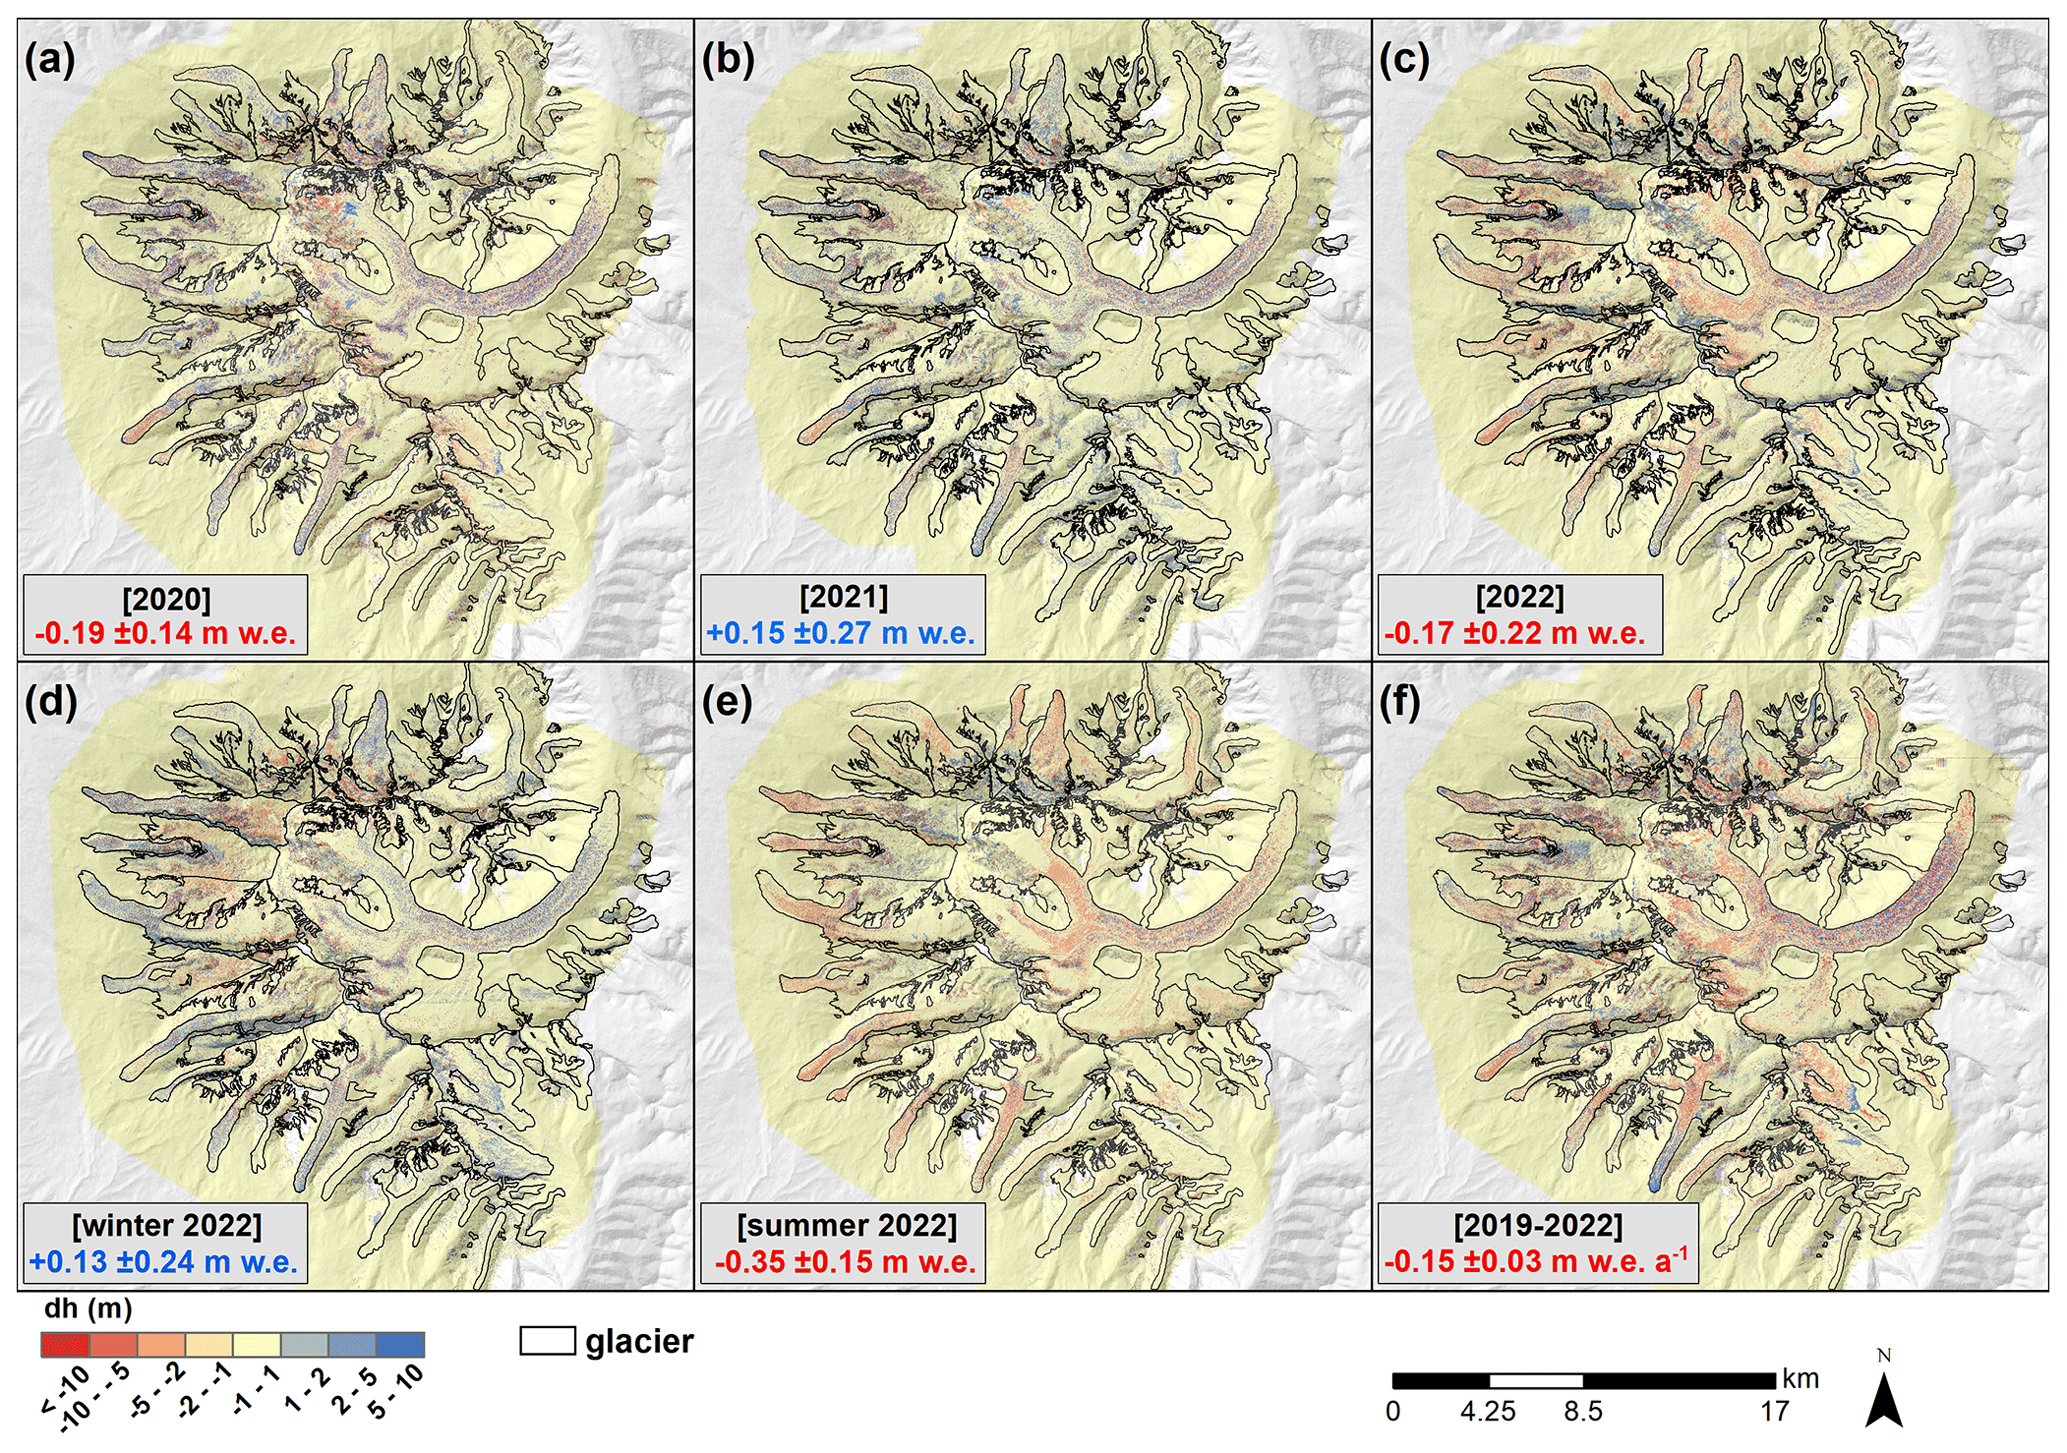
Figure 4Annual (a, b, c), seasonal (d, e), and multi-annual (f) surface elevation change grids over Muztagh Ata and associated geodetic mass balance estimates.
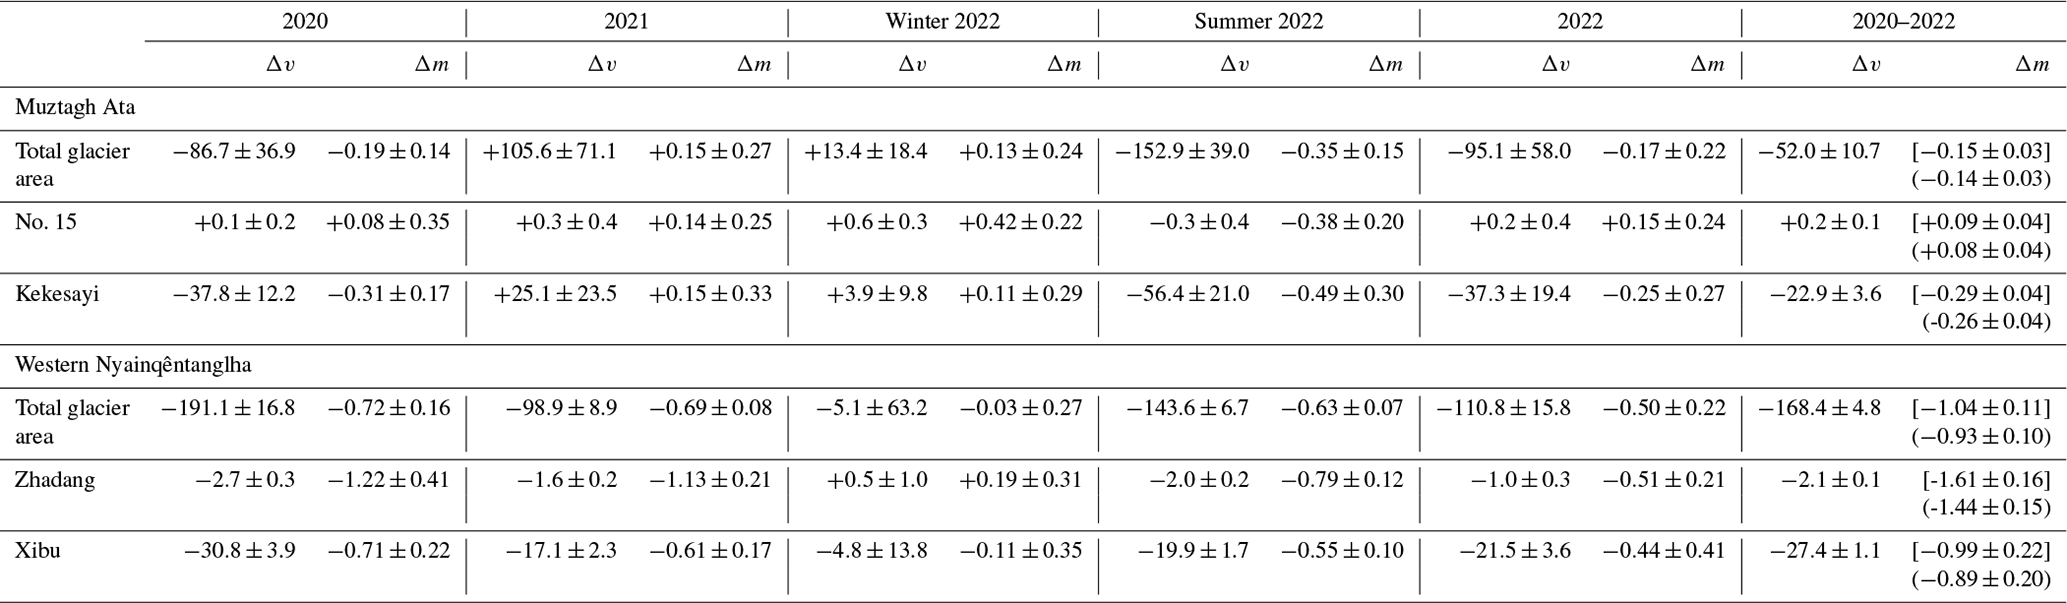
Table 3Summary of time-interval volume changes (×106 m3) and mass balance (m w.e.) for the total glacier area and selected glaciers. Mass balance values in the 2020–2022 column are provided in m w.e. a−1. Values in parentheses are calculated using a density of 850 kg m−3 and values in square brackets with a 3-year weighted density (see Sect. 6.4.1 for details).
On an individual glacier basis, both the annual and seasonal mass balances of Kekesayi Glacier matched the overall trends in the broader Muztagh Ata massif. Interestingly, the annual mass balance estimates of Muztagh Ata Glacier No. 15 yielded positive values for all 3 surveyed years, whilst the seasonal winter (positive) and summer (negative) budgets closely followed the general pattern in Muztagh Ata, respectively (Table 3).
The hypsometric distribution of elevation changes in Muztagh Ata (Fig. 5a) reveals the lack of a clearly defined elevation change (i.e. mass balance) gradient. Periods with a positive mass budget (2021, winter 2022) show elevation gains at different elevation ranges. They occurred from 4300 m up to the uppermost reaches of the glacierized area (7600 m) during 2021, whereas winter 2022 shows surface elevation increases below 5600 m. Elevation gains (accumulation) during the year 2020 were restricted to elevations above 6100 m, whilst in the summer of 2022 elevation gains occurred above 7400 m only.
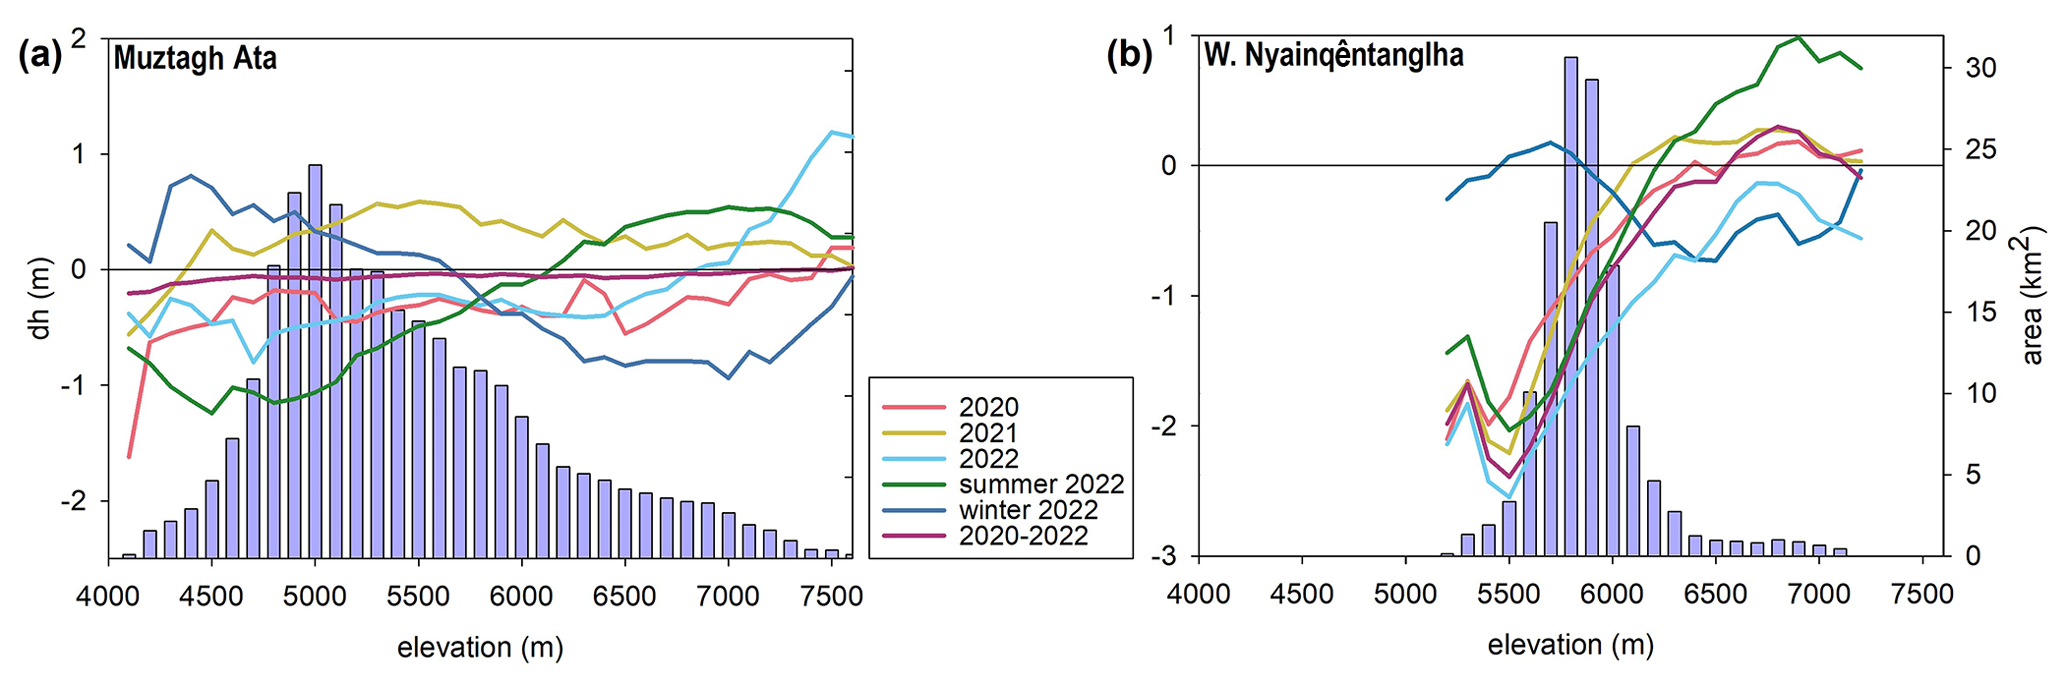
Figure 5Hypsometric curve of glacier surface elevation changes over the glacierized area in Muztagh Ata (a) and western Nyainqêntanglha (b). The light blue bars represent the ice area distribution on 100 m elevation bins for the 2019 glacier area on the right axis.
In contrast to Muztagh Ata, the annual mass balance of glaciers in western Nyainqêntanglha showed a consistent, highly negative signal, with the greatest ice loss rate (−0.72 ± 0.22 m w.e.) measured in 2020 (Fig. 6; Table 3). While the winter mass budget was roughly balanced (−0.03 ± 0.27 m w.e), the summer mass budget was strongly negative (Table 3). It must be noted though that the interannual and seasonal variability in mass balance is not fully comparable due to the incomplete coverage of the study site in the 2021 Pléiades acquisition. The largest, debris-covered Xibu Glacier had also a highly negative mass loss throughout the study period. In line with the overall seasonal budgets in western Nyainqêntanglha, Xibu Glacier lost mass during both the summer and winter seasons. Compared to Xibu Glacier, the mass loss of Zhadang Glacier was even greater on the annual scale (peaking at −1.22 ± 0.21 m w.e. in 2020) but recovered during the 2022 winter season (Table 3).
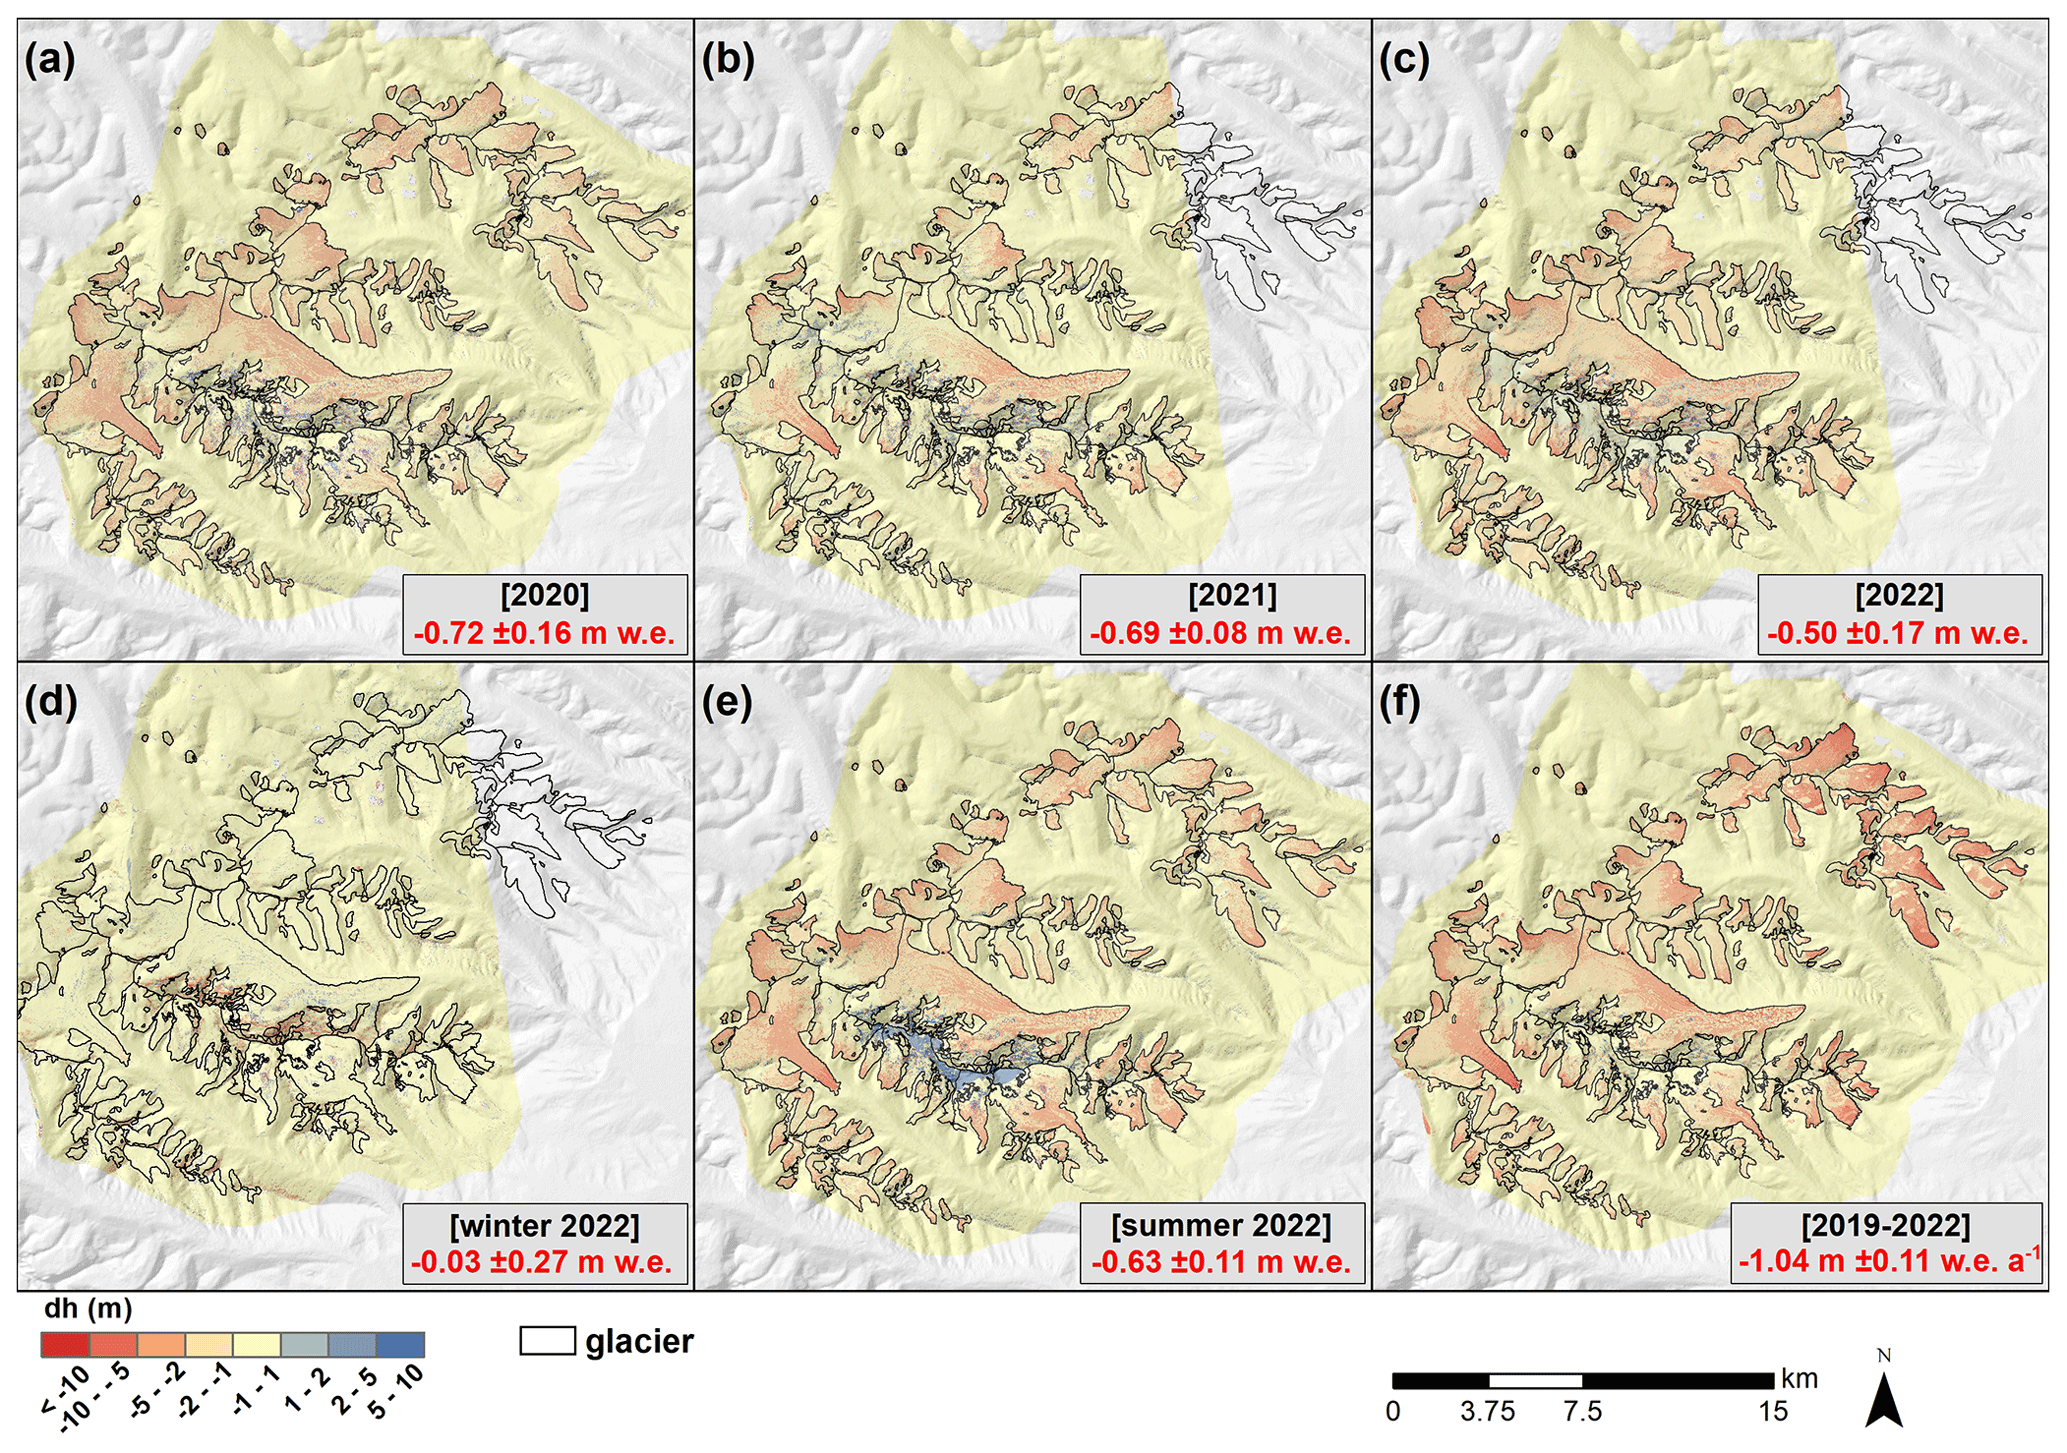
Figure 6Annual (a, b, c), seasonal (d, e), and multi-annual (f) surface elevation change grids over western Nyainqêntanglha and associated geodetic mass balance estimates.
In western Nyainqêntanglha, we observe clear annual (and 2022 summer) elevation change gradients. They depict a steep, positive gradient from lower to higher elevations, with elevation gains starting between 6100–6400 m (Fig. 5b). The 2022 annual hypsometric curve, though similar in shape to the 2 previous years, shows that all of the sampled glacier area underwent ice thinning over this interval. The 2022 winter curve shows slight elevation gains around 5500 m, coinciding with maximum area per elevation band. This, however, does not counterbalance elevation losses elsewhere in the glacier area.
4.2 Wet summer snow and winter firn area ratios derived from the Glacier Index
Firn area and wet-snow ratios varied between 0.55–0.60 and 0.15–0.23 in Muztagh Ata and 0.25–0.28 and 0.33–0.66 in western Nyainqêntanglha, respectively (Fig. 7 and Table S2). These ratios yielded Glacier Index values between 0.32 and 0.45 in Muztagh Ata and −0.38 and −0.07 in western Nyainqêntanglha. To provide a measure of the individual glacier variability, the Glacier Index in Kekesayi and Muztagh Ata No. 15 glaciers varied between 0.17 to 0.28 and 0.68 to 0.89, whilst in Xibu and Zhadang glaciers the index ranged between −0.25 to −0.04 and −0.51 to −0.05, respectively. Based on these assessments, we attribute a winter-accumulation regime to Muztagh Ata and a summer-accumulation regime to western Nyainqêntanglha. Moreover, the evolution of the summer wet-snow area ratio points to 2020 as the most negative mass balance year in western Nyainqêntanglha and 2022 in Muztagh Ata.
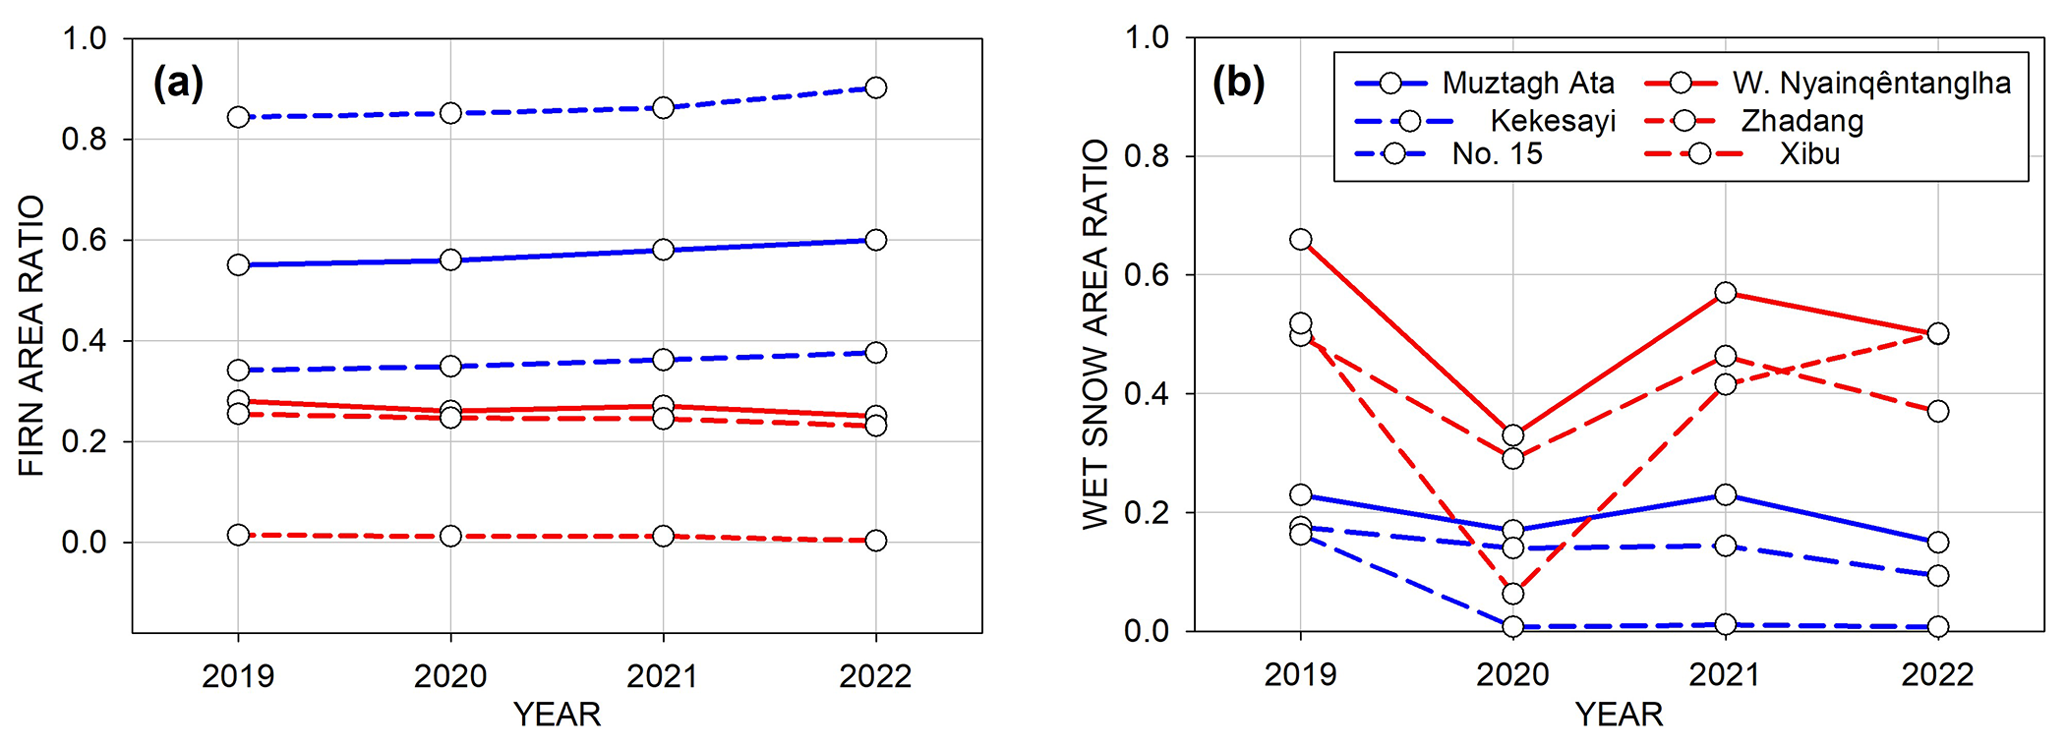
Figure 7Evolution of the firn area ratio (a) and wet-snow area ratio (b) between 2019 and 2022.
5.1 Methodological constraints
5.1.1 Internal consistency of the geodetic mass balance estimates
To verify the consistency of our high-resolution geodetic mass balance surveys at annual to seasonal mass balance, we tested the internal robustness of our geodetic surveys. We evaluated the residuals between accumulated vs. the sum of individual survey periods encompassing identical time intervals, in so-called “triangulation” tests (Nuth et al., 2012; Falaschi et al., 2023a). This is a way to measure the impact of using different inputs such as dDEM grids, snow and ice distribution maps, and the resulting average material density on geodetic mass balance values when evaluating similar periods yet at different time steps.
At the scale of our study regions, the differences between the sum of the summer and winter mass balances and the accumulated 2022 annual budget yielded differences of ±0.05 and ±0.10 m w.e. between both measurements in Muztagh Ata and western Nyainqêntanglha, respectively. In addition, on an individual glacier scale, we found a discrepancy in geodetic mass balance for Kekesayi Glacier of ±0.13 m w.e, while the difference for Muztagh Ata Glacier No. 15 was ±0.11 m w.e. Individually, Zhadang and Xibu glaciers in western Nyainqêntanglha showed differences between 0.09–0.22 m w.e. a−1.
Overall, we find that the mass balance differences considering all glaciers in the study region and for the most part differences for individual glaciers to be within the uncertainty ranges. We attribute the differences to the overall small differences in average density, which in turn derives from the snow and ice distribution. Indeed, for the September 2021 and April 2022 Sentinel-2 snow and ice masks, we used average densities of 590 and 630 kg m−3, respectively. In this sense, Pelto et al. (2019) showed how the spatial distribution of material densities has a larger impact on seasonal mass balances compared to the assumed density values themselves. In contrast, variable density distribution had a greater impact when smaller areas are considered, e.g. in the case of Muztagh Ata Glacier No. 15.
A second consistency test was carried out to test the impact of varying density assumptions in more detail, evaluating the accumulated 2020–2022 mass budget and the sum of all the individual annual periods. We calculated these differences using a single dDEM grid and (a) an overall density of 850 ± 60 kg m−3 and (b) a 3-year weighted density (Muztagh Ata = 774 ± 60 kg m−3; western Nyainqêntanglha = 762 ± 60 kg m−3) for all the material involved following Huss (2013) (Table 3). For the whole Muztagh Ata massif, the 2020–2022 estimates (−0.15 ± 0.03 m w.e. a−1 (scenario a) and −0.14 ± 0.03 m w.e. a−1 (scenario b)) were similar to the averaged mass budget of the individual periods (−0.07 ± 0.21 m w.e. a−1). The accumulated 2020–2022 mass balance of Kekesayi (−0.29 ± 0.04 m w.e. a−1 (scenario a) and −0.26 ± 0.04 m w.e. a−1 (scenario b)) differed by ±0.15 and ±0.12 m w.e. a−1, respectively, from the averaged individual periods (−0.14 ± 0.26 m w.e. a−1). Differences were smaller in the case of Muztagh Ata Glacier No. 15 (±0.04 m w.e. a−1). In western Nyainqêntanglha, the differences were much larger (−0.63 ± 0.15 m w.e. a−1 on average vs. −1.04 ± 0.11 m w.e. a−1 (scenario a) and −0.93 ± 0.10 m w.e. a−1; (scenario b)). Expectedly, even larger differences were found for Zhadang and Xibu glaciers, since higher elevation change rates will have a greater impact on any given density value.
In comparison with the end-of-summer snow densities retrieved from glaciers in other mountain regions (e.g. Pelto et al., 2019; Beraud et al., 2023), our snow density of 410 kg m−3, derived from in situ surveys (Zhu et al., 2018a) is somewhat lower. Using a snow density of 570 kg m−3 (Pelto et al., 2019), the annual mass balance shifts to −0.21, +0.24, and −0.21 m w.e. for the years 2020, 2021, and 2022 in Muztagh Ata and −0.89, −0.71, and −0.85 m w.e. in western Nyainqêntanglha. This approach, or the use of a 3-year weighted density as in Huss (2013), tends to reduce the differences between the accumulated vs. added mass budgets. The above confirms that variable density should be used for time spans of 3 years or less (Belart et al., 2017; Klug et al., 2018). Since we covered a period of 3 years only, no conclusion can be drawn on longer time spans.
5.1.2 Potential and limitations of Pléiades DEMs for assessment of short-term geodetic mass balance
We found that 90 % of the annual and seasonal glacier elevation changes in Muztagh Ata and western Nyainqêntanglha range between −4.7 to +3.3 m. As a consequence, highly accurate and precise DEMs are needed to capture the small magnitude of glacier mass fluctuations. In Sect. 3.1.4 we reported that our DEM errors are within previously reported errors of Pléiades DEMs used in geodetic mass balance assessments (e.g. Berthier et al., 2014; Denzinger et al., 2021; Falaschi et al., 2023a). A fine coregistration between DEMs allows the minimization of vertical and horizontal biases. This is especially important when utilizing DEMs acquired when seasonal snow is present off-glacier but difficult to circumvent when surveying mass balance during accumulation periods. Under these conditions, vertical shifts of up to 1 m measured over stable terrain have been reported (Beraud et al., 2023). Glaciers close to in-balance conditions such as Muztagh Ata are particularly sensitive to an adequate quantification of systematic biases compared to glaciers with a much more negative mass budget, as a given small vertical DEM adjustment may shift from slightly negative to slightly positive elevation changes and vice versa.
Around our reported DEM errors, the vertical precision (standard deviation on stable terrain) of our Pléiades time series in Muztagh Ata and western Nyainqêntanglha were 2.1 and 1.2 m, respectively (Table 2). DEM precision can be also described using the normalized median absolute deviation (NMAD), which is less sensitive to outliers compared to standard deviation (Höhle and Höhle, 2009; Dehecq et al., 2016). Independently from seasonal snow conditions, the NMAD over off-glacier terrain was consistently around ±1.3 m in Muztagh Ata and varied between ±0.6 and ±1.2 m in western Nyainqêntanglha (Table 2). These standard deviations and NMAD values are in the same order of magnitude as other very-high-resolution DEMs used in glaciological applications (Berthier et al., 2014; Belart et al., 2017; Rieg et al., 2018; Pelto et al., 2019; Beraud et al., 2023). Comparatively, the lower precision in the Muztagh Ata DEMs results in relatively larger uncertainties in particular cases (Table 3). This becomes more problematic due to the short temporal baseline and when glaciers are close to balanced conditions. With these caveats in mind, our annual and seasonal geodetic mass balance estimates were robust and consistent with the results retrieved from the Glacier Index (see Sect. 5.2) and can hence provide valuable insight into glacier accumulation regimes in High Mountain Asia.
5.2 Discerning accumulation regimes
The heterogeneity of regional climates displayed in High Mountain Asia, from monsoon-dominated regions with abundant precipitation occurring in the warm season to areas where westerly induced, winter precipitation prevails, results in diverse glacier behaviour and sensitivity to climate drivers (Bolch et al., 2012; Sakai and Fujita, 2017). The Glacier Index of Huang et al. (2022) showed important discrepancies in accumulation regimes for some regions across High Mountain Asia between 2015 and 2018, as derived from gridded climate datasets, including APHRODITE, ERA5, and HARv2 (High Asia Refined analysis, version 2) products. In the specific case of the Muztagh Ata area, there is conflicting evidence about whether glaciers are of winter- or summer-accumulation type. Data from the nearest Taxikorgan station indicate that precipitation occurs mainly during summer time (April–September) (Zhu et al., 2018a), so that a summer-accumulation regime may be assumed for the Muztagh Ata glaciers. Indeed, Zhu et al. (2018a, b) suggested summer precipitation as the main driver of the Muztagh Ata Glacier No. 15 mass balance and that higher amounts of solid precipitation in summer compared to the cold season were mostly responsible for the overall positive budget between 1998 and 2012. However, these authors also showed that between 1980 and 1997, and in spite of heavier precipitation in summer compared to winter, other processes affecting glacier mass balance (e.g. snowmelt, sublimation) resulted in a more negative budget in the summer season.
In contrast to the Taxikorgan instrumental records in Muztagh Ata, which show higher amounts of precipitation during the summer months, Maussion et al. (2014) used HAR data and found that overall, the Pamir region experiences mostly winter precipitation. Huang et al. (2022) found a conspicuous mismatch between the (transitional) accumulation regime derived from (a) gridded climate datasets and climate stations off-glacier and (b) the winter-accumulation type according to the SAR analyses. The authors noted the substantial differences in snow accumulation measured at ∼ 7000 m a.s.l. (605 mm a−1) and those recorded at Taxikorgan station between 1960 and 2002 (60–70 mm; Duan et al., 2015), suggesting that the upper part of Muztagh Ata, an anomalously high peak in the region (Seong et al., 2009), may be affected by a different atmospheric circulation system compared to the valley bottoms (i.e. at Taxikorgan station elevation). Sakai et al. (2015) used a summer-to-annual-precipitation ratio from APHRODITE data and temperature–precipitation plots as indicators of glacier sensitivity to climate changes and categorized the glaciers in Eastern Pamir within the winter accumulation and less sensitive envelope. Although our Pléiades datasets allowed for the retrieval of mass changes for two seasonal intervals only, the geodetic estimates of Muztagh Ata 2022 winter (+0.13 ± 0.24 m w.e.) and summer (−0.35 ± 0.15 m w.e.) mass balance favour a winter-accumulation-type scenario for the Muztagh Ata glaciers.
In stark contrast to Muztagh Ata and Eastern Pamir, western Nyainqêntanglha is located in a transitional area between the monsoon-dominated glaciers in the SE Tibetan Plateau and Himalaya and the westerlies-dominated regions to the northwest. Here, glaciers show a low annual temperature range, are highly sensitive to temperature and precipitation changes, and are therefore prone to strong mass losses (Sakai et al., 2015). There is good consensus in characterizing most glaciers in the area as summer-accumulation type (Fujita and Ageta, 2000; Maussion et al., 2014; Sakai et al., 2015; Huang et al., 2022). The mass balance of Zhadang Glacier was found to be particularly sensitive to the onset of the monsoon period (Kang et al., 2009; Mölg et al., 2012), though mid-latitude westerlies also drive its mass balance (Mölg et al., 2014). Our geodetic results for the western Nyainqêntanglha glaciers showed high ablation rates prevailing over accumulation in the 2022 summer season (−0.63 ± 0.07 m w.e. a−1) and no mass recovery during the winter season (−0.03 ± 0.27 m w.e. a−1). However, while elevation gains are not visible in the uppermost reaches of the glaciers in the 2022 winter elevation change grid (Fig. 6d), the summer elevation change panel (Fig. 6e) does indeed show elevation changes that we attribute to snow accumulation. The 2009–2011 and 2008–2013 mass balances of Zhadang Glacier modelled by Zhang et al. (2013) and Zhu et al. (2018a) support our findings. This further indicates that in western Nyainqêntanglha, accumulation through precipitation is higher in summer than in winter, but contemporary mass losses through runoff and evaporation can exceed mass gains and lead to a strongly negative mass balance.
5.2.1 Insight from the Glacier Index and climate records
The wet-snow area ratio and firn area ratio showed different patterns and trends in Muztagh Ata compared to western Nyainqêntanglha between 2020 and 2022 (Fig. 7). In western Nyainqêntanglha, the annual wet-snow area ratios are higher than the firn area ratios, meaning that there is more accumulation in summer than in winter. The opposite was found in Muztagh Ata, where the firn area ratios are higher than the late summer wet-snow area ratio. This is in turn indicative of higher accumulation during winter in Muztagh Ata. In addition, the firn area ratio is much lower in western Nyainqêntanglha compared to Muztagh Ata, and it is therefore not surprising that glacier mass balance has been much more negative for at least the last 5 decades (Bhattacharya et al., 2021a, and references therein; see Table 4). These results agree well with our geodetic mass balance results for the annual and seasonal intervals in the 2020–2022 sampled period (Table 3), which support winter- and summer-accumulation-type regimes in Muztagh Ata and western Nyainqêntanglha, respectively.
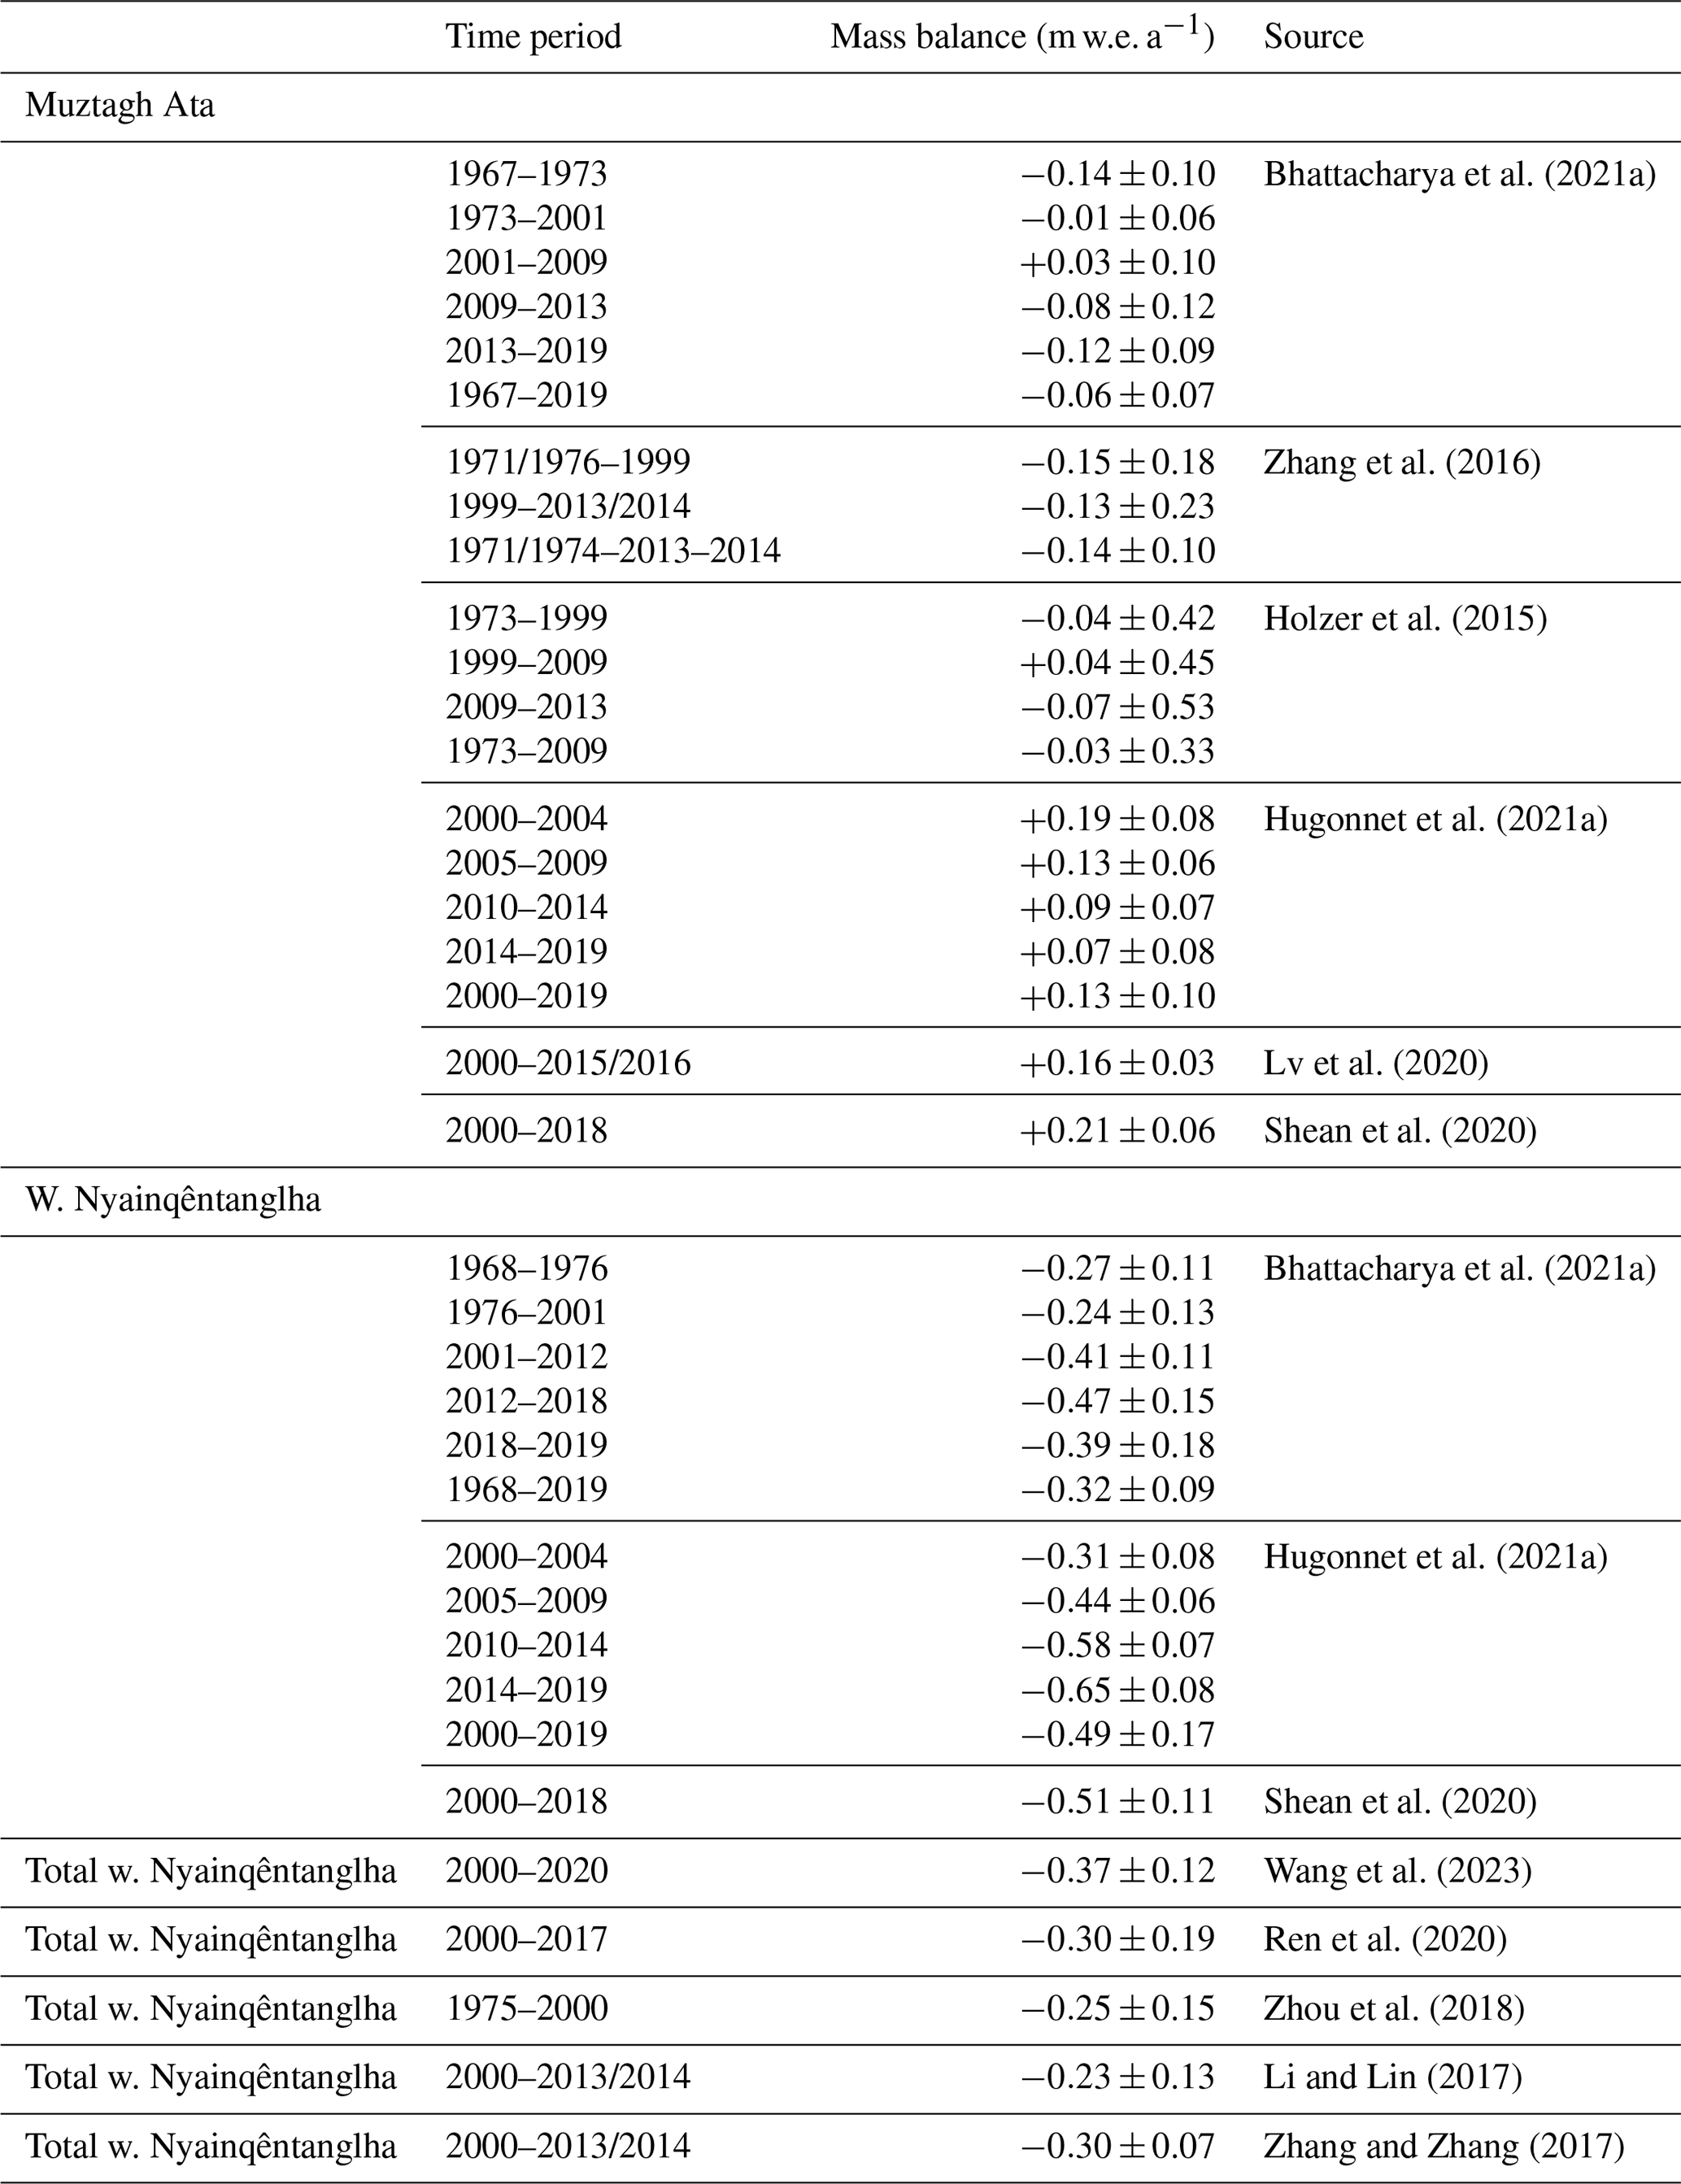
Table 4Mass balance estimates in Muztagh Ata and western Nyainqêntanglha based on optical and SAR-derived DEM differencing.
Despite the overall good agreement between the proposed accumulation regime types based on both the geodetic and Glacier Index approaches, we report a minor caveat. On the one hand, the wet-snow area ratio in Muztagh Ata indicates 2022 as the year with the most negative mass balance year, whilst the geodetic mass balance suggests 2020. Differences in geodetic mass balance and wet-snow area ratios are nevertheless small between both years, and hence we attribute this discrepancy to the geodetic mass balance uncertainty. On the other hand, the wet-snow area ratio in western Nyainqêntanglha indicates that the year 2022 should be the second-most negative mass balance year in the study period (−0.50 ± 0.17 m w.e. a−1 as per our geodetic estimate), whereas the geodetic results suggest 2021 (−0.69 ± 0.08 m w.e.) as the second-most negative year. A possible explanation lies in the differences in the acquisition dates between the Pléiades and Sentinel-1 satellite images used in the geodetic and Glacier Index approaches. The Glacier Index utilizes SAR imagery acquired from 20 July to 10 September each year to guarantee wet-snow conditions over accumulation areas (whereas in late September and October, snow may be dry for areas above 5000 m a.s.l. due to low temperatures). By contrast, the 2021 Pléiades scenes employed in the geodetic method were acquired on 30 September. Our climate data, however, show that in western Nyainqêntanglha, precipitation was higher in September 2022 compared to August in 2022, which will lead to a lower wet-snow area ratio.
Establishing a clear link between glacier mass balance and the investigated climate datasets and variables is a challenging task. Indeed, Huang et al. (2022) have shown how both reanalyses and instrumental records, such as the Taxikorgan climate station in the Muztagh Ata region, are difficult to link with glacier accumulation regimes in several regions throughout High Mountain Asia. To understand the influence of precipitation and temperature on the response of the glaciers in the study sites, we used daily Global Precipitation Measurement (GPM) IMERG late-run precipitation observations and monthly temperature estimates from ERA5-Land (see Sects. S3.3 and S4.3). Only the annual temperature anomalies in western Nyainqêntanglha showed a significant correlation with mass balance, which is most probably due to the small number of mass balance observations (n max = 7 in the 1967–2022 correlation tests, Fig. S1) and possibly to the different duration of the sampled time intervals as well. In Muztagh Ata, our results showed a stronger correlation between glacier mass budget and winter snowfall. The fact that winter snowfall appears to be a stronger mass balance driver in relation to air temperature in Muztagh Ata is consistent with cold and dry environments, which are influenced by solid precipitation to a greater extent (Zhu et al., 2018a, b).
We observed a different scenario in western Nyainqêntanglha. Correlations were much stronger (and significant in the case of annual temperature) between mass balance and temperature anomalies in comparison to solid precipitation. This is to be expected, since summer temperatures have a greater impact on glacier mass balance in more humid climatic regions such as western Nyainqêntanglha (Zhang et al., 2013; Bhattacharya et al., 2021a). Mölg et al. (2014) showed how summer precipitation determines the annual mass balance of summer-accumulation glaciers in the area. Summer temperature, however, modulates the solid vs. liquid precipitation ratio during the summer season, when most of the solid precipitation occurs in the region. In conclusion, the intricacies and limitations of determining accumulation regimes over our investigated glaciers, based on the available climate records, clearly reveal the need for complementary approaches.
5.3 Mass balance differences between both study sites and in the long-term perspective
Our mass balance estimates between 2020 and 2022 for the Muztagh Ata massif suggest a greater variability in mass budget than previously acknowledged in the region (Fig. 8a). During the past 6 decades, Bhattacharya et al. (2021a) found mass balance rates between +0.03 ± 0.10 and −0.14 ± 0.10 m w.e. a−1. At annual time steps, our values ranged between +0.15 ± 0.27 and −0.19 ± 0.14 m w.e. a−1 (Table 3). Averaged between 2020 and 2022, the mass balance of the Muztagh Ata region (−0.07 ± 0.20 m w.e. a−1) is similar to the 2013–2019 mean (−0.12 ± 0.09 m w.e. a−1; Bhattacharya et al., 2021a). This suggests an ongoing period of slight mass loss in the Muztagh Ata massif for the last 3 years, meaning a continuation of the slight mass loss rate observed for most of approximately the last decade (Bhattacharya et al., 2021a). A number of studies (Holzer et al., 2015; Lv et al., 2020) report slight but insignificant positive values between 1999 and 2015/2016, while Bhattacharya et al. (2021a) found almost balanced conditions since 1973 (−0.01 ± 0.06 m w.e. a−1 between 1973 and 2001 and +0.03 ± 0.10 m w.e. a−1 between 2001 and 2009).
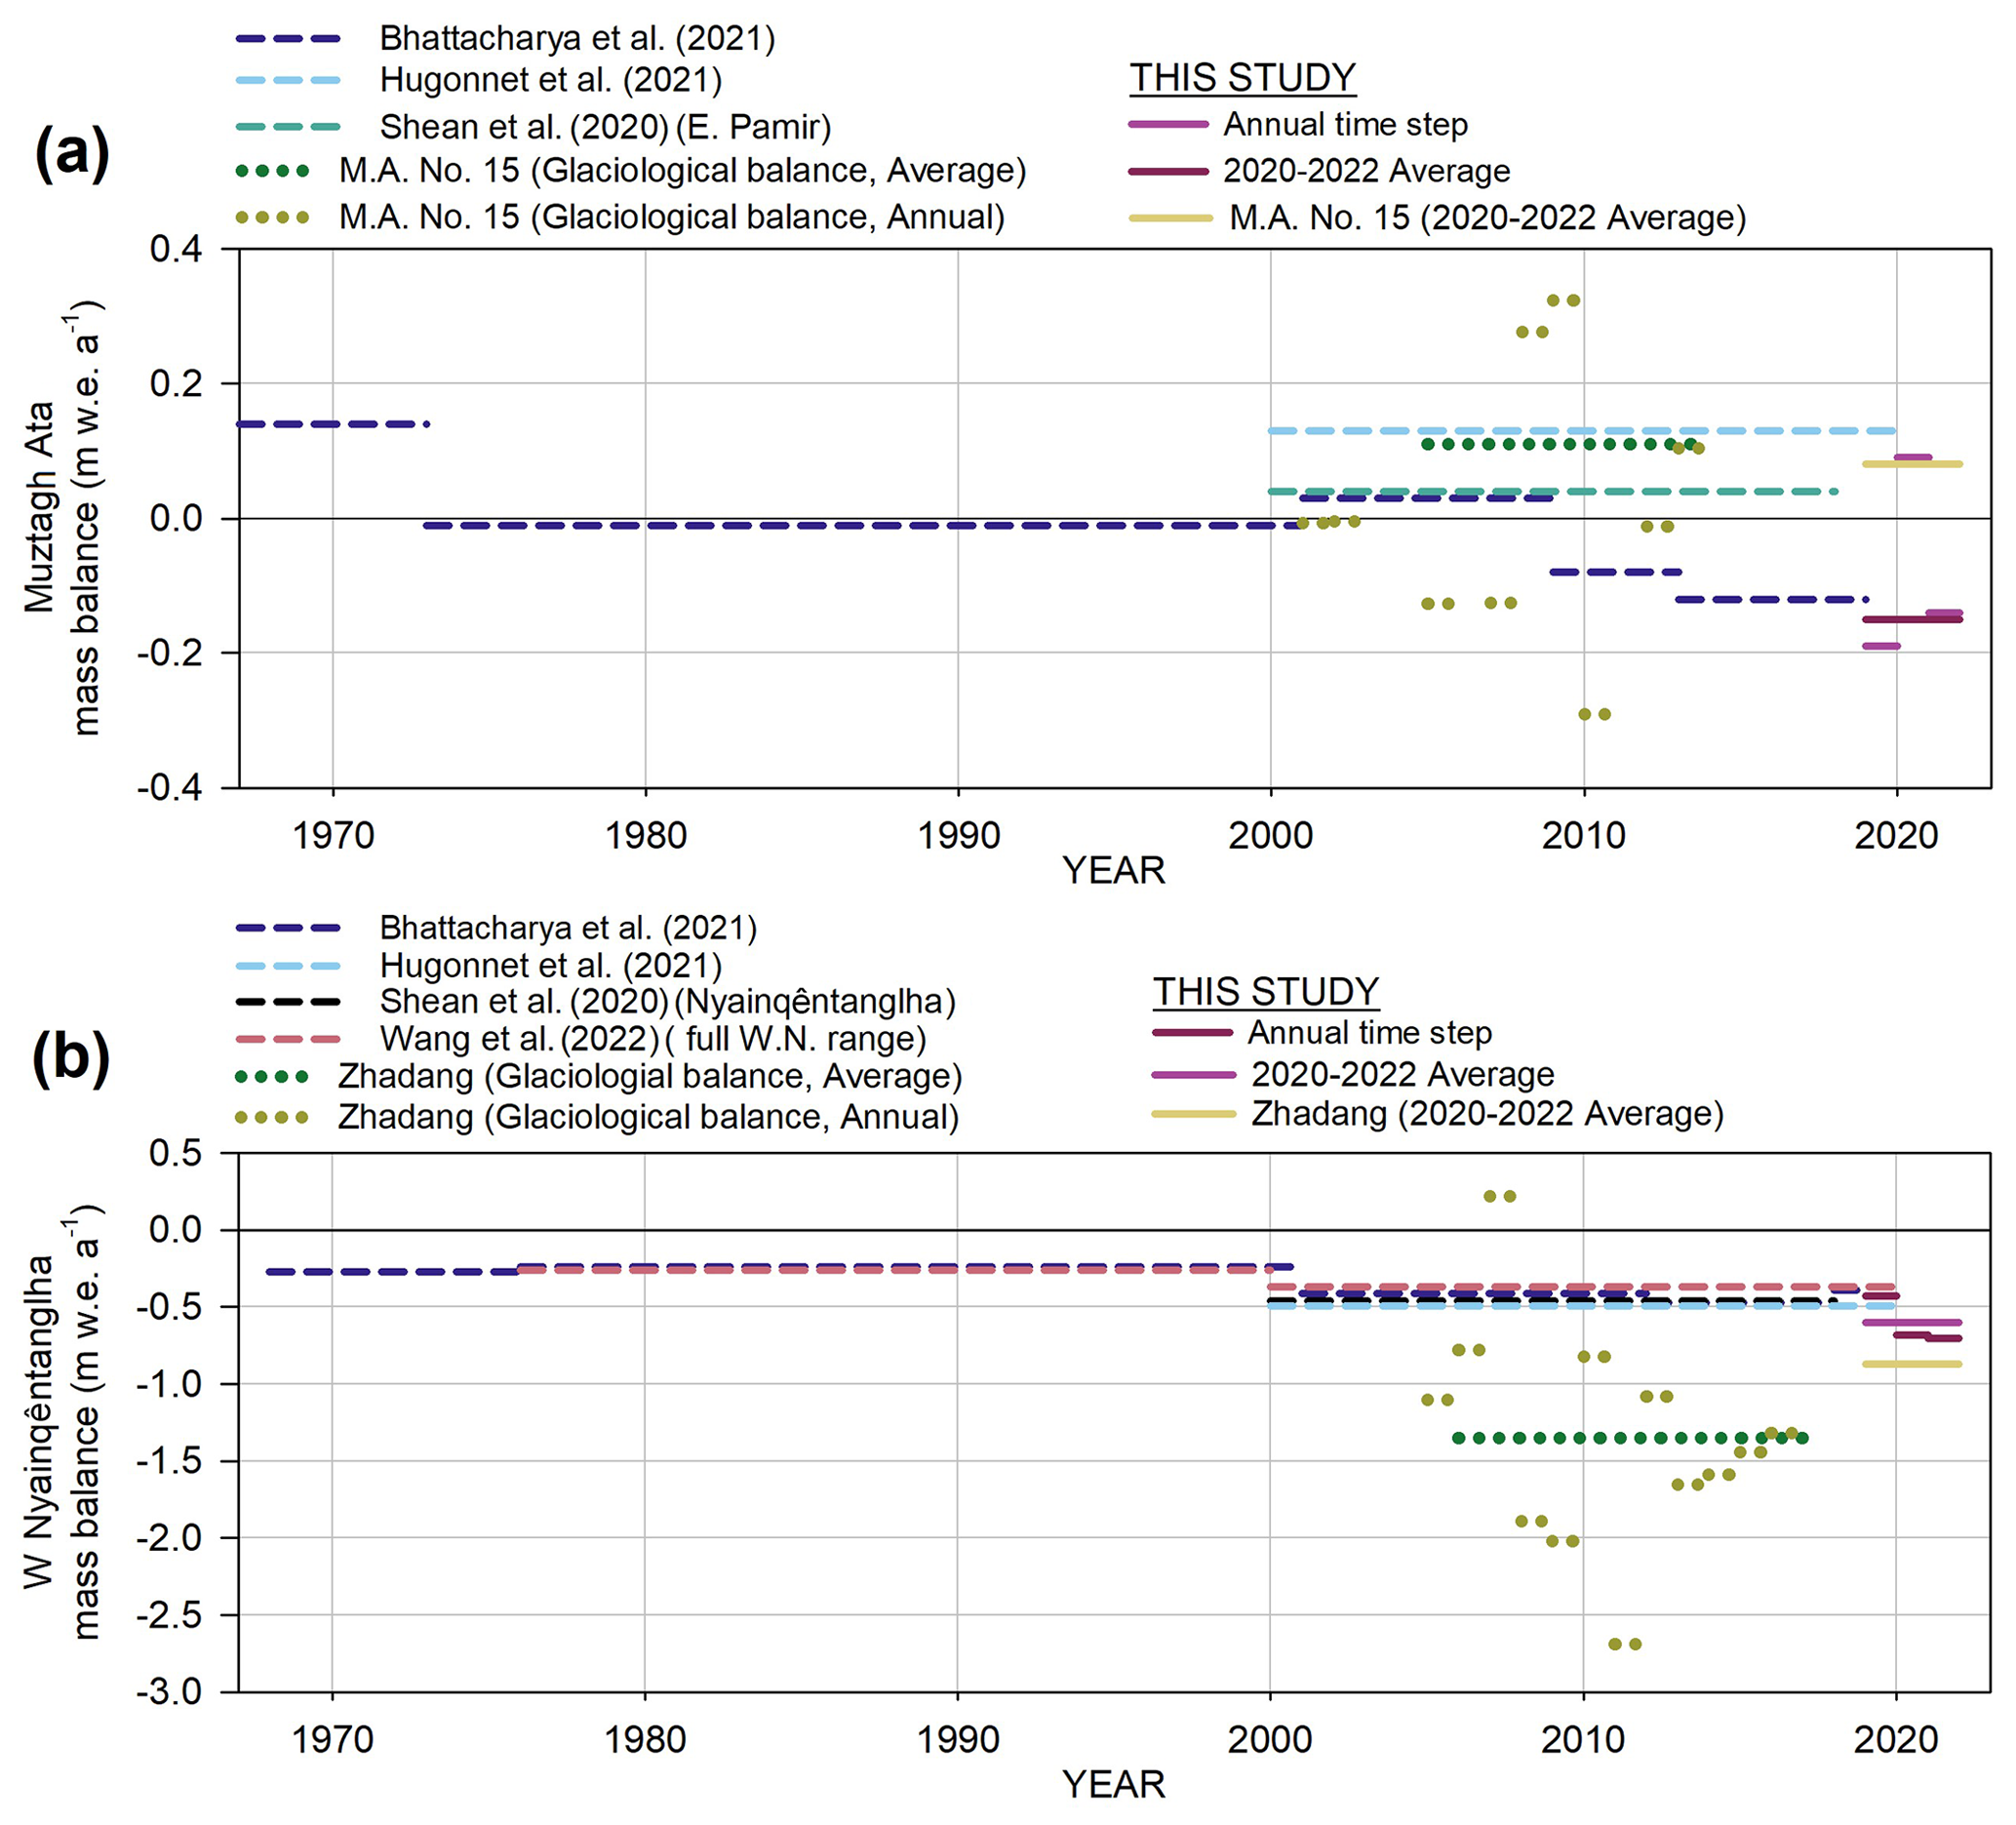
Figure 8Comparison of geodetic glacier mass balance for the total glacier area and specific glaciers with available glaciological mass balance records in Muztagh Ata (a) and western Nyainqêntanglha regions (b).
On an individual glacier basis, glaciological measurements exist for the small (∼ 1.1 km2) Muztagh Ata Glacier No. 15 (Fig. 1) between the years 2002 and 2014 (Yao et al., 2012, and unpublished data; Holzer et al., 2015). The mean 2005–2014 mass balance of this glacier was +0.11 m w.e. a−1, which is similar to our +0.12 ± 0.28 m w.e. a−1 2020–2022 average.
In contrast to Muztagh Ata, glaciers in the western Nyainqêntanglha range show much higher mass loss rates. The 2020 mass balance of −0.72 ± 0.16 m w.e. is not only much more negative than the −0.07 ± 0.20 w.e. a−1 2020–2022 average found in Muztagh Ata but also represents the highest recorded rate of ice mass loss for the western Nyainqêntanglha area itself since the late 1960s (Fig. 8b). Indeed, the mass budget has not been more negative than −0.65 ± 0.08 m w.e. a−1 over approximately the last 5 decades (Hugonnet et al., 2021a, and other sources; Table 4). It must be noted, however, that the sampled glaciers vary among these studies, and the mass budget could have differed if data from different temporal scales were considered.
Zhadang Glacier, which had a glaciological mass balance programme running between 2006 and 2017 (Yao et al., 2022), was one of the glaciers with the most negative mass budget in the western Nyainqêntanglha range. The 2020–2022 mean mass balance was −0.95 ± 0.25 m w.e. a−1, depicting a high mass loss rate consistent with modelled estimates (−1.06 m w.e. a−1 between 2001 and 2011, Huintjes et al., 2015;−0.91 m w.e. a−1 between 2010 and 2012, Zhu et al., 2015; −1.20 m w.e. a−1 between 2009 and 2011, Zhang et al., 2013). Surprisingly, though, remote-sensing-based estimates have yielded significatively less negative mass balances encompassing longer but overlapping periods (−0.50 ± 0.17 m w.e. a−1 between 2000 and 2014, Li and Lin, 2017; −0.60 ± 0.19 m w.e. a−1 between 2000 and 2017, Ren et al., 2020). The average 2006–2017 in situ mass balance of Zhadang Glacier (−1.35 m w.e. a−1; Yao et al., 2022) was found to be closer to our estimate, which may suggest that penetration correction for mass balance estimates based on DEMs originating from SAR data is inadequate in the area.
In this study we have assessed the capability of very-high-resolution Pléiades DEMs to quantify glacier mass balance over short (annual to seasonal) time steps over regions in High Mountain Asia that have shown contrasting mass balance trends in the last few decades. We find intrinsic DEM quality to be the main source of uncertainty in geodetic mass balance estimates rather than varying seasonal snow conditions across the two study sites. Indeed, the mean vertical precision (NMAD) of Muztagh Ata and western Nyainqêntanglha DEMs was ±1.3 and ±0.6 m to ±1.2 m, respectively. These levels of precision are in line with previously reported values of other very-high-resolution DEMs used in similar geodetic mass balance estimates worldwide.
Two main conclusions can be drawn from the internal consistency tests (utilized to evaluate the differences between accumulated vs. the sum of individual periods). On the one hand, the tests confirm that the use of a semi-automated approach such as ASMAG for the identification of different glacier surfaces (ice, snow, firn), and thus the distribution of assumed material densities, is a robust approach when quantifying glacier mass balance at a multi-glacier scale. Greater differences at individual glaciers, however, suggest that manual mapping by visual interpretation might be preferable, especially at small glaciers. Concurrently, the tests reaffirm that using time-weighted densities reduced the residuals between accumulated vs. added mass budgets, stressing the necessity of implementing detailed density distributions over constant values for intervals longer than 3 years.
Mean annual (−0.07 ± 0.20 m w.e. a−1) mass balance estimates in Muztagh Ata between 2020 and 2022 point to the continuation of the slight mass loss trend after a period of apparently balanced conditions. By contrast, the glacier mass balance in western Nyainqêntanglha reached a negative peak of −0.72 ± 0.16 m w.e. a−1 in 2022, which represents a new minimum over the last 6 decades. The analysis of ERA5-Land 1950–2021 temperature and GPM 2001–2021 solid precipitation anomalies confirms that the years 2020 and 2021 are (a) average years in terms of air temperature and snowfall in Muztagh Ata and (b) particularly warm and dry years in western Nyainqêntanglha.
The 2022 winter and summer mass balance estimates (+0.13 ± 0.24 and −0.35 ± 0.15 m w.e., respectively) in Muztagh Ata suggest a winter-accumulation type, whilst mass losses of −0.03 ± 0.27 and −0.63 ± 0.07 m w.e. in the winter and summer seasons, respectively, confirm a summer-accumulation-type regime in western Nyainqêntanglha, with ablation prevailing over accumulation in the summer (ablation) season. With the SAR-based Glacier Index, we indirectly validated our geodetic mass balance estimates and the derived inferences that were made in relation to glacier accumulation types in Muztagh Ata and western Nyainqêntanglha regions. Whilst the index does not provide a specific mass balance estimate per se that can be directly compared to geodetic (or glaciological) results, it can provide further insight into accumulation regimes in poorly known regions. Moreover, it fully bypasses the need for instrumental or reanalysis records, which are often unavailable or unrepresentative of climate conditions at glacier locations. Further geodetic and glaciological mass balance measurements in combination with such an index will open new possibilities in glaciological research.
Based on the above, we conclude that our DEM time series and mass budget estimates proved to be consistent for making reliable, short-term estimations of glacier mass balance using a remote-sensing-based approach. The increasing number and availability of very-high-resolution optical satellites with stereo capability and a relatively short revisit time, such as Pléiades, WorldView, SPOT6-7 or the recently launched ALOS-3 Pléiades Neo, will allow increasing the number of glaciers in isolated regions that can be readily monitored.
The DEM generation Stereo PipelineToolkit is available from Alexandrov et al. (2023): https://doi.org/10.5281/zenodo.10239162. The DEM coregistration code (Nuth and Kääb, 2011) is available from https://github.com/GlacioHack/GeoUtils (last access: 28 December 2022).
The glacier elevation change grids in this study are available from Zenodo at the following DOI: https://doi.org/10.5281/zenodo.10392969 (Falaschi et al., 2023b).
The Sentinel-2 scenes were obtained from the USGS EarthExplorer data poll (https://earthexplorer.usgs.gov/, U.S. Geological Survey, 2023) and the ESA Copernicus Open Access Hub (https://scihub.copernicus.eu/, Copernicus, 2022). The Sentinel-1 and Landsat OLI scenes used in the Glacier Index are available online on Google Earth Engine through the Google Cloud Storage and the Google Cloud public data programme. The elevation change grids from Bhattacharya et al. (2021b) are available from PANGAEA (https://www.pangaea.de, last access: 28 December 2022): https://doi.org/10.1594/PANGAEA.933924. The elevation change maps from Hugonnet et al. (2021b) are publicly available at https://doi.org/10.6096/13. The ERA-5 Land data were downloaded from the Copernicus Climate Change Service (Muñoz Sabater, 2019): https://doi.org/10.24381/cds.e2161bac.
The supplement related to this article is available online at: https://doi.org/10.5194/tc-17-5435-2023-supplement.
DF and TB designed the study. OK contributed to the study design. DF led the study, processed and analysed data, and wrote the paper. AB, KM, LH, and PR processed and analysed data. AB, KM, LH, OK, and TB contributed to the writing of the paper. TB and TY secured the funding. The order of authors from third to seventh is in alphabetical order.
At least one of the (co-)authors is a member of the editorial board of The Cryosphere. The peer-review process was guided by an independent editor, and the authors also have no other competing interests to declare.
Publisher’s note: Copernicus Publications remains neutral with regard to jurisdictional claims made in the text, published maps, institutional affiliations, or any other geographical representation in this paper. While Copernicus Publications makes every effort to include appropriate place names, the final responsibility lies with the authors.
We are grateful to CNES/Airbus DS for the provision of the Pléiades satellite data within the ISIS programme for reduced costs (Pléiades © CNES 2020/2021/2022 and AIRBUS DS). We would like to thank Christine Baron, Sylvie Boureausseau, and the whole Airbus Intelligence Team for their assistance during the acquisition of the Pléiades imagery. We are grateful to Etienne Berthier for kindly providing the along-track bias correction and the elevation change uncertainty “patch” tools. Special thanks go to the editor Regula Frauenfelder and to Cesar Deschamps-Berger and the two anonymous reviewers for their thorough review of the original manuscript.
This study was supported by the Strategic Priority Research Program of the Chinese Academy of Sciences (grant no. XDA20100300) and the Swiss National Science Foundation (grant no. 200021E_177652/1) within the framework of the DFG Research Unit GlobalCDA (FOR2630) and benefited from the research cooperation within the Dragon 5 programme supported by ESA and NRSCC (grant no. 4000136930/22/I-NB). Atanu Bhattacharya received funding from the Science and Engineering Research Board (SERB), Department of Science and Technology (DST), India (grant no. CRG/2021/002450).
This paper was edited by Regula Frauenfelder and reviewed by César Deschamps-Berger and two anonymous referees.
Abdel Jaber, W., Rott, H., Floricioiu, D., Wuite, J., and Miranda, N.: Heterogeneous spatial and temporal pattern of surface elevation change and mass balance of the Patagonian ice fields between 2000 and 2016, The Cryosphere, 13, 2511–2535, https://doi.org/10.5194/tc-13-2511-2019, 2019.
Alexandrov, O., McMichael, S., Broxton, M., Lundy, M., Beyer, R., Husmann, K., Edwards, L., Nefian, A., Smith., B, Shean, D., Smith, T., mstyer, Annex, A., Moratto, Z., Harguess, J.. Dehecq, A., Nodjoumi, G., Aravkin, A., Meyer, J., PicoJr., Bhushan, S., and Jay, L.: NeoGeographyToolkit/StereoPipeline: 2023-11-30-daily-build (2023-11-30-daily-build), Zenodo [code], https://doi.org/10.5281/zenodo.10239162, 2023.
Andreassen, L. M., Elvehøy, H., Kjøllmoen, B., and Engeset, R. V.: Reanalysis of long-term series of glaciological and geodetic mass balance for 10 Norwegian glaciers, The Cryosphere, 10, 535–552, https://doi.org/10.5194/tc-10-535-2016, 2016.
Armstrong, W. H., Polashenski, D., Truffer, M., Horne, G., Hanson, J. B., Hawley, R. L., Hengst, A. M., Vowels, L., Menounos, B., and Wychen, W. V.: Declining basal motion dominates the long-term slowing of Athabasca Glacier, Canada, J. Geophys. Res.-Earth, 127, 2021JF006439, https://doi.org/10.1029/2021JF006439, 2022.
Belart, J. M. C., Berthier, E., Magnússon, E., Anderson, L. S., Pálsson, F., Thorsteinsson, T., Howat, I. M., Aðalgeirsdóttir, G., Jóhannesson, T., and Jarosch, A. H.: Winter mass balance of Drangajökull ice cap (NW Iceland) derived from satellite sub-meter stereo images, The Cryosphere, 11, 1501–1517, https://doi.org/10.5194/tc-11-1501-2017, 2017.
Belart, J. M. C., Magnússon, E., Berthier, E., Pálsson, F., Aðalgeirsdóttir, G., and Jóhannesson, T.: The geodetic mass balance of Eyjafjallajökull ice cap for 1945–2014: Processing guidelines and relation to climate, J. Glaciol. 65, 395–409, https://doi.org/10.1017/jog.2019.16, 2019.
Beraud, L., Cusicanqui, D., Rabatel, A., Brun, F., Vincent, C., and Six, D.: Glacier-wide seasonal and annual geodetic mass balances from Pléiades stereo images: Application to the Glacier d'Argentière, French Alps, J. Glaciol., 69, 525–537, https://doi.org/10.1017/jog.2022.79, 2023.
Berthier, E. and Brun, F.: Karakoram geodetic glacier mass balances between 2008 and 2016: Persistence of the anomaly and influence of a large rock avalanche on Siachen Glacier, J. Glaciol., 65, 494–507, https://doi.org/10.1017/jog.2019.32, 2019.
Berthier, E., Vincent, C., Magnússon, E., Gunnlaugsson, Á. Þ., Pitte, P., Le Meur, E., Masiokas, M., Ruiz, L., Pálsson, F., Belart, J. M. C., and Wagnon, P.: Glacier topography and elevation changes derived from Pléiades sub-meter stereo images, The Cryosphere, 8, 2275–2291, https://doi.org/10.5194/tc-8-2275-2014, 2014.
Berthier, E., Cabot, V., Vincent, C., and Six, D.: Decadal region-wide and glacier-wide mass balances derived from multi-temporal ASTER satellite Digital Elevation Models. Validation over the Mont-Blanc area, Front. Earth Sci., 4, 63, https://doi.org/10.3389/feart.2016.00063, 2016.
Beyer, R. A., Alexandrov, O., and McMichael, S.: The Ames Stereo Pipeline: NASA’s Open Source Software for Deriving and Processing Terrain Data, Earth Space Sci., 5, 537–548, https://doi.org/10.1029/2018EA000409, 2018.
Bhattacharya, A., Bolch, T., Mukherjee, K., King, O., Menounos, B., Kapitsa, V., Neckel, N., Yang, W., and Yao, T.: High Mountain Asian glacier response to climate revealed by multi-temporal satellite observations since the 1960s, Nat. Commun., 12, 4133, https://doi.org/10.1038/s41467-021-24180-y, 2021a.
Bhattacharya, A., Bolch, T., Mukherjee, K., King, O., Menounos, B., Kapitsa, V., Neckel, N., Yang, W., and Yao, T.: Glacier elevation changes data in the High Mountain Asia derived from multi-temporal digital elevation models since the 1960s, PANGAEA [data set], https://doi.org/10.1594/PANGAEA.933924, 2021b.
Bippus, G.: Characteristics of summer snow areas on glaciers observed by means of Landsat data, PhD thesis, University of Innsbruck, Austria, https://www.uibk.ac.at/projects/station-hintereis-opal-data/theses/pdf/bippus_2011.pdf (last access: 10 December 2023), 2011.
Bolch, T., Yao, T., Kang, S., Buchroithner, M. F., Scherer, D., Maussion, F., Huintjes, E., and Schneider, C.: A glacier inventory for the western Nyainqentanglha Range and the Nam Co Basin, Tibet, and glacier changes 1976–2009, The Cryosphere, 4, 419–433, https://doi.org/10.5194/tc-4-419-2010, 2010.
Bolch, T., Kulkarni, A., Kääb, A., Huggel, C., Paul, F., Cogley, J. G., Frey, H., Kargel, J. S., Fujita, K., Scheel, M., Bajracharya, S., and Stoffel, M.: The state and fate of Himalayan glaciers, Science, 336, 310–314, https://doi.org/10.1126/science.1215828, 2012.
Bolch, T., Pieczonka, T., Mukherjee, K., and Shea, J.: Brief communication: Glaciers in the Hunza catchment (Karakoram) have been nearly in balance since the 1970s, The Cryosphere, 11, 531–539, https://doi.org/10.5194/tc-11-531-2017, 2017.
Bolch, T., Shea, J. M., Liu, S., Azam, F. M., Gao, Y., Gruber, S., Immerzeel, W. W., Kulkarni, A., Li, H., Tahir, A. A., Zhang, G., and Zhang, Y.: Status and Change of the Cryosphere in the Extended Hindu Kush Himalaya Region, in: The Hindu Kush Himalaya Assessment, edited by: Wester, P., Mishra, A., Mukherji, A., and Shrestha, A. B., Springer Nature, Cham, Switzerland, 209–255, https://doi.org/10.1007/978-3-319-92288-1_7, 2019a.
Bolch, T., Rohrbach, N., Kutuzov, S., Robson, B. A., and Osmonov, A.: Occurrence, evolution and ice content of ice-debris complexes in the Ak-Shiirak, Central Tien Shan revealed by geophysical and remotely-sensed investigations: Ice-debris complexes in Ak-Shiirak, Earth Surf. Process Landf., 44, 129–143, https://doi.org/10.1002/esp.4487, 2019b.
Braun, M. H., Malz, P., Sommer, C., Farías-Barahona, D., Sauter, T., Casassa, G., Soruco, A., Skvarca, P., and Seehaus, T. C.: Constraining glacier elevation and mass changes in South America, Nat. Clim. Change, 9, 130–136, https://doi.org/10.1038/s41558-018-0375-7, 2019.
Brun, F., Berthier, E., Wagnon, P., Kääb, A., and Treichler, D.: A spatially resolved estimate of High Mountain Asia glacier mass balances from 2000 to 2016, Nat. Geosci., 10, 668–673, https://doi.org/10.1038/ngeo2999, 2017.
Brun, F., Wagnon, P., Berthier, E., Jomelli, V., Maharjan, S. B., Shrestha, F., and Kraaijenbrink, P. D. A.: Heterogeneous influence of glacier morphology on the mass balance variability in High Mountain Asia, J. Geophys. Res.-Earth, 124, 1331–1345, https://doi.org/10.1029/2018JF004838, 2019.
Burns, P. and Nolin, A.: Using atmospherically-corrected Landsat imagery to measure glacier area change in the Cordillera Blanca, Peru from 1987 to 2010, Remote Sens. Environ., 140, 165–178, https://doi.org/10.1016/j.rse.2013.08.026, 2014.
Caidong, C. and Sorteberg, A.: Modelled mass balance of Xibu glacier, Tibetan Plateau: sensitivity to climate change, J. Glaciol., 56, 235–248, https://doi.org/10.3189/002214310791968467, 2010.
Clarke, G. K. C., Anslow, F. S., Jarosch, A. H., Radić, V., Menounos, B., Bolch, T., and Berthier, E.: Ice volume and subglacial topography for Western Canadian glaciers from mass balance fields, Thinning Rates, and a Bed Stress Model, J. Climate, 26, 4282–4303, https://doi.org/10.1175/JCLI-D-12-00513.1, 2013.
Cogley, G. J.: Geodetic and direct mass-balance measurements: Comparison and joint analysis, Ann. Glaciol., 50, 96–100, https://doi.org/10.3189/172756409787769744, 2009.
Cogley, J. G., Hock, R., Rasmussen, L. A., Arendt, A. A., Bauder, A., Braithwaite, R. J., Jansson, P., Kaser, G., Möller, M., Nicholson, L., and Zemp, M.: Glossary of glacier mass balance and related terms, IHP-VII Technical Documents in Hydrology No. 86, IACS Contribution No. 2, UNESCO-IHP, Paris, https://unesdoc.unesco.org/ark:/48223/pf0000192525 (last access: 10 December 2023), 2011.
Copernicus: Homepage, https://scihub.copernicus.eu/, last access: 28 December 2022.
Davaze, L., Rabatel, A., Dufour, A., Hugonnet, R., and Arnaud, Y.: Region-wide annual glacier surface mass balance for the European Alps from 2000 to 2016, Front. Earth Sci., 8, 149, https://doi.org/10.3389/feart.2020.00149, 2020.
Dehecq, A., Millan, R., Berthier, E., Gourmelen, N., Trouve, E., and Vionnet, V.: Elevation changes inferred from TanDEM-X data over the Mont-Blanc area: Impact of the X-Band Interferometric Bias, IEEE J. Sel. Top. Appl. Earth Obs., 9, 3870–3882, https://doi.org/10.1109/JSTARS.2016.2581482, 2016.
Dehecq, A., Gourmelen, N., Gardner, A. S., Brun, F., Goldberg, D., Nienow, P. W., Berthier, E., Vincent, C., Wagnon, P., and Trouvé, E.: Twenty-first century glacier slowdown driven by mass loss in High Mountain Asia, Nat. Geosci., 12, 22–27, https://doi.org/10.1038/s41561-018-0271-9, 2019.
Denzinger, F., Machguth, H., Barandun, M., Berthier, E., Girod, L., Kronenberg, M., Usubaliev, R., and Hoelzle, M.: Geodetic mass balance of Abramov Glacier from 1975 to 2015, J. Glaciol., 67, 331–342, https://doi.org/10.1017/jog.2020.108, 2021.
Deschamps-Berger, C., Gascoin, S., Berthier, E., Deems, J., Gutmann, E., Dehecq, A., Shean, D., and Dumont, M.: Snow depth mapping from stereo satellite imagery in mountainous terrain: evaluation using airborne laser-scanning data, The Cryosphere, 14, 2925–2940, https://doi.org/10.5194/tc-14-2925-2020, 2020.
Duan, K., Xu, B., and Wu, G.: Snow accumulation variability at altitude of 7010 m a.s.l. in Muztag Ata Mountain in Pamir Plateau during 1958–2002, J. Hydrol., 531, 912–918, https://doi.org/10.1016/j.jhydrol.2015.10.013, 2015.
Dussaillant, I., Berthier, E., Brun, F., Masiokas, M., Hugonnet, R., Favier, V., Rabatel, A., Pitte, P., and Ruiz, L.: Two decades of glacier mass loss along the Andes, Nat. Geosci., 12, 802–808, https://doi.org/10.1038/s41561-019-0432-5, 2019.
Falaschi, D., Rivera, A., Lo Vecchio Repetto, A., Moragues, S., Villalba, R., Rastner, P., Zeller, J., and Salcedo, A. P.: Evolution of surface characteristics of three debris-covered glaciers in the Patagonian Andes from 1958 to 2020, Front. Earth Sci, 9, 671854, https://doi.org/10.3389/feart.2021.671854, 2021.
Falaschi, D., Berthier, E., Belart, J. M. C., Bravo, C., Castro, M., Durand, M., and Villalba, R.: Increased mass loss of glaciers in Volcán Domuyo (Argentinian Andes) between 1962 and 2020, revealed by aerial photos and satellite stereo imagery, J. Glaciol., 69, 40–56, https://doi.org/10.1017/jog.2022.43, 2023a.
Falaschi, D., Bhattacharya, A., Guillet, G., Huang, L., King, O., Mukherjee, K., Rastner, P., Yao, T., and Bolch, T.: 2020-2022-glacier-elevation-change-data-in-Muztag-Ata-and-Western-Nyainqentanglha-from-Pleiades-DEMs, Zenodo [data set], https://doi.org/10.5281/zenodo.10392969, 2023b.
Farinotti, D., Immerzeel, W. W., de Kok, R. J., Quincey, D. J., and Dehecq, A.: Manifestations and mechanisms of the Karakoram glacier anomaly, Nat. Geosci., 13, 8–16, https://doi.org/10.1038/s41561-019-0513-5, 2020.
Fischer, M., Huss, M., Kummert, M., and Hoelzle, M.: Application and validation of long-range terrestrial laser scanning to monitor the mass balance of very small glaciers in the Swiss Alps, The Cryosphere, 10, 1279–1295, https://doi.org/10.5194/tc-10-1279-2016, 2016.
Fujita, K. and Ageta, Y.: Effect of summer accumulation on glacier mass balance on the Tibetan Plateau revealed by mass-balance model, J. Glaciol., 46, 244–252, https://doi.org/10.3189/172756500781832945, 2000.
Gardelle, J., Berthier, E., Arnaud, Y., and Kääb, A.: Region-wide glacier mass balances over the Pamir-Karakoram-Himalaya during 1999–2011, The Cryosphere, 7, 1263–1286, https://doi.org/10.5194/tc-7-1263-2013, 2013.
Girod, L., Nuth, C., Kääb, A., McNabb, R., and Galland, O.: MMASTER: Improved ASTER DEMs for elevation change monitoring, Remote Sens., 9, 704, https://doi.org/10.3390/rs9070704, 2017.
Gorelick, N., Hancher, M., Dixon, M., Ilyushchenko, S., Thau, D., and Moore, R.: Google Earth Engine: Planetary-scale geospatial analysis for everyone, Remote Sens. Environ., 202, 18–27, https://doi.org/10.1016/j.rse.2017.06.031, 2017.
Gleyzes, M. A., Perret, L., and Kubik, P.: Pleiades System Architecture and Main Performances, Int. Arch. Photogramm. Remote Sens. Spatial Inf. Sci., XXXIX-B1, 537–542, https://doi.org/10.5194/isprsarchives-XXXIX-B1-537-2012, 2012.
Guillet, G., King, O., Lv, M., Ghuffar, S., Benn, D., Quincey, D., and Bolch, T.: A regionally resolved inventory of High Mountain Asia surge-type glaciers, derived from a multi-factor remote sensing approach, The Cryosphere, 16, 603–623, https://doi.org/10.5194/tc-16-603-2022, 2022.
Guo, Z., Wang, N., Kehrwald, N. M., Mao, R., Wu, H., Wu, Y., and Jiang, X.: Temporal and spatial changes in Western Himalayan firn line altitudes from 1998 to 2009, Glob. Planet. Change, 118, 97–105, https://doi.org/10.1016/j.gloplacha.2014.03.012, 2014.
Hirschmuller, H.: Stereo Processing by Semiglobal Matching and Mutual Information. IEEE Trans. Pattern. Anal. Mach. Intell., 30, 328–341, https://doi.org/10.1109/TPAMI.2007.1166, 2007.
Höhle, J. and Höhle, M.: Accuracy assessment of digital elevation models by means of robust statistical methods, ISPRS J. Photogramm. Remote Sens., 64, 398–406, https://doi.org/10.1016/j.isprsjprs.2009.02.003, 2009.
Holzer, N., Vijay, S., Yao, T., Xu, B., Buchroithner, M., and Bolch, T.: Four decades of glacier variations at Muztagh Ata (eastern Pamir): a multi-sensor study including Hexagon KH-9 and Pléiades data, The Cryosphere, 9, 2071–2088, https://doi.org/10.5194/tc-9-2071-2015, 2015.
Huang, L., Li, Z., Tian, B., Chen, Q., and Zhou, J.: Monitoring glacier zones and snow/firn line changes in the Qinghai–Tibetan Plateau using C-band SAR imagery, Remote Sens. Environ., 137, 17–30, https://doi.org/10.1016/j.rse.2013.05.016, 2013.
Huang, L., Hock, R., Li, X., Bolch, T., Yang, K., Wang, N., Yao, T., Zhou, J., Dou, C., and Li, Z.: Winter accumulation drives the spatial variations in glacier mass balance in High Mountain Asia, Sci. Bull., 67, 1967–1970, https://doi.org/10.1016/j.scib.2022.08.019, 2022.
Hugonnet, R., McNabb, R., Berthier, E., Menounos, B., Nuth, C., Girod, L., Farinotti, D., Huss, M., Dussaillant, I., Brun, F., and Kääb, A.: Accelerated global glacier mass loss in the early twenty-first century, Nature, 592, 726–731, https://doi.org/10.1038/s41586-021-03436-z, 2021a.
Hugonnet, R., McNabb, R., Berthier, E., Menounos, B., Nuth, C., Girod, L., Farinotti, D., Huss, M., Dussaillant, I., Brun, F., and Kääb, A.: Accelerated global glacier mass loss in the early twenty-first century – Dataset, THEIA [dataset], https://doi.org/10.6096/13, 2021b.
Hugonnet, R., Brun, F., Berthier, E., Dehecq, A., Mannerfelt, E. S., Eckert, N., and Farinotti, D.: Uncertainty analysis of digital elevation models by spatial inference from stable terrain, IEEE J. Sel. Top. Appl. Earth Obs. Remote Sens., 15, 6456–6472, https://doi.org/10.1109/JSTARS.2022.3188922, 2022.
Huintjes, E., Sauter, T., Schröter, B., Maussion, F., Yang, W., Kropáček, J., Buchroithner, M., Scherer, D., Kang, S., and Schneider, C.: Evaluation of a coupled snow and energy balance model for Zhadang Glacier, Tibetan Plateau, using glaciological measurements and time-lapse photography, Arct. Antarct. Alp. Res., 47, 573–590, https://doi.org/10.1657/AAAR0014-073, 2015.
Huss, M.: Density assumptions for converting geodetic glacier volume change to mass change, The Cryosphere, 7, 877–887, https://doi.org/10.5194/tc-7-877-2013, 2013.
Huss, M., Sold, L., Hoelzle, M., Stokvis, M., Salzmann, N., Farinotti, D., and Zemp, M.: Towards remote monitoring of sub-seasonal glacier mass balance, Ann. Glaciol., 54, 75–83, https://doi.org/10.3189/2013AoG63A427, 2013.
Immerzeel, W. W., Lutz, A. F., Andrade, M., Bahl, A., Biemans, H., Bolch, T., Hyde, S., Brumby, S., Davies, B. J., Elmore, A. C., Emmer, A., Feng, M., Fernández, A., Haritashya, U., Kargel, J. S., Koppes, M., Kraaijenbrink, P. D. A., Kulkarni, A. V., Mayewski, P. A., Nepal, S., Pacheco, P., Painter, T. H., Pellicciotti, F., Rajaram, H., Rupper, S., Sinisalo, A., Shrestha, A. B., Viciroli, D., Wada, Y., Yao, T., and Baillie, J. E. M.: Importance and vulnerability of the world's water towers, Nature, 577, 364–369, https://doi.org/10.1038/s41586-019-1822-y, 2020.
Jakob, L., Gourmelen, N., Ewart, M., and Plummer, S.: Spatially and temporally resolved ice loss in High Mountain Asia and the Gulf of Alaska observed by CryoSat-2 swath altimetry between 2010 and 2019, The Cryosphere, 15, 1845–1862, https://doi.org/10.5194/tc-15-1845-2021, 2021.
Kääb, A., Treichler, D., Nuth, C., and Berthier, E.: Brief Communication: Contending estimates of 2003–2008 glacier mass balance over the Pamir–Karakoram–Himalaya, The Cryosphere, 9, 557–564, https://doi.org/10.5194/tc-9-557-2015, 2015.
Kääb, A., Winsvold, S., Altena, B., Nuth, C., Nagler, T., and Wuite, J.: Glacier remote sensing using Sentinel-2. Part I: radiometric and geometric performance, and application to ice velocity, Remote Sens., 8, 598, https://doi.org/10.3390/rs8070598, 2016.
Kang, S., Chen, F., Gao, T., Zhang, Y., Yang, W., Yu, W., and Yao, T.: Early onset of rainy season suppresses glacier melt: A case study on Zhadang glacier, Tibetan Plateau, J. Glaciol., 55, 755–758, https://doi.org/10.3189/002214309789470978, 2009.
King, O., Bhattacharya, A., Bhambri, R., and Bolch, T.: Glacial lakes exacerbate Himalayan glacier mass loss, Sci. Rep., 9, 18145, https://doi.org/10.1038/s41598-019-53733-x, 2019.
King, O., Bhattacharya, A., and Bolch, T.: The presence and influence of glacier surging around the Geladandong ice caps, North East Tibetan Plateau, Adv. Clim. Chang. Res., 12, 299–312, https://doi.org/10.1016/j.accre.2021.05.001, 2021.
Klug, C., Bollmann, E., Galos, S. P., Nicholson, L., Prinz, R., Rieg, L., Sailer, R., Stötter, J., and Kaser, G.: Geodetic reanalysis of annual glaciological mass balances (2001–2011) of Hintereisferner, Austria, The Cryosphere, 12, 833–849, https://doi.org/10.5194/tc-12-833-2018, 2018.
Koblet, T., Gärtner-Roer, I., Zemp, M., Jansson, P., Thee, P., Haeberli, W., and Holmlund, P.: Reanalysis of multi-temporal aerial images of Storglaciären, Sweden (1959–99) – Part 1: Determination of length, area, and volume changes, The Cryosphere, 4, 333–343, https://doi.org/10.5194/tc-4-333-2010, 2010.
Li, G. and Lin, H.: Recent decadal glacier mass balances over the Western Nyainqêntanglha Mountains and the increase in their melting contribution to Nam Co Lake measured by differential bistatic SAR interferometry, Glob. Planet. Change, 149, 177–190, https://doi.org/10.1016/j.gloplacha.2016.12.018, 2017.
Liang, Q., Wang, N., Yang, X., Chen, A., Hua, T., Li, Z., and Yang, D.: The eastern limit of “Kunlun-Pamir-Karakoram Anomaly” reflected by changes in glacier area and surface elevation, J. Glaciol., 68, 1167–1176, https://doi.org/10.1017/jog.2022.30, 2022.
Luo, W., Zhang, G., Chen, W., and Xu, F.: Response of glacial lakes to glacier and climate changes in the Western Nyainqêntanglha range, Sci. Total Environ., 735, 139607, https://doi.org/10.1016/j.scitotenv.2020.139607, 2020.
Lv, M., Quincey, D. J., Guo, H., King, O., Liu, G., Yan, S., Lu, X., and Ruan, Z.: Examining geodetic glacier mass balance in the eastern Pamir transition zone, J. Glaciol., 66, 927–937, https://doi.org/10.1017/jog.2020.54, 2020.
Maurer, J. M., Rupper, S. B., and Schaefer, J. M.: Quantifying ice loss in the eastern Himalayas since 1974 using declassified spy satellite imagery, The Cryosphere, 10, 2203–2215, https://doi.org/10.5194/tc-10-2203-2016, 2016.
Maussion, F., Scherer, D., Mölg, T., Collier, E., Curio, J., and Finkelnburg, R.: Precipitation seasonality and variability over the Tibetan Plateau as resolved by the High Asia Reanalysis, J. Climate, 27, 1910–1927, https://doi.org/10.1175/JCLI-D-13-00282.1, 2014.
McNabb, R., Nuth, C., Kääb, A., and Girod, L.: Sensitivity of glacier volume change estimation to DEM void interpolation, The Cryosphere, 13, 895–910, https://doi.org/10.5194/tc-13-895-2019, 2019.
Mölg, T., Maussion, F., Yang, W., and Scherer, D.: The footprint of Asian monsoon dynamics in the mass and energy balance of a Tibetan glacier, The Cryosphere, 6, 1445–1461, https://doi.org/10.5194/tc-6-1445-2012, 2012.
Mölg, T., Maussion, F., and Scherer, D.: Mid-latitude westerlies as a driver of glacier variability in monsoonal High Asia, Nat. Clim. Change, 4, 68–73, https://doi.org/10.1038/nclimate2055, 2014.
Mukherjee, K., Menounos, B., Shea, J., Mortezapour, M., Ednie, M., and Demuth, M. N.: Evaluation of surface mass-balance records using geodetic data and physically-based modelling, Place and Peyto glaciers, western Canada, J. Glaciol., 69, 665–682, https://doi.org/10.1017/jog.2022.83, 2023.
Muñoz Sabater, J.: ERA5-Land hourly data from 1950 to present, Copernicus Climate Change Service (C3S) Climate Data Store (CDS) [data set], https://doi.org/10.24381/cds.e2161bac, 2019.
Muñoz-Sabater, J., Dutra, E., Agustí-Panareda, A., Albergel, C., Arduini, G., Balsamo, G., Boussetta, S., Choulga, M., Harrigan, S., Hersbach, H., Martens, B., Miralles, D. G., Piles, M., Rodríguez-Fernández, N. J., Zsoter, E., Buontempo, C., and Thépaut, J.-N.: ERA5-Land: a state-of-the-art global reanalysis dataset for land applications, Earth Syst. Sci. Data, 13, 4349–4383, https://doi.org/10.5194/essd-13-4349-2021, 2021.
Nuth, C. and Kääb, A.: Co-registration and bias corrections of satellite elevation data sets for quantifying glacier thickness change, The Cryosphere, 5, 271–290, https://doi.org/10.5194/tc-5-271-2011, 2011.
Nuth, C., Schuler, T. V., Kohler, J., Altena, B., and Hagen, J. O.: Estimating the long-term calving flux of Kronebreen, Svalbard, from geodetic elevation changes and mass-balance modeling, J. Glaciol., 58, 119–133, https://doi.org/10.3189/2012JoG11J036, 2012.
Otsu, N.: A Threshold Selection Method from Gray-Level Histograms, IEEE Trans. Syst. Man Cybern. Syst., 9, 62–66, https://doi.org/10.1109/TSMC.1979.4310076, 1979.
Paul, F., Bolch, T., Kääb, A., Nagler, T., Nuth, C., Scharrer, K., Shepherd, A., Strozzi, T., Ticconi, F., Bhambri, R., Berthier, E., Bevan, S., Gourmelen, N., Heid, T., Jeong, S., Kunz, M., Lauknes, T. R., Luckman, A., Merryman Boncori, J. P., Moholdt, G., Muir, A., Neelmeijer, J., Rankl, M., VanLooy, J., and Van Niel, T.: The glaciers climate change initiative: methods for creating glacier area, elevation change and velocity products, Remote Sens. Environ., 162, 408–426, https://doi.org/10.1016/j.rse.2013.07.043, 2015.
Pelto, B. M., Menounos, B., and Marshall, S. J.: Multi-year evaluation of airborne geodetic surveys to estimate seasonal mass balance, Columbia and Rocky Mountains, Canada, The Cryosphere, 13, 1709–1727, https://doi.org/10.5194/tc-13-1709-2019, 2019.
Racoviteanu, A. E., Rittger, K., and Armstrong, R.: An automated approach for estimating snowline altitudes in the Karakoram and Eastern Himalaya from Remote Sensing, Front. Earth Sci., 7, 220, https://doi.org/10.3389/feart.2019.00220, 2019.
Rastner, P., Prinz, R., Notarnicola, C., Nicholson, L., Sailer, R., Schwaizer, G., and Paul, F.: On the automated mapping of snow cover on glaciers and calculation of snow line altitudes from multi-temporal Landsat data, Remote Sens., 11, 1410, https://doi.org/10.3390/rs11121410, 2019.
Ren, S., Menenti, M., Jia, L., Zhang, J., Zhang, J., and Li, X.: Glacier mass balance in the Nyainqêntanglha Mountains between 2000 and 2017 retrieved from ZiYuan-3 stereo images and the SRTM DEM, Remote Sens., 12, 864, https://doi.org/10.3390/rs12050864, 2020.
RGI Consortium: Randolph Glacier Inventory – A dataset of global glacier outlines, Version 6, NSIDC [data set], https://doi.org/10.7265/4M1F-GD79, 2017.
Rieg, L., Klug, C., Nicholson, L., and Sailer, R.: Pléiades Tri-Stereo Data for Glacier Investigations – Examples from the European Alps and the Khumbu Himal, Remote Sens., 10, 1563, https://doi.org/10.3390/rs10101563, 2018.
Sakai, A. and Fujita, K.: Contrasting glacier responses to recent climate change in high-mountain Asia, Sci. Rep., 7, 13717, https://doi.org/10.1038/s41598-017-14256-5, 2017.
Sakai, A., Nuimura, T., Fujita, K., Takenaka, S., Nagai, H., and Lamsal, D.: Climate regime of Asian glaciers revealed by GAMDAM glacier inventory, The Cryosphere, 9, 865–880, https://doi.org/10.5194/tc-9-865-2015, 2015.
Scherler, D., Wulf, H., and Gorelick, N.: Global assessment of supraglacial debris-cover extents, Geophys. Res. Lett., 45, 11798–11805, https://doi.org/10.1029/2018GL080158, 2018.
Seong, Y. B., Owen, L. A., Yi, C., Finkel, R. C., and Schoenbohm, L.: Geomorphology of anomalously high glaciated mountains at the northwestern end of Tibet: Muztag Ata and Kongur Shan, Geomorphology, 103, 227–250, https://doi.org/10.1016/j.geomorph.2008.04.025, 2009.
Shean, D. E., Alexandrov, O., Moratto, Z. M., Smith, B. E., Joughin, I. R., Porter, C., and Morin, P.: An automated, open-source pipeline for mass production of digital elevation models (DEMs) from very-high-resolution commercial stereo satellite imagery, ISPRS J. Photogramm. Remote Sens., 116, 101–117, https://doi.org/10.1016/j.isprsjprs.2016.03.012, 2016.
Shean, D. E., Bhushan, S., Montesano, P., Rounce, D. R., Arendt, A., and Osmanoglu, B.: A systematic, regional assessment of High Mountain Asia glacier mass balance, Front. Earth Sci., 7, 363, https://doi.org/10.3389/feart.2019.00363, 2020.
Shi, J. and Menenti, M.: Monitoring recent variations of the movements on the polythermal glaciers – a case study in the Nyainqêntanglha Mountains, in: 2013 IEEE International Geoscience and Remote Sensing Symposium – IGARSS, Melbourne, Australia, 21–26 July 2013, 3622–3625, https://doi.org/10.1109/IGARSS.2013.6723614, 2013.
Sold, L., Huss, M., Hoelzle, M., Andereggen, H., Joerg, P. C., and Zemp, M.: Methodological approaches to infer end-of-winter snow distribution on alpine glaciers, J. Glaciol., 59, 1047–1059, https://doi.org/10.3189/2013JoG13J015, 2013.
Sommer, C., Malz, P., Seehaus, T. C., Lippl, S., Zemp, M., and Braun, M. H.: Rapid glacier retreat and downwasting throughout the European Alps in the early 21st century, Nat. Commun., 11, 3209, https://doi.org/10.1038/s41467-020-16818-0, 2020.
U.S. Geological Survey: Earth Explorer, USGS [data set], https://earthexplorer.usgs.gov/ (last access: 28 December 2022), 2023.
Van Tiel, M., Kohn, I., Van Loon, A. F., and Stahl, K.: The compensating effect of glaciers: Characterizing the relation between interannual streamflow variability and glacier cover, Hydrol. Proc., 34, 553–568, https://doi.org/10.1002/hyp.13603, 2020.
Vishwakarma, B. D., Ramsankaran, R., Azam, Mohd. F., Bolch, T., Mandal, A., Srivastava, S., Kumar, P., Sahu, R., Navinkumar, P. J., Tanniru, S. R., Javed, A., Soheb, M., Dimri, A. P., Yadav, M., Devaraju, B., Chinnasamy, P., Reddy, M. J., Murugesan, G. P., Arora, M., Jain, S. K., Ojha, C. S. P., Harrison, S., and Bamber, J.: Challenges in understanding the variability of the cryosphere in the Himalaya and its impact on regional water Resources, Front. Water, 4, 909246, https://doi.org/10.3389/frwa.2022.909246, 2022.
Wagnon, P., Brun, F., Khadka, A., Berthier, E., Shrestha, D., Vincent, C., Arnaud, Y., Six, D., Dehecq, A., Ménégoz, M., and Jomelli, V.: Reanalysing the 2007–19 glaciological mass-balance series of Mera Glacier, Nepal, Central Himalaya, using geodetic mass balance, J. Glaciol., 67, 117–125, https://doi.org/10.1017/jog.2020.88, 2021.
Wang, Q. and Sun, W.: Seasonal Cycles of High Mountain Asia Glacier Surface Elevation Detected by ICESat-2, J. Geophys. Res.-Atmos., 127, e2022JD037501, https://doi.org/10.1029/2022JD037501, 2022.
Wang, S., Liu, J., Pritchard, H. D., Ke, L., Qiao, X., Zhang, J., Xiao, W., and Zhou, Y.: Characterizing 4 decades of accelerated glacial mass loss in the west Nyainqentanglha Range of the Tibetan Plateau, Hydrol. Earth Syst. Sci., 27, 933–952, https://doi.org/10.5194/hess-27-933-2023, 2023.
Wortmann, M., Bolch, T., Menz, C., Tong, J., and Krysanova, V.: Comparison and Correction of High-Mountain Precipitation Data Based on Glacio-Hydrological Modeling in the Tarim River Headwaters (High Asia), J. Hydrometeorol. 19, 777–801, https://doi.org/10.1175/JHM-D-17-0106.1, 2018.
Wu, K., Liu, S., Guo, W., Wei, J., Xu, J., Bao, W., and Yao, X.: Glacier change in the western Nyainqêntanglha Range, Tibetan Plateau using historical maps and Landsat imagery: 1970–2014, J. Mt. Sci, 13, 1358–1374, https://doi.org/10.1007/s11629-016-3997-0, 2016.
Wu, K., Liu, S., Zhu, Y., Xie, F., Gao, Y., Qi, M., Miao, W., Duan, S., Han, F., and Grünwald, R.: Monitoring the surface elevation changes of a monsoon temperate glacier with repeated UAV surveys, Mainri Mountains, China, Remote Sens., 14, 2229, https://doi.org/10.3390/rs14092229, 2022.
Xu, C., Li, Z., Wang, P., Anjum, M. N., Li, H., and Wang, F.: Detailed comparison of glaciological and geodetic mass balances for Urumqi Glacier No.1, eastern Tien Shan, China, from 1981 to 2015, Cold Reg. Sci. Technol., 155, 137–148, https://doi.org/10.1016/j.coldregions.2018.08.006, 2018.
Yan, S., Guo, H., Liu, G., and Ruan, Z.: Mountain glacier displacement estimation using a DEM-assisted offset tracking method with ALOS/PALSAR data, Remote Sens. Lett., 4, 494–503, https://doi.org/10.1080/2150704X.2012.754561, 2013.
Yang, H., Yan, S., Liu, G., and Ruan, Z.: Fluctuations and movements of the Kuksai Glacier, western China, derived from Landsat image sequences, J. Appl. Remote. Sens., 8, 084599, https://doi.org/10.1117/1.JRS.8.084599, 2013.
Yao, T., Li, Z., Yang, W., Guo, X., Zhu, L., Kang, S., Wu, Y., and Yu, W.: Glacial distribution and mass balance in the Yarlung Zangbo River and its influence on lakes, Chinese Sci. Bull., 55, 2072–2078, https://doi.org/10.1007/s11434-010-3213-5, 2010.
Yao, T., Thompson, L., Yang, W., Yu, W., Gao, Y., Guo, X., Yang, X., Duan, K., Zhao, H., Xu, B., Pu, J., Lu, A., Xiang, Y., Kattel, D. B., and Joswiak, D.: Different glacier status with atmospheric circulations in Tibetan Plateau and surroundings, Nat. Clim. Change, 2, 663–667, https://doi.org/10.1038/nclimate1580, 2012.
Yao, T., Bolch, T., Chen, D., Gao, J., Immerzeel, W., Piao, S., Su, F., Thompson, L., Wada, Y., Wang, L., Wang, T., Wu, G., Xu, B., Yang, W., Zhang, G., and Zhao, P.: The imbalance of the Asian water tower, Nat. Rev. Earth Environ., 3, 618–632, https://doi.org/10.1038/s43017-022-00299-4, 2022.
Zemp, M., Thibert, E., Huss, M., Stumm, D., Rolstad Denby, C., Nuth, C., Nussbaumer, S. U., Moholdt, G., Mercer, A., Mayer, C., Joerg, P. C., Jansson, P., Hynek, B., Fischer, A., Escher-Vetter, H., Elvehøy, H., and Andreassen, L. M.: Reanalysing glacier mass balance measurement series, The Cryosphere, 7, 1227–1245, https://doi.org/10.5194/tc-7-1227-2013, 2013.
Zemp, M., Frey, H., and Gärtner-Roer, I.: Historically unprecedented global glacier decline in the early 21st century, J. Glaciol., 61, 745–762, https://doi.org/10.3189/2015JoG15J017, 2015.
Zhang, G., Kang, S., Fujita, K., Huintjes, E., Xu, J., Yamazaki, T., Haginoya, S., Wei, Y., Scherer, D., Schneider, C., and Yao, T.: Energy and mass balance of Zhadang glacier surface, central Tibetan Plateau, J. Glaciol., 59, 137–148, https://doi.org/10.3189/2013JoG12J152, 2013.
Zhang, Q. and Zhang, G.: Glacier elevation changes in the western Nyainqêntanglha Range of the Tibetan Plateau as observed by TerraSAR-X/TanDEM-X images, Remote Sens. Lett., 8, 1142–1151, https://doi.org/10.1080/2150704X.2017.1362123, 2017.
Zhang, Z., Liu, S., Wei, J., Xu, J., Guo, W., Bao, W., and Jiang, Z.: Mass change of glaciers in Muztag Ata–Kongur Tagh, eastern Pamir, China from 1971/76 to 2013/14 as derived from remote sensing data, PLoS One, 11, e0147327, https://doi.org/10.1371/journal.pone.0147327, 2016.
Zhou, J., Li, Z., and Guo, W.: Estimation and analysis of the surface velocity field of mountain glaciers in Muztag Ata using satellite SAR data, Environ. Earth Sci., 71, 3581–3592, https://doi.org/10.1007/s12665-013-2749-5, 2014.
Zhou, Y., Li, Z., Li, J., Zhao, R., and Ding, X.: Glacier mass balance in the Qinghai–Tibet Plateau and its surroundings from the mid-1970s to 2000 based on Hexagon KH-9 and SRTM DEMs, Remote Sens. Environ., 210, 96–112, https://doi.org/10.1016/j.rse.2018.03.020, 2018.
Zhu, M., Yao, T., Yang, W., Maussion, F., Huintjes, E., and Li, S.: Energy- and mass-balance comparison between Zhadang and Parlung No. 4 glaciers on the Tibetan Plateau, J. Glaciol., 61, 595–607, https://doi.org/10.3189/2015JoG14J206, 2015.
Zhu, M., Yao, T., Yang, W., Xu, B., Wu, G., Wang, X., and Xie, Y.: Reconstruction of the mass balance of Muztag Ata No. 15 glacier, eastern Pamir, and its climatic drivers, J. Glaciol., 64, 259–274, https://doi.org/10.1017/jog.2018.16, 2018a.
Zhu, M., Yao, T., Yang, W., Xu, B., Wu, G., and Wang, X.: Differences in mass balance behavior for three glaciers from different climatic regions on the Tibetan Plateau, Clim. Dynam., 50, 3457–3484, https://doi.org/10.1007/s00382-017-3817-4, 2018b.