the Creative Commons Attribution 4.0 License.
the Creative Commons Attribution 4.0 License.
 | 11 Dec 2023
From atmospheric water isotopes measurement to firn core interpretation in Adélie Land: a case study for isotope-enabled atmospheric models in Antarctica
Christophe Leroy-Dos Santos
Elise Fourré
Cécile Agosta
Mathieu Casado
Alexandre Cauquoin
Martin Werner
Benedicte Minster
Frédéric Prié
Olivier Jossoud
Leila Petit
Amaëlle Landais
In a context of global warming and sea level rise acceleration, it is key to estimate the evolution of the atmospheric hydrological cycle and temperature in polar regions, which directly influence the surface mass balance of the Arctic and Antarctic ice sheets. Direct observations are available from satellite data for the last 40 years and a few weather data since the 1950s in Antarctica. One of the best ways to access longer records is to use climate proxies in firn or ice cores. The water isotopic composition in these cores is widely used to reconstruct past temperature variations.
We need to progress in our understanding of the influence of the atmospheric hydrological cycle on the water isotopic composition of ice cores. First, we present a 2-year-long time series of vapor and precipitation isotopic composition measurement at Dumont d’Urville Station, in Adélie Land. We characterize diurnal variations of meteorological parameters (temperature, atmospheric water mixing ratio (hereafter humidity) and δ18O) for the different seasons and determine the evolution of key relationships (δ18O versus temperature or humidity) throughout the year: we find that the temperature vs. δ18O relationship is dependent on synoptic events dynamics in winter contrary to summer. Then, this data set is used to evaluate the atmospheric general circulation model ECHAM6-wiso (model version with embedded water stable isotopes) in a coastal region of Adélie Land where local conditions are controlled by strong katabatic winds which directly impact the isotopic signal. We show that a combination of continental (79 %) and oceanic (21 %) grid cells leads model outputs (temperature, humidity and δ18O) to nicely fit the observations, at different timescales (i.e., seasonal to synoptic). Therefore we demonstrate the added value of long-term water vapor isotopic composition records for model evaluation.
Then, as a clear link is found between the isotopic composition of water vapor and precipitation, we assess how isotopic models can help interpret short firn cores. In fact, a virtual firn core built from ECHAM-wiso outputs explains much more of the variability observed in S1C1 isotopic record than a virtual firn core built from temperature only. Yet, deposition and post-deposition effects strongly affect the firn isotopic signal and probably account for most of the remaining misfits between archived firn signal and virtual firn core based on atmospheric modeling.
- Article
(4876 KB) - Full-text XML
-
Supplement
(2548 KB) - BibTeX
- EndNote


East Antarctica is the biggest freshwater reservoir on Earth (Smith and Evans, 2007). In a context of global warming, it is key to monitor and anticipate the surface mass balance (SMB) of this region and its link with climate change. Adélie Land is part of the Wilkes Land coast, a region that is at the boundary between the eastern part of the Antarctic Plateau and the Indian Ocean. Recent studies based on remote observations, reanalysis or CMIP5 models disagree on the recent evolution of temperature in this region (Wang et al., 2020; Retamales-Muñoz et al., 2019; Stenni et al., 2017), showing that it is complicated to determine how it is impacted by global warming.
Antarctica climate and ice sheet altitude evolution have been measured for 4 decades based on remote sensing and show an increasing mass loss in Wilkes Land (Rignot et al., 2019). These reconstructions require calibrations or evaluation with ground-based measurements, but weather stations and direct observations of surface mass balance are sparse (Favier et al., 2013; Wang et al., 2021). Global reanalysis data are suitable for studying climate variability, but these products have only been reliable in the data-scarce Antarctic region since 1979, when they began assimilating satellite data (Marshall et al., 2022). For periods older than 40 years, Antarctic climate reconstructions rely on a few weather stations installed in the 1950s (Fogt et al., 2016) or on the interpretation of climate proxies. Water isotope measurements in firn and ice cores are key tools to provide reconstruction of past climate and atmospheric water cycle over the last centuries and millennia (Jouzel et al., 2013; Stenni et al., 2017). They have been extensively used for past temperature reconstructions in continental Antarctica where water isotopic depletion can be related to temperature decrease through increased distillation along the atmospheric moisture path from evaporative regions to the precipitation sites of interest (Jouzel et al., 2007; Stenni et al., 2011). The interpretation of water isotope records in coastal Antarctica is more difficult because distillation is not the sole dominant influence on the water isotopic signal. Local effects of ocean evaporation itself influenced by the presence of sea ice, katabatic wind direction and speed, remobilization or sublimation of surface snow may also have a strong effect on the water isotopic composition of the deposited snow and hence on the archived signal (Ekaykin et al., 2002; Casado et al., 2018). While these effects prevent a simple interpretation of water isotopes as temperature proxy, they open the way to the use of these tracers to better constrain the past atmospheric water cycle.
In fact, recent studies have shown that isotopic signals recorded in coastal ice or firn cores are poorly correlated to surface temperature (Goursaud et al., 2017, 2019) or to SMB (Schlosser et al., 2014). This is confirmed by Altnau et al. (2015), who observed weaker relationship between SMB and δ18O for coastal firn cores in comparison to inland drilling sites with a 76-firn-core data set in Dronning Maud Land. Finally, these studies point out the need to take into account the influences of atmospheric dynamics and local processes, in addition to the classical thermodynamics part on isotopic signals. For instance, Sinclair et al. (2014) studied sea ice variations in the Ross Sea using d-excess signal, a second-order parameter reflecting evaporative conditions, coupled with chemical indicators in a core from Whitehall Glacier. This study attributes the observed variations to enhanced southerly winds and an increased advection of sea ice to the north showing regional dynamics influences. Also, from shallow firn cores drilled in Fimbul Ice Shelf in western Dronning Maud Land, Vega et al. (2016) suggest that d-excess reflects the effect of seasonal moisture transport changes. Furthermore, other ice core interpretation techniques, such as virtual firn cores (Sime et al., 2011; Casado et al., 2020) that take into account the intermittency of precipitation and isotope diffusion in firn, encourage the use of isotope-enabled models in order to consider other processes than temperature that affect isotopic signal (Sime et al., 2011; Casado et al., 2020). For example, Goursaud et al. (2018) demonstrated how ECHAM5-wiso could be valuable to investigate the dynamics of water stable isotope composition in precipitation in regard to different locations or seasons.
We build on these previous studies and aim at better constraining the isotopic signal of water vapor and precipitation in coastal sites to improve the interpretation of firn and ice core archives. This can be achieved by measuring the isotopic composition of precipitation and water vapor on site in order to understand local dynamics influences and using atmospheric general circulation models (AGCMs) equipped with water vapor isotope outputs that already include various processes linked to atmospheric dynamics. For example, large diurnal cycles observed in the isotopic composition of water vapor at Dome C were associated with atmospheric regimes demonstrating the impact of local meteorological processes on the isotopic signal (Casado et al., 2016). At Kohnen, Ritter et al. (2016) showed that mean diurnal cycle amplitude simulated by AGCMs (ECHAM5-wiso and LMDZ5Aiso) is lower than observed. In coastal regions, it has been observed that the isotopic signature of maritime air mass contrasts with depleted cold glacial air mass at Syowa Station (Kurita et al., 2016), while in Adélie Land, a first summer campaign of measurements made it possible to understand the influence of katabatic wind dynamics on the diurnal isotopic cycle (Bréant et al., 2019). Also, a 2-year data series at Neumayer station III was used to associate isotopic signal in water vapor to air masses origin through back trajectory simulations analyses (Bagheri Dastgerdi et al., 2021).
Here we present a long-term study of continuous isotopic measurement of water vapor and precipitation at Dumont d’Urville (DDU). First, we present our instrumental setup and the 2-year isotopic series observed at DDU. Then, we show the ECHAM6-wiso output at DDU geographical position and evaluate the model performance. Finally, we discuss the added value of an isotope-enabled model for ice-core interpretation in coastal regions by comparing an ECHAM6-wiso based virtual firn core to a firn core drilled close to DDU and presented in a previous study (Goursaud et al., 2017).
2.1 Observations
2.1.1 Water vapor isotopic composition
A Picarro analyzer (L2130-i) was installed in December 2018 in Adélie Land, at the coastal DDU station (Fig. 1) to monitor the isotopic composition of atmospheric water vapor. We used the same configuration as in Bréant et al. (2019); i.e., an inlet is positioned 1 m above the shelter roof, 6 m above ground level, roughly 30 m above sea level (a.s.l.). This inlet is connected to the isotopic analyzer by a heated and insulated perfluoroalkoxy (PFA) tube. The inlet is covered by a Gelman Zefluor 0.5 µm filter to prevent any inflow of precipitation, blowing snow or penguin feathers. Continuous measurement of the isotopic composition of atmospheric water vapor is still running to date. Here we present the first 2 years of measurements, from 1 January 2019 to 31 December 2020.
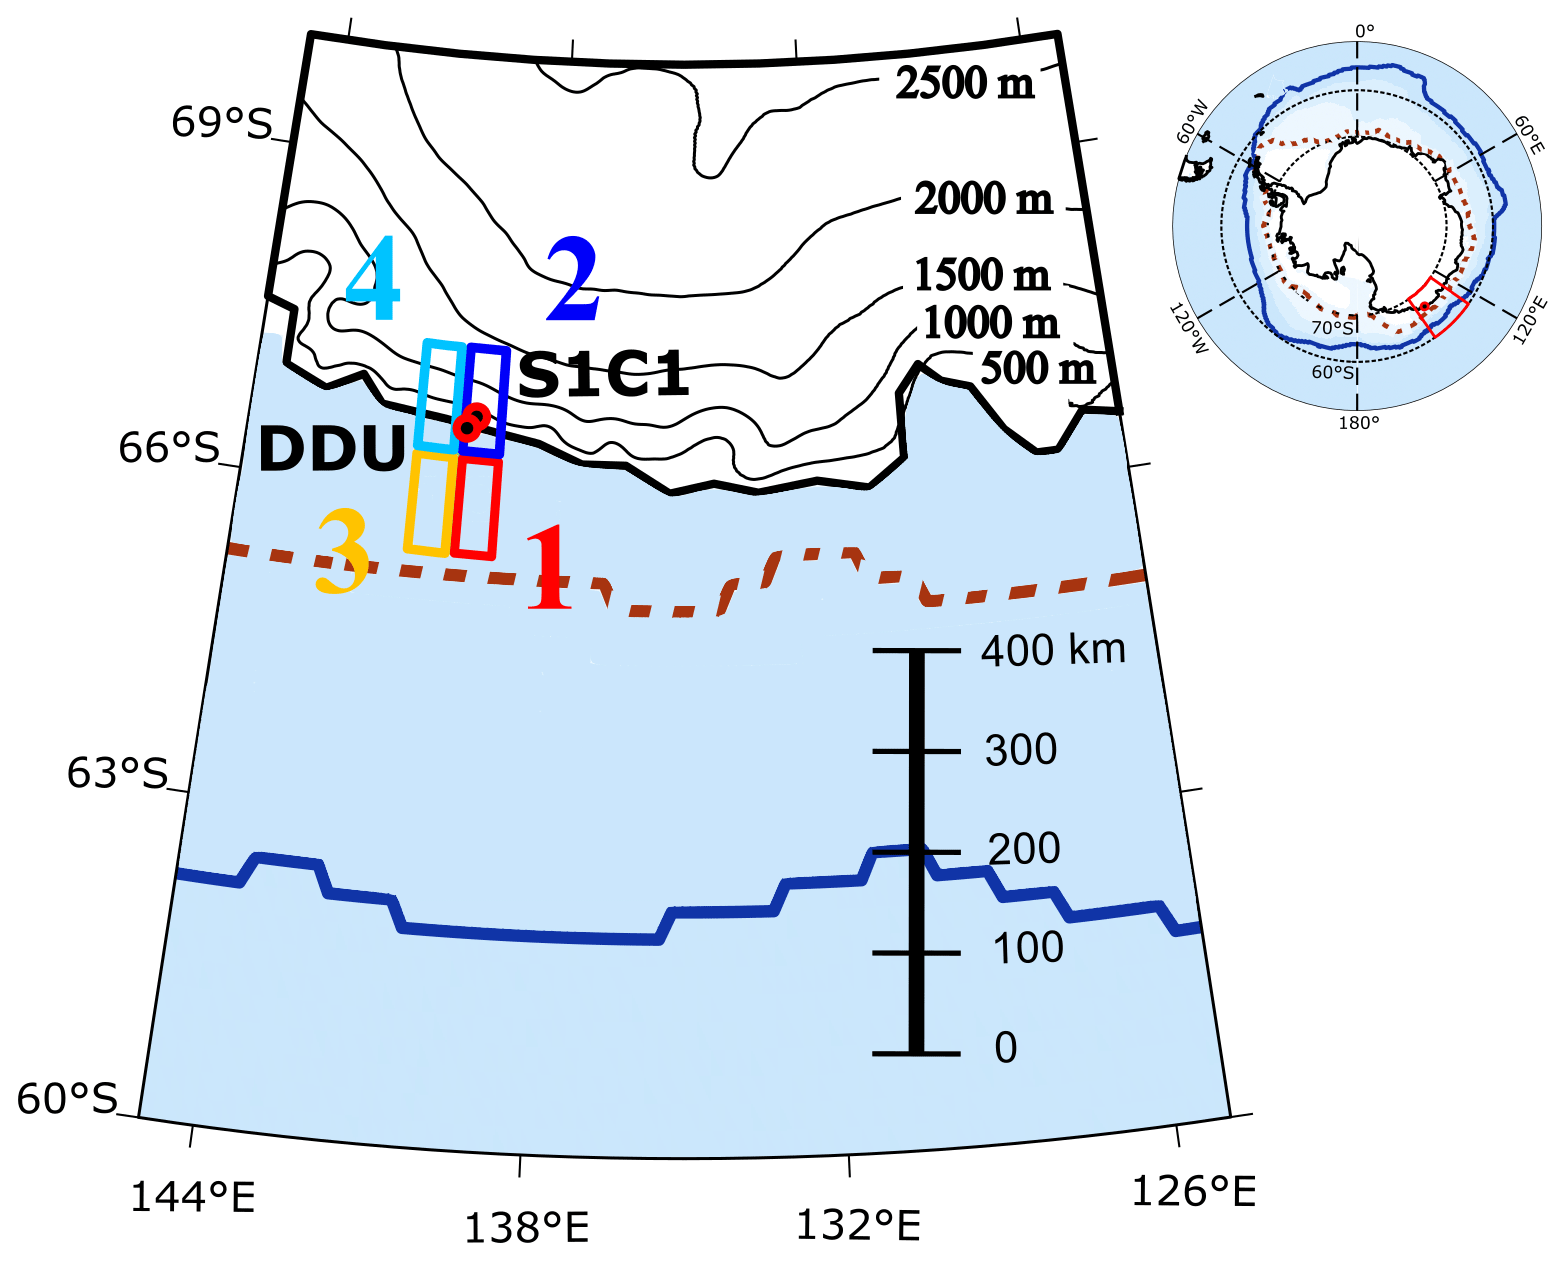
Figure 1Adélie Land map with Dumont d'Urville scientific station (located on Petrel Island, 5 km from the coast) and S1C1 drilling site (10 km inland) indicated by red dots. Black contours represent the topography, bold red dashed (bold blue) lines represent the sea-ice extent in March (October), defined as areas with a minimum sea-ice fraction of 0.15 from the ERA5 reanalysis over the period 1979–2020, as in Ding et al. (2017). Labeled (from #1 to #4) and colored (in red, blue, orange and light blue) rectangles represent closest ECHAM6-wiso grid cells to DDU.
The laser spectrometer measures molecular water vapor mixing ratio (in ppmv), hereafter called humidity, and water vapor δ18O and δD. The raw data sets have been calibrated and corrected following the protocol outlined in previous studies (Tremoy et al., 2011; Bonne et al., 2014; Steen-Larsen et al., 2014) and described below.
Humidity values have been compared to independent measurements from Meteo France weather station at DDU (Fig. S1 in Supplement). The comparison shows a robust linear relationship between both measurements over the 2-year period (coefficient of determination, hereafter called R2, equal to 0.99 and slope of 0.98). In the following, we only display raw humidity data from Picarro without any correction.
The δ18O and δD series were calibrated following the approach described in Leroy‐Dos Santos et al. (2020). Three main corrections were applied: (1) the influence of humidity on δ18O and δD measurement, (2) the difference between the measured values and the true isotopic values, and (3) the temporal drift of the instrument. For the calibration procedure, we used both a specifically designed low humidity level generator described in Leroy-Dos Santos et al. (2021) and a standard delivery module (SDM) associated with a Picarro brand vaporizer for higher humidity values. For consistency with the international VSMOW-SLAP scale (International Atomic Energy Agency, 2006), we relied on two bracketing internal standard waters: NEEM (δ18O: , δD: ) and FP5 (δ18O: , δD: ), calibrated at the Laboratoire des Sciences du Climat et de l'Environnement (LSCE) with mass spectrometry for δ18O and with laser spectrometry for δD.
To determine the isotope–humidity relationship for calibration, vapor with known isotopic composition was generated at different humidity levels, from 150 to 1500 ppmv with the low humidity level generator (in the field) and from 1000 to 5500 ppmv with the SDM (at LSCE). A well-constrained relationship is determined from the 2018 data set over the whole range of humidity values (Fig. S2). We note that we do not observe differences between field and LSCE relationships. Further measurements in 2019, 2020 and 2021 show that this calibration is stable over time, as already noted by Bailey et al. (2015). This calibration curve also takes into account the shift between measured and true isotopic values. The same shift in δ18O and δD has been observed between measured and true value for both NEEM and FP5. We checked the mean drift of the instrument by measuring NEEM standard at 1100 ppmv using an automatic routine every 48 h. Some technical issues led us to select only 150 calibrations over the 2-year period (Fig. S3). A large scattering was observed which was due to problem with the humidity generator during the winter, and we only used the data acquired during summer field season for the drift calibration (Text S1 in the Supplement). The estimated correction associated with the mean linear drift is insignificant with respect to the humidity dependency correction, and we estimate the mean uncertainty as 0.8 ‰ and 3.2 ‰ for δ18O and δD, respectively (details in Text S1).
2.1.2 Precipitation isotopic composition
In parallel with continuous water vapor isotopic measurements, the isotopic composition of precipitation and surface snow is also monitored. Precipitation is collected on a daily basis whenever the amount of precipitation is sufficient using a wooden platform with a plastic bottom (length × width × height cm) installed at DDU station on building rooftop. Samples are sent back in −20 ∘C shipment to LSCE once a year. Measurements are performed with a L2130-i Picarro laser spectrometer working in liquid mode. The uncertainty (1σ) of our data set is 0.2 ‰ and 0.7 ‰, respectively, for δ18O and δD. It is estimated using replicates (two measurements) over 15 % of the samples.
2.1.3 Meteorological data
Meteorological data have been available since 1956 at the Meteo France weather station of DDU at 3 h resolution and 1 h resolution. Hereafter, we use the 2 m air temperature (∘C), the specific humidity (volume mixing ratio in ppmv), calculated from pressure (mbar), temperature and relative humidity (%), as well as the wind speed (m s−1) and direction (∘).
2.2 ECHAM6-wiso model
ECHAM6-wiso is the isotopic version of the atmospheric general circulation model ECHAM6 (Stevens et al., 2013). The implementation of the water isotopes in ECHAM6 has been described in detail by Cauquoin et al. (2019) and has been updated in several aspects by Cauquoin and Werner (2021) to make the model results more consistent with the last findings based on water isotope observations (isotopic composition of snow on sea ice taken into account, supersaturation equation slightly updated, and kinetic fractionation factors for oceanic evaporation assumed to be independent of wind speed). We have used ECHAM6-wiso model outputs from a simulation at high spatial resolution (at T127L95, 0.9∘ horizontal resolution and 95 vertical levels) nudged to ERA5 reanalysis (Hersbach et al., 2020). The ECHAM6-wiso 3D-fields of temperature, vorticity and divergence as well as the surface pressure field were nudged toward the ERA5 reanalysis data every 6 h. The orbital parameters and greenhouse gases concentrations have been set to the values of the corresponding model year. The monthly mean sea surface temperature (SST) and sea-ice fields from the ERA5 reanalysis have been applied as ocean surface boundary conditions, as well as a mean δ18O of surface seawater reconstruction from the global gridded data set of LeGrande and Schmidt (2006). As no equivalent data set of the δD composition of seawater exists, the deuterium isotopic composition of the seawater in any grid cell has been set equal to the related δ18O composition, multiplied by a factor of 8, in accordance with the observed relation for meteoric water on a global scale (Craig, 1961). The ECHAM6-wiso simulation is described in detail and evaluated in Cauquoin and Werner (2021).
3.1 Vapor and precipitation records
We present the full 2019–2020 record of hourly atmospheric vapor isotopic composition at DDU (Fig. 2). The mean temperature and humidity over the 2-year measurement period (−11.2 ∘C and 1883 ppmv) are close to the average value calculated over the full data set available from Meteo France since 1957 (−10.8 ∘C and 1826 ppmv) and show similar seasonal cycles (Fig. 2). A clear seasonal cycle is observed for all variables except d-excess (Table 1), with higher mean values in summer (−2.3 ∘C, 3354 ppmv and −27.5 ‰ for temperature, humidity and δ18O, respectively, in December, January and February (DJF)) than in winter (−17.0 ∘C, 1185 ppmv, −34.8 ‰ in June, July and August (JJA)). The difference of d-excess mean value between winter and summer (2.4 ‰) is not significant compared to the standard deviation (3.2 ‰ and 3.3 ‰ for DJF and JJA, respectively).
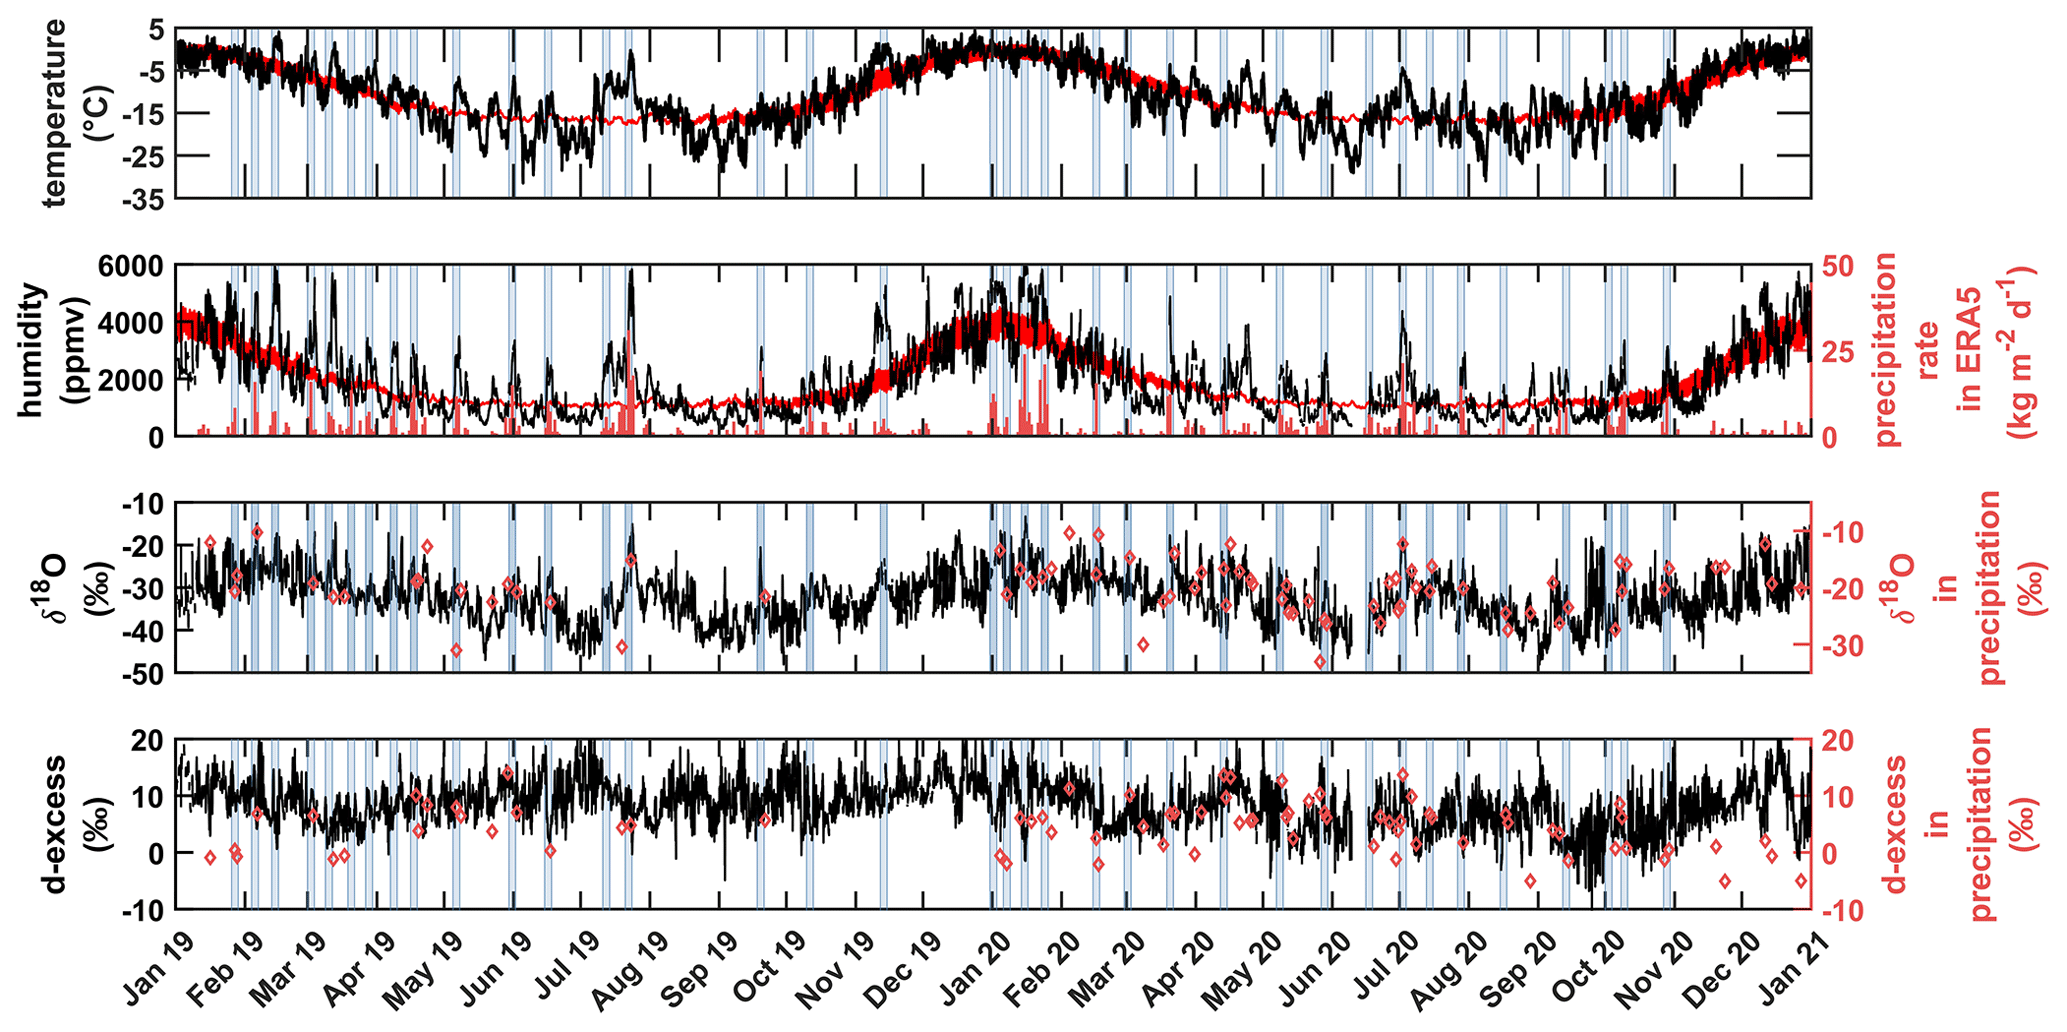
Figure 2Two-year data series (1 January 2019 to 31 December 2020) of meteorological and isotopic measurements at DDU. Panels from top to bottom: (1) hourly 2 m temperature (∘C) from Meteo France weather station in black, 3 h temperature averaged over 1957–2020 period in red. (2) Hourly humidity (ppmv) measured by the Picarro laser spectrometer in black, mean humidity (ppmv) from Meteo France weather station averaged over the 1957–2020 period in red; red bars indicate daily precipitation rate from ERA5 reanalysis (in ). (3) Calibrated δ18O (‰) in water vapor (hourly average in black) and in precipitation (red diamonds). (4)The d-excess (‰) in water vapor (hourly average in black) and in precipitation (red diamonds). Light-blue bars indicate the 3 d periods centered on high daily precipitation rates (peaks) with value higher than 4.5 and separated by a minimum of 5 d.
The variability of temperature, δ18O and humidity also shows a seasonality (Table 1), with a higher standard deviation in winter than in summer. These results can be explained by a different seasonal impact of the main precipitation events. Blue bars in Fig. 2 show the distribution of the 3 d periods centered on daily precipitation rates higher than 4.5 . We detect 35 precipitation peaks over the 2-year period, 7 (20 %) during DJF (summer) and 8 (23 %) during JJA (winter), so no seasonality of the occurrence is observed. However, the temperature anomalies associated with those events are more important in winter (Fig. S4). Servettaz et al. (2020) demonstrated the key role that such precipitation events, controlled by synoptic scale dynamics, could play in ice-core interpretation at high accumulation sites. As they are associated with warm and moist air intrusions, they cause warm anomalies compared to the seasonal mean. Here, we point out two major events that are particularly intense during extended winter (from May to September): (a) 23 July 2019, with a precipitation rate of 31 and (b) 2 July 2020, with a precipitation rate of 21 . These events correspond to the largest daily precipitation rates of each winter and to the first and third largest daily precipitation rates when considering the whole 2019–2020 period. The values of temperature, humidity and δ18O during these winter events (−1 and −4.4 ∘C, 5780 and 4370 ppmv, −17.8 ‰ and −19.3 ‰, respectively, for the two events) are close or above summer averages (Table 1).
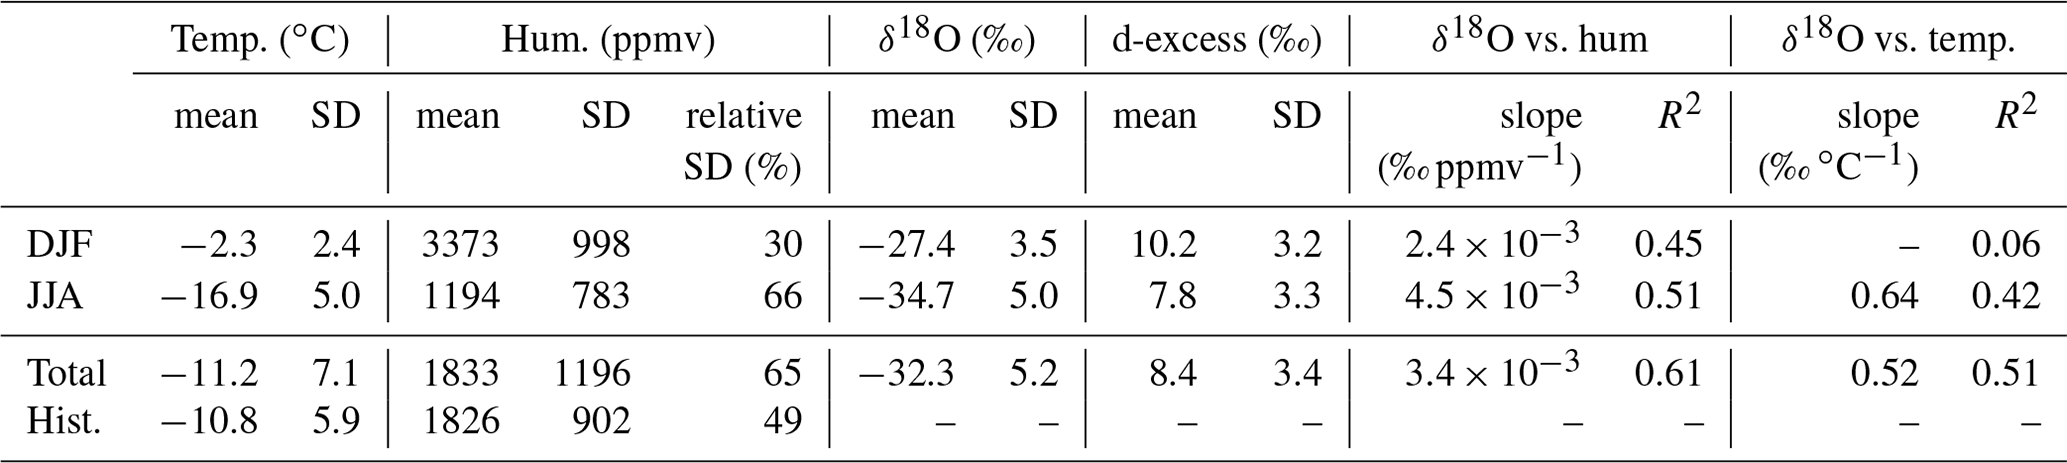
Table 1Mean and standard deviation (SD) of temperature (temp.), humidity (hum.) and isotopic composition of water vapor calculated from daily means (left). Correlations are calculated with daily data (right). The period considered is 2019–2020 except for “historical” (hist.) data, which are the mean of daily averages over 1957–2020.
As mentioned above, synoptic events are not clearly visible in summer. Summer variability is actually dominated by the succession of diurnal cycles. In Fig. 3, we show the mean diurnal cycles in summer and winter. During winter, the diurnal cycles of temperature and humidity are flattened to 0.6 ∘C and 40 ppmv and are not visible for δ18O and d-excess (Fig. 3). The summer diurnal cycle amplitudes reach almost 4∘C, 1000 ppmv and 4 ‰ for temperature, humidity and δ18O, respectively. The d-excess summer diurnal cycle amplitude (about 1 ‰) is smaller than the uncertainty and therefore hardly significant. The summer amplitudes of temperature and humidity diurnal cycles over the 2019–2020 study period are similar to the diurnal variability in temperature and humidity over the whole instrumental period (1957–2020). This summer diurnal cycle has been documented in previous detailed studies (Pettré et al., 1993; Bréant et al., 2019) and attributed to katabatic wind variability particularly during clear-sky conditions, when the sun zenithal angle impacts the radiative cooling of the continental surface responsible for the katabatic flow. When the sun is at its lowest position, cold and dry air masses coming from inland are associated with low δ18O values. On the contrary, when the sun is at its highest position, the origin of humid air masses is more local, through convective mixing for instance, and we observe a parallel increase in humidity, temperature and δ18O.
Differences between winter and summer weather regimes impact the relationship between variables in vapor. First, humidity and δ18O show high correlation coefficients (calculated from daily means) both over the whole record (R2=0.6) and at a seasonal scale (R2=0.5 for DJF and JJA). The slope of this linear relationship (Table 1 and Fig. S5) is almost doubled during winter ( ‰ ppmv−1) compared to summer ( ‰ ppmv−1). This difference between low and high humidity regimes (during winter and summer, respectively) is expected from the relationships between δ18O and humidity along distillation line or during mixing of two different air masses (Steen-Larsen et al., 2017). Second, the linear relationship between δ18O and temperature is strong for the full period (R2=0.5) but vanishes during summer (R2<0.1). This can be related to the smaller daily variability during summer, in comparison to winter when synoptic event occurrences lead to larger increase of temperature and δ18O over synoptic timescales. The δ18O–temperature slope (Table 1 and Fig. S6) over the full period (0.5 ‰ ) is similar to the winter mean slope (0.6 ‰ , R2=0.4). We note that spring mean slope is slightly different (0.4 ‰ , R2=0.3) but is statistically less representative in comparison. Further, we need to investigate the link between the isotopic composition of vapor and precipitation to study the impact on ice-core interpretation. The condensation of vapor in the upper atmospheric layers leads to precipitation but subsequent exchanges between atmospheric water vapor and snow flakes can also affect the isotopic composition of the collected precipitation. Classically a unique slope (site dependent) is used to convert isotopic signal into temperature.
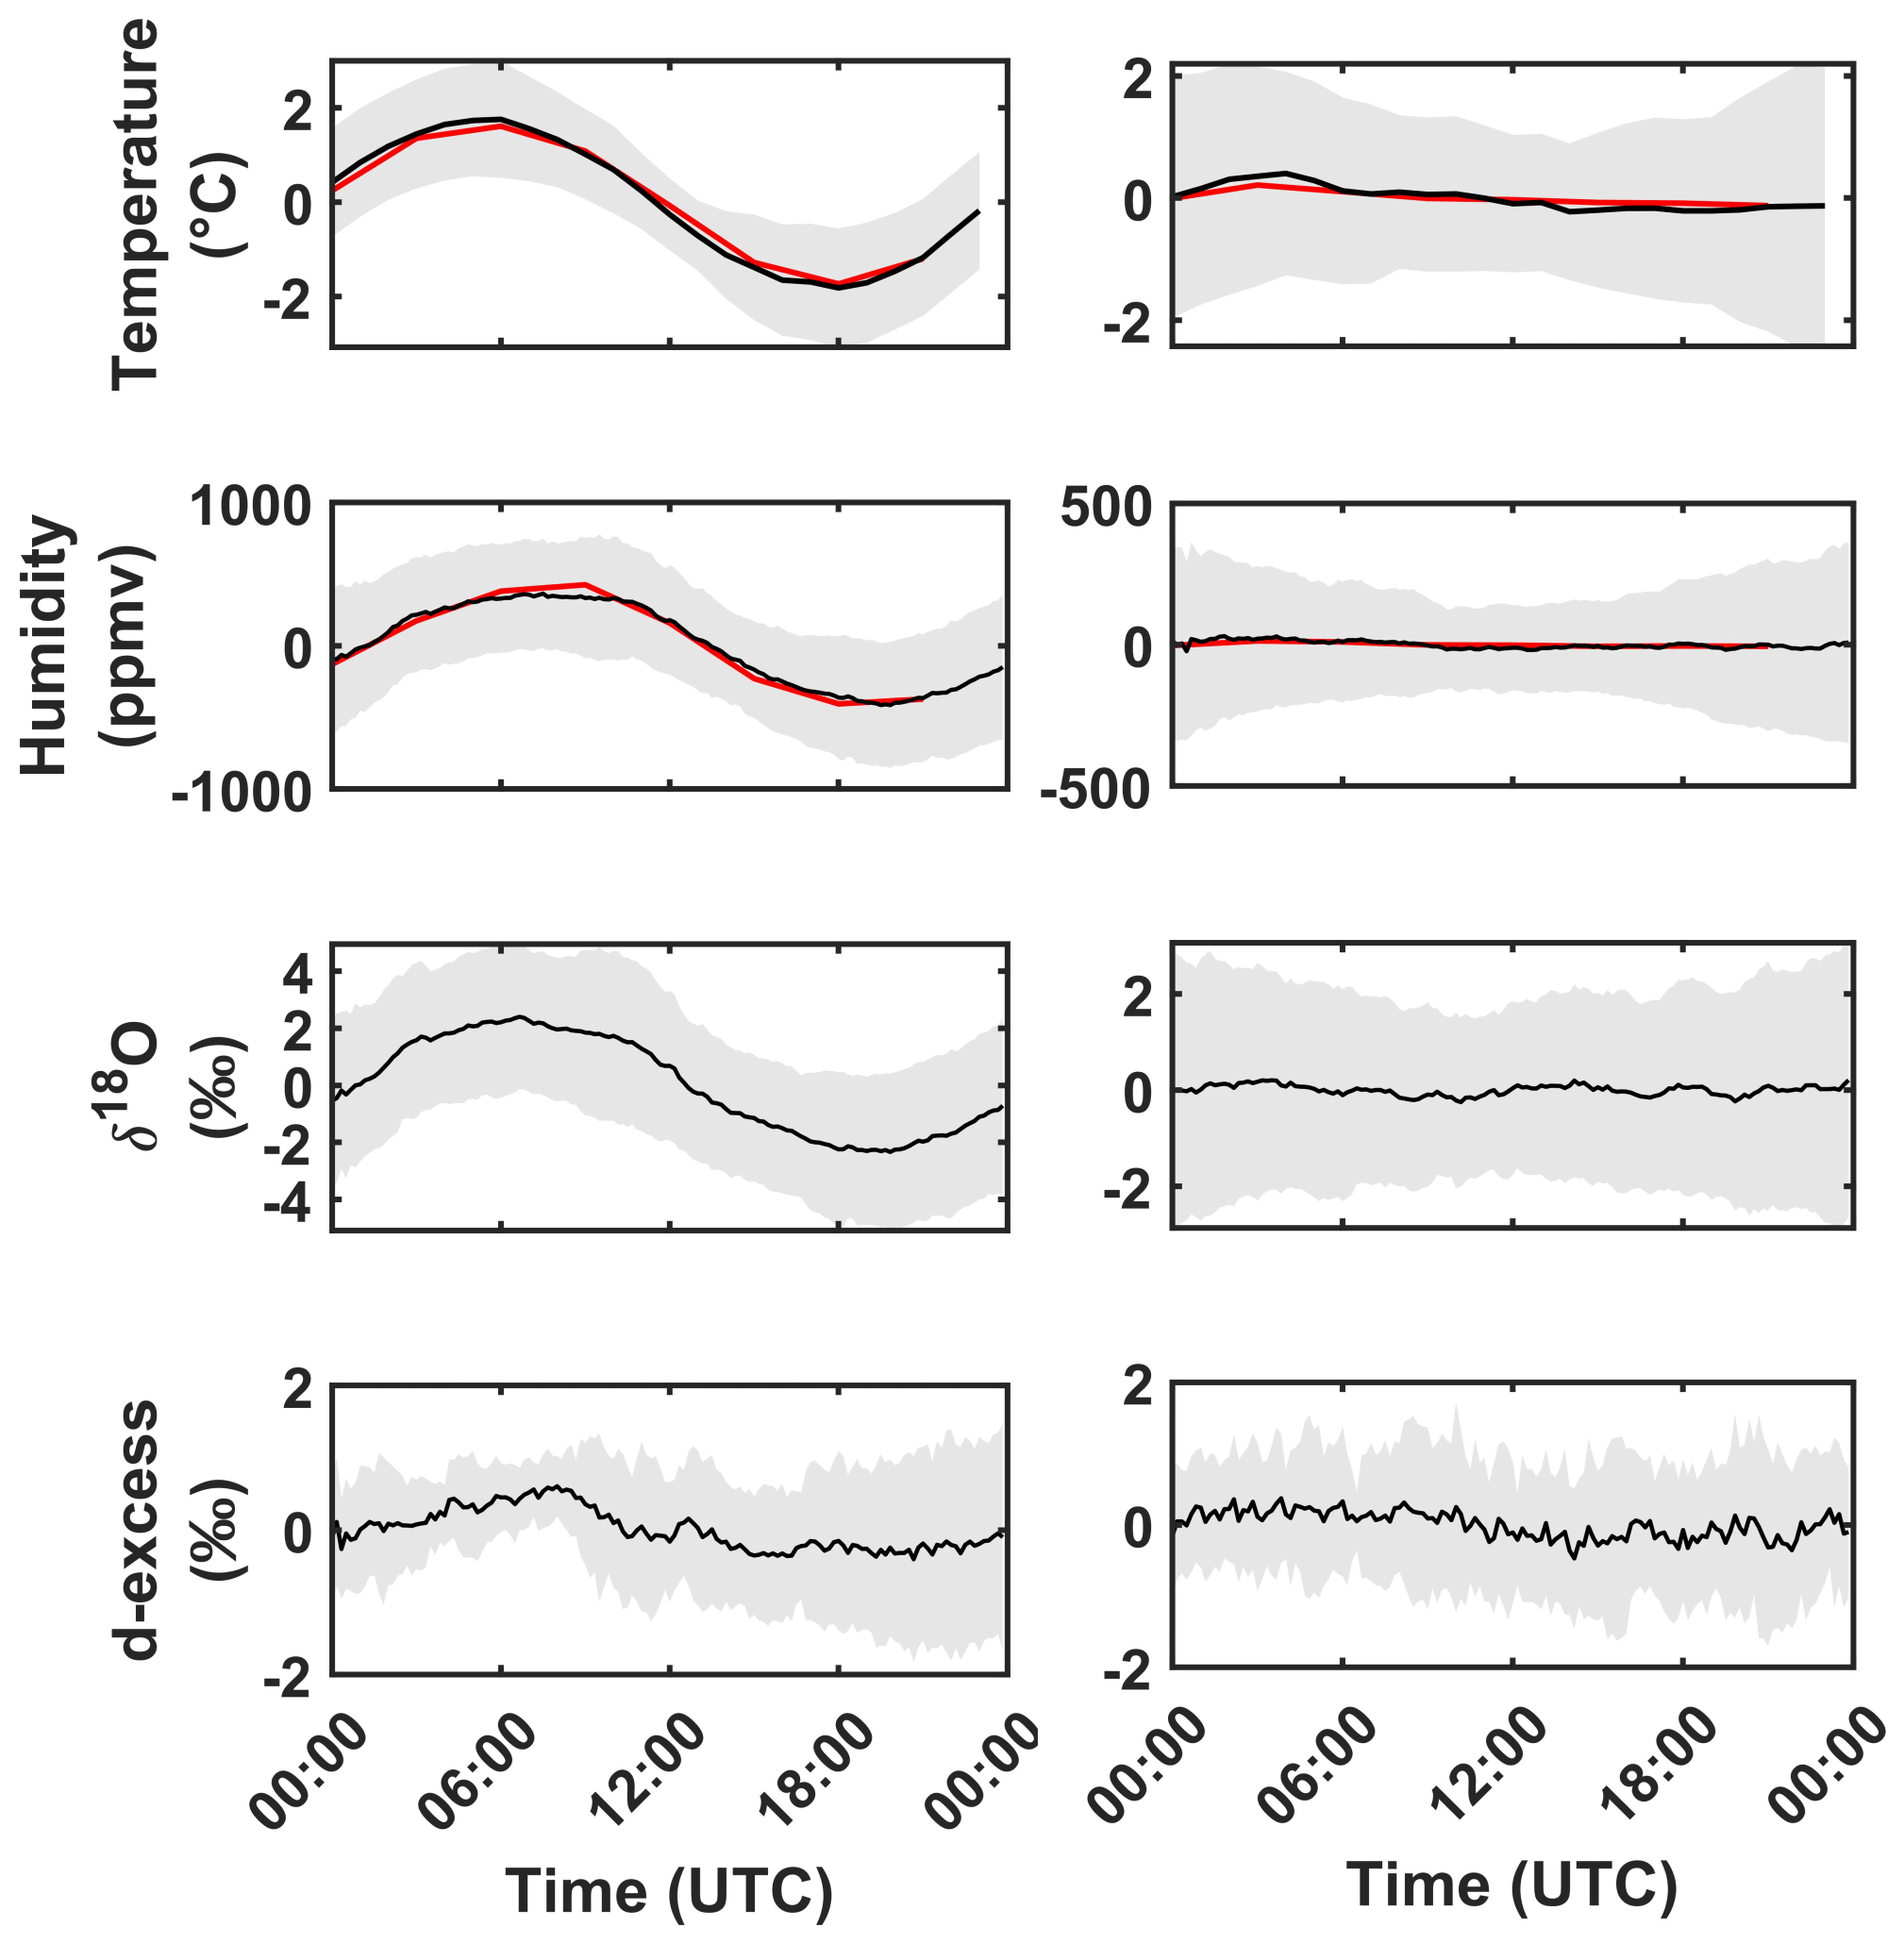
Figure 3Mean diurnal cycles estimated from hourly data in summer (DJF, left panel) and winter (JJA, right panel) over the 2019–2020 period. Red lines are computed from the historical Meteo France weather station data set (1957–2020 period, 3 h resolution). DDU time is UTC+10.
Over the 2019–2020 period, we collected 82 precipitation samples (Fig. 2). In order to compare isotopic signals in precipitation and vapor, we calculate the theoretical isotopic composition of vapor at equilibrium with each precipitation sample. We use solid–vapor fractionation coefficients at equilibrium from Majoube (1971) and Merlivat and Nief (1967) calculated with the daily 2 m temperature corresponding to the day of sample collection. The comparison is made with the daily averaged isotopic composition of water vapor measured at DDU (Fig. S7). Results exhibit a clear linear relationship between both data sets (R2=0.5) with a slope of 0.7 ‰ ‰−1. Note that we do not expect a correlation coefficient and slope of 1 because we averaged over 24 h, while the precipitation event is often shorter and precipitation samples can be affected by post-deposition effects before their collection. Furthermore the daily precipitation δ18O samples are strongly scattered, and it is not possible to observe in the precipitation δ18O record an equivalent to the strong peaks observed in the water vapor δ18O during the two strong mid-winter synoptic events. Because the sampling of precipitation was limited to one sample per day and only for the days with precipitation, it is expected that we cannot observe the same δ18O signal in the precipitation record than in the continuous water vapor at an hourly resolution.
3.2 ECHAM6-wiso: data–model comparison at DDU
To compare ECHAM6-wiso outputs and DDU measurements of temperature, humidity and δ18O, we consider the four ECHAM6-wiso grid cells around DDU station (Fig. 1). Since isotopic variables are not available at 2 m above the ground in ECHAM6-wiso, we consider all modeled variables at the lowest atmospheric level in ECHAM6-wiso (approximately 75 m above the ground, see exact altitudes in Table S1 in the Supplement) in order to work with a homogeneous data set. We have combined oceanic (continental) cells using the average values of grid cells outputs #1 and #3 (#2 and #4) to plot Fig. 4. Indeed, both oceanic (continental) cells show very similar characteristics (i.e., mean values, standard deviation, correlations with DDU measurements; Fig. S8 and Table S1).
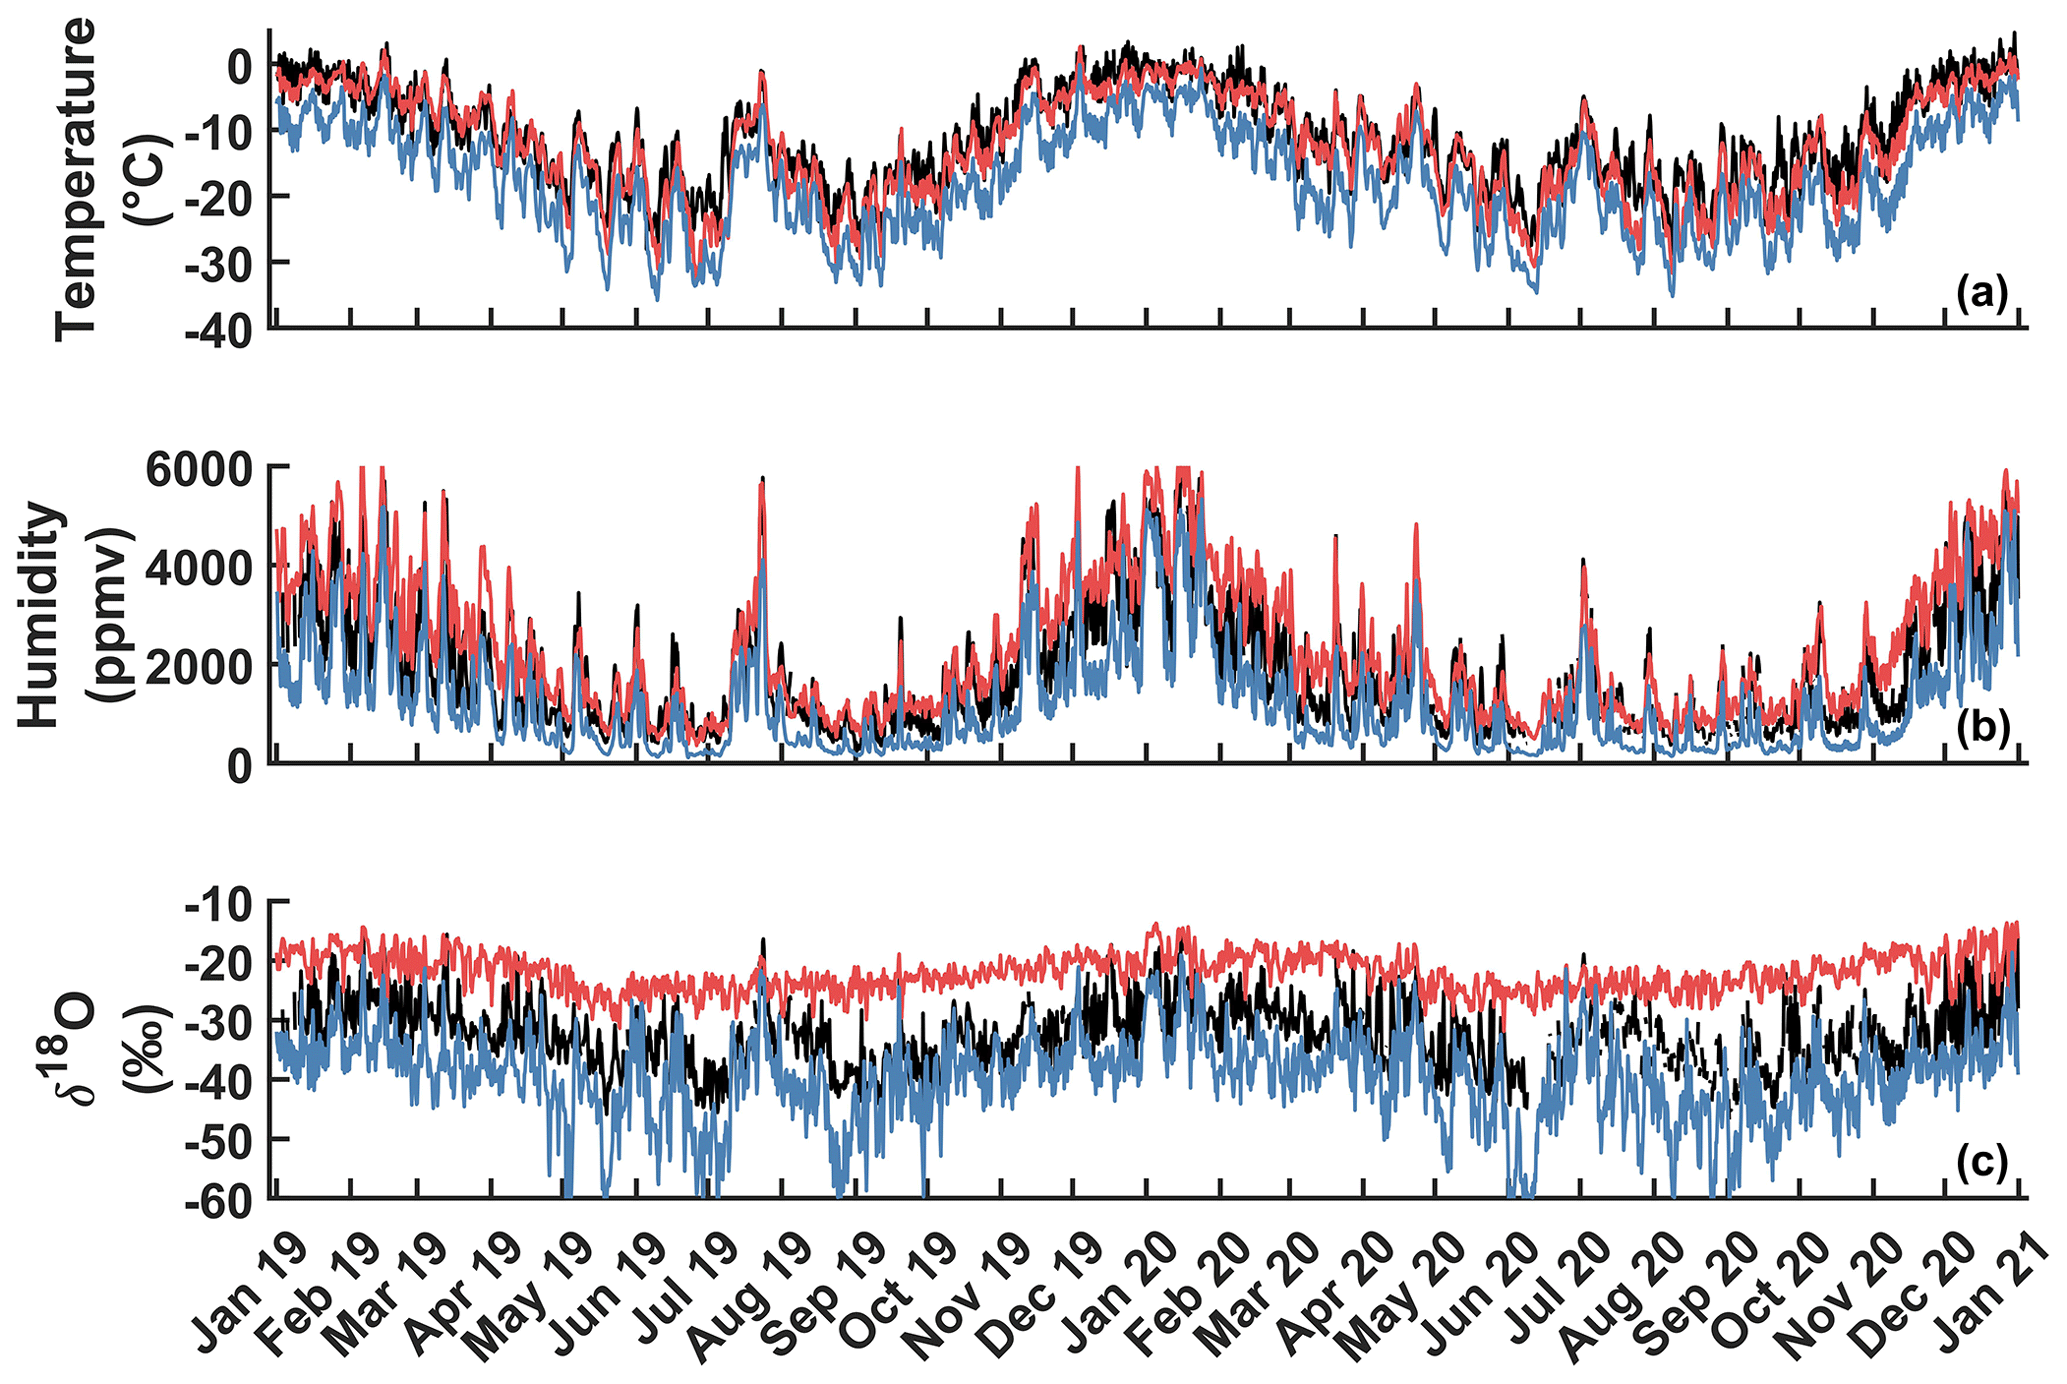
Figure 4Meteorological and isotopic measurements at DDU at 6-hourly resolution, in black. Panels from top to bottom: (1) 2 m temperature (∘C) from Meteo France weather station, (2) humidity (ppmv) measured by the Picarro laser spectrometer and (3) δ18O (‰) in water vapor. Colored lines are ECHAM6-wiso first-level outputs (6-hourly resolution): the red (blue) line represents the mean of oceanic (continental) grid cells.
Modeled temperature always present a cold bias (−1.2 ∘C for the oceanic grid cell and −6.7 ∘C for the continental grid cell) compared to measurements at DDU, while humidity bias is either positive (about 500 ppmv in average for oceanic grid cells) or negative (about −600 ppmv in average for continental grid cells). The temperature bias is not related to the average mean altitude of grid cells, as a similar comparison using the modeled 2 m temperature also results in cold biases (Table S1). We observe a bias of −3 ∘C in ERA5 2 m temperature in comparison to measurements over the 2-year data set, which could explain the differences in temperature between model and measurements as suggested by Goursaud et al. (2018). Despite these biases, ECHAM6-wiso outputs reproduce well the variability of the temperature and humidity records at DDU for both oceanic and continental grid cells. Over the full period, modeled daily temperature and humidity are highly correlated to observations (R2=0.9, Table S1), and both show very similar standard deviations (about 8 ∘C and 1200 ppmv for both continental and oceanic cells for temperature and humidity, respectively, compared to 7 ∘C and 1200 ppmv for observations; Table 1 and Table S1).
However the modeled water vapor δ18O signals for oceanic and continental grid cells are very different, and neither of them fits the measurements. In particular, the variability of the simulated water vapor δ18O in the oceanic grid cell (SD of 2.9 ‰) is lower than in the DDU record (SD of 5.2 ‰), while the variability in the continental grid cell is higher (7.1 ‰). Finally, the correlation between data and modeled water vapor δ18O is better for the continental grid cell (R2=0.5) than for the oceanic grid cell (R2=0.3). These results show that the modeled water vapor isotopic composition in this region at the frontier between the Antarctic ice sheet and ocean areas is strongly sensitive to the cell position over the ocean or the continent, more than for variables like temperature or humidity. It follows that both oceanic and continental influences must be considered to interpret our isotopic signal at DDU.
In the following we combine both oceanic and continental grid cells to build a modeled time series of temperature, humidity and water vapor δ18O comparable with our observations. For temperature and humidity, we directly compute weighted averages of the two grid cells time series, while for δ18O we also take into account the humidity content of each air mass to compute the combined weighted isotopic ratio. Three weighing approaches are investigated: (a) weights based on the distance between DDU coordinates and grid cell centers, (b) weights computed to minimize the distance between measured and modeled mean humidity (Nelder–Mead simplex algorithm as described in Lagarias et al., 1998), and (c) weights computed as in (b) but with δ18O as the target. If we look at the mean isotopic compositions and standard deviations of model data sets and the correlation coefficients (combination data sets vs. observations), we observe that the three sets of weights improve the comparison between ECHAM6-wiso δ18O outputs and measurements at DDU compared to individual grid cells (Tables 2 and S1).
Table 2ECHAM6-wiso combination (a, b and c; see text) of first-level outputs results and comparison with measurements. Mean and standard deviation of meteorological variables and isotopic composition (left section). Correlations between model and observations (middle section). Weights of each grid cell for the different computation schemes (right section).
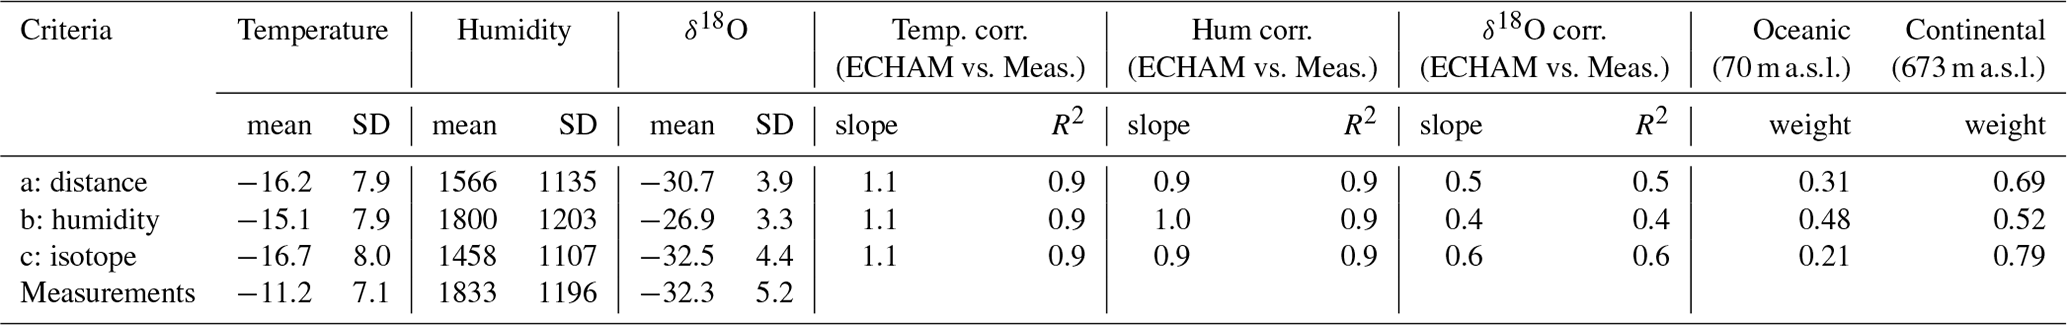
In Fig. 5 we present the results obtained with the weighing scheme c, targeting the best agreement for δ18O and leading to the highest correlations coefficients between measurements and model outputs for temperature (R2=0.9), humidity (R2=0.9) and δ18O (R2=0.6), slopes close to 1 for linear regression between observation and model outputs (1.1, 0.9 and 0.6 for temperature, humidity and δ18O, respectively), and the lowest difference between observed and modeled δ18O standard deviation (0.8 ‰). We notice an expected cold bias (probably due to ERA5 cold bias at DDU; see previous paragraph) and a dry bias probably due to an altitude effect (continental grid cell mean altitude is 673 m a.s.l.). This configuration corresponds to a combination of 79 % of continental air masses and 21 % of oceanic air masses, which gives less weight to the ocean grid cells than the other two combinations (Table 2). This shows that only a strong continental influence can explain the isotopic signal recorded at DDU. At the seasonal scale, the modeled time series issued from configuration C shows similar characteristics (average value, variability) to observations for humidity, temperature and water vapor isotopic composition (Table 3). As for d-excess, while modeled average value (7.8 ‰) and variability (4.4 ‰) are close to measured ones (Fig. S9), the model fails to reproduce the seasonality of observation. Seasonality is actually inverted in the model: while d-excess reached its maximum in summer (DJF) in observations (10.2 ‰), its value is minimal in ECHAM6-wiso combination (6.5 ‰). We will thus only consider the δ18O in the following.
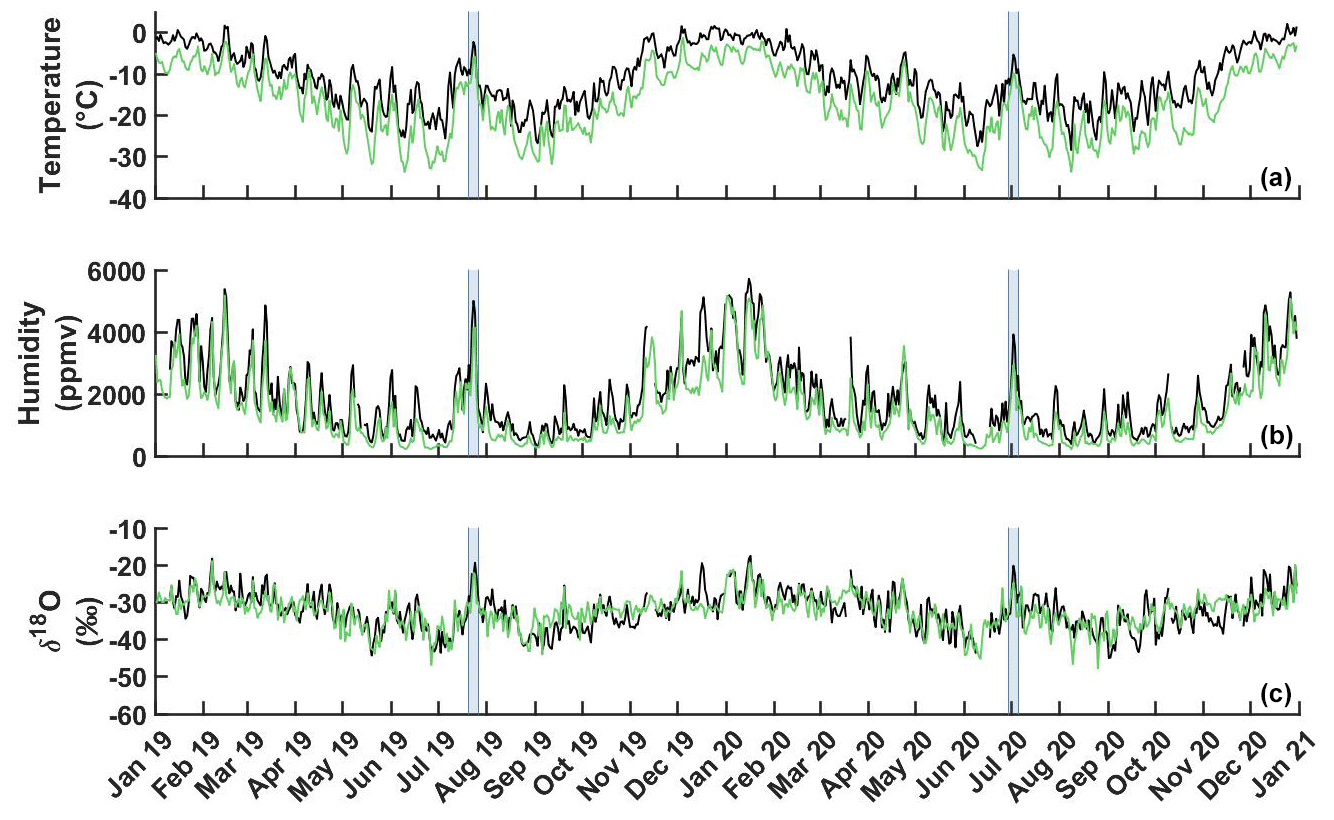
Figure 5Comparison of temperature, humidity and δ18O modeled by ECHAM6-wiso and measured at DDU station over the period 2019–2020. Meteorological and isotopic measurements at DDU at daily resolution are shown in black. Panels from top to bottom: (1) 2 m temperature (∘C) from Meteo France weather station, (2) humidity (ppmv) measured by the Picarro laser spectrometer and (3) water vapor δ18O (‰). Green lines correspond to the ECHAM6-wiso combination of surface air level outputs (daily resolution) using configuration C (see text). Light blue bars indicate major winter synoptic events of 23 July 2019 and 2 July 2020 (see text).
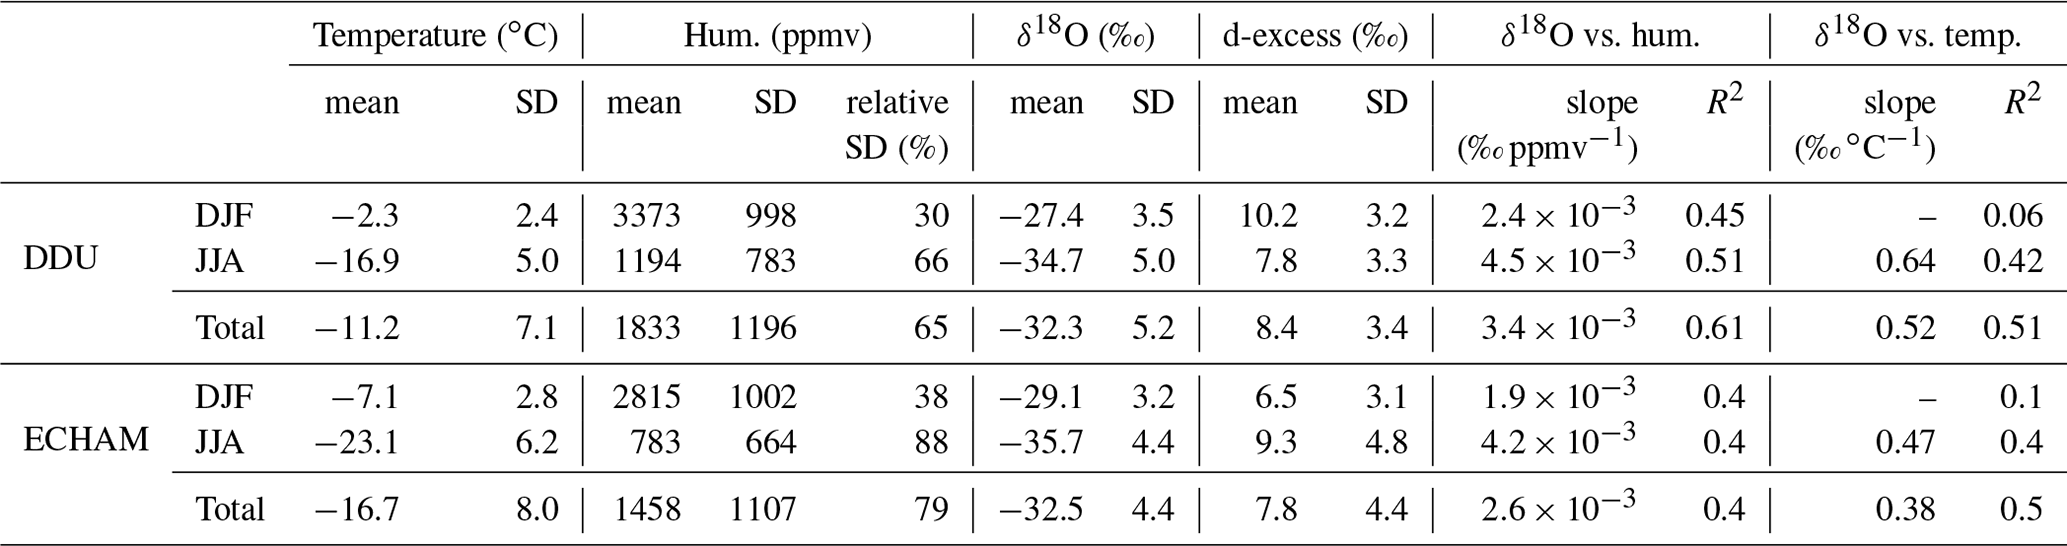
Table 3Mean and standard deviation (SD) of meteorological variables and isotopic composition calculated from daily means (left). Correlations are calculated with daily data (right). Top: from DDU measurements. Bottom: from ECHAM6-wiso first-level outputs using the C configuration (Table 2) of cell combinations.
We focus on the two major winter synoptic events of 23 July 2019 and 2 July 2020 identified in the previous section. Those winter events are associated with peaks in meteorological variables and isotopic values (temperature, humidity and δ18O) close to or even higher than summer means in the observations (Sect. 3.1) as well as in the model outputs (−5.9 and −9.9∘C, 4130 and 2930 ppmv, −22.1 ‰ and −24.8 ‰, respectively, for the two events) (Fig. 5 and Table 3). The amplitudes of these peaks in ECHAM6-wiso are comparable to that of measurements. This confirms that ECHAM6-wiso is able to reproduce the variability of the meteorological and isotopic signals even during extreme events.
Finally, we compare ECHAM6-wiso daily means of precipitation isotopic composition with observations. We obtain a weak but still significant correlation coefficient between both data sets (R2=0.3), and the slope of the linear regression is 0.4 ‰ ‰−1 (Fig. S10). In particular, the seasonal cycle is well captured both by the observations and the model outputs with lower mean δ18O values during winter and higher mean δ18O during summer (Fig. S11). In addition, we observe that the relationship between isotopic composition of vapor and precipitation is mainly preserved in ECHAM6-wiso (Fig. S12).
The above comparisons between model and observation support the use of ECHAM6-wiso to interpret the isotopic signal variability in water vapor and precipitation at the seasonal and interannual scale in the surrounding of the DDU station. It is thus a very powerful tool to help interpret snow and ice cores in the region.
The water isotopic series shown above have highlighted the complex relationships between temperature and δ18O of vapor and precipitation at DDU. We have also shown that the atmospheric model equipped with water isotope ECHAM6-wiso reproduces daily and seasonal mean and variability of the isotopic observation records. In the following, we explore how this model can help interpret firn cores isotopic records in Adélie Land. For this, we use the S1C1 firn core analyzed by Goursaud et al. (2017). This 22.4 m core has been drilled during the 2006/2007 season at 66.71∘ S, 139.8∘ E and 279 m a.s.l., 15 km from DDU (Fig. 1). It covers 60 years with a mean accumulation rate of 218 ± 69 , but we will limit our study to the period back to 1979 in order to be able to compare with reanalysis data. The S1C1 δ18O record measured with a resolution of 5 cm (Fig. 6a) shows variations with a maximum amplitude of δ18O variations of 10 ‰. There is no clear annual periodicity in the δ18O as seen in the frequency spectrum (Fig. 6b).
We create virtual firn cores (VFCs) following the approach of Sime et al. (2011) to study the origin of the δ18O variations in the S1C1 core (Text S2). The first VFC is obtained using temperature and precipitation from ERA5 (red curves in Fig. 6): δ18O is directly linked to temperature weighted by precipitation to account for precipitation intermittency. For this construction, we used the slope of 0.44 ‰ observed at DDU between δ18O of precipitation and temperature (Fig. S13). This first VFC, hereafter called VFC-ERA5, displays clear annual cycles of δ18O with an average amplitude of 7 ‰ (Fig. 6a). The standard deviation of the signal remains stable over time, which is different from the S1C1 δ18O record showing large variations of the standard deviation with depth (Fig. S14a). The frequency spectrum indeed reveals a marked annual periodicity (Fig. 6b).
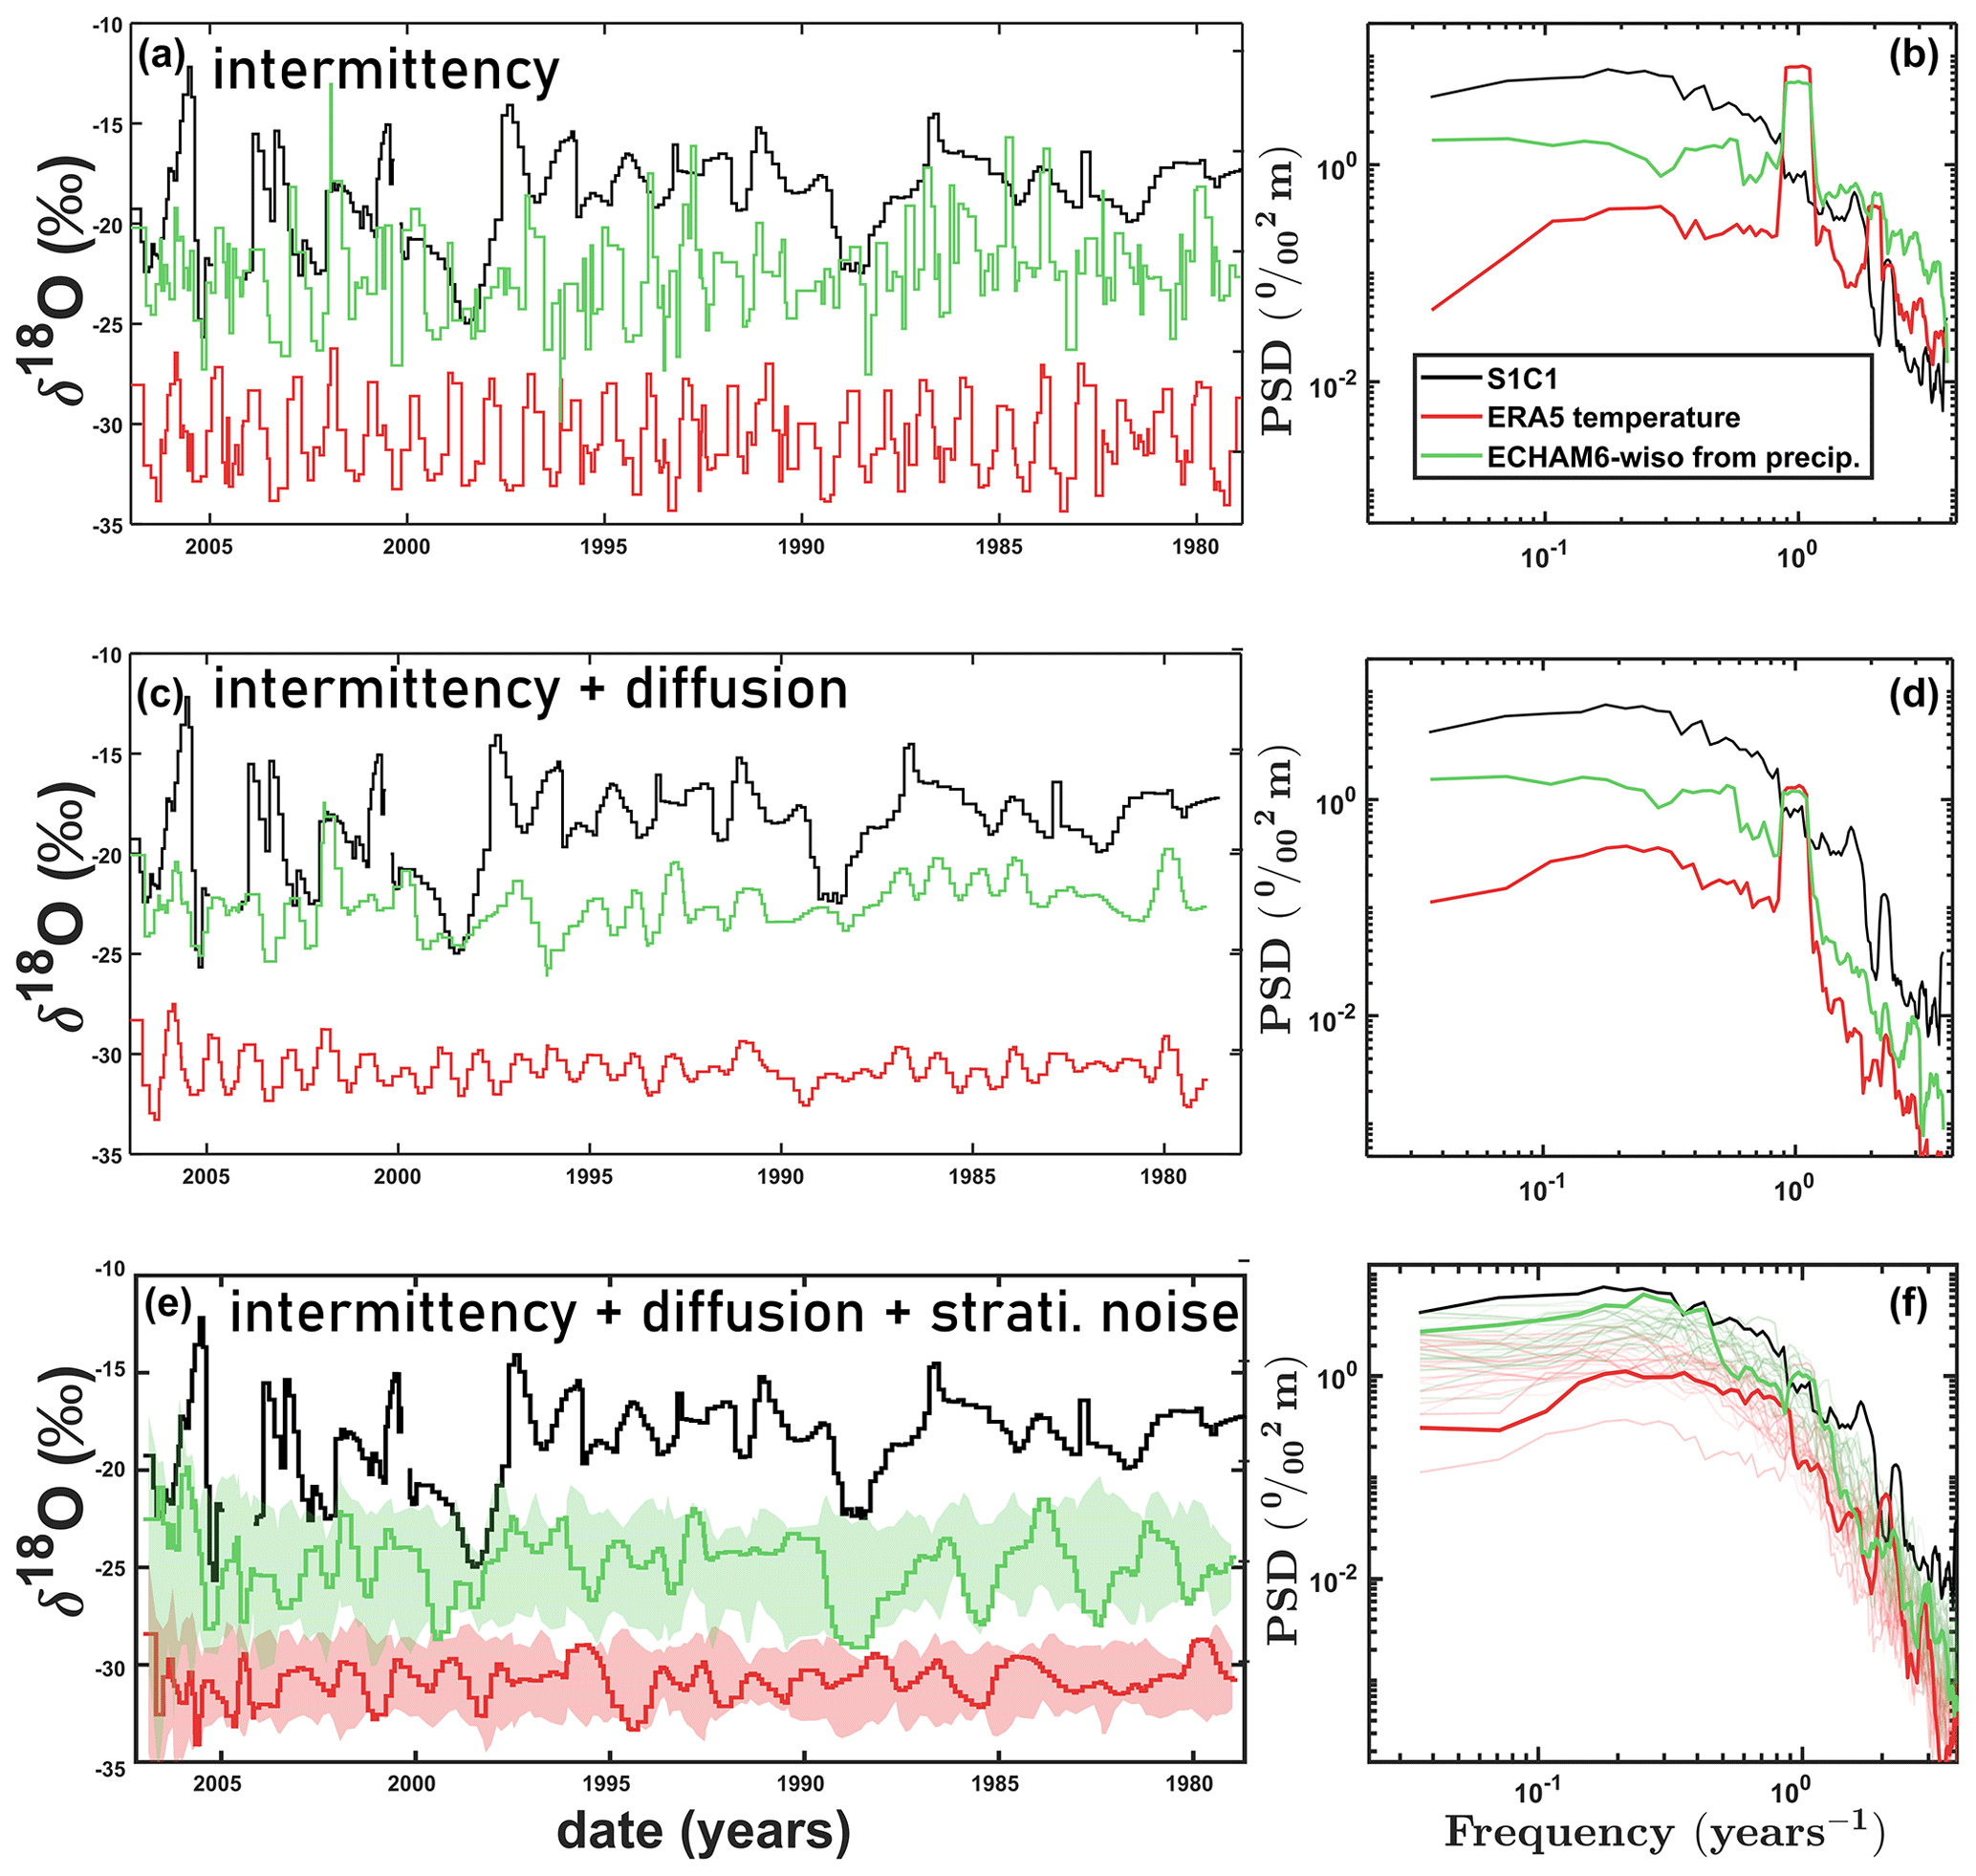
Figure 6In black, isotopic composition (δ18O in ‰) of S1C1 (first 620 cm of water equivalent) firn core versus date (years) using the dating based on chemical analyses in Goursaud et al. (2017). Red and green curves are the isotopic compositions of VFC resampled at S1C1 sampling resolution and based on temperature from ERA5 and on ECHAM6-wiso isotopic composition of precipitation, respectively (see text). In the first row, (a, b) VFCs are calculated with precipitation intermittency. In the second row, (c, d) VFCs are built with precipitation intermittency and isotopic diffusion. In the third row, (e, f) VFCs are calculated with precipitation intermittency, isotopic diffusion and simulated stratigraphic noise (25 random noise simulations). In panels (a), (c) and (f), an artificial bias is added to VFCs (−5 ‰ and −10 ‰, respectively, for green and red curves) in order to improve readability. Right column presents the associated frequency spectrums computed using Thomson's multitaper power spectral density. One stratigraphic noise simulation is highlighted in bold as an example; other simulations are represented by shaded envelop (e) or light plots (f).
The poor agreement between VFC-ERA5 and S1C1 δ18O records (Fig. 6a and b) clearly confirms that temperature is not the only driver of δ18O in this Adélie Land firn core. We have also produced a second VFC based on the outputs of ECHAM6-wiso (green curves in Fig. 6). In this case, the δ18O record of VFC-ECHAM is calculated from the δ18O of precipitation and precipitation amount, both simulated by ECHAM6-wiso back to 1979 and provided at a 6-hourly resolution. As for the VFC-ERA5, the VFC-ECHAM record displays a clear annual cycle visible in the associated spectrum (Fig. 6b). However, it displays a much larger variability in the amplitude of the annual cycle than the VFC-ERA5. This results in larger variations of the moving standard deviation of VFC-ECHAM δ18O record, which looks like variations observed in the temporal evolution of the standard deviation of S1C1 δ18O record (Fig. S14a). There is thus, in general, a better agreement of S1C1 δ18O record with VFC-ECHAM δ18O record than with VFC-ERA5 δ18O record. Still, the amplitude of the standard deviation of VFC-ECHAM δ18O record does not show the same clear decreasing trend as observed in S1C1 record, a difference which may be attributed to the diffusion of water isotopes within the firn.
In Fig. 6c, the influence of isotopic diffusion in the firn has been considered for the construction of the VFC records (details in Text S3). The rapid decrease of the amplitude of the annual cycles with increasing depth in S1C1 is reproduced by this VFC. This effect is also seen in the associated spectrum (Fig. 6d) with a decrease of the power in the high frequency range (from 1.2 ‰2 m to 0.04 ‰2 m in average for frequencies greater than 1.1 yr−1, in VFC-ECHAM), below the level of S1C1 spectrum. Diffusion also induces strong decrease of the standard deviation amplitude of the standard deviations of the VFC-ERA5 and VFC-ECHAM records (Fig. S14, Table S2), again below the level observed in the S1C1 record. This may be due to a too strong diffusion effect in our approach. Improvement of the diffusion model may be able to reconcile the amplitude of the high frequency variability of the VFC δ18O signals with the amplitude of the high frequency variability of the S1C1 δ18O signal. It may however not explain why there is no clear temporal correspondence between S1C1 δ18O signal and the VFC δ18O signal, nor why the annual cycle is not seen in the S1C1 signal, which may be explained by errors in the chronology of the S1C1 core. Another point of disagreement is the lower power associated with low frequency signal in the VFC records than in the S1C1 signal. These three points of disagreement may be caused by deposition or post-deposition effects creating a non-climatic low frequency variability while destroying the record of the annual variability (through wind blowing for example). To simulate such an effect, we follow Laepple et al. (2018) by adding white stratigraphic noise that is controlled by two parameters: (i) the relative amount of noise compared to the input signal (0 % to 100 %) and (ii) the length at which the noise impacts the signal (from 1 to 10 cm). In Fig. 6e, we show that using a noise level of 90 % and a noise scale of 7 cm, the VFC-ECHAM inter-annual amplitude variability is more likely to match S1C1 signal. This is confirmed by spectral analyses (Fig. 6f), in which the difference between S1C1 and VFC-ECHAM spectrums becomes comparable (4.1 ‰2 m and 2.3 ‰2 m in average for low frequencies, i.e., from 0.1 to 0.5 yr−1, respectively, for S1C1 and ECHAM, for example). We also notice that even with a noise level of 100 % (maximum authorized in this model), the ERA5-VFC spectrums hardly improve in comparison with observation (0.9 ‰2 m in average for low frequencies, for example). Note that invoking a strong stratigraphic noise level to explain the difference in the spectrum obtained for S1C1 and the VFC cores is not the only explanation. The linear relationship estimated between δ18O of vapor and precipitation at DDU shows that precipitation only imprints part of the vapor signal variability (slope =0.6 ‰ ‰−1 with R2=0.4 in ECHAM6-wiso; see Fig. S12). An interannual climatic variability that is too low in the δ18O of model precipitation would also explain the lower power in the low frequency range of the spectrums of the VFC records.
As a conclusion, we have shown that using of ECHAM6-wiso outputs better explains the firn core δ18O variability than considering only the temperature influence. Still, the interannual δ18O variability simulated by ECHAM6-wiso is not able to explain the low frequency variability of the firn core δ18O in Adélie Land. This could be explained by stratigraphic noise associated with deposition and post-deposition effects and maybe an underestimation of the interannual variability of precipitation and their isotopic signal in the model. In order to cancel the influence of stratigraphic noise and increase the signal-to-noise ratio, we would need to stack several firn cores (Münch and Laepple, 2018; Laepple et al., 2016, 2018; Casado et al., 2020).
We present the first multi-year continuous record of isotopic composition in surface vapor and precipitation at Dumont d'Urville Station (Adélie Land), a coastal site in East Antarctica. This region is characterized by the presence of strong katabatic winds and the local influence of ocean and sea ice. This new data set allows us to characterize diurnal variations of meteorological variables (temperature, humidity and δ18O) for the different seasons and to determine the evolution of key relationships (δ18O versus temperature or humidity) throughout the year. We found mean annual slopes of 0.5 and 0.4 ‰ for daily δ18O vs. temperature in the water vapor and in the precipitation, respectively (with R2=0.5 and 0.2). The warm and wet synoptic events occurring in winter and associated with strong precipitation are clearly imprinted in the water vapor isotopic signal, while our snow samplings mainly capture the strong seasonal cycle. We evaluate the ECHAM6-wiso model through a comparison of the simulated δ18O of water vapor and precipitation with our record, and we show that a combination of continental (79 %) and oceanic (21 %) grid cells leads the modeled temperature, humidity and δ18O to nicely fit trends and variability of observations. Winter extreme synoptic events are also correctly represented by the model. The excellent agreement between modeled and measured isotopic series encourages us to investigate how ECHAM6-wiso could help understand isotopic signals recorded in firn cores in the region. We focus on the S1C1 firn core previously studied and located 10 km inland from DDU. Constructing virtual firn cores from modeled temperature or from water isotope and taking into account the precipitation intermittency, we show that a pure temperature interpretation fails in explaining the interannual variability observed in the measured S1C1 isotopic record. We improve the agreement between measured and modeled records when using the water isotopic composition of precipitation instead of temperature, but the low frequency variability is still underestimated. Our results suggest that both deposition and post-deposition effects contribute significantly to the isotopic signal recorded in S1C1 core. Precipitation in ECHAM6-wiso model may also underestimate variability at interannual to decadal scales in Adélie Land. Stacking several firn core records in the region to get rid of the stratigraphical noise could help disentangle these two effects.
The full data set (isotopic composition of vapor and precipitation and meteorological data) is fully available through a Zenodo repository: https://doi.org/10.5281/zenodo.7708489 (Leroy-Dos Santos, 2023).
The supplement related to this article is available online at: https://doi.org/10.5194/tc-17-5241-2023-supplement.
CLDS analyzed data, produced plots, designed and wrote all sections of the original paper, with input from coauthors revising the text. EL and AL made substantial contribution with substantial contributions throughout the paper text. CA made substantial contributions to Sect. 3.2 with data analysis. AL made substantial contributions to Sects. 3.1 and 4. MC contributed to Sect. 4 through VFC script and output interpretation. AC and MW contributed to the ECHAM6-wiso data analysis. BM and FP analyzed snow samples. OJ is responsible for remote control of the setup at DDU. LP made plot S11. All authors provided comments to the manuscript.
The contact author has declared that none of the authors has any competing interests.
Publisher's note: Copernicus Publications remains neutral with regard to jurisdictional claims made in the text, published maps, institutional affiliations, or any other geographical representation in this paper. While Copernicus Publications makes every effort to include appropriate place names, the final responsibility lies with the authors.
We thank Valérie Masson-Delmotte, who contributed to this study by providing a Picarro analyzer. We acknowledge the staff from IPEV (especially Quentin Perret), all the over-winterers who contributed to setup maintenance (especially Audrey Teisseire, Gregoire Aufresne, Guillaume Herment) and the Meteo France members for their availability (especially Gaetan Heymes).
This work was supported by the IPEV ADELISE project, the LEFE program ADELISE. This article is part of the ANR ARCA (Atmospheric River Climatology in Antarctica; grant number ANR-20-CE01-0013) funded by the French National Research Agency. This study was also funded by Project ATLACE (CIRCNA/CAC/0273/2019) through national funds provided by FCT – Fundação para a Ciência e a Tecnologia. It was also funded by the Fondation Prince Albert II de Monaco under the project Antarctic-Snow. Co-author Cécile Agosta is funded by the AWACA ERC project (no. 951596).
This paper was edited by Michiel van den Broeke and reviewed by two anonymous referees.
Altnau, S., Schlosser, E., Isaksson, E., and Divine, D.: Climatic signals from 76 shallow firn cores in Dronning Maud Land, East Antarctica, The Cryosphere, 9, 925–944, https://doi.org/10.5194/tc-9-925-2015, 2015. a
Bagheri Dastgerdi, S., Behrens, M., Bonne, J.-L., Hörhold, M., Lohmann, G., Schlosser, E., and Werner, M.: Continuous monitoring of surface water vapour isotopic compositions at Neumayer Station III, East Antarctica, The Cryosphere, 15, 4745–4767, https://doi.org/10.5194/tc-15-4745-2021, 2021. a
Bailey, A., Noone, D., Berkelhammer, M., Steen-Larsen, H. C., and Sato, P.: The stability and calibration of water vapor isotope ratio measurements during long-term deployments, Atmos. Meas. Tech., 8, 4521–4538, https://doi.org/10.5194/amt-8-4521-2015, 2015. a
Bonne, J.-L., Masson-Delmotte, V., Cattani, O., Delmotte, M., Risi, C., Sodemann, H., and Steen-Larsen, H. C.: The isotopic composition of water vapour and precipitation in Ivittuut, southern Greenland, Atmos. Chem. Phys., 14, 4419–4439, https://doi.org/10.5194/acp-14-4419-2014, 2014. a
Bréant, C., Leroy-Dos Santos, C., Agosta, C., Casado, M., Fourré, E., Goursaud, S., Masson-Delmotte, V., Favier, V., Cattani, O., Prié, F., Golly, B., Orsi, A., Martinerie, P., and Landais, A.: Coastal water vapor isotopic composition driven by katabatic wind variability in summer at Dumont d'Urville, coastal East Antarctica, Earth Planet. Sc. Lett., 514, 37–47, https://doi.org/10.1016/j.epsl.2019.03.004, 2019. a, b, c
Casado, M., Landais, A., Masson-Delmotte, V., Genthon, C., Kerstel, E., Kassi, S., Arnaud, L., Picard, G., Prie, F., Cattani, O., Steen-Larsen, H.-C., Vignon, E., and Cermak, P.: Continuous measurements of isotopic composition of water vapour on the East Antarctic Plateau, Atmos. Chem. Phys., 16, 8521–8538, https://doi.org/10.5194/acp-16-8521-2016, 2016. a
Casado, M., Landais, A., Picard, G., Münch, T., Laepple, T., Stenni, B., Dreossi, G., Ekaykin, A., Arnaud, L., Genthon, C., Touzeau, A., Masson-Delmotte, V., and Jouzel, J.: Archival processes of the water stable isotope signal in East Antarctic ice cores, The Cryosphere, 12, 1745–1766, https://doi.org/10.5194/tc-12-1745-2018, 2018. a
Casado, M., Münch, T., and Laepple, T.: Climatic information archived in ice cores: impact of intermittency and diffusion on the recorded isotopic signal in Antarctica, Clim. Past, 16, 1581–1598, https://doi.org/10.5194/cp-16-1581-2020, 2020. a, b, c
Cauquoin, A. and Werner, M.: High‐Resolution Nudged Isotope Modeling With ECHAM6‐Wiso: Impacts of Updated Model Physics and ERA5 Reanalysis Data, J. Adv. Model. Earth Sy., 13, e2021MS002532, https://doi.org/10.1029/2021MS002532, 2021. a, b
Cauquoin, A., Werner, M., and Lohmann, G.: Water isotopes – climate relationships for the mid-Holocene and preindustrial period simulated with an isotope-enabled version of MPI-ESM, Clim. Past, 15, 1913–1937, https://doi.org/10.5194/cp-15-1913-2019, 2019. a
Craig, H.: Isotopic variations in meteoric waters, Science, 133, 1702–1703, publisher: American Association for the Advancement of Science, 1961. a
Ding, Q., Schweiger, A., L’Heureux, M., Battisti, D., Po-Chedley, S., Johnson, N., Blanchard-Wrigglesworth, E., Harnos, K., Zhang, Q., Eastman, R., and Steig, E.: Influence of high-latitude atmospheric circulation changes on summertime Arctic sea ice, Nat. Clim. Change, 7, 289–295, https://doi.org/10.1038/nclimate3241, 2017. a
Ekaykin, A. A., Lipenkov, V. Y., Barkov, N. I., Petit, J. R., and Masson-Delmotte, V.: Spatial and temporal variability in isotope composition of recent snow in the vicinity of Vostok station, Antarctica: implications for ice-core record interpretation, Ann. Glaciol., 35, 181–186, https://doi.org/10.3189/172756402781816726, 2002. a
Favier, V., Agosta, C., Parouty, S., Durand, G., Delaygue, G., Gallée, H., Drouet, A.-S., Trouvilliez, A., and Krinner, G.: An updated and quality controlled surface mass balance dataset for Antarctica, The Cryosphere, 7, 583–597, https://doi.org/10.5194/tc-7-583-2013, 2013. a
Fogt, R. L., Goergens, C. A., Jones, M. E., Witte, G. A., Lee, M. Y., and Jones, J. M.: Antarctic station‐based seasonal pressure reconstructions since 1905: 1. Reconstruction evaluation, J. Geophys. Res.-Atmos., 121, 2814–2835, https://doi.org/10.1002/2015JD024564, 2016. a
Goursaud, S., Masson-Delmotte, V., Favier, V., Preunkert, S., Fily, M., Gallée, H., Jourdain, B., Legrand, M., Magand, O., Minster, B., and Werner, M.: A 60-year ice-core record of regional climate from Adélie Land, coastal Antarctica, The Cryosphere, 11, 343–362, https://doi.org/10.5194/tc-11-343-2017, 2017. a, b, c, d
Goursaud, S., Masson-Delmotte, V., Favier, V., Orsi, A., and Werner, M.: Water stable isotope spatio-temporal variability in Antarctica in 1960–2013: observations and simulations from the ECHAM5-wiso atmospheric general circulation model, Clim. Past, 14, 923–946, https://doi.org/10.5194/cp-14-923-2018, 2018. a, b
Goursaud, S., Masson-Delmotte, V., Favier, V., Preunkert, S., Legrand, M., Minster, B., and Werner, M.: Challenges associated with the climatic interpretation of water stable isotope records from a highly resolved firn core from Adélie Land, coastal Antarctica, The Cryosphere, 13, 1297–1324, https://doi.org/10.5194/tc-13-1297-2019, 2019. a
Hersbach, H., Bell, B., Berrisford, P., Hirahara, S., Horányi, A., Muñoz‐Sabater, J., Nicolas, J., Peubey, C., Radu, R., Schepers, D., Simmons, A., Soci, C., Abdalla, S., Abellan, X., Balsamo, G., Bechtold, P., Biavati, G., Bidlot, J., Bonavita, M., De Chiara, G., Dahlgren, P., Dee, D., Diamantakis, M., Dragani, R., Flemming, J., Forbes, R., Fuentes, M., Geer, A., Haimberger, L., Healy, S., Hogan, R.J., Hólm, E., Janisková, M., Keeley, S., Laloyaux, P., Lopez, P., Lupu, C., Radnoti, G., de Rosnay, P., Rozum, I., Vamborg, F., Villaume, S., and Thépaut, J-N.: The ERA5 global reanalysis, Q. J. Roy. Meteor. Soc., 146, 1999–2049, 2020. a
International Atomic Energy Agency: Reference Sheet for International Measurement Standards, Tech. rep., https://nucleus.iaea.org/rpst/documents/VSMOW_SLAP.pdf (last access: 2021), 2006. a
Jouzel, J., Masson-Delmotte, V., Cattani, O., Dreyfus, G., Falourd, S., Hoffmann, G., Minster, B., Nouet, J., Barnola, J. M., Chappellaz, J., Fischer, H., Gallet, J. C., Johnsen, S., Leuenberger, M., Loulergue, L., Luethi, D., Oerter, H., Parrenin, F., Raisbeck, G., Raynaud, D., Schilt, A., Schwander, J., Selmo, E., Souchez, R., Spahni, R., Stauffer, B., Steffensen, J. P., Stenni, B., Stocker, T. F., Tison, J. L., Werner, M., and Wolff, E. W.: Orbital and Millennial Antarctic Climate Variability over the Past 800,000 Years, Science, 317, 793–796, https://doi.org/10.1126/science.1141038, 2007. a
Jouzel, J., Delaygue, G., Landais, A., Masson-Delmotte, V., Risi, C., and Vimeux, F.: Water isotopes as tools to document oceanic sources of precipitation: Water Isotopes and Precipitation Origin, Water Resour. Res., 49, 7469–7486, https://doi.org/10.1002/2013WR013508, 2013. a
Kurita, N., Hirasawa, N., Koga, S., Matsushita, J., Steen-Larsen, H. C., Masson-Delmotte, V., and Fujiyoshi, Y.: Identification of air masses responsible for warm events on the East Antarctic coast, SOLA, 12, 307–313, 2016. a
Laepple, T., Hörhold, M., Münch, T., Freitag, J., Wegner, A., and Kipfstuhl, S.: Layering of surface snow and firn at Kohnen Station, Antarctica: Noise or seasonal signal?: Layering of Antarctic Surface Firn, J. Geophys. Res.-Earth, 121, 1849–1860, https://doi.org/10.1002/2016JF003919, 2016. a
Laepple, T., Münch, T., Casado, M., Hoerhold, M., Landais, A., and Kipfstuhl, S.: On the similarity and apparent cycles of isotopic variations in East Antarctic snow pits, The Cryosphere, 12, 169–187, https://doi.org/10.5194/tc-12-169-2018, 2018. a, b
Lagarias, J. C., Reeds, J. A., Wright, M. H., and Wright, P. E.: Convergence Properties of the Nelder–Mead Simplex Method in Low Dimensions, SIAM J. Optimiz., 9, 112–147, https://doi.org/10.1137/S1052623496303470, 1998. a
LeGrande, A. N. and Schmidt, G. A.: Global gridded data set of the oxygen isotopic composition in seawater, Geophys. Res. Lett., 33, L12604, https://doi.org/10.1029/2006GL026011, 2006. a
Leroy-Dos Santos, C.: From atmospheric water isotopes measurement to firn core interpretation in Adelie Land: A case study for isotope-enabled atmospheric models in Antarctica: DATASET, Zenodo [data set], https://doi.org/10.5281/zenodo.7708489, 2023. a
Leroy-Dos Santos, C., Casado, M., Prié, F., Jossoud, O., Kerstel, E., Farradèche, M., Kassi, S., Fourré, E., and Landais, A.: A dedicated robust instrument for water vapor generation at low humidity for use with a laser water isotope analyzer in cold and dry polar regions, Atmos. Meas. Tech., 14, 2907–2918, https://doi.org/10.5194/amt-14-2907-2021, 2021. a
Leroy‐Dos Santos, C., Masson‐Delmotte, V., Casado, M., Fourré, E., Steen‐Larsen, H., Maturilli, M., Orsi, A., Berchet, A., Cattani, O., and Minster, B.: A 4.5 year‐long record of Svalbard water vapor isotopic composition documents winter air mass origin, J. Geophys. Res.-Atmos., 125, e2020JD032681, https://doi.org/10.1029/2020JD032681, 2020. a
Majoube, M.: Fractionnement en δ18O entre la glace et la vapeur d’eau, J. Chim. Phys., 68, 625–636, 1971. a
Marshall, G. J., Fogt, R. L., Turner, J., and Clem, K. R.: Can current reanalyses accurately portray changes in Southern Annular Mode structure prior to 1979?, Clim. Dynam., 59, 3717–3740, https://doi.org/10.1007/s00382-022-06292-3, 2022. a
Merlivat, L. and Nief, G.: Fractionnement isotopique lors des changements d'état solide-vapeur et liquide-vapeur de l'eau à des températures inférieures à 0∘C, Tellus, 19, 122–127, https://doi.org/10.1111/j.2153-3490.1967.tb01465.x, 1967. a
Münch, T. and Laepple, T.: What climate signal is contained in decadal- to centennial-scale isotope variations from Antarctic ice cores?, Clim. Past, 14, 2053–2070, https://doi.org/10.5194/cp-14-2053-2018, 2018. a
Pettré, P., Payan, C., and Parish, T. R.: Interaction of katabatic flow with local thermal effects in a coastal region of Adelie Land, east Antarctica, J. Geophys. Res., 98, 10429, https://doi.org/10.1029/92JD02969, 1993. a
Retamales-Muñoz, G., Durán-Alarcón, C., and Mattar, C.: Recent land surface temperature patterns in Antarctica using satellite and reanalysis data, J. S. Am. Earth Sci., 95, 102304, https://doi.org/10.1016/j.jsames.2019.102304, 2019. a
Rignot, E., Mouginot, J., Scheuchl, B., van den Broeke, M., van Wessem, M. J., and Morlighem, M.: Four decades of Antarctic Ice Sheet mass balance from 1979–2017, P. Natl. Acad. Sci. USA, 116, 1095–1103, https://doi.org/10.1073/pnas.1812883116, 2019. a
Ritter, F., Steen-Larsen, H. C., Werner, M., Masson-Delmotte, V., Orsi, A., Behrens, M., Birnbaum, G., Freitag, J., Risi, C., and Kipfstuhl, S.: Isotopic exchange on the diurnal scale between near-surface snow and lower atmospheric water vapor at Kohnen station, East Antarctica, The Cryosphere, 10, 1647–1663, https://doi.org/10.5194/tc-10-1647-2016, 2016. a
Schlosser, E., Anschütz, H., Divine, D., Martma, T., Sinisalo, A., Altnau, S., and Isaksson, E.: Recent climate tendencies on an East Antarctic ice shelf inferred from a shallow firn core network, J. Geophys. Res.-Atmos., 119, 6549–6562, https://doi.org/10.1002/2013JD020818, 2014. a
Servettaz, A. P. M., Orsi, A. J., Curran, M. A. J., Moy, A. D., Landais, A., Agosta, C., Winton, V. H. L., Touzeau, A., McConnell, J. R., Werner, M., and Baroni, M.: Snowfall and Water Stable Isotope Variability in East Antarctica Controlled by Warm Synoptic Events, J. Geophys. Res.-Atmos., 125, e2020JD032863, https://doi.org/10.1029/2020JD032863, 2020. a
Sime, L. C., Lang, N., Thomas, E. R., Benton, A. K., and Mulvaney, R.: On high-resolution sampling of short ice cores: Dating and temperature information recovery from Antarctic Peninsula virtual cores, J. Geophys. Res.h, 116, D20117, https://doi.org/10.1029/2011JD015894, 2011. a, b, c
Sinclair, K. E., Bertler, N. A., Bowen, M. M., and Arrigo, K. R.: Twentieth century sea-ice trends in the Ross Sea from a high-resolution, coastal ice-core record, Geophys. Res. Let., 41, 3510–3516, 2014. a
Smith, R. B. and Evans, J. P.: Orographic Precipitation and Water Vapor Fractionation over the Southern Andes, J. Hydrometeorol., 8, 3–19, https://doi.org/10.1175/JHM555.1, 2007. a
Steen-Larsen, H. C., Sveinbjörnsdottir, A. E., Peters, A. J., Masson-Delmotte, V., Guishard, M. P., Hsiao, G., Jouzel, J., Noone, D., Warren, J. K., and White, J. W. C.: Climatic controls on water vapor deuterium excess in the marine boundary layer of the North Atlantic based on 500 days of in situ, continuous measurements, Atmos. Chem. Phys., 14, 7741–7756, https://doi.org/10.5194/acp-14-7741-2014, 2014. a
Steen-Larsen, H. C., Risi, C., Werner, M., Yoshimura, K., and Masson-Delmotte, V.: Evaluating the skills of isotope-enabled general circulation models against in situ atmospheric water vapor isotope observations: Evaluating Isotope-Enabled GCMs, J. Geophys. Res.-Atmos., 122, 246–263, https://doi.org/10.1002/2016JD025443, 2017. a
Stenni, B., Buiron, D., Frezzotti, M., Albani, S., Barbante, C., Bard, E., Barnola, J. M., Baroni, M., Baumgartner, M., Bonazza, M., Capron, E., Castellano, E., Chappellaz, J., Delmonte, B., Falourd, S., Genoni, L., Iacumin, P., Jouzel, J., Kipfstuhl, S., Landais, A., Lemieux-Dudon, B., Maggi, V., Masson-Delmotte, V., Mazzola, C., Minster, B., Montagnat, M., Mulvaney, R., Narcisi, B., Oerter, H., Parrenin, F., Petit, J. R., Ritz, C., Scarchilli, C., Schilt, A., Schüpbach, S., Schwander, J., Selmo, E., Severi, M., Stocker, T. F., and Udisti, R.: Expression of the bipolar see-saw in Antarctic climate records during the last deglaciation, Nat. Geosci., 4, 46–49, https://doi.org/10.1038/ngeo1026, 2011. a
Stenni, B., Curran, M. A. J., Abram, N. J., Orsi, A., Goursaud, S., Masson-Delmotte, V., Neukom, R., Goosse, H., Divine, D., van Ommen, T., Steig, E. J., Dixon, D. A., Thomas, E. R., Bertler, N. A. N., Isaksson, E., Ekaykin, A., Werner, M., and Frezzotti, M.: Antarctic climate variability on regional and continental scales over the last 2000 years, Clim. Past, 13, 1609–1634, https://doi.org/10.5194/cp-13-1609-2017, 2017. a, b
Stevens, B., Giorgetta, M., Esch, M., Mauritsen, T., Crueger, T., Rast, S., Salzmann, M., Schmidt, H., Bader, J., Block, K., Brokopf, R., Fast, I., Kinne, S., Kornblueh, L., Lohmann, U., Pincus, R., Reichler, T., and Roeckner, E.: Atmospheric component of the MPI-M Earth system model: ECHAM6, J. Adv. Model. Earth Sy., 5, 146–172, 2013. a
Tremoy, G., Vimeux, F., Cattani, O., Mayaki, S., Souley, I., and Favreau, G.: Measurements of water vapor isotope ratios with wavelength-scanned cavity ring-down spectroscopy technology: new insights and important caveats for deuterium excess measurements in tropical areas in comparison with isotope-ratio mass spectrometry: Measuring tropical water vapor isotope ratios using WS-CRDS, Rapid Commun. Mass Spectr., 25, 3469–3480, https://doi.org/10.1002/rcm.5252, 2011. a
Vega, C. P., Schlosser, E., Divine, D. V., Kohler, J., Martma, T., Eichler, A., Schwikowski, M., and Isaksson, E.: Surface mass balance and water stable isotopes derived from firn cores on three ice rises, Fimbul Ice Shelf, Antarctica, The Cryosphere, 10, 2763–2777, https://doi.org/10.5194/tc-10-2763-2016, 2016. a
Wang, L., Ceriotti, M., and Markland, T. E.: Quantum kinetic energy and isotope fractionation in aqueous ionic solutions, Phys. Chem. Chem. Phys., 22, 10490–10499, 2020. a
Wang, Y., Ding, M., Reijmer, C. H., Smeets, P. C. J. P., Hou, S., and Xiao, C.: The AntSMB dataset: a comprehensive compilation of surface mass balance field observations over the Antarctic Ice Sheet, Earth Syst. Sci. Data, 13, 3057–3074, https://doi.org/10.5194/essd-13-3057-2021, 2021. a