the Creative Commons Attribution 4.0 License.
the Creative Commons Attribution 4.0 License.
 | 29 Nov 2023
Evaluation of snow cover properties in ERA5 and ERA5-Land with several satellite-based datasets in the Northern Hemisphere in spring 1982–2018
Kari Luojus
Aku Riihelä
Seasonal snow cover of the Northern Hemisphere (NH) greatly influences surface energy balance; hydrological cycle; and many human activities, such as tourism and agriculture. Monitoring snow cover at a continental scale is only possible from satellites or using reanalysis data. This study aims to analyze the time series of snow water equivalent (SWE), snow cover extent (SCE), and surface albedo in spring in ERA5 and ERA5-Land reanalysis data and to compare the time series with several satellite-based datasets. As reference data for the SWE intercomparison, we use bias-corrected SnowCCI v1 data for non-mountainous regions and the mean of Brown, MERRA-2, and Crocus v7 datasets for the mountainous regions. For surface albedo, we use the black-sky albedo datasets CLARA-A2 SAL, based on AVHRR data, and MCD43D51, based on MODIS data. Additionally, we use Rutgers and JAXA JASMES SCE products. Our study covers land areas north of 40∘ N and the period between 1982 and 2018 (spring season from March to May). The analysis shows that both ERA5 and ERA5-Land overestimate total NH SWE by 150 % to 200 % compared to the SWE reference data. ERA5-Land shows larger overestimation, which is mostly due to very high SWE values over mountainous regions. The analysis revealed a discontinuity in ERA5 around the year 2004 since adding the Interactive Multisensor Snow and Ice Mapping System (IMS) from the year 2004 onwards considerably improves SWE estimates but makes the trends less reliable. The negative NH SWE trends in ERA5 range from −249 to −236 Gt per decade in spring, which is 2 to 3 times larger than the trends detected by the other datasets (ranging from −124 to −77 Gt per decade). SCE is accurately described in ERA5-Land, whereas ERA5 shows notably larger SCE than the satellite-based datasets. Albedo estimates are more consistent between the datasets, with a slight overestimation in ERA5 and ERA5-Land. The negative trends in SCE and albedo are strongest in May, when the albedo trend varies from −0.011 to −0.006 per decade depending on the dataset. The negative SCE trend detected by ERA5 in May ( km2 per decade) is about twice as large as the trends detected by all other datasets (ranging from −0.66 to km2 per decade). The analysis also shows that there is a large spatial variability in the trends, which is consistent with other studies.
- Article
(9022 KB) - Full-text XML
-
Supplement
(2449 KB) - BibTeX
- EndNote


Seasonal snow cover of the Northern Hemisphere (NH) is an important part of the global climate system. In winter, a large fraction of incoming solar radiation is reflected due to the high albedo of snow cover, whereas in summer, the darker snow-free surface absorbs more incoming solar radiation (Callaghan et al., 2011; Flanner et al., 2011; Qu and Hall, 2005; Trenberth and Fasullo, 2009). Therefore, changes in snow cover will affect the surface albedo and thus the surface energy balance.
Snow cover affects many human activities, such as road traffic, tourism, forestry, and agriculture (Callaghan et al., 2011). In the high latitudes and the mountainous regions, snow cover also greatly influences the hydrological cycle (Barnett et al., 2005; Bormann et al., 2018; Callaghan et al., 2011; Douville et al., 2002; Li et al., 2017). In winter, snow cover stores a large amount of fresh water. When snow melts in spring and summer, water is released and redistributed. Melting snow is an important source of fresh water as about one-sixth of the world's population depends on meltwater from snow (Barnett et al., 2005). Hydropower production is also dependent on meltwater from snow (Callaghan et al., 2011; Magnusson et al., 2020). In many regions, most of the annual inflow to hydropower reservoirs often comes during the spring snowmelt period (Magnusson et al., 2020). Therefore, changes in snow cover can both cause water shortages and affect hydropower production.
The global air temperature is rising due to climate change which causes the melt season to begin earlier and affects the timing of the streamflow peaks (Kundzewicz et al., 2008; Musselman et al., 2021). Rising temperatures also cause the winter precipitation to shift from snow to rain, which impacts the intensity of the streamflow during the melt season (Kundzewicz et al., 2008). The streamflow is projected to decrease, especially in the USA and southern and central Europe (Van Vliet et al., 2016).
Snow water equivalent (SWE) is the amount of water that would result if the snowpack melted instantaneously, and it can be expressed in millimeters or, equivalently, in kilograms per square meter (Fierz et al., 2009). Recent studies show negative trends in global SWE and the extent and duration of NH snow cover, but seasonal and spatial variability exists (Bormann et al., 2018; Derksen and Mudryk, 2022; Hernández-Henríquez et al., 2015; Pulliainen et al., 2020). A considerable part of the seasonal snow cover is located in the NH. Therefore, when studying snow cover at a continental scale, the changes in Southern Hemisphere snow cover are minor compared to the changes in the NH. Seasonal snow in spring is especially sensitive to warming due to the strong surface albedo feedback (SAF) (Derksen and Brown, 2012). In winter, there is not much sunlight in the Arctic, so changes in snow cover have a smaller effect on the surface energy budget. In spring, the amount of incoming solar radiation increases, which also intensifies SAF. Since there is still a lot of snow in the Arctic in the spring season, changes in the spring snow cover greatly affect the surface energy balance and, thus, the climate system (Déry and Brown, 2007).
In early winter from October to December, most datasets show negative trends in snow cover extent (SCE), while in January and February, there are no significant trends (Mudryk et al., 2017). The observed snow cover trends in spring are negative in both Eurasia and North America (Derksen and Brown, 2012; Essery et al., 2020; Hernández-Henríquez et al., 2015). Also, a clear trend exists toward an earlier melt season (Metsämäki et al., 2018; Takala et al., 2009; Tedesco et al., 2009). SWE shows large spatial variability; in North America, there is a negative trend in observed SWE, whereas in Eurasia the trends are less prominent. In Siberia, there are also regions where SWE is observed and projected to increase (Pulliainen et al., 2020; Räisänen, 2008).
Particularly in the Arctic regions, snow cover plays a significant role in the climate system, making it crucial to understand the characteristics of the snow cover in these areas. As in situ measurement networks are sparse, snow cover monitoring at a continental scale is only possible from satellites or using reanalysis data. Both methods can cover large areas and provide snow cover estimates also in those regions that lack in situ observations and are therefore widely used in climate research (e.g., Mortimer et al., 2020; Mudryk et al., 2020).
Reanalyses provide decadal time series with multiple variables, making them suitable for various kinds of research, and they have become an important part of climate studies. ERA5 is the fifth-generation ECMWF (European Centre for Medium-Range Weather Forecasts) atmospheric reanalysis replacing the older ERA-Interim reanalysis (Hersbach et al., 2020). ERA5 uses advanced modeling and data assimilation systems and combines large numbers of historical observations into global estimates. ERA5-Land, in turn, is the land component from ERA5 with a finer spatial resolution (Muñoz-Sabater et al., 2021).
Snow cover properties in ERA5 and ERA5-Land have been evaluated in several studies (e.g., Mortimer et al., 2020; Urraca and Gobron, 2021; Räisänen, 2023). Overall, ERA5 and ERA5-Land have been found to perform well compared to other reanalyses (Jia et al., 2022; Lei et al., 2023; Mortimer et al., 2020). However, studies have shown that ERA5 tends to overestimate snow cover extent, SWE, and surface albedo (Bian et al., 2019; Guo and Yang, 2022; Orsolini et al., 2019; Xiaona et al., 2020). Also, ERA5-Land shows a slight overestimation in surface albedo during the snow-free season (Jia et al., 2022). ERA5 slightly underestimates very deep snow, especially late in the snow season, and shows delayed ablation of deep snowpack in spring (Lei et al., 2023; Mortimer et al., 2020). ERA5-Land SWE estimates agree well with other reanalysis datasets but struggle in comparison with satellite-based data (Räisänen, 2023). ERA5-Land shows especially large overestimation over mountainous areas (Monteiro and Morin, 2023). Also, a discontinuity in 2004 has been observed in ERA5 snow cover estimates, which is due to adding Interactive Multisensor Snow and Ice Mapping System (IMS) information in ERA5 (Urraca and Gobron, 2021; Mortimer et al., 2020). This discontinuity has improved the accuracy of snow cover estimates after the year 2004 but decreased the temporal stability (Urraca and Gobron, 2021).
Even though several studies exist on evaluating either ERA5 or ERA5-Land, few studies exist on comparing snow cover properties in ERA5 and ERA5-Land. Lei et al. (2023) studied the effect of spatial resolution on snow depth estimates over the Tibetan Plateau and found that the finer-resolution ERA5-Land is more consistent with in situ measurements than ERA5. Li et al. (2022) found that both ERA5 and ERA5-Land tend to overestimate snow depth at high elevations in Central Asia. Monteiro and Morin (2023) have assessed the performance of several reanalyses, including ERA5 and ERA5-Land, over the European Alps and concluded that ERA5-Land considerably overestimates SWE, while ERA5 is better in line with the reference data. Urraca and Gobron (2023) studied snow cover duration and the stability of the trends in ERA5 and ERA5-Land over the NH but did not consider other variables related to snow cover. Thus, our study is, to the authors' knowledge, the first where NH snow cover properties (SWE, SCE, and albedo) are compared between ERA5 and ERA5-Land and evaluated with several satellite-based datasets.
2.1 ERA5 and ERA5-Land
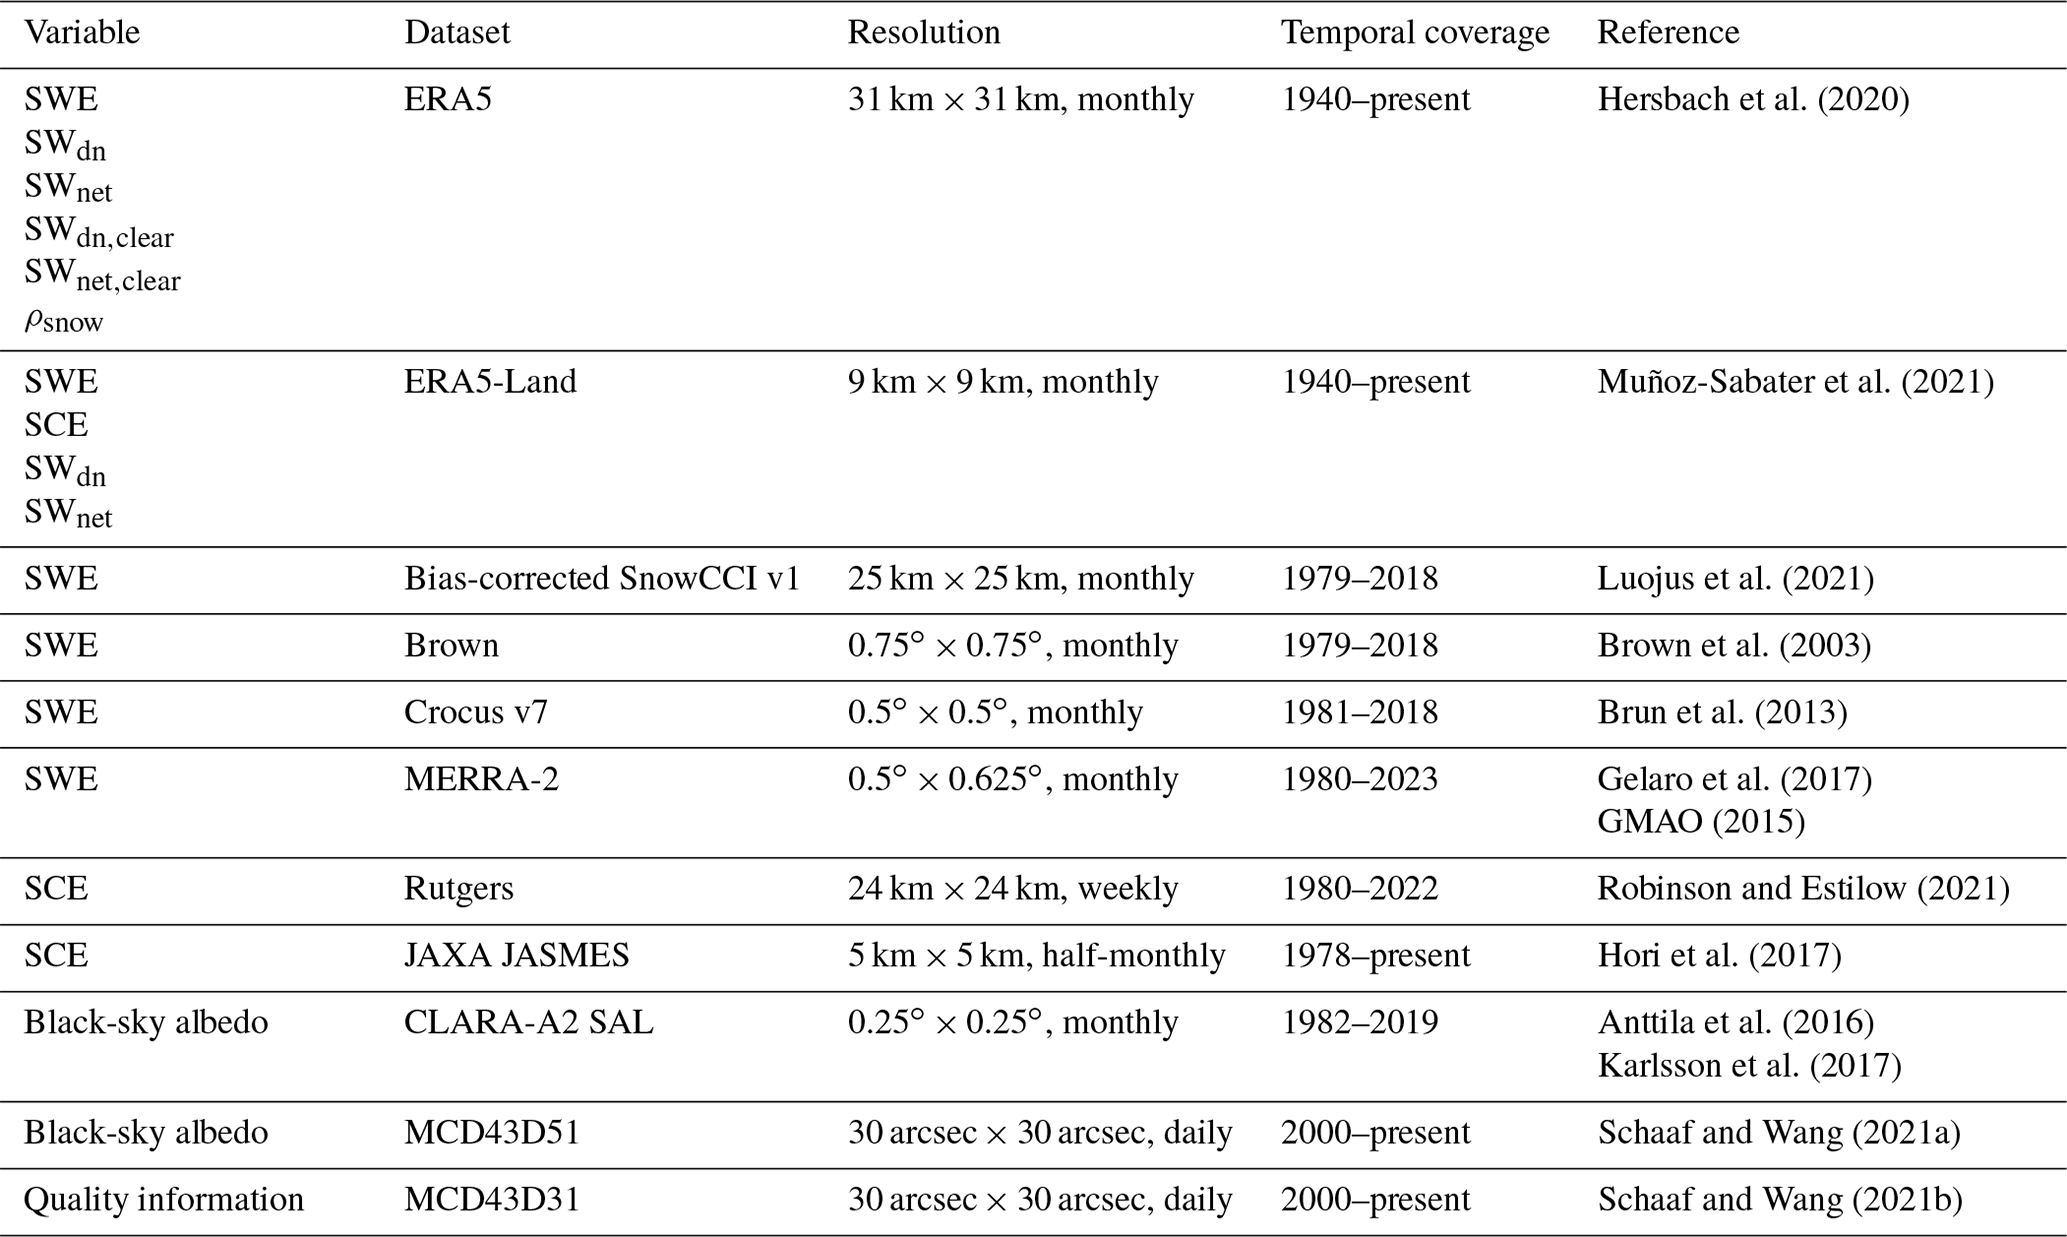
The datasets used in this study are listed in Table 1. ERA5 is the fifth-generation ECMWF atmospheric reanalysis replacing the older ERA-Interim (Hersbach et al., 2020). ERA5 covers the years from 1940 onwards with a grid resolution of 31 km, which is a considerably higher spatial resolution than in ERA-Interim (80 km). ERA5 is based on Integrated Forecasting System (IFS) Cycle 41r2, and it provides hourly fields for all variables. Additionally, it provides pre-computed monthly means (Hersbach et al., 2020), which we used in this study. The number of observations assimilated in ERA5 increases constantly throughout the production period. ERA5 assimilates snow depth information from several SYNOP (surface synoptic observation) stations, and from the year 2004 onwards, it also uses IMS data over the NH (Hersbach et al., 2020). IMS uses both satellite data and in situ measurements to produce daily binary snow cover maps (USNIC, 2008). IMS is assimilated to ERA5 only at altitudes below 1500 m (Hersbach et al., 2020). The snow cover observations are assimilated into ERA5 using a two-step algorithm (de Rosnay et al., 2014). First, grid cells that are snow-covered in IMS but snow-free in the model are assigned with a constant snow density (100 kg m−2) and snow depth (0.1 m). Second, the optimal interpolation scheme is used to assimilate in situ observations and snow-free IMS observations and to produce the final snow field.
ERA5-Land is a replay of the land component of ERA5 with a finer spatial resolution (9 km) (Muñoz-Sabater et al., 2021). It is produced with the land model H_TESSEL and without coupling the atmospheric module. Also, ERA5-Land runs without data assimilation, which makes it computationally lighter (Muñoz-Sabater et al., 2021).
Our study includes three variables: SWE, SCE, and albedo. SWE is directly available in both ERA5 and ERA5-Land (variable “sd”). In ERA5-Land, snow cover fraction in a grid cell (SC) is directly available (variable “snowc”), but for ERA5, we calculated SC in a grid cell using snow density and SWE (ECMWF, 2016):
where ρsnow is the density of snow. We calculated SCE by multiplying the snow cover fraction in a grid cell (SC) by the grid cell size.
ERA5 and ERA5-Land provide several estimates for albedo. Albedo is the hemispherical reflectance of the surface, defined as the ratio between reflected and incoming solar radiative fluxes (Ångström, 1925). When incoming solar radiation propagates through atmosphere, it can be scattered to different directions due to, for example, clouds and aerosols. A part of this scattered radiation reaches the surface, and it is called the diffuse solar radiation. The solar radiation that reaches the surface without being scattered is called direct solar radiation. Albedo can be divided into different components based on the solar radiation: the surface albedo, including both direct and diffuse solar radiation, is often referred to as blue-sky albedo. The albedo for direct solar radiation is the directional–hemispherical reflectance, often also called black-sky albedo. The albedo for the diffuse radiation, in turn, is bi-hemispherical reflectance and called white-sky albedo (Schaepman-Strub et al., 2006). The blue-sky albedo is a weighted average of black-sky and white-sky albedos (Schaepman-Strub et al., 2006). Clouds affect the ratio between the diffuse and direct solar radiation; therefore, the cloudiness changes also affect the blue-sky albedo (Key et al., 2001). Typically, the values for white-sky albedo are larger than the values for black-sky albedo, and blue-sky albedo is somewhere between these two (Manninen et al., 2012, 2019; Schaepman-Strub et al., 2006).
Both ERA5 and ERA5-Land have the albedo for diffuse radiation, i.e., the white-sky albedo (variable “fal”), directly available. Also, ERA5 and ERA5-Land provide radiation estimates from which blue-sky albedo can be computed. Additionally, ERA5 has radiation estimates for clear-sky conditions from which blue-sky albedo for clear sky can be calculated. Thus, we calculated the blue-sky albedo (αblue) using downward solar radiation (SWdn; variable “ssrd”) and net solar radiation (SWnet; variable “ssr”):
Similarly, blue-sky albedo for clear sky (αclear) was calculated using Eq. (2) with the radiation estimates for clear skies (downward solar radiation for clear skies, variable “ssrdc”, and net solar radiation for clear skies, variable “ssrc”).
We compared the time series of all these albedo estimates (Fig. S1 in the Supplement), and the analysis showed that the different albedo estimates are very close to each other in both ERA5 and ERA5-Land. The difference between the different albedo estimates ranges from 0 % to 0.9 % (absolute), while typically the albedo over snow and ice is 4 %–6 % (absolute) higher under cloud cover than in clear skies (Key et al., 2001). The satellite-based products (Sect. 2.2) provide estimates for black-sky albedo, which is not available in ERA5 or ERA5-Land. From the variables shown in Fig. S1, the blue-sky albedo for clear sky (αclear) would typically be the closest estimate to black-sky albedo, whereas white-sky albedo is typically the furthest away from black-sky albedo. However, the blue-sky albedo for clear sky (αclear) is only available in ERA5 and not in ERA5-Land. Therefore, we decided to use the blue-sky albedo (αblue) in this analysis, as it is available in both ERA5 and ERA5-Land. This issue is further discussed in Sect. 2.2.
2.2 Reference datasets
The SWE reference data used in this study consist of four datasets: bias-corrected ESA CCI Snow (“SnowCCI”; European Space Agency Climate Change Initiative, Snow) v1 data (Luojus et al., 2021), MERRA-2 (the Modern-Era Retrospective analysis for Research and Applications, Version 2; Gelaro et al., 2017; GMAO, 2015), Brown (Brown et al., 2003), and Crocus v7 (Brun et al., 2013).
SnowCCI v1, which is the same product as the GlobSnow v3 SWE product, is based on satellite-based microwave brightness temperature data and ground-based snow depth measurements (Luojus et al., 2021). The bias-corrected version is subsequently bias-corrected with extensive ground-based snow course measurements, which decreases the uncertainty in hemisphere-mean SWE estimates notably (Pulliainen et al., 2020). We have used bias-corrected SnowCCI v1, even though version 2 (v2) is already available. A notable difference between v1 and v2 is that v1 uses constant snow density, while v2 uses spatially and temporally varying snow densities (Mortimer et al., 2022). Using dynamic density improves the seasonal evolution of SWE, but, simultaneously, it decreases the annual maximum SWE, which leads to an underestimation of SWE in v2 (Mortimer et al., 2022). Therefore, v1 currently provides more reliable SWE estimates for multidecadal trend detection, and the bias corrections further improve v1 (Pulliainen et al., 2020) which makes the bias-corrected SnowCCI v1 currently the best SWE estimate. The bias-corrected SnowCCI v1 data (hereafter referred to as SnowCCI) are available for the period 1979–2018 and are mapped to a 25 km EASE grid (Luojus et al., 2021).
Currently, the SnowCCI dataset is the only available observation-based SWE dataset covering multiple decades and the entire NH. However, SnowCCI data are only available for non-mountainous regions, and therefore we have used model-based SWE products in the mountainous regions. As mountain areas store a considerable portion of snow mass (Kim et al., 2021), we decided to include them in this analysis as well, despite the lack of observation-based data products. We have used the mean of the MERRA-2, Brown, and Crocus v7 SWE products for the mountainous regions. MERRA-2 is a NASA (National Aeronautics and Space Administration) atmospheric reanalysis, and it is available from the year 1980 onwards (Gelaro et al., 2017). The Brown SWE product, in turn, uses a simple snow scheme driven by the ERA-Interim reanalysis (Brown et al., 2003). The Crocus version 7 product is a physical snow model driven by ERA-Interim reanalysis (Brun et al., 2013). Both MERRA-2 and Crocus v7 tend to slightly overestimate SWE under 150 mm and underestimate SWE over 150 mm (Mortimer et al., 2020). When interpreting the results, however, it should be kept in mind that we are comparing ERA5 and ERA5-Land with other model products, which can make the comparison more problematic. However, this approach has been used in other studies too (Mudryk et al., 2020; Derksen and Mudryk, 2023). Also, averaging over multiple products can improve the accuracy of SWE estimates (Mortimer et al., 2020), making the SWE estimates more reliable.
The SCE products used in this study are the Rutgers weekly product (Robinson and Estilow, 2021) and the JAXA JASMES SCE product (Hori et al., 2017). The Rutgers product provides weekly SCE at 24 km resolution. It is a binary product (no snow or snow-covered), and the threshold for which a grid cell is considered snow-covered is 50 % or greater (Robinson and Estilow, 2021). The data are available from the year 1980 onwards. The Rutgers weekly SCE product at 190 km resolution has been widely used in climate research (e.g., Brown et al., 2010; Déry and Brown, 2007; Hernández-Henríquez et al., 2015), as the dataset is available from the year 1966 onwards, making it the longest running satellite-based record of any environmental variable (Estilow et al., 2015). Recently, the product was gridded to a finer resolution, as the weekly SCE maps spanning from 1980 through 1999 were digitized at 24 km resolution. Since 1999, the SCE charts have been produced daily at 24 km resolution using the IMS data (Robinson and Estilow, 2021). Especially before the IMS period, the data are most accurate with cloud-free conditions, stable or slowly changing snow cover, and high solar illumination levels (Robinson and Estilow, 2021).
The JAXA JASMES product is based on AVHRR and MODIS data (Hori et al., 2017). The product provides the snow cover fraction (0 %–100 %) at 5 km resolution and is available from the year 1978 onwards. The product uses AVHRR before 2000 and MODIS data from the year 2000 onwards (Hori et al., 2017). Studies have shown that JAXA JASMES tends to slightly overestimate SCE, and the overestimation increases in spring. However, the overall accuracy of the dataset is very high (Hori et al., 2017). Rutgers shows higher SCE than JAXA JASMES in the Arctic (north of 60∘ N) in May (Derksen and Mudryk, 2023).
We used two satellite-based surface albedo products in this study. The CLARA-A2 SAL (Clouds, Albedo and Radiation second release Surface Albedo) product provides the broadband shortwave directional–hemispherical reflectance, i.e., the black-sky albedo (Anttila et al., 2016a; Karlsson et al., 2017). The product is based on AVHRR (Advanced Very High Resolution Radiometer) data, and the data are available for the period 1982–2019. We used the monthly mean values with a spatial resolution of 0.25∘ × 0.25∘ on a regular latitude–longitude grid. The mean relative retrieval error is −0.6 %, the mean root mean square error is 0.075, and the decadal relative stability (over Summit Camp in Greenland) is 8.5 % (Anttila et al., 2016b). The product has been found to perform especially well over snow and ice, which makes it well suited for cryospheric studies over the Arctic (Anttila et al., 2016b).
Additionally, we used the MCD43D51 product, which is the black-sky albedo for the MODIS shortwave broadband (Schaaf and Wang, 2021a). It is a daily product with a grid resolution of 30 arcsec (1 km) and is available from the year 2000 onwards. We also used the quality information (MCD43D31) for the albedo product (Schaaf and Wang, 2021b) and only included pixels with good quality in the analysis, which ensures the high accuracy of the product.
The satellite-based albedo products provide black-sky albedo estimates, whereas ERA5 and ERA5-Land albedo estimates are for blue-sky albedo, which can cause a slight uncertainty in the comparison. However, studies have shown that the difference between black sky and blue sky is less than 5 % with low aerosol optical depth (AOD) values (Manninen et al., 2012), which is typical for the Arctic region (Shikwambana and Sivakumar, 2018). Therefore, we decided not to make any adjustments to any of the albedo datasets to minimize the possible discrepancies between black-sky and blue-sky albedo estimates. This approach has also been used in previous studies (e.g., Riihelä et al., 2013; Pohl et al., 2020). For simplicity, from now on, we simply refer to albedo and do not differentiate between different types of albedos unless the difference is relevant.
2.3 Methods
We have used the nearest neighbor method to resample ERA5, ERA5-Land, Brown, Crocus, MERRA-2, Rutgers, and JAXA JASMES to a 25 km equal-area projection. The nearest neighbor was sufficient for our study because the native grid resolutions of the datasets were already very similar. The higher-resolution MODIS albedo product was first coarsened to 0.25∘ resolution by calculating the mean value of all the grid cells within one 0.25∘ × 0.25∘ grid cell and subsequently resampled to 25 km equal-area projection using the nearest neighbor method. We have used monthly mean values for each variable. The snow cover extent (SCE) was calculated by multiplying the area of one grid cell (25 km × 25 km) with the snow cover fraction in each grid cell. Our study covers land areas north of 40∘ N (glaciers and ice sheets are excluded) and the period between 1982–2018 (spring season from March to May). As MODIS data are available only from the year 2000 onwards, we have done some analysis additionally for the period 2000–2018.
To study the trends, we used the Theil–Sen estimator (Sen, 1968; Theil, 1950), which is the median of all slopes between paired values, and it is less sensitive to outliers than the ordinary least squares linear regression. We calculated trends for the entire study area (Sect. 3.1) and separately for Eurasia and North America (Sect. 3.2). Additionally, we computed the trends in each grid cell (Sect. 3.3) to study the spatial variability in the trends. If there were missing values when calculating the trends in each grid cell, we calculated trends only in grid cells with at least 15 values available during the study period (i.e., at least 15 years of data).
Figure 1 shows as an example the mean values for each of the datasets in April 1982–2018 (MODIS 2000–2018), and the differences are shown in the Supplement (Fig. S2). Overall, the spatial distributions of SWE, SCE, and albedo are quite similar in ERA5, ERA5-Land, and the satellite-based datasets. SWE shows large spatial variability of all the datasets. The highest monthly mean values exceed 240 mm, and these are found in the Rocky Mountains, southeastern Canada, Scandinavia, and Siberia. However, in ERA5 and ERA5-Land, the areas with very high SWE values are more extensive than in the SWE reference data, indicating that both ERA5 and ERA5-Land overestimate SWE compared to the SWE reference data. Also, ERA5-Land seems to overestimate SWE even more than ERA5.
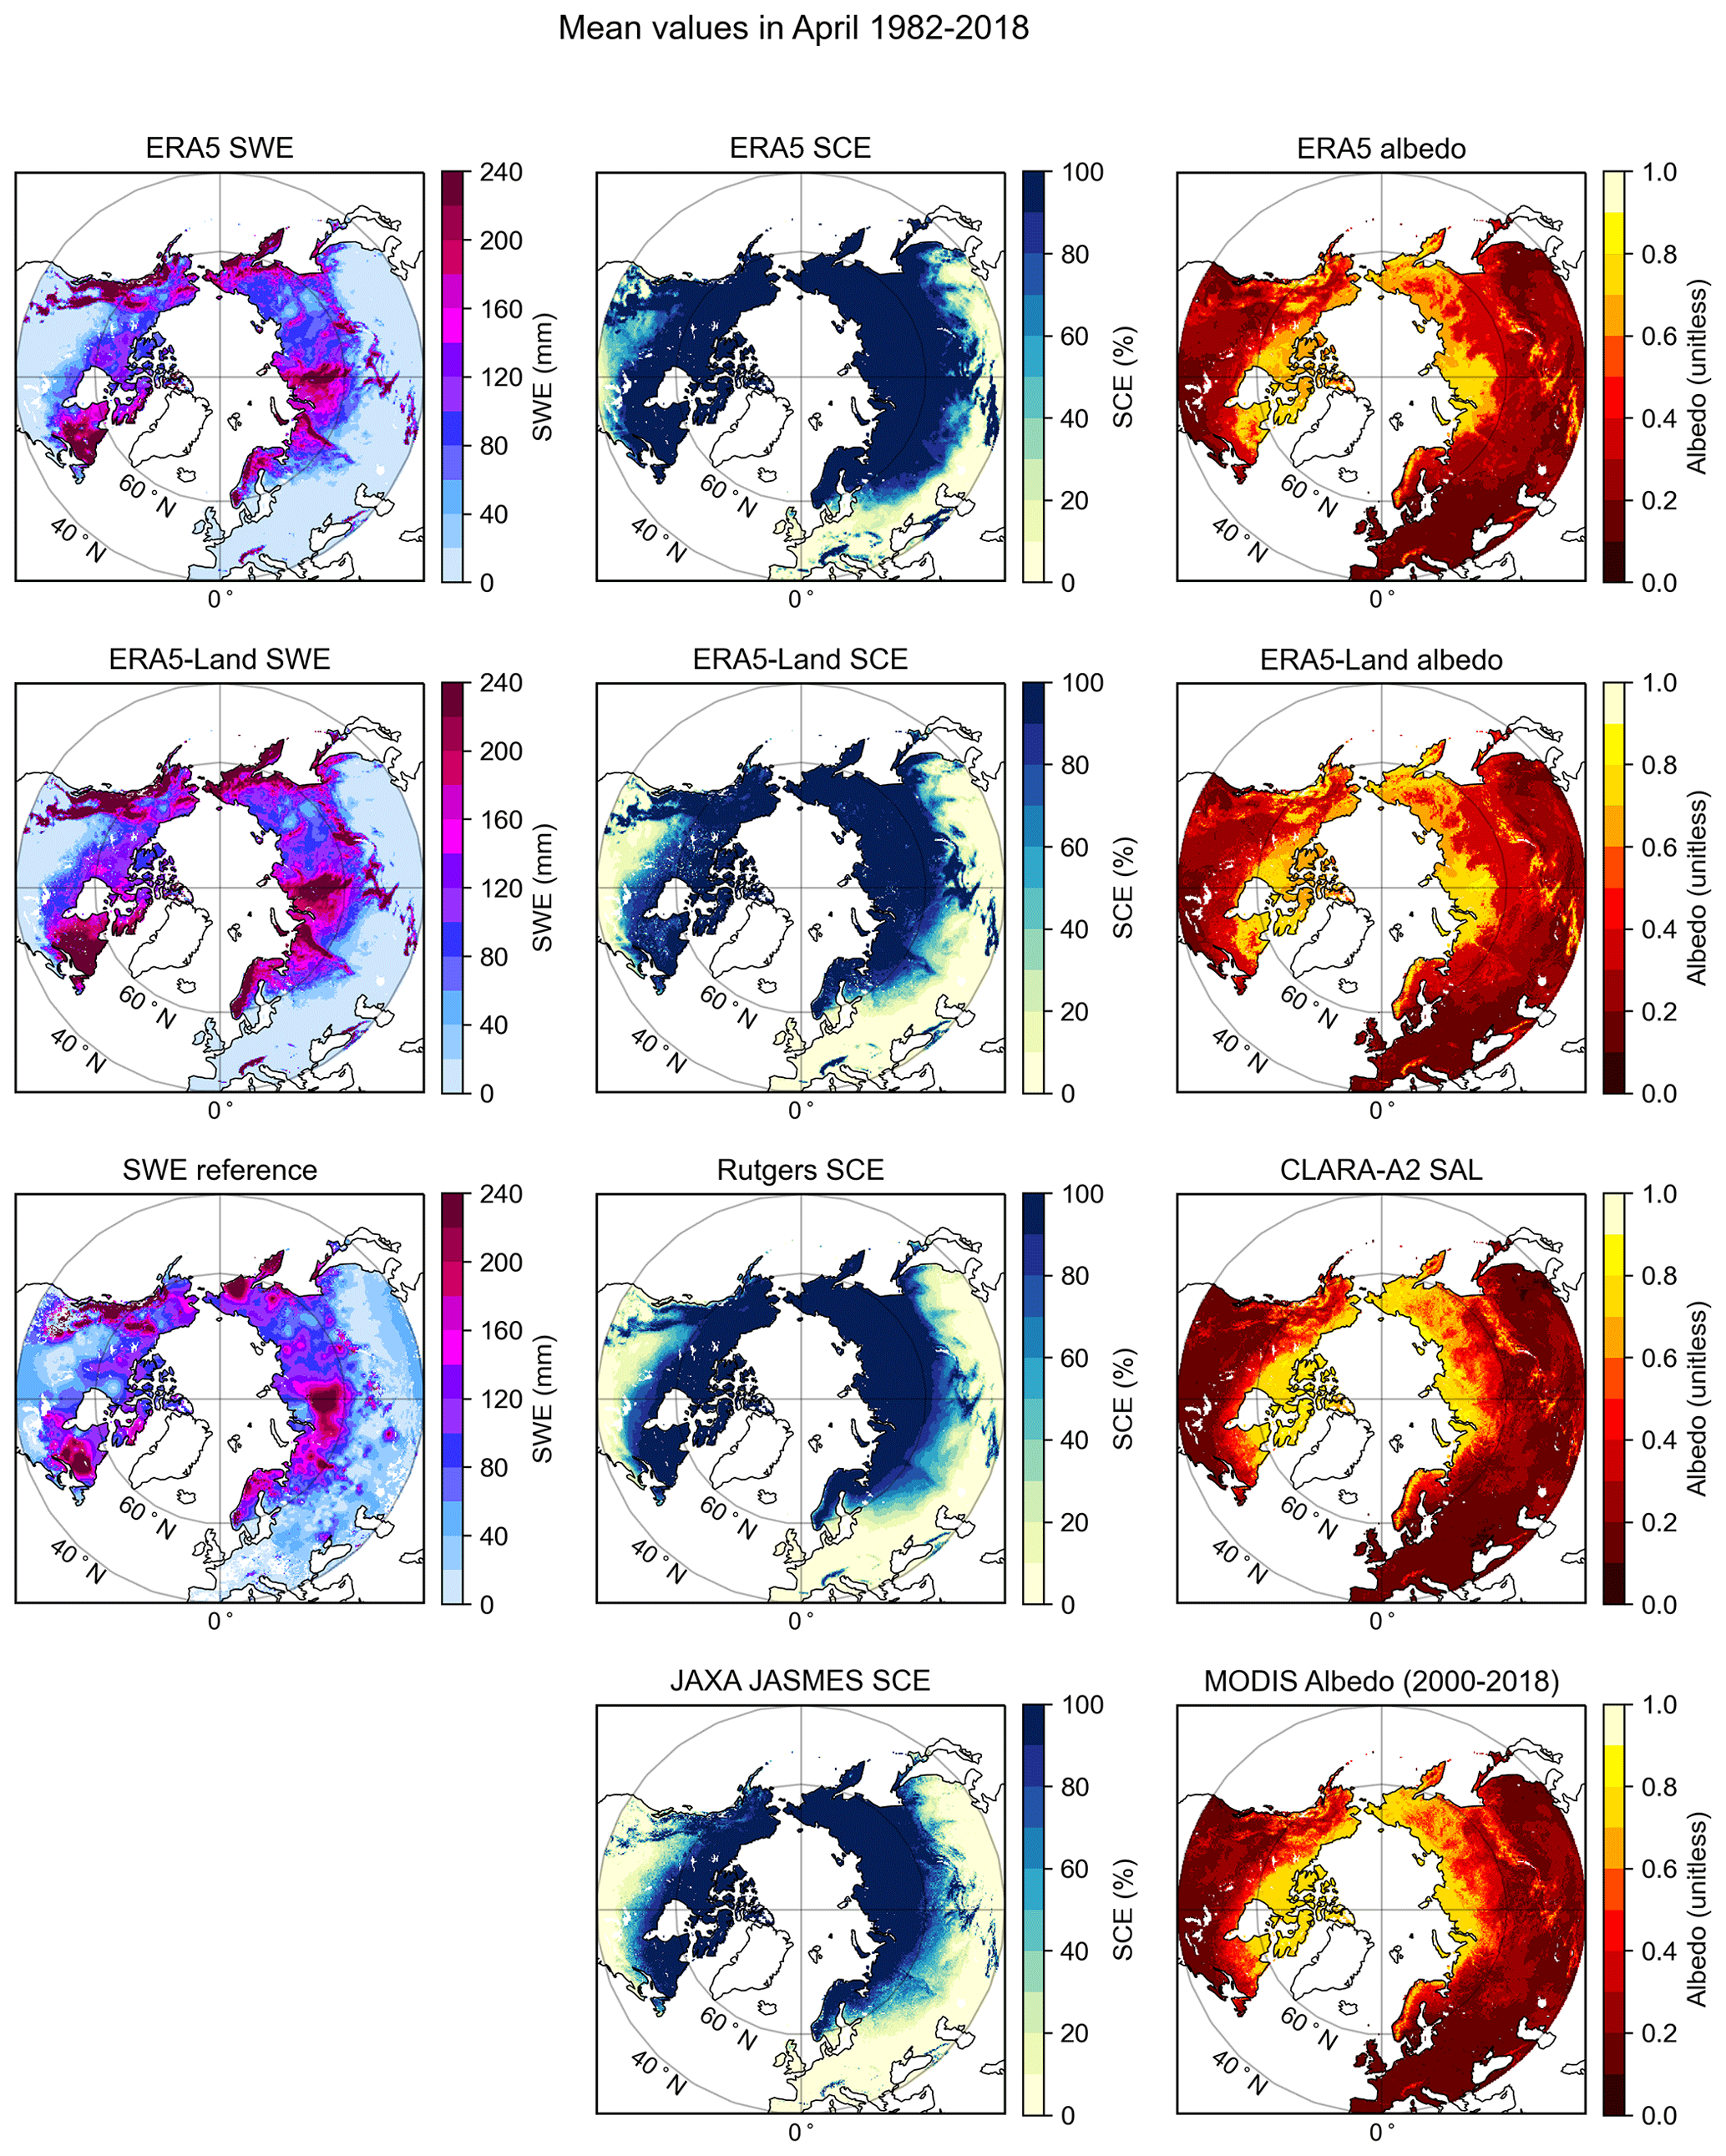
Figure 1Mean values in April 1982–2018 for each of the datasets (MODIS 2000–2018).
The spatial distribution of SCE is consistent between ERA5-Land, Rutgers, and JAXA JASMES, whereas ERA5 shows clearly larger SCE. Albedo shows the highest values in the northern part of the study area, and the spatial distribution is similar to the SWE distribution. All the albedo datasets are quite consistent with each other. When comparing ERA5 and ERA5-Land, ERA5-Land shows slightly higher values than ERA5. The difference plots (Fig. S2) reveal that SCE and albedo in ERA5-Land show very consistent differences when comparing them with the satellite-based datasets. Both variables show negative differences in the northernmost parts of the study area and positive differences around latitude 60∘ N. For ERA5, there are clear inconsistencies between the variables.
3.1 Time series and trends in the NH
Both ERA5 and ERA5-Land notably overestimate the SWE sum over the entire study area in every month in spring compared to the SWE reference data (Fig. 2, top row). ERA5-Land shows even higher values than ERA5, which was also evident in Fig. 1. The magnitude of the difference stays about the same (Fig. 2, second row) throughout the spring season, indicating that in late spring the relative difference is very large. The values in ERA5 and ERA5-Land are about 2 times higher in March and almost 3 times higher in May compared to the SWE reference data. The difference between ERA5-Land and SWE reference data stays around 3000 Gt throughout the study period. For ERA5, in turn, there is a clear drop in the difference around the year 2004, which is the year when IMS data were added to the reanalysis. The drop is more visible in March and April than in May. The root mean square error (RMSE) for ERA5 varies between 1200 and 1400 Gt depending on the month and for ERA5-Land between 2780 and 3160 Gt, respectively. RMSE for each month and dataset are shown in the Supplement (Table S1).
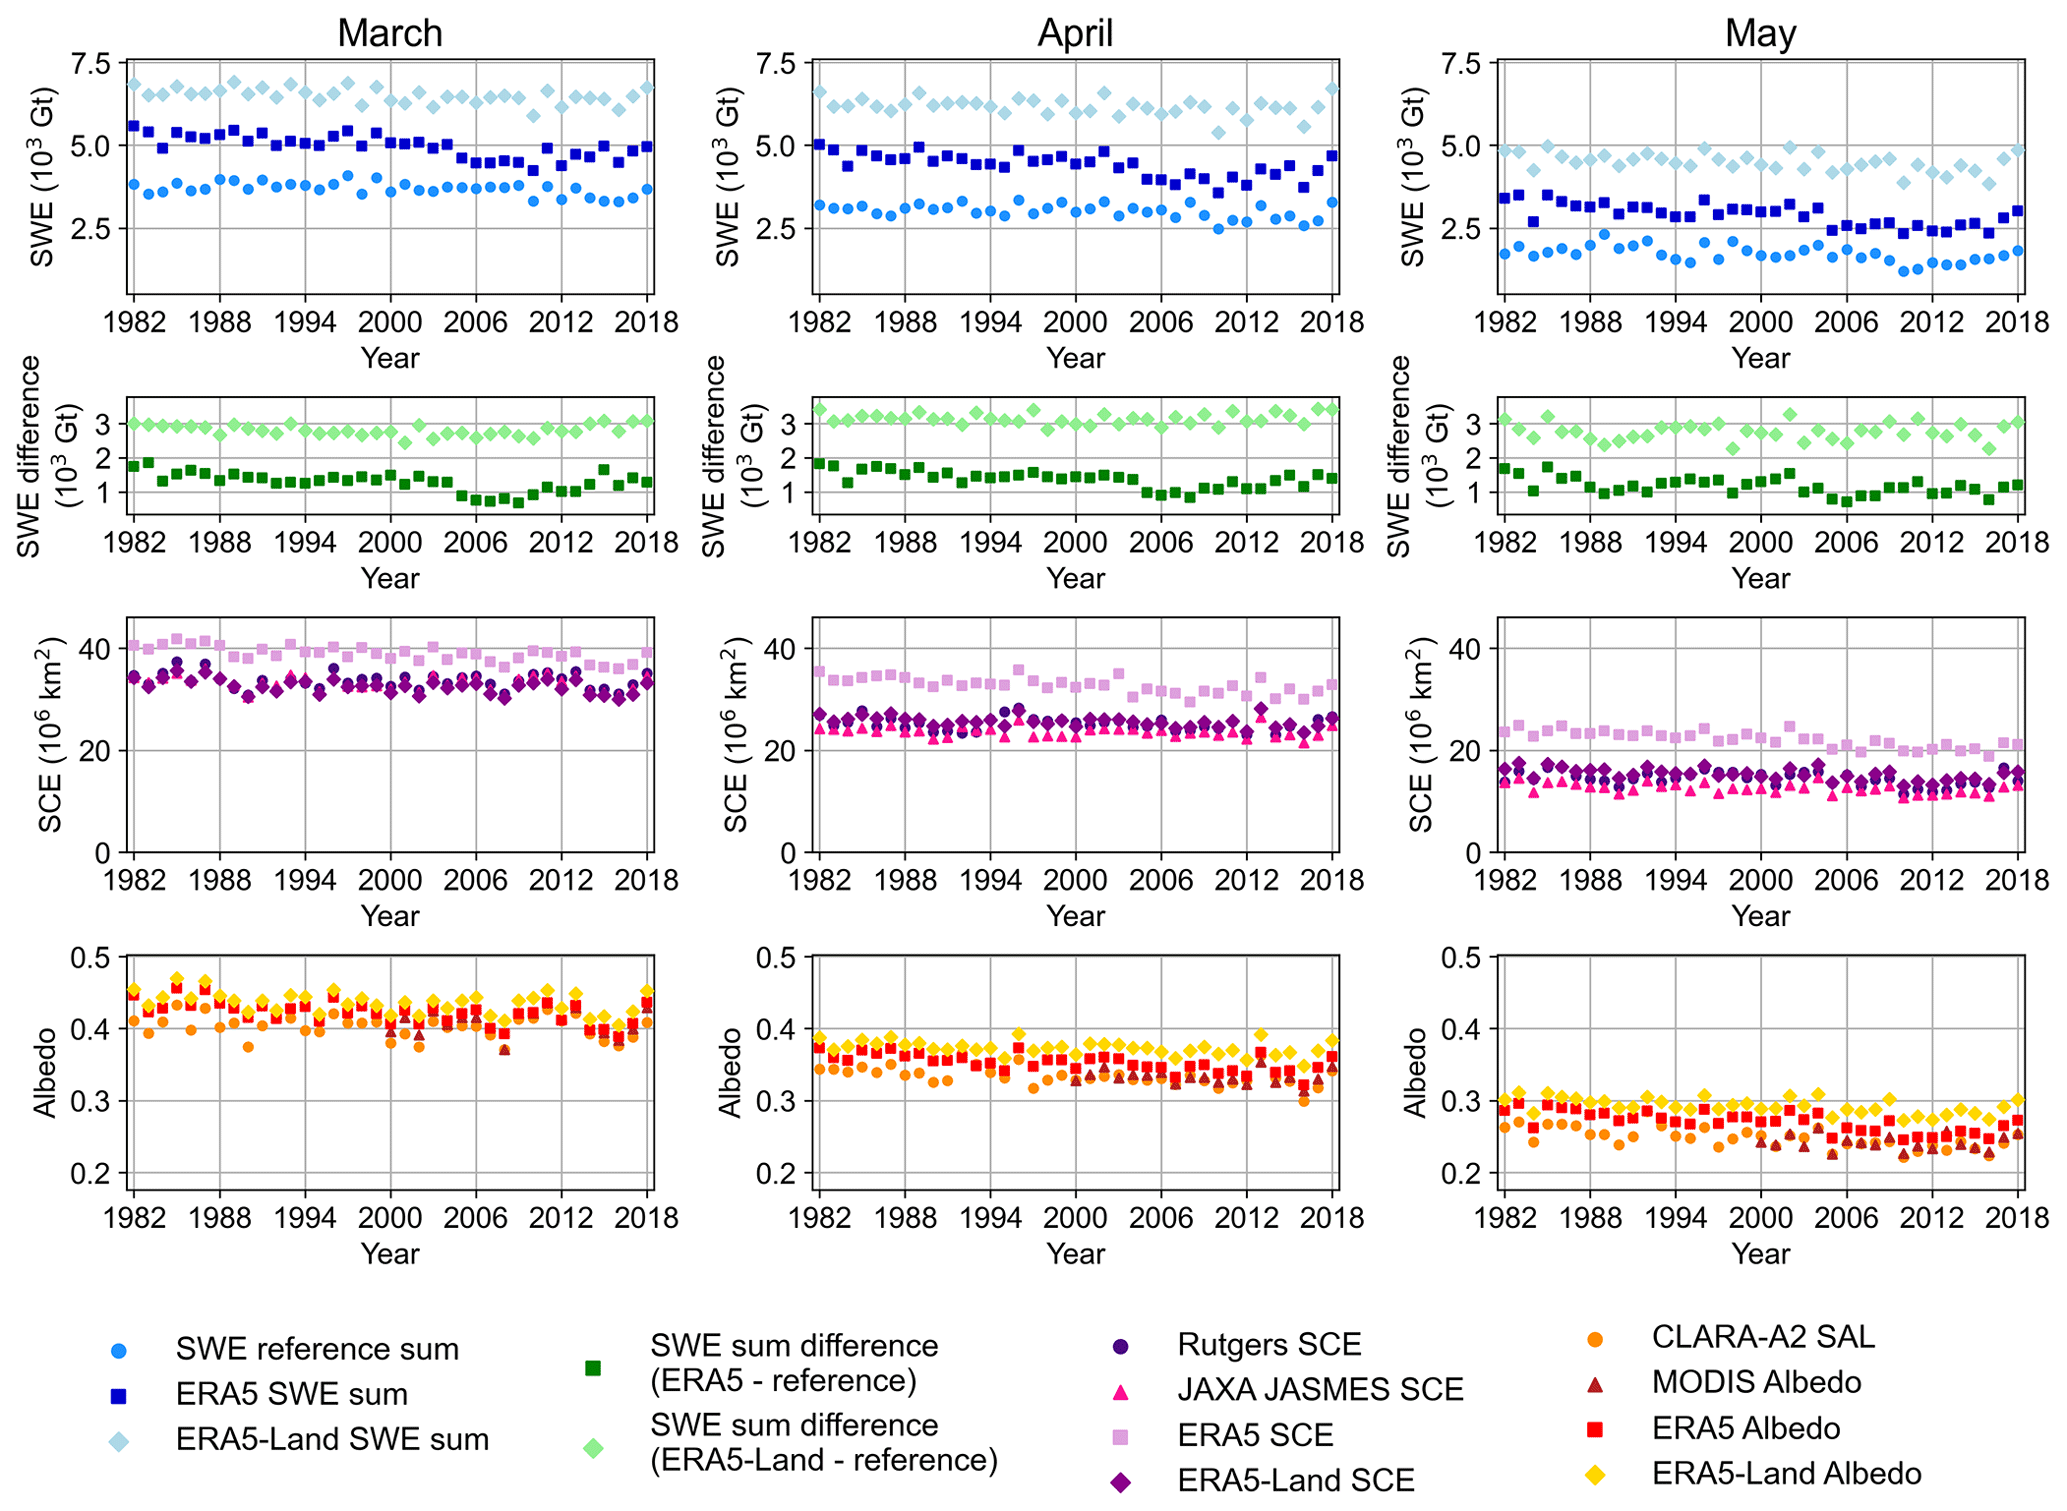
Figure 2Time series in the whole study area in (left) March, (middle) April, and (right) May for SWE sum (top row), difference in SWE sum (second row), SCE (third row), and albedo (bottom row).
The time series for non-mountainous regions are shown in Fig. 3. The SWE values between the datasets are more consistent with each other, indicating that most of the overestimation in SWE occurs in the mountainous regions. ERA5 is especially very well in line with the satellite-based dataset after the year 2004. The drop in difference in SWE (second row, dark-green markers) is even more visible in the non-mountainous regions, which was to be expected as IMS is only assimilated at altitudes below 1500 m. However, the figure also shows that the difference decreases steadily already before 2004, as the number of assimilated observations steadily increases throughout the study period.
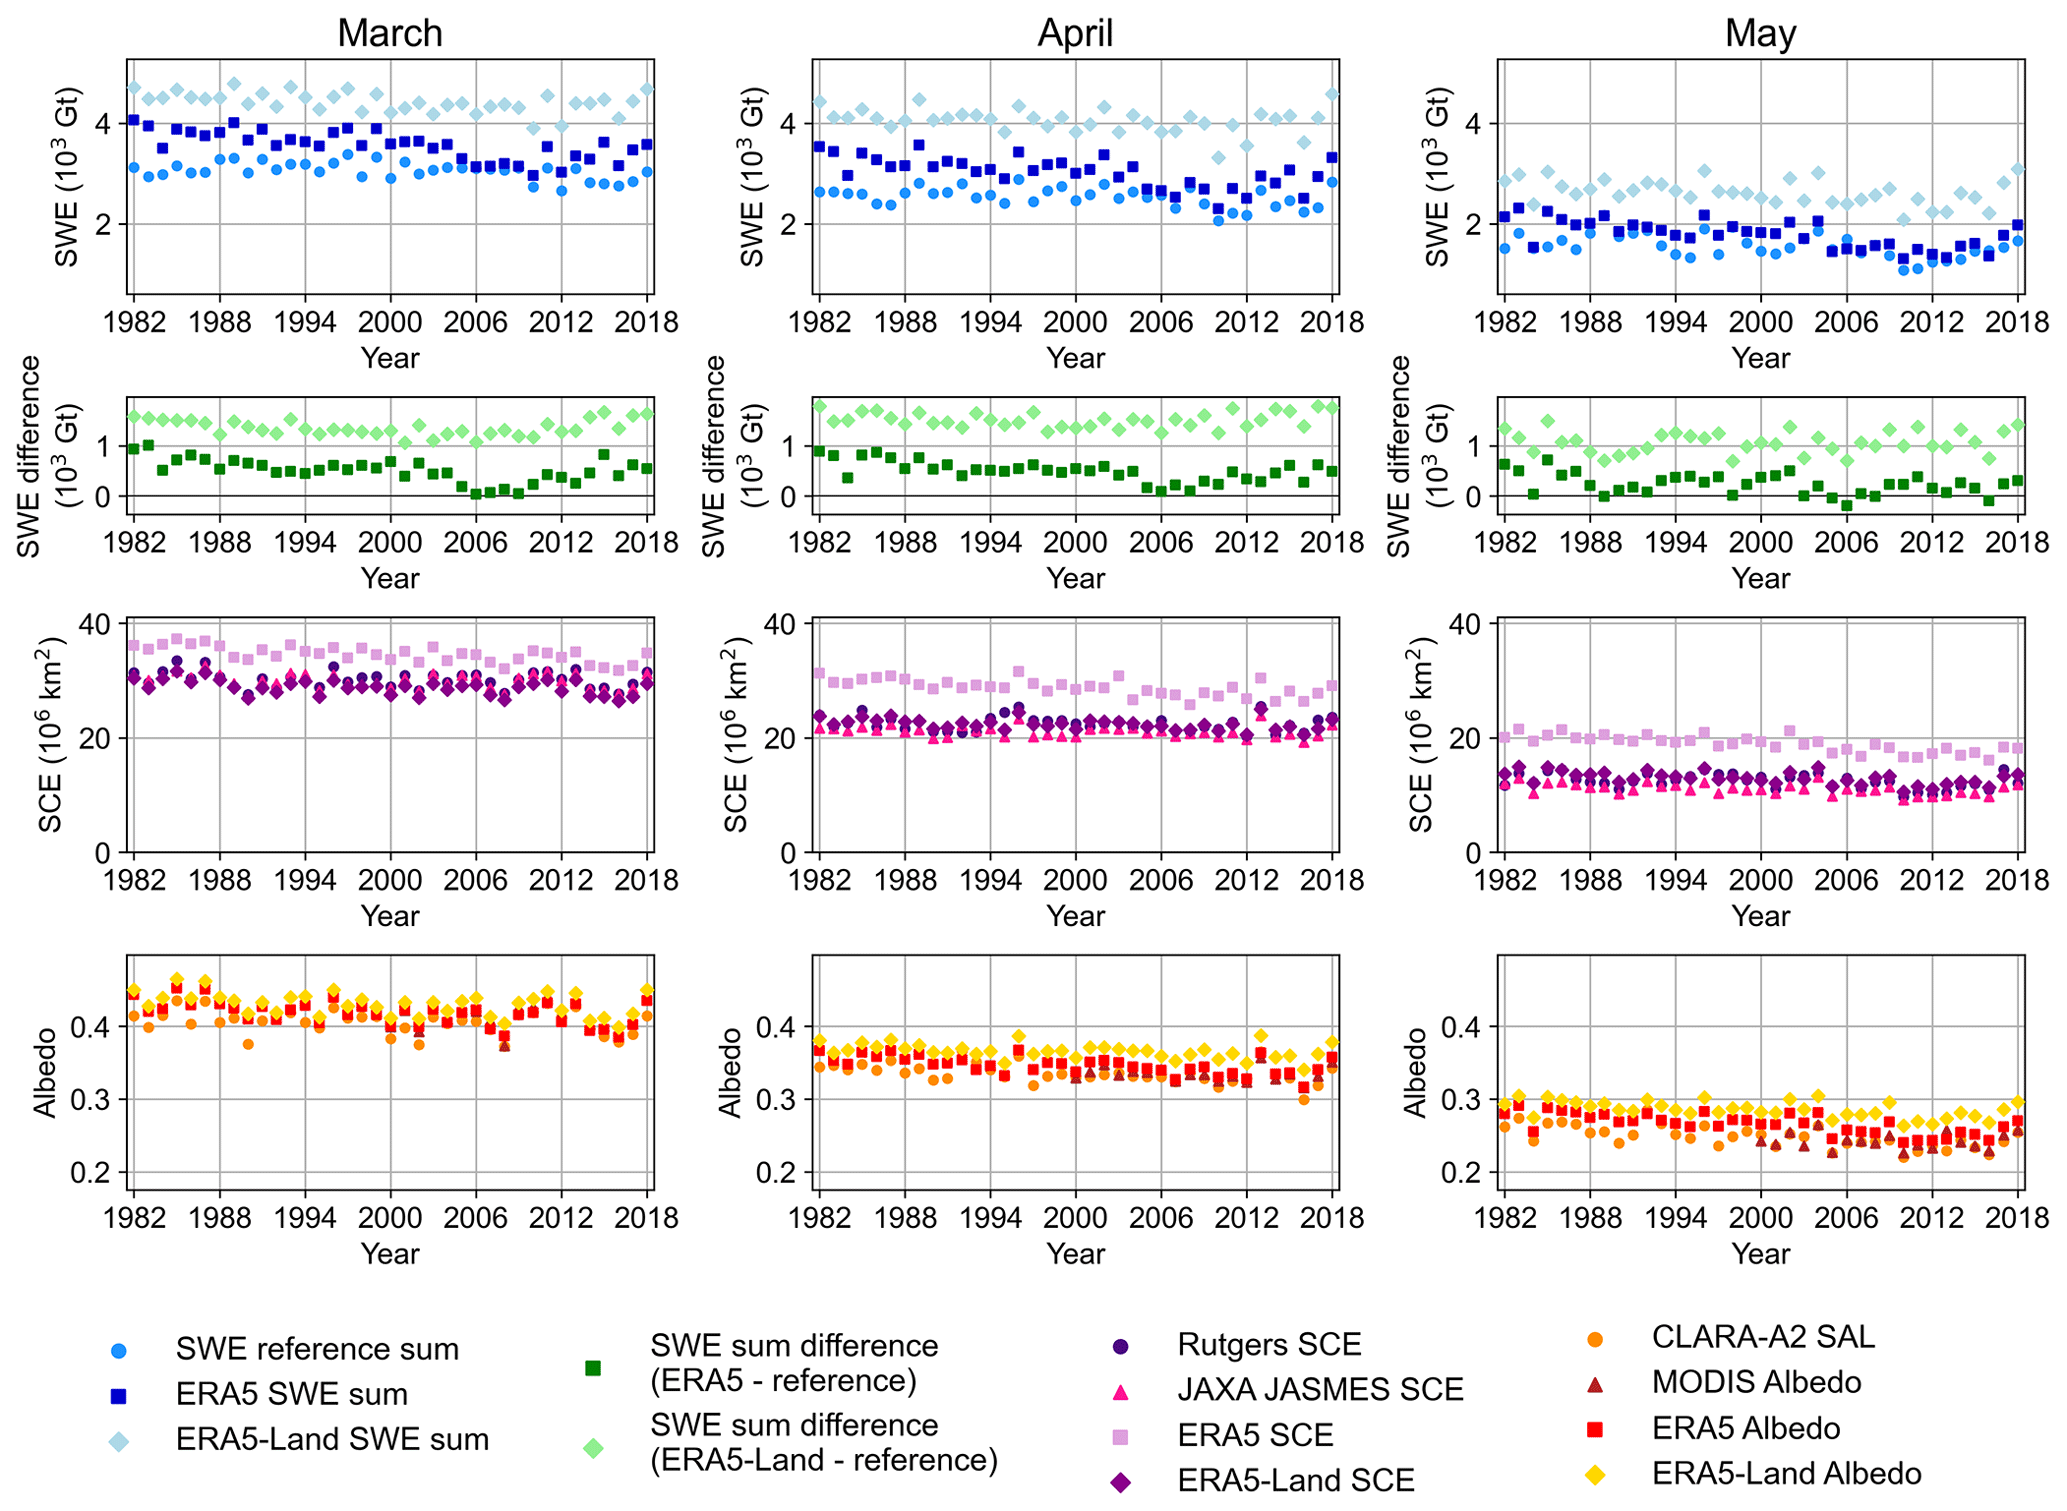
Figure 3Time series in the non-mountainous regions in (left) March, (middle) April, and (right) May for SWE sum (top row), difference in SWE sum (second row), SCE (third row), and albedo (bottom row).
The SCE time series (Fig. 2 third row) show similar values for ERA5-Land, Rutgers, and JAXA JASMES. ERA5, in turn, shows a considerably larger SCE, which is consistent with Fig. 1. The RMSE is also considerably larger for ERA5 (Table S1). There is a slight drop in ERA5 SCE estimates in the year 2004, but it is not visible in the albedo time series. The albedo time series (Fig. 2, bottom row) are more consistent with each other, which was already seen in Fig. 1. There is a slight overestimation in albedo in both ERA5 and ERA5-Land compared to CLARA-A2 SAL and MODIS data, but the overestimation is not as prominent as in SWE. Even though ERA5 and ERA5-Land slightly overestimate albedo, both are able to capture the annual variability quite well. The RMSE is slightly smaller for ERA5 than for ERA5-Land (Table S1). Also, the time series of SCE for the non-mountainous regions (Fig. 3) are quite similar to Fig. 2: ERA5 overestimates SCE, and a slight drop is visible around the year 2004. Overall, albedo and SCE for the non-mountainous regions (Fig. 3) do not differ much from Fig. 2, which is most likely due to the fact that even though mountain areas store a considerable portion of snow mass (Kim et al., 2021), they only represent a small fraction of the whole study area. Therefore, they have a limited effect on SCE and albedo.
Figure 4 summarizes the decadal trends and the 95 % confidence intervals of the trends for each of the datasets. ERA5 shows negative SWE trends in every month (ranging from −249 to −236 Gt per decade ). The trends in ERA5-Land and the SWE reference data are also negative but not as prominent (ranging from −124 to −77 Gt per decade), which means that ERA5 shows a decreasing trend 2 or even 3 times larger than ERA5-Land and the SWE reference data. Overall, the trends in ERA5-Land and SWE reference data are more consistent with each other, compared to ERA5. In March, the difference between the trends in ERA5 and SWE reference exceeds the uncertainty range marked in the figure with error bars. All datasets show statistically significant negative trends in March and May. In April, ERA5 and SWE reference data show statistically significant negative trends.
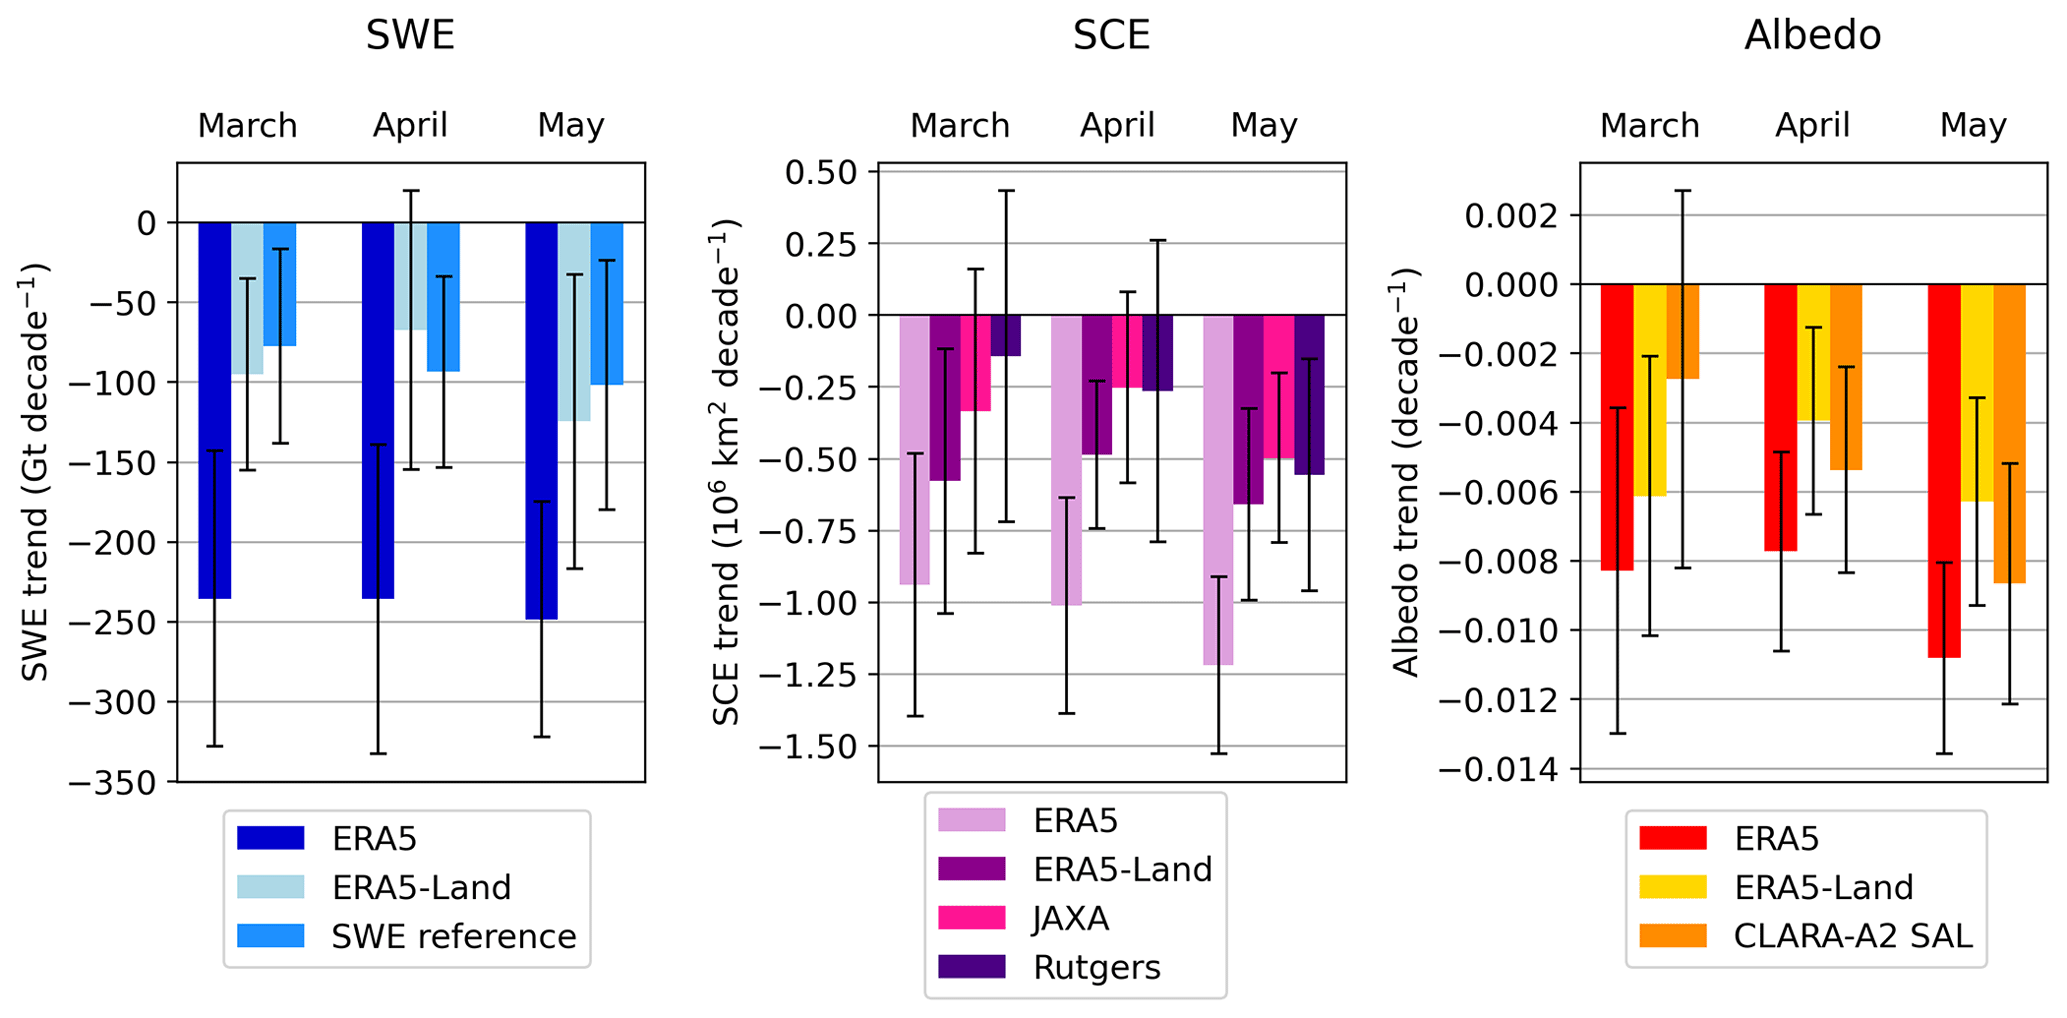
Figure 4Trends in the Northern Hemisphere in 1982–2018. The error bars represent the 95 % confidence intervals.
The trends in SCE show large variability between the datasets. In March and April, both ERA5 and ERA5-Land show statistically significant negative trends, whereas the satellite-based JAXA JASMES and Rutgers indicate that there is not a statistically significant trend. In May, all the datasets show statistically significant negative trends, but the negative trend detected by ERA5 ( km2 per decade) is about twice as large as the trends detected by other datasets (ranging from −0.66 to km2 per decade). Similar to SWE, ERA5 shows the most prominent SCE trends in each month.
The trends in albedo are more consistent between all the datasets. In March, CLARA-A2 SAL indicates that there is no statistically significant trend, contrary to ERA5 and ERA5-Land. In April and May, all three datasets show statistically significant trends, and the negative trends are strongest in May, when they vary from −0.011 to −0.006 per decade. Consistent with SWE and SCE, ERA5 shows more prominent trends each month than ERA5-Land and CLARA-A2 SAL.
The trends between SCE and albedo are consistent with each other in all the datasets. The trends become more prominent in both variables when spring advances, and, simultaneously, the uncertainties decrease. Climate warming affects the snow cover in late spring and summer the most, while the changes in snow cover in late winter and early spring are minor (Derksen and Brown, 2012; Mudryk et al., 2017). This also affects the uncertainties, as the wide uncertainty range in March decreases towards April and May. ERA5 also shows consistent trends in SCE and albedo, even though the values themselves (Figs. 1 and S2) showed notable discrepancies.
3.2 Time series and trends in North America and Eurasia
Figures 5 and 6 show the time series of SWE sum, SCE, and albedo in North America and Eurasia. In North America, ERA5 and ERA5-Land show considerably larger values than the SWE reference data (Fig. 5, top row). The magnitude of the SWE difference stays about the same throughout the spring season, which is consistent with Fig. 2. A drop in the difference between ERA5 and the SWE reference data can also be observed in North America. In Eurasia (Fig. 6, top row), ERA5-Land overestimates SWE considerably, whereas ERA5 is better in line with the SWE reference data. There is a clear difference between ERA5 and SWE reference data at the beginning of the study period, but the difference decreases throughout the study period, and after the year 2004, the difference drops close to zero.
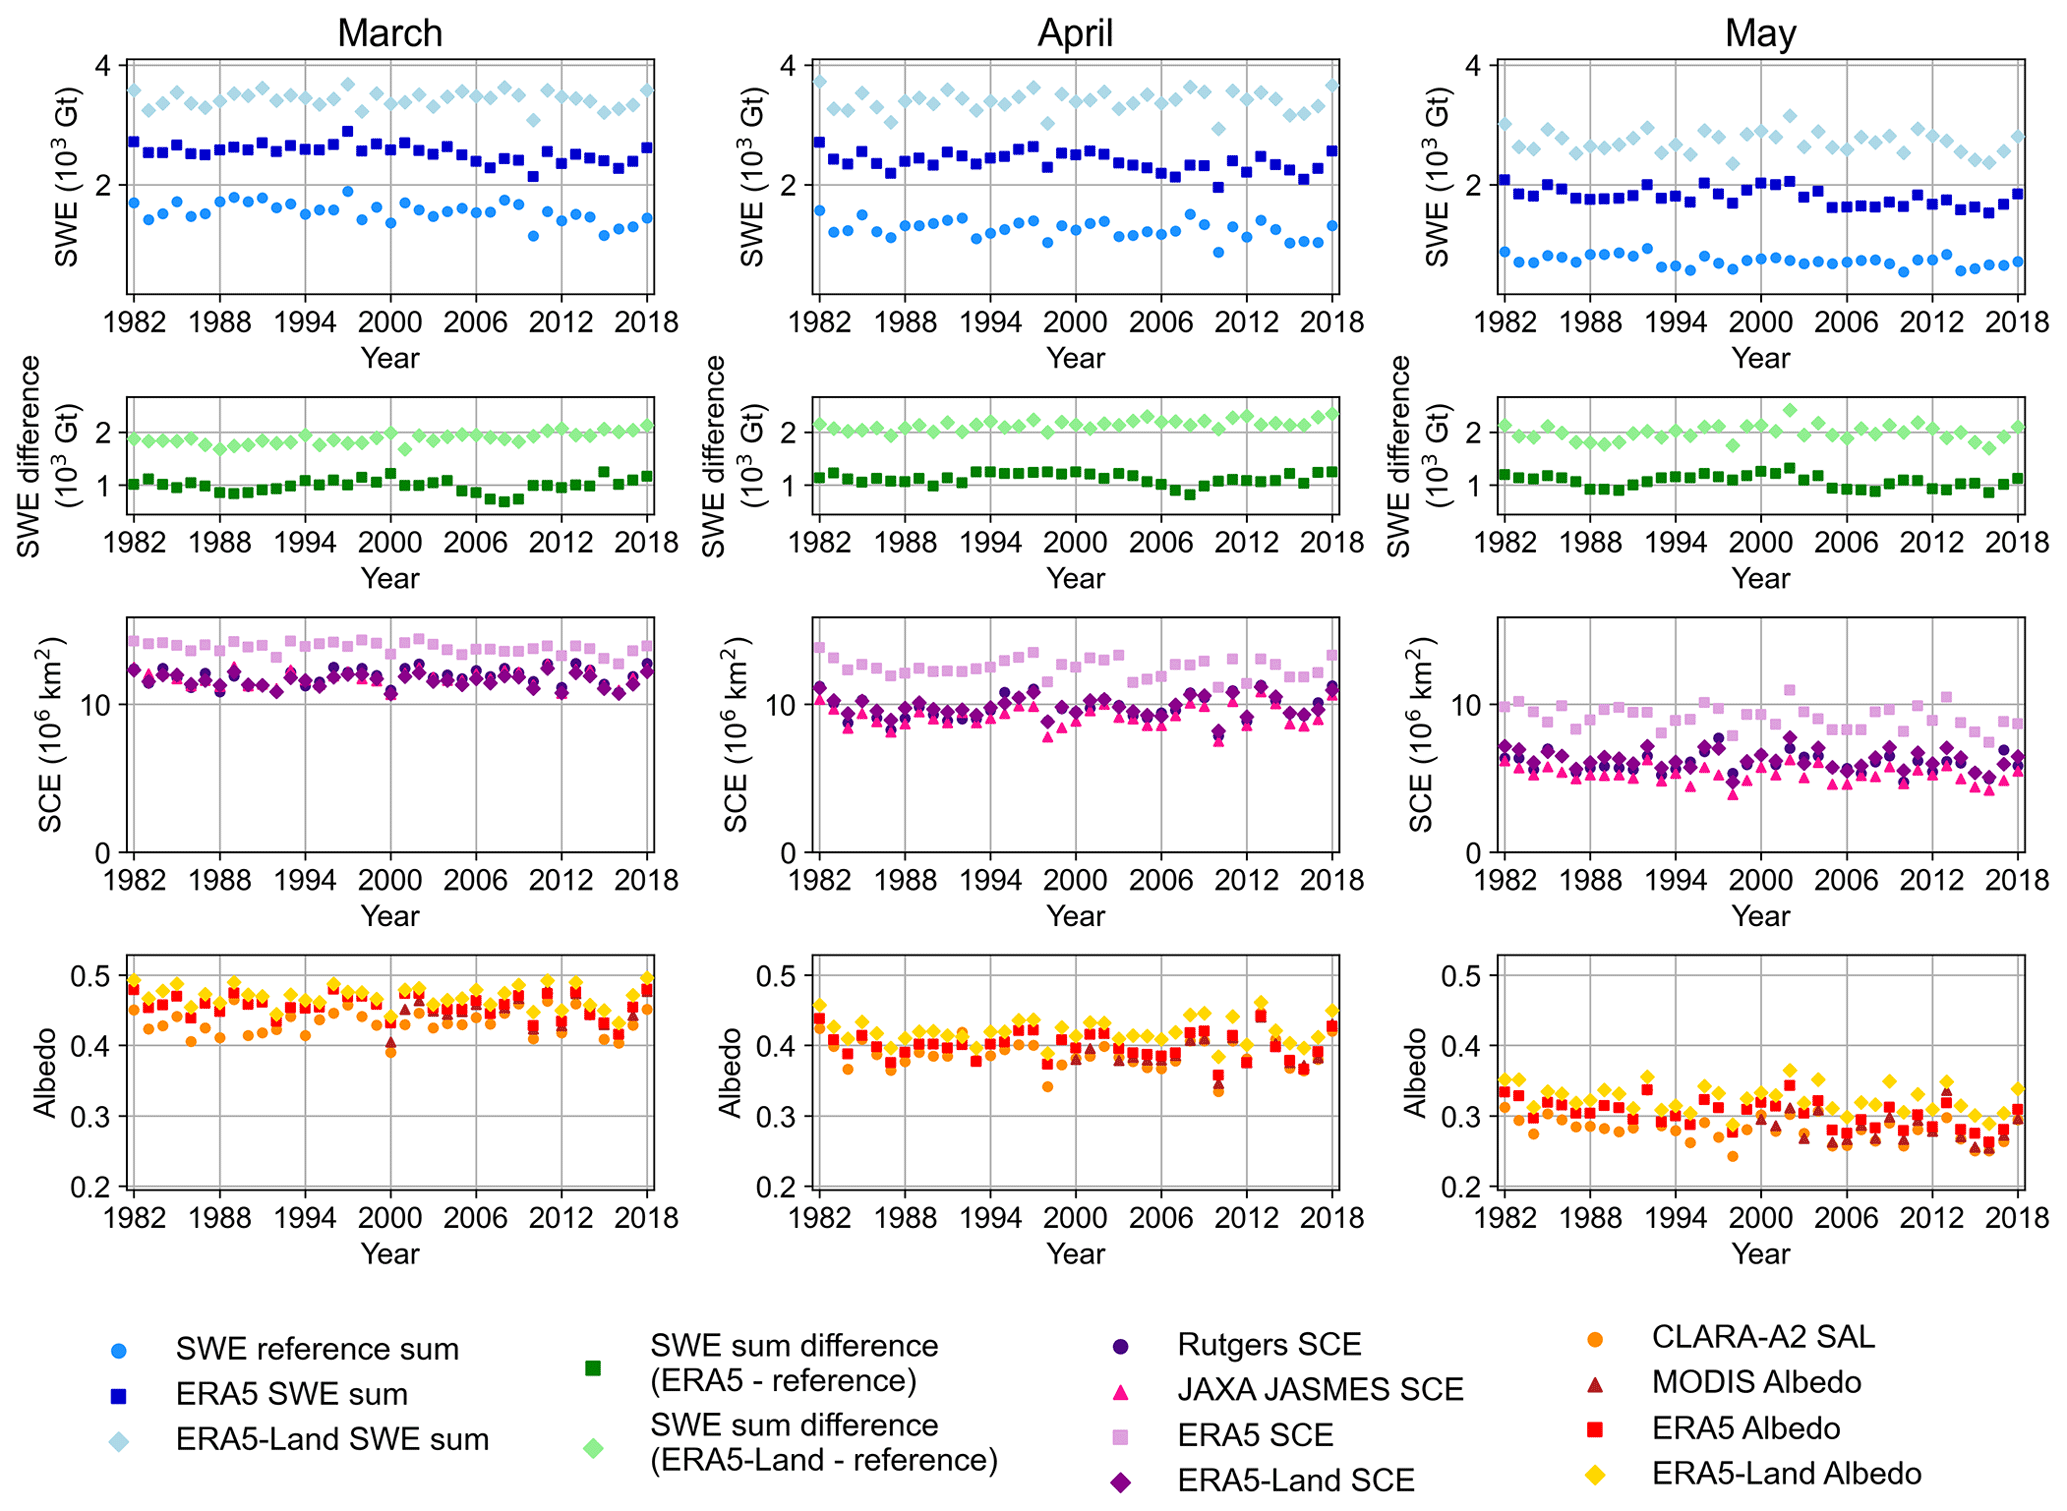
Figure 5Time series in North America in (left) March, (middle) April, and (right) May for SWE sum (top row), the difference in SWE sum (second row), SCE (third row), and albedo (bottom row).
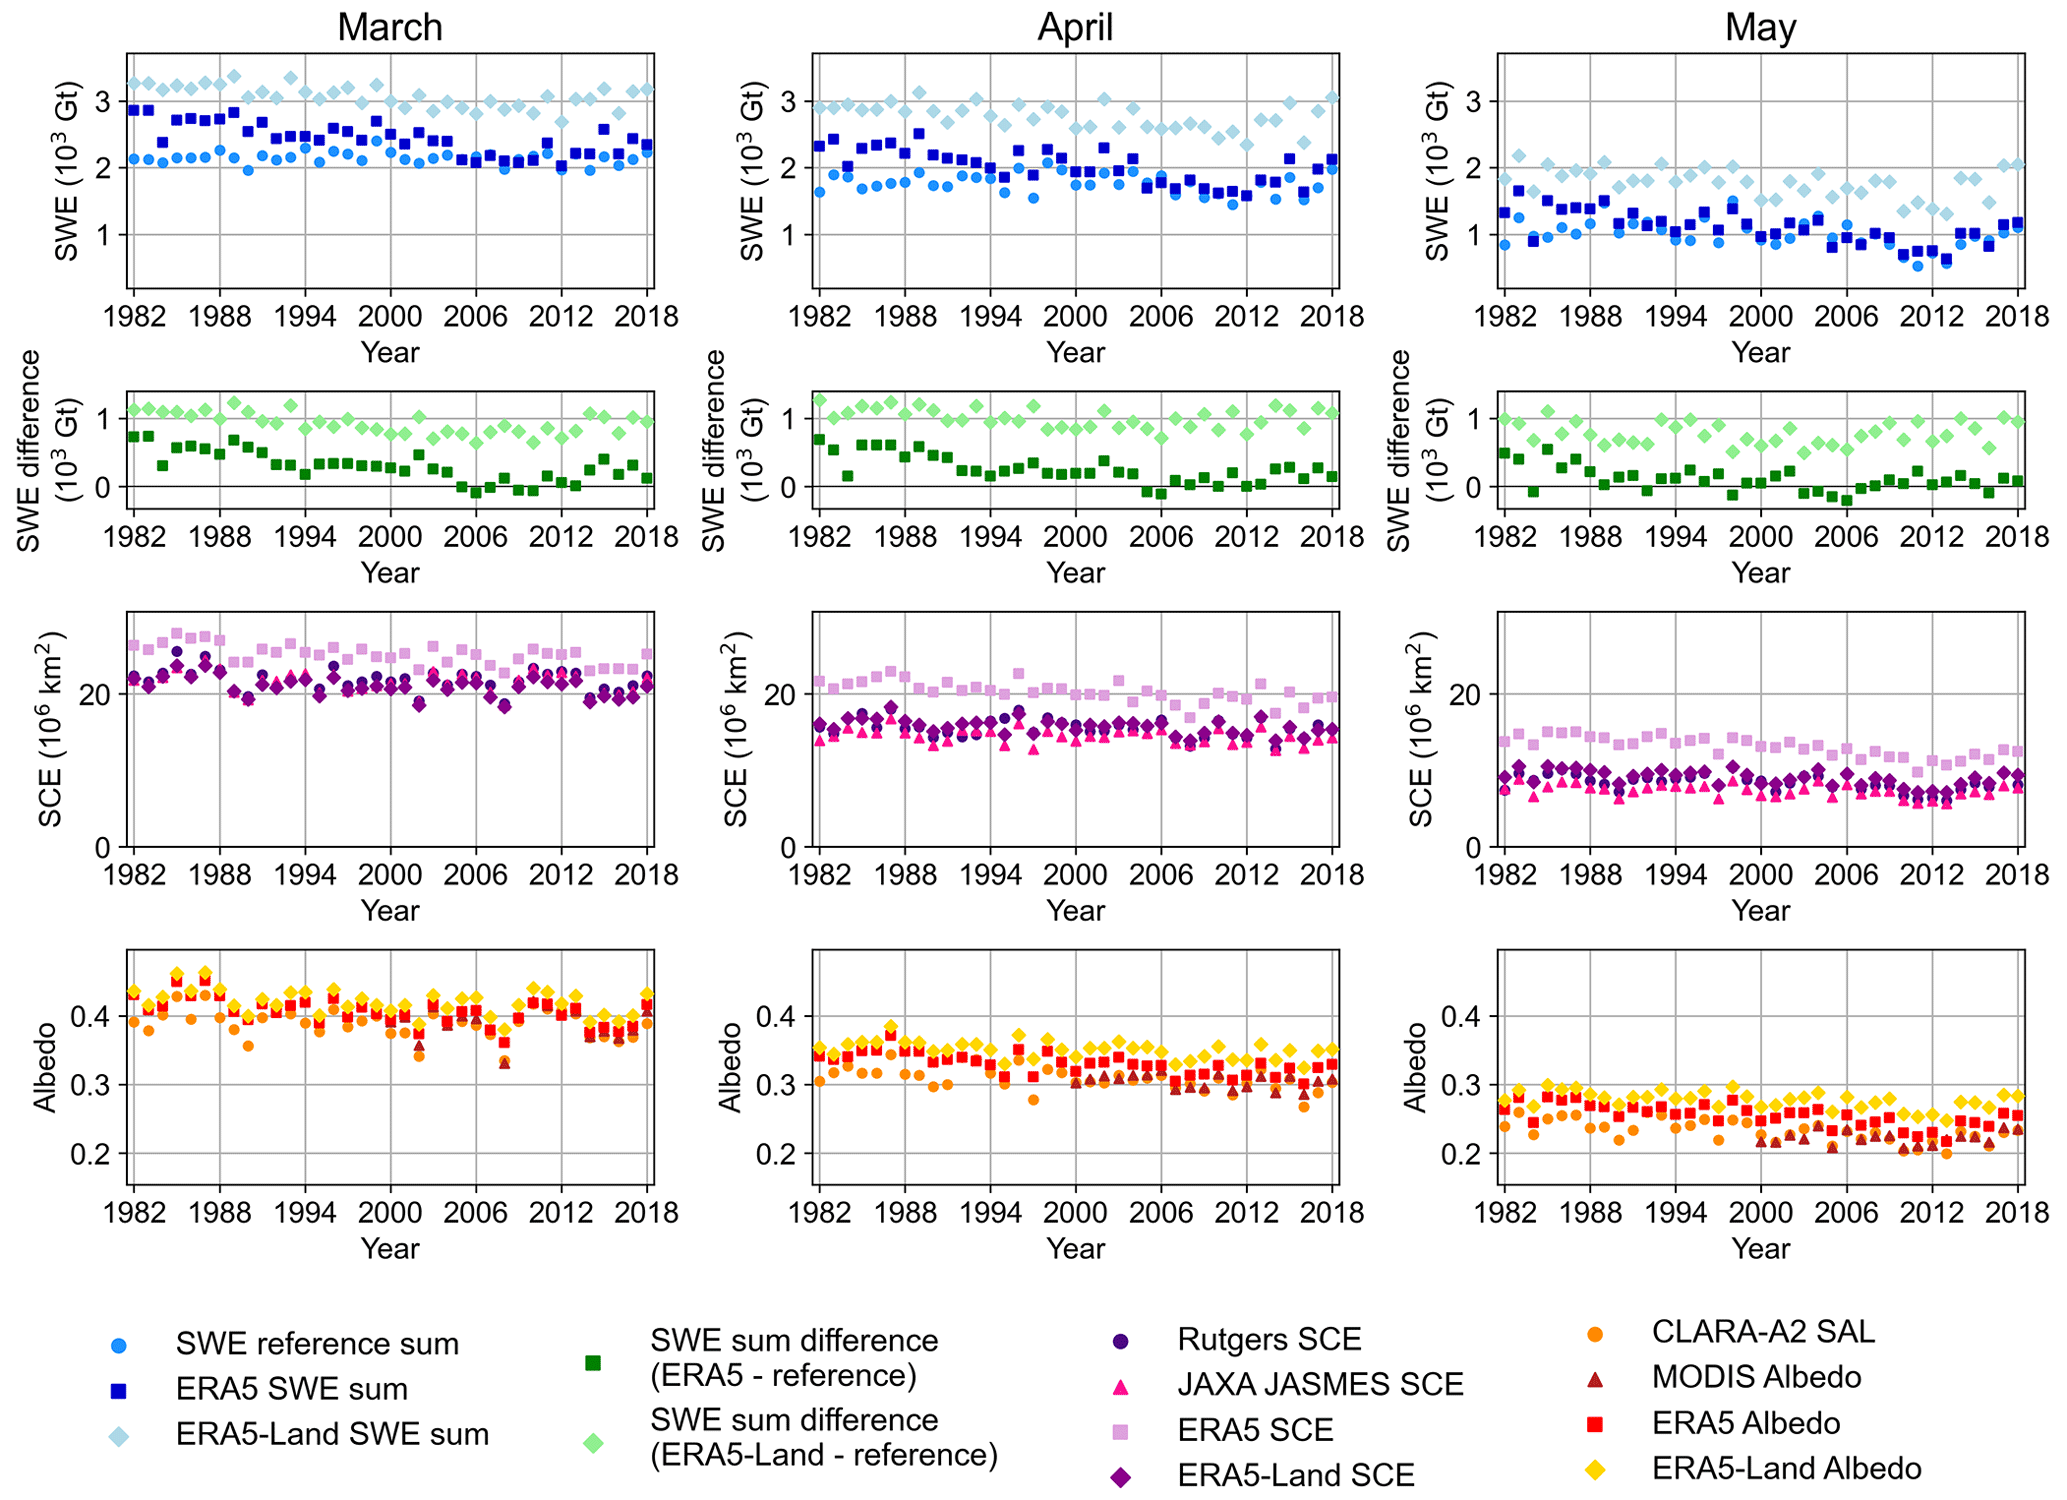
Figure 6Time series in Eurasia in (left) March, (middle) April, and (right) May for SWE sum (top row), the difference in SWE sum (second row), SCE (third row), and albedo (bottom row).
The SCE and albedo time series in North America and Eurasia (Figs. 5 and 6) show similar features to the time series in the entire study area (Fig. 2). ERA5 and ERA5-Land show a slight overestimation in albedo, and ERA5 overestimates SCE in both North America and Eurasia.
Figures 7 and 8 summarize the decadal trends and the 95 % confidence intervals in North America and Eurasia. In North America (Fig. 7), ERA5 shows statistically significant negative trends in SWE every month (ranging from −70 to −57 Gt per decade), whereas ERA5-Land indicates that there is no trend at all. The SWE reference data, in turn, show negative trends in March (−77 Gt per decade) and May (−41 Gt per decade). SCE also shows no trends, except ERA5 in March ( km2 per decade) and May ( km2 per decade). All the albedo datasets indicate that there is no trend in March or April, whereas in May, all the datasets show statistically significant negative trends (ranging from −0.009 to −0.006 per decade).
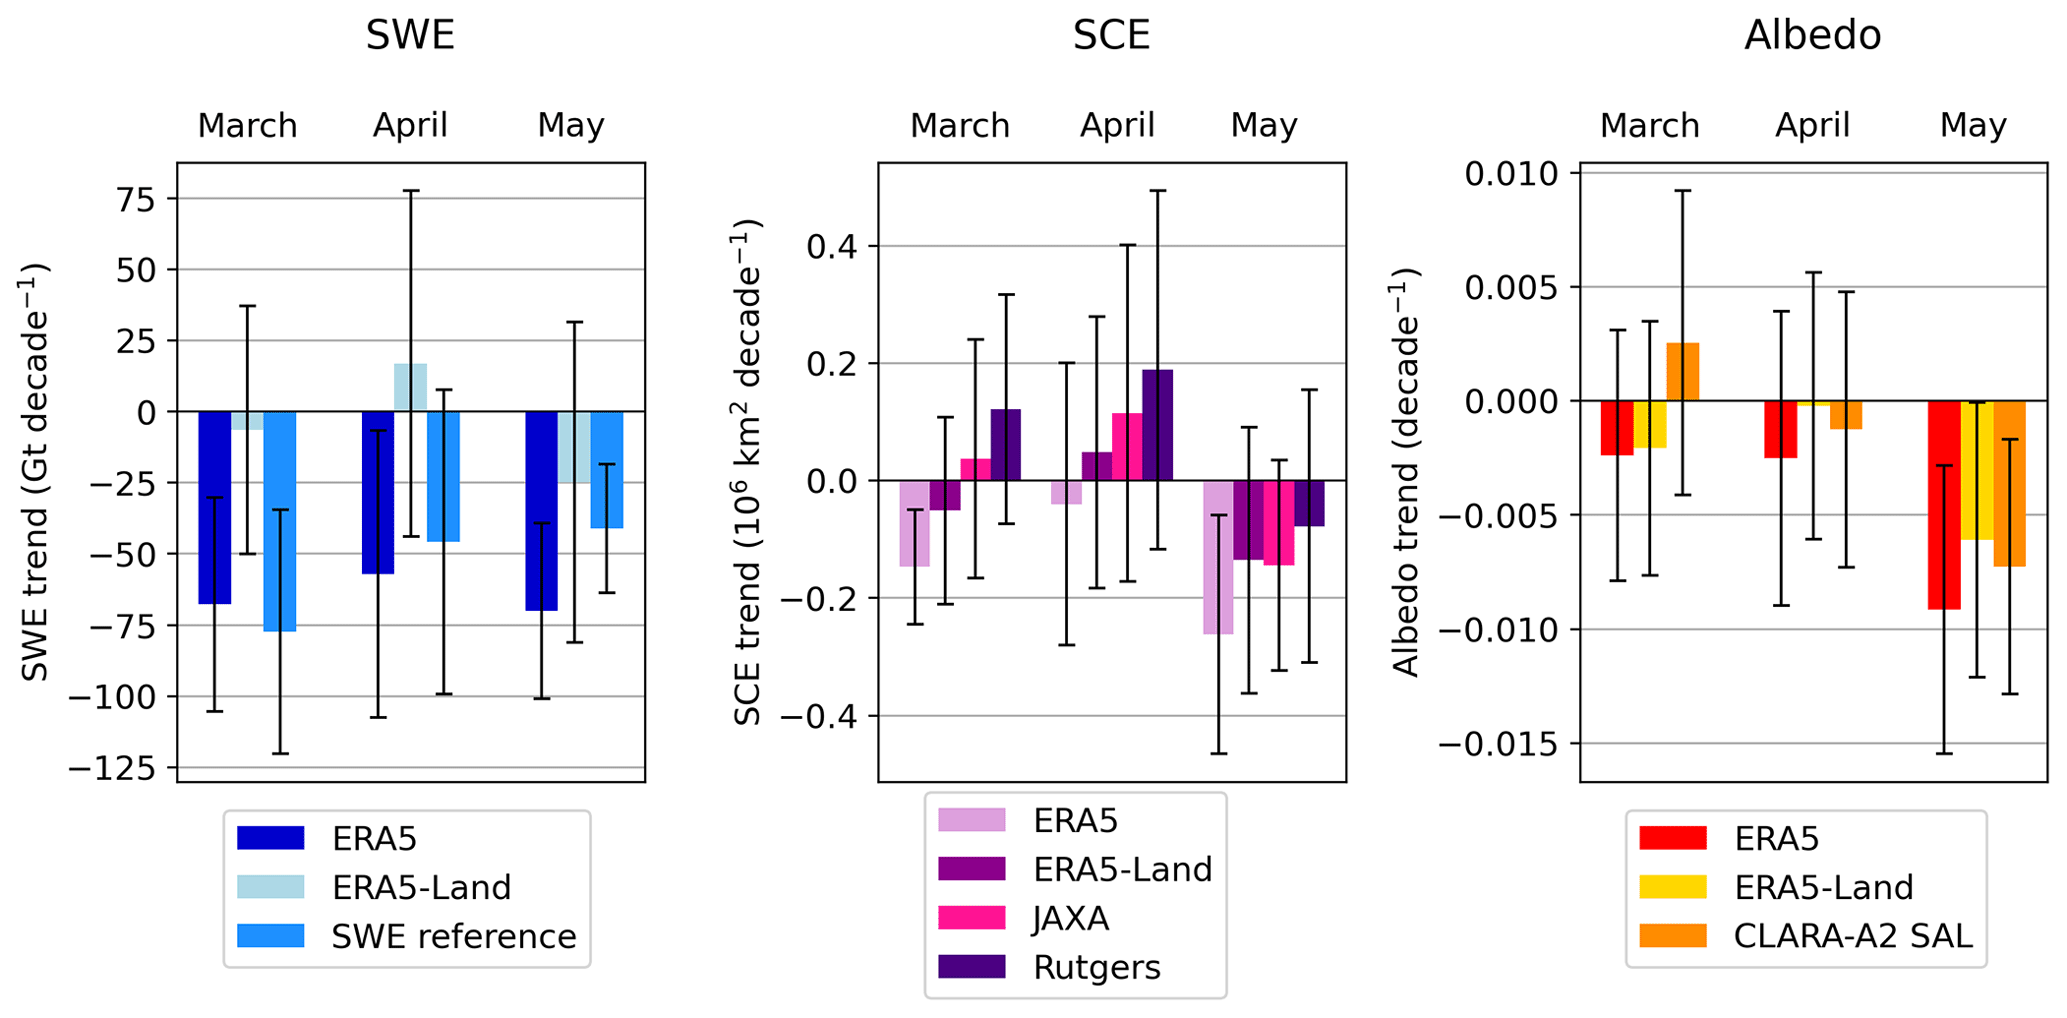
Figure 7Trends in North America in 1982–2018. The error bars represent the 95 % confidence intervals.
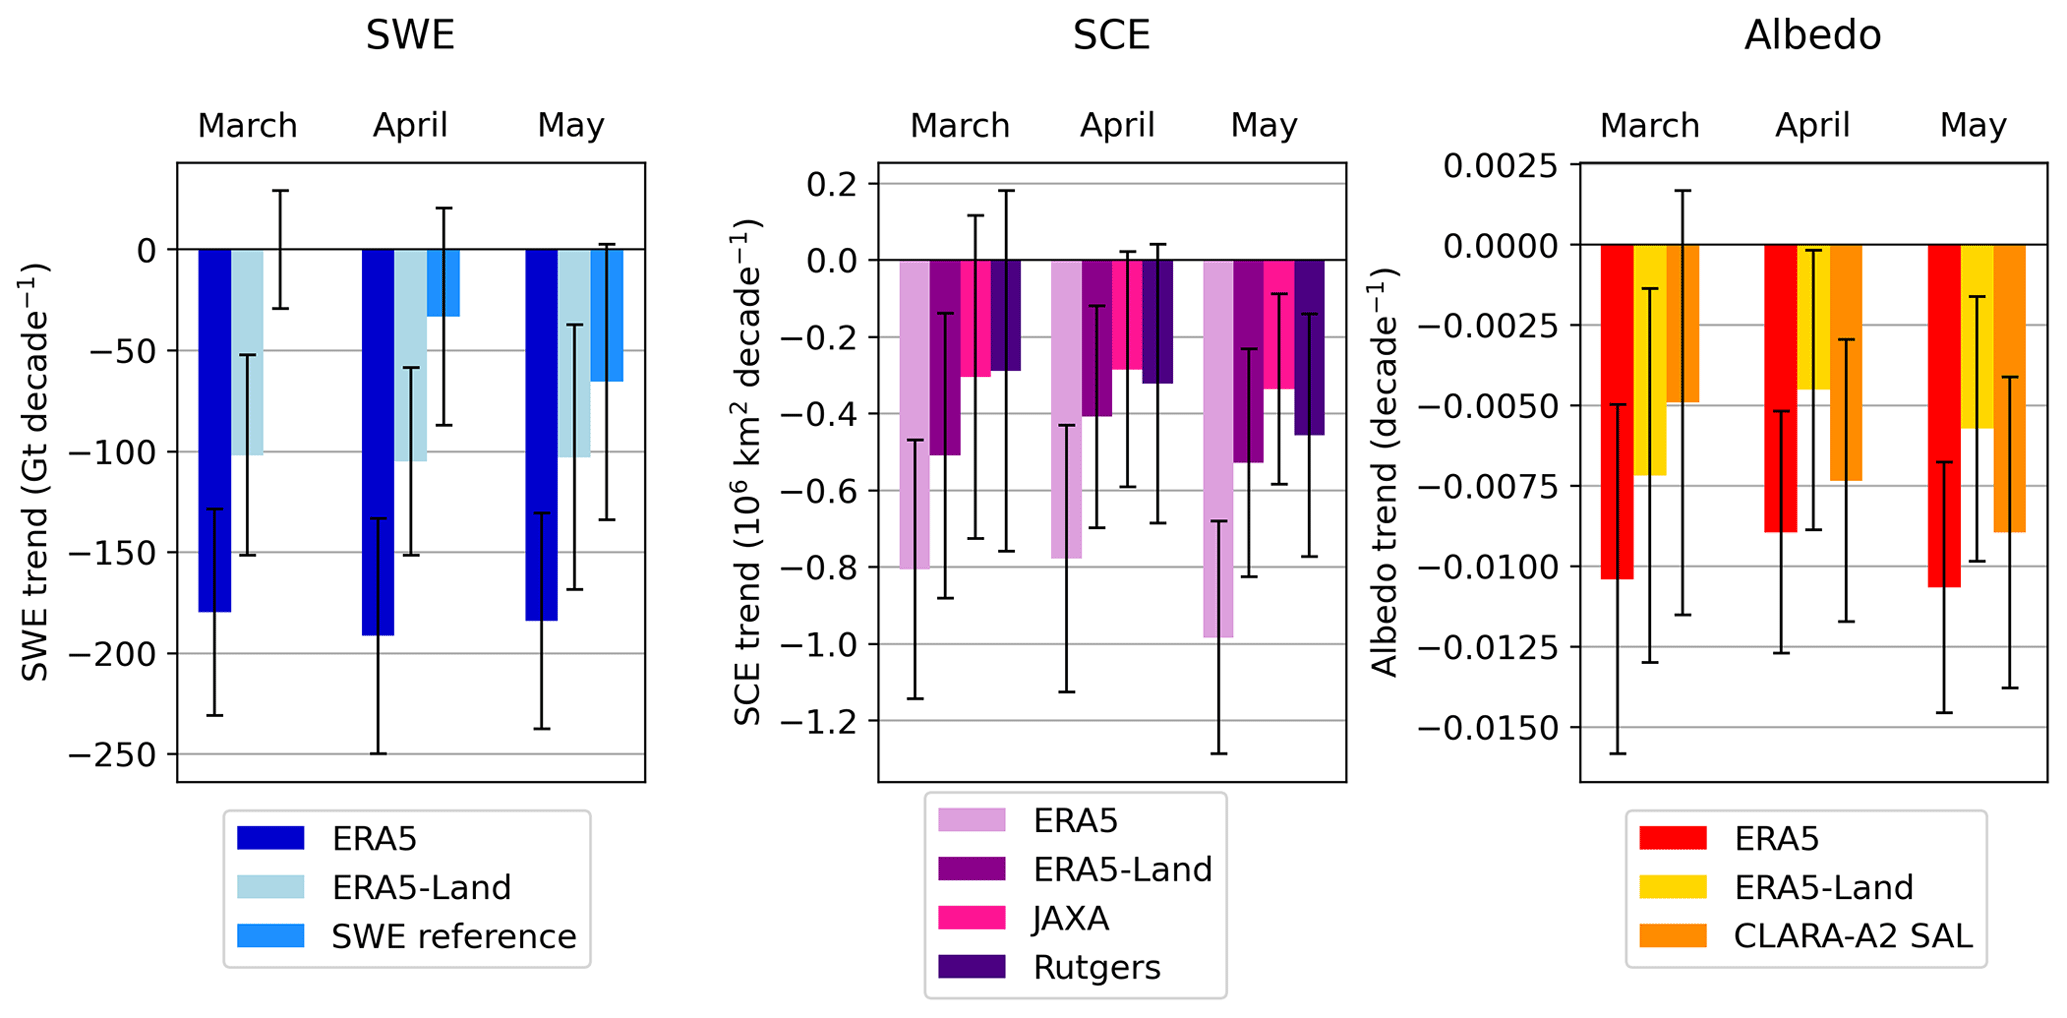
Figure 8Trends in Eurasia in 1982–2018. The error bars represent the 95 % confidence intervals.
In Eurasia (Fig. 8), both ERA5 and ERA5-Land indicate a statistically significant negative trend every month, whereas the SWE reference data detect no trend at all, which is consistent with previous studies (Pulliainen et al., 2020). For ERA5, the SWE trend ranges from −191 to −180 Gt per decade and for ERA5-Land from −105 to −102 Gt per decade. Especially in March, the trend is very close to zero according to the SWE reference data and becomes more prominent towards May, when the trend is −65 Gt per decade. There is a considerable difference in trends between ERA5, ERA5-Land, and the SWE reference data, which cannot be explained even with the uncertainties. The trends in albedo and SCE look similar to the ones detected in the whole study area (Fig. 4). ERA5 and ERA5-Land show statistically significant SCE trends every month, whereas JAXA JASMES and Rutgers only detect negative trends in May. The negative SCE trends detected by ERA5 (ranging from −0.78 to km2 per decade) are about twice as large as the trends detected by other datasets (ranging from −0.53 to km2 per decade). In March, CLARA-A2 SAL indicates that there is not a statistically significant trend, but in April and May, all three datasets show statistically significant negative trends (ranging from −0.005 to 0.011 per decade). Trends in both albedo and SCE intensify as spring progresses, which was also evident in the whole study area (Fig. 3). Overall, the trends are more prominent in Eurasia than in North America.
3.3 Spatial trends in SWE and albedo
The trends in SWE for the period 1982–2018 show large spatial variability between the datasets (Fig. 9, top row). The trends in April and May are shown in the Supplement (Figs. S3–S4). ERA5 detects mostly negative trends in the whole study region in March. ERA5-Land, in turn, shows negative trends on the western side of Eurasia and very weak trends in North America and eastern Eurasia. The SWE reference data detect negative trends in the northern part of North America but show large variability in trends in Eurasia. All datasets indicate a positive trend in Lapland. The trends in March in albedo (Fig. 8, bottom row) are more consistent between the datasets. There is a large area in the southwestern part of Eurasia with a clear negative trend related to the loss of low-latitude seasonal snow cover in every dataset. A positive trend is visible in Canada; however, the size of the area shows some variability between the datasets. Also, CLARA-A2 SAL detects a positive trend in southeastern Eurasia, which is not visible in ERA5 or ERA5-Land.
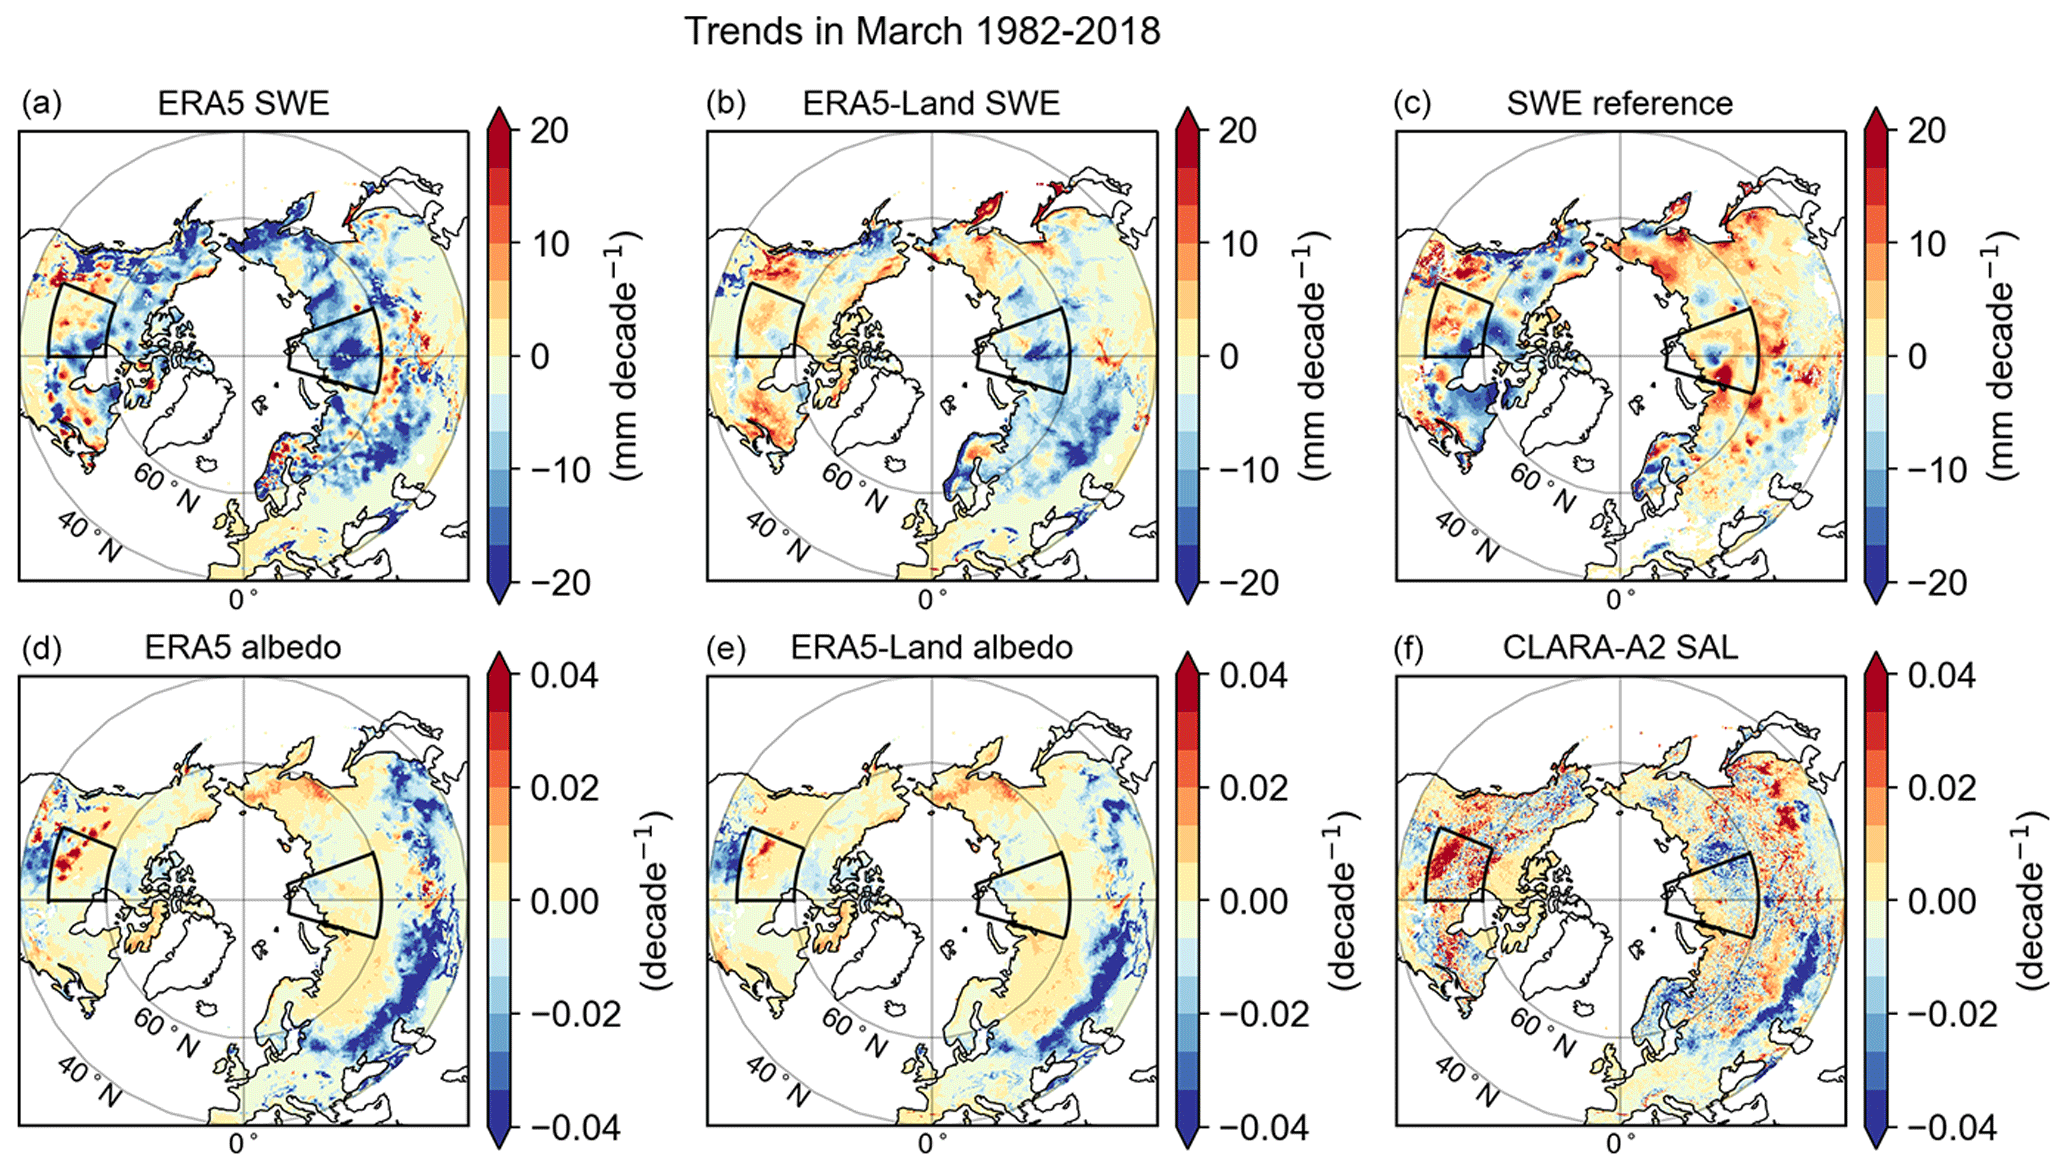
Figure 9(a, b, c) SWE trends in March 1982–2018. (d, e, f) Albedo trends in March 1982–2018.
We additionally studied the trends for the period 2000–2018, as MODIS data are only available from the year 2000 onwards. The SWE trends for the period 2000–2018 (Fig. 10, top row) are more consistent with each other, which is most likely due to adding the IMS information to ERA5, which improves SWE estimates after 2004. The trends in April and May are shown in the Supplement (Figs. S5–S6). Overall, the trends are more prominent in 2000–2018 than in 1982–2018. All datasets detect negative trends in northeastern Canada, the west coast of North America, and western Eurasia in March. Positive trends, in turn, are shown over a large area in Canada, Scandinavia, and many areas in Siberia. The positive trend in Canada is consistent with other studies, and it is associated with cooling in the spring season (Mudryk et al., 2018). The positive trend is very strong in Scandinavia, and it is detected by all the datasets. We additionally analyzed in situ snow depth measurements across Lapland (Fig. S7) to investigate whether the positive trend is also visible in in situ measurements. For the period 1982–2018, the trend based on in situ measurements is negligible, but for 2000–2018, there is a statistically significant positive trend (9.3 cm per decade in March), which is consistent with Figs. 9 and 10.
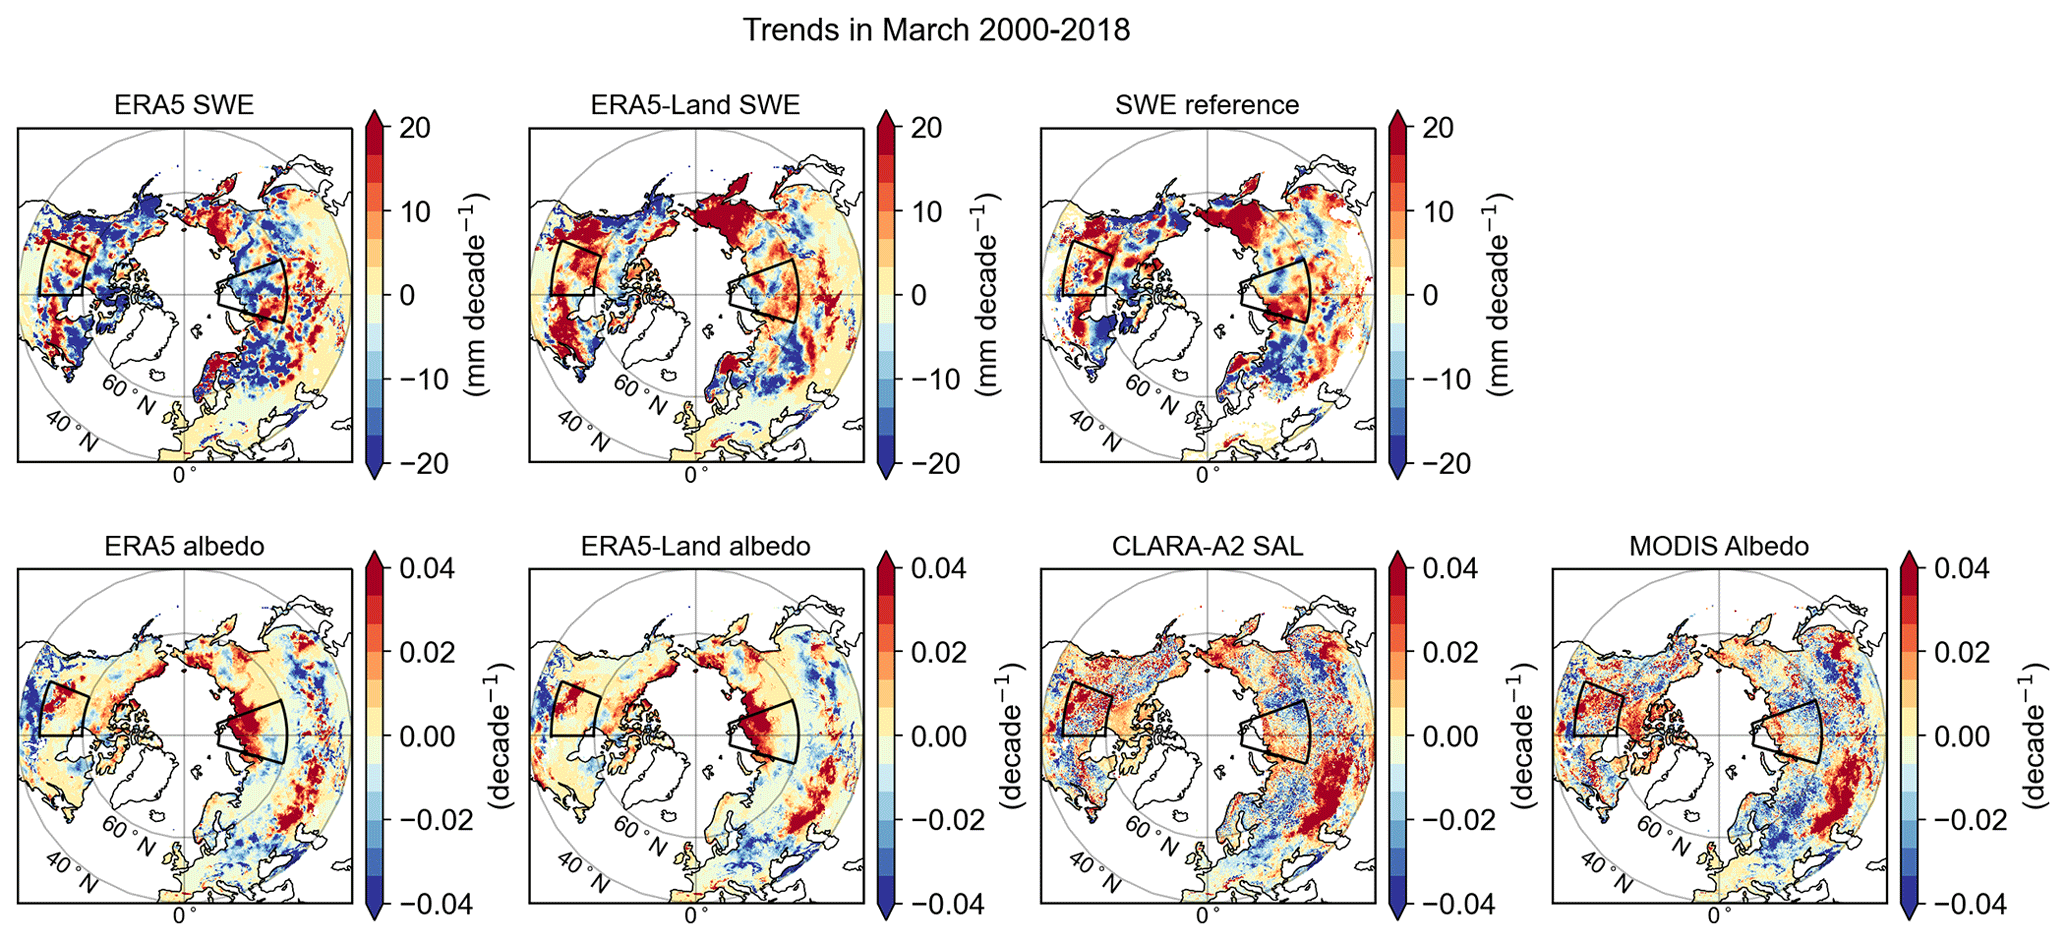
Figure 10(Top row) SWE trends in March 2000–2018, (bottom row) albedo trends in March 2000–2018.
MODIS and CLARA-A2 SAL are consistent with each other, whereas ERA5 and ERA5-Land show some discrepancies in albedo trends. All datasets show a strong positive trend in albedo in Central Asia (Fig. 9, bottom row), which is associated with an increase in snow cover over that area (Li et al., 2018). The albedo over Central Asia has also been observed to increase in summer due to deforestation (Li et al., 2018). Albedo has also been increasing over Canada, which is consistent with the positive SWE trend. Also, a negative trend is detected over Europe and western parts of Russia, where SWE has also been decreasing. Both ERA5 and ERA5-Land show a strong positive trend in northern Siberia, which is not as prominent in MODIS or CLARA-A2 SAL products. Also, MODIS and CLARA-A2 SAL show a negative trend in central Siberia, which is not visible in ERA5 or ERA5-Land.
3.4 Regional trends
We additionally studied time series in smaller areas in western Siberia and the Canadian Prairies (areas marked in Figs. 9 and 10). We chose these areas because the trends in 1982–2018 show large differences between datasets but are more consistent in 2000–2018. In Siberia, both ERA5 and ERA5-Land overestimate SWE at the beginning of the study period (Fig. 11, first and second row). The difference in SWE sum decreases throughout the study period, and there is a clear drop in the difference between ERA5 and the SWE reference data in the year 2004. After 2004, the difference is close to zero, with some annual variability. ERA5-Land does not show a clear improvement in 2004, but the difference is more stable throughout the study period.
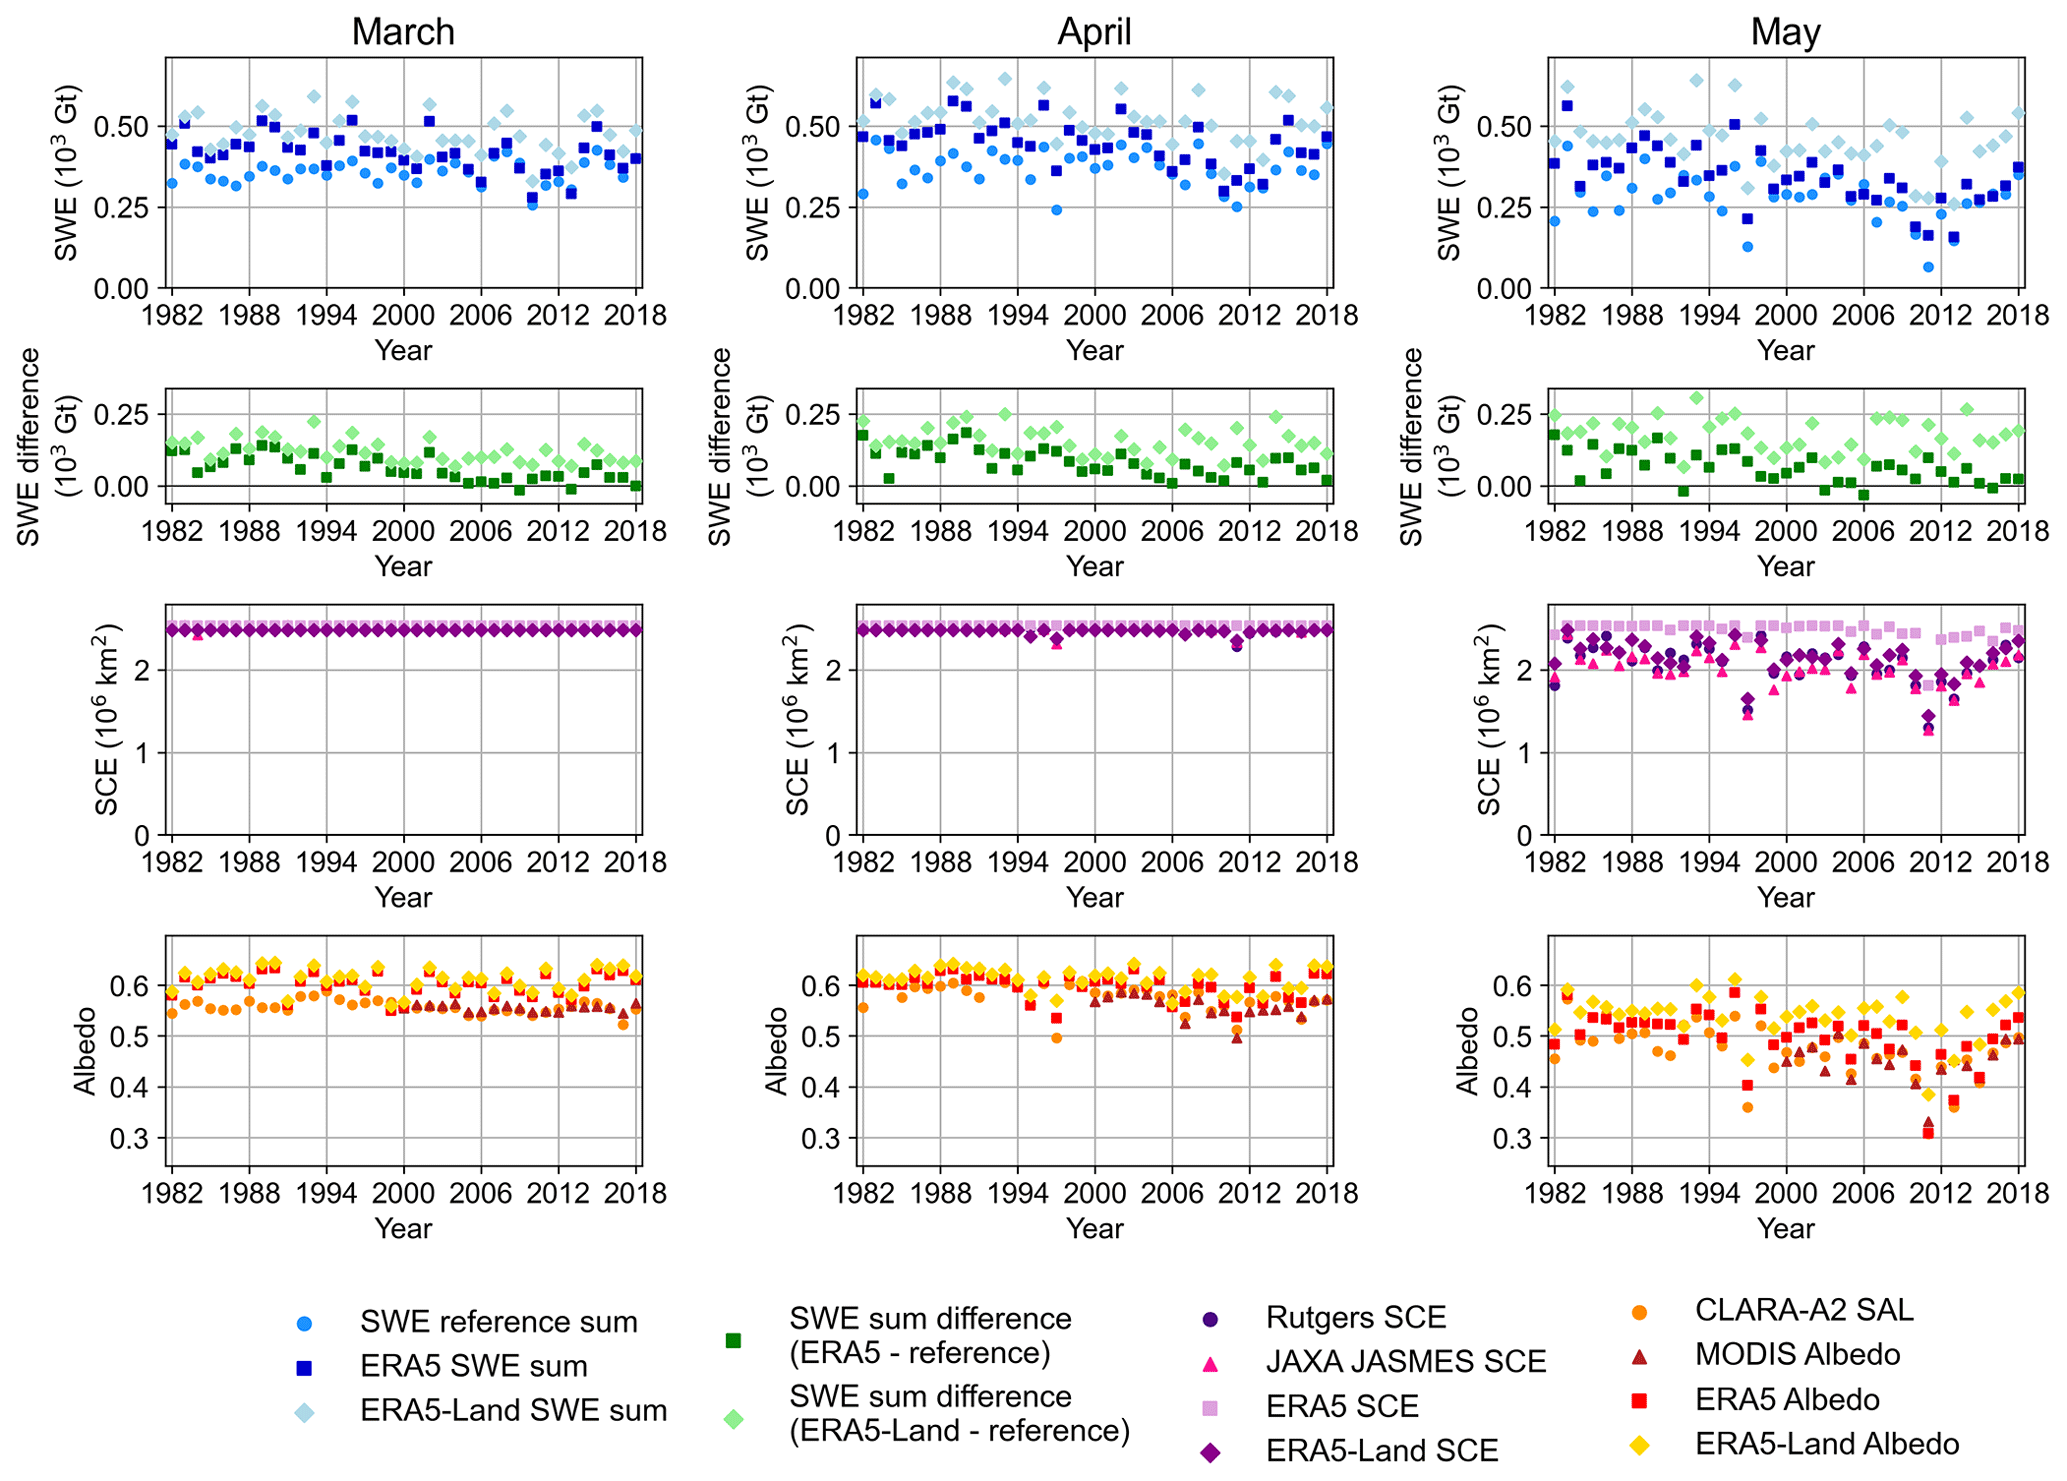
Figure 11Time series in western Siberia in (left) March, (middle) April, and (right) May for SWE sum (top row), the difference in SWE sum (second row), SCE (third row), and albedo (bottom row). The area is marked in Figs. 9 and 10.
All SCE datasets (Fig. 11, third row) show that the whole area is covered with snow in March and April, with a few minor exceptions. In May, when the spring advances, and the melt season starts, the variability increases. ERA5 shows overestimation in SCE compared to other datasets, while ERA5-Land is very well in line with JAXA JASMES and Rutgers. Both ERA5 and ERA5-Land show a small overestimation in albedo (Fig. 11, bottom row). The overestimation compared to satellite-based data is at its lowest in April. Even though there is a difference in the albedo values between ERA5, ERA5-Land, and the satellite-based datasets, both ERA5 and ERA5-Land capture the annual variability quite accurately.
In the Canadian Prairies, the SWE estimates are quite consistent with each other (Fig. 12, first and second row). There is only a minor variability between the datasets, and the difference varies from negative to positive. Especially in May, both ERA5 and ERA5-Land show mostly smaller SWE estimates than the SWE reference data. Contrary to western Siberia, there is no clear drop in the SWE sum difference in the year 2004.
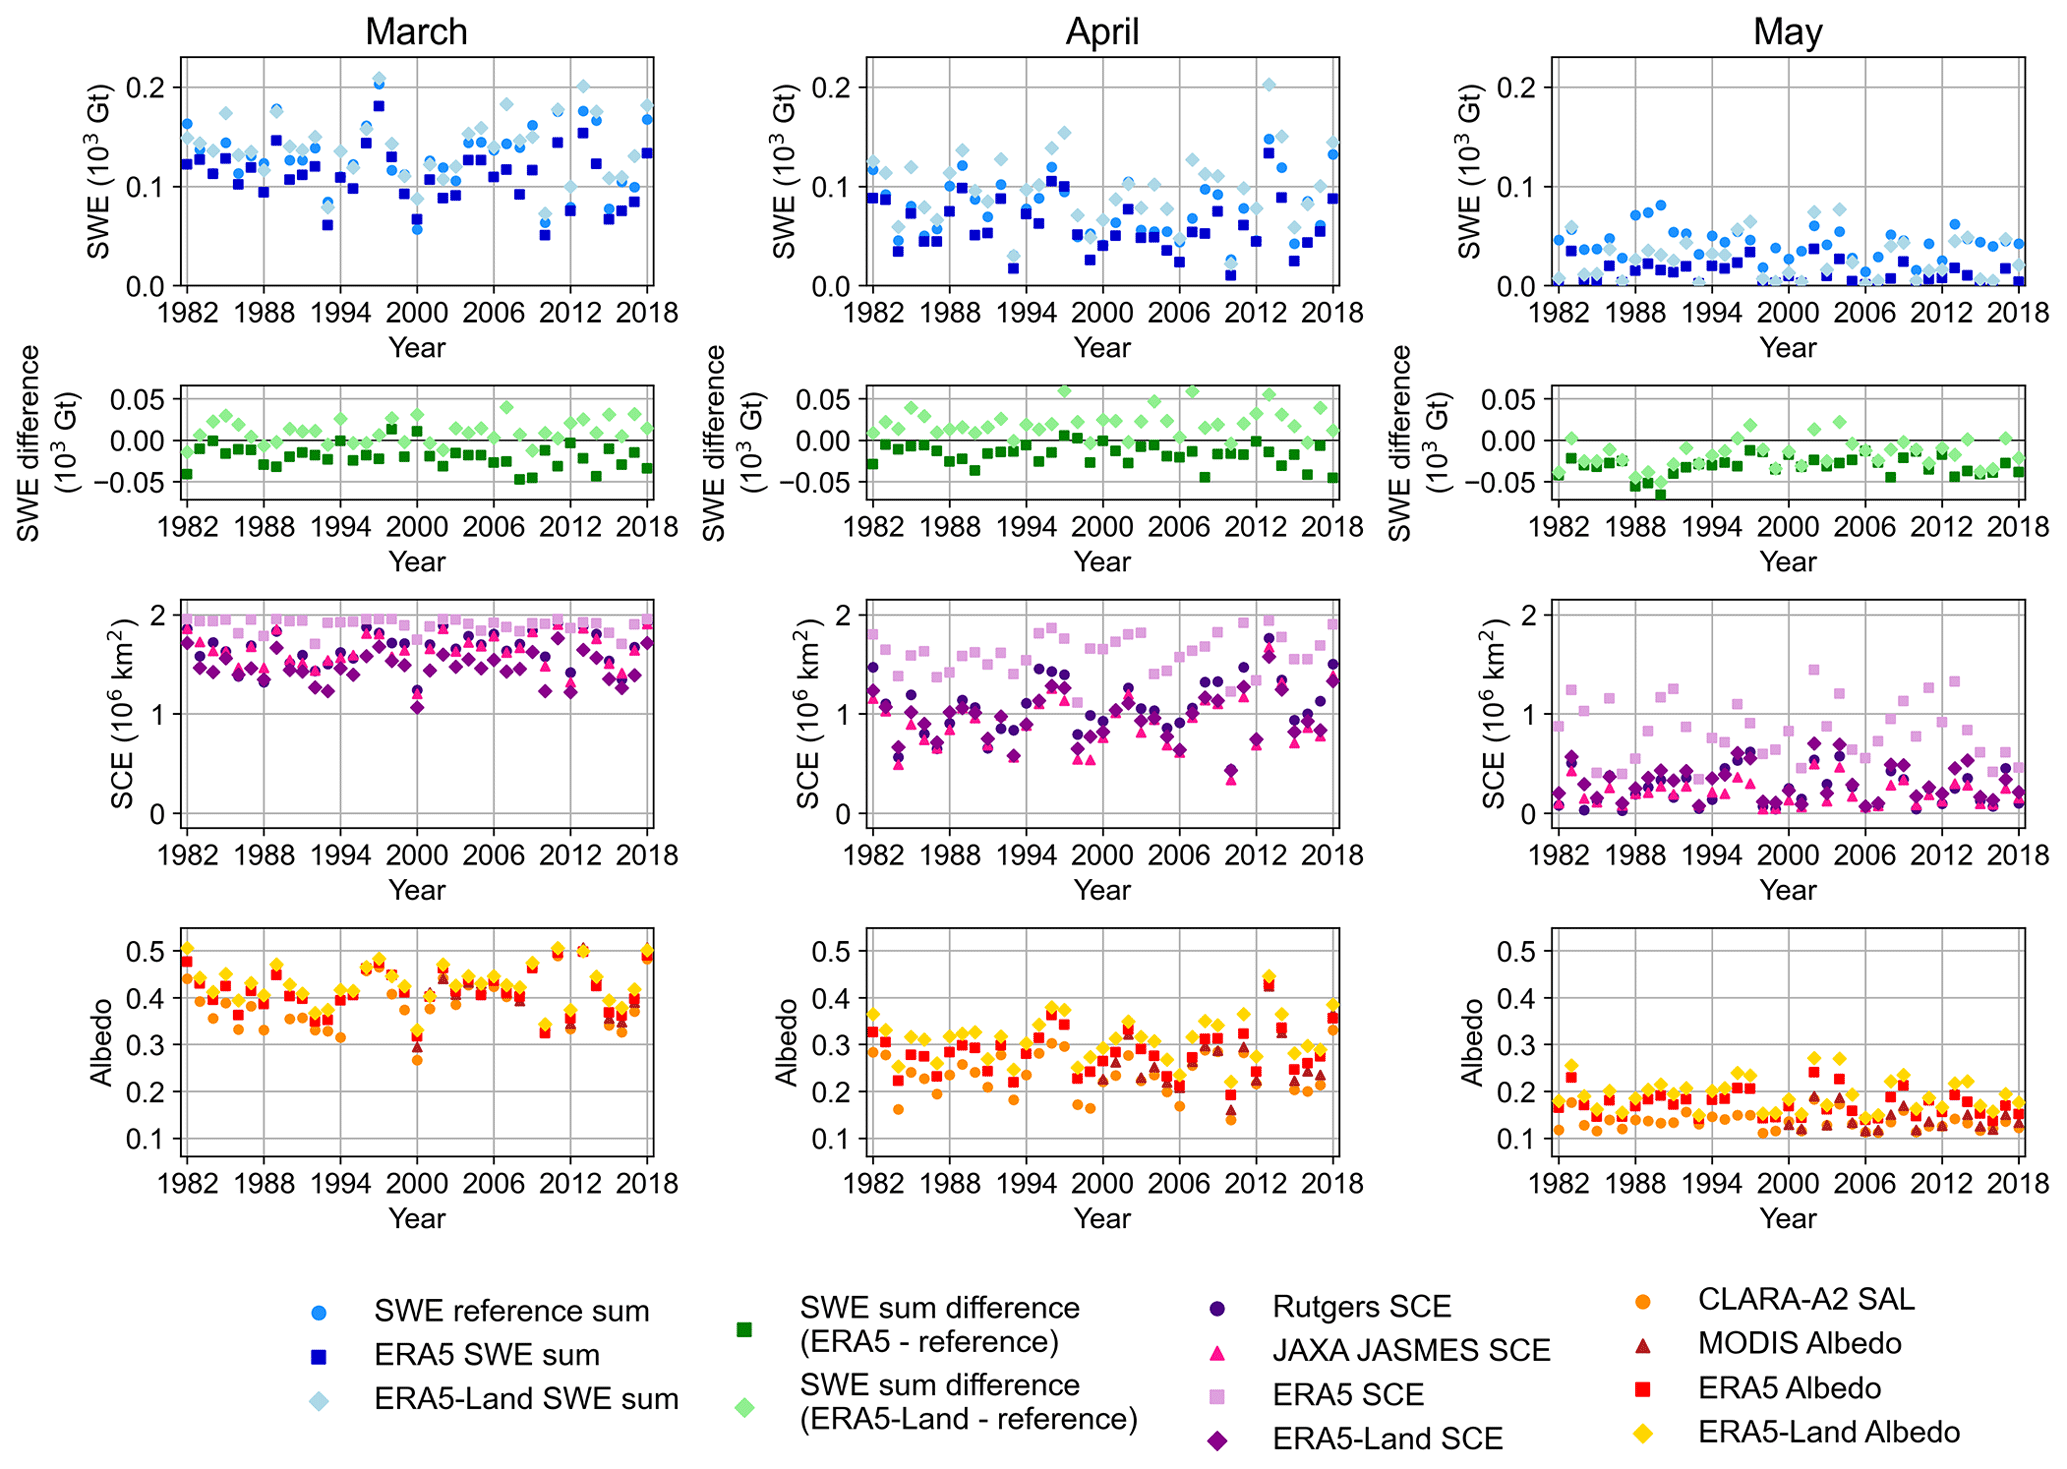
Figure 12Time series in Canadian Prairies in (left) March, (middle) April, and (right) May for SWE sum (top row), the difference in SWE sum (second row), SCE (third row), and albedo (bottom row). The area is marked in Figs. 9 and 10.
In SCE (Fig. 12, third row), the variability between the datasets increases when spring advances. ERA5 overestimates SCE in this area throughout the spring season, and the overestimation is greatest in May. ERA5-Land, in turn, shows smaller SCE values in March compared to Rutgers and JAXA JASMES. In April and May, ERA5-Land, Rutgers, and JAXA JASMES are mostly consistent with each other. All the albedo datasets are very consistent in the Canadian Prairies in March, but when spring advances, the difference increases (Fig. 12, bottom row); in May, both ERA5 and ERA5-Land show a slight overestimation in albedo. Both Figs. 11 and 12 illustrate that even though there are discrepancies between ERA5, ERA5-Land, and the satellite-based datasets, both ERA5 and ERA5-Land are able to capture the interannual variability quite accurately. For example, in western Siberia (Fig. 11), there is a clear increase in all the variables in May after the year 2011, which all the datasets detect similarly. In Canadian Prairies (Fig. 12) albedo shows large interannual variability in March throughout the study period, which both ERA5 and ERA5-Land capture quite accurately.
ERA5 and ERA5-Land show overall very large total SWE estimates compared to the SWE reference data, and the excessively high values are mostly concentrated in the mountainous regions (Figs. 1 and 2). The SWE estimates in the non-mountainous regions are better in line with the SWE reference data (Fig. 3). This result is consistent with other studies, as snow depth above 1500 m is unrealistically large in ERA5 (Hersbach et al., 2020). ERA5 has also shown a delayed ablation of deep snowpack in spring in the Tibetan Plateau (Lei et al., 2023). The snowpack is presented in IFS with a single layer of snow, which does not produce enough melting, and this results in excessively high snow depths (Hersbach et al., 2020).
ERA5-Land has a notably higher resolution than ERA5, which could indicate that ERA5-Land would perform better over mountains with complex terrain. For example, downscaled regional climate models show smaller biases in snow cover in mountainous regions compared to original CMIP6 climate models with coarse resolution (Matiu et al., 2019). However, studies have shown that ERA5-Land overestimates snow depths more than ERA5 over the mountains (Monteiro and Morin, 2023; Muñoz-Sabater et al., 2021), which is consistent with our study. Both ERA5 and ERA5-Land show too-high values in mountainous regions, but ERA5 has been found to perform better at the highest mountains (> 3300 m), whereas ERA5-Land shows improvements in mid-altitude mountains due to the higher resolution (Muñoz-Sabater et al., 2021). This also most likely explains why ERA5-Land overestimates SWE more than ERA5 (Fig. 2). The comparison between North America and Eurasia (Figs. 5 and 6) showed that ERA5 and ERA5-Land overestimate SWE more in North America, which likely results from the very high SWE values in the Rocky Mountains. As the highest elevations of the Rocky Mountains exceed 3300 m, ERA5-Land shows even larger overestimation in SWE compared to ERA5.
When interpreting the results, it should be noted that in the mountainous regions, we are comparing ERA5 and ERA5-Land to other model products, which may cause uncertainties in the comparison. However, the results are consistent with other studies, which increases the reliability of this analysis in mountainous regions. Another point to consider when interpreting the results is that Brown and Crocus are driven by ERA-Interim instead of ERA5, which can also affect the comparison. However, studies have shown that using ERA5 instead of ERA-Interim in Brown and Crocus has an opposite effect on snow cover estimates (Derksen and Mudryk, 2023). As we are using the mean value of several datasets, it is therefore likely that this only has a minor effect on the results in the mountainous regions.
The regional analysis (Sect. 3.3) showed that there is a large regional variability between the datasets. Even though ERA5 and ERA5-Land show overall larger SWE estimates than the reference data, the difference is mostly the opposite in the Canadian Prairies. SWE in ERA5 is lower than SWE in the reference data in Canadian Prairies throughout the spring season, whereas for ERA5-Land, the difference decreases and becomes negative when spring advances (Fig. 12). However, also in these smaller regions, the difference between ERA5 and ERA5-Land stays the same, as ERA5-Land shows larger SWE estimates than ERA5.
The SCE time series between ERA5-Land and the satellite-based datasets show only minor differences, while ERA5 notably overestimates SCE compared to the satellite-based datasets. That is, ERA5 tends to overestimate SCE, while ERA5-Land tends to overestimate SWE. The overestimation of SCE in ERA5 occurs in regions with shallow snowpack, which means that it does not convert to excessively large SWE values. ERA5-Land, in turn, overestimates SWE compared to the SWE reference data, especially over mountainous regions with deep snowpack. These areas are typically completely covered with snow, and, therefore, overestimating SWE does not cause excessively high SCE values.
Time series of albedo are overall quite consistent between the datasets. Both ERA5 and ERA5-Land show a slight overestimation in albedo (Fig. 2), and when spring advances the difference slightly increases. Also, the analysis shows that ERA5-Land shows moderately higher albedo values than ERA5. The discrepancy between satellite-based datasets and the reanalysis can be due to the different albedos used in the analysis. The satellite-based datasets provide estimates for black-sky albedo, whereas ERA5 and ERA5-Land provide estimates for blue-sky albedo. The black-sky albedo only accounts for direct solar radiation, while the blue-sky albedo is for both direct and diffuse solar radiation (Schaepman-Strub et al., 2006). Typically, blue-sky albedo shows higher values than black-sky albedo (Manninen et al., 2012), which may cause discrepancies in the comparison.
The comparison between the different albedo estimates in ERA5 and ERA5-Land (Fig. S1) shows only a slight difference between the albedo estimates and indicates that the differences between albedo estimates are smaller than is typical (Key et al., 2001). Figure 10 shows that in March, the study area in western Siberia is fully covered with snow. Therefore, we additionally compared the ERA5 and ERA5-Land albedo estimates over that area. The difference between white-sky albedo and blue-sky albedo for clear sky only showed 1.1 % (absolute) higher values (ranging from 0.4 % to 1.7 %), which is a notably smaller difference than is typical. Studies have shown that radiation quantities are slightly biased in ERA5 (Babar et al., 2019; Urraca et al., 2018), which would also affect albedo.
Even though there are discrepancies between ERA5 and ERA5-Land and the satellite-based datasets, both ERA5 and ERA5-Land are mostly able to capture the annual variability quite accurately. This finding is also consistent with other studies (Orsolini et al., 2019). The regional analyses (Figs. 11 and 12) show especially large annual variability, which both ERA5 and ERA5-Land are mostly able to capture.
The trends in 1982–2018 show considerable variability among the datasets (Fig. 4). ERA5 shows the overall most prominent trends in all variables. The SWE trend in ERA5 differs considerably from the SWE trends in ERA5-Land and the reference data. Recent studies have shown that there is a discontinuity in ERA5 snow cover estimates in 2004, which is caused by adding the IMS information to ERA5 (Mortimer et al., 2020; Urraca and Gobron, 2023). This improves the SWE estimates after the year 2004, but it decreases the stability of the time series and, therefore, makes the trends less reliable. ERA5-Land does not assimilate data and therefore does not exhibit the same discontinuity, which improves the stability of trends but in turn decreases the accuracy of snow cover estimates at the end of the study period. The satellite-based datasets can also exhibit discontinuities due to using different satellite instruments, but typically these are taken into account so that the datasets are suitable for climate studies (Hori et al., 2017; Luojus et al., 2021).
IMS information is assimilated only at altitudes below 1500 m, so it does not improve snow cover estimates in mountainous regions. This most likely explains why the discontinuity is more visible in Eurasia than in North America (Figs. 5 and 6). As the Rocky Mountains account for a large fraction of the SWE sum in North America, adding IMS has a smaller effect on the total SWE estimate at the continental scale. This phenomenon is also seen in the trends in North America and Eurasia (Figs. 7 and 8). The SWE trends in North America are similar in ERA5 and the SWE reference data (Fig. 7), while there is a large difference in Eurasia (Fig. 8). Since there is not a clear discontinuity visible in North America, it improves the stability of the trends and makes them more reliable. The downside is that the SWE values themselves are not improved towards the end of the study period. In Eurasia, in turn, the trends show a considerable difference between ERA5 and the SWE reference data, which cannot be explained by the uncertainties. This suggests that the trends in 1982–2018 are not reliable, but the SWE estimates notably improve after the year 2004 and are very similar to the SWE reference data. This conclusion is consistent with previous studies (Mortimer et al., 2020; Urraca and Gobron, 2021). The trends between SCE and albedo are mostly well in line between the datasets. This was to be expected, as snow cover highly affects the surface albedo. In ERA5, the monthly SCE and albedo values showed considerable discrepancies (Figs. 1, S1, and 2), but the trends are still consistent.
There are also uncertainties related to the satellite-based datasets, which can affect the comparison. While the accuracy of the satellite-based SWE estimates has improved considerably with the evolution of retrieval methods, some uncertainties remain. The comparison between JAXA JASMES and in situ observations showed a slight overestimation in JAXA JASMES (Hori et al., 2017). Also, the difference between JAXA JASMES and Rutgers increases towards May, indicating that melting snow may pose a challenge to satellite-based snow detection. The uncertainty related to the MCD43D51 product is overall very low, as we have only included the pixels with good quality in the analysis. Also, CLARA-A2 SAL performs overall accurately over snow and ice (Anttila et al., 2016b), which increases the reliability of this analysis.
In mountainous regions, the high topographic variability can cause uncertainties in the satellite-based estimates, as the relatively coarse resolution of satellite data is not ideal for mountainous regions. The complex terrain causes uncertainties in SWE estimates, but averaging over multiple products can improve the accuracy (Mortimer et al., 2020). Mountains can also complicate albedo retrieval due to shadowing, but this is taken into account by making the topography correction for the CLARA-A2 SAL product (Anttila et al., 2016a). Also, as mountains only represent a small fraction of the whole study area, they have a limited effect on the overall albedo and SCE values.
We have evaluated snow cover properties in ERA5 and ERA5-Land and compared the time series and trends with several satellite-based datasets. Our study included SWE, SCE, and albedo, which are the most important variables related to snow cover. Our study covers land areas north of 40∘ N and the spring season from March to May in 1982–2018. The main findings of our study are as follows.
Both ERA5 and ERA5-Land overestimate SWE compared to the reference data, with ERA5-Land SWE estimates being the largest. The difference between ERA5-Land and SWE reference data remains at about 3000 Gt throughout the study period, which means that the NH total seasonal snow mass estimated by ERA5-Land is about 2 times higher in March and almost 3 times higher in May compared to the SWE reference data. The excessively high SWE is mostly due to the very large values over mountainous regions.
There is a discontinuity in ERA5 around the year 2004, since adding IMS from the year 2004 onwards considerably improves SWE estimates but affects the temporal stability. ERA5-Land does not exhibit the same discontinuity, which improves the temporal stability of the trends but in turn decreases the accuracy of snow cover estimates at the end of the study period.
Due to the discontinuity, ERA5 shows a decreasing trend that is 2 or even 3 times larger than ERA5-Land and the SWE reference data: SWE trends in ERA5 range from −249 to −236 Gt per decade in spring, while the trends in ERA5-Land and the SWE reference data range from −124 to −77 Gt per decade in spring.
ERA5 and ERA5-Land albedo estimates are quite consistent with the satellite-based datasets with only a slight overestimation. However, this discrepancy may be explained by the discrepancy between the used variables: the satellite-based datasets provide estimates for black-sky albedo, whereas ERA5 and ERA5-Land provide estimates for blue-sky albedo. Typically, the blue-sky albedo is slightly higher than the black-sky albedo, which may explain the difference. The negative trend in albedo is strongest in May, when it varies from −0.011 to −0.006 per decade depending on the dataset.
SCE is very accurately described in ERA5-Land, whereas ERA5 shows considerably larger values compared to the satellite-based datasets. Similar to albedo, the negative trends become more prominent when spring advances, and in May, all the datasets show statistically significant negative trends. However, the negative trend detected by ERA5 ( km2 per decade) is about twice as large as the trends detected by other datasets (ranging from −0.66 to km2 per decade).
Despite the discrepancies in ERA5 and ERA5-Land with the satellite-based datasets, both are able to capture the interannual variability quite accurately.
The bias-corrected SnowCCI data are available online at https://doi.org/10.1594/PANGAEA.911944 (Luojus et al., 2020). The Brown and Crocus v7 datasets are available from the original authors (please see Table 1 for references). MERRA-2 SWE data are available online at https://doi.org/10.5067/RKPHT8KC1Y1T (GMAO, 2015). CLARA-A2 SAL data are available online at https://doi.org/10.5676/EUM_SAF_CM/CLARA_AVHRR/V002 (Anttila et al., 2016a). MCD43D51 data are available online at https://doi.org/10.5067/MODIS/MCD43D51.061 (Schaaf and Wang, 2021a). MCD43D31 data are available online at https://doi.org/10.5067/MODIS/MCD43D31.061 (Schaaf and Wang, 2021b). Rutgers SCE data are available online at https://doi.org/10.7265/zzbm-2w05 (Robinson and Estilow, 2021). JAXA JASMES SCE data are available online at https://www.eorc.jaxa.jp/JASMES/index.html (Hori et al., 2017). ERA5 data are available at https://doi.org/10.24381/cds.f17050d7 (Hersbach et al., 2023). ERA5-Land data are available at https://doi.org/10.24381/cds.68d2bb30 (Muñoz Sabater, 2019).
The supplement related to this article is available online at: https://doi.org/10.5194/tc-17-5007-2023-supplement.
KK conceptualized the study with help from AR. KL provided the SWE reference data. KK performed the analysis and produced the figures. KK wrote the original draft. All authors contributed to manuscript review and editing.
The contact author has declared that none of the authors has any competing interests.
Publisher's note: Copernicus Publications remains neutral with regard to jurisdictional claims made in the text, published maps, institutional affiliations, or any other geographical representation in this paper. While Copernicus Publications makes every effort to include appropriate place names, the final responsibility lies with the authors.
This research has been supported by the Academy of Finland (grant no. 341845) and the Väisälän Rahasto.
This paper was edited by Stephen Howell and reviewed by two anonymous referees.
Ångström, A.: The albedo of various surfaces of ground, Geogr. Ann., 7, 323–342, https://doi.org/10.1080/20014422.1925.11881121, 1925.
Anttila, K., Jääskeläinen, E., Riihelä, A., Manninen, T., Andersson, K., and Hollman, R.: Algorithm theoretical basis document: CM SAF cloud, albedo, radiation data record Ed. 2 – Surface Albedo, https://doi.org/10.5676/EUM_SAF_CM/CLARA_AVHRR/V002, 2016a.
Anttila, K., Manninen, T., Jääskeläinen, E., Riihelä, A., and Hollman, R.: Validation report: CM SAF cloud, albedo, radiation data record Ed. 2 – Surface Albedo, https://doi.org/10.5676/EUM_SAF_CM/CLARA_AVHRR/V002, 2016b.
Babar, B., Graversen, R., and Boström, T.: Solar radiation estimation at high latitudes: Assessment of the CMSAF databases, ASR and ERA5, Sol. Energy, 182, 397–411, https://doi.org/10.1016/j.solener.2019.02.058, 2019.
Barnett, T., Adam, J., and Lettenmaier, D.: Potential impacts of a warming climate on water availability in snow-dominated regions, Nature, 438, 303–309, https://doi.org/10.1038/nature04141, 2005.
Bian, Q., Xu, Z., Zhao, L., Zhang, Y. F., Zheng, H., Shi, C., Zhang, S., Xie, C., and Yang, Z. L.: Evaluation and intercomparison of multiple snow water equivalent products over the Tibetan Plateau, J. Hydrometeorol., 20, 2043–2055, https://doi.org/10.1175/JHM-D-19-0011.1, 2019.
Bormann, K. J., Brown, R. D., Derksen, C., and Painter, T. H.: Estimating snow-cover trends from space, Nat. Clim. Change, 8, 924–928, https://doi.org/10.1038/s41558-018-0318-3, 2018.
Brown, R. D., Brasnett, B., and Robinson, D.: Gridded North American monthly snow depth and snow water equivalent for GCM evaluation, Atmos.-Ocean, 41, 1–14, https://doi.org/10.3137/ao.410101, 2003.
Brown, R., Derksen, C., and Wang, L.: A multi-data set analysis of variability and change in Arctic spring snow cover extent, 1967–2008, J. Geophys Res.-Atmos., 115, D16111, https://doi.org/10.1029/2010JD013975, 2010.
Brun, E., Vionnet, V., Boone, A., Decharme, B., Peings, Y., Vallette, R., Karbou, F., and Morin, S.: Simulation of northern Eurasian local snow depth, mass, and density using a detailed snowpack model and meteorological reanalyses, J. Hydrometeorol., 14, 203–219, https://doi.org/10.1175/JHM-D-12-012.1, 2013.
Callaghan, T. V., Johansson, M., Brown, R. D., Groisman, P. Y., Labba, N., Radionov, V., Bradley, R. S., Blangy, S., Bulygina, O. N., Christensen, T. R., Colman, J. E., Essery, R. L. H., Forbes, B. C., Forchhammer, M. C., Golubev, V. N., Honrath, R. E., Ju-day, G. P., Meshcherskaya, A. V., Phoenix, G. K., Pomeroy, J., Rautio, A., Robinson, D. A., Schmidt, N. M., Serreze, M. C., Shevchenko, V. P., Shiklomanov, A. I., Shmakin, A. B., Sköld, P., Sturm, M., Woo, M.-K., and Wood, E. F.: Multiple effects of changes in arctic snow cover, Ambio, 40, 32–45, https://doi.org/10.1007/s13280-011-0213-x, 2011.
Derksen, C. and Brown, R.: Spring snow cover extent reductions in the 2008–2012 period exceeding climate model projections, Geophys. Res. Lett., 39, L19504, https://doi.org/10.1029/2012GL053387, 2012.
Derksen, C. and Mudryk, L.: Assessment of Arctic seasonal snow cover rates of change, The Cryosphere, 17, 1431–1443, https://doi.org/10.5194/tc-17-1431-2023, 2023.
de Rosnay, P., Balsamo, G., Albergel, C., Muñoz-Sabater, J., and Isaksen, L.: Initialisation of land surface variables for numerical weather prediction, Surv. Geophys., 35, 607–621, 2014.
Déry, S. J. and Brown, R. D.: Recent Northern Hemisphere snow cover extent trends and implications for the snow albedo feedback, Geophys. Res. Lett., 34, L22504, https://doi.org/10.1029/2007GL031474, 2007.
Douville, H., Chauvin, F., Planton, S., Royer, J. F., Salas-Melia, D., and Tyteca, S.: Sensitivity of the hydrological cycle to increasing amounts of greenhouse gases and aerosols, Clim. Dynam., 20, 45–68, https://doi.org/10.1007/s00382-002-0259-3, 2002.
ECMWF: IFS Documentation CY41R2 – Part IV: Physical Processes, ECMWF, https://doi.org/10.21957/tr5rv27xu, 2016.
Essery, R., Kim, H., Wang, L., Bartlett, P., Boone, A., Brutel-Vuilmet, C., Burke, E., Cuntz, M., Decharme, B., Dutra, E., Fang, X., Gusev, Y., Hagemann, S., Haverd, V., Kontu, A., Krinner, G., Lafaysse, M., Lejeune, Y., Marke, T., Marks, D., Marty, C., Menard, C. B., Nasonova, O., Nitta, T., Pomeroy, J., Schädler, G., Semenov, V., Smirnova, T., Swenson, S., Turkov, D., Wever, N., and Yuan, H.: Snow cover duration trends observed at sites and predicted by multiple models, The Cryosphere, 14, 4687–4698, https://doi.org/10.5194/tc-14-4687-2020, 2020.
Estilow, T. W., Young, A. H., and Robinson, D. A.: A long-term Northern Hemisphere snow cover extent data record for climate studies and monitoring, Earth Syst. Sci. Data, 7, 137–142, https://doi.org/10.5194/essd-7-137-2015, 2015.
Fierz, C., Armstrong, R. L., Durand, Y., Etchevers, P., Greene, E., McClung, D. M., Nishimura, K., Satyawali, P. K., and Sokratov, S. A.: The International Classification for Seasonal Snow on the Ground, IHP-VII Technical Documents in Hydrology No. 83, IACS Contribution No. 1, UNESCO-IHP, 2009.
Flanner, M. G., Shell, K. M., Barlage, M., Perovich, D. K., and Tschudi, M. A.: Radiative forcing and albedo feedback from the Northern Hemisphere cryosphere between 1979 and 2008, Nat. Geosci., 4, 151–155, https://doi.org/10.1038/ngeo1062, 2011.
Gelaro, R., McCarty, W., Suárez, M. J., Todling, R., Molod, A., Takacs, L., Randles, C. A., Darmenov, A., Bosilovich, M. G., Reichle, R., Wargan, K., Coy, L., Cullather, R., Draper, C., Akella, S., Buchard, V., Conaty, A., da Silva, A. M., Gu, W., Kim, G.-K., Koster, R., Lucchesi, R., Merkova, D., Nielsen, J. E., Partyka, G., Pawson, S., Putman, W., Rienecker, M., Schubert, S. D., Sienkiewicz, M., and Zhao, B.: The modern-era retrospective analysis for research and applications, version 2 (MERRA-2), J. Climate, 30, 5419–5454, https://doi.org/10.1175/JCLI-D-16-0758.1, 2017.
Global Modeling and Assimilation Office (GMAO): MERRA-2 tavg1_2d_lnd_Nx: 2d, 1-Hourly, Time-Averaged, Single-Level, Assimilation, Land Surface Diagnostics V5.12.4 (M2T1NXLND), Goddard Earth Sciences Data and Information Services Center (GES DISC) [data set], https://doi.org/10.5067/RKPHT8KC1Y1T, 2015.
Guo, H. and Yang, Y.: Spring snow-albedo feedback from satellite observation, reanalysis and model simulations over the Northern Hemisphere, Sci. China Earth Sci., 65, 1463–1476, https://doi.org/10.1007/s11430-021-9913-1, 2022.
Hernández-Henríquez, M. A., Déry, S. J., and Derksen, C.: Polar amplification and elevation-dependence in trends of Northern Hemisphere snow cover extent, 1971–2014, Environ. Res. Lett., 10, 044010, https://doi.org/10.1088/1748-9326/10/4/044010, 2015.
Hersbach, H., Bell, B., Berrisford, P., Hirahara, S., Horányi, A., Muñoz-Sabater, J., Nicolas, J., Peubey, C., Radu, R., Schepers, D., Simmons, A., Soci, C., Abdalla, S., Abellan, X., Balsamo, G., Bechtold, P., Biavati, P., Bidlot, J., Bonavita, M., De Chiara, G., Dahlgren, P., Dee, D., Diamantakis, M., Dragani, R., Flemming, J., Forbes, R., Fuentes, M., Geer, A., Haimberger, H., Healy, S., Hogan, R. J., Hólm, E., Janisková, M., Keeley, S., Laloyaux, P., Lopez, P., Lupu, C., Radnoti, G., de Rosnay, P., Rozum, I., Vamborg, F., Villaume, S., and Thépaut, J.-N.: The ERA5 global reanalysis, Q. J. Roy. Meteor. Soc., 146, 1999–2049, https://doi.org/10.1002/qj.3803, 2020.
Hersbach, H., Bell, B., Berrisford, P., Biavati, G., Horányi, A., Muñoz Sabater, J., Nicolas, J., Peubey, C., Radu, R., Rozum, I., Schepers, D., Simmons, A., Soci, C., Dee, D., Thépaut, J.-N.: ERA5 monthly averaged data on single levels from 1940 to present, Copernicus Climate Change Service (C3S) Climate Data Store (CDS) [data set], https://doi.org/10.24381/cds.f17050d7, 2023.
Hori, M., Sugiura, K., Kobayashi, K., Aoki, T., Tanikawa, T., Kuchiki, K., Niwano, M., and Enomoto, H.: A 38-year (1978–2015) Northern Hemisphere daily snow cover extent product derived using consistent objective criteria from satellite-borne optical sensors, Remote Sens. Environ., 191, 402–418, https://doi.org/10.1016/j.rse.2017.01.023, 2017 (data available at: https://www.eorc.jaxa.jp/JASMES/index.html, last access: 13 April 2022).
Jia, A., Wang, D., Liang, S., Peng, J., and Yu, Y.: Global Daily Actual and Snow-Free Blue-Sky Land Surface Albedo Climatology From 20-Year MODIS Products, J. Geophys Res.-Atmos., 127, e2021JD035987, https://doi.org/10.1029/2021JD035987, 2022.
Karlsson, K.-G., Anttila, K., Trentmann, J., Stengel, M., Meirink, J. F., Devasthale, A., Hanschmann, T., Kothe, S., Jääskeläinen, E., Sedlar, J., Benas, N., van Zadelhoff, G.-J., Schlundt, C.,; Stein, D., Finkensieper, S., Håkansson, N., Hollmann, R., Fuchs, P., and Werscheck, M.: CLARA-A2: CM SAF cLoud, Albedo and surface RAdiation dataset from AVHRR data – Edition 2, Satellite Application Facility on Climate Monitoring, https://doi.org/10.5676/EUM_SAF_CM/CLARA_AVHRR/V002, 2017.
Key, J. R., Wang, X., Stoeve, J. C., and Fowler, C.: Estimating the cloudy-sky albedo of sea ice and snow from space, J. Geophys Res.-Atmos., 106, 12489–12497, https://doi.org/10.1029/2001JD900069, 2001.
Kim, R. S., Kumar, S., Vuyovich, C., Houser, P., Lundquist, J., Mudryk, L., Durand, M., Barros, A., Kim, E. J., Forman, B. A., Gutmann, E. D., Wrzesien, M. L., Garnaud, C., Sandells, M., Marshall, H.-P., Cristea, N., Pflug, J. M., Johnston, J., Cao, Y., Mocko, D., and Wang, S.: Snow Ensemble Uncertainty Project (SEUP): quantification of snow water equivalent uncertainty across North America via ensemble land surface modeling, The Cryosphere, 15, 771–791, https://doi.org/10.5194/tc-15-771-2021, 2021.
Kundzewicz, Z. W., Mata, L. J., Arnell, N. W., Döll, P., Jimenez, B., Miller, K., Oki, T., Şen, Z., and Shiklomanov, I.: The implications of projected climate change for freshwater resources and their management, Hydrolog. Sci. J., 53, 3–10, https://doi.org/10.1623/hysj.53.1.3, 2008.
Lei, Y., Pan, J., Xiong, C., Jiang, L., and Shi, J.: Snow depth and snow cover over the Tibetan Plateau observed from space in against ERA5: matters of scale, Clim. Dynam., 60, 1523–1541, https://doi.org/10.1007/s00382-022-06376-0, 2022.
Li, D., Wrzesien, M. L., Durand, M., Adam, J., and Lettenmaier, D. P.: How much runoff originates as snow in the western United States, and how will that change in the future?, Geophys. Res. Lett., 44, 6163–6172, https://doi.org/10.1002/2017GL073551, 2017.
Li, Q., Ma, M., Wu, X., and Yang, H.: Snow cover and vegetation-induced decrease in global albedo from 2002 to 2016, J. Geophys Res.-Atmos., 123, 124–138, https://doi.org/10.1002/2017JD027010, 2018.
Li, Q., Yang, T., and Li, L.: Evaluation of snow depth and snow cover represented by multiple datasets over the Tianshan Mountains: Remote sensing, reanalysis, and simulation, Int. J. Climatol., 42, 4223–4239, https://doi.org/10.1002/joc.7459, 2022.
Luojus, K., Pulliainen, J., Takala, M., Lemmetyinen, J., and Moisander, M.: GlobSnow v3.0 snow water equivalent (SWE), PANGAEA [data set], https://doi.org/10.1594/PANGAEA.911944, 2020.
Luojus, K., Pulliainen, J., Takala, M., Lemmetyinen, J., Moisander, M., Mortimer, C., Derksen, C., Hiltunen, M., Smolander, T., Ikonen, J., Cohen, J., Veijola, K., and Venäläinen, P.: GlobSnow v3.0 Northern Hemisphere snow water equivalent dataset, Sci. Data, 8, 163, https://doi.org/10.1038/s41597-021-00939-2, 2021.
Magnusson, J., Nævdal, G., Matt, F., Burkhart, J. F., and Winstral, A.: Improving hydropower inflow forecasts by assimilating snow data, Hydrol. Res., 51, 226–237, https://doi.org/10.2166/nh.2020.025, 2020.
Manninen, T., Riihelä, A., and de Leeuw, G.: Atmospheric effect on the ground-based measurements of broadband surface albedo, Atmos. Meas. Tech., 5, 2675–2688, https://doi.org/10.5194/amt-5-2675-2012, 2012.
Manninen, T., Jääskeläinen, E., and Riihelä, A.: Black and white-sky albedo values of snow: In situ relationships for AVHRR-based estimation using CLARA-A2 SAL, Can. J. Remote Sens., 45, 350–367, https://doi.org/10.1080/07038992.2019.1632177, 2019.
Matiu, M., Petitta, M., Notarnicola, C., and Zebisch, M.: Evaluating Snow in EURO-CORDEX Regional Climate Models with Observations for the European Alps: Biases and Their Relationship to Orography, Temperature, and Precipitation Mismatches, Atmosphere, 11, 46, https://doi.org/10.3390/atmos11010046, 2020.
Metsämäki, S., Böttcher, K., Pulliainen, J., Luojus, K., Cohen, J., Takala, M., Mattila, O.-P., Schwaizer, G., Derksen, C., and Koponen, S.: The accuracy of snow melt-off day derived from optical and microwave radiometer data – A study for Europe, Remote Sens. Environ., 211, 1–12, https://doi.org/10.1016/j.rse.2018.03.029, 2018.
Monteiro, D. and Morin, S.: Multi-decadal analysis of past winter temperature, precipitation and snow cover data in the European Alps from reanalyses, climate models and observational datasets, The Cryosphere, 17, 3617–3660, https://doi.org/10.5194/tc-17-3617-2023, 2023.
Mortimer, C., Mudryk, L., Derksen, C., Luojus, K., Brown, R., Kelly, R., and Tedesco, M.: Evaluation of long-term Northern Hemisphere snow water equivalent products, The Cryosphere, 14, 1579–1594, https://doi.org/10.5194/tc-14-1579-2020, 2020.
Mortimer, C., Mudryk, L., Derksen, C., Brady, M., Luojus, K., Venäläinen, P., Moisander, M., Lemmetyinen, J., Takala, M., Tanis, C., and Pulliainen, J.: Benchmarking algorithm changes to the Snow CCI+ snow water equivalent product, Remote Sens. Environ., 274, 112988, https://doi.org/10.1016/j.rse.2022.112988, 2022.
Mudryk, L., Santolaria-Otín, M., Krinner, G., Ménégoz, M., Derksen, C., Brutel-Vuilmet, C., Brady, M., and Essery, R.: Historical Northern Hemisphere snow cover trends and projected changes in the CMIP6 multi-model ensemble, The Cryosphere, 14, 2495–2514, https://doi.org/10.5194/tc-14-2495-2020, 2020.
Mudryk, L. R., Kushner, P. J., Derksen, C., and Thackeray, C.: Snow cover response to temperature in observational and climate model ensembles, Geophys. Res. Lett., 44, 919–926, https://doi.org/10.1002/2016GL071789, 2017.
Mudryk, L. R., Derksen, C., Howell, S., Laliberté, F., Thackeray, C., Sospedra-Alfonso, R., Vionnet, V., Kushner, P. J., and Brown, R.: Canadian snow and sea ice: historical trends and projections, The Cryosphere, 12, 1157–1176, https://doi.org/10.5194/tc-12-1157-2018, 2018.
Muñoz-Sabater, J.: ERA5-Land monthly averaged data from 1950 to present. Copernicus Climate Change Service (C3S) Climate Data Store (CDS) [data set], https://doi.org/10.24381/cds.68d2bb30, 2019.
Muñoz-Sabater, J., Dutra, E., Agustí-Panareda, A., Albergel, C., Arduini, G., Balsamo, G., Boussetta, S., Choulga, M., Harrigan, S., Hersbach, H., Martens, B., Miralles, D. G., Piles, M., Rodríguez-Fernández, N. J., Zsoter, E., Buontempo, C., and Thépaut, J.-N.: ERA5-Land: a state-of-the-art global reanalysis dataset for land applications, Earth Syst. Sci. Data, 13, 4349–4383, https://doi.org/10.5194/essd-13-4349-2021, 2021.
Musselman, K. N., Addor, N., Vano, J. A., and Molotch, N. P.: Winter melt trends portend widespread declines in snow water resources, Nat. Clim. Change, 11, 418–424, https://doi.org/10.1038/s41558-021-01014-9, 2021.
Orsolini, Y., Wegmann, M., Dutra, E., Liu, B., Balsamo, G., Yang, K., de Rosnay, P., Zhu, C., Wang, W., Senan, R., and Arduini, G.: Evaluation of snow depth and snow cover over the Tibetan Plateau in global reanalyses using in situ and satellite remote sensing observations, The Cryosphere, 13, 2221–2239, https://doi.org/10.5194/tc-13-2221-2019, 2019.
Qu, X. and Hall, A.: Surface contribution to planetary albedo variability in cryosphere regions, J. Climate, 18, 5239–5252, https://doi.org/10.1175/JCLI3555.1, 2005.
Pohl, C., Istomina, L., Tietsche, S., Jäkel, E., Stapf, J., Spreen, G., and Heygster, G.: Broadband albedo of Arctic sea ice from MERIS optical data, The Cryosphere, 14, 165–182, https://doi.org/10.5194/tc-14-165-2020, 2020.
Pulliainen, J., Luojus, K., Derksen, C., Mudryk, L., Lemmetyinen, J., Salminen, M., Ikonen, J., Takala, M., Cohen, J., Smolander, T., and Norberg, J.: Patterns and trends of Northern Hemisphere snow mass from 1980 to 2018, Nature, 581, 294–298, https://doi.org/10.1038/s41586-020-2258-0, 2020.
Räisänen, J.: Warmer climate: less or more snow?, Clim. Dynam., 30, 307–319 https://doi.org/10.1007/s00382-007-0289-y, 2008.
Räisänen, J.: Changes in March mean snow water equivalent since the mid-20th century and the contributing factors in reanalyses and CMIP6 climate models, The Cryosphere, 17, 1913–1934, https://doi.org/10.5194/tc-17-1913-2023, 2023.
Riihelä, A., Manninen, T., Laine, V., Andersson, K., and Kaspar, F.: CLARA-SAL: a global 28 yr timeseries of Earth's black-sky surface albedo, Atmos. Chem. Phys., 13, 3743–3762, https://doi.org/10.5194/acp-13-3743-2013, 2013.
Robinson, D. A. and Estilow, T. W.: Rutgers Northern Hemisphere 24 km Weekly Snow Cover Extent, September 1980 Onward, Version 1, Boulder, Colorado USA, National Snow and Ice Data Center [data set], https://doi.org/10.7265/zzbm-2w05, 2021.
Schaaf, C. and Wang, Z.: MODIS/Terra+Aqua BRDF/Albedo Black Sky Albedo Shortwave Daily L3 Global 30ArcSec CMG V061, NASA EOSDIS Land Processes DAAC [data set], https://doi.org/10.5067/MODIS/MCD43D51.061, 2021a.
Schaaf, C. and Wang, Z.: MODIS/Terra+Aqua BRDF/Albedo QA BRDF Quality Daily L3 Global 30ArcSec CMG V061, NASA EOSDIS Land Processes DAAC [data set], https://doi.org/10.5067/MODIS/MCD43D31.061, 2021b.
Schaepman-Strub, G., Schaepman, M. E., Painter, T. H., Dangel, S., and Martonchik, J. V.: Reflectance quantities in optical remote sensing – Definitions and case studies, Remote Sens. Environ., 103, 27–42, https://doi.org/10.1016/j.rse.2006.03.002, 2006.
Sen, P. K.: Estimates of the regression coefficient based on Kendall's tau, J. Am. Stat. Assoc., 63, 1379–1389, https://doi.org/10.2307/2285891, 1968.
Shikwambana, L. and Sivakumar, V.: Global distribution of aerosol optical depth in 2015 using CALIPSO level 3 data, J. Atmos. Sol.-Terr. Phys., 173, 150–159, https://doi.org/10.1016/j.jastp.2018.04.003, 2018.
Takala, M., Pulliainen, J., Metsämäki, S. J., and Koskinen, J. T.: Detection of snowmelt using spaceborne microwave radiometer data in Eurasia from 1979 to 2007, IEEE T. Geosci. Remote, 47, 2996–3007, https://doi.org/10.1109/TGRS.2009.2018442, 2009.
Tedesco, M., Brodzik, M., Armstrong, R., Savoie, M., and Ramage, J.: Pan arctic terrestrial snowmelt trends (1979–2008) from spaceborne passive microwave data and correlation with the Arctic Oscillation, Geophys. Res. Lett., 36, L21402, https://doi.org/10.1029/2009GL039672, 2009.
Theil, H.: A rank-invariant method of linear and polynomial regression analysis (Parts 1–3), K. Ned. Akad. Van. Wet. A, 53, 386–392, 521–525, 1397–1412, 1950.
Trenberth, K. E. and Fasullo, J. T.: Global warming due to increasing absorbed solar radiation, Geophys. Res. Lett., 36, L07706, https://doi.org/10.1029/2009GL037527, 2009.
Urraca, R. and Gobron, N.: Temporal stability of long-term satellite and reanalysis products to monitor snow cover trends, The Cryosphere, 17, 1023–1052, https://doi.org/10.5194/tc-17-1023-2023, 2023.
Urraca, R., Huld, T., Gracia-Amillo, A., Martinez-de-Pison, F. J., Kaspar, F., and Sanz-Garcia, A.: Evaluation of global horizontal irradiance estimates from ERA5 and COSMO-REA6 reanalyses using ground and satellite-based data, Sol. Energy, 164, 339–354, https://doi.org/10.1016/j.solener.2018.02.059, 2018.
USNIC: IMS Daily Northern Hemisphere Snow and Ice Analysis at 1 km, 4 km, and 24 km Resolutions, Version 1, https://doi.org/10.7265/N52R3PMC, 2008.
Van Vliet, M. T. H., Van Beek, L. P. H., Eisner, S., Flörke, M., Wada, Y., and Bierkens, M. F. P.: Multi-model assessment of global hydropower and cooling water discharge potential under climate change, Glob. Environ. Change, 40, 156–170, https://doi.org/10.1016/j.gloenvcha.2016.07.007, 2016.
Xiaona, C., Shunlin, L., and Yaping, Y.: Differences in snow-induced radiative forcing estimated from satellite and reanalysis surface albedo datasets over the Northern Hemisphere landmass for the overlapping period of 1982–2012, Environ. Res. Commun., 2, 091001, https://doi.org/10.1088/2515-7620/abb3b8, 2020.