the Creative Commons Attribution 4.0 License.
the Creative Commons Attribution 4.0 License.
 | 27 Nov 2023
Signature of the stratosphere–troposphere coupling on recent record-breaking Antarctic sea-ice anomalies
Raúl R. Cordero
Sarah Feron
Alessandro Damiani
Pedro J. Llanillo
Jorge Carrasco
Alia L. Khan
Richard Bintanja
Zutao Ouyang
Gino Casassa
In February 2023, the sea-ice extent around Antarctica dropped to 1.79×10⁶ km2, setting a satellite-era record low for the second straight year. Recent records stress the need for further research into the factors behind record-breaking Antarctic sea-ice anomalies. By influencing the circumpolar westerly winds, the stratospheric polar vortex has played a major role in the Antarctic surface climate in recent decades. However, the footprint of the polar vortex variability in the year-to-year changes in the Antarctic sea-ice cover remains obscured. Here, we use satellite retrievals and reanalysis data to study the response of the sea-ice extent around Antarctica to changes in the polar vortex strength. We focus on the last 2 decades that saw sharp changes in the stratospheric zonal flow, the tropospheric westerly winds and the sea-ice cover (the latter climbed to record highs in 2013 and 2014 before dropping to record lows in 2017, 2022 and 2023). Our results suggest that this unprecedented interannual variability is noticeably influenced by the polar vortex dynamics. The signature of the stratosphere–troposphere coupling is apparent in recent records (highs and lows) in the sea-ice extent around Antarctica.
- Article
(7049 KB) - Full-text XML
-
Supplement
(2463 KB) - BibTeX
- EndNote


Sea ice plays an important role in the Earth's energy balance by reflecting the incoming solar radiation back to space and by regulating heat and gas exchanges between the ocean and the atmosphere (Hobbs et al., 2016). As a breeding habitat for marine biota, sea ice is also vital to coastal ecosystems in Antarctica (Wing et al., 2021).
Unlike the Arctic, where the sea-ice extent (SIE) has shown a steady decline since the start of satellite observations (Lannuzel et al., 2020), sea ice surrounding Antarctica has not demonstrated a clear trend. Sea-ice reconstructions from ice cores (Thomas et al., 2019; Dalaiden et al., 2021; Yang et al., 2021) and data assimilation (Fogt et al., 2022) suggest that the Antarctic SIE decreased throughout much of the early and middle 20th century before rebounding in the late 1970s. Ocean warming and increased ice-shelf melt in the Antarctic likely contributed to the period of sea-ice expansion that ended in 2014 (Bintanja et al., 2013).
The SIE in Antarctic waters climbed during most of the satellite era (the post-1979 period) to record highs before recently plummeting to record lows. Satellite observations detected record highs for winter SIE for 3 consecutive years, from 2012 to 2014 (Meehl et al., 2016; Reid and Massom, 2015). However, considerable losses in sea ice around Antarctica started to occur in 2016 and led to record lows in 2017 (Parkinson, 2019; Turner et al., 2017), 2022 (Turner et al., 2022; Raphael and Handcock, 2022) and 2023 (NSIDC, 2023). The enhanced interannual variability that led to recent sea-ice records (highs and lows) appears to be related to swift changes in the westerly winds that encircle Antarctica (e.g., Eayrs et al., 2021; Doddridge and Marshall, 2017).
A comparison with major climate indices shows that the long-term trends in the sea-ice cover are largely dominated by the changes in the Southern Annular Mode (SAM) (Yang et al., 2021), which describes the strength and position of the circumpolar westerly winds (Mo, 2000). The positive (negative) SAM phase is associated with the strengthening (weakening) and poleward (northward) migration of the westerly winds. While strengthened westerlies lead to northward sea-ice transport and expansion (Eayrs et al., 2021; Ferreira et al., 2015), they also facilitate heat advection from the subtropics that may result in sea-ice melting (Crosta et al., 2021). The trend toward positive values of the SAM index observed since the late 1950s (Marshall, 2003) has played a central role in the recent Antarctic mass redistributions (Medley and Thomas, 2019) and may have contributed to the expansion of the Antarctic sea-ice cover observed from 1979 to 2015 (Yang et al., 2021).
There is growing evidence suggesting that year-to-year changes in the sea-ice cover are determined by the variability of the circumpolar westerly winds (Eayrs et al., 2021; Doddridge et al., 2017). However, the processes that drive this variability are not fully understood. Through atmospheric teleconnections, changes in the South Pacific tropospheric circulation can be influenced by the positive (i.e., El Niño) and negative (i.e., La Niña) phases of the El Niño–Southern Oscillation (ENSO) (Fogt et al., 2011). Although they are not always concurrent, La Niña (El Niño) events coincide with positive (negative) phases of SAM more often than expected by chance (Fogt et al., 2011), which makes periods of strengthened westerlies more likely during La Niña (Eayrs et al., 2021).
The tropospheric westerly winds are also affected by the strength of the stratospheric polar vortex. The downward impact of weak (strong) polar vortex regimes was detected in the subsequent shift of the SAM index to its negative (positive) phase (Bergner et al., 2022; Thompson et al., 2005). The connection between polar vortex strength and surface climate can be long lasting too; a strong stratospheric polar vortex is often followed by strengthened tropospheric westerlies (i.e., positive SAM values) that can persist for months (Lim et al., 2018).
Among other factors, the strength of the polar vortex is influenced by the stratospheric ozone depletion (WMO, 2018). By affecting the polar vortex, the stratospheric ozone depletion has played an important role in modulating the tropospheric westerly winds (i.e., the SAM index). A cold (warm) and strengthened (disturbed) stratospheric polar vortex is associated with large (small) and long-lasting (short-lived) ozone holes (Cordero et al., 2022). The long-term trend toward positive values of the SAM index (Fig. S1a in the Supplement) has been partially attributed to the stratospheric ozone depletion that occurs over Antarctica every spring (Damiani et al., 2020; Polvani et al., 2011; Previdi and Polvani, 2014; Thompson et al., 2011). The pause (apparent in summertime only, Fig. S1b) in the long-term strengthening of the SAM has been credited to the success of the Montreal Protocol that banned human-made ozone-depleting substances (Banerjee et al., 2020).
Despite the well-established influence of the stratospheric polar vortex on the circumpolar westerly winds (i.e., the SAM phase), the footprint of the polar vortex variability in the year-to-year changes in the Antarctic sea-ice cover remains elusive. Here, we use existing satellite retrievals and reanalysis datasets to study the Antarctic SIE response to changes in the polar vortex strength. We focus on the last 2 decades that have seen sharp changes in the Antarctic polar vortex, the westerly winds and the sea-ice cover. Our results suggest that this unprecedented interannual variability can be noticeably influenced by the polar vortex dynamics.
Estimates of the SIE and sea-ice concentration (SIC) data from November 1978 to the present were obtained from the US National Snow and Ice Data Center Sea Ice Index (Fetterer et al., 2017). The SIE corresponds to the area where the sea-ice concentration equaled or exceeded 15 %. The data correspond to the platforms DMSP, DMSP 5D-3/F17, DMSP 5D-3/F18 and Nimbus-7 and the sensors SMMR, SSM/I and SSMIS.
Estimates of the SAM index were obtained from the Climate Prediction Center (National Weather Service, National Oceanic and Atmospheric Administration – NOAA). The SAM index is constructed by projecting the daily (00:00 Z) 700 mb height anomalies poleward of 20∘ S onto the loading pattern of the SAM (Mo, 2000). The loading pattern of the SAM is defined as the leading mode of empirical orthogonal function (EOF) analysis of monthly mean 700 hPa height during the 1979–2000 period.
Estimates of the near-surface wind speed, the near-surface temperature, the sea-level pressure (SLP) and the potential vorticity (PV) come from the atmospheric ERA5 produced by the European Centre for Medium-Range Weather Forecasts (ECMWF) (Hersbach et al., 2020). The PV is a conserved quantity that acts as a tracer for motion on an isentropic surface. Here, the vortex edge was defined by applying a K kg−1 m2 s−1 threshold to the potential vorticity (PV) on the 100 hPa pressure surface.
Estimates of the 45–75∘ S zonal mean zonal wind speed on the 100 hPa surface, the 60–90∘ S zonal mean zonal temperature on the 50 hPa surface, the ozone hole area and the polar vortex area on the 460 K isentropic surface are from the Modern-Era Retrospective analysis for Research and Applications, Version 2 (MERRA-2) assimilation (Gelaro et al., 2017). These domains (45–75∘ S and 60–90∘ S) are commonly used. The average east–west (zonal) wind speed for 45 to 75∘ S is near the peak of the polar jet maximum (NASA Ozone Watch, 2023a). This jet stream isolates air over Antarctica from air in the midlatitudes. The region poleward of this jet stream is called the Antarctic polar vortex (NASA Ozone Watch, 2023a). The 60–90∘ S zonal mean zonal temperature is the temperature averaged around the polar cap for latitudes south of 60∘ S (NASA Ozone Watch, 2023b). This is a good measure of the overall temperature in the polar vortex (NASA Ozone Watch, 2023b). The ozone hole area is determined from total ozone satellite measurements and corresponds to the region of ozone values below 220 Dobson units (DU) located south of 40∘ S; values below 220 DU represent anthropogenic ozone losses over Antarctica (NASA Ozone Watch, 2023c).
Daily estimates of all data were used. In each case, anomalies were calculated using a 30-year reference period from 1981 to 2010, excepting in the case of the ozone hole area. In the latter case, we excluded the last 2 decades of the last century, when accelerated growth of the ozone hole area masked changes in the interannual variability. Accordingly, anomalies in the ozone hole area were calculated using a 10-year reference period of 2001 through 2010. Please note that the use of both ERA5 and MERRA-2 datasets was intentional and illustrates the fact that our results do not depend on the used dataset. Unless otherwise noted, plots were generated using Python's Matplotlib library (Hunter, 2007).
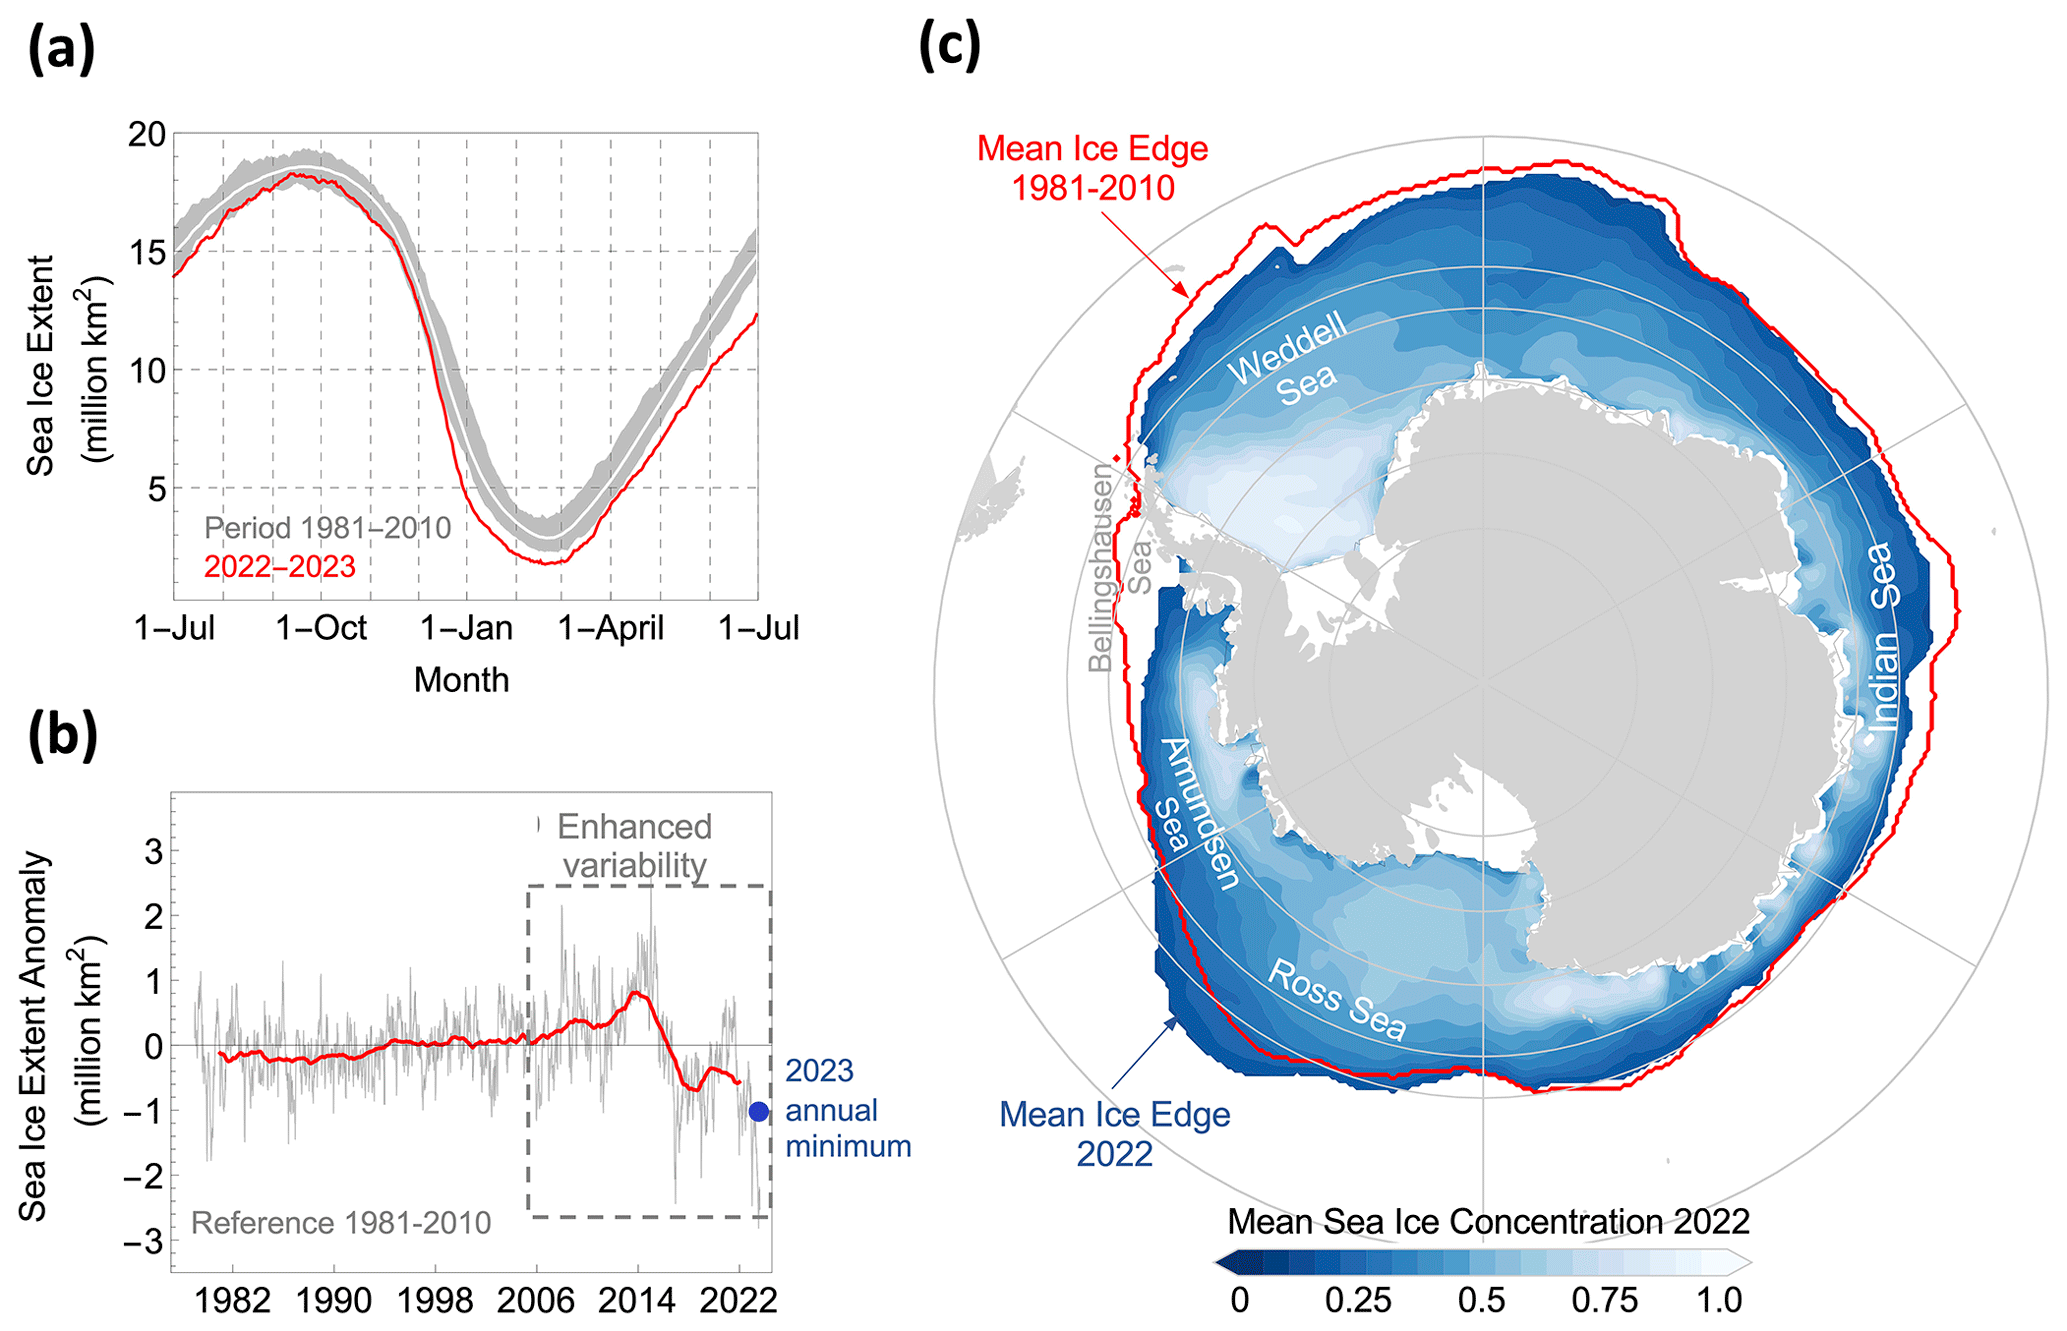
Figure 1The sea-ice extent (SIE) in Antarctic waters increased during most of the satellite era to record highs before recently dropping to record lows. (a) Daily SIE during the season for 2021–2022 (red line). The gray shading indicates the highest and lowest daily values measured over the period 1981–2010, while the white line indicates the mean over the same period. The Antarctic sea ice dropped to its lowest extent (as according to satellite records) in February 2022. (b) Daily SIE relative to the 1981–2010 mean. The bold red line shows the 4-year centered moving average. Satellite observations indicate record highs for winter SIE from 2012 to 2014. Record highs were followed by losses starting in 2016 and record annual minima in 2017 and 2022. The daily SIE anomalies exhibited an enhanced variability during the last 2 decades. (c) SIC values for 2022 and mean ice edge averaged over the period 1981–2010 (red line). The Antarctic SIE in 2022 was the lowest annual mean since the start of satellite observations.
3.1 Recent record
Antarctic sea-ice extent set a record low on 21 February 2023, reaching an annual minimum extent of 1.79×10⁶ km2 (Fig. 1a). This record low, 1.05×10⁶ km2 below the 1981 to 2010 average (Fig. 1b), was not the only record recently broken. In 2022, the Antarctic sea ice experienced its lowest annual mean extent since the start of satellite observations, surpassing the previous record low of 2017 (Figs. S2 and S3). As discussed elsewhere (e.g., Turner et al., 2022), annual minima may be determined by local atmospheric extremes operating on daily timescales (i.e., deep storms). However, low annual averages suggest the influence of persistent circulation anomalies associated with climate modes.
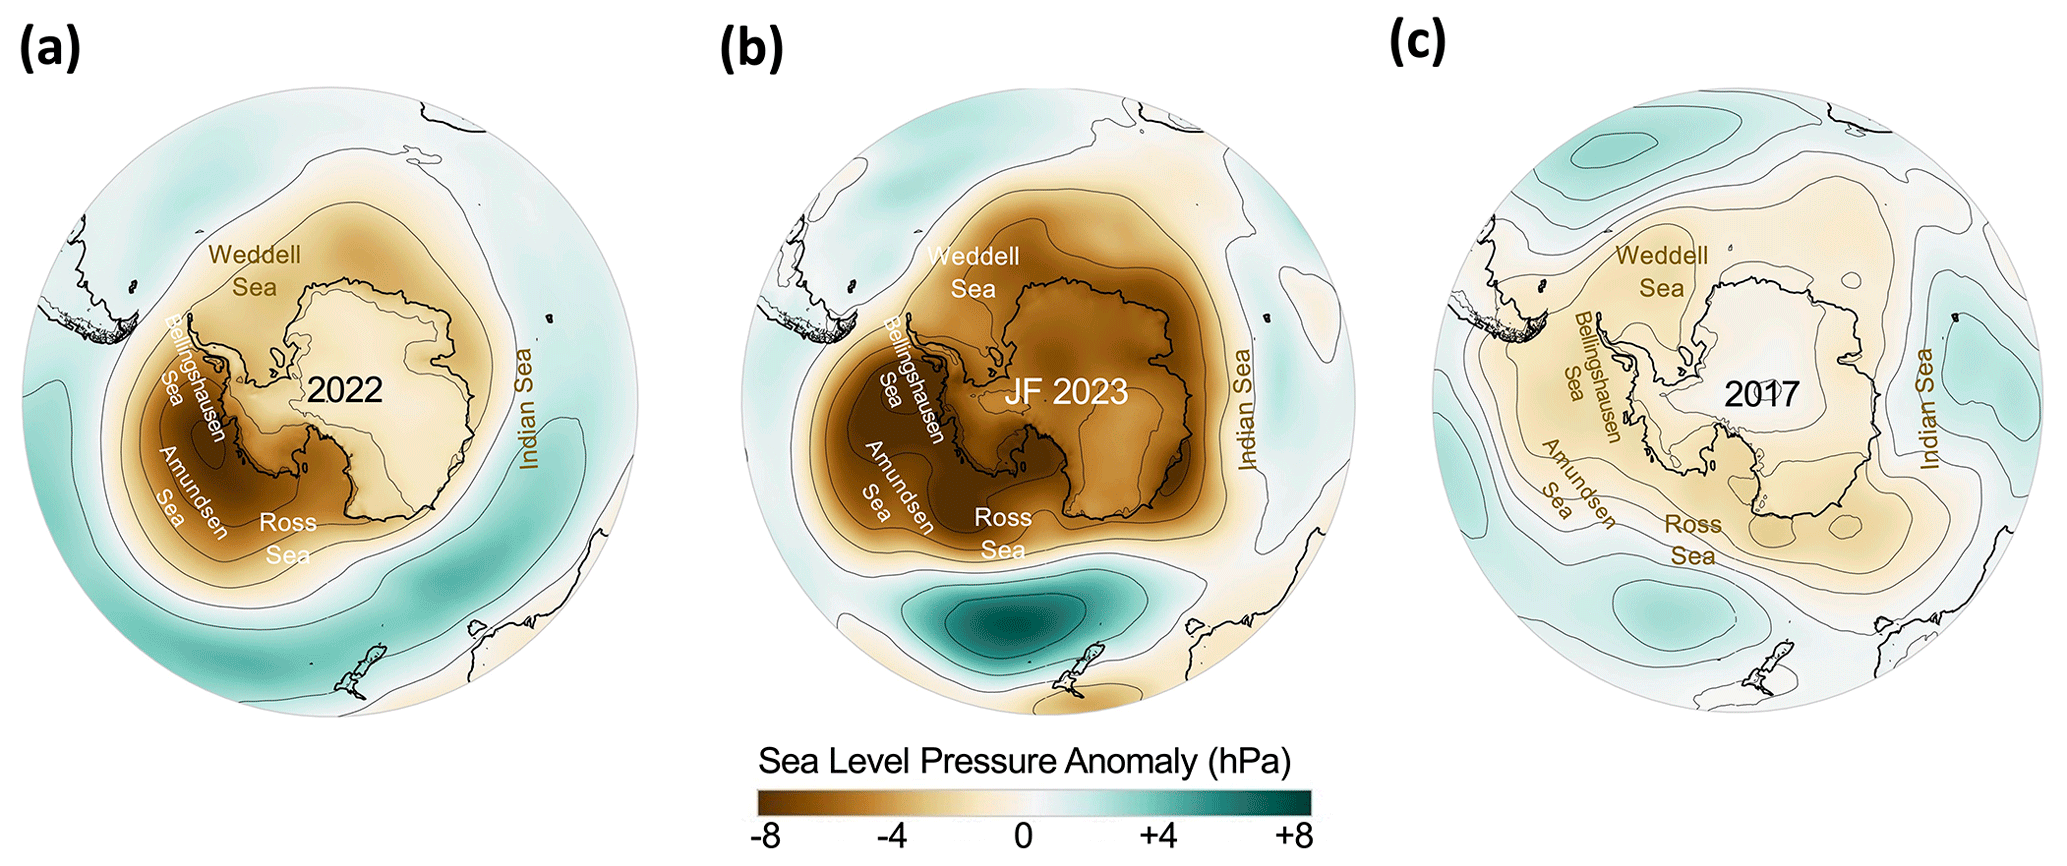
Figure 2Sea-level pressure anomalies relative to the 1981–2010 mean. (a) Annual anomalies for 2022, (b) annual anomalies for January–February 2023 and (c) annual anomalies for 2017. While the Amundsen Sea Low (ASL) reached record-low levels in 2022, it was close to the long-term average in 2017.
The most remarkable anomalies observed in 2022 (and also in early 2023) included SIC values well below long-term averages in the Bellingshausen–Amundsen Sea sector, which was in sharp contrast to positive sea-ice anomalies in the Ross Sea sector (Fig. 1c). This regional pattern is compatible with a strengthened Amundsen Sea Low (ASL), resulting from a high density of storms in the region southwest of the Antarctic Peninsula. The ASL deepened in 2022 (Fig. 2a) and remained strong in the summer of 2023 (Fig. 2b), which favored heat advection from the subtropics to the Antarctic Peninsula as well as the northward cold airflow from the Antarctic Plateau to the Ross Sea sector. The strengthened ASL seen throughout 2022 (Fig. 2a) likely contributed to the sea-ice negative (positive) anomalies in the Bellingshausen–Amundsen (Ross) Sea sector shown in Fig. 1c and to the extremely warm year at the northern tip of Antarctica. The strength of the north to northwesterly airflow down to the Antarctic Peninsula contributed to 2022 being the warmest year on record in this region (Fig. S4).
The record-low SIE seen in the melt season of 2022–2023 was likely influenced by persistently positive SAM values and by the return of La Niña. While La Niña makes the ASL stronger than average (Raphael et al., 2016), a positive SAM leads to the poleward displacement of the cyclone tracks, which in turn also reinforces the ASL (Clem et al., 2017). La Niña returned in 2022 for the third year in a row, and the mean annual SAM index ended 2022 with positive values for the third year in a row. In fact, the SAM index exhibited the highest spring average since 2008 in 2022 (Fig. S1c). Through their effect on the ASL, both factors (La Niña and a positive phase of the SAM) likely affected the amount and meridional extent of sea ice in the Bellingshausen Sea and Ross Sea sectors.
The strengthened ASL, which played a major role in the 2022–2023 records, was not a factor in 2017, when the Antarctic sea ice experienced its now second-lowest annual mean extent. While the ASL reached nearly record-low levels in 2022 (Fig. 2a), it was close to the long-term average in 2017 (Fig. 2c). The differences in the ASL (deeper in 2022 than in 2017) probably contributed to the considerably different regional patterns between the 2017 and 2022 SIE anomalies (Fig. S3). Despite these different regional patterns, as we discuss in the next section, both the 2017 and 2022 SIE anomalies were likely influenced by strengthened tropospheric westerlies associated with persistently positive SAM values.
3.2 Recent records seen in context
The record-breaking positive and negative anomalies in the sea ice during the last 2 decades are a sign of enhanced temporal variability around Antarctica (Fig. 1b). In a few years, the Antarctic annual mean SIE climbed to record highs (from 2012 to 2014) before dropping to record lows (in 2017, 2022 and 2023). Taken as a measure of the variability, the standard deviation of the SIE anomalies (Fig. 1b) climbed by about 75 %, from 0.4×10⁶ km2 over the period 1979–2002 to 0.7×10⁶ km2 over the period 2003–2022. This enhanced variability could be related to swift changes in the tropospheric westerly winds (e.g., Eayrs et al., 2021; Doddridge and Marshall, 2017). Although mostly focused on the austral summer, the influence of the SAM and the westerly winds on the SIE has also been underlined in prior efforts (e.g., Eayrs et al., 2021; Doddridge and Marshall, 2017).
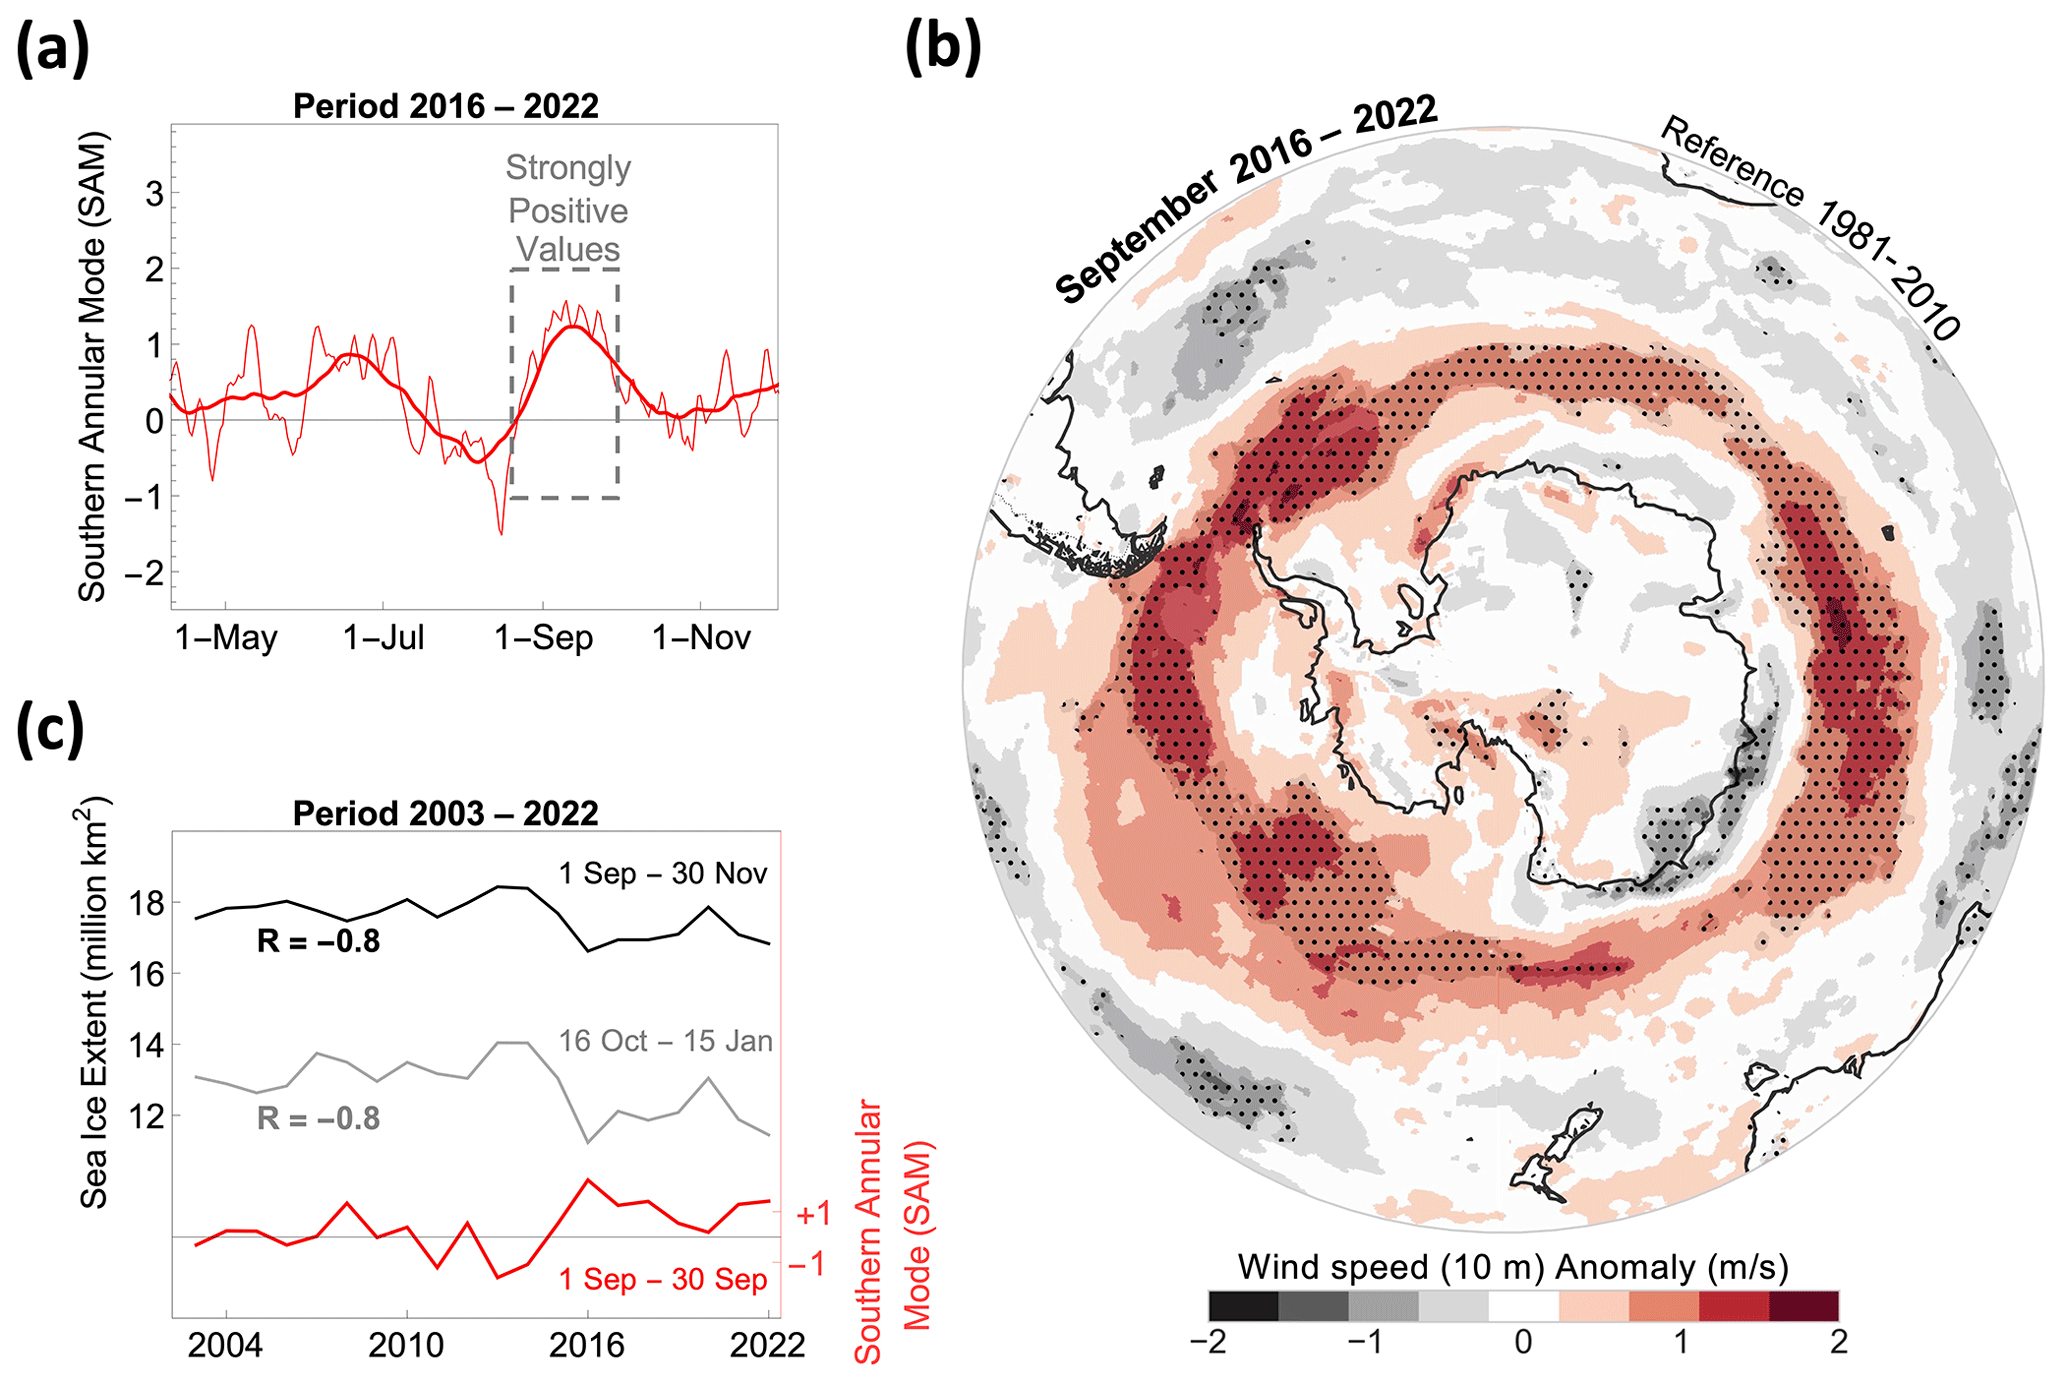
Figure 3The strength of the westerly winds in early spring plays a major role in the sea-ice retreat during the melt season. (a) Daily estimates of the Southern Annular Mode (SAM) index averaged over the period 2016–2022 (thin red line). The bold red line shows the 30 d centered moving mean. Over the period 2016–2022, the SAM index exhibited strongly positive values in early spring (September). (b) Average near-surface wind speed for September 2016–2022, relative to the 1981–2010 mean. The strengthened westerly winds around Antarctica in early spring (September) over the period 2016–2022 are consistent with the strongly positive values of the SAM index shown in panel (a). Stippling indicates regions where the wind speed anomalies are considered to be significant according to the Welch t test. (c) Progress of the SAM index averaged from 1 September to 30 September (red line), and the SIE averaged from 1 September to 30 November (black line) and from 16 October to 15 January (gray line). The high correlation () between the SAM index in September and the SIE during the melt season suggests that the strength of the westerly winds in early spring can precondition the sea-ice retreat several months in advance.
The significant losses in the SIE that started to occur around Antarctica in 2016 coincided with remarkably strong tropospheric westerly winds in early spring. The strengthened westerly winds around Antarctica are associated with the positive phase of the SAM, whose index often exhibited positive strong values in early winter over the period 2004–2016 (Fig. S1f) and in early spring over the period 2016–2022 (Figs. 3a and S5). The recent springtime positive values of the SAM index may be related to the prevailing ENSO phase. Although they are not always concurrent, positive phases of the SAM are more likely during La Niña (Fogt et al., 2011), which showed up four times over the period 2016–2022 (in 2018 and from 2020 to 2022).
Over the period 2016–2022, the average near-surface wind speed for September showed strong positive anomalies around Antarctica, which were particularly large along the northern limit of the Bellingshausen Sea (Fig. 3b). These anomalies are consistent with a strengthened ASL. Although the ASL has deepened since the mid-20th century (Dalaiden et al., 2022), the recurrent La Niña events, along with persistently positive SAM values, likely contributed to strengthening it further over the period 2016–2022. The strong positive wind speed anomalies for September 2016–2022 (Fig. 3b) are in sharp contrast with the slightly negative anomalies for September 2007–2015 (Fig. S6). Note that over the period 2007–2015, the sea-ice cover appeared to be expanding.
Time series of the SAM index and the SIE during the last 2 decades suggest that the strength of the westerly winds in early spring drives the subsequent sea-ice retreat. Figure 3c shows that strong (weak) near-surface westerly winds in September have often preceded negative (positive) anomalies in the SIE in spring and early summer. The strong correlation between the SAM index in September and SIE during the melt season (Fig. 3c) provides predictability of sea-ice cover, several months in advance. These results add evidence that there is a high degree of inter-seasonal persistence in the sea-ice retreat or advance (Stammerjohn et al., 2008) and that atmospheric circulation anomalies in spring can precondition sea-ice melt well ahead of the annual minimum (Holland et al., 2018).
Although Fig. 3c suggests that strengthened westerlies in early spring may contribute to sea-ice retreat, prior efforts have shown that the effect of strong westerlies in early winter may be the opposite and result in sea-ice expansion. In late spring and early summer, stronger winds associated with a positive SAM can lead to the poleward displacement of cyclone tracks, which may enable storms to accelerate sea-ice losses (Turner et al., 2022). However, in winter, stronger winds associated with a positive SAM can drive sea-ice expansion by pushing sea ice away from the Antarctic continent and bringing cold surface waters northwards (Eayrs et al., 2021). This is why a positive phase of the SAM has been previously associated with the sea-ice expansion (Yang et al., 2021; Ferreira et al., 2015; Lefebvre and Goosse, 2008) that led to record highs for winter SIE in 2013 and 2014 (Meehl et al., 2016; Reid and Massom, 2015).
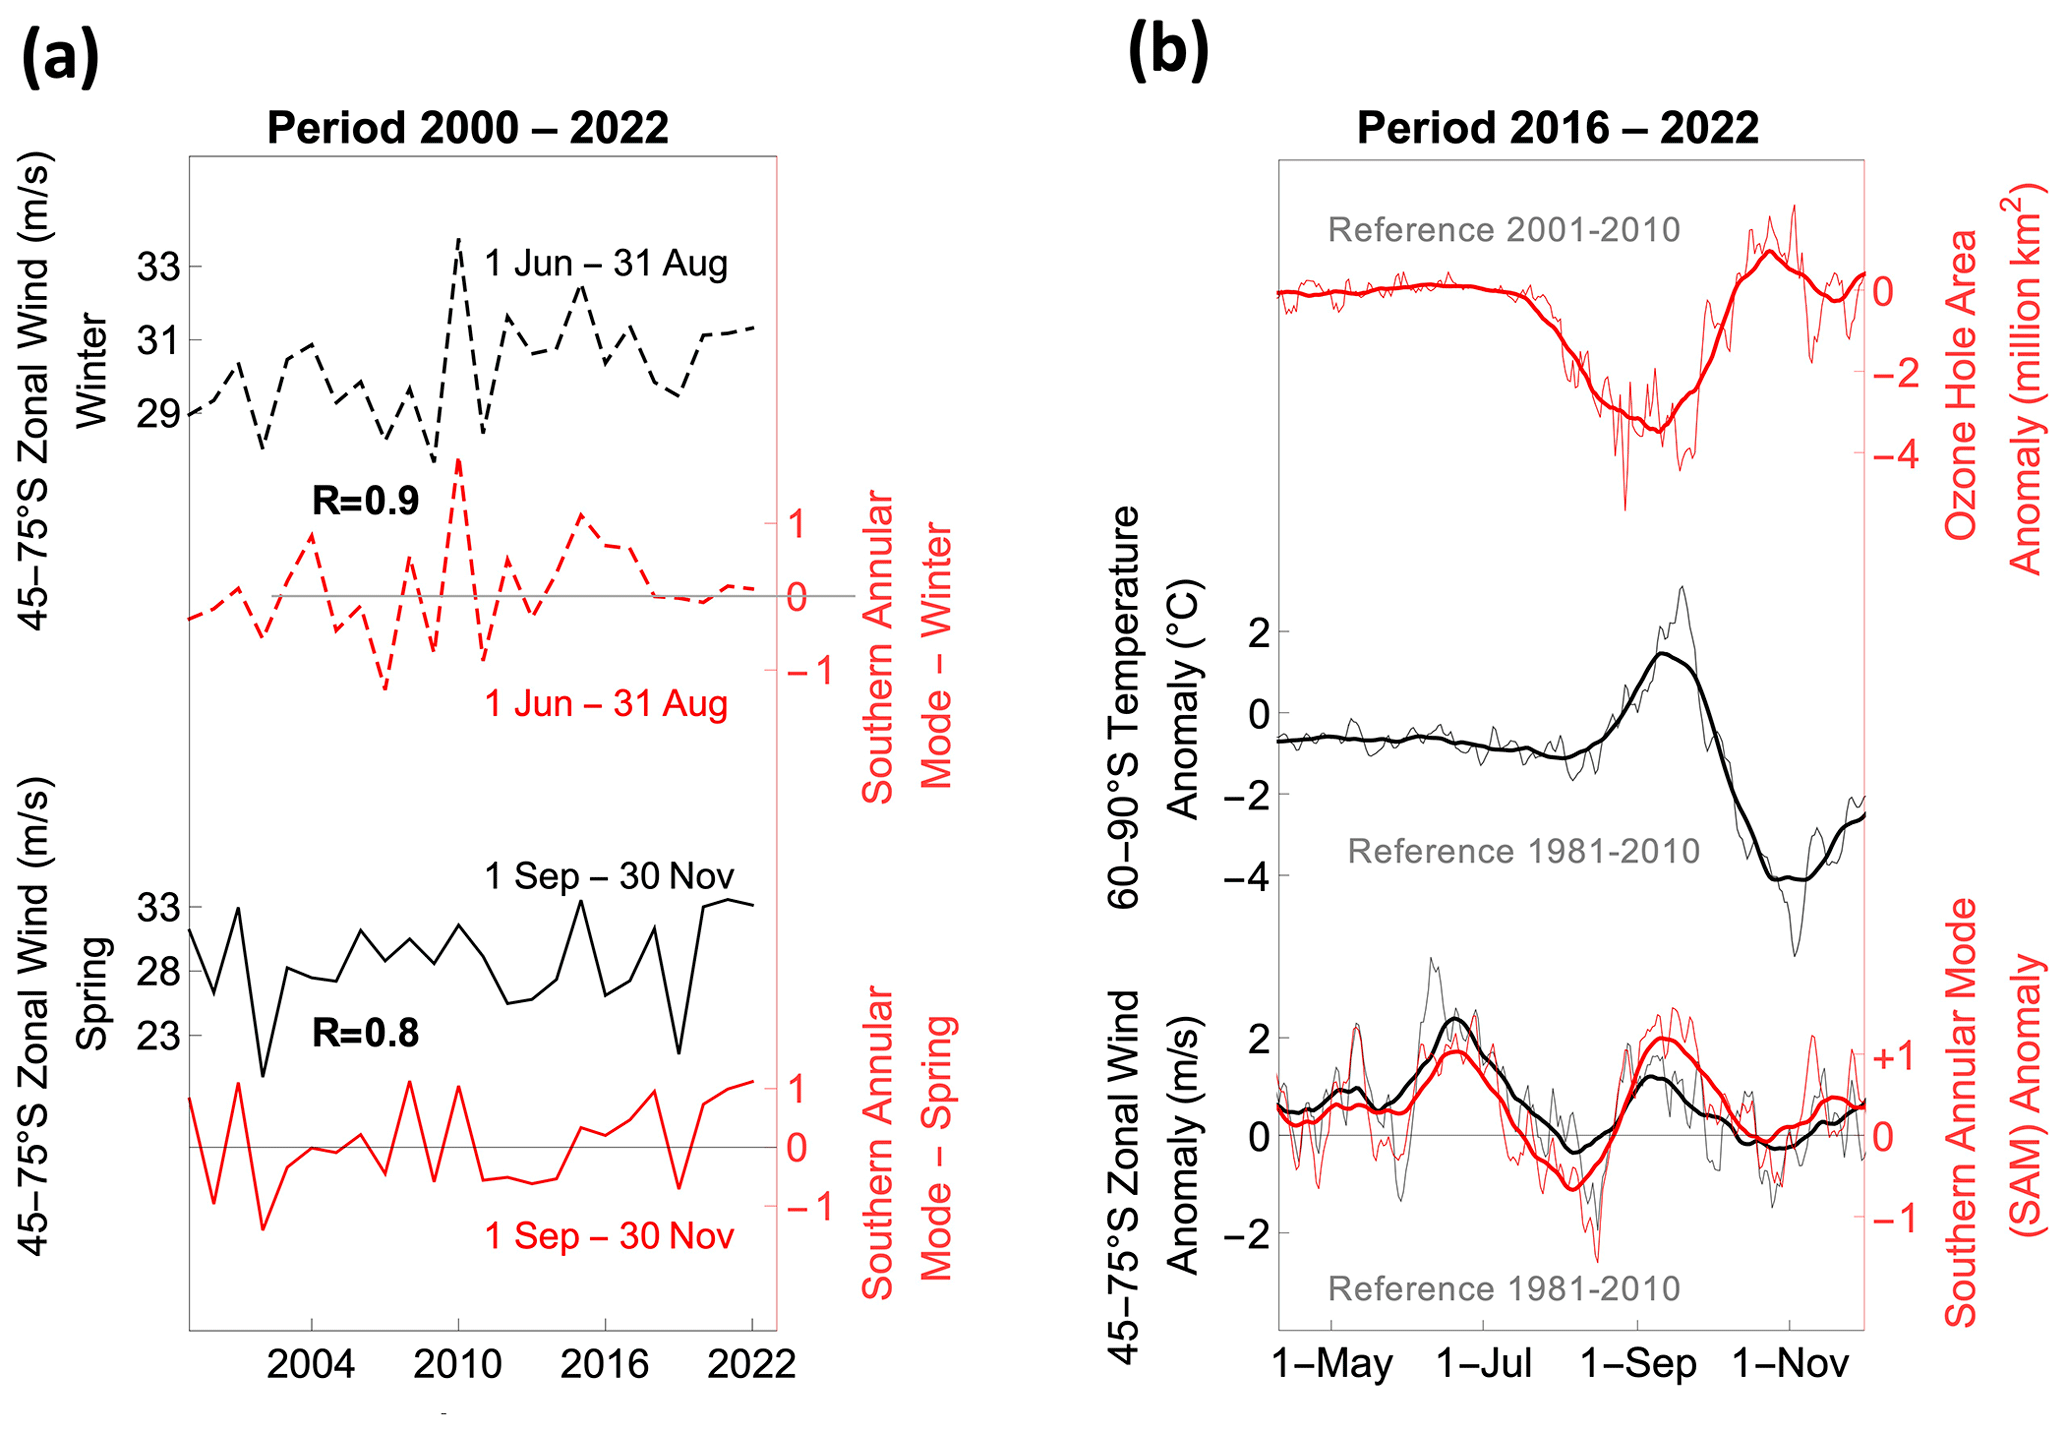
Figure 4Quasi-simultaneous stratospheric and tropospheric anomalies denote a robust stratosphere–troposphere coupling. (a) Spring and winter averages of the SAM index (red line) and of the 45–75∘ S zonal mean zonal wind speed on the 100 hPa surface (black line). The former depends on the tropospheric westerly winds, while the latter is associated with the strength of the polar jet. The correlation coefficients (R) between the SAM index and the stratospheric wind speed are also shown in the plot. (b) Departures from the average Southern Annular Mode (SAM) index (red line, lower panel), 45–75∘ S zonal mean zonal wind speed on the 100 hPa surface (black line, lower panel), 60–90∘ S zonal mean zonal temperature on the 50 hPa surface (black line, middle panel) and ozone hole area (red line, upper panel). The thin lines show daily anomalies averaged over the period 2016–2022, while the bold lines show the 30 d centered moving mean. Anomalies are relative to the 1981–2010 mean, except for the ozone hole area anomalies that are relative to the 2001–2010 mean.
3.3 Stratosphere–troposphere coupling
The tropospheric westerly winds are influenced by the strength of the stratospheric polar vortex, which in turn is related to the wind speeds in the polar-front jet stream (the polar vortex is the region poleward of the jet). Attributable to this stratosphere–troposphere coupling, when the polar vortex is colder and stronger than usual, the near-surface westerly winds encircling Antarctica strengthen, and the SAM index becomes persistently positive (Bergner et al., 2022; Thompson et al., 2005). By contrast, a weak and relatively warm polar vortex is associated with weaker westerly winds around Antarctica and negative phases of the SAM index (Bergner et al., 2022; Thompson et al., 2005). As a result, there is a robust correlation (R>0.8) in winter and in spring between the SAM index and the 45–75∘ S zonal mean zonal wind speed on the 100 hPa surface (Fig. 4a). The SAM index is also correlated in spring () with the 60–90∘ S zonal mean zonal temperature on the 50 hPa surface and with both the polar vortex (R∼0.6) and the ozone hole area (R∼0.7) (Fig. S7).
The tropospheric westerly winds can also be influenced by the effect of the ozone hole on the strength of the stratospheric polar vortex (Damiani et al., 2020; Polvani et al., 2011; Previdi and Polvani, 2014; Thompson et al., 2011). Although the long-term trend in the ozone hole area depends on the amounts of ozone-depleting substances in the atmosphere (WMO, 2018), the interannual variability of the ozone hole area is largely governed by the strength of the polar vortex (Cordero et al., 2022). However, there is also a feedback loop between the strength of the polar vortex and the ozone hole (WMO, 2018). Since ozone is a greenhouse gas, its depletion has a cooling effect in the middle and upper stratosphere, which in turn reinforces the polar vortex and affects the tropospheric westerly winds. Roughly mirroring long-term changes in stratospheric temperature, the ozone hole area (the stratospheric temperature) increased (decreased) from the early 1980s until reaching its peak about 2 decades ago (Fig. S8). Although this trend is less clear in late spring, the ozone hole area (the stratospheric temperature) in early spring appears to be steadily declining (increasing) since the early 2000s due to the success of the Montreal Protocol (Cordero et al., 2022).
The stratosphere–troposphere coupling is apparent from the quasi-simultaneous changes in the tropospheric westerly winds and the stratospheric jet stream (Fig. 4b; the lower panel shows the departures from the average tropospheric SAM index and the stratospheric 45–75∘ S zonal mean zonal wind speed on the 100 hPa surface). As shown in Fig. 4b (lower panel), the considerable Antarctic sea-ice losses in recent years coincided with strong tropospheric westerly winds and a strengthened stratospheric jet stream in early spring (September). This suggests that the strong positive values of the SAM index around September over the period 2016–2022 were influenced by the strengthened jet, which in recent years often exhibited high values around September (Fig. S9). This strong polar vortex is likely one reason we have seen so many strongly positive SAM values for September in recent years (Fig. S5). The relatively strong stratospheric jet stream observed in early spring (September) since the mid-2010s is remarkable, considering that they occurred during the decade when the Antarctic ozone hole healing emerged (Solomon et al., 2016). Although the ozone depletion provided a considerable contribution to strengthening the jet stream in the 1980s and 1990s, the recent ozone healing has probably negated that contribution.
Due to the Antarctic ozone healing, the ozone holes (in early spring) have been relatively small in recent years. As shown in Fig. 4b (upper panel), the ozone hole area in early spring over the period 2016–2022 was on average up to 3×10⁶ km2 smaller than the 2001–2010 mean. The small early-spring ozone holes seen in recent years may have contributed to the concurrent positive anomalies in the stratospheric temperature. As shown in Fig. 4b (middle panel), the stratospheric temperature in early spring over the period 2016–2022 was on average up to 2 ∘C higher than the 1981–2010 mean. These relatively high stratospheric temperatures do not favor a strengthened polar vortex, suggesting that it is unlikely that the ozone depletion has provided a considerable contribution to the strong stratospheric jet stream (and in turn to the strengthened tropospheric westerlies) often seen in early spring since the mid-2010s.
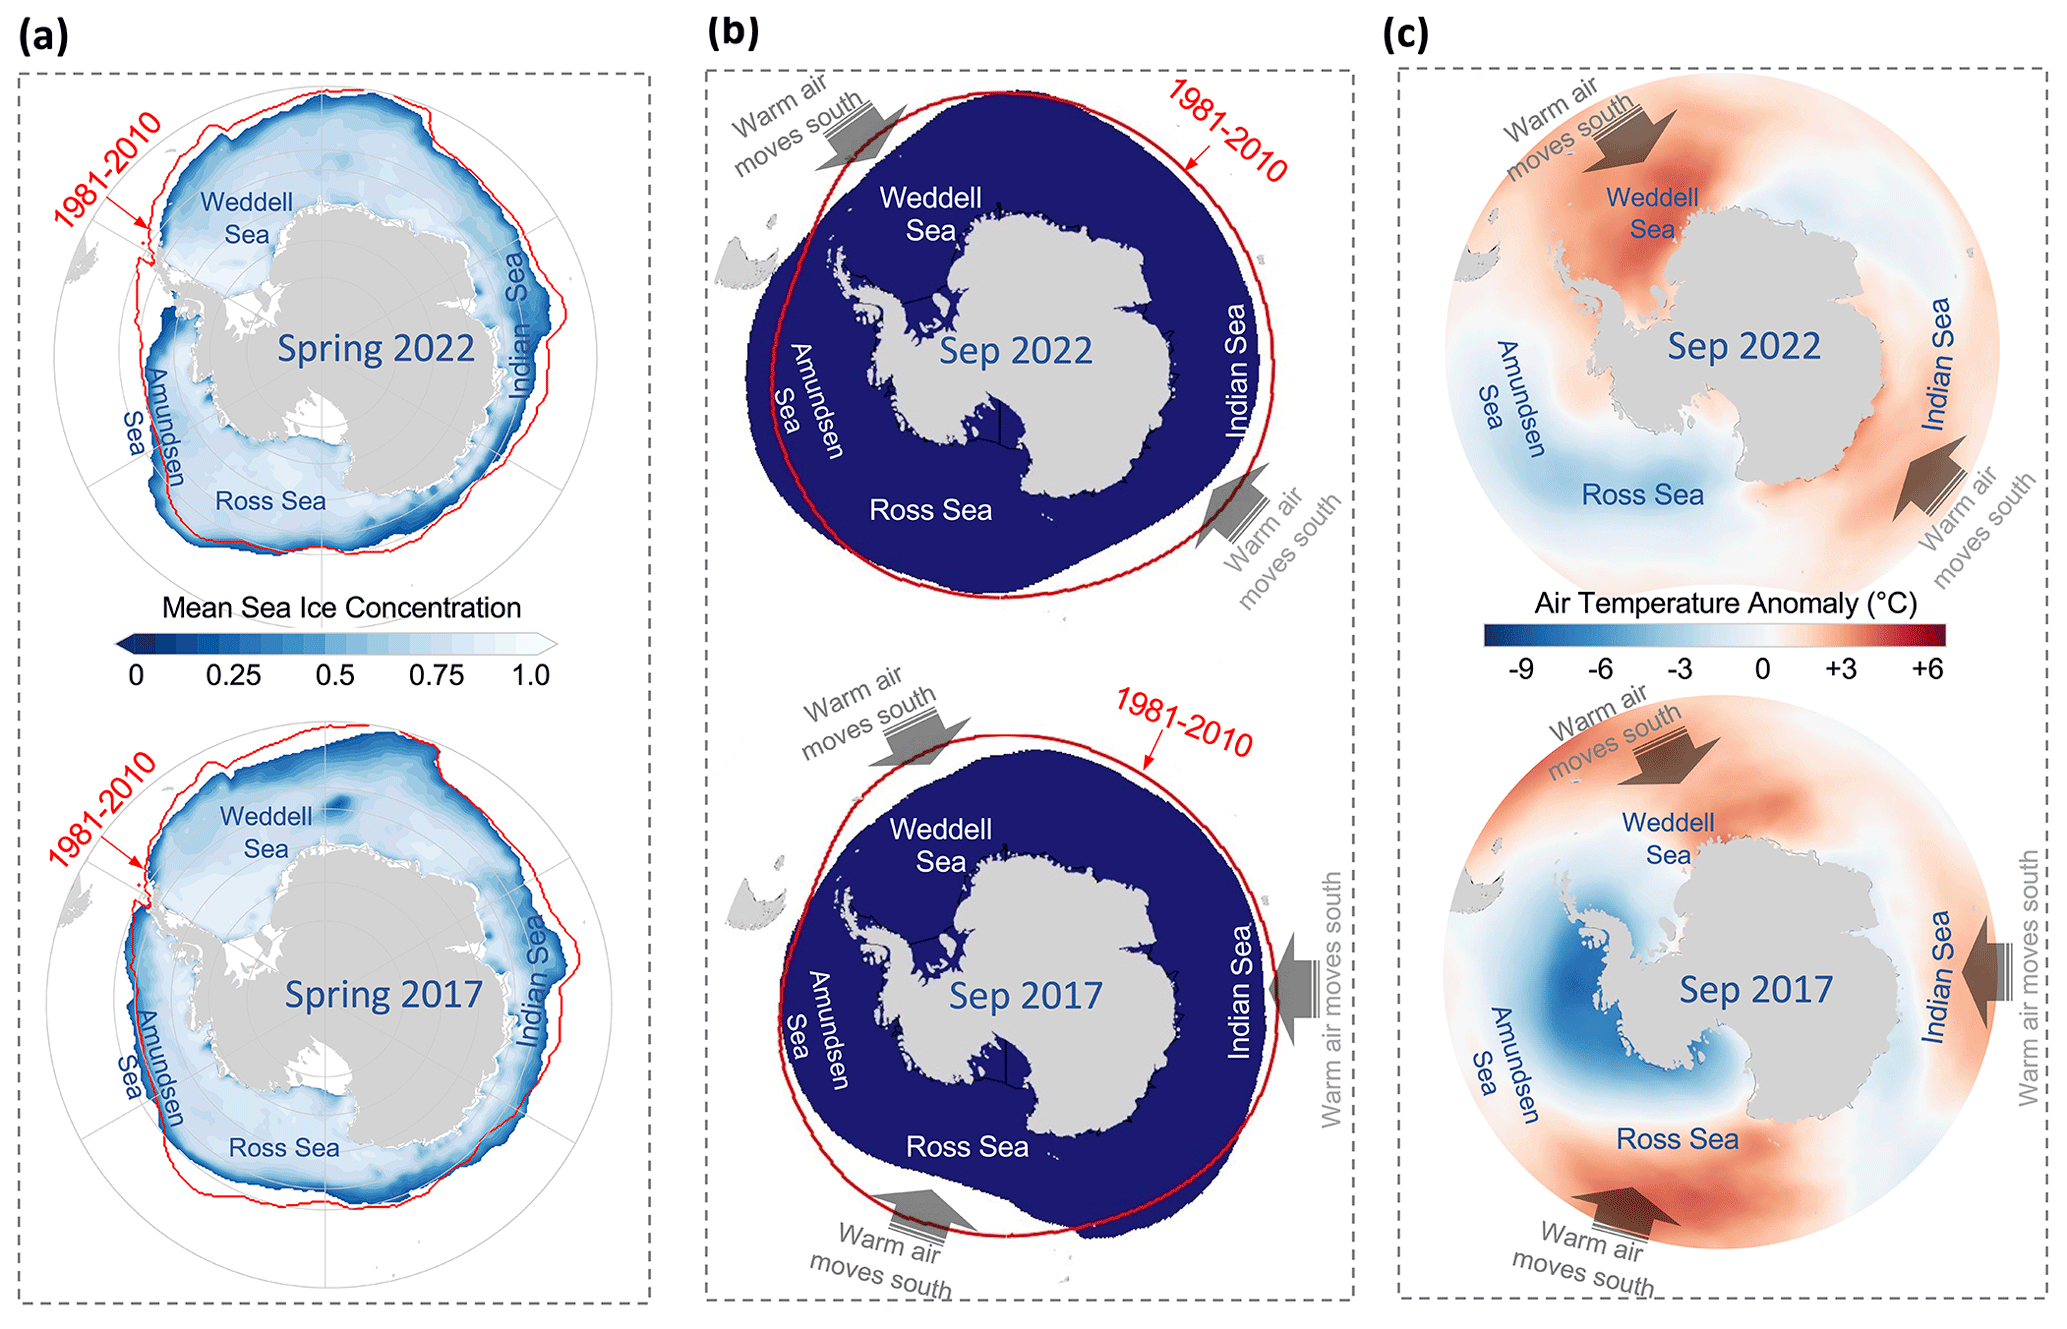
Figure 5The distinctive regional patterns associated with the springtime sea-ice anomalies are generally compatible with large-amplitude anomalies in the stratospheric zonal flow and with the tropospheric temperature anomalies. (a) SIC for spring 2022 (upper panel) and for spring 2017 (lower panel). The spring ice edge averaged over the period 1981–2010 is also shown (red line). Relative to 1981–2010 climatology, there are several anomalies apparent. For example, in spring 2022, negative anomalies occurred in the Weddell and Indian seas, whereas in spring 2017, negative anomalies appeared in the Weddell, Indian and Ross seas. (b) Polar vortex (100 hPa) for September 2022 (upper panel) and for September 2017 (lower panel). The September vortex edge averaged over the period 1981–2010 is also shown (red line). Relative to 1981–2010 climatology, there are several anomalies apparent. In early spring 2022, negative anomalies appeared in the Weddell and Indian seas. In early spring 2017, negative anomalies occurred in the Weddell, Indian and Ross seas. (c) Average air temperature (800 hPa) for September 2022 (upper panel) and for September 2017 (lower panel) relative to the 1981–2010 mean. PV anomalies (see panel (b)) likely played a role in the heat advection seen in the Weddell and Indian seas in early spring 2022 as well as in the heat advection seen in the Weddell, Indian and Ross seas in early spring 2017.
3.4 Shape-shifting vortex's effects
The strong polar vortex observed (especially in early spring) likely played a role in the Antarctic sea-ice losses that started to occur in 2016 and that included annual mean SIE record lows in 2017 and 2022 (Fig. S2a). Although these losses were of a comparable magnitude, they exhibited different regional patterns (Figs. 5a and S3). On a regional scale, the most remarkable differences between the springtime sea-ice anomalies seen in 2022 and 2017 occurred in the Ross and Bellingshausen–Amundsen seas. SIC values above long-term averages in the Ross Sea sector in spring 2022 (Fig. 5a, upper panel) were in sharp contrast to negative sea-ice anomalies in the same sector in spring 2017 (Fig. 5a, lower panel). Also, while SIC values were well below long-term averages in the Bellingshausen–Amundsen seas in spring 2022 (Fig. 5a, upper panel), fewer anomalies were apparent in the same sector in spring 2017 (Fig. 5a, lower panel). These regional differences are compatible with anomalies in the ASL (deeper in 2022 than in 2017, Fig. 2). Although the absolute depth of the ASL is strongly influenced by the SAM phase (Raphael et al., 2016), the SAM index exhibited comparable values in spring 2022 and in spring 2017 (Fig. S5). Differences between wind speeds in the polar-front jet stream were not substantial either. What exhibited considerable differences was the shape of the stratospheric polar vortex (Fig. 5b).
The distinctive regional patterns associated with the sea-ice anomalies shown in Fig. 5a are generally compatible with large-amplitude anomalies in the stratospheric zonal flow shown in Fig. 5b and with the low-level air temperature anomalies shown in Fig. 5c. Although roughly centered over Antarctica, the stratospheric polar vortex is often irregularly shaped with several regions where the cold air can shift northward and regions where the warm air can extend southward. Relative to the 1981–2010 climatology, the early-spring vortex (in 2022 and 2017) exhibited negative anomalies in both the Weddell and Indian seas (Fig. 5b). These negative anomalies allowed warm air to extend southward (Fig. 5c), likely contributing to the sea-ice retreat in these regions in springs 2017 and 2022 (Fig. 5a). As shown in Fig. 5b, the early-spring vortex exhibited slightly positive (negative) anomalies in 2022 (2017) in the Amundsen and Ross seas. These anomalies allowed cold air to dip northward (warm air to extend southward) in 2022 (2017), likely contributing to the sea-ice advance (retreat) in these sectors in spring 2022 (2017).
The shape-shifting polar vortex in early winter (June) may have also played a role in the regional anomalies associated with the wintertime sea ice (Fig. S10). Although the sea-ice extent reached record highs for winter in 2013 and 2014 (Meehl et al., 2016; Reid and Massom, 2015), modest negative anomalies were detected in the Weddell Sea sector in 2013 and along the northeastern Antarctic Peninsula in 2014 (Fig. S10a). These small anomalies concurred with regions where the irregularly shaped polar vortex enables warm air to extend southward (Fig. S10b). Coincidences between the polar vortex and the SIE anomalies also occurred in the Amundsen Sea sector in the winters of 2013 and 2014, where the polar vortex allowed cold air to shift northward, likely driving the sea-ice expansion in that sector (Fig. S10).
The coincidences noted above between the SIE anomalies and large-amplitude anomalies in the stratospheric zonal flow suggest that the stratospheric circulation influences the regional configuration of sea-ice advance and retreat. However, the available evidence is still far from being conclusive, because on the one hand the satellite records are limited, and on the other hand the year-to-year anomalies detected since the start of satellite observations have not been that large. Despite being unprecedented according to satellite data, record highs for winter SIE (in 2013 and 2014) and record lows for spring SIE (in 2017 and 2022) were relatively modest (about +8 % for winter records and about −7 % for spring records). As discussed in prior efforts (e.g., Turner et al., 2022), modest anomalies are subjected to the influence of local or regional circulation anomalies (including individual storms in the melt season). Yet, our results provide compelling evidence that further support the hypothesis that the polar vortex dynamics played a role in the recent satellite-era records (highs and lows).
The stratospheric polar vortex can lead to changes in the tropospheric circulation and impact the surface climate on a wide range of timescales. Here, we combine satellite retrievals and reanalysis datasets to study the role of the polar vortex variability in the year-to-year changes in the Antarctic sea-ice cover. First, we address the connection between the stratospheric polar vortex dynamics and tropospheric westerly winds. Second, we explore the Antarctic SIE response to changes in the strength of the westerly winds. Our results suggest that changes in the often-coupled stratospheric zonal flow and the tropospheric westerly winds have likely contributed to the recent satellite-era records (highs and lows) in the Antarctic sea ice.
We found a strong correlation between the strength of the tropospheric westerlies and the wind speeds in the polar-front jet stream (the polar vortex is the region poleward of the jet), which denotes a robust stratosphere–troposphere coupling. The quasi-simultaneous stratospheric and tropospheric anomalies seen in recent years over Antarctica underline the influence that the stratospheric circulation has on the interannual variability of the Antarctic surface climate. These results add to a growing body of evidence that suggests that stratospheric variability plays an important role in driving the near-surface climate (Lim et al., 2018; Byrne and Shepherd, 2018).
Due to the stratosphere–troposphere coupling, the strong stratospheric jet stream frequently seen around September in recent years has likely contributed to the strengthening of the tropospheric westerly winds around Antarctica. Changes in the westerlies have huge impacts on the Antarctic surface climate as the strength of the westerly winds drives the baffling rise and fall of sea-ice cover around Antarctica. While prior efforts have shown that strong westerlies lead to wintertime sea-ice expansion (e.g., Ferreira et al., 2015), our analyses suggest that strengthened westerlies may result in springtime sea-ice retreat. The significant SIE losses that started to occur around Antarctica in 2016 coincided with remarkably strong tropospheric westerly winds in early spring (see Fig. 3a).
We found that strong (weak) near-surface westerly winds in September have often preceded negative (positive) anomalies in the SIE in spring and early summer. The high correlation between the strength of the westerly winds in September and SIE during the melt season (see Fig. 3c) provides predictability of sea-ice cover for several months in advance. These results add to the evidence that there is a high degree of inter-seasonal persistence in the sea-ice retreat or advance (Stammerjohn et al., 2008) and that atmospheric circulation anomalies in spring can precondition the sea-ice melt well ahead of the annual minimum (Holland et al., 2018).
We also found that the footprint of the stratospheric circulation (i.e., the shape-shifting polar vortex) plays a role in the distinctive regional patterns associated with the recent record lows in the sea ice around Antarctica. The stratospheric polar vortex often exhibits regions where the cold air can shift northward (contributing to sea-ice advance) and regions where the warm air can extend southward (contributing to regional sea-ice retreat). Although we found that large-amplitude anomalies in the stratospheric zonal flow are generally compatible with the regional sea-ice advance and retreat, the influence of local or regional circulation anomalies, including individual storms, cannot be ruled out. Thus, as noted above, assessing the robustness of this connection requires a longer record.
Our results suggest that, by influencing the circumpolar tropospheric westerly winds, a strengthened polar vortex in early spring may have played a role in the recent satellite-era record lows in the sea ice around Antarctica. So, the following question arises: “what has caused the polar vortex to strengthen?” Although we cannot fully respond to this question, our analyses provide some clues. It seems probable that more than one factor was responsible. However, the ozone hole is unlikely to be one of them. The cooling signal associated with ozone depletion reinforced the vortex until the early 2000s, but this effect has started to reverse in the last 2 decades due to the onset of the ozone healing. Thus, the ozone hole probably is not contributing to the strong stratospheric jet stream seen in early spring (September) since the mid-2010s. After ruling out ozone depletion, the main drivers behind the early-spring strengthening of the polar vortex seen in recent years may be located in the tropics.
A number of studies have examined the year-to-year variability of the sea-ice cover and suggested that it is linked to a range of tropical forcing factors (Holland et al., 2017; Meehl et al., 2016; Stammerjohn et al., 2008). The ENSO influences the tropical atmospheric circulation, leading to large-scale planetary waves that affect the strength of the polar vortex (Kwon et al., 2020; WMO, 2018). However, our understanding of the processes that determine the interannual variability of the planetary-wave activity is still incomplete, and the effects of climate change in the ENSO are not clear. What is clear is that the recent changes in the Antarctic sea ice have been driven by a near-surface atmospheric circulation influenced by large-amplitude anomalies in the stratospheric zonal flow.
Since here we focused on the influence of atmospheric circulation anomalies on sea ice, further research is needed to explore the role of other competing drivers. For example, ocean warming and increased ice-shelf melt in Antarctica likely contributed to the period of sea-ice expansion that ended in 2014 (e.g., Bintanja et al., 2013). A recent modeling effort (Goosse et al., 2023) has suggested that the seasonal advance of sea ice is mostly controlled by the initial summer SIE and the insolation; in contrast, the seasonal retreat is controlled by atmospheric and oceanic feedbacks. We expect that the recent record-low extent, which is far below the previous record, will trigger cross-disciplinary studies and the international collaboration required to further explore how sea-ice processes and feedbacks between the ocean and atmosphere modulate the seasonal cycle of the Antarctic SIE.
Sea-ice extent (SIE) and sea-ice concentration (SIC) data are available at https://doi.org/10.7265/N5K072F8 (Fetterer et al., 2017).
Daily estimates of the SAM index are available at https://www.cpc.ncep.noaa.gov/products/precip/CWlink/daily_ao_index/aao/aao.shtml#publication (last access: 15 January 2023; Mo, 2000).
Data of the near-surface wind speed, the near-surface temperature, the sea-level pressure (SLP) and the potential vorticity (PV) are available at https://www.ecmwf.int/en/forecasts/datasets/reanalysis-datasets/era5 (last access: 15 January 2023; Hersbach et al., 2020).
Daily estimates of the 45–75∘ S zonal mean zonal wind speed, the 60–90∘ S zonal mean zonal temperature, the ozone hole area and the polar vortex area are available at https://gmao.gsfc.nasa.gov/reanalysis/MERRA-2/ (last access: 15 January 2023) (https://doi.org/10.5067/VJAFPLI1CSIV; Global Modeling and Assimilation Office, 2015).
The supplement related to this article is available online at: https://doi.org/10.5194/tc-17-4995-2023-supplement.
RRC and SF conceived and designed the experiments; RRC, AD, PJL, JC and SF analyzed the data; ALK and SF contributed materials and analysis tools; RRC, SF, AD, RB, ZO and GC contributed to writing (reviewing and editing); all authors have read and agreed to the published version of the paper.
The contact author has declared that none of the authors has any competing interests.
Publisher's note: Copernicus Publications remains neutral with regard to jurisdictional claims made in the text, published maps, institutional affiliations, or any other geographical representation in this paper. While Copernicus Publications makes every effort to include appropriate place names, the final responsibility lies with the authors.
We thank the Laboratory for Atmospheres at NASA's Goddard Space Flight Center, the European Centre for Medium-Range Weather Forecasts (ECMWF), and each of the satellite teams for the data access as well as all their hard work in producing the datasets. We also thank the researchers contributing to the National Snow and Ice Data Center Sea Ice Index.
This research has been supported by the Agencia Nacional de Investigación y Desarrollo (grant nos. ANILLO ACT210046 and FONDECYT 1231904) and the Institut chilien de l'Antarctique (grant no. RT_69-20).
This paper was edited by Christian Haas and reviewed by Christoph Kittel and two anonymous referees.
Banerjee, A., Fyfe, J. C., and Polvani, L. M.: A pause in Southern Hemisphere circulation trends due to the Montreal Protocol, Nature, 579, 544–548, https://doi.org/10.1038/s41586-020-2120-4, 2020.
Bergner, N., Friedel, M., Domeisen, D. I. V., Waugh, D., and Chiodo, G.: Exploring the link between austral stratospheric polar vortex anomalies and surface climate in chemistry-climate models, Atmos. Chem. Phys., 22, 13915–13934, https://doi.org/10.5194/acp-22-13915-2022, 2022.
Bintanja, R., van Oldenborgh, G. J., Drijfhout, S. S., Wouters, B., and Katsman, C. A.: Important role for ocean warming and increased ice-shelf melt in Antarctic sea-ice expansion, Nat. Geosci., 6, 376–379, https://doi.org/10.1038/ngeo1767, 2013.
Byrne, N. J. and Shepherd, T. G.: Seasonal persistence of circulation anomalies in the Southern Hemisphere stratosphere and its implications for the troposphere, J. Climate, 31, 3467–3483, https://doi.org/10.1175/JCLI-D-17-0557.1, 2018.
Clem, K. R., Renwick, J. A., and McGregor, J.: Large-scale forcing of the Amundsen Sea low and its influence on sea ice and West Antarctic temperature, J. Climate, 30, 8405–8424, https://doi.org/10.1175/JCLI-D-16-0891.1, 2017.
Cordero, R. R., Feron, S., Damiani, A., Redondas, A., Carrasco, J., Sepúlveda, E., and Seckmeyer, G.: Persistent extreme ultraviolet irradiance in Antarctica despite the ozone recovery onset, Sci. Rep., 12, 1266, https://doi.org/10.1038/s41598-022-05449-8, 2022.
Crosta, X., Etourneau, J., Orme, L. C., Dalaiden, Q., Campagne, P., Swingedouw, D., and Ikehara, M.: Multi-decadal trends in Antarctic sea-ice extent driven by ENSO–SAM over the last 2,000 years, Nat. Geosci., 14, 156–160, https://doi.org/10.1038/s41561-021-00697-1, 2021.
Dalaiden, Q., Goosse, H., Rezsohazy, J., and Thomas, E. R.: Reconstructing atmospheric circulation and sea-ice extent in the West Antarctic over the past 200 years using data assimilation, Clim. Dynam., 57, 3479–3503, https://doi.org/10.1007/s00382-021-05879-6, 2021.
Dalaiden, Q., Schurer, A. P., Kirchmeier-Young, M. C., Goosse, H., and Hegerl, G. C.: Antarctic Surface Climate Changes Since the Mid-20th Century Driven by Anthropogenic Forcing, Geophys. Res. Lett., 49, e2022GL099543, https://doi.org/10.1029/2022GL099543, 2022.
Damiani, A., Cordero, R. R., Llanillo, P. J., Feron, S., Boisier, J. P., Garreaud, R., and Watanabe, S.: Connection between Antarctic ozone and climate: Interannual precipitation changes in the Southern Hemisphere, Atmosphere, 11, 579, https://doi.org/10.3390/atmos11060579, 2020.
Doddridge, E. W. and Marshall, J.: Modulation of the seasonal cycle of Antarctic sea ice extent related to the Southern Annular Mode, Geophys. Res. Lett., 44, 9761–9768, https://doi.org/10.1002/2017GL074319, 2017.
Eayrs, C., Li, X., Raphael, M. N., and Holland, D. M.: Rapid decline in Antarctic sea ice in recent years hints at future change, Nat. Geosci., 14, 460–464, https://doi.org/10.1038/s41561-021-00768-3, 2021.
Ferreira, D., Marshall, J., Bitz, C. M., Solomon, S., and Plumb, A.: Antarctic Ocean and sea ice response to ozone depletion: A two-time-scale problem, J. Climate, 28, 1206–1226 https://doi.org/10.1175/JCLI-D-14-00313.1, 2015.
Fetterer, F., Knowles, K., Meier, W. N., Savoie, M., and Windnagel, A. K.: Sea Ice Index, Version 3, Boulder, Colorado USA. National Snow and Ice Data Center [data set], https://doi.org/10.7265/N5K072F8, 2017.
Fogt, R. L., Bromwich, D. H., and Hines, K. M.: Understanding the SAM influence on the South Pacific ENSO teleconnection, Clim. Dynam., 36, 1555–1576, https://doi.org/10.1007/s00382-010-0905-0, 2011.
Fogt, R. L., Sleinkofer, A. M., Raphael, M. N., and Handcock, M. S.: A regime shift in seasonal total Antarctic sea ice extent in the twentieth century, Nat. Clim. Change, 12, 54–62, https://doi.org/10.1038/s41558-021-01254-9, 2022.
Gelaro, R., McCarty, W., Suárez, M. J., Todling, R., Molod, A., Takacs, L., and Zhao, B.: The modern-era retrospective analysis for research and applications, version 2 (MERRA-2), J. Climate, 30, 5419–5454, https://doi.org/10.1175/JCLI-D-16-0758.1, 2017.
Global Modeling and Assimilation Office (GMAO): inst3_3d_asm_Cp: MERRA-2 3D IAU State, Meteorology Instantaneous 3-hourly (p-coord, 0.625x0.5L42), version 5.12.4, Greenbelt, MD, USA: Goddard Space Flight Center Distributed Active Archive Center (GSFC DAAC) [data set], https://doi.org/10.5067/VJAFPLI1CSIV, 2015.
Goosse, H., Allende Contador, S., Bitz, C. M., Blanchard-Wrigglesworth, E., Eayrs, C., Fichefet, T., Himmich, K., Huot, P.-V., Klein, F., Marchi, S., Massonnet, F., Mezzina, B., Pelletier, C., Roach, L., Vancoppenolle, M., and van Lipzig, N. P. M.: Modulation of the seasonal cycle of the Antarctic sea ice extent by sea ice processes and feedbacks with the ocean and the atmosphere, The Cryosphere, 17, 407–425, https://doi.org/10.5194/tc-17-407-2023, 2023.
Hersbach, H., Bell, B., Berrisford, P., Hirahara, S., Horányi, A., Muñoz-Sabater, J., and Thépaut, J. N.: The ERA5 global reanalysis, Q. J. Roy. Meteor., 146, 1999–2049, https://doi.org/10.1002/qj.3803, 2020 (data available at: https://www.ecmwf.int/en/forecasts/datasets/reanalysis-datasets/era5, last access: 15 January 2023).
Hobbs, W. R., Massom, R., Stammerjohn, S., Reid, P., Williams, G., and Meier, W.: A review of recent changes in Southern Ocean sea ice, their drivers and forcings, Glob. Planet. Change, 143, 228–250, https://doi.org/10.1016/j.gloplacha.2016.06.008, 2016.
Holland, M. M., Landrum, M., L., Raphael, M., and Stammerjohn, S.: Springtime winds drive Ross Sea ice variability and change in the following autumn, Nat. Commun., 8, 731, https://doi.org/10.1038/s41467-017-00820-0, 2017.
Holland, M. M., Landrum, L., Raphael, M. N., and Kwok, R.: The regional, seasonal, and lagged influence of the Amundsen Sea Low on Antarctic sea ice, Geophys. Res. Lett., 45(20), 11227–11234, https://doi.org/10.1029/2018GL080140, 2018.
Hunter, J. D.: Matplotlib: A 2D graphics environment, Comput. Sci. Eng., 9, 90–95 https://doi.org/10.1109/MCSE.2007.55, 2007.
Kwon, H., Choi, H., Kim, B. M., Kim, S. W., and Kim, S. J.: Recent weakening of the southern stratospheric polar vortex and its impact on the surface climate over Antarctica, Environ. Res. Lett., 15, 094072, https://doi.org/10.1088/1748-9326/ab9d3d, 2020.
Lannuzel, D., Tedesco, L., Van Leeuwe, M., Campbell, K., Flores, H., Delille, B., and Wongpan, P.: The future of Arctic sea-ice biogeochemistry and ice-associated ecosystems, Nat. Clim. Change, 10, 983–992, https://doi.org/10.1038/s41558-020-00940-4, 2020.
Lefebvre, W. and Goosse, H.: Analysis of the projected regional sea-ice changes in the Southern Ocean during the twenty-first century, Clim. Dynam., 30, 59–76, https://doi.org/10.1007/s00382-007-0273-6, 2008.
Lim, E. P., Hendon, H. H., and Thompson, D. W. J.: Seasonal evolution of stratosphere-troposphere coupling in the Southern Hemisphere and implications for the predictability of surface climate, J. Geophys. Res.-Atmos., 123, 12-002, https://doi.org/10.1029/2018JD029321, 2018.
Marshall, G. J.: Trends in the Southern Annular Mode from observations and reanalyses, J. Climate, 16, 4134–4143, https://doi.org/10.1175/1520-0442(2003)016<4134:TITSAM>2.0.CO;2, 2003.
Medley, B. and Thomas, E. R.: Increased snowfall over the Antarctic Ice Sheet mitigated twentieth-century sea-level rise, Nat. Clim. Change, 9, 34–39, https://doi.org/10.1038/s41558-018-0356-x, 2019.
Meehl, G. A., Arblaster, J. M., Bitz, C. M., Chung, C. T., and Teng, H.: Antarctic sea-ice expansion between 2000 and 2014 driven by tropical Pacific decadal climate variability, Nat. Geosci., 9, 590–595, https://doi.org/10.1038/ngeo2751, 2016.
Mo, K. C.: Relationships between Low-Frequency Variability in the Southern Hemisphere and Sea Surface Temperature Anomalies, J. Climate, 13, 3599–3610 https://doi.org/10.1175/1520-0442(2000)013<3599:RBLFVI>2.0.CO;2, 2000 (data available at: https://www.cpc.ncep.noaa.gov/products/precip/CWlink/daily_ao_index/aao/aao.shtml#publication, last access: 15 January 2023).
NASA Ozone Watch: Antarctic MERRA-2 Wind, last updated: 3 January 2023, https://ozonewatch.gsfc.nasa.gov/meteorology/wind_2022_MERRA2_SH.html (last access: 12 August 2023), 2023a.
NASA Ozone Watch: Antarctic MERRA-2 Wind, last updated: 12 August 2023, https://ozonewatch.gsfc.nasa.gov/meteorology/temp_2023_MERRA2_SH.html (last access: 12 August 2023), 2023b.
NASA Ozone Watch:, Antarctic MERRA-2 Wind, last updated: 12 August 2023, https://ozonewatch.gsfc.nasa.gov/meteorology/SH.html (last access: 12 August 2023), 2023c.
NSIDC – National Snow and Ice Data Center. Antarctic sea ice minimum settles on record low extent again, last updated: 27 February 2023, https://nsidc.org/arcticseaicenews/2023/02/antarctic-sea-ice-minimum-settles-on-record-low-extent-again/, last access: 12 August 2023, 2023.
Parkinson, C. L.: A 40-y record reveals gradual Antarctic sea ice increases followed by decreases at rates far exceeding the rates seen in the Arctic, P. Natl Acad. Sci. USA, 116, 14414–14423, https://doi.org/10.1073/pnas.1906556116, 2019.
Polvani, L. M., Waugh, D. W., Correa, G. J. P., and Son, S-W.: Stratospheric ozone depletion: The main driver of 20th century atmospheric circulation changes in the Southern Hemisphere, J. Climate, 24, 795–812, https://doi.org/10.1175/2010JCLI3772.1, 2011.
Previdi, M. and Polvani, L. M.: Climate system response to stratospheric ozone depletion and recovery, Q. J. Roy. Meteor. Soc., 140, 2401–2419, https://doi.org/10.1002/qj.2330, 2014.
Raphael, M. N. and Handcock, M. S.: A new record minimum for Antarctic sea ice, Nat. Rev. Earth Environ., 3, 215–216, https://doi.org/10.1038/s43017-022-00281-0, 2022.
Raphael, M. N., Marshall, G. J., Turner, J., Fogt, R. L., Schneider, D., Dixon, D. A., and Hobbs, W. R.: The Amundsen sea low: variability, change, and impact on Antarctic climate, B. Am. Meteorol. Soc., 97, 111–121, https://doi.org/10.1175/BAMS-D-14-00018.1, 2016.
Reid, P. and Massom, R. A.: State of the Climate in 2014, edited by: Blunden, J. and Arndt, D. S., Spec. Suppl. B. Am. Meteorol. Soc., 96, S163–S164, https://doi.org/10.1175/BAMS-D-15-00093.1, 2015.
Solomon, S., Ivy, D. J., Kinnison, D., Mills, M. J., Neely III, R. R., and Schmidt, A.: Emergence of healing in the Antarctic ozone layer, Science, 353, 269–274, https://doi.org/10.1126/science.aae0061, 2016.
Stammerjohn, S. E., Martinson, D. G., Smith, R. C., Yuan, X., and Rind, D.: Trends in Antarctic annual sea ice retreat and advance and their relation to El Niño-Southern Oscillation and Southern Annular Mode variability, J. Geophys. Res., 113, C03S90, https://doi.org/10.1029/2007JC004269, 2008.
Thomas, E. R., Allen, C. S., Etourneau, J., King, A. C., Severi, M., Winton, V. H. L., and Peck, V. L.: Antarctic sea ice proxies from marine and ice core archives suitable for reconstructing sea ice over the past 2000 years, Geosciences, 9, 506, https://doi.org/10.3390/geosciences9120506, 2019.
Thompson, D. W., Solomon, S., Kushner, P. J., England, M. H., Grise, K. M., and Karoly, D. J.: Signatures of the Antarctic ozone hole in Southern Hemisphere surface climate change, Nat. Geosci., 4, 741–749, https://doi.org/10.1038/ngeo1296, 2011.
Thompson, D. W. J., Baldwin, M. P., and Solomon, S.: Stratosphere–troposphere coupling in the Southern Hemisphere, J. Atmos. Sci., 62, 708–715, https://doi.org/10.1175/JAS-3321.1, 2005.
Turner, J., Phillips, T., Marshall, G. J., Hosking, J. S., Pope, J. O., Bracegirdle, T. J., and Deb, P.: Unprecedented springtime retreat of Antarctic sea ice in 2016, Geophys. Res. Lett., 44, 6868–6875, https://doi.org/10.1002/2017GL073656, 2017.
Turner, J., Holmes, C., Caton Harrison, T., Phillips, T., Jena, B., Reeves-Francois, T., and Bajish, C. C.: Record low Antarctic sea ice cover in February 2022, Geophys. Res. Lett., 49, e2022GL098904, https://doi.org/10.1029/2022GL098904, 2022.
Wing, S. R., Wing, L. C., O'Connell-Milne, S. A., Barr, D., Stokes, D., Genovese, S., and Leichter, J. J.: Penguins and seals transport limiting nutrients between offshore pelagic and coastal regions of Antarctica under changing sea ice, Ecosystems, 24, 1203–1221, https://doi.org/10.1007/s10021-020-00578-5, 2021.
WMO (World Meteorological Organization): Scientific Assessment of Ozone Depletion: 2018, Global Ozone Research and Monitoring Project-Report No. 58, https://wedocs.unep.org/20.500.11822/32140 (last access: 15 January 2023), 2018.
Yang, J., Xiao, C. D., Liu, J. P., Li, S. T., and Qin, D. H.: Variability of Antarctic sea ice extent over the past 200 years, Sci. Bull., 66, 2394–2404, https://doi.org/10.1016/j.scib.2021.07.028, 2021.