the Creative Commons Attribution 4.0 License.
the Creative Commons Attribution 4.0 License.
 | 01 Nov 2023
Assessing the potential for ice flow piracy between the Totten and Vanderford glaciers, East Antarctica
Felicity S. McCormack
Jason L. Roberts
Bernd Kulessa
Alan Aitken
Christine F. Dow
Lawrence Bird
Benjamin K. Galton-Fenzi
Katharina Hochmuth
Richard S. Jones
Andrew N. Mackintosh
Koi McArthur
The largest regional drivers of current surface elevation increases in the Antarctic Ice Sheet are associated with ice flow reconfiguration in previously active ice streams, highlighting the important role of ice dynamics in mass balance calculations. Here, we investigate controls on the evolution of the flow configuration of the Vanderford and Totten glaciers – key outlet glaciers of the Aurora Subglacial Basin (ASB) – the most rapidly thinning region of the East Antarctic Ice Sheet (EAIS). We synthesise factors that influence the ice flow in this region and use an ice sheet model to investigate the sensitivity of the catchment divide location to changes in surface elevation due to thinning at the Vanderford Glacier (VG) associated with ongoing retreat and thickening at the Totten Glacier (TG) associated with an intensification of the east–west snowfall gradient. The present-day catchment divide between the Totten and Vanderford glaciers is not constrained by the geology or topography but is determined by the large-scale ice sheet geometry and its long-term evolution in response to climate forcing. Furthermore, the catchment divide migrates under relatively small changes in surface elevation, leading to ice flow and basal water piracy from the Totten to the Vanderford Glacier. Our findings show that ice flow reconfigurations occur not only in regions of West Antarctica like the Siple Coast but also in the east, motivating further investigations of past, and the potential for future, ice flow reconfigurations around the whole Antarctic coastline. Modelling of ice flow and basal water piracy may require coupled ice sheet thermomechanical and subglacial hydrology models constrained by field observations of subglacial conditions. Our results have implications for ice sheet mass budget studies that integrate over catchments and the validity of the zero flow assumption when selecting sites for ice core records of past climate.
- Article
(13097 KB) - Full-text XML
- BibTeX
- EndNote


The Vanderford Glacier (VG) is the fastest-retreating glacier in the East Antarctic Ice Sheet (EAIS), with approximately 18.6 km of grounding line retreat observed over the period 1996 to 2020 (Picton et al., 2023). The Vanderford Glacier drains part of the ice contained in the Aurora Subglacial Basin (ASB; Fig. 1a), which contains approximately 7 m of global sea level equivalent (Morlighem et al., 2020). However, half of that water-equivalent ice volume lies on topography that is grounded below sea level, and hence the ASB is highly vulnerable to significant deglaciation as the climate warms. The ASB is the most rapidly thinning basin in East Antarctica (Smith et al., 2020), and modelling studies indicate that it will continue to be the dominant East Antarctic contributor to global sea level rise over the coming decades to centuries (Pelle et al., 2020, 2021; Seroussi et al., 2020). Geological data proximal to the East Antarctic coastline from Princess Elizabeth Land to Adélie Land (Cook et al., 2013; Williams et al., 2010; Wilson et al., 2018) suggest markedly reduced ice volumes could have been present in the ASB and Wilkes Subglacial Basin during the mid-Pliocene warm period (MPWP; 3.3 to 3 Ma), when global temperatures were ∼ 2.5 to 4 ∘C warmer than the 1850 to 1900 mean. Ice sheet model simulations of the MPWP show preferential ice loss from the ASB and Wilkes subglacial basins (Austermann et al., 2015; DeConto and Pollard, 2016), highlighting the potential of the ASB to reach a tipping point as the climate warms (McKay et al., 2022; Noble et al., 2020).
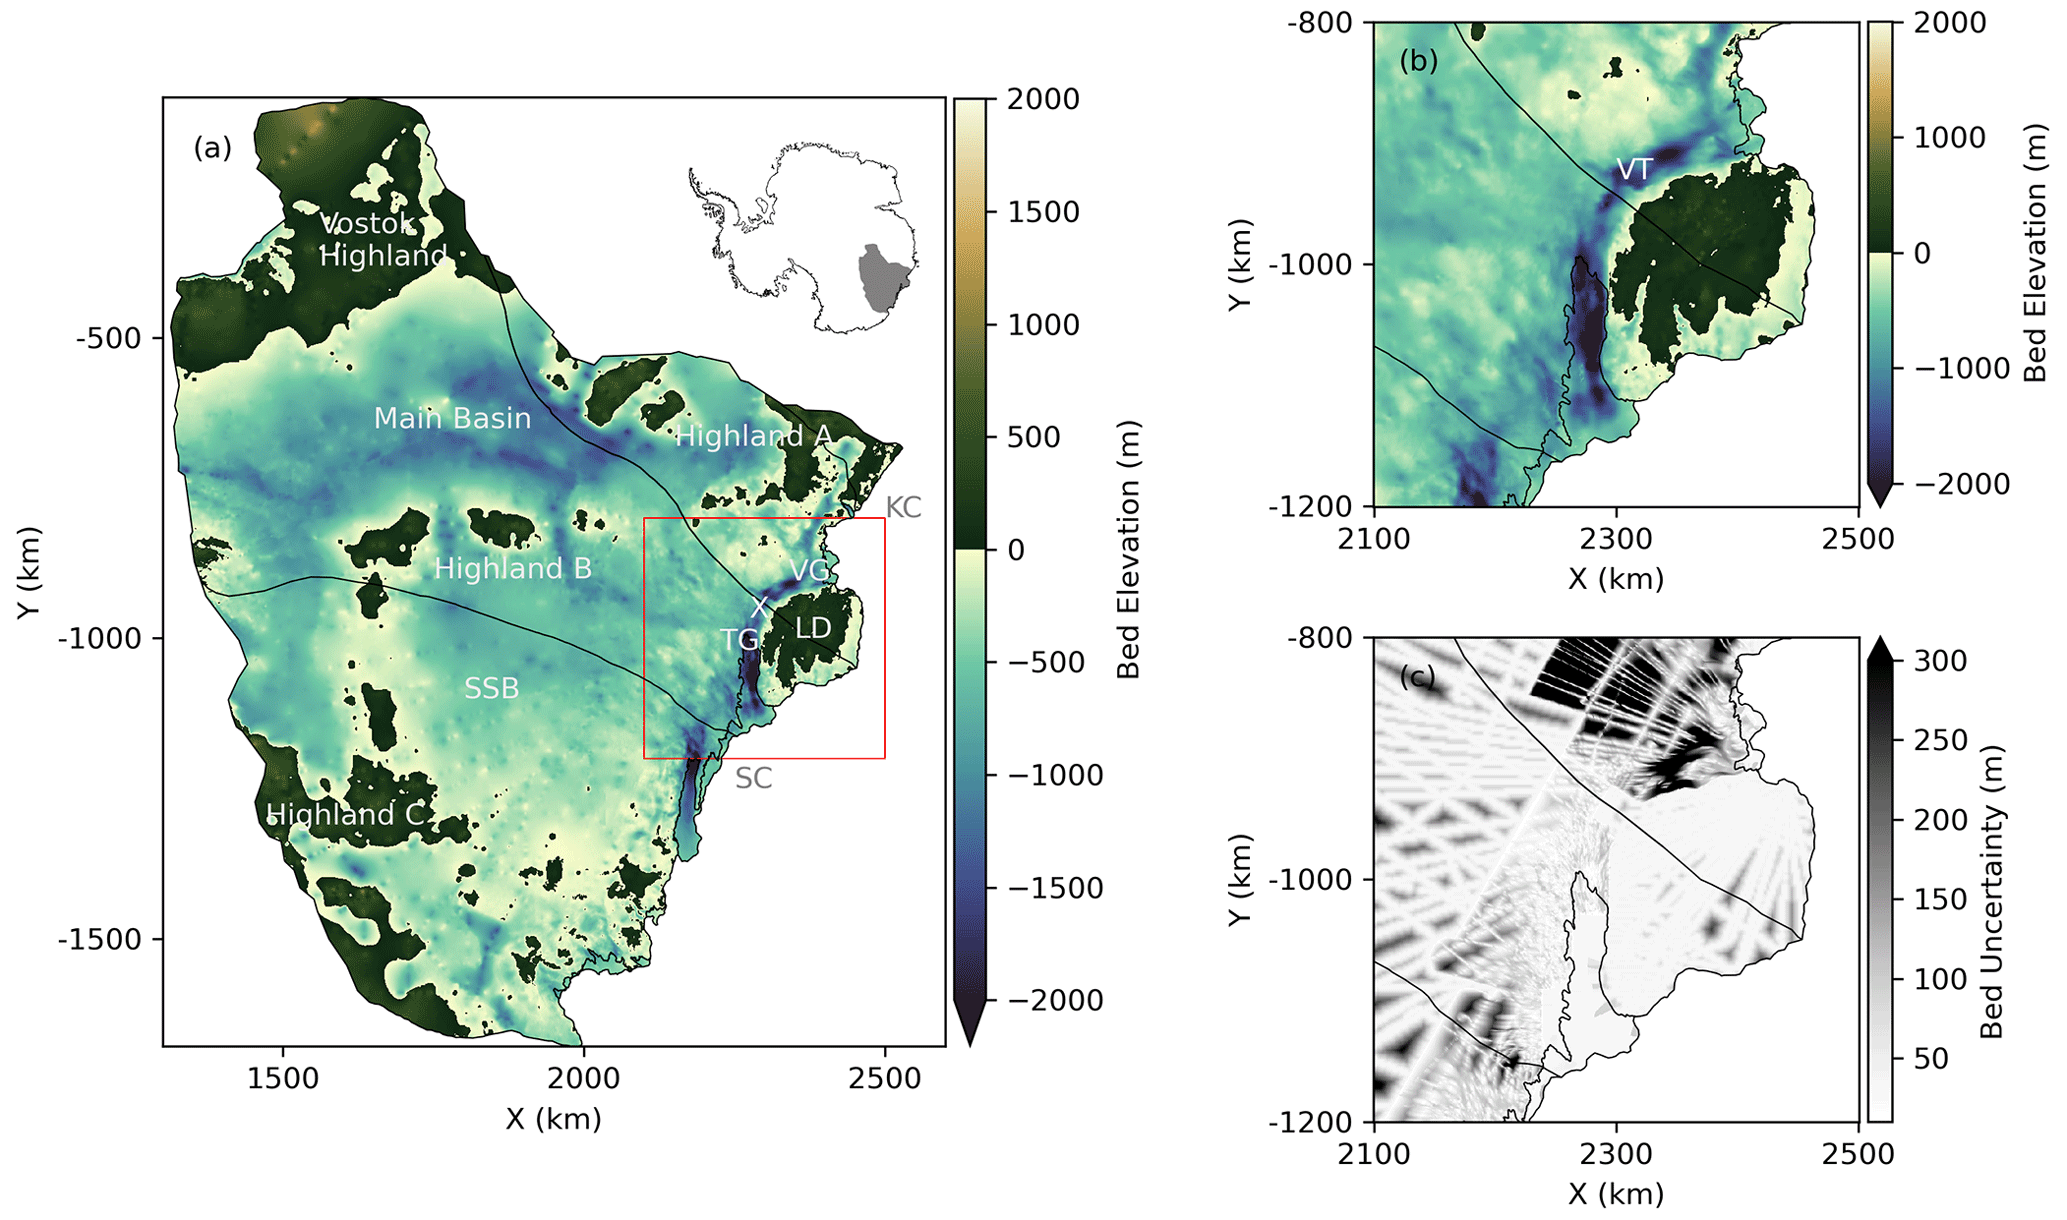
Figure 1Aurora Subglacial Basin bed elevation and uncertainty derived from the BedMachine Antarctica v3 dataset (Morlighem et al., 2020). (a) Bed topography (m), with red enlarged inset shown in panel (b), and (c) uncertainty (m). The ASB catchment outline is from Zwally et al. (2012), and the coastline and grounding line (black) are from MEaSUREs2. All data are referenced to the WGS84 ellipsoid and displayed in eastings (x axis) and northings (y axis) using polar stereographic coordinates (km). Locations of regions in panel (a) are the following: Vostok Highland, ASB main basin, Highland A, Highland B, Highland C, Sabrina Subglacial Basin (SSB), Totten Glacier (TG), Vanderford Glacier (VG), Sabrina Coast (SC), Knox Coast (KC), the Elcheikh saddle point (X), and Law Dome (LD). The Vanderford Trench (VT) is highlighted in panel (b).
Currently, ice flow, ice discharge, and sediment discharge from the Totten Glacier (TG) is larger than at the Vanderford Glacier (Hochmuth et al., 2020; Li et al., 2016; Rignot et al., 2019). However, paleo-sediment records indicate that the Vanderford Glacier has likely been the dominant contributor to offshore sedimentation along the Sabrina and Knox coast sectors on geologic (million-year) timescales, rather than the Totten Glacier (Hochmuth et al., 2020). In particular, sedimentation rates at the Vanderford Glacier were twice those at the Totten Glacier during the mid–late Oligocene (27 to 24 Ma), when global temperatures were approximately 3 to 4 ∘C higher than the present day (Westerhold et al., 2020). Furthermore, modelling indicates similar levels of erosion potential for the bed under both the Totten and Vanderford glaciers – and indeed, that these glaciers have the highest erosive potential in East Antarctica – such that similar magnitudes of sediment discharge from each of these two glaciers are possible under present-day ice sheet geometries (Aitken and Urosevic, 2021).
Changes in basal water accumulation and routing have been hypothesised to play a role in flow diversion (piracy) – and even ice flow stagnation – between neighbouring ice streams of the Siple Coast in the past. For example, Alley et al. (1994) propose that a diversion of basal meltwater from Kamb Ice Stream into Whillans Ice Stream, associated with an inland extension of the ice streams due to increased basal melt over the Holocene, led to a reduction in basal lubrication and meltwater production beneath Kamb Ice Stream and its consequent stagnation. These changes may have also impacted the slowdown of the adjacent Whillans Ice Stream and may impact the likelihood of future stagnation here (Beem et al., 2014; Joughin and Tulaczyk, 2002). More recent modelling of the Siple Coast system indicates that basal hydromechanical processes, including thermal switching between basal melting and freezing states, are a dominant control on the ice flow configuration and that further large-scale flow reconfiguration could be possible in the next tens to hundreds of years (Bougamont et al., 2015), consistent with century-scale changes in the routing of ice streams in this region (Catania et al., 2012; Hulbe and Fahnestock, 2007).
Basal water accumulation and routing has also been suggested to play a role in the stagnation of Carlson Inlet – a proposed relict ice stream – and reconfiguration of ice flow from Carlson Inlet to Rutford Ice Stream over 240 years ago (Vaughan et al., 2008). Changes in basal water routing are strongly linked to ice sheet geometry changes, and modelling by Vaughan et al. (2008) suggests that thickening of Rutford Ice Stream by only 4 % would be sufficient enough to reroute subglacial water to Carlson Inlet, potentially reactivating its flow. Similar mechanisms may have been involved in the reconfiguration of ice streams in the Weddell Sea sector in the past few thousand years (Siegert et al., 2013, 2019). The precise drivers of ice flow and basal water routing changes are uncertain and likely to vary between ice stream pairs due to variations in the basal hydromechanics and topography and ice sheet geometry, geology, and climate. Importantly, ice flow reconfiguration could be an important process for multiple regions around the Antarctic margin, occurring even under minor changes in ice sheet geometry.
Given the significant potential of the ASB to raise global sea levels, it is essential to understand controls on the present-day flow configuration between the Totten and Vanderford glaciers and its potential evolution as the climate warms. In this study, we first conduct a synthesis of the geology, topography, subglacial hydrology, and geomorphology of the ASB to ascertain how these factors may influence the past and present flow configuration of the Totten and Vanderford glaciers and of climate drivers in the ASB and how they might change in the future. We then use an ice sheet model to generate ice surface elevation change fields to investigate the sensitivity of ice flow and basal water piracy between the Totten and Vanderford glaciers.
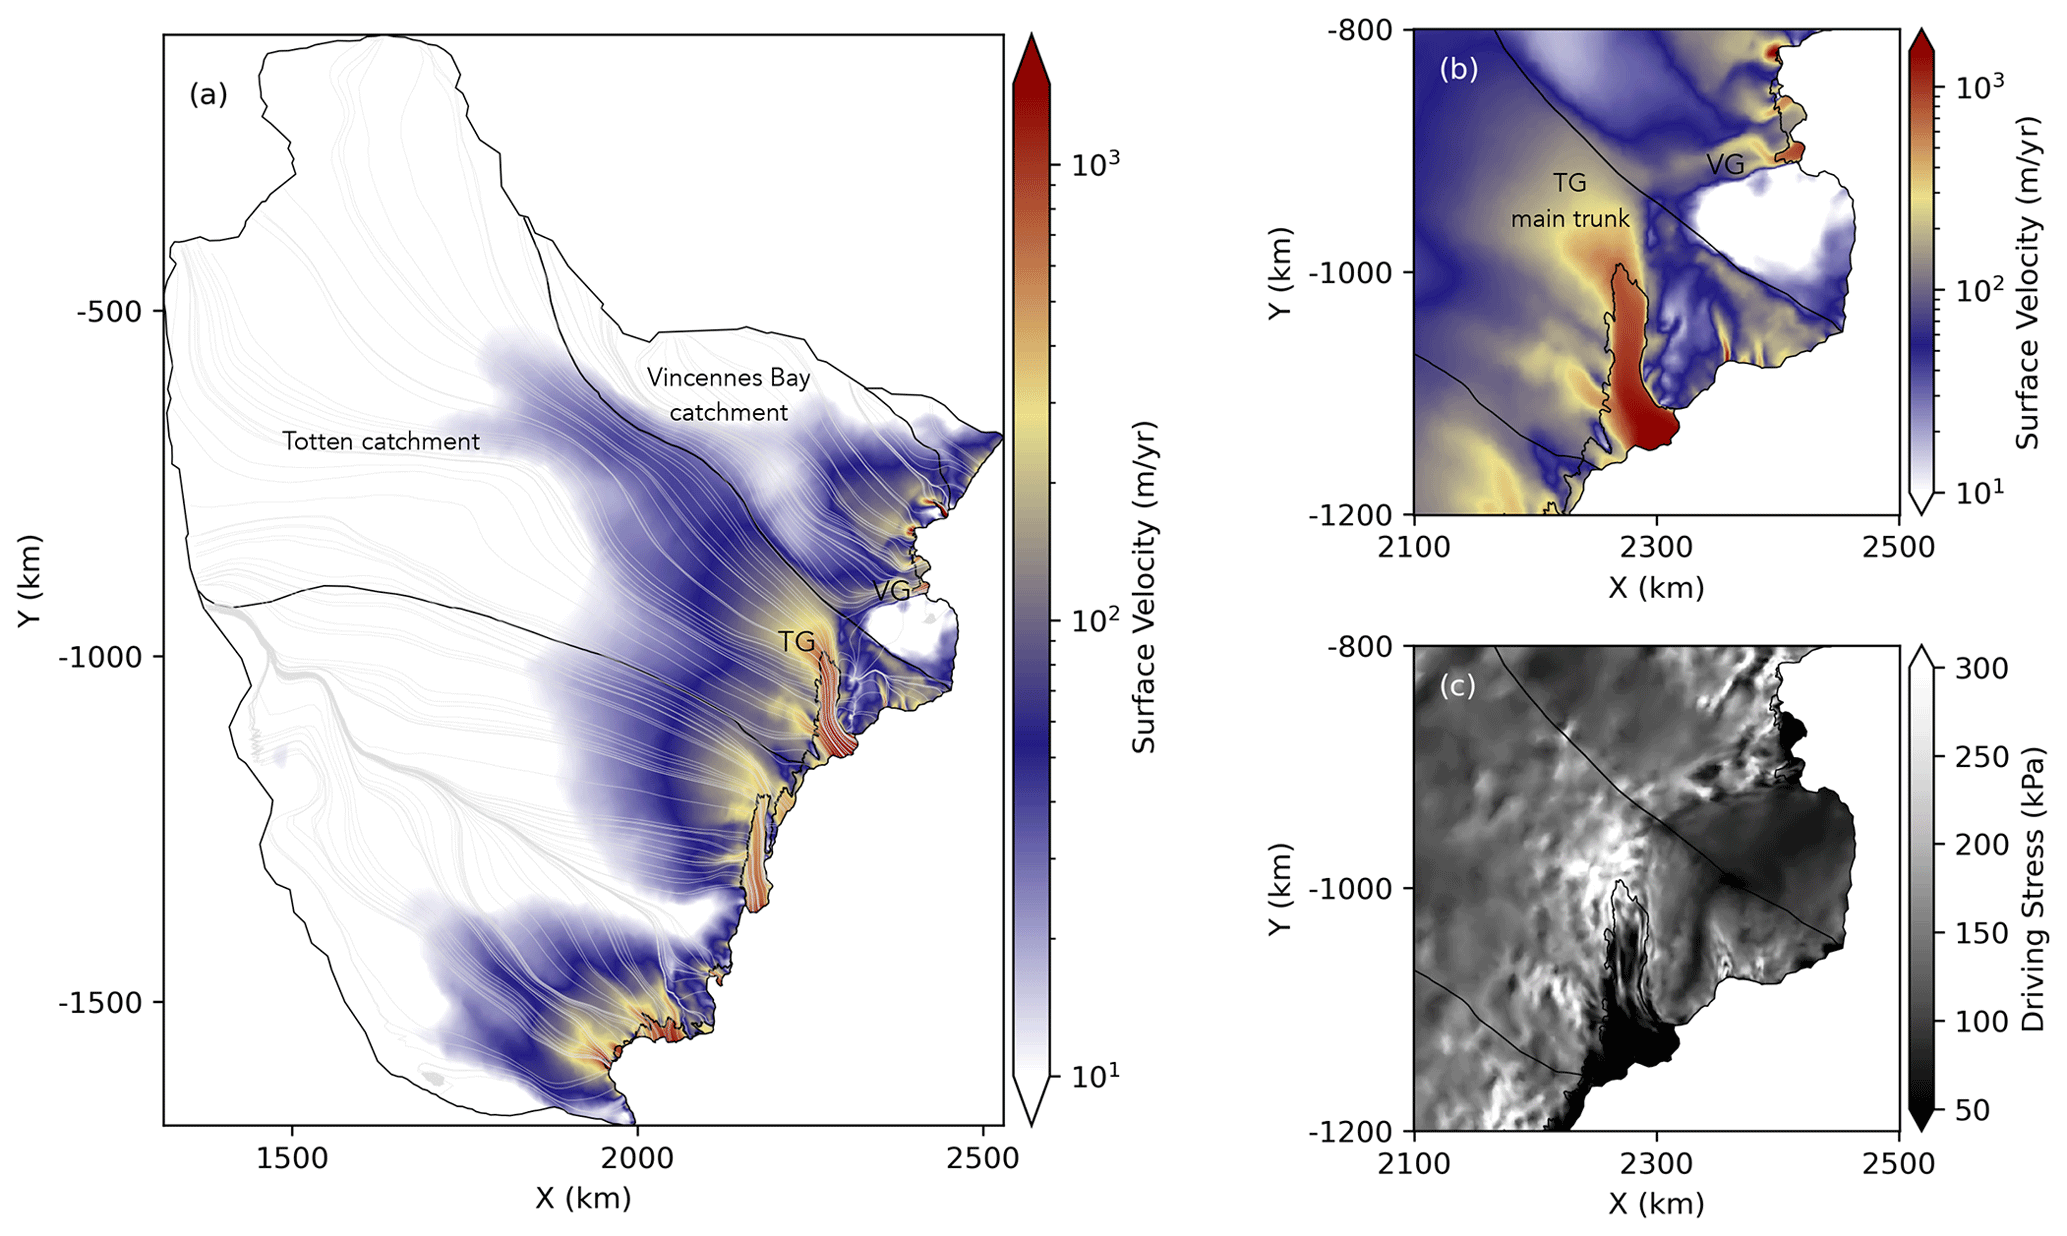
Figure 2(a, b) Ice surface speeds (m yr−1) from MEaSUREs2 and (c) driving stress p (kPa). Black contours are as for Fig. 1. Light-grey contours in panel (a) are velocity streamlines. Locations of the Totten Glacier (TG) and the Vanderford Glacier (VG) are indicated.
2.1 Current flow and trends
The Totten Glacier is one of the fastest-flowing glaciers in East Antarctica (Rignot et al., 2011, 2019), with ice surface speeds of over 750 m yr−1 at the main tributary grounding line (southernmost region) – more than 100 m yr−1 greater than the corresponding ice surface speed at the Vanderford grounding line (Fig. 2a). Average ice discharge from 2009 to 2017 at the Totten Glacier (71.4 ± 2.6 Gt yr−1) is almost twice that at the Vanderford Glacier (36.2 ± 0.5 Gt yr−1), naturally reflecting thicker ice, a steeper surface slope, and hence greater driving stresses (Fig. 2c) near the Totten Glacier grounding line. Both glaciers have accelerated in recent decades: the Vanderford Glacier surface speeds increased by 31 % over the period 2000 to 2013, with little subsequent change (Picton et al., 2023); the Totten Glacier experienced insignificant increases in surface speed from 2007 to 2022 (Rignot et al., 2022), but with quasi-decadal cyclicity (Roberts et al., 2017). Furthermore, the Vanderford Glacier grounding line retreated by ∼ 18.6 km over the period 1996 to 2020 (Picton et al., 2023), making it the fastest-retreating glacier in East Antarctica (Stokes et al., 2022). Changes at both glaciers are consistent with ocean-driven ice shelf thinning and calving (Sect. 3.2) and consequent reductions in buttressing (Fürst et al., 2016; Gudmundsson et al., 2019).
Discharge rates from each glacier are related to the broad-scale flow configuration of the ASB (Fig. 2). The Totten Glacier is currently fed by a catchment of 267 904 km2. The majority of discharge through Totten is channelled from the west through its main tributary, with a smaller portion channelled through the eastern flank of the glacier (Fig. 2b). Ice sheet models suggest ongoing grounding line retreat along the eastern flank and into the Sabrina Subglacial Basin (SSB) will occur in coming decades (McCormack et al., 2021; Pelle et al., 2020; Sun et al., 2016). Despite the fact that the undulating bed topography in the SSB lies largely below sea level (Fig. 1), this portion of the Totten catchment is generally thinner, having a sea level potential that is much smaller than that of the ASB main basin (Morlighem et al., 2020).
The current Vincennes Bay catchment that feeds the Vanderford Glacier is approximately 71 329 km2 – just over a quarter of the size of the adjacent Totten catchment. Similarly to Totten, discharge from the Vanderford Glacier is channelled through a western and an eastern trunk (Fig. 2b). The western trunk largely originates from, and is to the west of, Highland A (compare Figs. 1 and 2). The eastern trunk originates in the same region as the main Totten tributary, east and south of Highland A; the Elcheikh saddle point (cross in Fig. 1a) marks the divergence of flow to either the main Totten tributary or the eastern trunk of the Vanderford Glacier.
2.2 Geology
The geology of the ASB – in particular, the extents and types of sedimentary basins in the Totten and Vincennes Bay catchments – shows correspondence with patterns in ice sheet flow and subglacial hydrology (Sect. 2.4). The ASB region is dominated by sedimentary basins, interpreted to represent deposition during rifting events that occurred well before the EAIS developed (Aitken et al., 2023). Sequences of these sedimentary rocks are stacked vertically, ranging from an older Neoproterozoic to lower Paleozoic sequence (Maritati et al., 2019) and a younger sedimentary sequence dating from the Permian–Triassic to the Cenozoic (Aitken et al., 2023). The topographic barriers of Highlands A, B, and C and the Knox Highlands typically comprise erosional remnants of the older sequence, while the topographic basins typically comprise rocks of the younger sequence (Fig. 3).
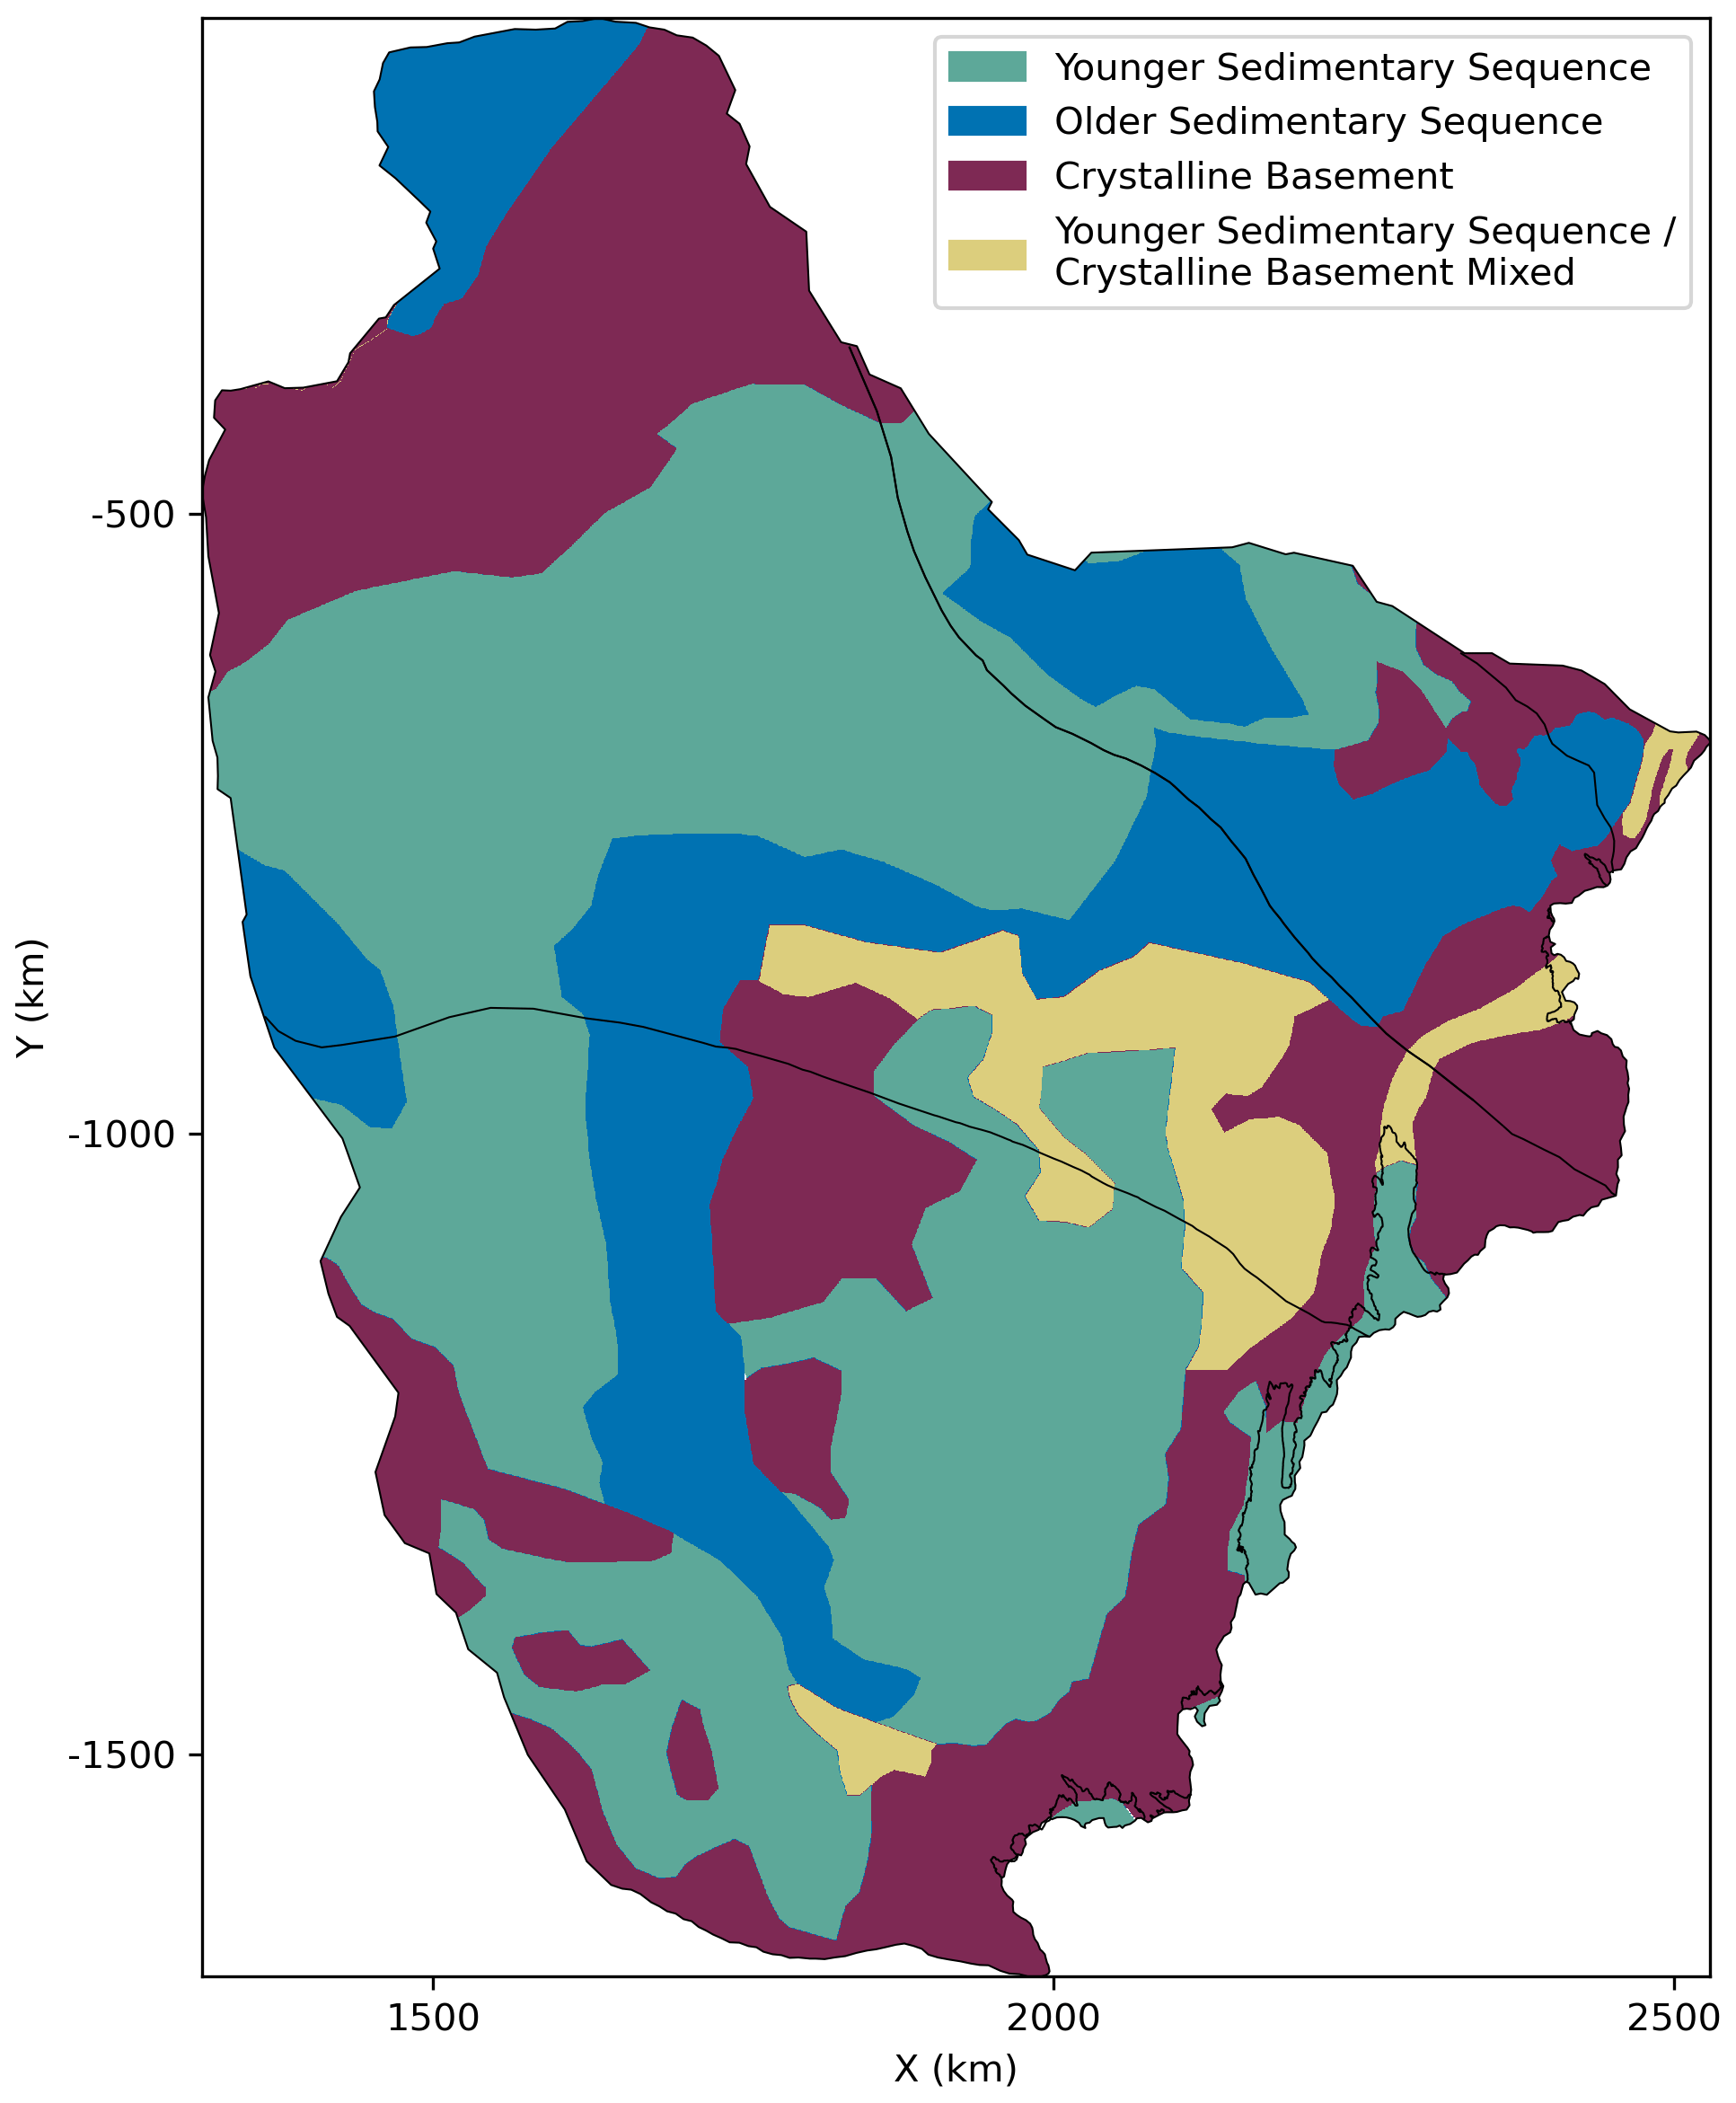
Figure 3Interpreted bedrock geology of the ASB region showing the distribution of sedimentary rocks (Aitken et al., 2023). Variations in basement geology are not shown here.
The sedimentary cover in the main topographic lows reaches thicknesses of several kilometres, while the cover on the highlands is thinner. In regions of enhanced glacial erosion, the geology has been eroded to basement or possesses a mixture of basement with remnants of the younger sedimentary sequence (Aitken et al., 2016). Areas with sedimentary basins are in general floored by more easily erodible rocks than in basement-dominated regions, and upstream basins – particularly upstream of the main Totten tributary – are likely to provide an abundance of sediment to the downstream glacier bed, facilitating till continuity and basal sliding (see Sect. 2.4; Bell et al., 1998; Li et al., 2022).
Sedimentary basins also permit the occurrence of a viable hydrogeology system, where the permeable bed allows fluid exchange between the subglacial hydrological system and groundwater storage (Siegert et al., 2018). Groundwater discharge into the glacier bed varies with ice sheet retreat rate and also with the thickness and permeability of the sedimentary basins, with major potential impacts on the basal sliding of contemporary glaciers in East and West Antarctica (Li et al., 2022). In the case of the Vincennes Bay catchment, the bed is dominated by the older sedimentary sequence and crystalline basement (Fig. 3), which are more likely to have low permeability; here, capacity for active hydrogeology may be restricted (although these regions of hard bed are characterised by channelised subglacial hydrology and faster flow; see Sect. 2.1 and 2.4). In contrast, the ASB main basin – which both is thick and contains relatively young sedimentary rocks – has higher potential to support active hydrogeology, with potential impacts on basal sliding processes and hence ice streaming (Siegert et al., 2018; Li et al., 2022). Although estimates for the contributions of groundwater to the subglacial hydrology system exist broadly across Antarctica (Li et al., 2022), they are currently not available for the ASB specifically.
2.3 Bed topography
Approximately 75 % of the bed topography in the Totten and Vincennes Bay catchments is below sea level, and over 10 % is more than 1 km below sea level, particularly in the ASB main basin (Fig. 1). Regions of topographic highs play a role in determining the overall ASB catchment boundary as well as the orientation of flow within the Totten and Vincennes Bay catchments. This is notably the case with the topographic barriers of Highlands A and B, the western edge of the Vanderford Glacier, Law Dome, and the coastal ridge adjacent to the Totten Glacier and the Moscow University ice shelf (Figs. 1, 3). Ice flowing into the main Totten tributary has a similar flow trajectory to ice that flows into the eastern trunk of the Vanderford; ice from both glaciers originates in a region of generally high topography north of Lake Vostok (Vostok Highland; Fig. 1a). Downstream, both the Totten and Vanderford glaciers flow into the Vanderford Trench – a deeply incised subglacial channel that borders Law Dome and records the lowest known topography of the ASB (−2782 m below sea level; Fig. 1b). While topography provides a clear control on the overall ASB catchment boundary, there are no distinguishing features of the bed topography that clearly control the location of the drainage divide between the Totten and Vincennes Bay catchments. However, possible local controls in the Vanderford Trench are difficult to observe where very steep topography and thick ice hinder imaging of the ice base by ice-penetrating radar.
In terms of the susceptibility of each glacier to ongoing retreat, bathymetric pinning points on the Totten ice shelf, in the ∼ 20 km downstream of the main Totten tributary grounding line, provide significant buttressing of the upstream glacier (McCormack et al., 2021; Roberts et al., 2017). A prograde bed slope in the ∼ 20 km upstream of the present-day grounding line decreases the likelihood of substantial retreat occurring under climate change projections to 2100 (Pelle et al., 2020; Sun et al., 2016). For the Vanderford Glacier, there is a high degree of uncertainty in the underlying bed topography within the Vanderford Trench; notably, uncertainties of 600 m and greater exist within the 10 km upstream of the present-day Vanderford grounding line (see discussion in Sect. 5 and Fig. 1c; Morlighem et al., 2020). Given the controlling influence of the bed elevation and slope on grounding line retreat, this has significant implications for the observed and simulated timing and rate of retreat. These lines of evidence, coupled with the current rates of retreat from each glacier, suggest that the Vanderford Glacier could retreat more rapidly, and further into the Vanderford Trench, than the Totten Glacier over the coming decades.
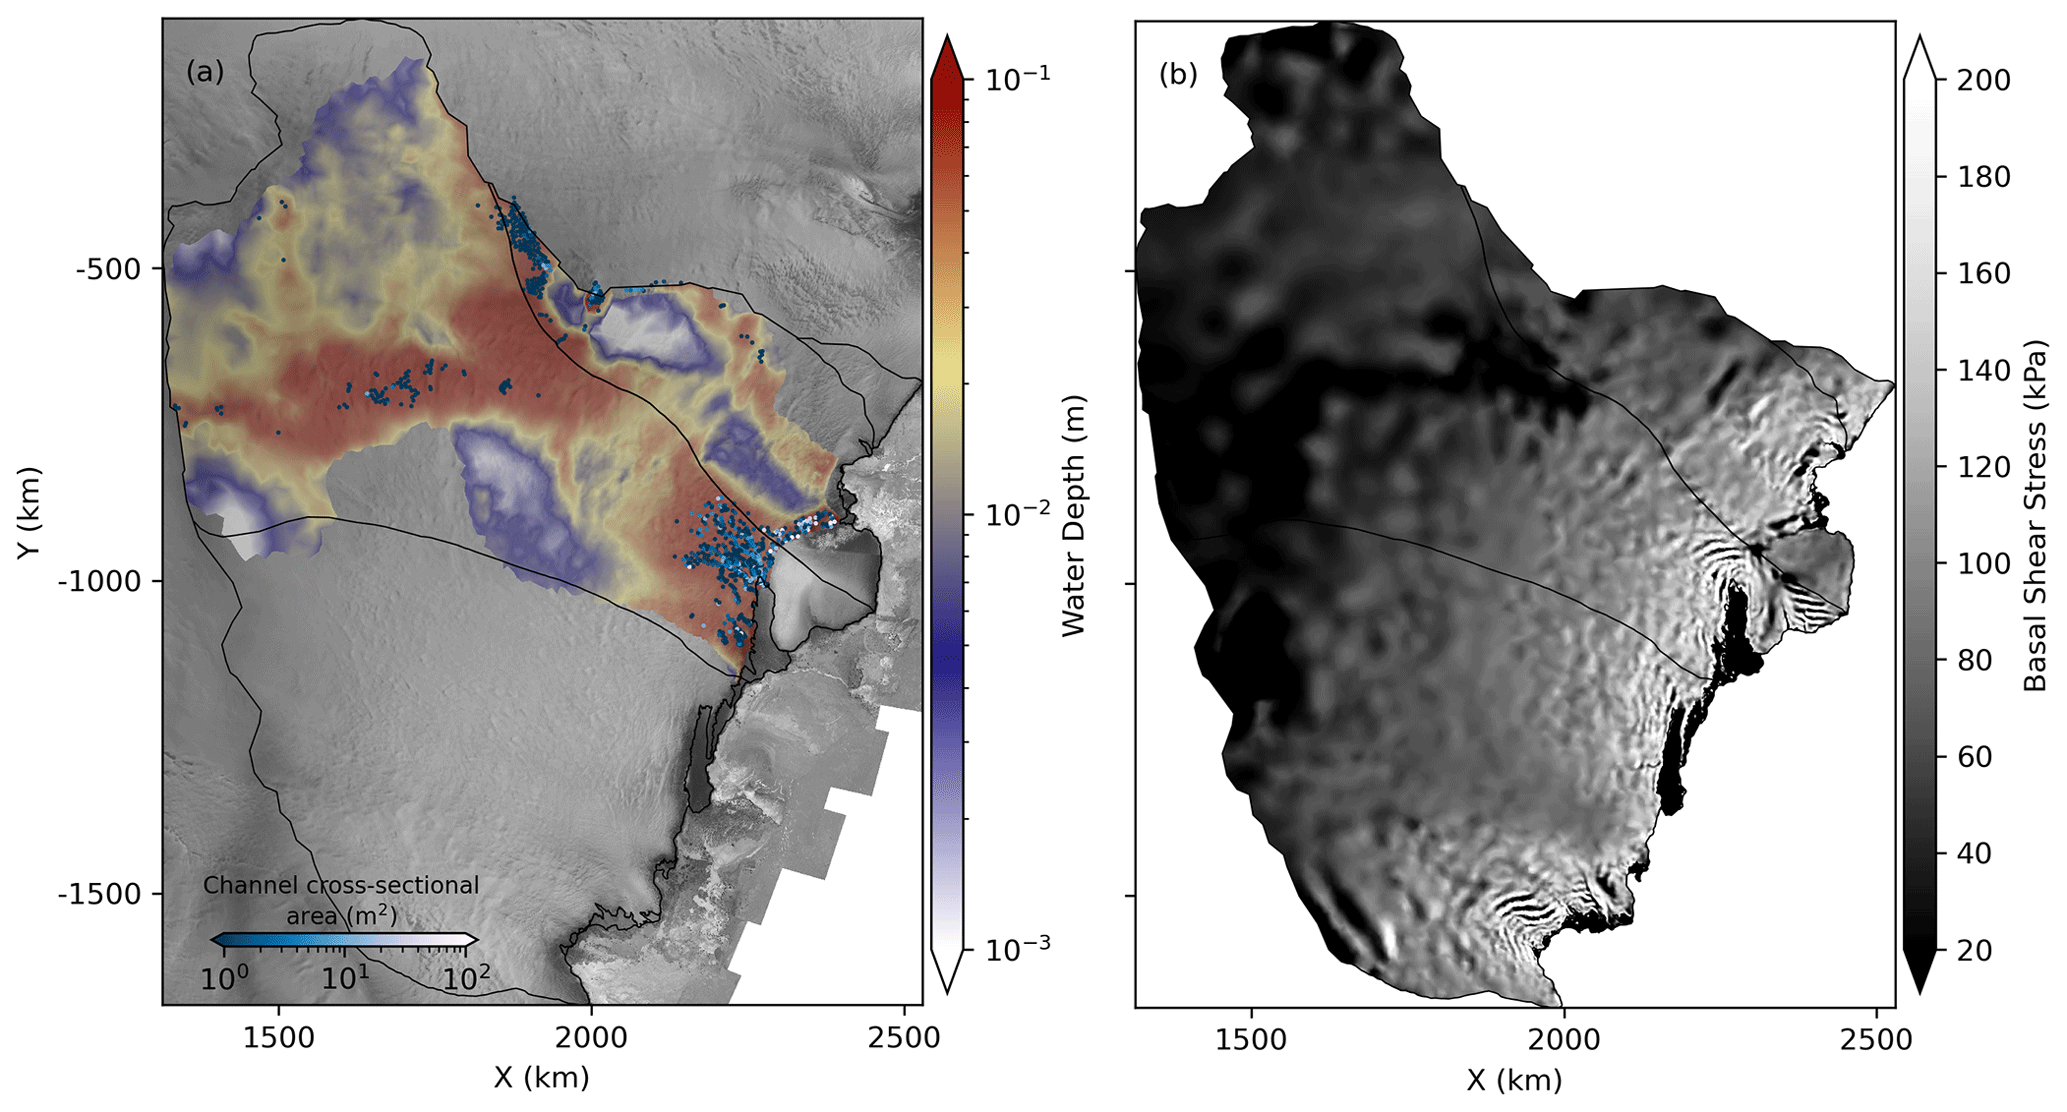
Figure 4(a) Water depth (m) in the distributed and channelised subglacial hydrology system generated using GlaDS (Dow et al., 2020) and (b) basal shear stress (kPa) from the ice sheet model simulation, as described in Eq. (1) in Sect. 4.1. Black contours are the same as in Fig. 1.
2.4 Subglacial hydrology and geomorphology
Observations and modelling confirm the presence of a widespread, persistent subglacial hydrological network in the ASB (Dow et al., 2020), consisting of a distributed “sheet-like” system in the ASB main basin and a channelised system in the few hundred kilometres upstream of the Totten and Vanderford Glacier grounding lines (Fig. 4a). The proximal ice–bed interface of the distributed system is well lubricated and supports little to no basal shear stress (< 20 kPa; Fig. 4b). Basal specularity content derived from radar is reduced within the channelised system (Dow et al., 2020), consistent with a rougher ice–bed interface where channels are present (Schroeder et al., 2013; Young et al., 2016), and a strong bed here supports most of the basal shear stresses for each glacier (Fig. 4b). The calculation of the basal shear stresses in Fig. 4b is described in Sect. 4.1, and the striped pattern in the approach to the grounding line is consistent with previous studies (e.g. Sergienko and Hindmarsh, 2013).
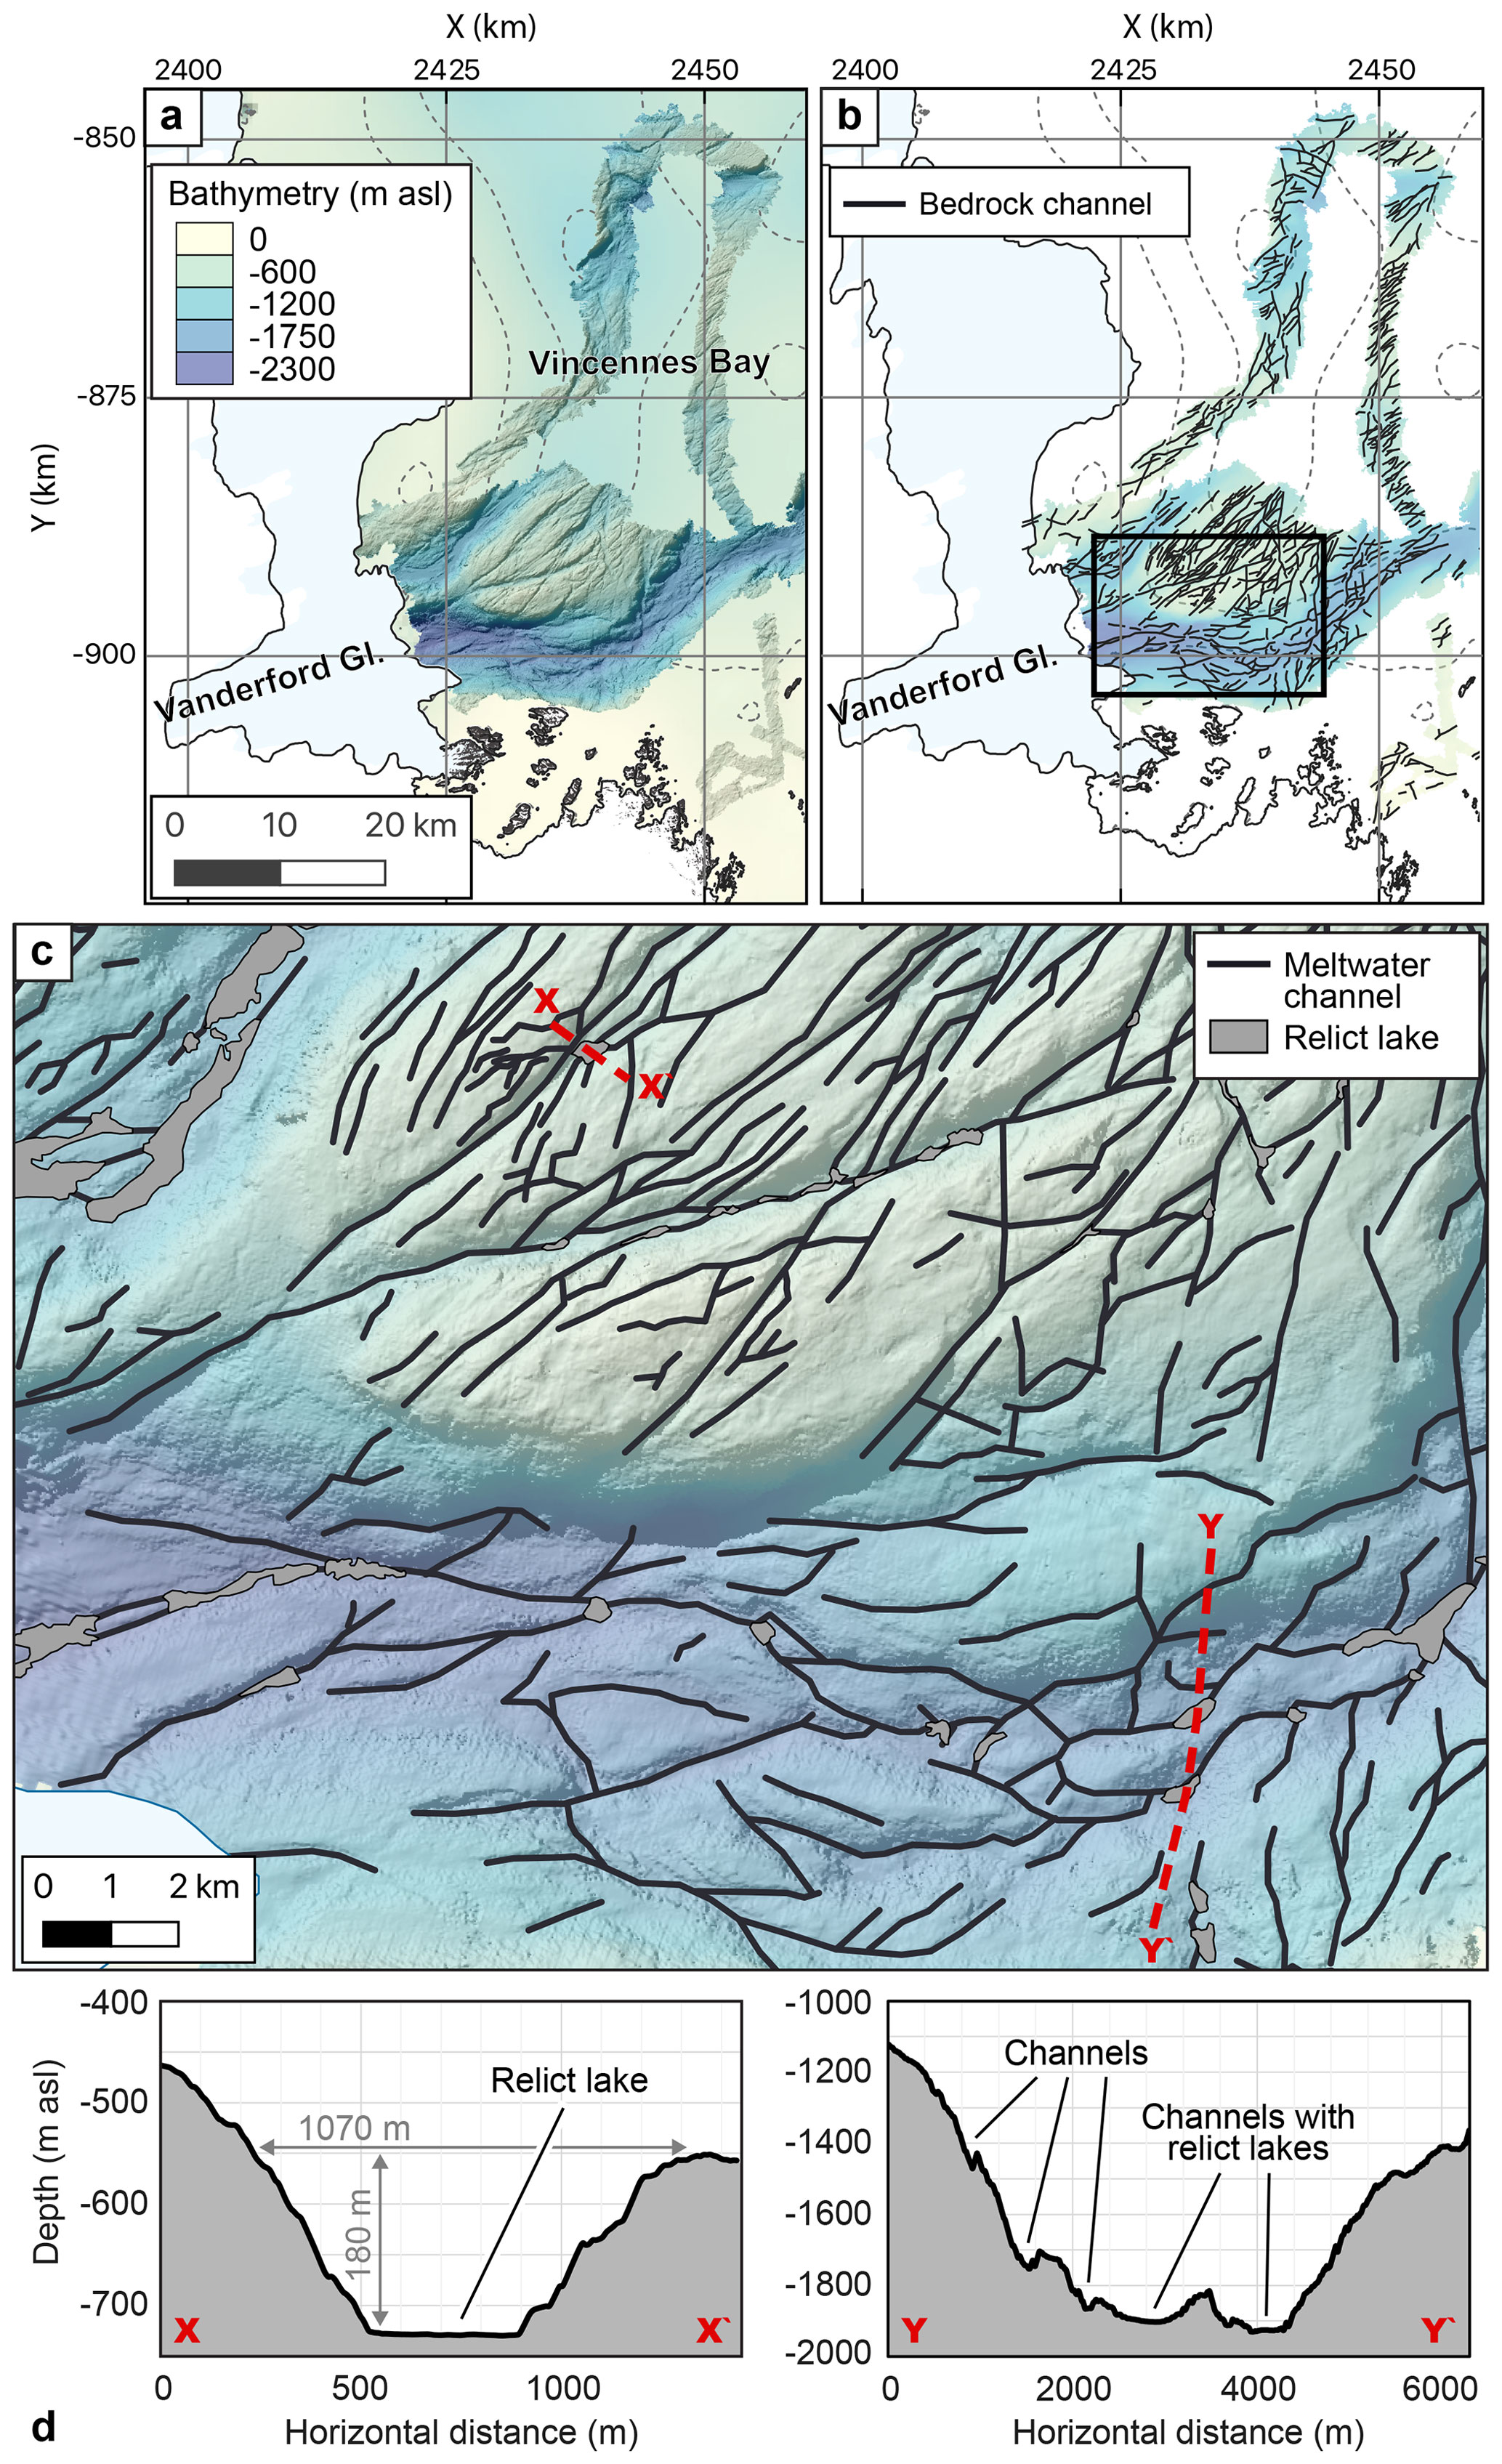
Figure 5Geomorphology of the continental shelf in front of the Vanderford Glacier. (a) High-resolution multibeam bathymetry (Commonwealth of Australia, 2022) highlighting a submarine canyon overlaid on previous bathymetric estimates (Arndt et al., 2013; Morlighem et al., 2020) with contours at 250 m intervals. (b) Bedrock channels (black lines) and black square show the location of (c). (c) Bedrock channels of the inner continental shelf, interpreted as relict subglacial meltwater channels, and flat-bottom parts of these channels (slope ≤ 2∘), interpreted as relict lakes. (d) Geometry of the meltwater landforms highlighted in cross-section profiles. Channels follow lines of geological weakness in shallow and deep areas (from 450 to 2280 m water depth). A large bedrock high has major channels (150 to 280 m deep, 1 km wide and 9 to 16 km long) connected by shorter, less-incised channels. Within the two troughs, bedrock channels have an anastomosing pattern, with meandering central channels linked in multiple places to neighbouring channels. Flat surfaces are found in deeper parts of the main channels, reflecting localised sedimentation.
The majority of basal water in the ASB is routed towards the Totten Glacier (Dow et al., 2020; Wright et al., 2012; Young et al., 2016); output from the Glacier Drainage System (GlaDS) subglacial hydrology model estimates approximately 42 m3 s−1 discharge from the Totten catchment into the ocean, compared with only 3 m3 s−1 from the Vanderford Glacier (Dow et al., 2020). This is partly due to fewer channels developing in the approach to the Vanderford grounding line in the steady-state GlaDS simulations compared to the Totten grounding line. Nevertheless, the subglacial hydrological networks of the Totten and Vincennes Bay catchments are strongly connected. For example, ICESat surveys identified at least two “active” lakes located within the 200 km upstream of the Totten grounding line, with lake drainage and filling evidenced in surface elevation changes between 2003 and 2006 (Smith et al., 2009). Hydraulic potential analysis of one of these lakes shows that basal water drainage may be routed from the Totten to the Vanderford Glacier with only small changes in the ice surface elevation (Young et al., 2016).
The geomorphology of the continental shelf proximal to the Vanderford Glacier – revealed in high-resolution multibeam bathymetry (Commonwealth of Australia, 2022) – provides evidence for an active subglacial hydrology network in the Vincennes Bay region in the past. Of particular note is the presence of deeply incised bedrock channels, which are the most abundant landform on the inner continental shelf and which span depths of 450 to 2280 m below sea level. Similar bedrock channels and flat-bottomed basins are also observed in front of the Thwaites and Pine Island glaciers in West Antarctica (Lowe and Anderson, 2003; Nitsche et al., 2013), where hydrological modelling suggests that these are relict subglacial meltwater channels and lakes (Beaud et al., 2018; Kirkham et al., 2019). The presence of these landforms on the inner shelf of Vincennes Bay supports the existence of an active, dominant subglacial hydrological system beneath a more extensive Vanderford Glacier, which formed over multiple glacial periods. A previous study (Kirkham et al., 2019) has also documented a series of relict subglacial lakes akin to those mapped in front of Vanderford (indicated in grey in Fig. 5). The network of subglacial meltwater channels and lakes would have formed during the last glacial period, or possibly over multiple glacial periods (Kirkham et al., 2019; Beaud et al., 2018). Based on lake geometry and contemporary subglacial water transfer, these lakes likely drained episodically through the subglacial meltwater channels on decadal timescales (Kirkham et al., 2019), facilitating ice basal sliding over the rugged topography of the inner continental shelf.
In summary, the large-scale geometry of the ASB controls the current divergence of flow between the Totten and Vanderford glaciers. However, it is likely that the characteristics of, and variability in, the subglacial environment, particularly those elements that influence basal motion (e.g. the bed substrate and deformability, subglacial hydrological network, groundwater system) in the ASB, play a key role in the flow configuration. As basal water pressure and water accumulation vary into the future – e.g. associated with drawdown of the Vanderford Glacier due to grounding line retreat and subsequent thinning – basal water and ice flow piracy towards the Vanderford may also occur.
3.1 Atmospheric drivers
Surface mass balance (SMB) is the primary atmospheric driver of variability between the Totten and Vanderford glaciers. The atmospheric circulation over Law Dome is predominately polar easterlies (Bromwich, 1988), and the orography of the Dome causes relatively large snow accumulation, with a strong east–west gradient (Morgan et al., 1997; Udy et al., 2021). The temporal distribution of the snow accumulation is related to the passage of synoptic-scale features and is therefore episodic, typical of coastal Antarctica (Bromwich, 1988).
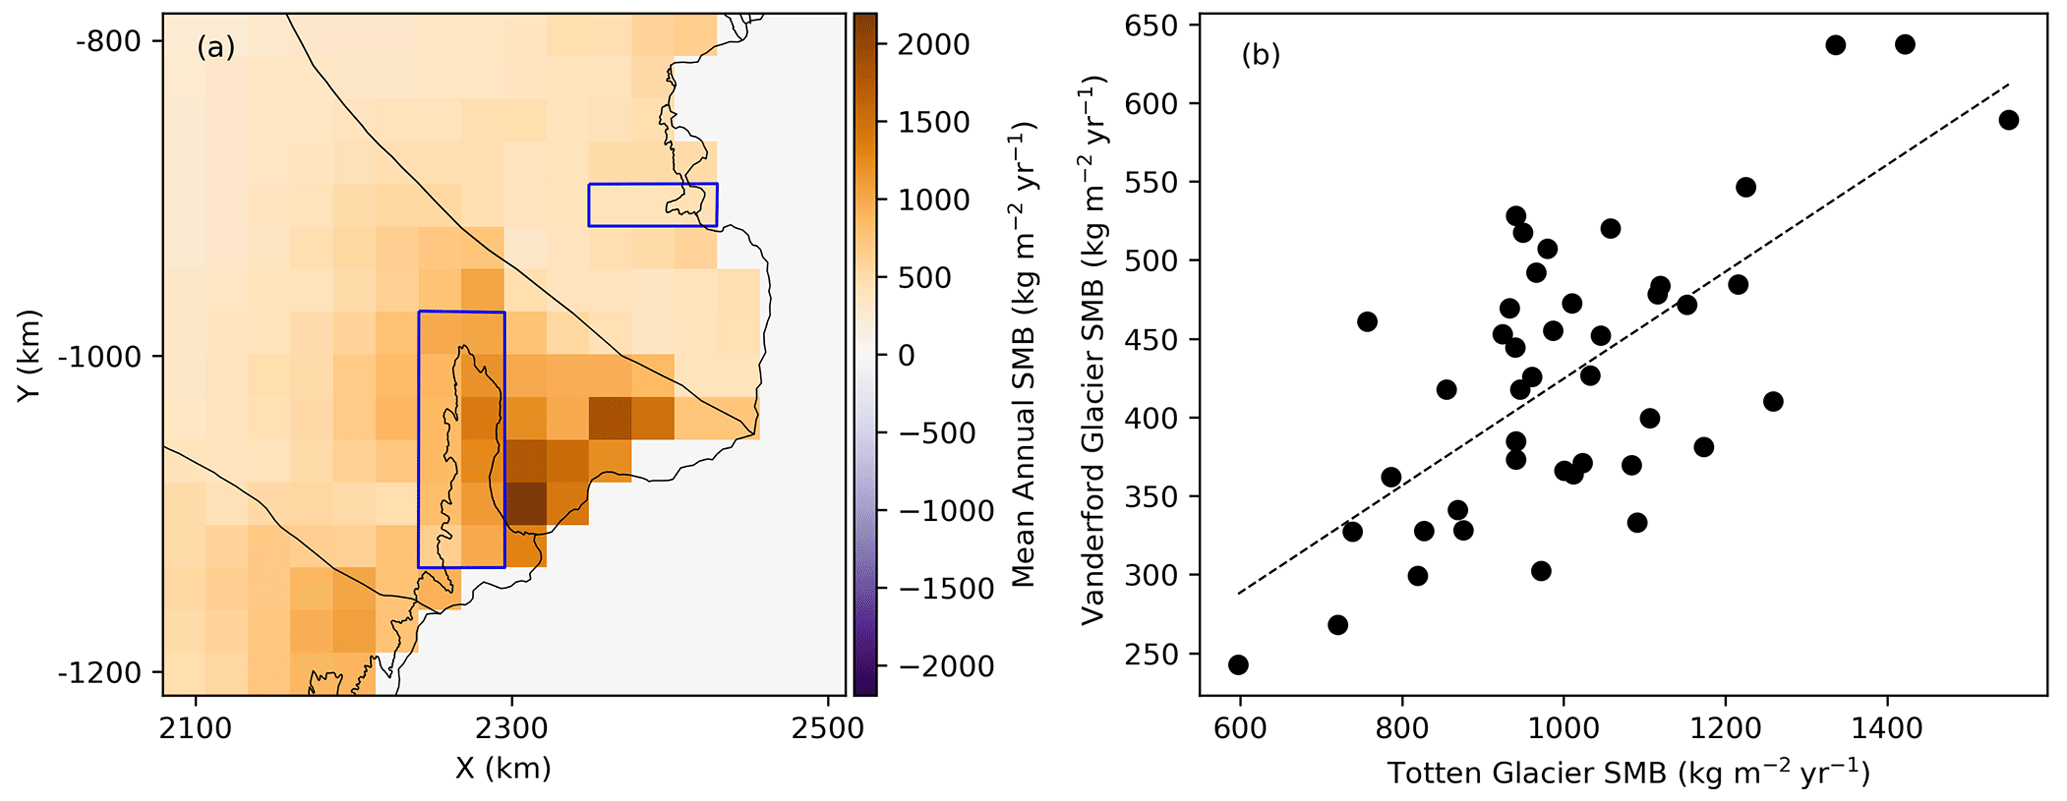
Figure 6Surface mass balance over Law Dome (LD) and surrounding area. (a) RACMO2.3p2 reanalysis (van Wessem et al., 2018) averaged over the period 1979 to 2021, showing a strong east–west snow accumulation gradient over Law Dome. Totten (larger) and Vanderford (smaller) bounding boxes for the SMB analysis in panel (b) are shown (blue). (b) Vanderford annual snow accumulation as a function of Totten annual snowfall. Least-squares linear regression line shows slopes less than unity, indicating that for increasing local snow accumulation the mismatch between the Totten and Vanderford SMB is expected to increase.
Antarctic snow accumulation is expected to increase as water vapour increases with a warming atmosphere (Krinner et al., 2007). While there is no clear trend in Law Dome accumulation rates over the past 2000 years (Roberts et al., 2015), a trend of increasing total Antarctic annual snow accumulation has been observed since 1800 (Thomas et al., 2017). While high-spatial-resolution snow accumulation observations are broadly lacking, the RACMO2.3p2 reanalysis model (van Wessem et al., 2018) captures the strong east–west gradient in snow accumulation over Law Dome on annual timescales. Results averaged over the Totten and Vanderford glaciers (Fig. 6) suggest that without major changes in atmospheric circulation patterns, a local increase in snow accumulation over Law Dome will amplify the east–west gradient.
In addition to the direct snow accumulation implications, there is a secondary effect on glacier flow related to the enhanced vertical advection of cool surface temperature into the interior at increased snow accumulation rates. For pseudo-steady-state surface elevations and approximately equal surface temperatures, the higher snow accumulation over the Totten will result in higher vertical velocities compared to the Vanderford. Without compensating differences in geothermal heat flow, deformational heating, or heat transport from basal hydrology processes, this increased vertical advection of cold will result in the bulk ice properties of the Totten being colder and stiffer than those of the Vanderford.
Without considering the effects of ocean-driven ice shelf melting (and associated surface lowering), the projected SMB changes in the ASB under a warming climate could lead to enhanced surface elevation and thickness increases at the Totten Glacier compared with the Vanderford Glacier. These effects could be further enhanced if they were to occur in concert with a dynamics-driven deceleration of the Totten Glacier due to cooling and stiffening ice over timescales of centuries to millennia.
3.2 Oceanic drivers
Similarly to glaciers in the Amundsen Sea sector of West Antarctica, ice shelf thinning, grounding line retreat, and increased discharge at the Totten Glacier are linked to the incursion of warm modified circumpolar deep water (mCDW) through deeply incised bathymetric channels (Roberts et al., 2017; Silvano et al., 2018, 2019), evidenced from both airborne and shipborne measurements (Greenbaum et al., 2015; Rintoul et al., 2016). Ice shelf melt rates at the Totten Glacier have been estimated to exceed 50 m yr−1 near the grounding line (Adusumilli et al., 2020) and are among the largest observed melt rates in East Antarctica. Modelling indicates increased melt in recent decades, attributed primarily to freshening shelf water (Nakayama et al., 2021). This is despite a consistent trend of poleward migration and warming of mCDW off the shelf (Herraiz-Borreguero and Naveira Garabato, 2022; Yamazaki et al., 2021), which is projected to increase as the climate warms. However, observational evidence and modelling outputs are consistent with significant variability in melt rates as a result of variable mCDW supply in this region (Gwyther et al., 2014, 2018; Nakayama et al., 2021; Paolo et al., 2015; Silvano et al., 2019).
Links between ocean forcing and recent trends at the Vanderford Glacier are less well established than at the Totten Glacier. Data from seal dives suggest that the mCDW in Vincennes Bay is up to 0.5 ∘C and the warmest sampled to date in East Antarctica; however, temperatures at the Vanderford Glacier ice shelf of −0.5 ∘C are comparable to those at the Totten Glacier ice front of −0.4 ∘C (Ribeiro et al., 2021). The presence of a deep bathymetric trough at the Vanderford ice front (Commonwealth of Australia, 2022) provides a clear pathway for mCDW incursion to the ice shelf cavity, although the bathymetric connection from this trough to the continental shelf slope has not been mapped. It is hypothesised that the ocean is driving the observed retreat and thinning of the Vanderford Glacier 2003 to 2020 (Picton et al., 2023), but observations and modelling are needed to establish causal relationships.
Modelling has been used to evaluate the potential for enhanced melting on the Sabrina and Knox coasts over the coming centuries (Sun et al., 2016). Upwelling of mCDW is positively correlated with the Southern Annular Mode (SAM), and positive SAM trends are projected to continue through the 21st century, which could lead to enhanced mCDW-driven ice shelf melt (Herraiz-Borreguero and Naveira Garabato, 2022; Purich and England, 2021). Surface winds near the East Antarctic coastal margin are projected to intensify under climate warming (Fyfe et al., 2007; Spence et al., 2014; Wang, 2013), which could also increase wind-driven upwelling of mCDW to the continental shelf, and the supply of warm water to ice shelf cavities (Greene et al., 2017). Naughten et al. (2018) suggested that warming surface waters linked to a decline in summer sea ice cover could dominate freshening associated with ice sheet mass loss trends in this sector. A key caveat on modelling results is the generally low spatial resolution (hence coarsely resolved bathymetry) used and the fact that previous bathymetry products do not incorporate the deep bathymetric trough in Vincennes Bay (Commonwealth of Australia, 2022) important for warm water supply to the ice shelf cavity. Nevertheless, evidence consistently points to the possibility of increasing ocean-driven ice shelf melt in this sector.
The cumulation of these factors – the warmer mCDW in Vincennes Bay, the pathway for its incursion into the Vanderford ice shelf cavity, and the greater potential for grounding line retreat of the Vanderford Glacier into the Vanderford Trench compared to the buttressed Totten Glacier – suggests a potential heightened vulnerability of the Vanderford Glacier to continued thinning in the coming decades to centuries.
Here, we use the Ice-sheet and Sea-level System Model (ISSM; Larour et al., 2012) to quantify the impact on ice and basal water routing due to ice surface elevation changes at the Totten and Vanderford glaciers that are consistent with present-day flow dynamics and address the potential climate scenarios discussed in Sect. 3. That is, we generate three ice surface elevation perturbations, based on (1) an increase in SMB in the Totten catchment (defined as expSMB), (2) a decrease in basal friction in the Vincennes Bay catchment (defined as expFriction), and (3) a combination of (1) and (2) (defined as expCombined). The model setup and experiments are discussed in more detail below.
4.1 Model setup and experiments
The model domain covers the ASB (Fig. 1a) and comprises 58 938 anisotropic mesh elements. The initial bed topography, thickness, surface elevation, and ice masks are from BedMachine Antarctica v3 (Morlighem et al., 2020; Morlighem, 2022), and surface velocities are from MEaSUREs version 2 (MEaSUREs2; Rignot et al., 2011, 2017). Using the shallow shelf approximation (SSA; MacAyeal, 1989) and inverse methods, we calculate the basal friction coefficient across the grounded ASB using the Budd friction law (Budd et al., 1979), given by
where τb (Pa) is the basal shear stress, Cf () is the friction coefficient, and ub (m yr−1) is the basal sliding velocity. The effective pressure N (Pa) is given by , where ρice is the ice density (kg m−3), g is the gravitational acceleration (m s−2), h is the ice thickness (m), ρwater is the density of freshwater (kg m−3), and b is the bed elevation (m). We assume a Glen-type flow relation (Glen, 1953), where the viscosity μ (Pa s) is given by
and inverse methods over the entire domain to calculate the ice rigidity B (Pa s), for effective strain rate (s−1) and n=3. The inverse method relies on minimising a cost function that includes terms for the linear and logarithmic misfit between the simulated and observed surface velocities, as well as regularisation parameters that smooth strong gradients in the rigidity and basal friction coefficient (Morlighem et al., 2013). MEaSUREs2 velocities are used at the inflow boundaries, and a free-flux boundary condition is applied at the calving front.
Holding the grounding line positions fixed, we run a 200-year spin-up simulation with monthly time stepping, at the end of which the ice surface speed and geometry are in a pseudo steady state. For this simulation we use annual average surface mass balance from RACMO2.3p2 and basal melt rates are calculated using a parameterisation that linearly decreases the basal melt from 30 m yr−1 at ice shelf drafts of 400 m below sea level or deeper to 5 m yr−1 at ice shelf drafts of 200 m below sea level or shallower (Seroussi et al., 2017). The final ice velocities, surface elevation, and thicknesses from this simulation are used as the initial conditions for our perturbation experiments described below.
To generate ice surface elevation increases at the Totten Glacier (expSMB), we increase the annual average SMB as follows:
where SMBnew is the perturbation field, SMBRACMO is the observed annual average SMB from RACMO2.3p2 over the period 1979 to 2021 (van Wessem et al., 2018), and SMBt is the observed annual average SMB within the Totten catchment with zero SMB elsewhere in the ASB. Values for the constant β increase from 0.06 to 0.42, in increments of 0.06, and are chosen to represent the percentage increases in SMB that correspond to 1 ∘C increases in air surface temperature from 1 to 7 ∘C (Frieler et al., 2015). Although we note that other surface processes influence the SMB, we assume that increases in accumulation will dominate at basin scale.
To generate ice surface elevation decreases at the Vanderford Glacier (expFriction), we decrease the basal friction coefficient within the Vincennes Bay catchment as follows:
where Cnew is the perturbation field, Cf is the basal friction coefficient calculated using inversion (Fig. A1a), and Cv is the basal friction coefficient within the Vincennes Bay catchment which is zero elsewhere in the ASB (Fig. A1b). Values for the constant σ increase from 0.1 to 0.7 in increments of 0.1. These values are chosen to yield the same area-weighted percentage changes between the simulated surface elevation compared with the control, when averaged over the Vincennes Bay catchment, as the corresponding surface elevation change generated from expSMB. M is a mask that is generated by calculating the distance from the grounding line within the Vincennes Bay catchment and then normalising the field to vary linearly from 1 at the grounding line to 0 at the furthest point (on the southern inflow catchment boundary). We choose α=20 as the exponent to M, which concentrates the change in the basal friction coefficient within the ∼ 100 km upstream of the Vanderford Glacier grounding line (see Appendix A). We reduce the basal friction coefficient in the Vincennes Bay catchment rather than modify the basal melt rate because, although not directly observable, we expect a reduction in basal traction as a consequence of increased ocean melting, retreat, and acceleration. In this way, we avoid increasing the basal melt rates at the Vanderford Glacier relative to the Totten Glacier (given the lack of evidence for such a relative increase in ocean forcing), while still capturing the effects of continued retreat at the Vanderford Glacier, which is more likely than at the Totten Glacier over the coming decades to century (Sect. 3). We also emphasise that the aim here is not to model the expected evolution of this system but to generate surface change fields that are dynamically consistent with increasing SMB at the Totten Glacier and continued retreat at the Vanderford Glacier, to ascertain the impact of perturbations in the surface elevation on ice and basal water flow piracy.
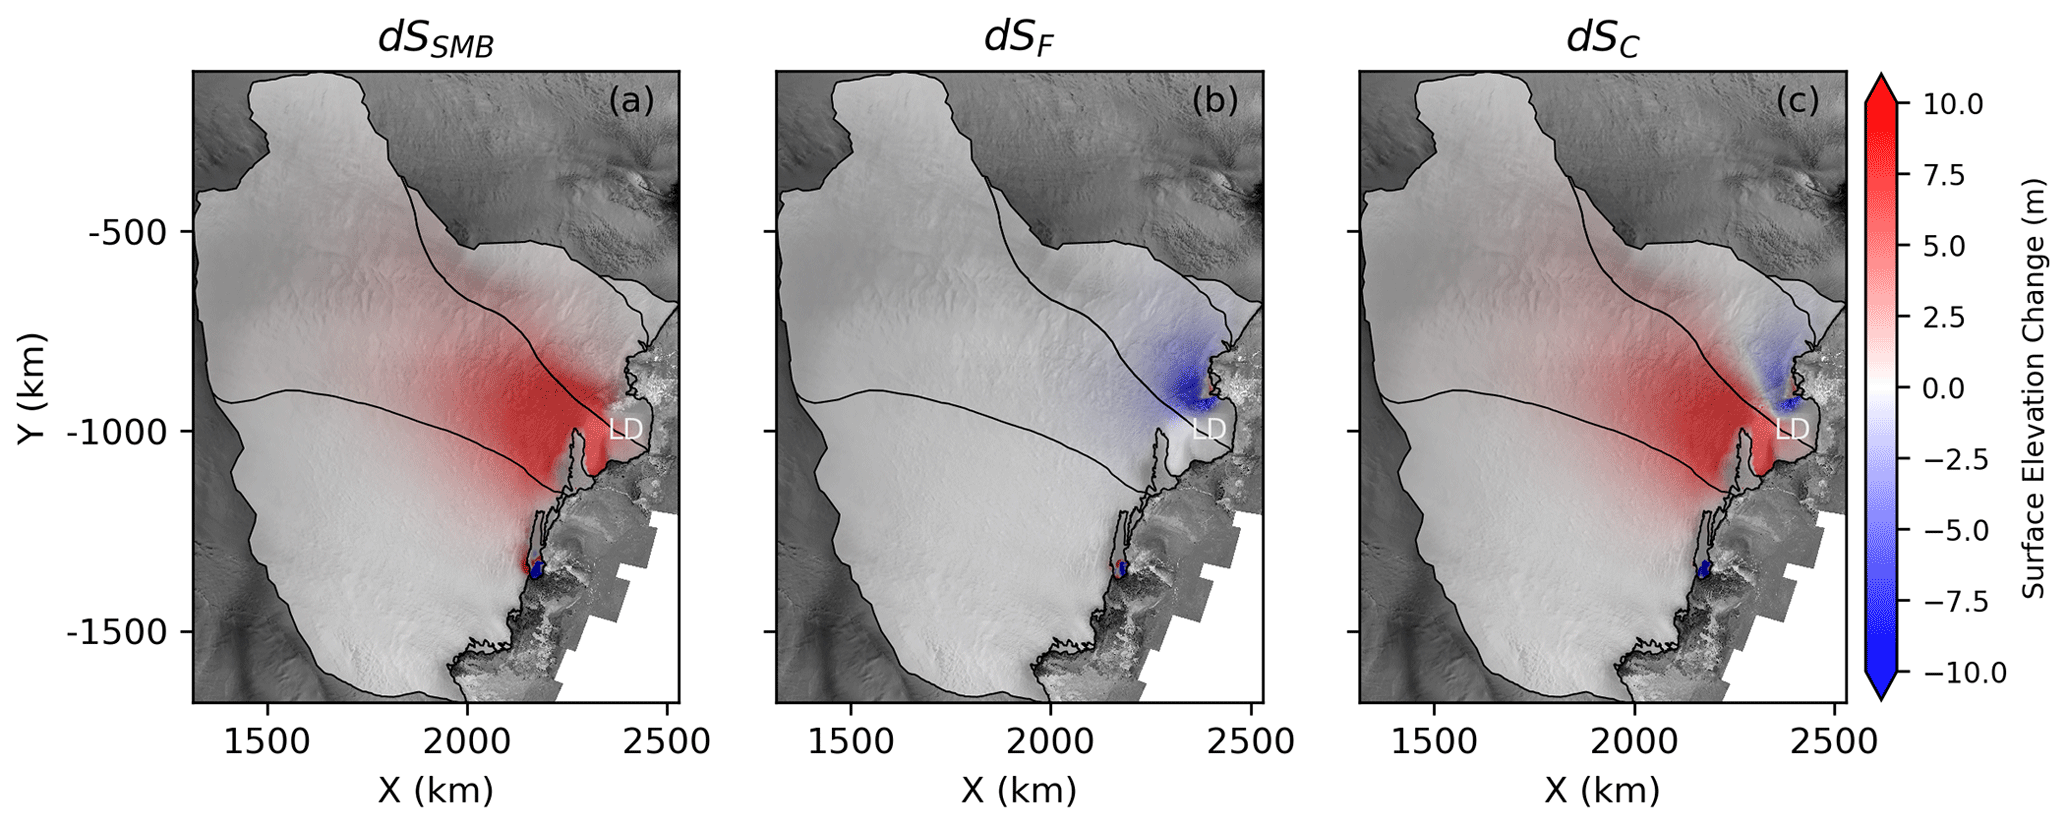
Figure 7Surface elevation changes (dSi) in the perturbation experiments compared with the control (m) for the 1 ∘C increase. (a) dSSMB (expSMB1), (b) dSF (expFriction1), and (c) dSC (expCombined1).
In addition to the expSMB and expFriction experiments, a third experiment (expCombined) combines the SMB and basal friction coefficient fields in Eqs. (3) and (4). Using the output geometries (thickness and surface elevation) and velocities from the pseudo-steady-state simulation, we run each of the perturbation experiments expSMB, expFriction, and expCombined for 1000 years with monthly time stepping. A 1000-year control run that uses the original SMBRACMO and Cf fields is also simulated. Figure 7 shows the differences between the perturbed surface elevations and the control (dSi, where the subscript i refers to SMB, F, or C) for an air surface temperature increase of 1 ∘C (i.e. for β=0.06 in Eq. 3 and σ=0.1 in Eq. 4), hereafter denoted expSMB1, expFriction1, and expCombined1.
4.2 Driving stresses and ice flow routing
We investigate the impact of the changed surface elevations on the driving stresses and ice flow routing within the ASB. The driving stress p (Pa) is given by
where ∇Si is the gradient in the perturbed surface elevation and the sum of the BedMachine surface elevation and each dSi field.
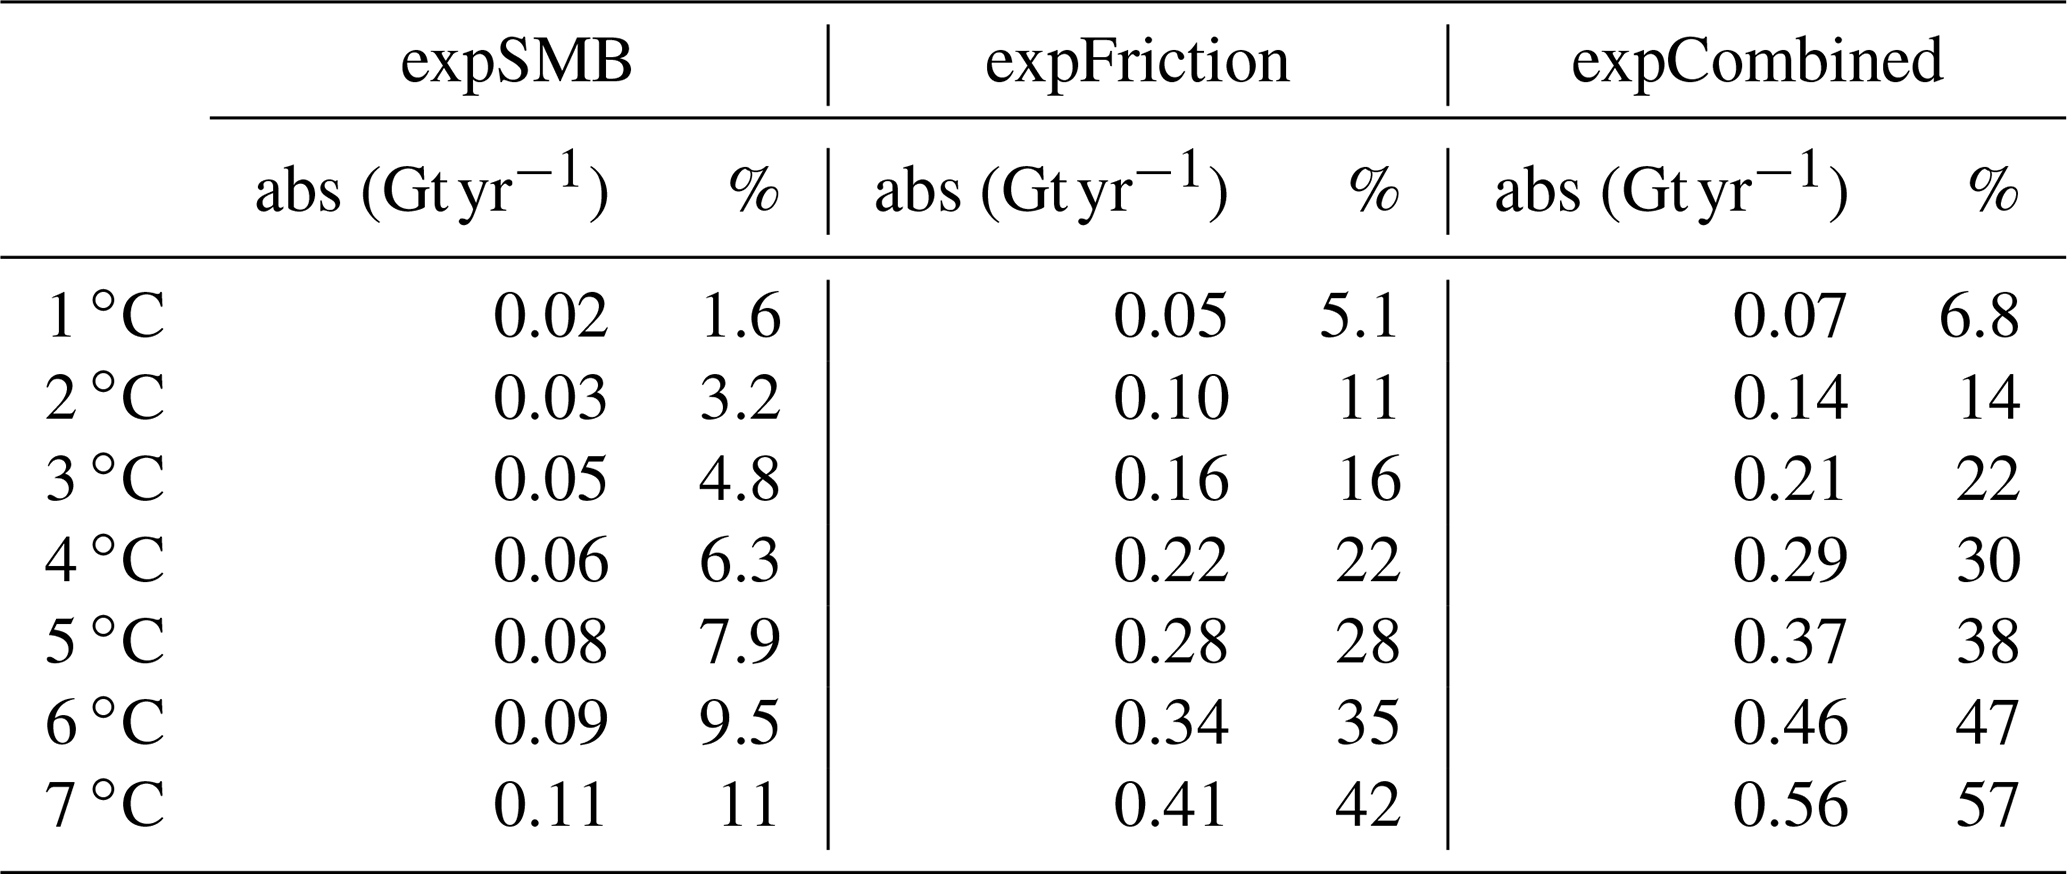
For expSMB1, the driving stress decreases through much of the interior of the ASB but increases within ∼ 10 km of the Totten Glacier grounding line. This is consistent with decreasing velocities upstream of the Totten Glacier grounding line but increasing velocities on the Totten Glacier ice shelf and the Vanderford Glacier ice shelf. The divide between the Totten and Vincennes Bay catchments migrates eastwards for expSMB1 compared with the catchments defined using the MEaSUREs2 velocities, increasing the Vincennes Bay catchment area by ∼ 1208 km2 (1.7 %; Table 1). This leads to a rerouting of ice flow from the Totten Glacier towards the Vanderford Glacier, with an increase in discharge from the Vanderford Glacier of ∼ 0.02 Gt yr−1 (i.e. 1.6 % increase; Table 2). Both trends increase with increasing air surface temperature change; for expSMB7, the Vincennes Bay catchment area increases by 17 % and the ice discharge increases by 11 %.
Table 1Absolute (abs) and percentage changes in the Vincennes Bay catchment areas at the end of the 1000-year perturbation experiments. The catchment area defined by the MEaSUREs2 velocities is 71 329 km2 (compared with 68 902 km2 defined by the Ice Sheet Mass Balance Intercomparison Exercise (IMBIE; Shepherd et al., 2012).
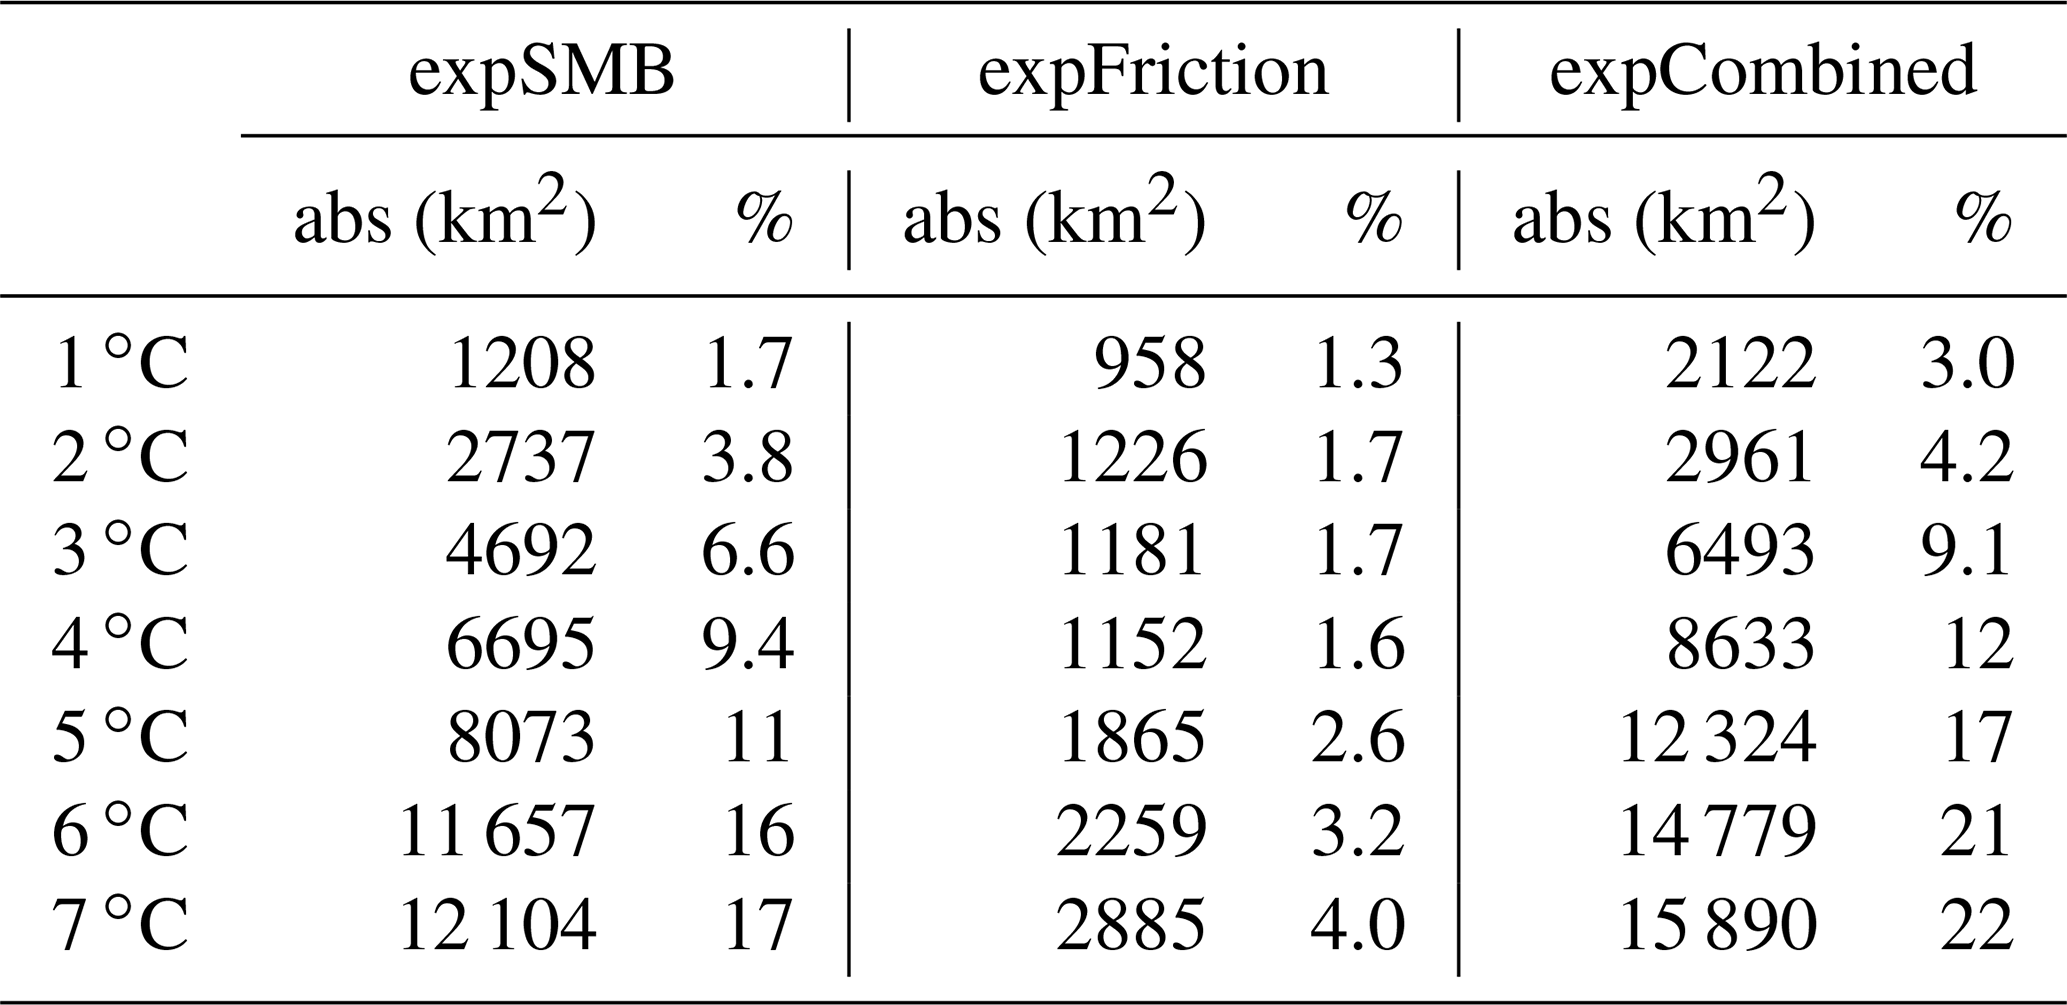
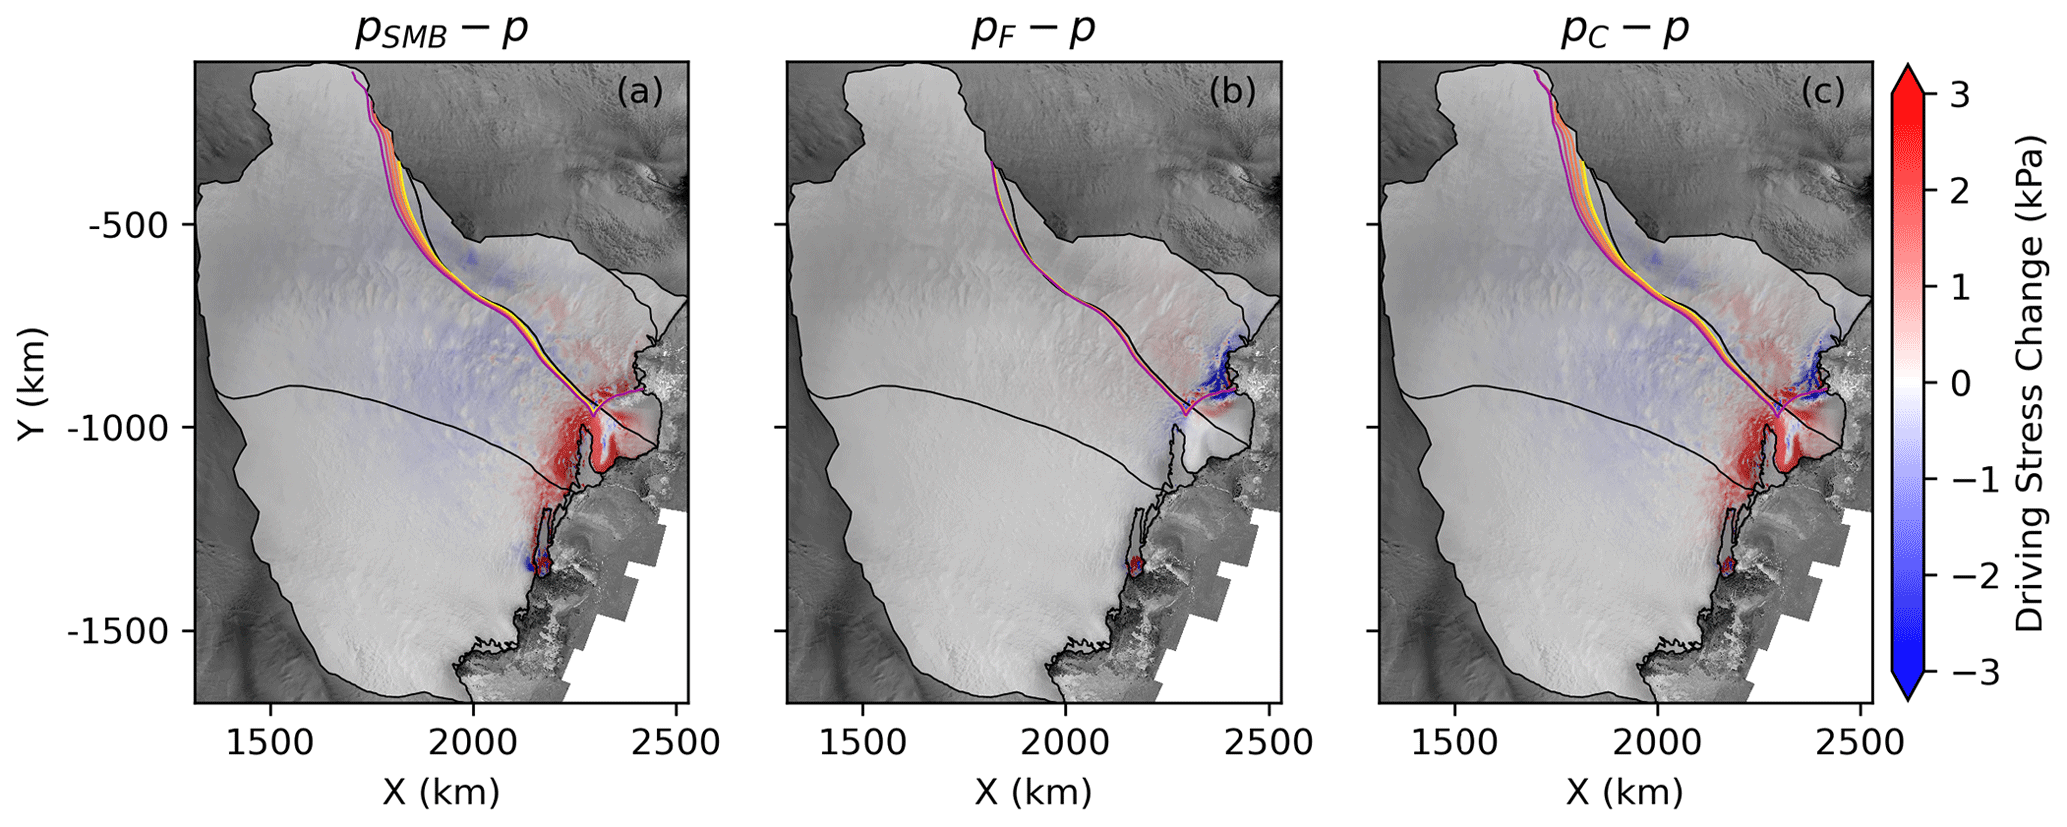
Figure 8Driving stress changes (kPa) in the perturbation experiments for a 1 ∘C increase compared with the control (m). (a) dSSMB (expSMB1), (b) dSF (expFriction1), and (c) dSC (expCombined1). The contours are the changes in the catchment divides for each of the perturbation experiments for 1 to 7 ∘C, coloured brightest to dullest (yellow to purple), respectively.
Decreasing the friction coefficient in the Vincennes Bay catchment (expFriction1) leads to immediate acceleration of the Vanderford Glacier and surface elevation lowering upstream of the grounding line (Fig. 7). The driving stress also decreases close to the grounding line and on the Vanderford Glacier ice shelf, although it increases upstream of the grounding line to the Elcheikh saddle point (Fig. 8). This also results in an eastwards migration of the divide (i.e. into the Totten catchment) between the Totten and Vincennes Bay catchments, increasing the Vincennes Bay catchment area by 958 km2 (1.3 %), which is less of a migration than observed in expSMB1. By contrast, the flux across the Vanderford Glacier grounding line increases by 5.1 %, which is over 3 times that of expSMB1, reflecting the greater increase in velocities in the Vincennes Bay catchment. For expFriction7, the discharge increases by 42 %, reflecting the greater sensitivity to relative increases in ice surface speed.
The driving stress changes for expCombined1, along with the changes in the Vincennes catchment areas and discharges, are close to a linear combination of expSMB1 and expFriction1 (Fig. 8). The magnitude of the differences increases for increasing air surface temperature, such that in expCombined7, the increase in the Vincennes Bay catchment area is ∼ 5 % larger than expSMB7 and the discharge 15 % larger than in expFriction7.
Table 2Absolute and percentage changes in the Vanderford Glacier discharge (Gt yr−1) at the end of the 1000-year perturbation experiments. Differences are with respect to the values calculated using MEaSUREs2 velocities.
4.3 Basal water routing
We next examine the sensitivity of basal water routing between the Totten and Vanderford glaciers due to changes in the surface elevation. We use the MATLAB TopoToolbox (Schwanghart and Scherler, 2014) to calculate the basal water accumulation across the ASB (the total upstream area in km2 that contributes to water accumulation within each individual grid cell). The upstream area is defined based on the basal water flow direction vector, which is calculated using the local slope in the effective pressure at the base of the ice sheet (Greene, 2023), and an upstream cell can provide water to only one neighbouring outlet cell. Here, rather than assuming overburden hydraulic potential, we use the parameterisation for the effective pressure NE given by McArthur et al. (2023), defined as
where rl, , and m are constants, and the fields hi are calculated by summing the BedMachine thickness and the perturbed thickness from each simulation. A summary of the derivation of this parameterisation is provided in Appendix B.
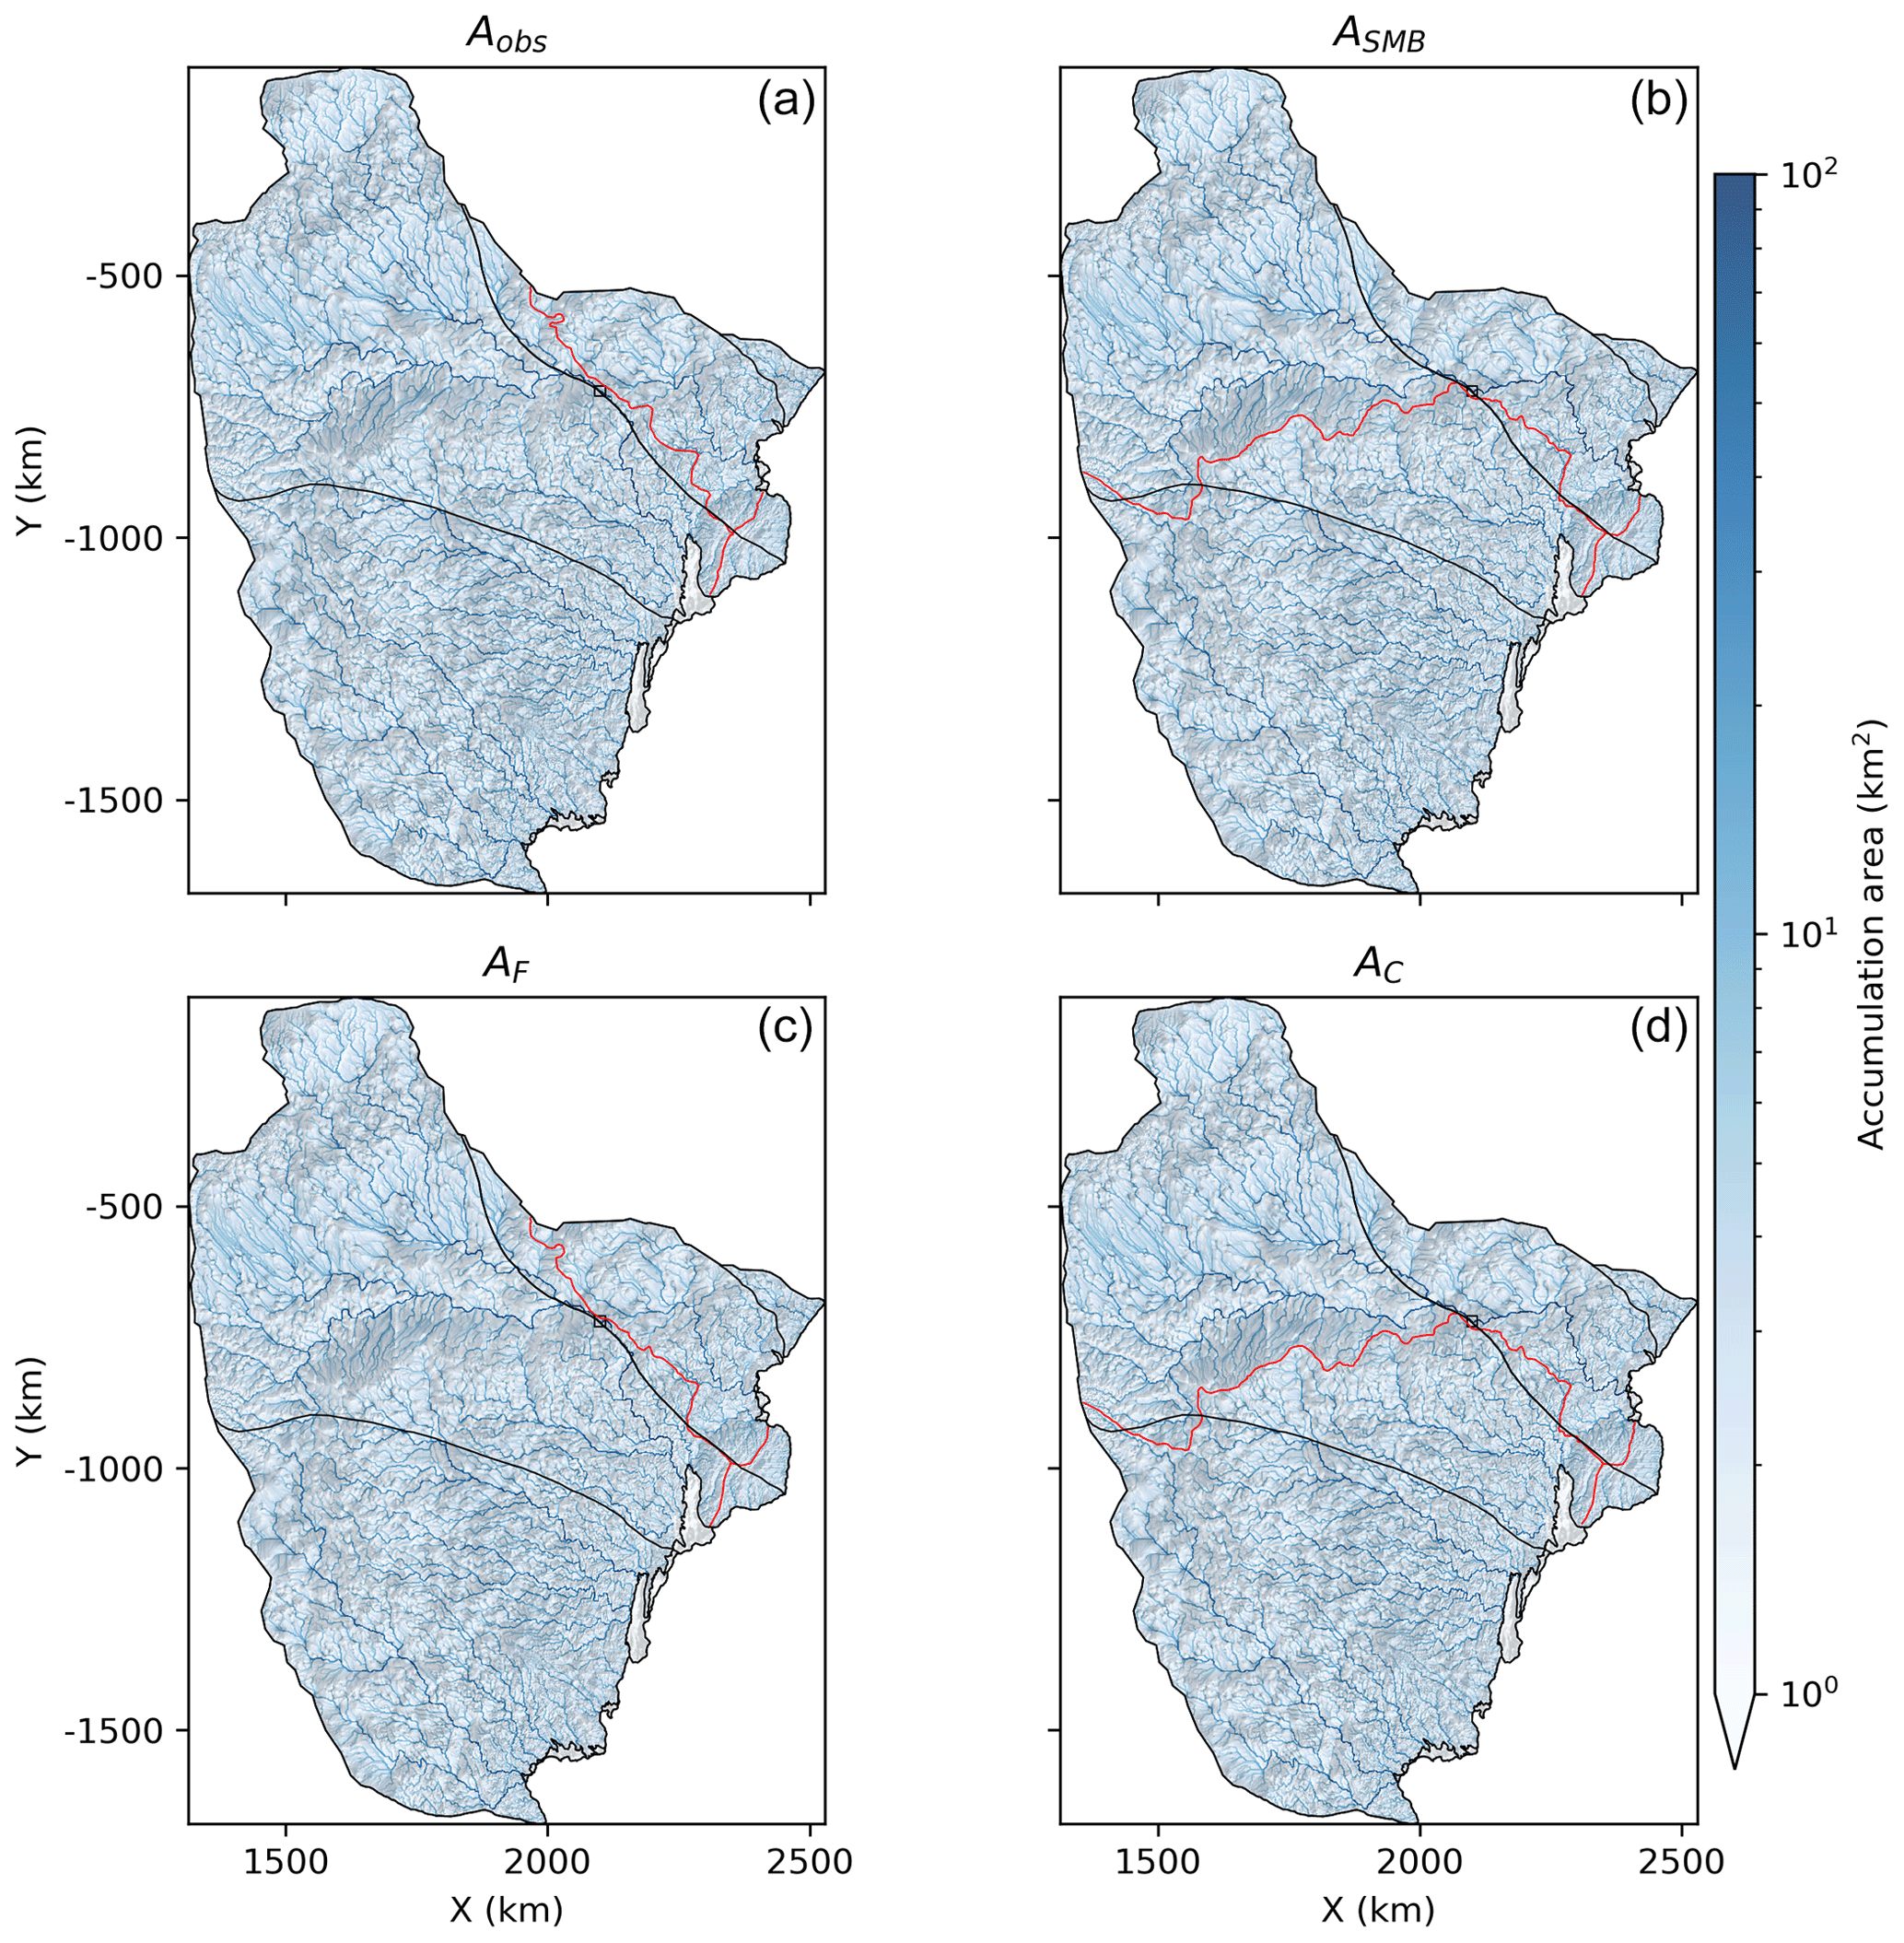
Figure 9Basal water accumulation (km2) using (a) BedMachine geometries (Aobs), (b) geometry fields from expSMB5 (ASMB), (c) geometry fields from expFriction5 (AF), and (d) geometry fields from expCombined5 (AC). The black square represents the switch point of changes in water routing between the different experiments. The black contours demarcate the IMBIE Totten and Vincennes Bay ice catchments. The red contours show the subglacial hydrological catchment divides, demarcating catchments that drain into the Knox and Sabrina coasts, respectively.
The basal water accumulation calculated using the BedMachine bed topography, thickness, and surface elevation is shown in Fig. 9a. Currently, basal water is preferentially routed towards Totten over any other glacier in the ASB. This pattern of basal water accumulation is very similar for each of the surface change experiments under 1 to 4 ∘C warming. However, for the expSMB5 and expCombined5 experiments, basal water piracy to Vincennes Bay occurs, with the glaciers in this sector draining almost the entire region in the interior of the ASB (Fig. 9b, d). Under these scenarios, the only water routing towards the Totten Glacier originates north of Highland B. The pattern is consistent, with little subsequent change, for air surface temperature increases above 5 ∘C. By contrast, basal water accumulation is relatively insensitive to changes in surface elevation associated with the basal traction reduction over the Vanderford catchment imposed in our experiments, over the entire investigated range (i.e. expFriction1 to expFriction7; Fig. 9c).
This study examined the potential for ice flow and basal water piracy between the Totten and Vincennes Bay catchments due to changes in the ice surface elevation induced by thinning at the Vanderford Glacier (e.g. due to ongoing grounding line retreat) and increased SMB at the Totten Glacier. For each scenario of ice surface elevation change, irrespective of the corresponding degree of warming, a rerouting of ice flow from the Totten Glacier towards the Vanderford Glacier occurred, with subsequent increases in the ice discharge at Vanderford. Increasing the SMB led to a greater eastward migration of the boundary between the two catchments than decreasing the basal traction, although the discharge towards Vanderford increased more substantially with increases in the basal friction coefficient. There was no amplification in the response when the two effects were combined, with increases in the discharge and Vincennes Bay catchment area towards the Vanderford that were essentially a linear superposition of the two separate effects.
Very little change was observed in the basal water routing for surface elevation changes corresponding to air surface temperature increases up to 4 ∘C. However, surface elevation increases in the expSMB5 and expCombined5 scenarios led to a re-routing of basal water from the Totten Glacier to the Vincennes Bay glaciers. This effect persisted under increasing air surface temperatures, with no subsequent change in routing. Interestingly, this effect was not observed in the cases of thinning at the Vanderford Glacier, even in the most extreme case (expFriction7). The switch in basal water routing from the Totten to the Vanderford Glacier was sudden, with otherwise relatively small variations in the overall basal water routing calculations. In all scenarios, the switch occurred within a region where the basal water routing from the ASB main basin converged, before diverging again to the Totten and Vincennes Bay catchments (as indicated in the black box, Fig. 9). The median ice surface increase from the expCombined4 to expCombined5 experiments compared with the control was 3.1 m in this region (i.e. from 12.4 m in expCombined4 to 15.5 m in expCombined5). Although this particular “switch” region may differ in our calculations using the hydraulic potential from those using a subglacial hydrology model, this result may indicate the importance of considering regions of flow convergence in the identification of tipping points in basal water routing.
The surface elevation changes generated in expFriction, and consequent impacts on ice and basal water routing, were strongly impacted by both how far inland the effect of reduced friction penetrated and the magnitude of the perturbation itself. Due to the limited region over which the perturbation in basal friction was concentrated, changes in the surface elevation far upstream were relatively minor compared with those resulting from thickening simulated at the Totten Glacier, limiting the corresponding magnitude of changes in the ice and basal water piracy. Hence, a greater response might occur if the thinning were to penetrate deeper into the ASB.
Our analysis relied on parameterised hydraulic potential to infer changes in basal water routing, which is not as robust as using a subglacial hydrology model that incorporates the full physics (Dow, 2019). For example, the growth of channels will impact the local hydraulic potential gradients – an effect which is neglected in this study. Dow (2019) also showed that the basal water routing between the Totten and Vanderford glaciers is highly sensitive to details in the bed topography elevations, such that uncertainties in the bed topography may influence calculations based on hydraulic potential. Furthermore, ice sheet–hydrology interactions could influence the sensitivity of ice and basal water routing, even under more minor changes in the overlying ice sheet geometry than those found here. If basal water piracy were to occur as the Vanderford Glacier retreats, enhanced basal lubrication at Vanderford could cause acceleration beyond what is currently predicted by many stand-alone ice sheet models (Seroussi et al., 2020). On the other hand, steeper surface elevation slopes in the Vanderford Glacier could result in larger and more efficient subglacial hydrology channel formation, which could cause a reduction in ice speed near the grounding line due to lower basal water pressures (Alley et al., 1994; Dow et al., 2022). Our analysis excluded the influence of variable melt rates (due to frictional or geothermal heat flow, e.g. McCormack et al., 2022) and changes in the groundwater flux due to loading and unloading (Li et al., 2022; Siegert et al., 2018), both of which impact the supply of water, as well as the flow routing. We also neglected basal hydro-thermomechanical processes, which impact overall ice flow dynamics (Arthern et al., 2015; Sergienko and Hindmarsh, 2013) and which have been shown to play a role in redistributing meltwater and impacting the strength of the bed in the Siple Coast ice streams (Bougamont et al., 2015). Uncertainty associated with these competing processes and the exact thresholds under which we might expect basal water piracy to occur motivates further investigation into coupled hydro-thermomechanical interactions and dynamics in the ASB.
Our numerical experiments were designed to simulate only the effects of increased surface elevation at the Totten Glacier and decreased surface elevation at the Vanderford Glacier and did not include the competing influence of thinning at the Totten Glacier nor ongoing grounding line retreat at the Vanderford Glacier. Satellite observations from 2012 have shown a lowering of the Totten Glacier surface elevation (Picton et al., 2023; Smith et al., 2020), with estimates of 1.2 ± 0.6 m yr−1 (Flament and Remy, 2012), linked to ocean-driven thinning of the ice shelf and consequent dynamic thinning of the upstream glacier (Li et al., 2016; Rignot et al., 2019; Roberts et al., 2017). Various ice sheet models predict continued thinning at the Totten Glacier under climate change scenarios into the future (Seroussi et al., 2020), which could outweigh gains in surface elevation from increased SMB. Nevertheless, the main Totten tributary is topographically constrained (Pelle et al., 2020), currently limiting its retreat beyond the Vanderford Trench ridge and into the upstream ASB main basin. By contrast, the Vanderford Glacier is currently the fastest-retreating glacier in EAIS and is retreating into a deepening subglacial bed (Morlighem et al., 2020). We did not include the effect of grounding line retreat at the Vanderford Glacier on the surface elevation changes generated here, although grounding line retreat is likely to compound the thinning simulated by our model. It is unclear how the rates of thinning at the Totten and Vanderford glaciers will evolve in the future, and it is possible that proportionally higher thinning at Vanderford than Totten could be sufficient to divert flow to the Vanderford Glacier.
There are a number of key uncertainties in how rapidly these glaciers will retreat in the future – including the impact of retreat into the marine basin of the ASB, as has been evidenced during past warm periods (Aitken et al., 2016; DeConto and Pollard, 2016; Golledge et al., 2015). First, detailed knowledge of the subglacial topography is essential in accurately predicting retreat rates, both in the ASB (McCormack et al., 2021) and elsewhere in Antarctica (Castleman et al., 2022; Schlegel et al., 2018; Seroussi et al., 2020), and the sensitivity of basal water routing to relatively small changes in the topography (Dow, 2019). There are relatively high uncertainties in ASB topography, particularly where there is (1) a paucity of radar transects, e.g. in the ASB main basin and basal water switch region (black box; Fig. 9); (2) relatively slow-flowing ice, e.g. in the interior of the ASB where mass conservation estimates of bed topography are less reliable; and (3) deep topography, where side reflections are strong and mask bed returns (Fig. 1d). For the latter, this is particularly the case in the Vanderford Glacier, upstream of the grounding line. Improved knowledge of the bed geometry and sediment characteristics in these regions is essential and should be a focus of future airborne surveys.
Second, SMB impacts the long-term evolution of the ice sheet geometry, yet projections in this region are highly uncertain. This is largely because coupled general circulation models used to project changes in accumulation are relatively coarse resolution (typically ∼ 100 km) – too coarse to accurately capture topographic or other effects that are essential in modelling Antarctic accumulation (e.g. Ghilain et al., 2022). This is likely to influence SMB projections, particularly in the region of high accumulation at the Totten Glacier, and hence predictions of whether, or to what degree, surface increases due to SMB could compensate for surface lowering due to ocean-driven thinning.
Finally, while links have been made between the presence of mCDW in the Vincennes Bay region (Ribeiro et al., 2021) and rapid retreat of the Vanderford Glacier in the past few decades (Picton et al., 2023), a causal relationship between ocean drivers and thinning and retreat has not been established. This is partly due to the relatively coarse spatial resolution of melt rates beneath the Vanderford Glacier ice shelf generated from satellite observations, which are also sparsely sampled in time (Greene et al., 2022), and a lack of consistent ocean state measurements in Vincennes Bay. Given that accurate knowledge of ocean melt rates is critical for ice sheet model simulations of retreat and the evidence for a strong observed warming trend of mCDW in this region of East Antarctica (Herraiz-Borreguero and Naveira Garabato, 2022), this emphasises the need for long-term ocean state monitoring in this region.
Coupled ice sheet–hydrology interactions may be at the heart of substantial ice and basal water reconfigurations in the past. For the Siple Coast ice streams, such reconfigurations have had a lasting impact on ice sheet mass balance: although the Kamb Ice Stream shutdown occurred about 170 years ago, its surface elevation is still increasing, contributing to positive mass balance. In this study, we considered the potential of the Totten and Vanderford glaciers, East Antarctica, to undergo such a reconfiguration. We find that the drainage divide between the Totten and Vanderford glaciers is transient and that relatively minor changes in the ice sheet geometry could cause ice flow piracy from the Totten to the Vanderford Glacier. For example, increasing the SMB at the Totten Glacier for scenarios between 1 and 7 ∘C of warming (SMB experiments), for corresponding magnitudes of thinning at the Vanderford Glacier (friction experiments) and for combinations of the two effects (combined experiments), leads to an increase in the Vincennes Bay catchment area of between 3 % and 22 %. The catchment boundary shifts up to 275 449 km for the SMB experiments, up to 30 019 km for the friction experiments, and up to 284 165 km for the combined experiments, where the maximum boundary migration occurs at the most inland point of the catchment and the minimum distance at the Elcheikh saddle point.
Our assessment of the basal water routing suggests that basal water piracy could also occur under larger ice sheet geometry changes, although this estimate is preliminary. The longer-term impacts of potential piracy from the Totten to the Vanderford Glacier on the flow dynamics, and hence overall mass balance, of this region are unknown. Given our finding that ice surface geometry changes can drive migration of the Totten–Vincennes Bay catchment boundary, determining how fast such changes might occur and their subsequent impacts on ice mass loss from the ASB and consequent global sea level rise deserves further investigation. If ice flow and basal water piracy is a result of coupled ice sheet–subglacial hydrology interactions, then without inclusion of these processes we may not be able to predict the occurrence of piracy here or elsewhere in Antarctica. The findings motivate further investigation into other regions of Antarctica that may be vulnerable to substantial flow reconfiguration, including the relevant processes that drive these changes and the timescales over which they could occur.
In Eq. (4) for the perturbed friction coefficient field, we choose α=20 to concentrate the reduction in basal friction close to the Vanderford Glacier grounding line, as it corresponds well with the region of maximal, weighted friction MCf (i.e. the region where MCf>100 ). We note that this impacts the depth of penetration of changes in the surface elevation into the ASB, as discussed in Sect. 5.
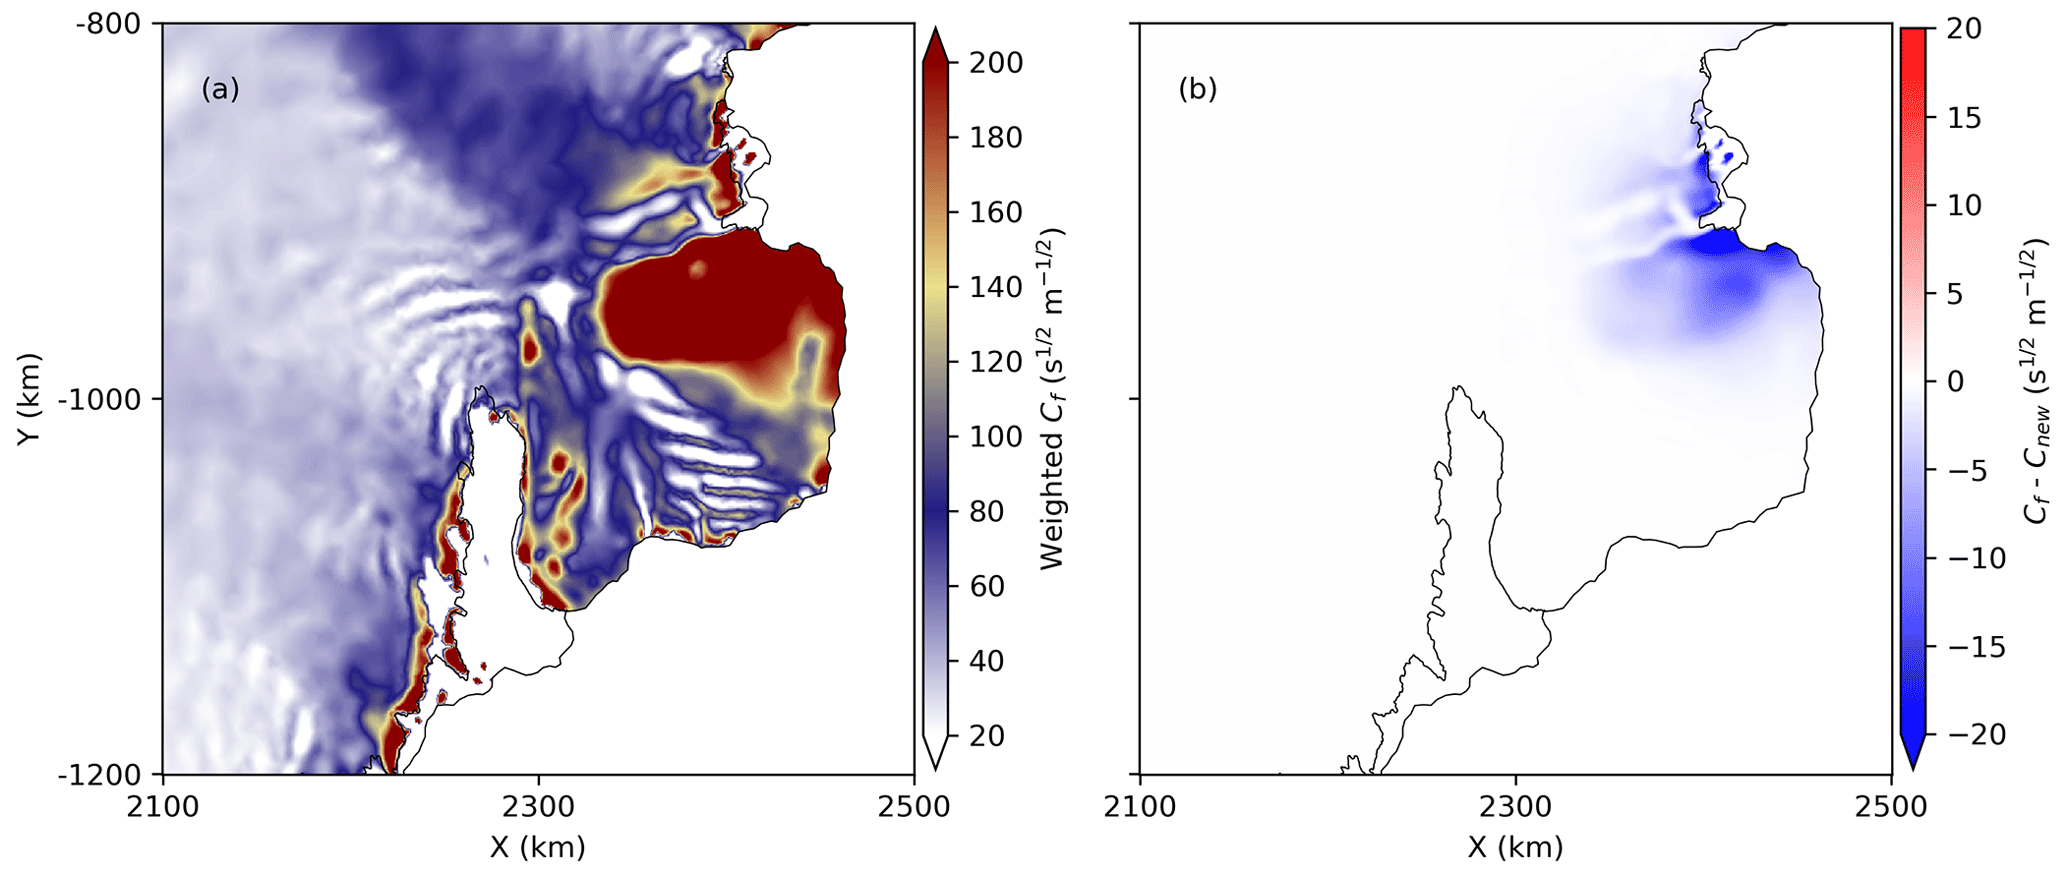
Figure A1(a) Basal friction coefficient Cf () calculated using inversion for the spin-up and weighted by M and (b) difference between Cf and Cnew for σ=0.1 ().
We use the parameterisation for the effective pressure (NE) defined in McArthur et al. (2023), which is given by
Here, ρice is the density of ice (kg m−3), g is the gravitational acceleration (m s−2), and h is ice thickness (m). Both and m are constants, γ is a constant representing the typical effective pressure as a fraction of the ice overburden pressure for regions of thick ice, rl is the basal water pressure as a fraction of the ice overburden pressure for ice thicknesses tending to zero, ht is a typical thickness value for thick ice, hs is a typical thickness value for thin ice, and ϵ is a small constant chosen so that the water pressure in regions of thin ice is low (rl+ϵ)ρicegh. To find values for the constants rl, γ, hs, and ht, and for ϵ=0.05, we use output from the GlaDS model from Dow et al. (2020) for the Totten and Vincennes Bay catchments, and similarly to McArthur et al. (2023), this results in rl=0.7, γ=0.96, hs=500 m, and ht=2800 m.
All of the datasets used in this study are publicly available. We use version 4.20 of the open-source ISSM software, which is freely available for download from https://issm.jpl.nasa.gov/download/ (see Larour et al., 2012). The datasets used to initialise the model are available via the corresponding articles cited in this paper. Namely, ice sheet geometries from BedMachine Antarctica v3 (Morlighem et al., 2020; Morlighem, 2022, https://doi.org/10.5067/FPSU0V1MWUB6) and surface velocities from MEaSUREs version 2 (Rignot et al., 2011, 2017, https://doi.org/10.5067/MEASURES/CRYOSPHERE/nsidc-0484.001).
FSM conceived and led the study, conducted the ice sheet modelling and analysis, and prepared the paper. BK contributed to the paper planning. JLR assisted with the ice sheet modelling methodology. KM provided analysis on the new effective pressures. All authors contributed to the preparation and editing of the paper.
At least one of the (co-)authors is a member of the editorial board of The Cryosphere. The peer-review process was guided by an independent editor, and the authors also have no other competing interests to declare.
Publisher’s note: Copernicus Publications remains neutral with regard to jurisdictional claims made in the text, published maps, institutional affiliations, or any other geographical representation in this paper. While Copernicus Publications makes every effort to include appropriate place names, the final responsibility lies with the authors.
We thank Poul Christoffersen for helpful discussions that improved the paper. This research was undertaken using resources from the National Computational Infrastructure Merit Allocation Scheme, supported by the Australian Government.
This research has been supported by the Australian Research Council (ARC) Special Research Initiative (SRI) Securing Antarctica's Environmental Future (SR200100005), ARC Discovery Early Career Awards (DE210101433, DE210101923), the ARC SRI Australian Centre for Excellence in Antarctic Science (SR200100008), the Natural Sciences and Engineering Research Council of Canada (grant no. NSERC RGPIN; 03761-2017), and the Canada Research Chairs (grant no. CRC 950-231237).
This paper was edited by Joseph MacGregor and reviewed by two anonymous referees.
Adusumilli, S., Fricker, H. A., Medley, B., Padman, L., and Siegfried, M. R.: Interannual Variations in Meltwater Input to the Southern Ocean from Antarctic Ice Shelves, Nat. Geosci., 13, 616–620, https://doi.org/10.1038/s41561-020-0616-z, 2020. a
Aitken, A. R. A. and Urosevic, L.: A Probabilistic and Model-Based Approach to the Assessment of Glacial Detritus from Ice Sheet Change, Palaeogeogr. Palaeocl., 561, 110053, https://doi.org/10.1016/j.palaeo.2020.110053, 2021. a
Aitken, A. R. A., Roberts, J. L., van Ommen, T. D., Young, D. A., Golledge, N. R., Greenbaum, J. S., Blankenship, D. D., and Siegert, M. J.: Repeated Large-Scale Retreat and Advance of Totten Glacier Indicated by Inland Bed Erosion, Nature, 533, 385–389, https://doi.org/10.1038/nature17447, 2016. a, b
Aitken, A. R. A., Li, L., Kulessa, B., Schroeder, D., Jordan, T. A., Whittaker, J. M., Anandakrishnan, S., Dawson, E. J., Wiens, D. A., Eisen, O., and Siegert, M. J.: Antarctic Sedimentary Basins and Their Influence on Ice-Sheet Dynamics, Rev. Geophys., 61, e2021RG000767, https://doi.org/10.1029/2021RG000767, 2023. a, b, c
Alley, R. B., Anandakrishnan, S., Bentley, C. R., and Lord, N.: A Water-Piracy Hypothesis for the Stagnation of Ice Stream C, Antarctica, Ann. Glaciol., 20, 187–194, https://doi.org/10.3189/1994AoG20-1-187-194, 1994. a, b
Arndt, J. E., Schenke, H. W., Jakobsson, M., Nitsche, F. O., Buys, G., Goleby, B., Rebesco, M., Bohoyo, F., Hong, J., Black, J., Greku, R., Udintsev, G., Barrios, F., Reynoso-Peralta, W., Taisei, M., and Wigley, R.: The International Bathymetric Chart of the Southern Ocean (IBCSO) Version 1.0 – A New Bathymetric Compilation Covering Circum-Antarctic Waters, Geophys. Res. Lett., 40, 3111–3117, https://doi.org/10.1002/grl.50413, 2013. a
Arthern, R. J., Hindmarsh, R. C. A., and Williams, C. R.: Flow Speed within the Antarctic Ice Sheet and Its Controls Inferred from Satellite Observations, J. Geophys. Res., 120, 1171–1188, https://doi.org/10.1002/2014JF003239, 2015. a
Austermann, J., Pollard, D., Mitrovica, J., Moucha, R., Forte, A., R.M, D., Rowley, R., and Raymo, M.: The Impact of Dynamic Topography Change on Antarctic Ice Sheet Stability during the Mid-Pliocene Warm Period, Geology, 43, https://doi.org/10.1130/G36988.1, 2015. a
Beaud, F., Venditti, J. G., Flowers, G. E., and Koppes, M.: Excavation of Subglacial Bedrock Channels by Seasonal Meltwater Flow, Earth Surf. Proc. Land., 43, 1960–1972, https://doi.org/10.1002/esp.4367, 2018. a, b
Beem, L. H., Tulaczyk, S. M., King, M. A., Bougamont, M., Fricker, H. A., and Christoffersen, P.: Variable Deceleration of Whillans Ice Stream, West Antarctica, J. Geophys. Res.-Earth, 119, 212–224, https://doi.org/10.1002/2013JF002958, 2014. a
Bell, R. E., Blankenship, D. D., Finn, C. A., Morse, D. L., Scambos, T. A., Brozena, J. M., and Hodge, S. M.: Influence of Subglacial Geology on the Onset of a West Antarctic Ice Stream from Aerogeophysical Observations, Nature, 394, 58–62, https://doi.org/10.1038/27883, 1998. a
Bougamont, M., Christoffersen, P., Price, S. F., Fricker, H. A., Tulaczyk, S., and Carter, S. P.: Reactivation of Kamb Ice Stream Tributaries Triggers Century-Scale Reorganization of Siple Coast Ice Flow in West Antarctica, Geophys. Res. Lett., 42, 8471–8480, https://doi.org/10.1002/2015GL065782, 2015. a, b
Bromwich, D. H.: Snowfall in High Southern Latitudes, Rev. Geophys., 26, 149–168, https://doi.org/10.1029/RG026i001p00149, 1988. a, b
Budd, W. F., Keage, P., and Blundy, N.: Empirical Studies of Ice Sliding, J. Glaciol., 23, 157–170, 1979. a
Castleman, B. A., Schlegel, N.-J., Caron, L., Larour, E., and Khazendar, A.: Derivation of bedrock topography measurement requirements for the reduction of uncertainty in ice-sheet model projections of Thwaites Glacier, The Cryosphere, 16, 761–778, https://doi.org/10.5194/tc-16-761-2022, 2022. a
Catania, G., Hulbe, C., Conway, H., Scambos, T. A., and Raymond, C. F.: Variability in the Mass Flux of the Ross Ice Streams, West Antarctica, over the Last Millennium, J. Glaciol., 58, 741–752, https://doi.org/10.3189/2012JoG11J219, 2012. a
Commonwealth of Australia: RSV Nuyina Voyage 2 2021-22 Voyage Data, Southern Ocean, Antarctica, Commonwealth of Australia, https://doi.org/10.26179/ZZ6J-E834, 2022. a, b, c, d
Cook, C. P., van de Flierdt, T., Williams, T., Hemming, S. R., Iwai, M., Kobayashi, M., Jimenez, Escutia, C., Gonzalez, J. J., Khim, B., McKay, R. M., Passchier, S., Bohaty, S. M., Riesselman, C. R., Tauxe, L., Sugisaki, S., Galindo, A. L., Patterson, M. O., Sangiorgi, F., Pierce, E. L., Brinkhuis, H., Klaus, A., Fehr, A., Bendle, J. A. P., Bijl, P. K., Carr, S. A., Dunbar, R. B., Flores, J. A., Hayden, T. G., Katsuki, K., Kong, G. S., Nakai, M., Olney, M. P., Pekar, S. F., Pross, J., Rohl, U., Sakai, T., Shrivastava, P. K., Stickley, C. E., Tuo, S., Welsh, K., and Yamane, M.: Dynamic Behaviour of the East Antarctic Ice Sheet during Pliocene Warmth, Nat. Geosci., 6, 765–769, https://doi.org/10.1038/ngeo1889, 2013. a
DeConto, R. and Pollard, D.: Contribution of Antarctica to Past and Future Sea-Level Rise, Nature, 531, 591–597, https://doi.org/10.1038/nature17145, 2016. a, b
Dow, C. F.: How Well Does the Equal-Pressure Hydraulic Potential Approach Work for Estimating Subglacial Hydrological Networks?, in: American Geophyiscal Union Fall Meeting 2019, San Francisco, 9–13 December 2019, C13C–1310, https://doi.org/10.1017/aog.2023.9, 2019. a, b, c
Dow, C. F., McCormack, F. S., Young, D. A., Greenbaum, J. S., Roberts, J. L., and Blankenship, D. D.: Totten Glacier Subglacial Hydrology Determined from Geophysics and Modeling, Earth Planet. Sc. Lett., 531, 115961, https://doi.org/10.1016/j.epsl.2019.115961, 2020. a, b, c, d, e, f
Dow, C. F., Ross, N., Jeofry, H., Siu, K., and Siegert, M. J.: Antarctic Basal Environment Shaped by High-Pressure Flow through a Subglacial River System, Nat. Geosci., 15, 892–898, https://doi.org/10.1038/s41561-022-01059-1, 2022. a
Flament, T. and Remy, F.: Dynamic Thinning of Antarctic Glaciers from Along-Track Repeat Radar Altimetry, J. Glaciol., 58, 830–840, https://doi.org/10.3189/2012JoG11J118, 2012. a
Frieler, K., Clark, P. U., He, F., Buizert, C., Reese, R., Ligtenberg, S. R. M., van den Broeke, M. R., Winkelmann, R., and Levermann, A.: Consistent Evidence of Increasing Antarctic Accumulation with Warming, Nat. Clim. Change, 5, 348–352, 2015. a
Fürst, J., Durand, G., Gillet-Chaulet, F., Tavard, T., Rankl, M., Braun, M., and Gagliardini, O.: The Safety Band of Antarctic Ice Shelves, Nat. Clim. Change, 6, 479–482, https://doi.org/10.1038/NCLIMATE2912, 2016. a
Fyfe, J. C., Saenko, O. A., Zickfeld, K., Eby, M., and Weaver, A. J.: The Role of Poleward-Intensifying Winds on Southern Ocean Warming, J. Climate, 20, 5391–5400, https://doi.org/10.1175/2007JCLI1764.1, 2007. a
Ghilain, N., Vannitsem, S., Dalaiden, Q., Goosse, H., De Cruz, L., and Wei, W.: Large ensemble of downscaled historical daily snowfall from an earth system model to 5.5 km resolution over Dronning Maud Land, Antarctica, Earth Syst. Sci. Data, 14, 1901–1916, https://doi.org/10.5194/essd-14-1901-2022, 2022. a
Glen, J. W.: Rate of Flow of Polycrystalline Ice, Nature, 172, 721–722, 1953. a
Golledge, N. R., Kowalewski, D. E., Naish, T. R., Levy, R. H., Fogwill, C. J., and Gasson, E. G.: The Multi-Millennial Antarctic Commitment to Future Sea-Level Rise, Nature, 526, 421, https://doi.org/10.1038/nature15706, 2015. a
Greenbaum, J. S., Blankenship, D. D., Young, D. A., Richter, T. G., Roberts, J. L., Aitken, A. R. A., Legresy, B., Schroeder, D. M., Warner, R. C., van Ommen, T. D., and Siegert, M. J.: Ocean Access to a Cavity beneath Totten Glacier in East Antarctica, Nat. Geosci., 8, 294–298, https://doi.org/10.1038/ngeo2388, 2015. a
Greene, C.: How to estimate subglacial water routes, MATLAB Central File Exchange, https://www.mathworks.com/matlabcentral/fileexchange/55352-how-to-estimate-subglacial-water-routes, last access: 20 January 2023. a
Greene, C. A., Blankenship, D. D., Gwyther, D. E., Silvano, A., and van Wijk, E.: Wind Causes Totten Ice Shelf Melt and Acceleration, Science Advances, 3, e1701681, https://doi.org/10.1126/sciadv.1701681, 2017. a
Greene, C. A., Gardner, A. S., Schlegel, N.-J., and Fraser, A. D.: Antarctic Calving Loss Rivals Ice-Shelf Thinning, Nature, 609, 948–953, https://doi.org/10.1038/s41586-022-05037-w, 2022. a
Gudmundsson, G. H., Paolo, F. S., Adusumilli, S., and Fricker, H. A.: Instantaneous Antarctic Ice Sheet Mass Loss Driven by Thinning Ice Shelves, Geophys. Res. Lett., 46, 13903–13909, https://doi.org/10.1029/2019GL085027, 2019. a
Gwyther, D. E., Galton-Fenzi, B. K., Hunter, J. R., and Roberts, J. L.: Simulated melt rates for the Totten and Dalton ice shelves, Ocean Sci., 10, 267–279, https://doi.org/10.5194/os-10-267-2014, 2014. a
Gwyther, D. E., O'Kane, T. J., Galton-Fenzi, B. K., Monselesan, D. P., and Greenbaum, J. S.: Intrinsic Processes Drive Variability in Basal Melting of the Totten Glacier Ice Shelf, Nat. Commun., 9, 3141, https://doi.org/10.1038/s41467-018-05618-2, 2018. a
Herraiz-Borreguero, L. and Naveira Garabato, A. C.: Poleward Shift of Circumpolar Deep Water Threatens the East Antarctic Ice Sheet, Nat. Clim. Change, 12, 728–734, https://doi.org/10.1038/s41558-022-01424-3, 2022. a, b, c
Hochmuth, K., Gohl, K., Leitchenkov, G., Sauermilch, I., Whittaker, J. M., Uenzelmann-Neben, G., Davy, B., and De Santis, L.: The Evolving Paleobathymetry of the Circum-Antarctic Southern Ocean Since 34 Ma: A Key to Understanding Past Cryosphere-Ocean Developments, Geochem. Geophy. Geosy., 21, e2020GC009122, https://doi.org/10.1029/2020GC009122, 2020. a, b
Hulbe, C. and Fahnestock, M.: Century-Scale Discharge Stagnation and Reactivation of the Ross Ice Streams, West Antarctica, J. Geophys. Res.-Earth, 112, F03S27, https://doi.org/10.1029/2006JF000603, 2007. a
Joughin, I. and Tulaczyk, S.: Positive Mass Balance of the Ross Ice Streams, West Antarctica, Science, 295, 476–480, https://doi.org/10.1126/science.1066875, 2002. a
Kirkham, J. D., Hogan, K. A., Larter, R. D., Arnold, N. S., Nitsche, F. O., Golledge, N. R., and Dowdeswell, J. A.: Past water flow beneath Pine Island and Thwaites glaciers, West Antarctica, The Cryosphere, 13, 1959–1981, https://doi.org/10.5194/tc-13-1959-2019, 2019. a, b, c, d
Krinner, G., Magand, O., Simmonds, I., Genthon, C., and Dufresne, J. L.: Simulated Antarctic Precipitation and Surface Mass Balance at the End of the Twentieth and Twenty-First Centuries, Clim. Dynam., 28, 215–230, https://doi.org/10.1007/s00382-006-0177-x, 2007. a
Larour, E., Seroussi, H., Morlighem, M., and Rignot, E.: Continental Scale, High Order, High Spatial Resolution, Ice Sheet Modeling Using the Ice Sheet System Model (ISSM), J. Geophys. Res.-Earth, 117, F01022, https://doi.org/10.1029/2011JF002140, 2012 (ISSM model code available at: https://issm.jpl.nasa.gov/download/, last access: 30 October 2023). a, b
Li, L., Aitken, A. R. A., Lindsay, M. D., and Kulessa, B.: Sedimentary Basins Reduce Stability of Antarctic Ice Streams through Groundwater Feedbacks, Nat. Geosci., 15, 645–650, https://doi.org/10.1038/s41561-022-00992-5, 2022. a, b, c, d, e
Li, X., Rignot, E., Mouginot, J., and Scheuchl, B.: Ice Flow Dynamics and Mass Loss of Totten Glacier, East Antarctica, from 1989 to 2015, Geophys. Res. Lett., 43, 6366–6373, https://doi.org/10.1002/2016GL069173, 2016. a, b
Lowe, A. L. and Anderson, J. B.: Evidence for Abundant Subglacial Meltwater beneath the Paleo-Ice Sheet in Pine Island Bay, Antarctica, J. Glaciol., 49, 125–138, https://doi.org/10.3189/172756503781830971, 2003. a
MacAyeal, D.: Large-Scale Ice Flow over a Viscous Basal Sediment: Theory and Application to Ice Stream B, Antarctica, J. Geophys. Res., 94, 4071–4087, 1989. a
Maritati, A., Halpin, J. A., Whittaker, J. M., and Daczko, N. R.: Fingerprinting Proterozoic Bedrock in Interior Wilkes Land, East Antarctica, Sci. Rep.-UK, 9, 10192, https://doi.org/10.1038/s41598-019-46612-y, 2019. a
McArthur, K., McCormack, F. S., and Dow, C. F.: Basal conditions of Denman Glacier from glacier hydrology and ice dynamics modeling, The Cryosphere Discuss. [preprint], https://doi.org/10.5194/tc-2023-28, in review, 2023. a, b, c
McCormack, F. S., Roberts, J. L., Gwyther, D. E., Morlighem, M., Pelle, T., and Galton-Fenzi, B. K.: The Impact of Variable Ocean Temperatures on Totten Glacier Stability and Discharge, Geophys. Res. Lett., 48, e2020GL091790, https://doi.org/10.1029/2020GL091790, 2021. a, b, c
McCormack, F. S., Roberts, J. L., Dow, C. F., Stål, T., Halpin, J. A., Reading, A. M., and Siegert, M. J.: Fine-Scale Geothermal Heat Flow in Antarctica Can Increase Simulated Subglacial Melt Estimates, Geophys. Res. Lett., 49, e2022GL098539, https://doi.org/10.1029/2022GL098539, 2022. a
McKay, D. I., Staal, A., Abrams, J. F., Winkelmann, R., Sakschewski, B., Loriani, S., Fetzer, I., Cornell, S. E., Rockström, J., and Lenton, T. M.: Exceeding 1.5 ∘C Global Warming Could Trigger Multiple Climate Tipping Points, Science, 377, eabn7950, https://doi.org/10.1126/science.abn7950, 2022. a
Morgan, V., Wookey, C., Li, J., van Ommen, T., Skinner, W., and Fitzpatrick, M.: Site Information and Initial Results from Deep Ice Drilling on Law Dome, Antarctica, J. Glaciol., 43, 3–10, 1997. a
Morlighem, M.: MEaSUREs BedMachine Antarctica, Version 3, NASA National Snow and Ice Data Center Distributed Active Archive Center, Boulder, Colorado USA [data set], https://doi.org/10.5067/FPSU0V1MWUB6, 2022. a
Morlighem, M., Seroussi, H., Larour, E., and Rignot, E.: Inversion of Basal Friction in Antarctica Using Exact and Incomplete Adjoints of a Higher-Order Model, J. Geophys. Res., 118, 1746–1753, https://doi.org/10.1002/jgrf.20125, 2013. a
Morlighem, M., Rignot, E., Binder, T., Blankenship, D., Drews, R., Eagles, G., Eisen, O., Ferraccioli, F., Forsberg, R., Fretwell, P., Goel, V., Greenbaum, J. S., Gudmundsson, H., Guo, J., Helm, V., Hofstede, C., Howat, I., Humbert, A., Jokat, W., Karlsson, N. B., Lee, W. S., Matsuoka, K., Millan, R., Mouginot, J., Paden, J., Pattyn, F., Roberts, J., Rosier, S., Ruppel, A., Seroussi, H., Smith, E. C., Steinhage, D., Sun, B., van den Broeke, M. R., van Ommen, T. D., van Wessem, M., and Young, D. A.: Deep Glacial Troughs and Stabilizing Ridges Unveiled beneath the Margins of the Antarctic Ice Sheet, Nat. Geosci., 13, 132–137, https://doi.org/10.1038/s41561-019-0510-8, 2020. a, b, c, d, e, f, g
Nakayama, Y., Greene, C. A., Paolo, F. S., Mensah, V., Zhang, H., Kashiwase, H., Simizu, D., Greenbaum, J. S., Blankenship, D. D., Abe-Ouchi, A., and Aoki, S.: Antarctic Slope Current Modulates Ocean Heat Intrusions Towards Totten Glacier, Geophys. Res. Lett., 48, e2021GL094149, https://doi.org/10.1029/2021GL094149, 2021. a, b
Naughten, K. A., Meissner, K. J., Galton-Fenzi, B. K., England, M. H., Timmermann, R., and Hellmer, H. H.: Future Projections of Antarctic Ice Shelf Melting Based on CMIP5 Scenarios, J. Climate, 31, 5243–5261, https://doi.org/10.1175/JCLI-D-17-0854.1, 2018. a
Nitsche, F. O., Gohl, K., Larter, R. D., Hillenbrand, C.-D., Kuhn, G., Smith, J. A., Jacobs, S., Anderson, J. B., and Jakobsson, M.: Paleo ice flow and subglacial meltwater dynamics in Pine Island Bay, West Antarctica, The Cryosphere, 7, 249–262, https://doi.org/10.5194/tc-7-249-2013, 2013. a
Noble, T. L., Rohling, E. J., Aitken, A. R. A., Bostock, H. C., Chase, Z., Gomez, N., Jong, L. M., King, M. A., Mackintosh, A. N., McCormack, F. S., McKay, R. M., Menviel, L., Phipps, S. J., Weber, M. E., Fogwill, C. J., Gayen, B., Golledge, N. R., Gwyther, D. E., McC. Hogg, A. Martos, Y. M., Pena-Molino, B., Roberts, J., van de Flierdt, T., and Williams, T.: The Sensitivity of the Antarctic Ice Sheet to a Changing Climate: Past, Present, and Future, Rev. Geophys., 58, e2019RG000663, https://doi.org/10.1029/2019RG000663, 2020. a
Paolo, F., Fricker, H., and Padman, L.: Volume Loss from Antarctic Ice Shelves Is Accelerating, Science, 348, 327–331, https://doi.org/10.1126/science.aaa0940, 2015. a
Pelle, T., Morlighem, M., and McCormack, F. S.: Aurora Basin, the Weak Underbelly of East Antarctica, Geophys. Res. Lett., 47, e2019GL086821, https://doi.org/10.1029/2019GL086821, 2020. a, b, c, d
Pelle, T., Morlighem, M., Nakayama, Y., and Seroussi, H.: Widespread Grounding Line Retreat of Totten Glacier, East Antarctica, Over the 21st Century, Geophys. Res. Lett., 48, e2021GL093213, https://doi.org/10.1029/2021GL093213, 2021. a
Picton, H. J., Stokes, C. R., Jamieson, S. S. R., Floricioiu, D., and Krieger, L.: Extensive and anomalous grounding line retreat at Vanderford Glacier, Vincennes Bay, Wilkes Land, East Antarctica, The Cryosphere, 17, 3593–3616, https://doi.org/10.5194/tc-17-3593-2023, 2023. a, b, c, d, e, f
Purich, A. and England, M. H.: Historical and Future Projected Warming of Antarctic Shelf Bottom Water in CMIP6 Models, Geophys. Res. Lett., 48, e2021GL092752, https://doi.org/10.1029/2021GL092752, 2021. a
Ribeiro, N., Herraiz-Borreguero, L., Rintoul, S. R., McMahon, C. R., Hindell, M., Harcourt, R., and Williams, G.: Warm Modified Circumpolar Deep Water Intrusions Drive Ice Shelf Melt and Inhibit Dense Shelf Water Formation in Vincennes Bay, East Antarctica, J. Geophys. Res.-Oceans, 126, e2020JC016998, https://doi.org/10.1029/2020JC016998, 2021. a, b
Rignot, E., Mouginot, J., and Scheuchl, B.: Ice Flow of the Antarctic Ice Sheet, Science, 333, 1427–1430, https://doi.org/10.1126/science.1208336, 2011. a, b
Rignot, E., Mouginot, J., and Scheuchl, B.: MEaSUREs InSAR-based Antarctica Ice Velocity Map 450m V2.0, NASA DAAC at the National Snow and Ice Data Center [data set], https://doi.org/10.5067/MEASURES/CRYOSPHERE/nsidc-0484.001, 2017. a
Rignot, E., Mouginot, J., Scheuchl, B., van den Broeke, M., van Wessem, M. J., and Morlighem, M.: Four Decades of Antarctic Ice Sheet Mass Balance from 1979–2017, P. Natl. Acad. Sci. USA, 116, 1095–1103, 2019. a, b, c
Rignot, E., Mouginot, J., Scheuchl, B., and Jeong, S.: Changes in Antarctic Ice Sheet Motion Derived from Satellite Radar Interferometry between 1995 and 2022, Geophys. Res. Lett., 49, e2022GL100141, https://doi.org/10.1029/2022GL100141, 2022. a
Rintoul, S. R., Silvano, A., Pena-Molino, B., van Wijk, E., Rosenberg, M., Greenbaum, J. S., and Blankenship, D. D.: Ocean Heat Drives Rapid Basal Melt of the Totten Ice Shelf, Science Advances, 2, e1601610, https://doi.org/10.1126/sciadv.1601610, 2016. a
Roberts, J., Plummer, C., Vance, T., van Ommen, T., Moy, A., Poynter, S., Treverrow, A., Curran, M., and George, S.: A 2000-year annual record of snow accumulation rates for Law Dome, East Antarctica, Clim. Past, 11, 697–707, https://doi.org/10.5194/cp-11-697-2015, 2015. a
Roberts, J. L., Galton-Fenzi, B. K., Paolo, F. S., Donnelly, C., Gwyther, D. E., Padman, L., Young, D. A., Warner, R. C., Greenbaum, J. S., Fricker, H. A., Payne, A. J., Cornford, S., Le Brocq, A., van Ommen, T., Blankenship, D. D., and Siegert, M. J.: Ocean Forced Variability of Totten Glacier Mass Loss, Geol. Soc. Spec. Pub., 461, 175–186, https://doi.org/10.1144/SP461.6, 2017. a, b, c, d
Schlegel, N.-J., Seroussi, H., Schodlok, M. P., Larour, E. Y., Boening, C., Limonadi, D., Watkins, M. M., Morlighem, M., and van den Broeke, M. R.: Exploration of Antarctic Ice Sheet 100-year contribution to sea level rise and associated model uncertainties using the ISSM framework, The Cryosphere, 12, 3511–3534, https://doi.org/10.5194/tc-12-3511-2018, 2018. a
Schroeder, D. M., Blankenship, D. D., and Young, D. A.: Evidence for a Water System Transition beneath Thwaites Glacier, West Antarctica, P. Natl. Acad. Sci. USA, 110, 12225–12228, https://doi.org/10.1073/pnas.1302828110, 2013. a
Schwanghart, W. and Scherler, D.: Short Communication: TopoToolbox 2 – MATLAB-based software for topographic analysis and modeling in Earth surface sciences, Earth Surf. Dynam., 2, 1–7, https://doi.org/10.5194/esurf-2-1-2014, 2014. a
Sergienko, O. V. and Hindmarsh, R. C.: Regular Patterns in Frictional Resistance of Ice-Stream Beds Seen by Surface Data Inversion, Science, 342, 1086–1089, 2013. a, b
Seroussi, H., Nakayama, Y., Larour, E., Menemenlis, D., Morlighem, M., Rignot, E., and Khazendar, A.: Continued Retreat of Thwaites Glacier, West Antarctica, Controlled by Bed Topography and Ocean Circulation, Geophys. Res. Lett., 44, 6191–6199, https://doi.org/10.1002/2017GL072910, 2017. a
Seroussi, H., Nowicki, S., Payne, A. J., Goelzer, H., Lipscomb, W. H., Abe-Ouchi, A., Agosta, C., Albrecht, T., Asay-Davis, X., Barthel, A., Calov, R., Cullather, R., Dumas, C., Galton-Fenzi, B. K., Gladstone, R., Golledge, N. R., Gregory, J. M., Greve, R., Hattermann, T., Hoffman, M. J., Humbert, A., Huybrechts, P., Jourdain, N. C., Kleiner, T., Larour, E., Leguy, G. R., Lowry, D. P., Little, C. M., Morlighem, M., Pattyn, F., Pelle, T., Price, S. F., Quiquet, A., Reese, R., Schlegel, N.-J., Shepherd, A., Simon, E., Smith, R. S., Straneo, F., Sun, S., Trusel, L. D., Van Breedam, J., van de Wal, R. S. W., Winkelmann, R., Zhao, C., Zhang, T., and Zwinger, T.: ISMIP6 Antarctica: a multi-model ensemble of the Antarctic ice sheet evolution over the 21st century, The Cryosphere, 14, 3033–3070, https://doi.org/10.5194/tc-14-3033-2020, 2020. a, b, c, d
Shepherd, A., Ivins, E. R., Barletta, V. R., Bentley, M. J., Bettadpur, S., Briggs, K. H., Bromwich, D. H., Forsberg, R., Galin, N., Horwath, M., and Jacobs, S.: A reconciled estimate of ice-sheet mass balance, Science, 338, 1183–1189, https://doi.org/10.1126/science.1228102, 2012. a
Siegert, M., Ross, N., Corr, H., Kingslake, J., and Hindmarsh, R.: Late Holocene Ice-Flow Reconfiguration in the Weddell Sea Sector of West Antarctica, Quaternary Sci. Rev., 78, 98–107, https://doi.org/10.1016/j.quascirev.2013.08.003, 2013. a
Siegert, M. J., Kulessa, B., Bougamont, M., Christoffersen, P., Key, K., Andersen, K. R., Booth, A. D., and Smith, A. M.: Antarctic Subglacial Groundwater: A Concept Paper on Its Measurement and Potential Influence on Ice Flow, Geol. Soc. Spec. Pub., 461, 197–213, https://doi.org/10.1144/SP461.8, 2018. a, b, c
Siegert, M. J., Kingslake, J., Ross, N., Whitehouse, P. L., Woodward, J., Jamieson, S. S. R., Bentley, M. J., Winter, K., Wearing, M., Hein, A. S., Jeofry, H., and Sugden, D. E.: Major Ice Sheet Change in the Weddell Sea Sector of West Antarctica Over the Last 5,000 Years, Rev. Geophys., 57, 1197–1223, https://doi.org/10.1029/2019RG000651, 2019. a
Silvano, A., Rintoul, S. R., Pe na-Molino, B., Hobbs, W. R., van Wijk, E., Aoki, S., Tamura, T., and Williams, G. D.: Freshening by Glacial Meltwater Enhances Melting of Ice Shelves and Reduces Formation of Antarctic Bottom Water, Science Advances, 4, eaap9467, https://doi.org/10.1126/sciadv.aap9467, 2018. a
Silvano, A., Rintoul, S. R., Kusahara, K., Pe na-Molino, B., van Wijk, E., Gwyther, D. E., and Williams, G. D.: Seasonality of Warm Water Intrusions Onto the Continental Shelf Near the Totten Glacier, J. Geophys. Res.-Oceans, 124, 4272–4289, https://doi.org/10.1029/2018JC014634, 2019. a, b
Smith, B., Fricker, H. A., Gardner, A. S., Medley, B., Nilsson, J., Paolo, F. S., Holschuh, N., Adusumilli, S., Brunt, K., Csatho, B., Harbeck, K., Markus, T., Neumann, T., Siegfried, M. R., and Zwally, H. J.: Pervasive Ice Sheet Mass Loss Reflects Competing Ocean and Atmosphere Processes, Science, 368, 1239–1242, https://doi.org/10.1126/science.aaz5845, 2020. a, b
Smith, B. E., Fricker, H. A., Joughin, I. R., and Tulaczyk, S.: An Inventory of Active Subglacial Lakes in Antarctica Detected by ICESat (2003–2008), J. Glaciol., 55, 573–595, https://doi.org/10.3189/002214309789470879, 2009. a
Spence, P., Griffies, S. M., England, M. H., Hogg, A. M., Saenko, O. A., and Jourdain, N. C.: Rapid Subsurface Warming and Circulation Changes of Antarctic Coastal Waters by Poleward Shifting Winds, Geophys. Res. Lett., 41, 4601–4610, https://doi.org/10.1002/2014GL060613, 2014. a
Stokes, C. R., Abram, N. J., Bentley, M. J., Edwards, T. L., England, M. H., Foppert, A., Jamieson, S. S. R., Jones, R. S., King, M. A., Lenaerts, J. T. M., Medley, B., Miles, B. W. J., Paxman, G. J. G., Ritz, C., van de Flierdt, T., and Whitehouse, P. L.: Response of the East Antarctic Ice Sheet to Past and Future Climate Change, Nature, 608, 275–286, https://doi.org/10.1038/s41586-022-04946-0, 2022. a
Sun, S., Cornford, S. L., Gwyther, D. E., Gladstone, R. M., Galton-Fenzi, B. K., Zhao, L., and Moore, J. C.: Impact of Ocean Forcing on the Aurora Basin in the 21st and 22nd Centuries, Ann. Glaciol., 57, 79–86, https://doi.org/10.1017/aog.2016.27, 2016. a, b, c
Thomas, E. R., van Wessem, J. M., Roberts, J., Isaksson, E., Schlosser, E., Fudge, T. J., Vallelonga, P., Medley, B., Lenaerts, J., Bertler, N., van den Broeke, M. R., Dixon, D. A., Frezzotti, M., Stenni, B., Curran, M., and Ekaykin, A. A.: Regional Antarctic snow accumulation over the past 1000 years, Clim. Past, 13, 1491–1513, https://doi.org/10.5194/cp-13-1491-2017, 2017. a
Udy, D. G., Vance, T. R., Kiem, A. S., Holbrook, N. J., and Curran, M. A. J.: Links between Large-Scale Modes of Climate Variability and Synoptic Weather Patterns in the Southern Indian Ocean, J. Climate, 34, 883–899, https://doi.org/10.1175/JCLI-D-20-0297.1, 2021. a
van Wessem, J. M., van de Berg, W. J., Noël, B. P. Y., van Meijgaard, E., Amory, C., Birnbaum, G., Jakobs, C. L., Krüger, K., Lenaerts, J. T. M., Lhermitte, S., Ligtenberg, S. R. M., Medley, B., Reijmer, C. H., van Tricht, K., Trusel, L. D., van Ulft, L. H., Wouters, B., Wuite, J., and van den Broeke, M. R.: Modelling the climate and surface mass balance of polar ice sheets using RACMO2 – Part 2: Antarctica (1979–2016), The Cryosphere, 12, 1479–1498, https://doi.org/10.5194/tc-12-1479-2018, 2018. a, b, c
Vaughan, D. G., Corr, H. F. J., Smith, A. M., Pritchard, H. D., and Shepherd, A.: Flow-Switching and Water Piracy between Rutford Ice Stream and Carlson Inlet, West Antarctica, J. Glaciol., 54, 41–48, https://doi.org/10.3189/002214308784409125, 2008. a, b
Wang, Z.: On the Response of Southern Hemisphere Subpolar Gyres to Climate Change in Coupled Climate Models, J. Geophys. Res.-Oceans, 118, 1070–1086, https://doi.org/10.1002/jgrc.20111, 2013. a
Westerhold, T., Marwan, N., Drury, A. J., Liebrand, D., Agnini, C., Anagnostou, E., Barnet, J. S. K., Bohaty, S. M., De Vleeschouwer, D., Florindo, F., Frederichs, T., Hodell, D. A., Holbourn, A. E., Kroon, D., Lauretano, V., Littler, K., Lourens, L. J., Lyle, M., Pälike, H., Röhl, U., Tian, J., Wilkens, R. H., Wilson, P. A., and Zachos, J. C.: An Astronomically Dated Record of Earth's Climate and Its Predictability over the Last 66 Million Years, Science, 369, 1383–1387, https://doi.org/10.1126/science.aba6853, 2020. a
Williams, T., van de Flierdt, T., Hemming, S. R., Chung, E., Roy, M., and Goldstein, S. L.: Evidence for Iceberg Armadas from East Antarctica in the Southern Ocean during the Late Miocene and Early Pliocene, Earth Planet. Sc. Lett., 290, 351–361, https://doi.org/10.1016/j.epsl.2009.12.031, 2010. a
Wilson, D. J., Bertram, R. A., Needham, E. F., van de Flierdt, T., Welsh, K. J., McKay, R. M., Mazumder, A., Riesselman, C. R., Jimenez-Espejo, F. J., and Escutia, C.: Ice Loss from the East Antarctic Ice Sheet during Late Pleistocene Interglacials, Nature, 561, 383–386, https://doi.org/10.1038/s41586-018-0501-8, 2018. a
Wright, A. P., Young, D. A., Roberts, J. L., Schroeder, D. M., Bamber, J. L., Dowdeswell, J. A., Young, N. W., Le Brocq, A. M., Warner, R. C., Payne, A. J., Blankenship, D. D., van Ommen, T. D., and Siegert, M. J.: Evidence of a Hydrological Connection between the Ice Divide and Ice Sheet Margin in the Aurora Subglacial Basin, East Antarctica, J. Geophys. Res.-Earth, 117, https://doi.org/10.1029/2011JF002066, 2012. a
Yamazaki, K., Aoki, S., Katsumata, K., Hirano, D., and Nakayama, Y.: Multidecadal Poleward Shift of the Southern Boundary of the Antarctic Circumpolar Current off East Antarctica, Science Advances, 7, eabf8755, https://doi.org/10.1126/sciadv.abf8755, 2021. a
Young, D. A., Schroeder, D. M., Blankenship, D. D., Kempf, S. D., and Quartini, E.: The Distribution of Basal Water between Antarctic Subglacial Lakes from Radar Sounding, Philos. T. R. Soc. A, 374, 20140297, https://doi.org/10.1098/rsta.2014.0297, 2016. a, b, c
Zwally, H. J., Giovinetto, M. B., Beckley, M. A., and Saba, J. L.: Antarctic and Greenland Drainage Systems, GSFC Cryospheric Sciences Laboratory, https://earth.gsfc.nasa.gov/cryo/data/polar-altimetry/antarctic-and-greenland-drainage-systems (last access: 21 February 2023), 2012. a
- Abstract
- Introduction
- Controls on the ASB flow configuration
- Climate drivers of the ASB
- Sensitivity of driving stress and hydraulic potential to changes in surface elevation
- Discussion and summary
- Conclusions
- Appendix A: Friction coefficient reduction
- Appendix B: The effective pressure calculation
- Data availability
- Author contributions
- Competing interests
- Disclaimer
- Acknowledgements
- Financial support
- Review statement
- References