the Creative Commons Attribution 4.0 License.
the Creative Commons Attribution 4.0 License.
 | 18 Oct 2023
Late Holocene glacier and climate fluctuations in the Mackenzie and Selwyn mountain ranges, northwestern Canada
Brian Menounos
Brent M. Goehring
Gerald Osborn
Ben M. Pelto
Christopher M. Darvill
Joerg M. Schaefer
Over the last century, northwestern Canada experienced some of the highest rates of tropospheric warming globally, which caused glaciers in the region to rapidly retreat. Our study seeks to extend the record of glacier fluctuations and assess climate drivers prior to the instrumental record in the Mackenzie and Selwyn mountains of northwestern Canada. We collected 27 10Be surface exposure ages across nine cirque and valley glacier moraines to constrain the timing of their emplacement. Cirque and valley glaciers in this region reached their greatest Holocene extents in the latter half of the Little Ice Age (1600–1850 CE). Four erratic boulders, 10–250 m distal from late Holocene moraines, yielded 10Be exposure ages of 10.9–11.6 ka, demonstrating that by ca. 11 ka, alpine glaciers were no more extensive than during the last several hundred years. Estimated temperature change obtained through reconstruction of equilibrium line altitudes shows that since ca. 1850 CE, mean annual temperatures have risen 0.2–2.3 ∘C. We use our glacier chronology and the Open Global Glacier Model (OGGM) to estimate that from 1000 CE, glaciers in this region reached a maximum total volume of 34–38 km3 between 1765 and 1855 CE and had lost nearly half their ice volume by 2019 CE. OGGM was unable to produce modeled glacier lengths that match the timing or magnitude of the maximum glacier extent indicated by the 10Be chronology. However, when applied to the entire Mackenzie and Selwyn mountain region, past millennium OGGM simulations using the Max Planck Institute Earth System Model (MPI-ESM) and the Community Climate System Model 4 (CCSM4) yield late Holocene glacier volume change temporally consistent with our moraine and remote sensing record, while the Meteorological Research Institute Earth System Model 2 (MRI-ESM2) and the Model for Interdisciplinary Research on Climate (MIROC) fail to produce modeled glacier change consistent with our glacier chronology. Finally, OGGM forced by future climate projections under varying greenhouse gas emission scenarios predicts 85 % to over 97 % glacier volume loss by the end of the 21st century. The loss of glaciers from this region will have profound impacts on local ecosystems and communities that rely on meltwater from glacierized catchments.
- Article
(5320 KB) - Full-text XML
-
Supplement
(101138 KB) - BibTeX
- EndNote


Between 1990 and 2020 CE, northwestern Canada warmed by 1.1 ∘C above the 1961–1990 CE average (Muñoz-Sabater et al., 2021), which contributed to the loss of an estimated 0.429 ± 0.232 km3 of ice in the Mackenzie and Selwyn mountains of eastern Yukon and Northwest Territories between 2000 and 2020 CE (Fig. 1; Hugonnet et al., 2021). Glaciers in this region are clearly responding to recent climate warming, but proxy evidence of past climate change is scarce (Tomkins et al., 2008; Dyke, 1990). Reconstructions of when and how glaciers responded to past climate change provide one method for estimating paleoclimatic conditions, while also placing the rate of modern glacier change into a geologic context.
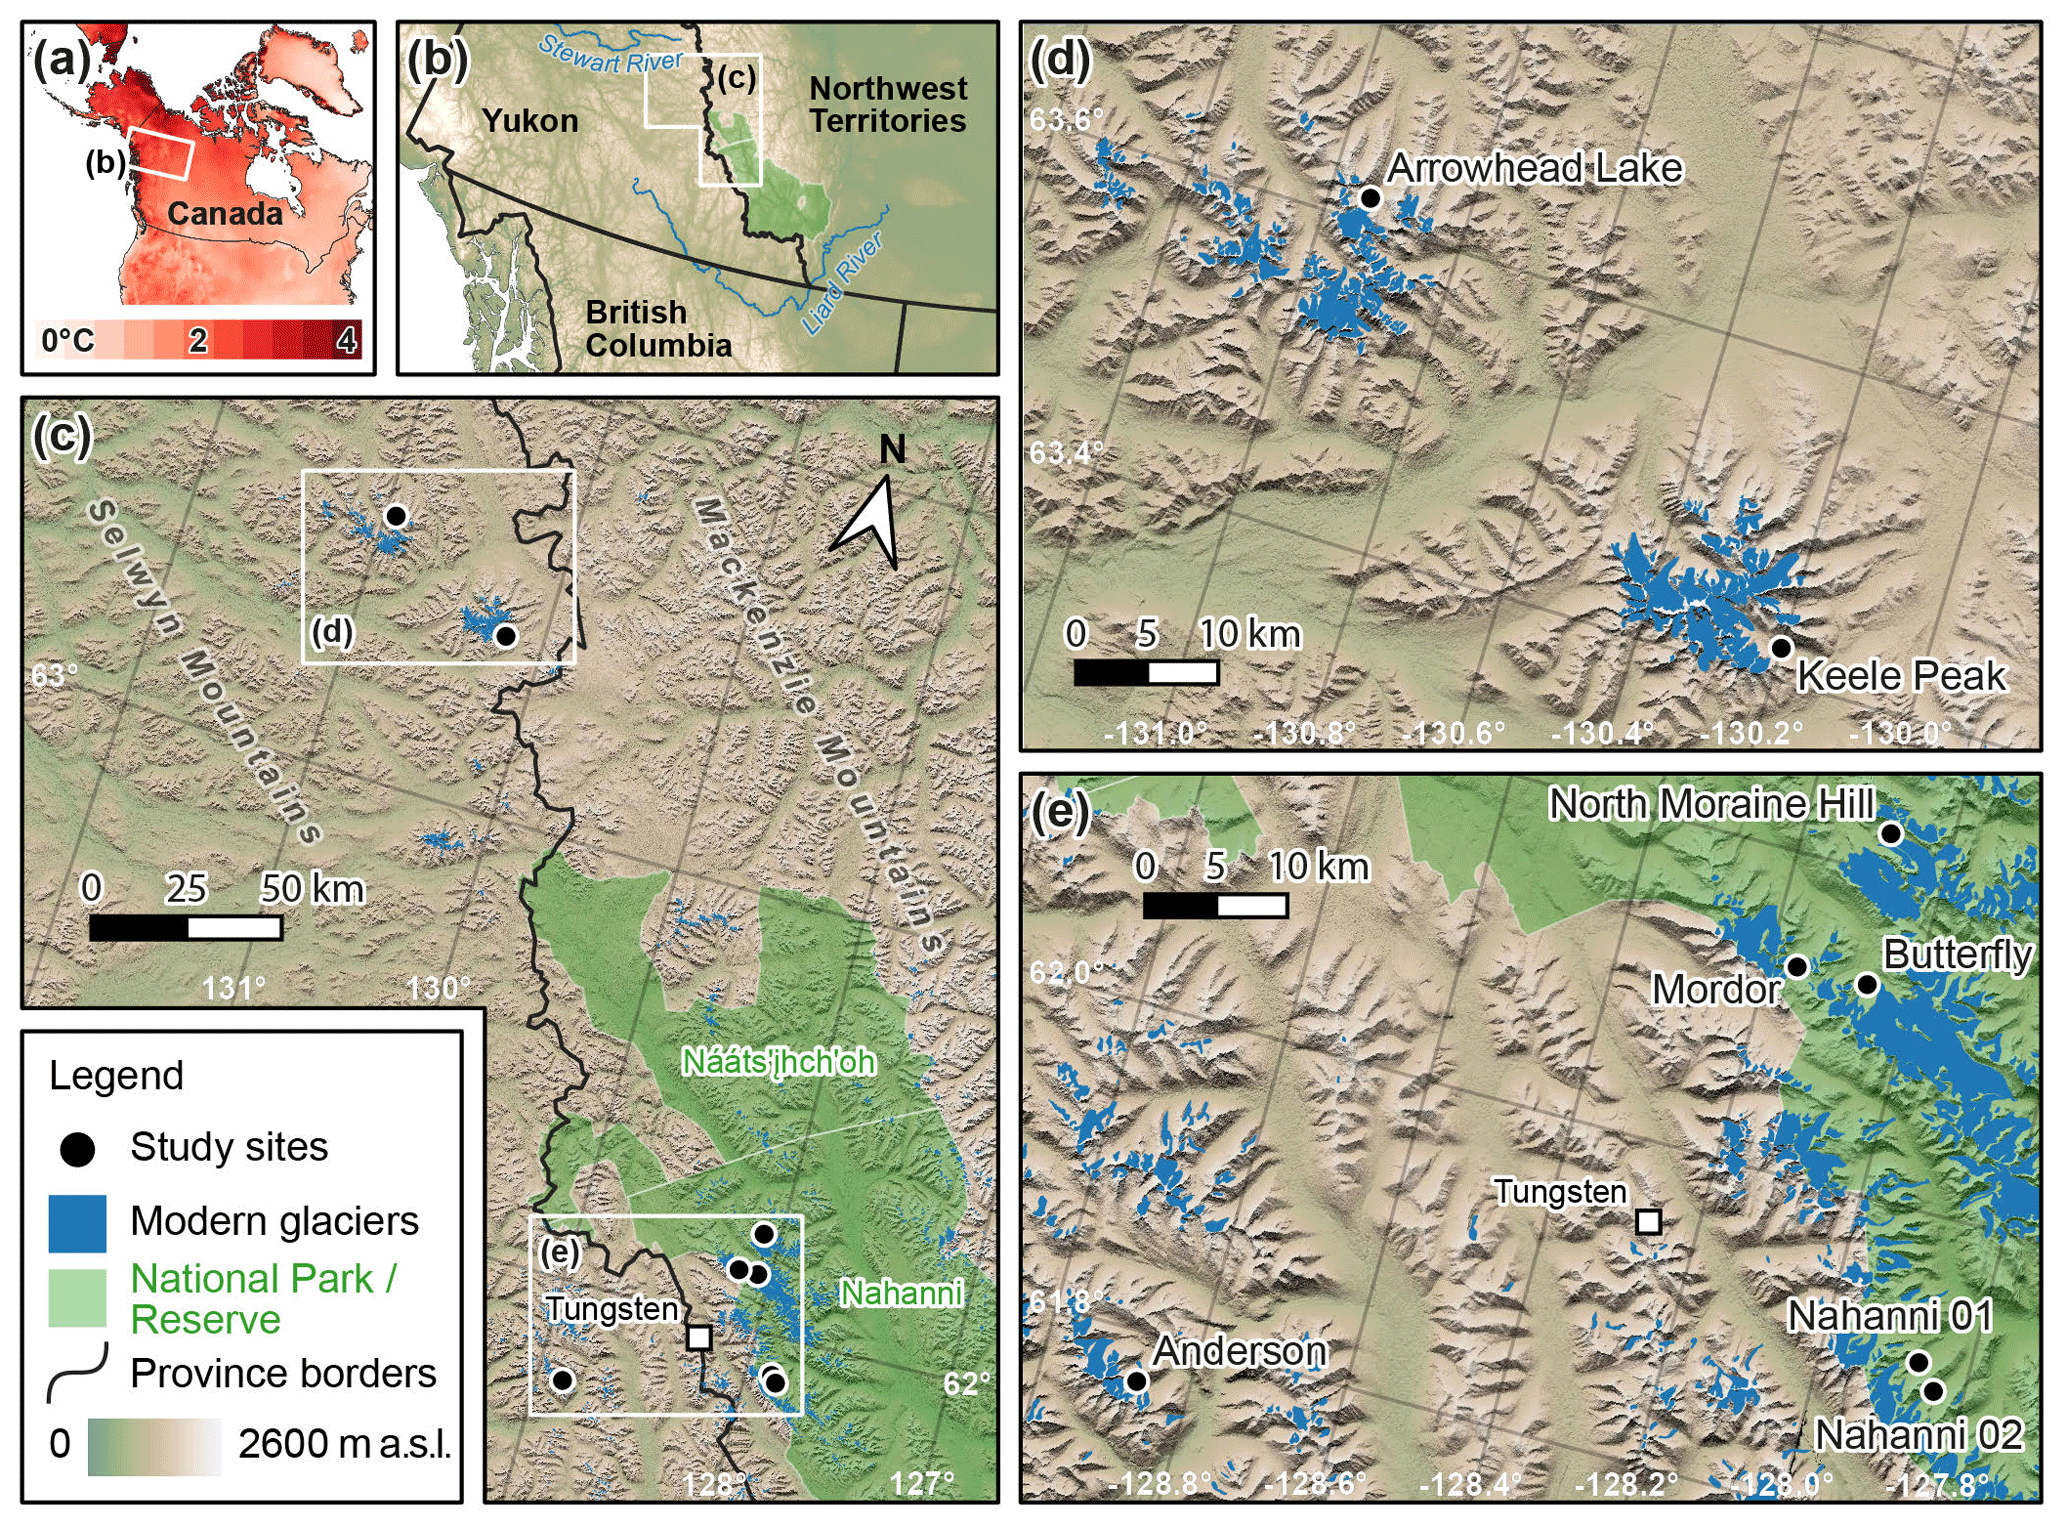
Figure 1Study area map of 10Be sampling locations. Panel (a) is the temperature trend from ERA5-Land between 1950 and 2021 CE.
Few glacier change studies exist for the Mackenzie and Selwyn mountains compared to other mountainous regions in SW Yukon, British Columbia, and Alaska. Previous Quaternary research in this region focused on Pleistocene glacial deposits and Holocene rock glaciers (i.e., Duk-Rodkin et al., 1996; Fritz et al., 2012; Menounos et al., 2017; Dyke, 1990). The remote location and related logistical challenges of conducting fieldwork in this area are likely reasons that this region is underrepresented in Holocene climate reconstructions (e.g., Marcott et al., 2013).
The timing and magnitude of the most extensive Holocene glacier expansion in the eastern Yukon and Northwest Territories, which places modern glacier retreat in context, remain uncertain. Research in northern and interior Alaska indicates that glaciers reached their maximum Holocene extents around 3.0–2.0 ka (Badding et al., 2013), while nearly all glaciers in southern Alaska and western Canada reached their greatest Holocene positions around 1600–1850 CE, at the culmination of the Little Ice Age (LIA, ∼ 1300–1850 CE) (Menounos et al., 2009; Barclay et al., 2009; Hawkins et al., 2021).
The primary objectives of our study are to develop a Holocene glacier chronology in the Mackenzie and Selwyn mountains of eastern Yukon and Northwest Territories and use our glacier chronology to estimate changes in climate responsible for these glacier fluctuations. We then deepen our understanding of glacier activity in this area by estimating glacier volume change using multiple models of past climate to force a glacier flowline model. Finally, we briefly evaluate future glacier change in this region in response to various greenhouse gas emission scenarios.
The Mackenzie and Selwyn ranges extend over 600 km from north of the Liard River in northwestern British Columbia to the Stewart River and northern extent of the Mackenzie Range in northern Yukon (Fig. 1). This region is covered by 650 km2 of ice from nearly 1200 glaciers situated among peaks that rise as high as 2952 m above sea level (Pfeffer et al., 2014). Bedrock consists of faulted and folded Paleozoic sedimentary rocks with Early Cretaceous granitic intrusions (Pfeffer et al., 2014; Cecile and Abbott, 1989). A portion of our study area is situated in the Nahanni (Nááts'ihch'oh) National Park Reserve, which was expanded in 2009 to > 30 000 km2 (Demuth et al., 2014). Glacier runoff within the Nahanni National Park Reserve flows into the Liard River watershed, which later joins the Mackenzie River, eventually draining north to the Beaufort Sea. Two of our nine field sites are located nearly 200 km to the northwest of Nahanni National Park Reserve and are situated on or adjacent to the Keele Peak massif, which is similarly composed of Early Cretaceous granitic rock. Meltwater from our study sites on and near the Keele Peak massif flows into the Stewart River, which flows west to the Yukon River and eventually to the Bearing Sea. The watersheds in our study area are culturally and ecologically important for the numerous First Nations communities who have lived on this land for millennia, including the Dënéndeh, Kaska Dena, and Na-Cho Nyak Dun First Nations, among others.
Our glacier chronology originates from digitized glacier margins of aerial photos and satellite imagery as well as constraining the age of late Holocene moraines using cosmogenic 10Be surface exposure dating. Cosmogenic surface exposure dating relies on the accumulation of rare isotopes, in this case 10Be, in the bedrock surface during periods of exposure at or near the surface of the Earth (Gosse and Phillips, 2001). We use this chronology to estimate paleoclimate conditions in the late Holocene using several methods. First, we estimate past and present equilibrium line altitudes (ELAs) using the maximum elevation of lateral moraines (MELMs, LIA maximum only), toe-to-headwall altitude ratio (THAR), and accumulation area ratio (AAR) and infer changes in temperature and precipitation from estimated ELA changes (Braithwaite and Raper, 2009; Meier and Post, 1962; Ohmura and Boettcher, 2018). We then estimate the temperature decrease needed to grow glaciers to their late Holocene positions using a flowline glacier model. Additionally, we perturb monthly temperature and precipitation from several general circulation model (GCM) simulations of climate since 1000 CE to produce modeled glacier extents that most closely match the terrestrial and remotely sensed record (Taylor et al., 2012) before evaluating past modeled glacier volume change for all glaciers in the Mackenzie and Selwyn mountains. Finally, we model future glacier change in this region under various Representative Concentration Pathways (RCPs; Moss et al., 2010).
3.1 Field site selection
We selected sampling locations within the Mackenzie and Selwyn mountain ranges using satellite imagery, aerial photos, and digital elevation data to identify purported late Holocene moraines. We consulted bedrock geologic maps of the area to locate sites that likely contained quartz-bearing lithologies suitable for 10Be surface exposure dating (hereafter 10Be dating), which was then confirmed in hand samples in the field (Cecile and Abbott, 1989; Gordey, 1992). Helicopters and floatplanes during late summer in 2014, 2016, and 2017 provided access to the field sites.
3.2 Mapping of former and present glacier extents
We manually digitized past glacier outlines for six of the nine glaciers sampled for 10Be dating. Those glaciers represent sites with multiple dated moraine boulders and morphologies better suited for glacier flowline modeling. It is the authors' understanding that only two of the glaciers included in this study, North Moraine Hill and Butterfly glaciers, have formal names. The remaining glaciers are referred to with informal names below. The resulting glaciers used in paleoclimate reconstructions are Anderson, Mordor, North Moraine Hill, Butterfly, Keele Peak, and Arrowhead glaciers (Fig. 2). We used imagery from air photos between 1949 and the mid-1970s CE and satellite imagery from 1985 CE onward (Table S2 and Fig. S12 in the Supplement). Air photos represent digitally scanned negatives housed at the Canadian National Airphoto Library (NAPL). We georeferenced each air photo by manually selecting 40–60 ground control points (GCPs) on the air photographs and high-resolution satellite imagery (e.g., large boulders, peaks, and ridges). We subsequently performed a thin-plate spline transformation in GIS software (QGIS), visually inspecting the georeferenced image for any obvious distortions. Portions of glacier outlines further from GCPs have positional errors smaller than 20 m.
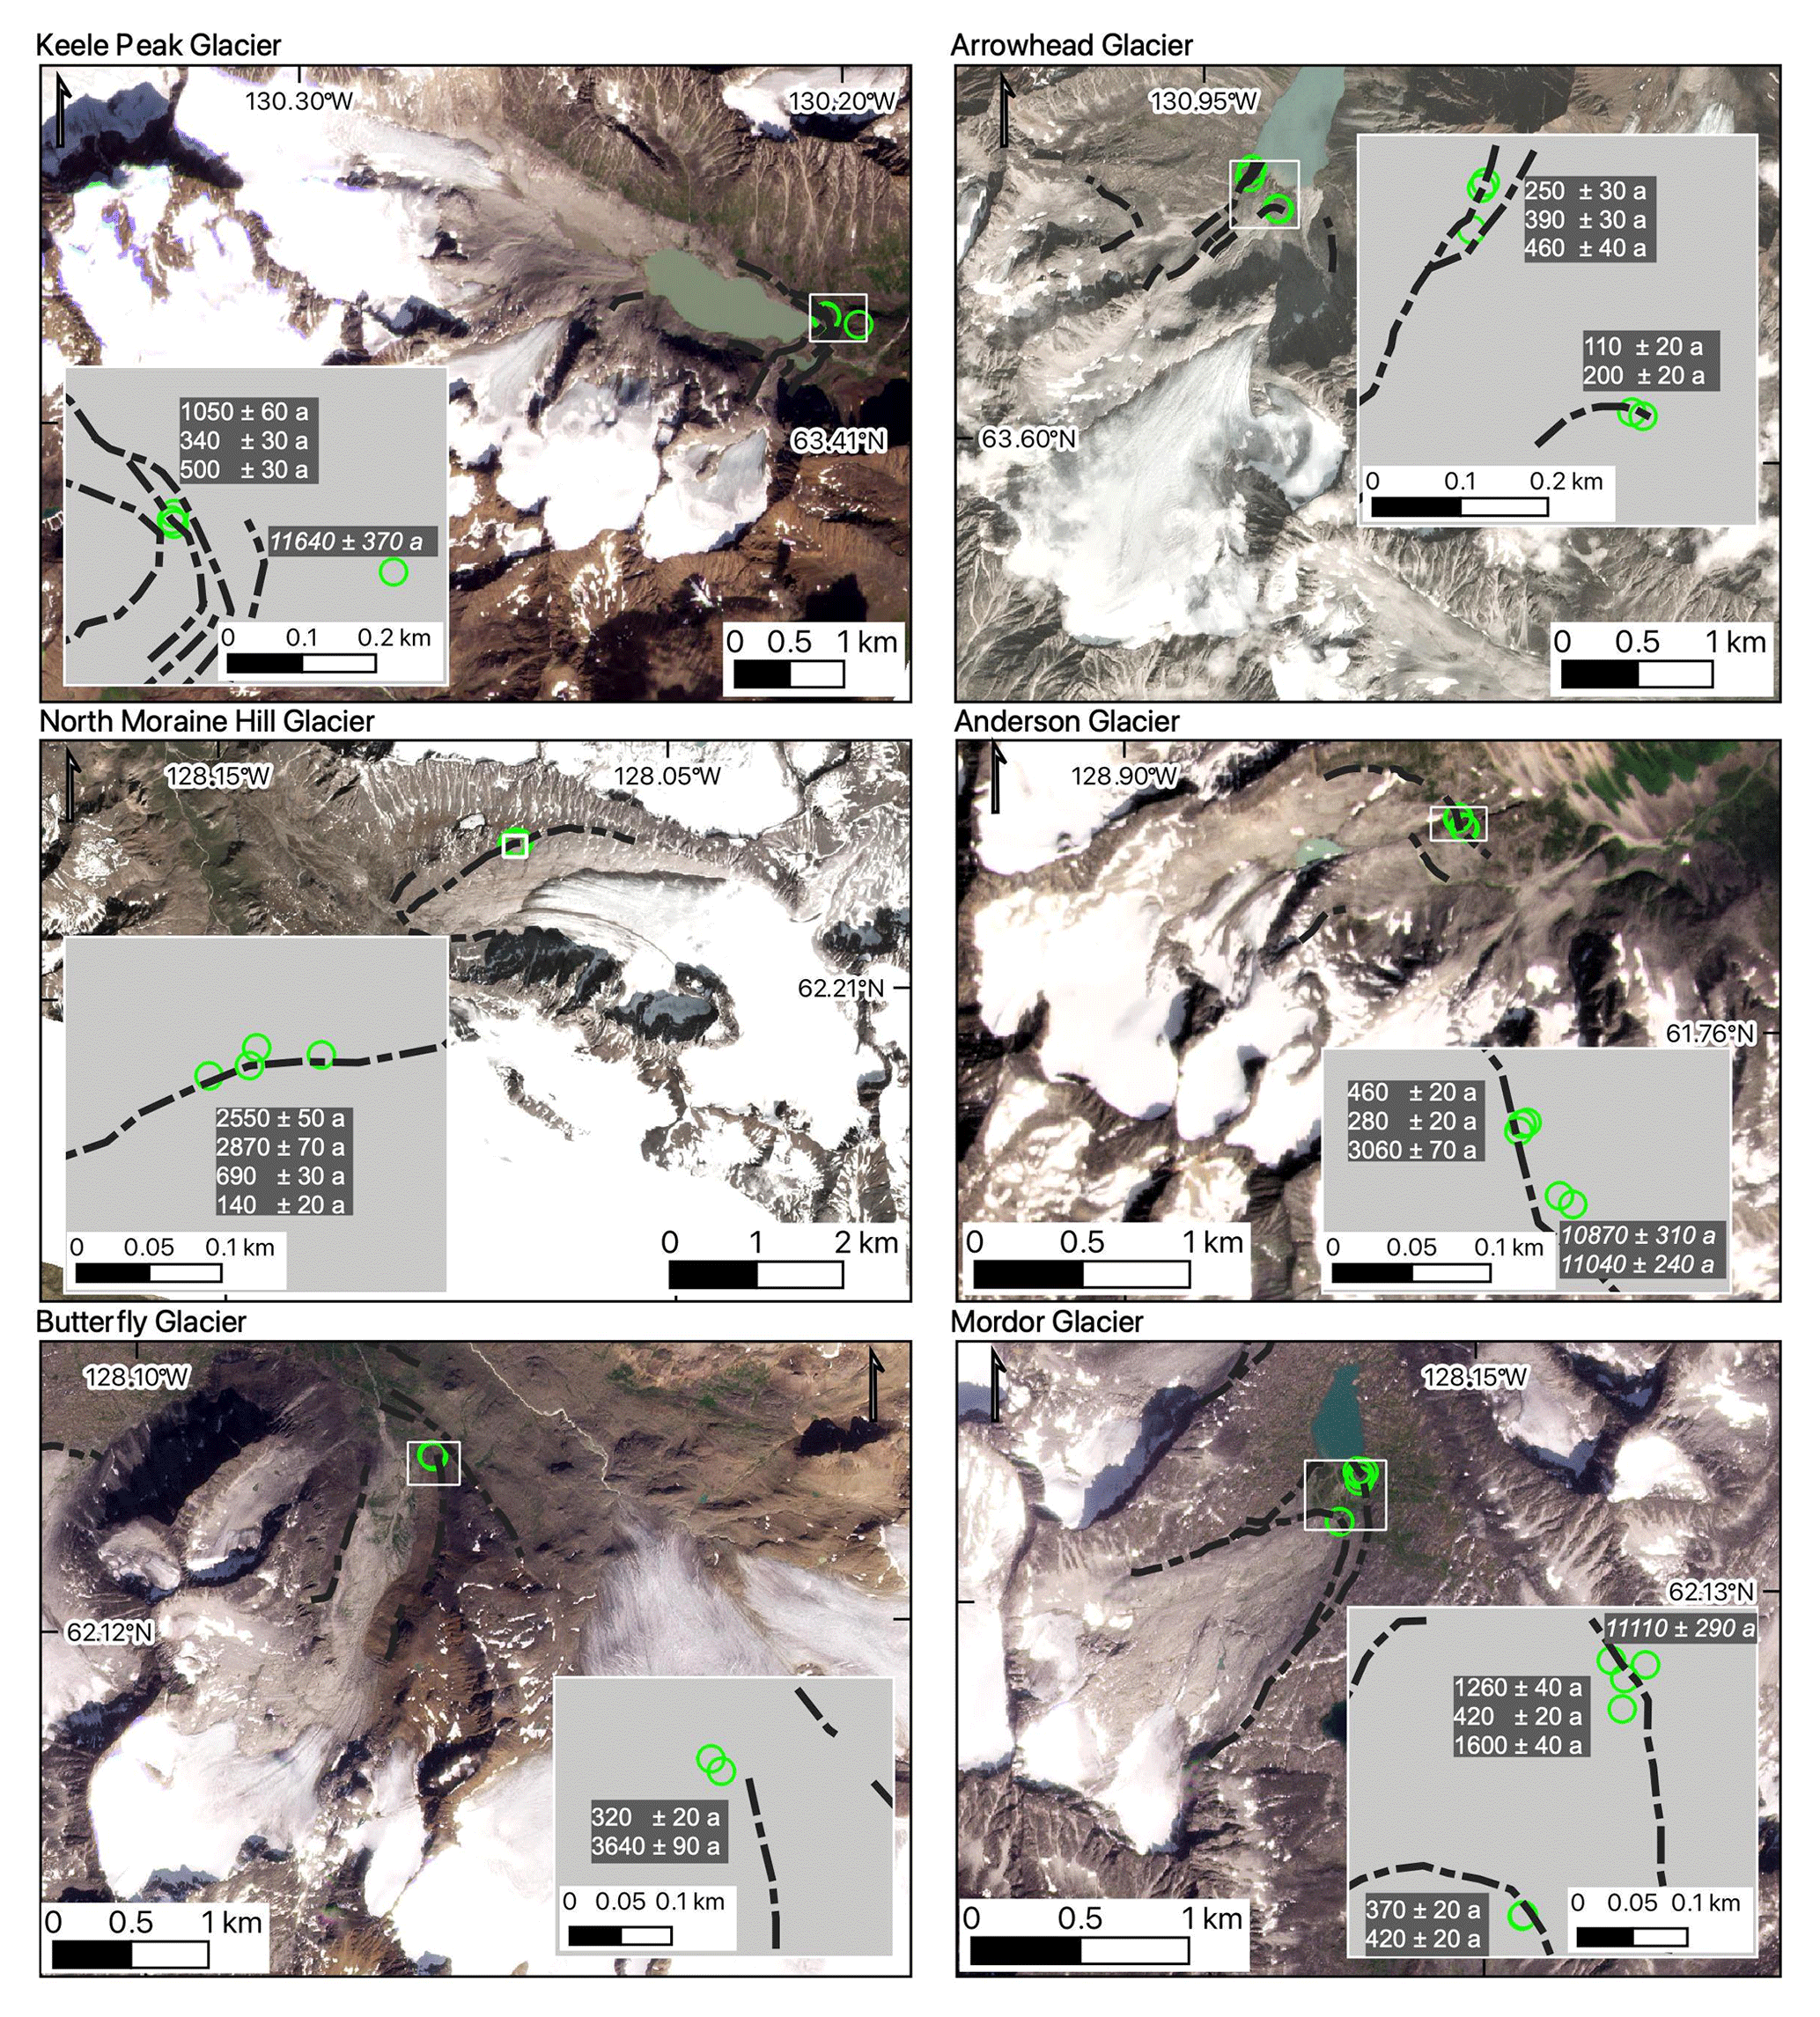
Figure 2Glaciers from which 10Be samples were collected. Sample locations are shown with green circles. Moraine crests are depicted as dashed black lines. Exposure ages ± analytical errors for individual boulders are in text boxes, with erratic boulder ages shown in italics. Grey insets show sampling sites at a larger scale. Imagery is from PlanetLabs, acquired between July and August 2021 and 2022.
We used Landsat 5, 7, and 8 satellite imagery to delineate glacier margins at roughly 5–10-year intervals from the mid-1980s onward (Fig. S12 in the Supplement). To aid in the manual digitization, we made false-color composites for each Landsat scene to highlight the glacier surface relative to non-glaciated terrain. The surfaces of most glacier termini are debris-free, which facilitated glacier mapping. We mapped late Holocene glacier margins using high-resolution satellite imagery from Mapbox and PlanetLabs to delineate glacier trimlines and moraine crests. In areas with cloud cover or snow-covered terrain, we used hillshades from ArcticDEM to help identify moraine ridges (Porter et al., 2018).
3.3 10Be field sampling
We targeted samples from large (generally taller than 1 m), granitic boulders on or near moraine crests (Fig. 2, the Supplement). It is commonly assumed that large boulders on moraine crests are windswept such that snow cover is minimal, and their large size limits the chance of being previously covered by moraine material or moving following deposition (Heyman et al., 2016). Recent work by Tomkins et al. (2021) provides evidence that sampling from the crests of moraines may not reduce the chance of geomorphic exposure age scatter; however, at the time of sampling in this study, we followed the common practice of targeting boulders on moraine crests. Several erratic boulders directly overlying bedrock and distal to the moraine crests were sampled as well (see the Supplement). We measured topographic shielding of the incoming cosmic ray flux and boulder self-shielding using a Brunton compass and inclinometer, and then we determined the location and elevation of each sample with a handheld GPS receiver with barometric altimeter. Samples were collected from the top surfaces of boulders using a concrete saw as well as a hammer and chisel to collect approximately 1 kg of rock.
3.4 10Be laboratory procedures and AMS measurements
The Lamont–Doherty Earth Observatory Cosmogenic Nuclide Laboratory processed samples collected in 2014, and we analyzed the remaining samples in the Tulane University Cosmogenic Nuclide Laboratory. All samples were crushed, milled, and sieved to 250–750 µm. Physical and chemical isolation of quartz was completed following the procedures of Nichols and Goehring (2019). We isolated Be using standard chemical isolation procedures, including anion and cation exchange columns (Ditchburn and Whitehead, 1994; Schaefer et al., 2009). We included a process blank with every batch of approximately eight samples (Supplement Table S3). We sent sample aliquots of extracted Be to either the Purdue Rare Isotope Measurement (PRIME) Laboratory or the Lawrence Livermore National Laboratory (LLNL_CAMS) for accelerator mass spectrometry (AMS) measurements, which were normalized to the standard KNSTD dilution series (Nishiizumi et al., 2007).
We calculated the exposure ages for all samples using version 3 of the online exposure age calculator formerly known as CRONUS-Earth, hosted by the University of Washington (https://hess.ess.washington.edu/, last access: 1 April 2023). We used the default 10Be reference production rates from the “primary” calibration dataset (Borchers et al., 2016) and report individual sample ages using the Lifton–Sato–Dunai (LSDn) scaling scheme and 1σ analytical errors (Table 1). No corrections for burial by snow or surface erosion are applied to the moraines as snow depth and its variation and rates of surface erosion are poorly constrained. We do, however, provide estimates of how exposure ages may be influenced by snow cover (Supplement Table S4). Moraine ages are reported as the median exposure age ± interquartile range to avoid the issue of using statistics that assume an underlying distribution of the ages of the moraine boulders, a key requirement of parametric approaches to characterize central tendency and dispersion (Menounos et al., 2017; Darvill et al., 2022).
Table 110Be sample information for all boulders sampled in this study.
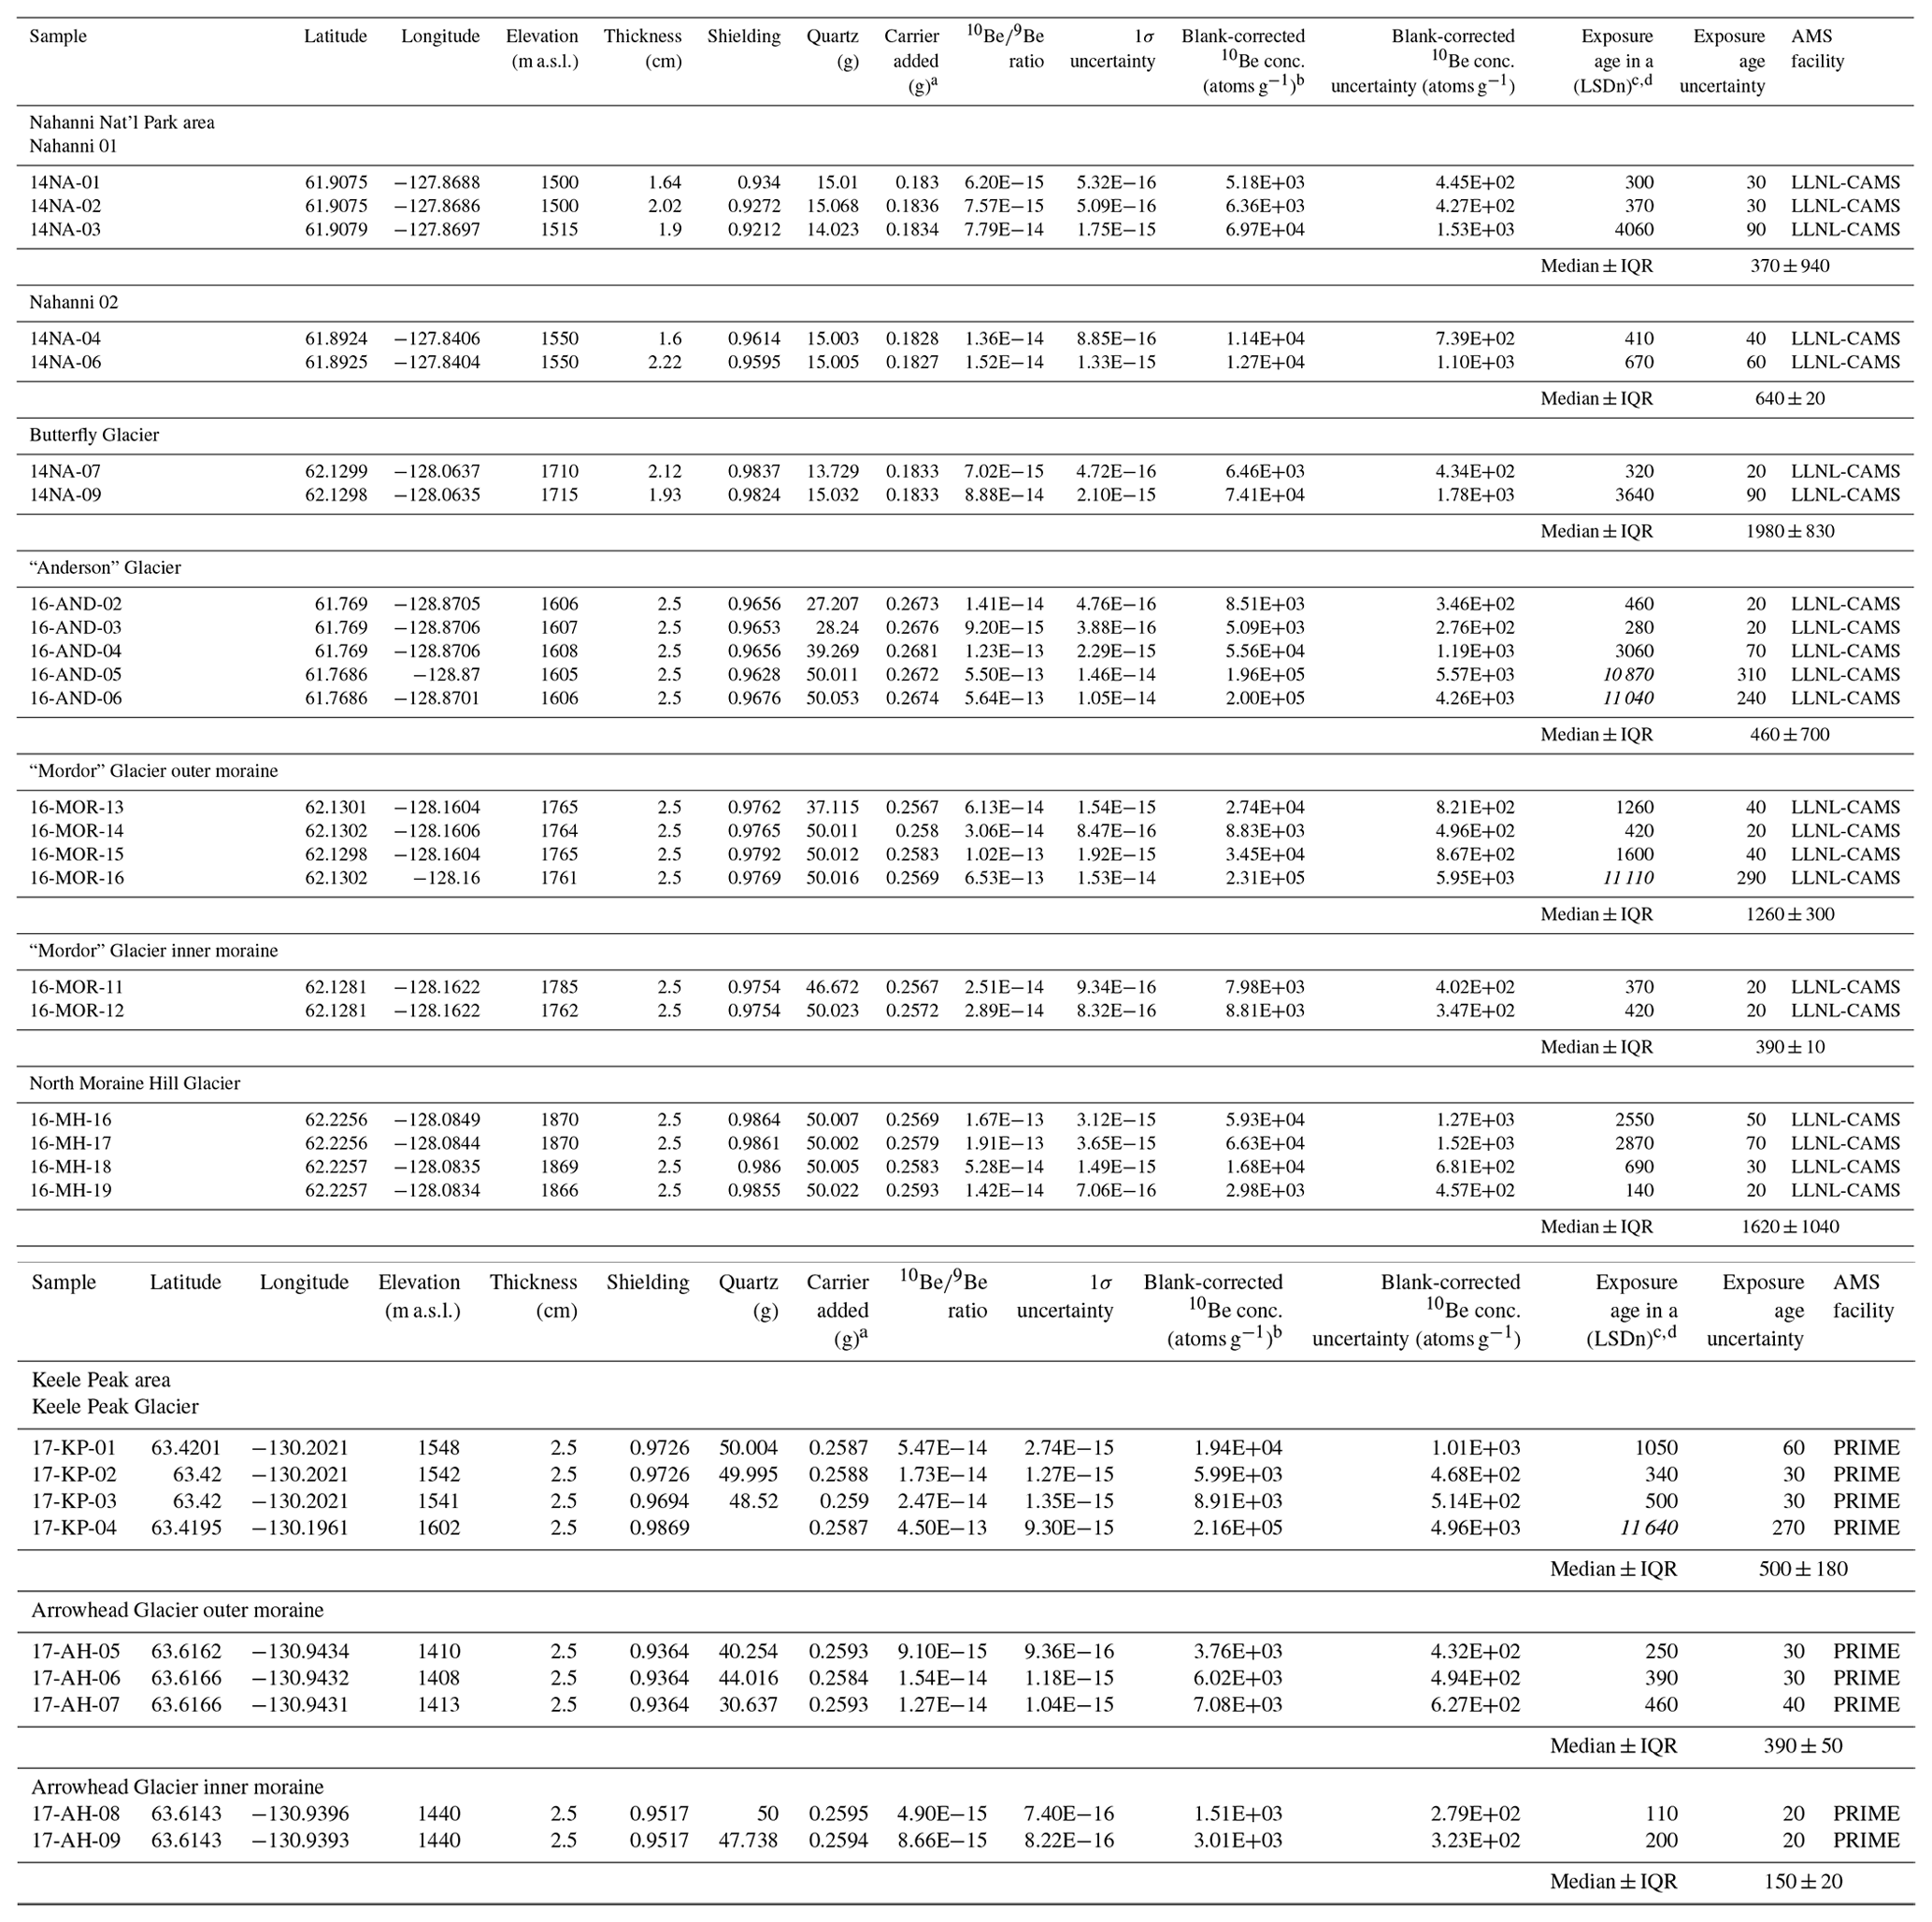
a Be carrier for samples 14-NA* was 1038.3 µg g−1, except samples 14-NA(02&07), whose carrier was 1038.8 µg g−1. All remaining samples used a PRIME Be carrier with a concentration of 1040 ppm. b Isotopic ratios were measured at either the Lawrence Livermore National Laboratory – Center for Accelerator Mass Spectrometry (LLNL-CAMS) or the Purdue Rare Isotope Measurement Laboratory (PRIME). ratios are not corrected for 10Be detected in procedural blanks. The c ages are calculated using version 3 of the online exposure age calculator formerly known as the CRONUS-Earth online exposure age calculator found at https://hess.ess.washington.edu/ (last access: 1 April 2023) (wrapper 3.0.2, muons: 1A, constants as of 26 August 2020). All ages are calculated using the Lifton–Sato–Dunai (LSDn) scaling and the default production rate. Ages and errors are rounded to the nearest decade. d The median exposure age and interquartile range (IQR) exclude the exposure age of erratic boulders, whose ages are listed in italics.
3.5 ELA reconstructions
Variations in the equilibrium line altitude of a glacier relate to long-term changes in climate. Such variations have been used to estimate changes in either temperature or precipitation (Dahl and Nesje, 1992; Moore et al., 2022; Oien et al., 2022). Commonly used methods to reconstruct past ELAs include the maximum elevation of lateral moraines, toe-to-headwall altitude ratio, and accumulation area ratio, among others. Each method offers advantages and limitations in reconstructing past ELAs (Benn et al., 2005; Nesje, 1992; Porter, 2001; Osmaston, 2005). We use the MELM, THAR, and AAR methods of ELA reconstruction to estimate glacier ELAs between the Little Ice Age (ca. 1300–1850 CE) and modern times (2000–2021 CE).
To record the MELM for each glacier, we used high-resolution satellite imagery and elevation data from ASTER GDEM version 3 (NASA/METI/AIST/Japan Spacesystems and U.S./Japan ASTER Science Team, 2019) to identify the highest elevation of preserved lateral moraines.
The THAR method assumes that a glacier's ELA is positioned at a fixed ratio between the maximum and minimum elevation of the glacier, as shown in Eq. (1).
Work by Meierding (1982) and Murray and Locke (1989) found that ratios of 0.35 to 0.4 yielded satisfactory estimates of alpine glacier ELAs. Here, we use the mean ELA from a THAR of 0.35 and 0.4.
The accumulation area ratio assumes a fixed ratio of the accumulation area to the total area of a glacier in equilibrium (Braithwaite and Raper, 2009; Meier and Post, 1962). Here, we assume the AAR for glaciers in this region to be 0.6, which is generally considered to be the ratio of steady-state cirque and valley glaciers in NW North America (Porter, 1975).
We generated LIA and modern glacier hypsometries by clipping the ASTER DEM to the digitized glacier extents. In this case, the modern glacier extents are from the latest satellite imagery used for each glacier (imagery from 2017–2021 CE). We acknowledge that the modern DEM does not account for the paleo-surface of the glacier during the LIA and may negatively bias the paleo-ELA (Porter, 2001).
For each ELA reconstruction method, we inferred the change in average temperature (dT) from the Little Ice Age to present as a function of changing ELA by assuming an environmental lapse rate of −6.5 ∘C km−1.
The ELA of a glacier is also influenced by changes in precipitation. Ohmura et al. (2018, 1992) empirically derive an equation (Eq. 2) to estimate the annual precipitation, P, in millimeters of water equivalent (mm w.e.) at the ELA of a glacier, given a mean summer (JJA) temperature T:
where a=966, b=230, and c=5.87. We estimated changes in precipitation at the ELA of each study glacier by assuming a modern (1986–2015 CE mean) JJA temperature (T) at the modern ELA from the fifth-generation European Centre for Medium-Range Weather Forecasts (ECMWF) global climate atmospheric reanalysis (ERA5). We use our dT estimate from our ELA reconstructions to yield Eq. (3).
We selected ERA5 2 m surface temperatures (Hersbach et al., 2020) from the grid cell nearest to the study glacier and used the same −6.5 ∘C km−1 lapse rate to approximate T at the modern ELA.
3.6 Glacier modeling
3.6.1 Open Global Glacier Model
Our final method of ELA reconstruction uses the Open Global Glacier Model (OGGM; Maussion et al., 2019), which is a modular, open-source model framework with the capacity to model glacier evolution for all glaciers on Earth. The glacier model within OGGM is a depth-integrated flowline model that solves the continuity equation for ice using the shallow-ice approximation (Cuffey and Paterson, 2010). Multiple flowlines for each glacier are calculated using a DEM clipped around the glacier polygon using the routing algorithm of Kienholz et al. (2014). The default mass balance model used in OGGM begins with gridded monthly climate data, here the Climatic Research Unit gridded Time Series (CRU TS) version 4.04 (Harris et al., 2020). The climate data feed a temperature index model described in Marzeion et al. (2012), incorporating a temperature sensitivity parameter that is calibrated using nearby glaciers with observations of specific mass balance (Zemp et al., 2021). Ice thickness is estimated by assuming a given glacier bed shape (parabolic, rectangular, or mixed) and applying a mass-conservation approach that employs the shallow-ice approximation. OGGM assumes that the “modern” glacier outline, sourced from the Randolph Glacier Inventory (RGI), is from the same date as the DEM. Users are also able to supply their own glacier outlines. More information on OGGM can be found at https://OGGM.org (last access: 1 April 2023) or in publications on the model (Maussion et al., 2019; Eis et al., 2021).
3.6.2 Equilibrium run
In our first experiment using OGGM, we started with the RGI polygons for the six of our study glaciers targeted for surface exposure dating (Anderson, Mordor, Butterfly, North Moraine Hill, Keele Peak, and Arrowhead glaciers). We then ran a 1000-year simulation under a constant climate, iteratively adjusting a temperature bias relative to the average CRU TS climate centered around 2000 CE (close to the RGI polygon date of most glaciers in the region) until the modeled glacier reached equilibrium at or very near the glacier length indicated by the moraine record. From these equilibrium run experiments, we produce three different estimates of ELA and temperature change. First, the temperature lowering required to expand a glacier to its LIA length was interpreted as the approximate temperature change from the LIA to 2000 CE. Second, we then extracted the hypsometry of the modeled glacier at t=0 (modern extent) and t=1000 (LIA extent) and estimated the modeled ELA using the same AAR method as described in Sect. 3.5, again assuming an AAR of 0.6. We can again apply the −6.5 ∘C km−1 lapse rate to estimate the apparent temperature change from modeled glacier extents between the two time periods. Third, for the modern glacier extent, we extracted the elevation at which the modeled surface mass balance of each glacier is equal to zero without any temperature bias. This represents the modern climatic ELA and is not based on glacier morphology.
3.6.3 Transient run
In our next experiment with OGGM, we simulate changes in glacier volume in the Mackenzie and Selwyn mountains using our glacier chronology to tune the climate model input. We used OGGM to simulate the response of our five glaciers driven by monthly temperature and precipitation variability from four Coupled Model Intercomparison Project Phase 5 (CMIP5) GCM runs (CCSM4, MIROC-ESM, MPI-ESM-P, and MRI-ESM2; Taylor et al., 2012). All GCMs incorporate volcanic, total solar irradiance, summer insolation in both hemispheres, aerosol and greenhouse gas emission, and land use change forcings over the period 850–2005 CE (Landrum et al., 2013; Sueyoshi et al., 2013; Yukimoto et al., 2019).
We omitted the glacier on Keele Peak, as its RGI outline includes several cirque glaciers separated from the main glacier, which causes OGGM to produce a problematic flowline that crosses several flow divides. We set the mass balance gradient for each glacier to 5.2 mm w.e. m−1 based on the mass balance gradient for Bologna Glacier in Nahanni National Park Reserve for the 2014–2015 CE balance year (Ednie and Demuth, 2019). For each GCM, we ran 300–500 simulations, incrementally perturbing the temperature bias (Tbias) and unitless precipitation factor (Pbias) to determine which combination of temperature and precipitation bias produces a modeled glacier length time series that best fits our glacier chronology. Tbias values ranged from −5 to +2 ∘C and Pbias was between 1.0 and 4.0. Initial testing prior to running the larger simulations showed that Tbias and Pbias values beyond the above range produced glacier extents that far exceeded the late Holocene maximum extent of the glacier or made them disappear entirely. When the glacier flowline exceeded 80 grid points beyond the modern glacier extent, the simulation was discarded. For each simulation, we calculated the summed root mean squared error (RMSE) of modeled glacier length versus the moraine and remotely sensed glacier length at multiple time steps. The combination of Tbias and Pbias that produced the lowest RMSE was selected as the “optimized” set of parameters for each glacier and GCM. The exact values of Tbias and Pbias are not meant to convey specific information about past climate. These values allow for regional tuning of the OGGM to better fit the reconstructed and observed glacier response.
Finally, we averaged the set of Tbias and Pbias from each glacier that produced the lowest RMSE for each GCM and applied those corrections before running simulations of the past millennium for all (1235) glaciers in the eastern YT and NWT, forced by each “calibrated” GCM. The past millennium climate is of interest as it covers the onset and termination of Little Ice Age cooling. We start all past millennium runs at 1000 CE. We then compared the modeled glacier volume change over the past millennium to our chronology as well as what is already known about late Holocene glacier change in this region to evaluate if the modeling results were reasonable.
3.6.4 Future glacier simulations
To predict the fate of glaciers in this region, we use OGGM to project 21st century glacier change for all 1235 glaciers in the eastern Yukon and Northwest Territories, forced by four different CCSM4 projection runs under different Representative Concentration Pathways (RCPs). We use the default model parameters of OGGM v1.5.3 and rely on OGGM's pre-processed glacier directories, which already contain glacier geometry and climate data.
The historical climate data are CRU TS version 4.04 (Harris et al., 2020). We then download the CMIP5 (CCSM4) climate model output from four different RCPs and run OGGM's bias correction against the CRU calibration data, which in turn calculates anomalies from the CRU reference climatology (1961–1990 CE). Finally, we run OGGM for all 1235 glaciers forced by the calibrated climate scenarios from 2020 to 2100 CE and analyze the projected change in glacier area and volume.
4.1 Glacier chronology
Glaciers in the Mackenzie and Selwyn mountains deposited moraines fronting cirque and valley glaciers 0.7 to 2 km beyond their ca. 2020 CE extents. These moraines are typically devoid of vegetation other than widespread lichen cover. The moraines we sampled are commonly boulder-rich, with pebble–cobble matrices (see the Supplement).
Many alpine cirques preserve two nested moraines within tens of meters of each other. We observed nested moraine crests at Keele Peak, Arrowhead, North Moraine Hill, and Mordor glaciers. There is also a partially nested crest preserved at Anderson Glacier. We did not sample both crests at most locations since our focus was to date the outermost moraines.
Erratic boulders 10–40 m beyond cirque moraines at Anderson and Mordor glaciers date to 10.9–11.1 ka (Table 1). An erratic boulder sampled ∼ 250 m beyond the late Holocene moraine fronting Keele Peak glacier dates to 11.6 ± 0.3 ka. Erratic boulders directly overlaid bedrock and had abundant lichen cover. We did not observe any obvious signs of boulder surface erosion, such as grüssification, solution pitting, or enhanced relief of resistant minerals.
In the Nahanni National Park region, the median 10Be age on moraine boulders is 610 ± 850 a (ca. 1405 CE, n=19). Adjacent to Keele Peak, the median moraine exposure age is 370 ± 110 a (ca. 1650 CE, n=8). Together, the sampled moraines in this study date to 460 ± 415 a (ca. 1560 CE). We sampled both the inner and outer crest of the moraine couplet at Arrowhead and Mordor glaciers. At Anderson Glacier, the outer moraine dates to 390 ± 50 a (1620 CE, n=3) and the inner moraine to 150 ± 24 a (1860 CE, n=2). At Mordor Glacier, the outer moraine dates to 1260 ± 295 a (760 CE, n=3) and the inner moraine dates to 390 ± 22 a (1630 CE, n=2).
There is notable scatter in the exposure ages on many of the sampled moraines (Table 1, Fig. 3). At Nahanni 01, Butterfly, Anderson, Mordor, and North Moraine Hill glaciers, there is at least one sample from each moraine that returned ages older than 1 ka. This scatter gives individual moraine ages large errors; however, when we analyze all moraine boulder ages together, there is a distinct peak in exposure ages between ∼ 800 and 100 a exposure (ca. 1200 to 1900 CE), with the greatest peak around 480 to 280 a (1540–1740 CE, Fig. 3).
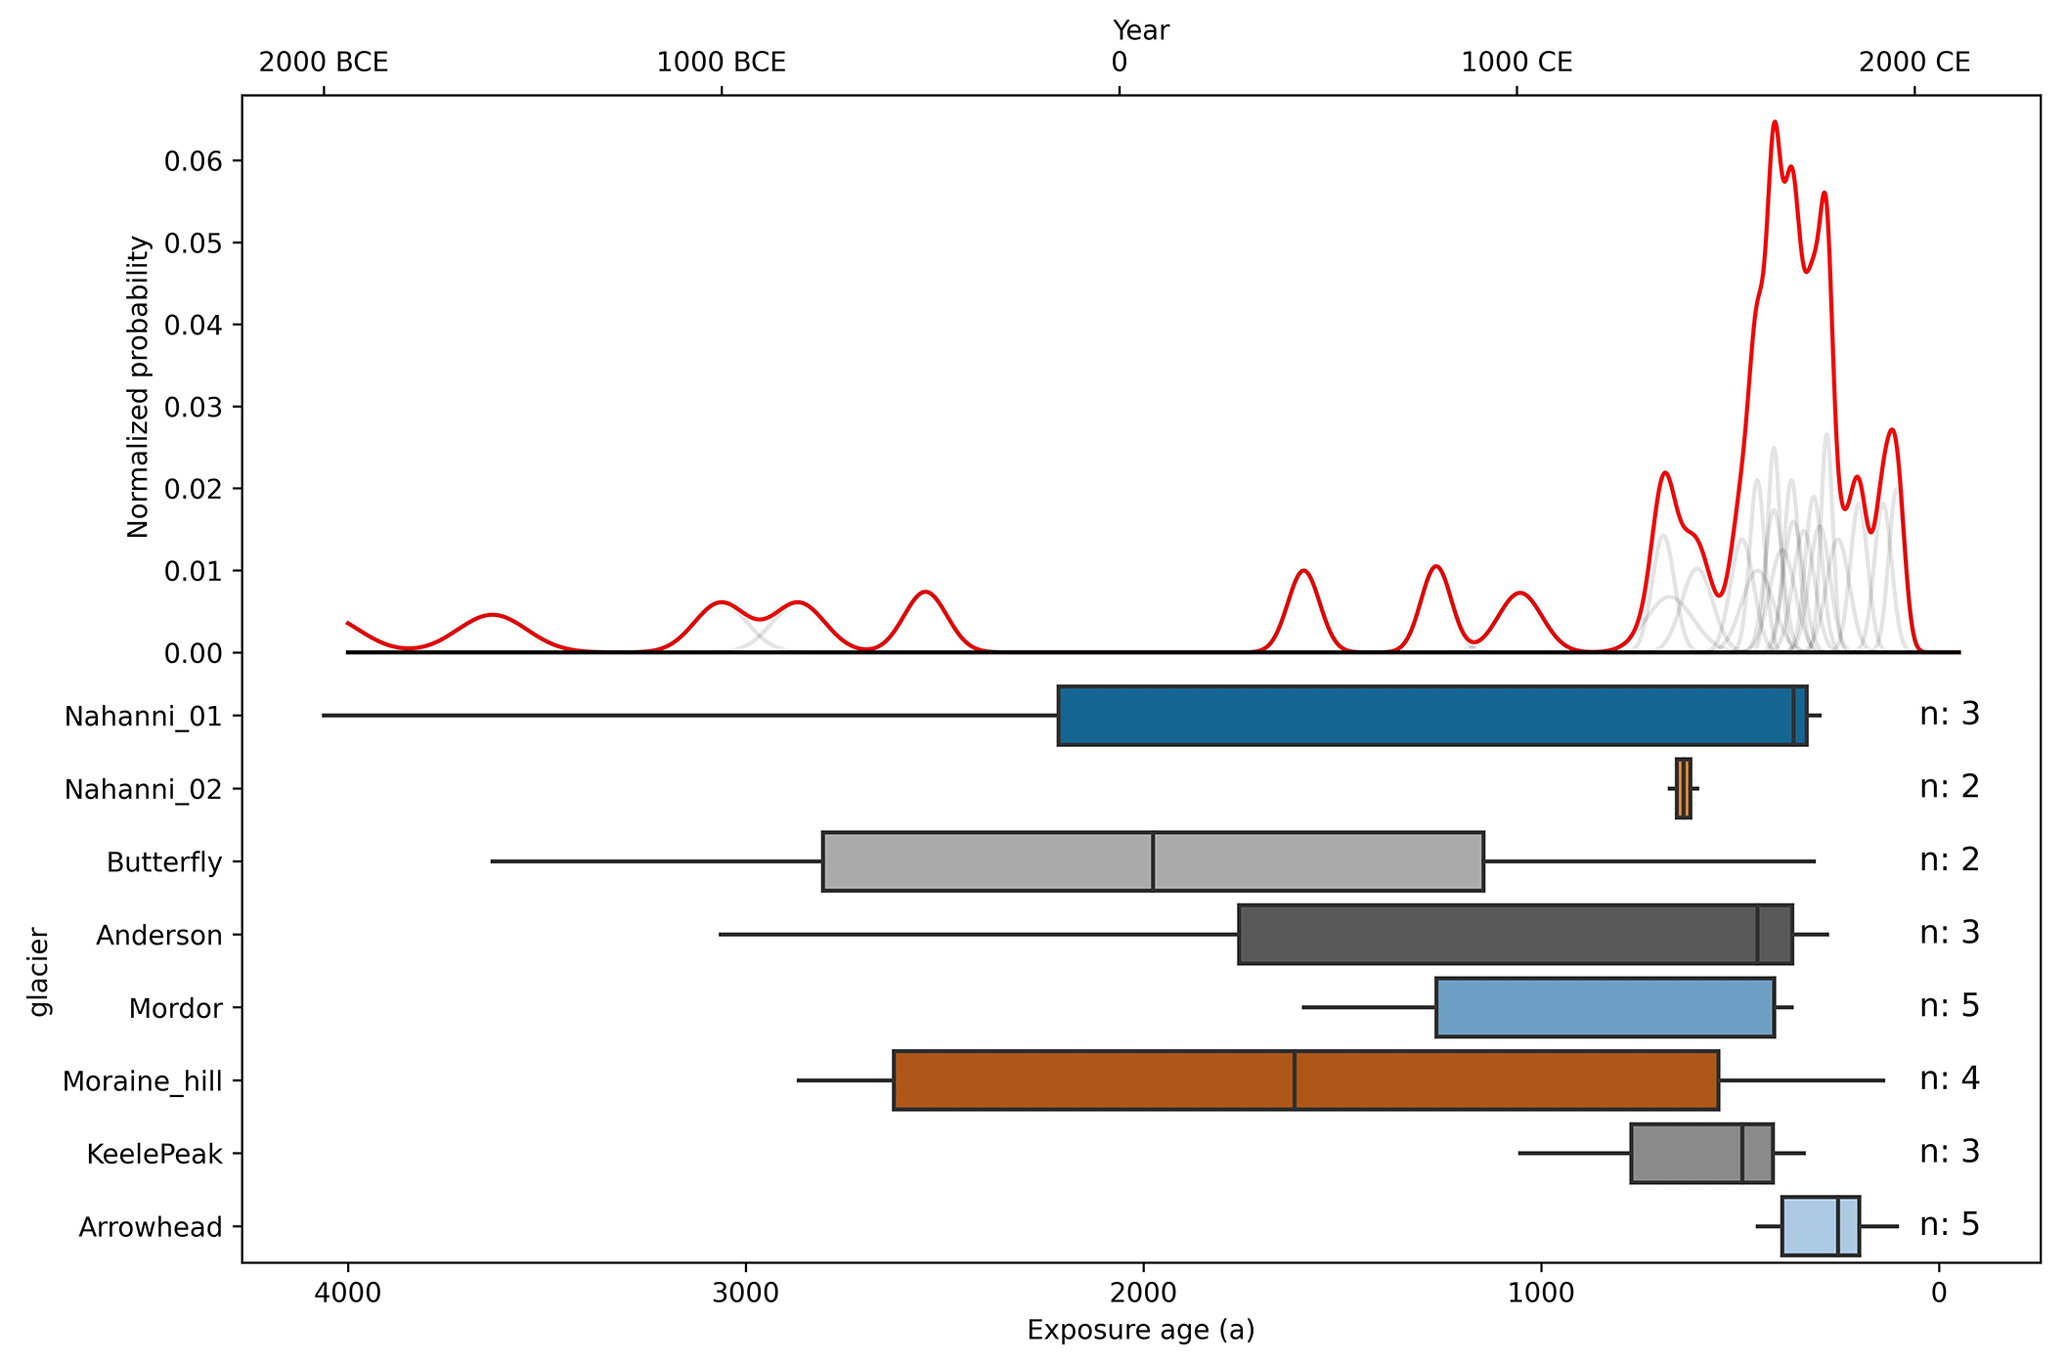
Figure 3Box-and-whisker plots of 10Be surface exposure ages for each glacier, showing the interquartile range and median age of each moraine surface and the normalized probability density function (red line) for all 10Be samples as well as a kernel density plot (grey lines) for each individual 10Be sample.
4.2 Climate reconstructions since the late Holocene
ELA reconstruction using the different methods described above yields a range of estimated changes in ELA between the LIA and modern times (Fig. 4). We use ELAs from the AAR method using mapped former and modern glacier extents as the “standard” ELA against which we compare our other ELA estimates. Any ELA reconstruction method could serve as the standard; the AAR method was selected due to its common usage in glacier reconstructions (Benn et al., 2005; Dahl and Nesje, 1992; Oien et al., 2022). When comparing ELA change within a single method, dELA is the change in reconstructed ELA between the LIA and modern times using the method in question. As discussed below, we assume that precipitation remains constant between the LIA and modern times for ELA reconstructions using the MELM, THAR, and AAR methods.
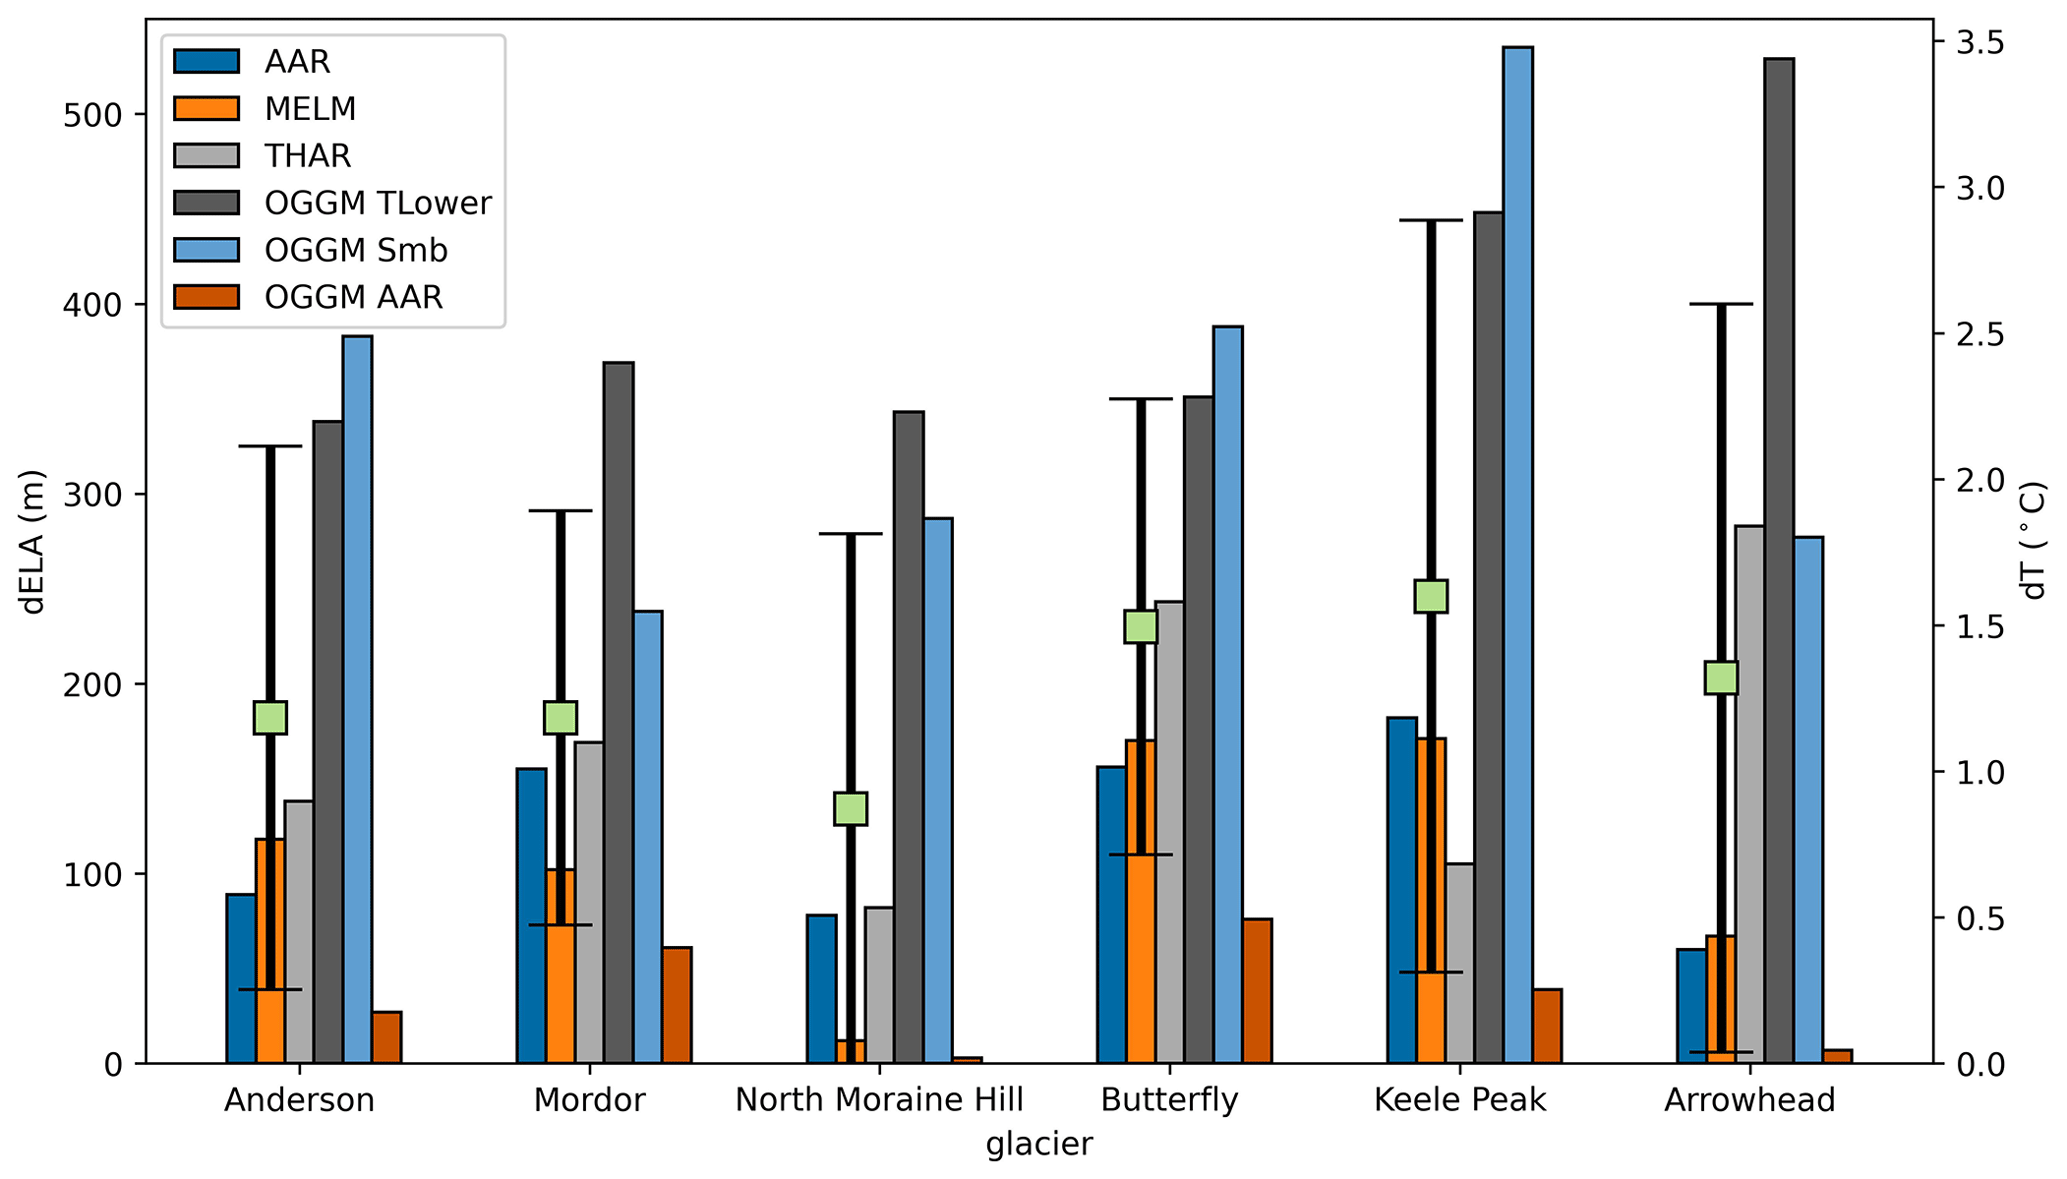
Figure 4Changes in ELA and estimated temperature change between the Little Ice Age maximum and modern times (ca. 2015) for six glaciers in this study. Each bar represents a different ELA reconstruction method as described in the text. OGGM TLower is the temperature lowering from ca. 2000 CE climatology required to allow the modeled glaciers to reach their late Holocene maximum extent. OGGM Smb is the change in ELA where the modeled surface mass balance on the glacier equals zero between the late Holocene maximum and ca. 2000 CE. OGGM AAR is the difference in AAR-derived ELA from the modeled glacier extent at the late Holocene maximum and ca. 2000 CE. Green squares with capped error bars are the mean and 1σ standard deviation for all ELA reconstruction methods for each glacier.
The modern ELA derived from the AAR method is +12 to +171 m (average 107 m) higher than the LIA ELA using the maximum elevation of lateral moraines method, corresponding to a +0.1 to +1.1 ∘C (average 0.9 ∘C) increase in temperature (Fig. 4). Using the THAR method, the dELAs range from +47 to +240 m (average 138 m), corresponding to a dT of +0.3 to +1.6 ∘C (average 0.9 ∘C) since the LIA.
ELAs reconstructed from LIA and modern glacier extent mapping, assuming an AAR of 0.6, indicate a rise in ELA since the LIA of +60 to +182 m, corresponding to a +0.4 to +1.2 ∘C (average 0.8 ∘C) increase in annual average temperature (Fig. 4).
Using OGGM, we include three estimates of ELA change. Non-transient simulations on glaciers in the Nahanni National Park region using OGGM require +2.3 ∘C of warming, relative to the 30-year average climate centered around 2000 CE, to retreat from their LIA extents to modern positions. Keele Peak and Arrowhead glaciers require nearly +3.2 ∘C average warming since the LIA relative to their modern temperature (Fig. 4). This warming is equivalent to a dELA since the LIA of +354 m in Nahanni National Park and +492 m in the Keele Peak area.
Applying the AAR method, but with OGGM-derived glacier hypsometries at the LIA and modern times, indicates much less warming since the LIA, with rises in ELAs between +7 and +76 m, corresponding to a rise in temperature of < 0.1 to 0.5 ∘C. We interpret this minimal change in ELA to be the result of glacier surface thickening in the OGGM when the glacier expands to LIA extents, which reduces the apparent ELA change as the lower portion of the modeled glacier surface thickens (Supplement Figs. S5 and S6).
The third variation of ELA reconstruction using OGGM estimates the modern ELA not from modeled glacier hypsometry, but rather the elevation at which the modeled surface mass balance on the glacier is equal to zero. In a warming climate, this estimate of glacier ELA is expected to be higher than the AAR-derived ELA, as a glacier undergoing rapid retreat has a morphometry that lags behind the climate signal. Changes in ELA using the modern mass-balance-derived ELA and the AAR-derived LIA ELA range from +277 to +535 m. Estimated temperature change indicates a rise in temperature since the LIA of +1.6–3.5 ∘C.
Using the equation of Ohmura et al. (2018) and temperature change estimates from our AAR-derived ELAs, we estimate that compared to modern values, there was −117 to −339 mm w.e. a−1, or 5 %–15 % (average 10 %), less precipitation at the ELA of our study glaciers during the LIA (Supplement Table S2).
4.3 Past millennium glacier change
Estimates of glacier evolution in the YT and NWT over the past millennium vary among the four GCMs (Fig. 5). The MPI simulation shows steady glacier volume until 1600 CE, while MRI, MIROC, and CCSM4 indicate a reduction in glacier volume until ca. 1250 CE; afterwards CCSM4 and MRI (and to a lesser degree MPI) show an increase in glacier volume until ca. 1400 CE before a period of stable ice volume until ca. 1600 CE. MRI, MPI, and CCSM4 all indicate glacier expansion ca. 1600 CE, with MPI reaching a maximum ice volume of 38.1 km3 at 1765 CE and CCSM4 producing a maximum ice volume of 34.7 km3 at 1855 CE (Fig. 5). MRI appears to largely miss 20th century glacier retreat and continues to show glacier expansion until 1980 CE, followed by volume loss. Glacier volume simulated by MIROC decreases through the past millennium, in contrast to the other GCM simulations. Projections of future glacier loss (below) using CCSM4 climate simulations begin with an initial regional ice volume of 18.1 km3 in 2019 CE. Compared to the maximum modeled ice volume in the CCSM4 past millennium simulations, this represents a 48 % loss in ice volume since ca. 1850 CE.
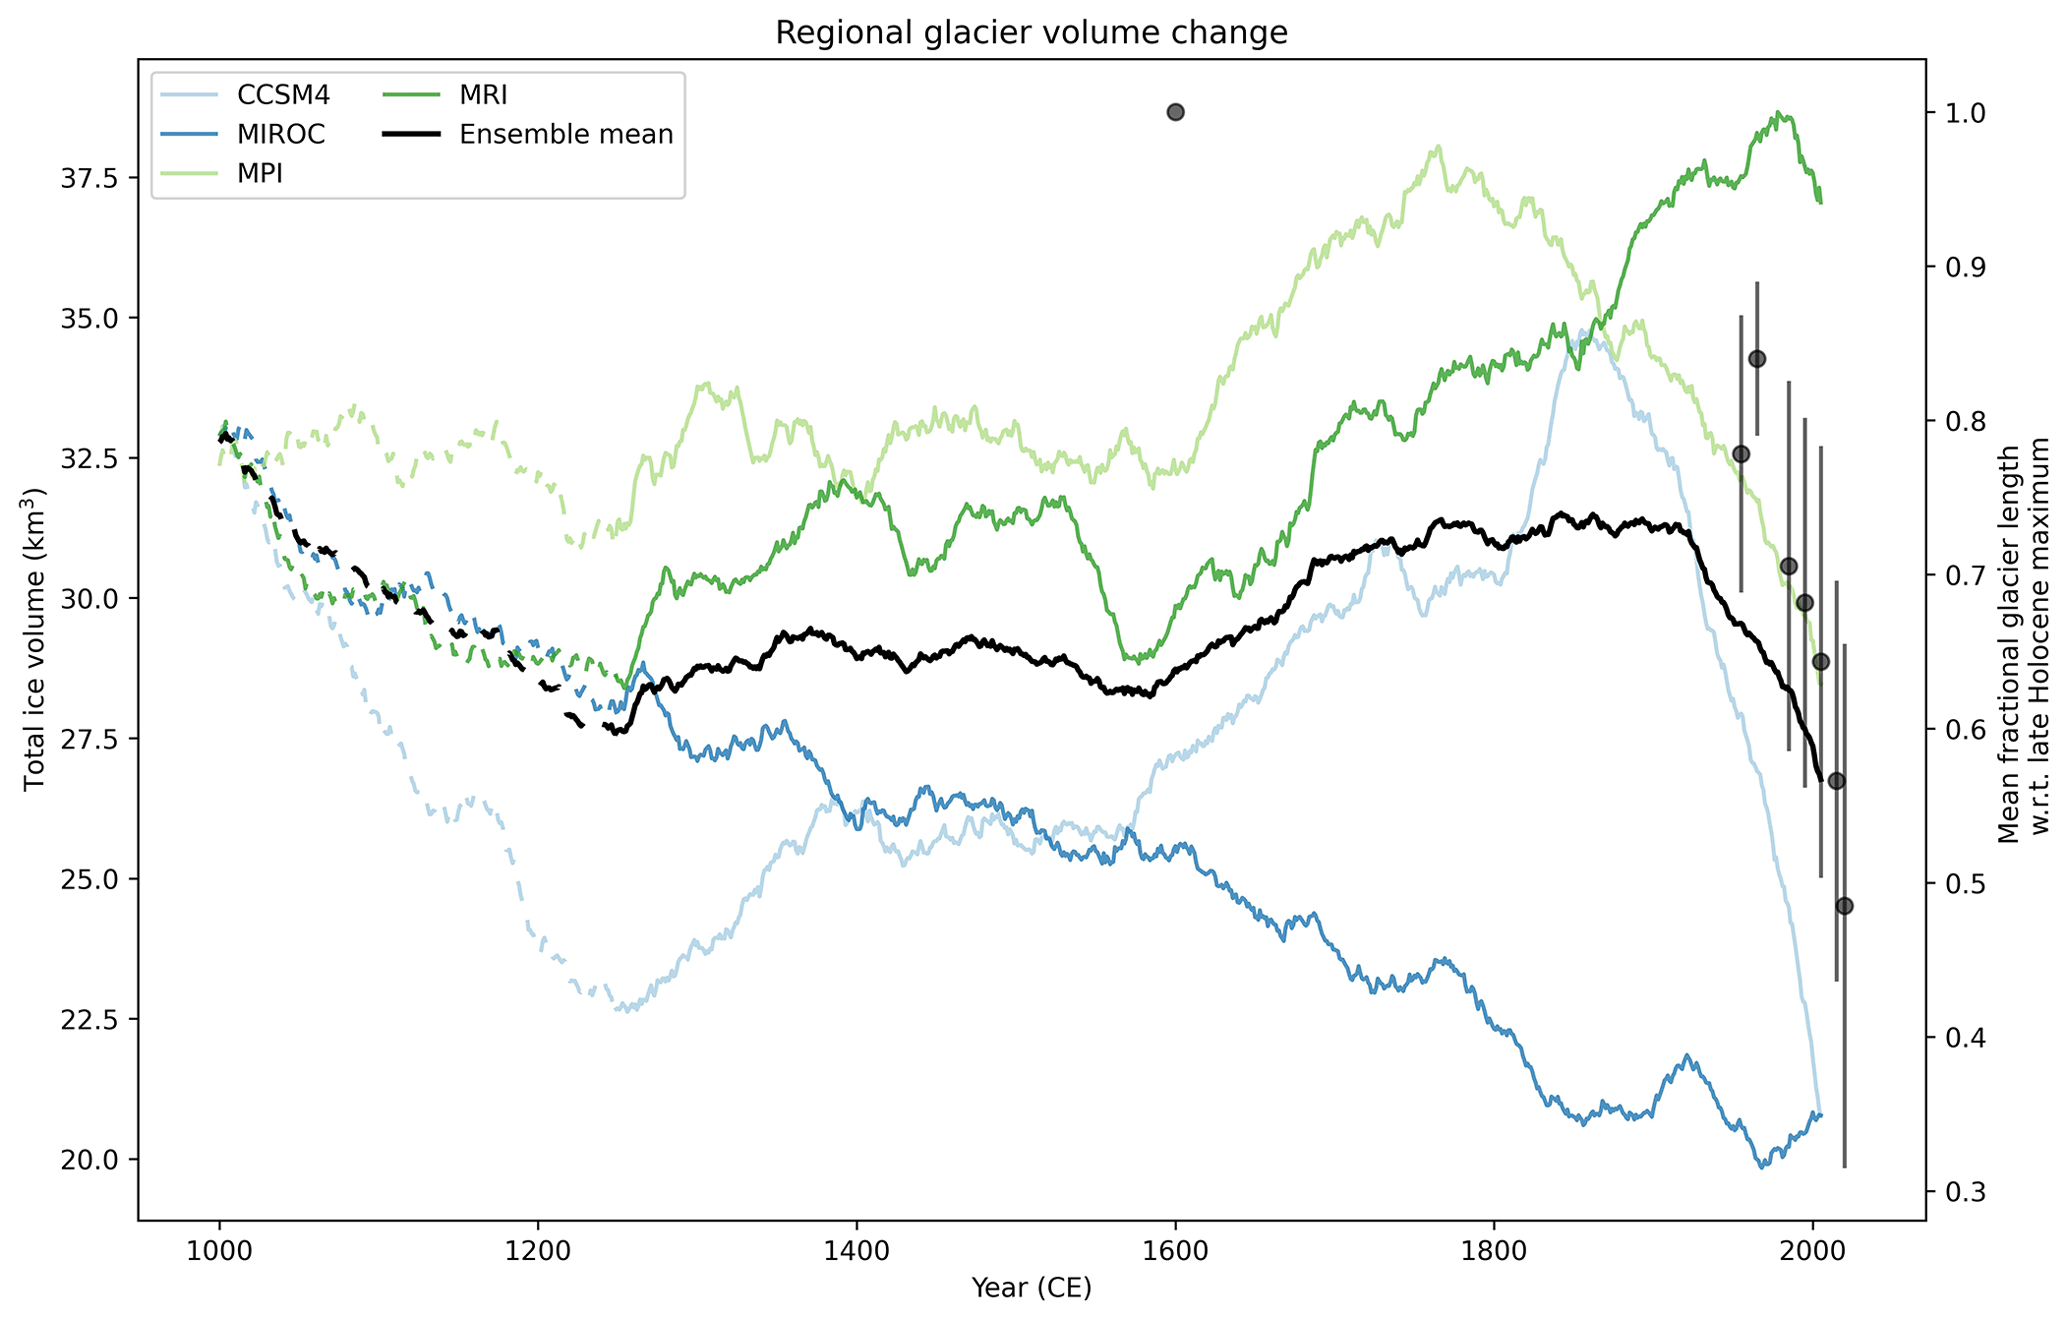
Figure 5Modeled ice volume change for all glaciers in the eastern YT and NWT produced by OGGM using four different GCMs. Dashed lines from 1000 CE to 1250 CE are used to indicate the spin-up duration of the model. Dots and vertical lines respectively denote the average and standard deviation (1σ) of normalized mean glacier length binned by decade.
4.4 21st century glacier projections
Under all CCSM4 21st century emission scenarios, glacier volume in the eastern YT and NWT significantly declines throughout this century (Fig. 6). Glacier volume is projected to decrease by 85 % under RCP2.6 and 97 % under RCP8.5 compared to 2019 CE values. The greatest rate of ice loss is projected to be between the present day and ca. 2040 CE; then the rate of volume decline slowly decreases through to the end of the century.
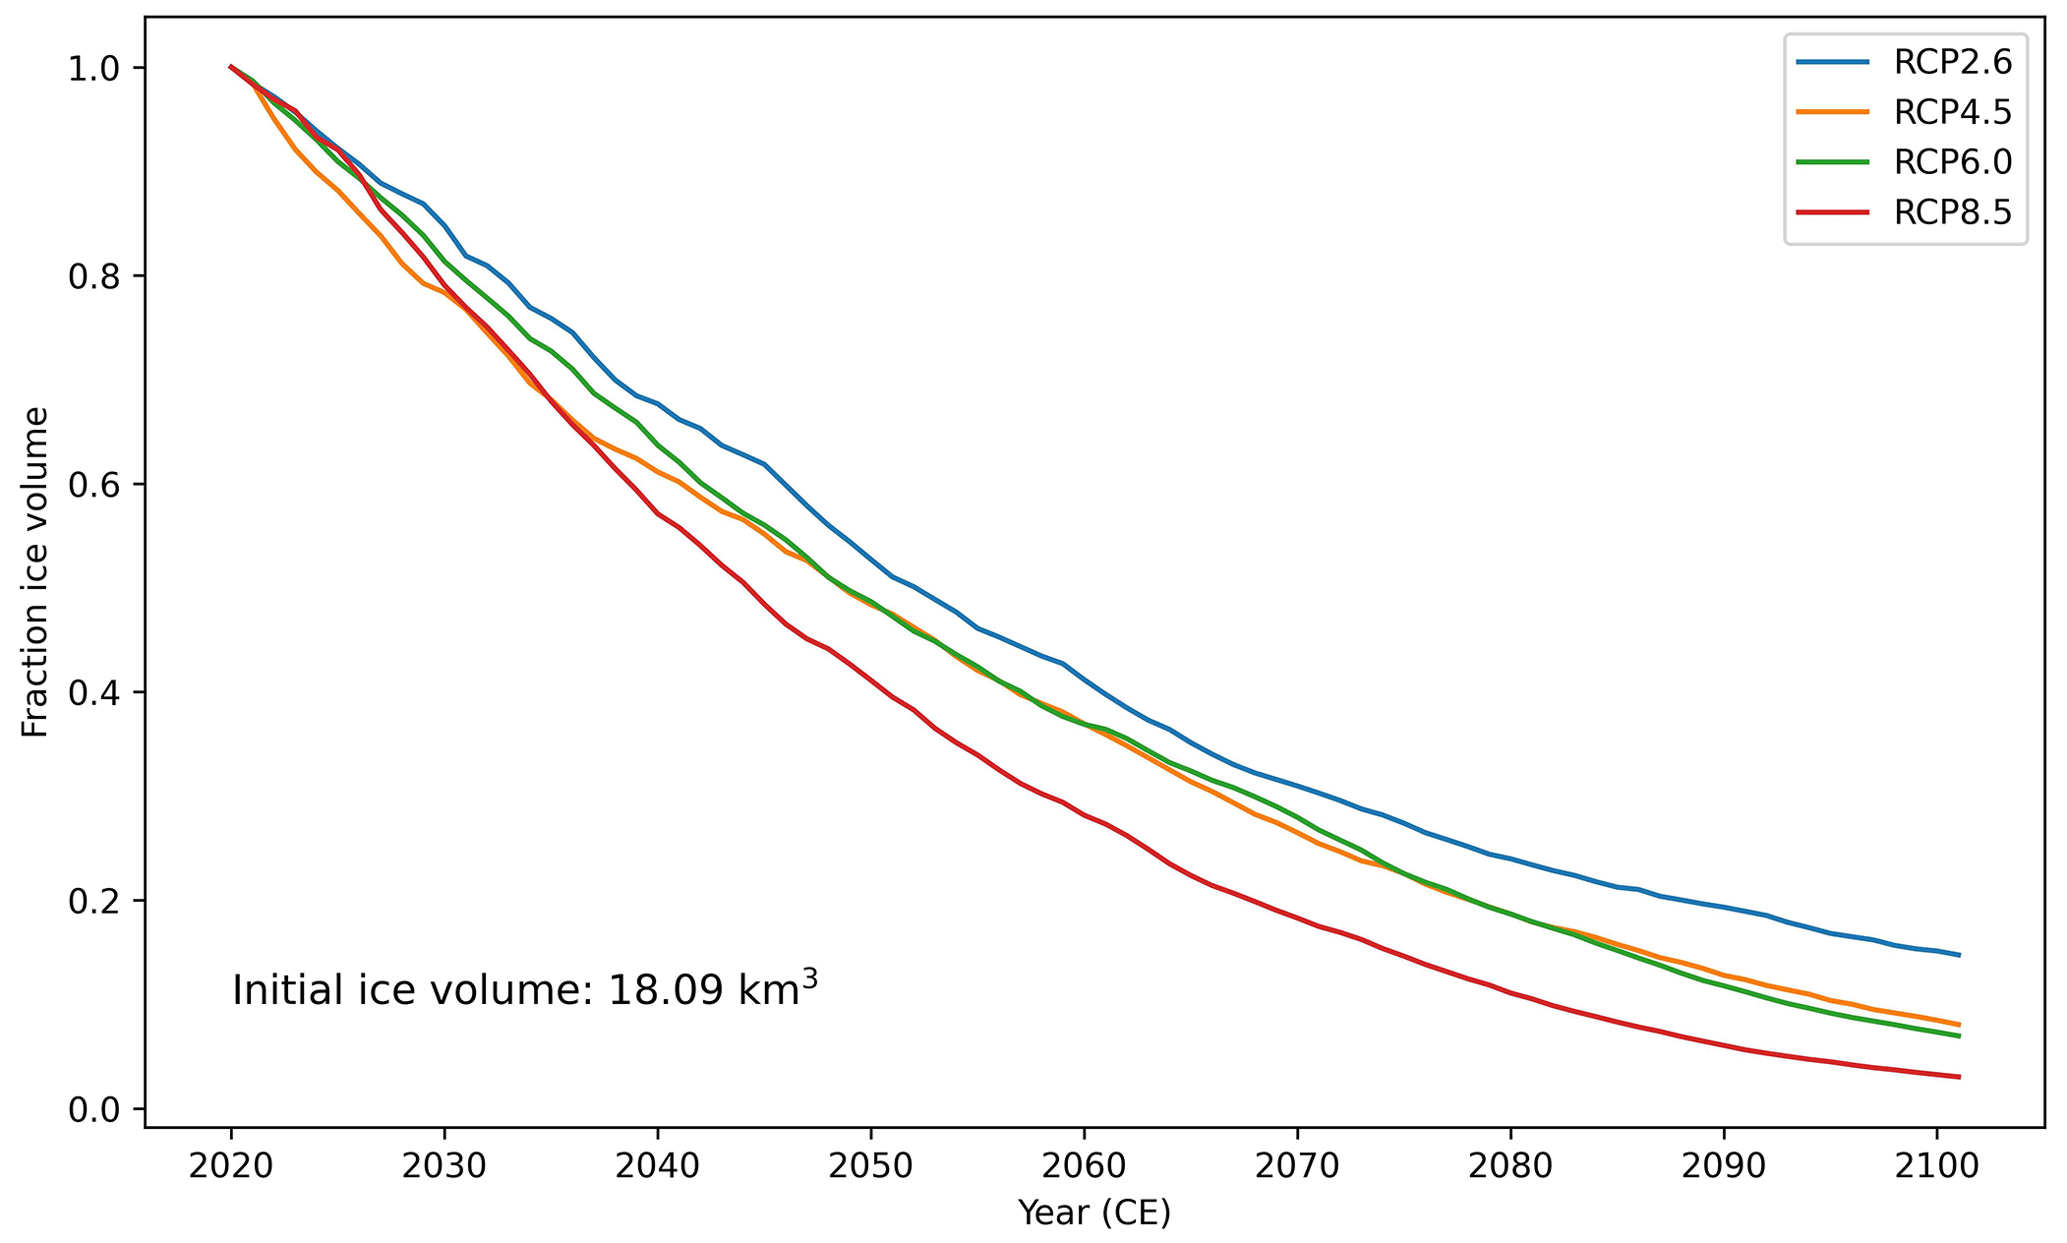
Figure 6Fractional glacier volume change until 2100 CE under various Representative Concentration Pathways (RCPs) for all glaciers in the eastern YT and NWT.
5.1 Holocene glacier fluctuations
Early Holocene erratic boulders just beyond moraines dating to the last millennium, as well as a lack of moraines down-valley of the latest Holocene moraines, imply that since ca. 11 ka, glaciers in this region have been no more extensive than during the latest Holocene. These results agree with records from southern Alaska and western Canada (Menounos et al., 2009; Mood and Smith, 2015; Barclay et al., 2009) showing that most alpine glaciers within these regions reached their greatest Holocene positions during the last several hundred years. We interpret the erratic boulders of latest Pleistocene age to record local deglaciation associated with the termination of the Younger Dryas cold interval (Menounos et al., 2017; Seguinot et al., 2016; Braumann et al., 2022). Similar erratic boulders that lie beyond late Holocene cirque moraines were dated by Menounos et al. (2017) and were also interpreted to record local deglaciation. The erratic boulders sampled in the present study were not part of a moraine, so their ages are interpreted to reflect deglaciation at those sites; the absence of an associated moraine precludes us from drawing conclusions about the size of the up-valley glaciers. The most parsimonious explanation for coeval ages of erratic boulders and end moraines is the complex decay of the Cordilleran Ice Sheet; some cirques were still covered by the ice sheet, while others were ice-free prior to the Younger Dryas and were therefore able to form an end moraine (Menounos et al., 2017).
Our moraine chronology generally agrees with the limited previous work in this region. Moraine ages from this study suggest that glaciers reached their LIA maximum closer to 1560 CE, with a possible readvance or standstill in the mid-1800s. Tomkins et al. (2008) used varve and tree ring records near Tungsten, YT, to infer periods of glacier growth around the late 1300s to 1450 CE, 1600 to 1670 CE, and 1730 to 1778 CE, as well as an apparent Little Ice Age maximum from 1778–1892 CE. Dyke (1990) completed an extensive lichenometric survey of rock glaciers and late Holocene moraines directly west and south of Tungsten, dating most late Holocene moraines to within the past 400 years. Our moraine chronology is in general agreement with the lichenometric ages of Dyke (1990) and suggests an earlier Little Ice Age maximum than interpreted by Tomkins et al. (2008). The significant scatter in our 10Be moraine dataset complicates our interpretations of decadal- to century-scale glacier fluctuations, however.
Several scenarios could yield moraine exposure ages that are either older or younger than the true depositional age of the moraine. Inherited nuclides from episodes of previous exposure would result in exposure ages older than the true depositional age. One source of inherited nuclides could be rockfall followed by supraglacial transport before deposition on the moraine. It is also possible that there was insufficient resetting of the 10Be inventory in the local bedrock during the Last Glacial Maximum (LGM) as these sites sit at the periphery of the LGM extent of the Cordilleran Ice Sheet. A third possibility is that the inclusion of old outliers reflects the incorporation of previously exposed boulders within the glacier forefield. A review of Holocene glacier fluctuations in western Canada revealed a progressive expansion of ice that culminated with climatic advances during the Little Ice Age (Menounos et al., 2009). Given what is known about Holocene glacier activity, the most likely explanation for our pre-Little Ice Age boulder ages is that these boulders contain inherited nuclides from previous moraine-building events and were subsequently reincorporated into the late Holocene moraines during the advances of the Little Ice Age.
A final possibility to explain the scatter in our moraine ages is that many boulder ages are too young. Mass shielding by previous burial within a moraine followed by exhumation of a sampled boulder, or from snow cover, would reduce the nuclide production rate and result in erroneously young exposure ages. Exhumation and post-depositional movement would be more likely if our moraines were originally ice-cored (Crump et al., 2017).
Snow cover results in younger apparent ages on moraine boulders; however, unrealistic quantities of snow cover are required to meaningfully impact the exposure age of our moraines. 1 m of 0.25 g cm−3 snow on the surface of our boulders for 4 months of the year would decrease the calculated age by 15 %–27 % (Supplement Table S4). This decrease in age does not significantly impact our interpretations, as the moraines would still predominately date to the Little Ice Age.
The timing of glacier fluctuations in the eastern Yukon and Northwest Territories agrees with records of late Holocene glacier advance in Europe (Braumann et al., 2020, 2021; Ivy-Ochs et al., 2009). Though Europe has different climate forcings than western North America, the similar timing of late Holocene glacier response suggests that lower temperatures associated with decreasing summer insolation in the Northern Hemisphere played an important role in the timing of glacier advance in the late Holocene in both regions.
5.2 ELA and climate reconstruction
In this study, we reconstructed and estimated past and present glacier ELAs through several methods, in line with recommendations by Benn et al. (2005) that multiple ELA reconstruction methods be used to provide a more robust estimation of past ELAs and uncertainty with each reconstruction method. An important limitation to the AAR and THAR methods is that they do not account for modern glaciers being out of equilibrium with modern climate. If the modern ELA is not accurately known and the glacier is retreating or advancing in response to climate perturbations, then comparisons in ELA change between the modern time period and other time periods will underestimate or overestimate ELA departures (Porter, 2001). Additionally, the assumption that a glacier's ELA only fluctuates due to changes in temperature is an oversimplification (Ohmura et al., 1992). Increased (decreased) precipitation will lead to a higher (lower) mass balance and may obscure the impact of temperature change on glacier response (i.e., Shea et al., 2004).
Anderson et al. (2011) present lacustrine δ18O records from the central Yukon that suggest a wet, early Little Ice Age and then dry conditions until modern day in response to the changing position and strength of the Aleutian Low. If glaciers in the Mackenzie and Selwyn mountains received greater snowfall during the LIA, then less cooling would be needed to grow glaciers to their LIA extents. Tomkins et al. (2008) developed a July mean temperature reconstruction from tree rings and varved lake sediments close to Tungsten, near the northern end of Nahanni National Park Reserve. Their amalgamated temperature reconstruction demonstrates the differing signals of varved lacustrine sediment and tree ring records but does suggest cooler temperatures in the early 1800s and a warm interval at the end of the 1800s to early 1900s, followed by cooling until at least the 1940s before warmer-than-average July temperatures until modern times.
Our non-transient experiment using OGGM provides another estimate for temperature change since the LIA, though it still ignores the effect of precipitation variability. By determining the temperature lowering from the present climate needed to grow a modeled glacier to LIA extents, we remove the likely erroneous estimation of the modern glacier ELA based on current glacier hypsometry and more directly compare modern temperatures with the inferred temperature during the LIA maximum, when the glacier was in equilibrium with climate. Both the non-transient (“OGGM TLower” in Fig. 4) and surface mass balance (“OGGM Smb” in Fig. 4) experiments incorporate modern climatology and as a result indicate generally greater temperature change since the LIA compared to glacier-geometry-based reconstruction methods. A bedrock borehole temperature reconstruction (62.47∘ N, 129.22∘ W) between Nahanni National Park and Keele Peak indicates around +3 ∘C of surface warming since 1500 CE (Huang et al., 2000), consistent with our temperature change estimates comparing past ELAs to modern climatology. A similar study design as presented in this paper would be improved by selecting a site with a multiyear in situ mass balance record to compare the modeled modern ELA estimate with the ELA derived from in situ measurements.
OGGM is built to perform best at regional to global scales and may produce problematic results at the scale of individual glaciers (Maussion et al., 2019). Differences between the year of DEM acquisition and RGI glacier extent, erroneous glacier margins, and lack of nearby mass balance calibration information can all have significant impacts on the evolution of individual modeled glaciers. To help give confidence that the modeling results from OGGM were producing reasonable glacier evolution, we ran a simple flowline glacier model modified from Jarosch et al. (2013), which was able to grow glaciers to similar extents as OGGM (Supplement Fig. S2). The similar glacier evolution between the two models indicates that modeled glacier response is the result of climate inputs rather than unique properties of each model.
As mentioned above, regular mass balance data from in situ mass balance measurements or remote sensing on glaciers in remote areas will help improve the performance and validation of global glacier models like OGGM (Eis et al., 2021). A study design similar to that presented in this paper may be successfully implemented in areas with robust glacier chronologies from the late Holocene to the present from many more glaciers than are included in our study. Well-constrained glacier chronologies would serve to extend the calibration or validation dataset for large-scale glacier modeling efforts (i.e., Rounce et al., 2023).
5.3 GCM evaluation
Of the four different CMIP5 GCM simulations tested, glacier model runs forced by CCSM4 and MPI yield glacier fluctuations that best match our general understanding of latest Holocene glacier expansion and glacier retreat over the past millennium (Menounos et al., 2009; Luckman, 2000; Fig. 5). We consider the results from MRI to be unreasonable due to the continued ice expansion through most of the 20th century and similarly discount the results from MIROC due to the modeled steady glacier volume decline over the entire past millennium.
Our 10Be chronology suggests glacier advance and moraine formation earlier than what the modeling results show. At Arrowhead Glacier, the outer and inner moraine 10Be ages (1620 and 1860 CE, respectively) are comparable with the modeled glacier evolution under the CCSM4 climate, however. MRI suggests a period of glacier retreat shortly before 1600 CE, which is consistent with our moraine chronology; however, MRI, CCSM4, and MPI all suggest further ice expansion, which would have overridden previously deposited moraines. If the exposure age of a moraine is interpreted to more closely record the onset of glacier retreat, rather than advance, then our moraine chronology further indicates that glaciers reached their LIA maximum extents prior to when OGGM suggests.
The four GCMs used in our study simulate varied temperature and precipitation time series over the past millennium, which results in differing modeled glacier responses (Supplement Figs. S8–S11). Modeled glaciers forced by CCSM4 and MPI reach late Holocene maxima between 1765 and 1860 CE, coincident with other late Holocene glacier records (Menounos et al., 2009; Barclay et al., 2009; Mood and Smith, 2015). Our moraine and remote sensing record allowed four GCMs to be calibrated for a small selection of glaciers in the region prior to being run for all 1235 glaciers. Without a well-dated moraine chronology, we would be unable to assess how the model performs beyond the remote sensing record.
Further research is needed to evaluate why the existing GCM simulations fail to grow glaciers at the same time as our moraine chronology suggests in northwestern Canada. The moraine record offers an important method of validating glacier models beyond the remote sensing record; however, moraine chronologies must be tightly constrained in order to confidently evaluate model results. Additional cosmogenic surface exposure dating in this region, especially in areas where there is an unambiguous lack of post-depositional movement, may help to produce moraine chronologies with less scatter. Measuring multiple nuclides on moraine boulders (such as using paired 14C–10Be) would allow potential inheritance to be investigated (i.e., Goehring et al., 2022). Finally, as mentioned above, consistent mass balance records from glaciers in this region would help to better constrain the influence of local climate on glacier response in the Mackenzie and Selwyn mountains (Pelto et al., 2019; Ednie and Demuth, 2019).
5.4 Future response of glaciers to climate change
The Mackenzie and Selwyn mountains are almost certain to experience profound glacier mass loss throughout the 21st century. The estimated magnitude of ice volume decline agrees with modeling results by Clarke et al. (2015), who estimate a 70 %–95 % reduction in glacier volume in the Canadian Rocky Mountains by 2100 CE. Additionally, recent work by Rounce et al. (2023) estimates 93 %–100 % deglaciation in the Mackenzie and Selwyn mountains by 2100 CE, depending on the magnitude of global temperature change. Under SSP3.7 and SSP5.85, this region is predicted to be fully deglaciated by 2080 CE (Rounce et al., 2023). By 2019 CE, approximately half of the ice volume was lost in the Mackenzie and Selwyn mountains in the CCSM4 run compared to the glacier maximum in 1860 CE (Fig. 5). The loss of glaciers in this region will cause greater fluctuations in streamflow and temperature that may have negative impacts on thermally stressed species, including fish that are important food sources for local communities (Babaluk et al., 2015; Clason et al., 2023; Moore et al., 2009).
Based on geomorphic mapping, surface exposure ages, and numerical modeling, the following conclusions can be drawn from our study. (1) The probability distribution of 10Be ages suggests that most glaciers in eastern YT and NWT reached their greatest Holocene extents during the latter half of the Little Ice Age (1600–1850 CE). (2) The uncertainty ascribed to some moraines is high, given the presence of some boulders that yielded 10Be ages that predate the Little Ice Age, and future work utilizing multi-nuclide approaches would allow this scatter to be further investigated. (3) We find no evidence of glaciers extending beyond LIA limits since at least 10.9–11.6 ka, in accord with most other Holocene glacier records in the Northern Hemisphere. (4) Our ELA reconstructions suggest warming of 0.2–2.3 ∘C since the LIA, with morphology-based ELA reconstructions likely underestimating the modern ELA of glaciers undergoing retreat. And (5) projections of future glacier change estimate a further 85 %–97 % loss of glacier volume in the Mackenzie and Selwyn mountains by 2100 CE, in agreement with recent global modeling efforts.
Glacier chronologies from late Holocene glacier fluctuations can provide important sources of validation of GCM simulations beyond the instrumental record, especially given the variety between individual GCM simulations of past climate. Nearby in situ mass balance records and well-constrained late Holocene glacier chronologies are needed to help validate past millennium GCM simulations and highlight important feedbacks between the arctic and the global climate system. Modern tropospheric warming will continue to dramatically reduce glacier volume in this region, with significant impacts on the local ecosystem that relies on glacier-fed rivers and streams through the summer months.
All data described in this paper that have not already been published elsewhere are included within the main text and/or Supplement. Code used for glacier modeling has been sourced from https://OGGM.org (last access: 1 April 2023, Maussian et al., 2019) or from Jarosch et al. (2013). Code used for analysis can be accessed at https://github.com/adamglacier/LIA-Yukon (last access: 10 October 2023) and https://doi.org/10.5281/zenodo.8436478 (Hawkins, 2023).
The supplement related to this article is available online at: https://doi.org/10.5194/tc-17-4381-2023-supplement.
Following the CRediT Authorship Guidelines, ACH contributed to all 14 authorship components except resources and supervision. BM was involved in all authorship components. BMG contributed to formal analysis, investigation, resources, supervision, validation, and review and editing. GO was involved in conceptualization, investigation, supervision, and review and editing. BMP contributed to data curation, methodology, and software. CMD was involved in investigation, visualization, and review and editing. JMS was involved in conceptualization, funding acquisition, investigation, and review and editing.
The contact author has declared that none of the authors has any competing interests.
Publisher's note: Copernicus Publications remains neutral with regard to jurisdictional claims made in the text, published maps, institutional affiliations, or any other geographical representation in this paper. While Copernicus Publications makes every effort to include appropriate place names, the final responsibility lies with the authors.
Funding for this study was provided by an NSERC Northern Supplement and Discovery grant to Brian Menounos and a GSA Quaternary Geology and Geomorphology Division Arthur D. Howard Research Award to Adam C. Hawkins. Additional travel support was provided to Adam C. Hawkins by the University of Northern British Columbia. The Geological Survey of Canada shared helicopter access in the Nahanni National Park Reserve (NNPR) and graciously allowed us use of their concrete saw. The friendly staff at the Whitehorse Airphoto Library provided invaluable assistance with field site reconnaissance. We are grateful to the Dehcho, Denendeh, and Nahanni Butte First Nations for access to complete our study on their traditional territories. Rebecca Lerch assisted in fieldwork in NNPR. Expert flying by Alpine Aviation provided floatplane access to remote sites around Keele Peak and in NNPR. We thank Christopher Halsted and Alia Lesnek for their helpful comments that improved this paper.
This research has been supported by the Natural Sciences and Engineering Research Council of Canada (Discovery Grant and Northern Research Supplement grant), the Geological Society of America (Arthur D. Howard Research Award), and the Canada Excellence Research Chairs, Government of Canada.
This paper was edited by Chris R. Stokes and reviewed by Alia J. Lesnek and Christopher Halsted.
Anderson, L., Finney, B. P., and Shapley, M. D.: Lake carbonate-δ18O records from the Yukon Territory, Canada: Little Ice Age moisture variability and patterns, Quaternary Sci. Rev., 30, 887–898, 2011.
Babaluk, J. A., Sawatzky, C. D., Watkinson, D. A., Tate, D. P., Mochnacz, N. J., and Reist, J. D.: Distributions of Fish Species within the South Nahanni River Watershed, Northwest Territories, 91 pp., ISBN 978-0-660-02009-9, 2015.
Badding, M. E., Briner, J. P., and Kaufman, D. S.: 10Be ages of late Pleistocene deglaciation and Neoglaciation in the north-central Brooks Range, Arctic Alaska, J. Quaternary Sci., 28, 95–102, 2013.
Barclay, D. J., Wiles, G. C., and Calkin, P. E.: Holocene glacier fluctuations in Alaska, Quaternary Sci. Rev., 28, 2034–2048, 2009.
Benn, D. I., Owen, L. A., Osmaston, H. A., Seltzer, G. O., Porter, S. C., and Mark, B.: Reconstruction of equilibrium-line altitudes for tropical and sub-tropical glaciers, Quatern. Int., 138–139, 8–21, 2005.
Borchers, B., Marrero, S., Balco, G., Caffee, M., Goehring, B., Lifton, N., Nishiizumi, K., Phillips, F., Schaefer, J., and Stone, J.: Geological calibration of spallation production rates in the CRONUS-Earth project, Quat. Geochronol., 31, 188–198, 2016.
Braithwaite, R. J. and Raper, S. C. B.: Estimating equilibrium-line altitude (ELA) from glacier inventory data, Ann. Glaciol., 50, 127–132, 2009.
Braumann, S. M., Schaefer, J. M., Neuhuber, S. M., Reitner, J. M., Lüthgens, C., and Fiebig, M.: Holocene glacier change in the Silvretta Massif (Austrian Alps) constrained by a new 10Be chronology, historical records and modern observations, Quaternary Sci. Rev., 245, 106493, https://doi.org/10.1016/j.quascirev.2020.106493, 2020.
Braumann, S. M., Schaefer, J. M., Neuhuber, S. M., Lüthgens, C., Hidy, A. J., and Fiebig, M.: Early Holocene cold snaps and their expression in the moraine record of the eastern European Alps, Clim. Past, 17, 2451–2479, https://doi.org/10.5194/cp-17-2451-2021, 2021.
Braumann, S. M., Schaefer, J. M., Neuhuber, S., and Fiebig, M.: Moraines in the Austrian Alps record repeated phases of glacier stabilization through the Late Glacial and the Early Holocene, Sci. Rep., 12, 9438, https://doi.org/10.1038/s41598-022-12477-x, 2022.
Cecile, M. P. and Abbott, J. G.: Geology of the Niddery Lake map area [NTS 105-O], Geological Survey of Canada, Open File 2076, https://doi.org/10.4095/130689, 1989.
Clarke, G. K. C., Jarosch, A. H., Anslow, F. S., Radić, V., and Menounos, B.: Projected deglaciation of western Canada in the twenty-first century, Nat. Geosci., 8, 372–377, 2015.
Clason, C., Rangecroft, S., Owens, P. N., Łokas, E., Baccolo, G., Selmes, N., Beard, D., Kitch, J., Dextre, R. M., Morera, S., and Blake, W.: Contribution of glaciers to water, energy and food security in mountain regions: current perspectives and future priorities, Ann. Glaciol., 1–6, https://doi.org/10.1017/aog.2023.14, 2023.
Crump, S. E., Anderson, L. S., Miller, G. H., and Anderson, R. S.: Interpreting exposure ages from ice-cored moraines: a Neoglacial case study on Baffin Island, Arctic Canada, J. Quaternary Sci., 32, 1049–1062, 2017.
Cuffey, K. M. and Paterson, W. S. B.: The Physics of Glaciers, Academic Press, 704 pp., ISBN 9780123694614, 2010.
Dahl, S. O. and Nesje, A.: Paleoclimatic implications based on equilibrium-line altitude depressions of reconstructed Younger Dryas and Holocene cirque glaciers in inner Nordfjord, western Norway, Palaeogeogr. Palaeoclim., 94, 87–97, 1992.
Darvill, C. M., Menounos, B., Goehring, B. M., and Lesnek, A. J.: Cordilleran ice sheet stability during the last deglaciation, Geophys. Res. Lett., 49, e2021GL097191, https://doi.org/10.1029/2021gl097191, 2022.
Demuth, M. N., Wilson, P., and Haggarty, D.: Glaciers of the Ragged Range, Nahanni National Park Reserve, Northwest Territories, Canada, in: Global Land Ice Measurements from Space, edited by: Kargel, J. S., Leonard, G. J., Bishop, M. P., Kääb, A., and Raup, B. H., Springer Berlin Heidelberg, Berlin, Heidelberg, 375–383, https://doi.org/10.1007/978-3-540-79818-7_16, 2014.
Ditchburn, R. G. and Whitehead, N. E.: The separation of 10Be from silicates, Proceedings of the 3rd workshop of the South Pacific Environmental Radioactivity Association (SPERA) Extended abstracts, 4–7, 15–17 February 1994.
Duk-Rodkin, A., Barendregt, R. W., Tarnocai, C., and Phillips, F. M.: Late Tertiary to late Quaternary record in the Mackenzie Mountains, Northwest Territories, Canada: stratigraphy, paleosols, paleomagnetism, and chlorine – 36, Can. J. Earth Sci., 33, 875–895, 1996.
Dyke, A. S.: A lichenometric study of Holocene rock glaciers and neoglacial moraines, Frances Lake map area, southeastern Yukon Territory and Northwest Territories, Geological Survey of Canada, 1–33, ISBN 0-660-13739-9, 1990.
Ednie, M. and Demuth, M. N.: Mass balance results from the Cordillera Glacier-Climate Observing Network, British Columbia, Northwest Territories, and Alberta, for 2015 and 2016 balance years, Geological Survey of Canada, Open File 8503, 30 pp., https://doi.org/10.4095/314926, 2019.
Eis, J., van der Laan, L., Maussion, F., and Marzeion, B.: Reconstruction of past glacier changes with an ice-flow glacier model: proof of concept and validation, Front. Earth Sci., 9, 77, https://doi.org/10.3389/feart.2021.595755, 2021.
Fritz, M., Herzschuh, U., Wetterich, S., Lantuit, H., De Pascale, G. P., Pollard, W. H., and Schirrmeister, L.: Late glacial and Holocene sedimentation, vegetation, and climate history from easternmost Beringia (northern Yukon Territory, Canada), Quaternary Res., 78, 549–560, 2012.
Goehring, B. M., Menounos, B., Osborn, G., Hawkins, A., and Ward, B.: Reconciling the apparent absence of a Last Glacial Maximum alpine glacial advance, Yukon Territory, Canada, through cosmogenic beryllium-10 and carbon-14 measurements, Geochronology, 4, 311–322, 2022.
Gordey, S. P.: Geology, Little Nahanni River, Northwest Territories-Yukon Territory, Geological Survey of Canada, “A” Series Map 1762A, https://doi.org/10.4095/184006, 1992.
Gosse, J. C. and Phillips, F. M.: Terrestrial in situ cosmogenic nuclides: theory and application, Quaternary Sci. Rev., 20, 1475–1560, 2001.
Harris, I., Osborn, T. J., Jones, P., and Lister, D.: Version 4 of the CRU TS monthly high-resolution gridded multivariate climate dataset, Sci. Data, 7, 109, https://doi.org/10.1038/s41597-020-0453-3, 2020.
Hawkins, A.: adamglacier/LIA-Yukon: v1.0.0 (v1.0.0), Zenodo [code], https://doi.org/10.5281/zenodo.8436478, 2023.
Hawkins, A. C., Menounos, B., Goehring, B. M., Osborn, G. D., Clague, J. J., and Jensen, B.: Tandem dating methods constrain late Holocene glacier advances, southern Coast Mountains, British Columbia, Quaternary Sci. Rev., 274, 107282, https://doi.org/10.1016/j.quascirev.2021.107282, 2021.
Hersbach, H., Bell, B., Berrisford, P., Hirahara, S., Horányi, A., Muñoz-Sabater, J., Nicolas, J., Peubey, C., Radu, R., Schepers, D., Simmons, A., Soci, C., Abdalla, S., Abellan, X., Balsamo, G., Bechtold, P., Biavati, G., Bidlot, J., Bonavita, M., Chiara, G., Dahlgren, P., Dee, D., Diamantakis, M., Dragani, R., Flemming, J., Forbes, R., Fuentes, M., Geer, A., Haimberger, L., Healy, S., Hogan, R. J., Hólm, E., Janisková, M., Keeley, S., Laloyaux, P., Lopez, P., Lupu, C., Radnoti, G., Rosnay, P., Rozum, I., Vamborg, F., Villaume, S., and Thépaut, J.-N.: The ERA5 global reanalysis, Q. J. Roy. Meteor. Soc., 146, 1999–2049, 2020.
Heyman, J., Applegate, P. J., Blomdin, R., Gribenski, N., Harbor, J. M., and Stroeven, A. P.: Boulder height – exposure age relationships from a global glacial 10Be compilation, Quat. Geochronol., 34, 1–11, 2016.
Huang, S., Pollack, H. N., and Shen, P. Y.: Temperature trends over the past five centuries reconstructed from borehole temperatures, Nature, 403, 756–758, 2000.
Hugonnet, R., McNabb, R., Berthier, E., Menounos, B., Nuth, C., Girod, L., Farinotti, D., Huss, M., Dussaillant, I., Brun, F., and Kääb, A.: Accelerated global glacier mass loss in the early twenty-first century, Nature, 592, 726–731, 2021.
Ivy-Ochs, S., Kerschner, H., Maisch, M., Christl, M., Kubik, P. W., and Schlüchter, C.: Latest Pleistocene and Holocene glacier variations in the European Alps, Quaternary Sci. Rev., 28, 2137–2149, 2009.
Jarosch, A. H., Schoof, C. G., and Anslow, F. S.: Restoring mass conservation to shallow ice flow models over complex terrain, The Cryosphere, 7, 229–240, https://doi.org/10.5194/tc-7-229-2013, 2013.
Kienholz, C., Rich, J. L., Arendt, A. A., and Hock, R.: A new method for deriving glacier centerlines applied to glaciers in Alaska and northwest Canada, The Cryosphere, 8, 503–519, https://doi.org/10.5194/tc-8-503-2014, 2014.
Landrum, L., Otto-Bliesner, B. L., Wahl, E. R., Conley, A., Lawrence, P. J., Rosenbloom, N., and Teng, H.: Last millennium climate and its variability in CCSM4, J. Climate, 26, 1085–1111, 2013.
Luckman, B. H.: The Little Ice Age in the Canadian Rockies, Geomorphology, 32, 357–384, 2000.
Marcott, S. A., Shakun, J. D., Clark, P. U., and Mix, A. C.: A reconstruction of regional and global temperature for the past 11,300 years, Science, 339, 1198–1201, 2013.
Marzeion, B., Hofer, M., Jarosch, A. H., Kaser, G., and Mölg, T.: A minimal model for reconstructing interannual mass balance variability of glaciers in the European Alps, The Cryosphere, 6, 71–84, https://doi.org/10.5194/tc-6-71-2012, 2012.
Maussion, F., Butenko, A., Champollion, N., Dusch, M., Eis, J., Fourteau, K., Gregor, P., Jarosch, A. H., Landmann, J., Oesterle, F., Recinos, B., Rothenpieler, T., Vlug, A., Wild, C. T., and Marzeion, B.: The Open Global Glacier Model (OGGM) v1.1, Geosci. Model Dev., 12, 909–931, https://doi.org/10.5194/gmd-12-909-2019, 2019.
Meier, M. F. and Post, A. S.: Recent variations in mass net budgets of glaciers in western North America, International Association of Scientific Hydrology Publications, 58, 63–77, 1962.
Meierding, T. C.: Late Pleistocene glacial equilibrium-line altitudes in the Colorado Front Range: a comparison of methods, Quaternary Res., 18, 289–310, 1982.
Menounos, B., Osborn, G., Clague, J. J., and Luckman, B. H.: Latest Pleistocene and Holocene glacier fluctuations in western Canada, Quaternary Sci. Rev., 28, 2049–2074, 2009.
Menounos, B., Goehring, B. M., Osborn, G., Margold, M., Ward, B., Bond, J., Clarke, G. K. C., Clague, J. J., Lakeman, T., Koch, J., Caffee, M. W., Gosse, J., Stroeven, A. P., Seguinot, J., and Heyman, J.: Cordilleran Ice Sheet mass loss preceded climate reversals near the Pleistocene Termination, Science, 358, 781–784, 2017.
Mood, B. J. and Smith, D. J.: Holocene glacier activity in the British Columbia Coast Mountains, Canada, Quaternary Sci. Rev., 128, 14–36, 2015.
Moore, E. M. M., Eaves, S. R., Norton, K. P., Mackintosh, A. N., Anderson, B. M., Dowling, L. H., and Hidy, A. J.: Climate reconstructions for the Last Glacial Maximum from a simple cirque glacier in Fiordland, New Zealand, Quaternary Sci. Rev., 275, 107281, https://doi.org/10.1016/j.quascirev.2021.107281, 2022.
Moore, R. D., Fleming, S. W., Menounos, B., Wheate, R., Fountain, A., Stahl, K., Holm, K., and Jakob, M.: Glacier change in western North America: influences on hydrology, geomorphic hazards and water quality, Hydrol. Process., 23, 42–61, 2009.
Moss, R. H., Edmonds, J. A., Hibbard, K. A., Manning, M. R., Rose, S. K., van Vuuren, D. P., Carter, T. R., Emori, S., Kainuma, M., Kram, T., Meehl, G. A., Mitchell, J. F. B., Nakicenovic, N., Riahi, K., Smith, S. J., Stouffer, R. J., Thomson, A. M., Weyant, J. P., and Wilbanks, T. J.: The next generation of scenarios for climate change research and assessment, Nature, 463, 747–756, 2010.
Muñoz-Sabater, J., Dutra, E., Agustí-Panareda, A., Albergel, C., Arduini, G., Balsamo, G., Boussetta, S., Choulga, M., Harrigan, S., Hersbach, H., Martens, B., Miralles, D. G., Piles, M., Rodríguez-Fernández, N. J., Zsoter, E., Buontempo, C., and Thépaut, J.-N.: ERA5-Land: a state-of-the-art global reanalysis dataset for land applications, Earth Syst. Sci. Data, 13, 4349–4383, https://doi.org/10.5194/essd-13-4349-2021, 2021.
Murray, D. R. and Locke, W. W.: Dynamics of the late Pleistocene Big Timber Glacier, Crazy Mountains, Montana, USA, J. Glaciol., 35, 183–190, 1989.
NASA/METI/AIST/Japan Spacesystems and U.S./Japan ASTER Science Team: ASTER Global Digital Elevation Model V003, NASA EOSDIS Land Processes Distributed Active Archive Center [data set], https://doi.org/10.5067/ASTER/ASTGTM.003, 2019.
Nesje, A.: Topographical effects on the equilibrium-line altitude on glaciers, GeoJournal, 27, 383–391, https://doi.org/10.1007/bf00185102, 1992.
Nichols, K. A. and Goehring, B. M.: Isolation of quartz for cosmogenic in situ 14C analysis, Geochronology, 1, 43–52, https://doi.org/10.5194/gchron-1-43-2019, 2019.
Nishiizumi, K., Imamura, M., Caffee, M. W., Southon, J. R., Finkel, R. C., and McAninch, J.: Absolute calibration of 10Be AMS standards, Nucl. Instrum. Methods Phys. Res. B, 258, 403–413, 2007.
Ohmura, A. and Boettcher, M.: Climate on the equilibrium line altitudes of glaciers: theoretical background behind Ahlmann's P/T diagram, J. Glaciol., 64, 489–505, 2018.
Ohmura, A., Kasser, P., and Funk, M.: Climate at the equilibrium line of glaciers, J. Glaciol., 38, 397–411, 1992.
Oien, R. P., Rea, B. R., Spagnolo, M., Barr, I. D., and Bingham, R. G.: Testing the area–altitude balance ratio (AABR) and accumulation–area ratio (AAR) methods of calculating glacier equilibrium-line altitudes, J. Glaciol., 68, 357–368, 2022.
Osmaston, H.: Estimates of glacier equilibrium line altitudes by the AreaxAltitude, the Area×Altitude Balance Ratio and the Area×Altitude Balance Index methods and their validation, Quatern. Int., 138–139, 22–31, 2005.
Pelto, B. M., Menounos, B., and Marshall, S. J.: Multi-year evaluation of airborne geodetic surveys to estimate seasonal mass balance, Columbia and Rocky Mountains, Canada, The Cryosphere, 13, 1709–1727, https://doi.org/10.5194/tc-13-1709-2019, 2019.
Pfeffer, W. T., Tad Pfeffer, W., Arendt, A. A., Bliss, A., Bolch, T., Graham Cogley, J., Gardner, A. S., Hagen, J.-O., Hock, R., Kaser, G., Kienholz, C., Miles, E. S., Moholdt, G., Mölg, N., Paul, F., Radić, V., Rastner, P., Raup, B. H., Rich, J., Sharp, M. J., and The Randolph Consortium: The Randolph Glacier Inventory: a globally complete inventory of glaciers, J. Glaciol., 60, 537–552, https://doi.org/10.3189/2014jog13j176, 2014.
Porter, C., Morin, P., Howat, I., Noh, M.-J., Bates, B., Peterman, K., Keesey, S., Schlenk, M., Gardiner, J., Tomko, K., Willis, M., Kelleher, C., Cloutier, M., Husby, E., Foga, S., Nakamura, H., Platson, M., Wethington, M., Jr, Williamson, C., Bauer, G., Enos, J., Arnold, G., Kramer, W., Becker, P., Doshi, A., D'Souza, C., Cummens, P., Laurier, F., and Bojesen, M.: ArcticDEM, Harvard Dataverse V1 [data set], https://doi.org/10.7910/DVN/OHHUKH, 2018.
Porter, S. C.: Equilibrium-line altitudes of late Quaternary glaciers in the Southern Alps, New Zealand, Quaternary Res., 5, 27–47, https://doi.org/10.1016/0033-5894(75)90047-2, 1975.
Porter, S. C.: Snowline depression in the tropics during the Last Glaciation, Quaternary Sci. Rev., 20, 1067–1091, 2001.
Rounce, D. R., Hock, R., Maussion, F., Hugonnet, R., Kochtitzky, W., Huss, M., Berthier, E., Brinkerhoff, D., Compagno, L., Copland, L., Farinotti, D., Menounos, B., and McNabb, R. W.: Global glacier change in the 21st century: Every increase in temperature matters, Science, 379, 78–83, 2023.
Schaefer, J. M., Denton, G. H., Kaplan, M., Putnam, A., Finkel, R. C., Barrell, D. J. A., Andersen, B. G., Schwartz, R., Mackintosh, A., Chinn, T., and Schlüchter, C.: High-frequency Holocene glacier fluctuations in New Zealand differ from the northern signature, Science, 324, 622–625, 2009.
Seguinot, J., Rogozhina, I., Stroeven, A. P., Margold, M., and Kleman, J.: Numerical simulations of the Cordilleran ice sheet through the last glacial cycle, The Cryosphere, 10, 639–664, https://doi.org/10.5194/tc-10-639-2016, 2016.
Shea, J. M., Marshall, S. J., and Livingston, J. M.: Glacier distributions and climate in the Canadian Rockies, Arct. Antarct. Alp. Res., 36, 272–279, 2004.
Sueyoshi, T., Ohgaito, R., Yamamoto, A., Chikamoto, M. O., Hajima, T., Okajima, H., Yoshimori, M., Abe, M., O'ishi, R., Saito, F., Watanabe, S., Kawamiya, M., and Abe-Ouchi, A.: Set-up of the PMIP3 paleoclimate experiments conducted using an Earth system model, MIROC-ESM, Geosci. Model Dev., 6, 819–836, https://doi.org/10.5194/gmd-6-819-2013, 2013.
Taylor, K. E., Stouffer, R. J., and Meehl, G. A.: An overview of CMIP5 and the experiment design, B. Am. Meteorol. Soc., 93, 485–498, 2012.
Tomkins, J. D., Lamoureux, S. F., and Sauchyn, D. J.: Reconstruction of climate and glacial history based on a comparison of varve and tree-ring records from Mirror Lake, Northwest Territories, Canada, Quaternary Sci. Rev., 27, 1426–1441, 2008.
Tomkins, M. D., Dortch, J. M., Hughes, P. D., Huck, J. J., Pallàs, R., Rodés, Á., Allard, J. L., Stimson, A. G., Bourlès, D., Rinterknecht, V., Jomelli, V., Rodríguez-Rodríguez, L., Copons, R., Barr, I. D., Darvill, C. M., and Bishop, T.: Moraine crest or slope: An analysis of the effects of boulder position on cosmogenic exposure age, Earth Planet. Sc. Lett., 570, 117092, https://doi.org/10.1016/j.epsl.2021.117092, 2021.
Yukimoto, S., Kawai, H., Koshiro, T., Oshima, N., Yoshida, K., Urakawa, S., Tsujino, H., Deushi, M., Tanaka, T., Hosaka, M., Yabu, S., Yoshimura, H., Shindo, E., Mizuta, R., Obata, A., Adachi, Y., and Ishii, M.: The Meteorological Research Institute Earth System Model Version 2.0, MRI-ESM2.0: Description and basic evaluation of the physical component, J. Meteorol. Soc. Jpn. Ser. II, 97, 931–965, 2019.
Zemp, M., Nussbaumer, S. U., Gärtner-Roer, I., Bannwart, J., Paul, F., and Hoelzle, M.: Global Glacier Change Bulletin No. 4 (2018–2019), ISC(WDS)/IUGG(IACS)/UNEP/UNESCO/WMO, World Glacier Monitoring Service, 278 pp., https://doi.org/10.5904/wgms-fog-2021-05, 2021.