the Creative Commons Attribution 4.0 License.
the Creative Commons Attribution 4.0 License.
 | 05 Oct 2023
Stratigraphic noise and its potential drivers across the plateau of Dronning Maud Land, East Antarctica
Alexandra Zuhr
Thomas Münch
Maria Hörhold
Johannes Freitag
Remi Dallmayr
Thomas Laepple
Stable water isotopologues of snow, firn and ice cores provide valuable information on past climate variations. Yet single profiles are generally not suitable for robust climate reconstructions. Stratigraphic noise, introduced by the irregular deposition, wind-driven erosion and redistribution of snow, impacts the utility of high-resolution isotope records, especially in low-accumulation areas. However, it is currently unknown how stratigraphic noise differs across the East Antarctic Plateau and how it is affected by local environmental conditions. Here, we assess the amount and structure of stratigraphic noise at seven sites along a 120 km transect on the plateau of Dronning Maud Land, East Antarctica. Replicated oxygen isotope records of 1 m length were used to estimate signal-to-noise ratios as a measure of stratigraphic noise at sites characterised by different accumulation rates (43–64 mm w.e. a−1), snow surface roughnesses and slope inclinations. While we found a high level of stratigraphic noise at all sites, there was also considerable variation between sites. At sastrugi-dominated sites, greater stratigraphic noise coincided with stronger surface roughnesses, steeper slopes and lower accumulation rates, probably related to increased wind speeds. These results provide a first step to modelling stratigraphic noise and might guide site selection and sampling strategies for future expeditions to improve high-resolution climate reconstructions from low-accumulation regions.
- Article
(4176 KB) - Full-text XML
- BibTeX
- EndNote


The East Antarctic ice sheet is a valuable climate archive. Stable water isotopologues in snow, firn and ice core records store information on past temperature variations (e.g. Jouzel and Masson-Delmotte, 2010; Dansgaard, 1964), especially on past glacial and interglacial periods (EPICA community members, 2004, 2006). However, the interpretation of isotope records at subannual to decadal resolutions is hampered by significant uncertainties (e.g. Casado et al., 2020; Laepple et al., 2018; Münch and Laepple, 2018) which limit the usability of this archive to quantify recent global warming impacts on the Antarctic Plateau (Stenni et al., 2017; Jones et al., 2016). Several processes, such as precipitation intermittency (Laepple et al., 2011; Helsen et al., 2005), water vapour exchange and sublimation (e.g. Wahl et al., 2021; Town et al., 2008), induce noise in the isotopic temperature imprint in snow, firn and ice cores. Additionally, accumulation does not occur as perfectly stratified layers but is affected by irregular depositions as well as wind-driven erosion and redistribution (Zuhr et al., 2021; Picard et al., 2019). These processes introduce a non-climatic variability into the isotope profiles, known as stratigraphic noise (Fisher et al., 1985), which reduces the usability of single isotope profiles for climate reconstructions (e.g. Münch et al., 2016a). Isotopic diffusion in snow and firn furthermore smoothes the overall isotopic variations, leading to a loss of high-frequency variations (e.g. Laepple et al., 2018; van der Wel et al., 2015; Johnsen et al., 2000).
While atmospheric circulation, temperature and precipitation intermittency introduce variations in the isotopic compositions on scales of hundreds of kilometres (Goursaud et al., 2018; Münch and Laepple, 2018), stratigraphic noise has been defined as the uncorrelated part between two or more isotope profiles at local scales (Fisher et al., 1985). Münch et al. (2016a) found the decorrelation length of stratigraphic noise to be around 5 to 10 m on the plateau of Dronning Maud Land (DML), which means that the stratigraphic noise in one snow core is independent of the noise of an adjacent profile at a distance of more than 5–10 m.
Stratigraphic noise hampers the extraction and interpretation of climate signals, especially on subannual to decadal scales where accumulation rates are low (e.g. Jones et al., 2014; Karlöf et al., 2006; McMorrow et al., 2002; Sommer et al., 2000). For instance, with accumulation rates of 240–600 mm w.e. a−1 in Greenland, it is possible to extract seasonal and annual signals from the isotopic imprints in firn cores (Vinther et al., 2010). However, in DML, with low accumulation rates of 40 to 90 mm w.e. a−1 (Oerter et al., 2000), seasonal snow layers can be completely eroded (Helsen et al., 2005). Accordingly, discrepancies between isotope profiles and observed temperatures are smaller in coastal areas of East Antarctica compared to the drier inland plateau of DML (Helsen et al., 2005). This is further evidenced by the signal-to-noise ratios (SNRs), which measure the ratio of the common (spatially coherent) isotopic signal over the independent stratigraphic noise: while Fisher et al. (1985) found SNRs between 1.1 and 2.7 (at 140–520 mm w.e. a−1) for annually resolved ice core records from Greenland, Graf et al. (2002) obtained a SNR of only 0.14 on the plateau of DML.
Although several studies have identified stratigraphic noise as a crucial limiting factor for high-resolution ice core signal interpretation, it remains unknown how stratigraphic noise differs spatially, e.g. across the East Antarctic Plateau (EAP), and how it is related to local environmental properties like the accumulation rate, slope inclination and surface roughness. Knowledge of such relationships would allow us to optimise the selection of sampling sites for extracting snow and firn cores for the purpose of high-resolution climate reconstructions. Less stratigraphic noise from optimal sites would enhance the effective resolution at which a climate signal can be extracted (Casado et al., 2018). Furthermore, this knowledge would enable stratigraphic noise to be simulated in proxy system models (Casado et al., 2018; Dolman and Laepple, 2018; Dee et al., 2015). An improved quantitative understanding would also result in more accurate estimates of past climate variability as it would allow us to correct for stratigraphic noise within the spectral domain (e.g. Münch and Laepple, 2018; Laepple et al., 2017). It might further enable the use of replicate cores as a proxy for past surface roughnesses and related wind speeds (Barnes et al., 2006).
In this study, we use SNRs to quantify stratigraphic noise in high-resolution isotope records collected from seven sites in DML (EAP). We relate differences in stratigraphic noise to varying local environmental properties such as slope inclination, surface roughness and the accumulation rate in order to identify potential underlying environmental drivers.
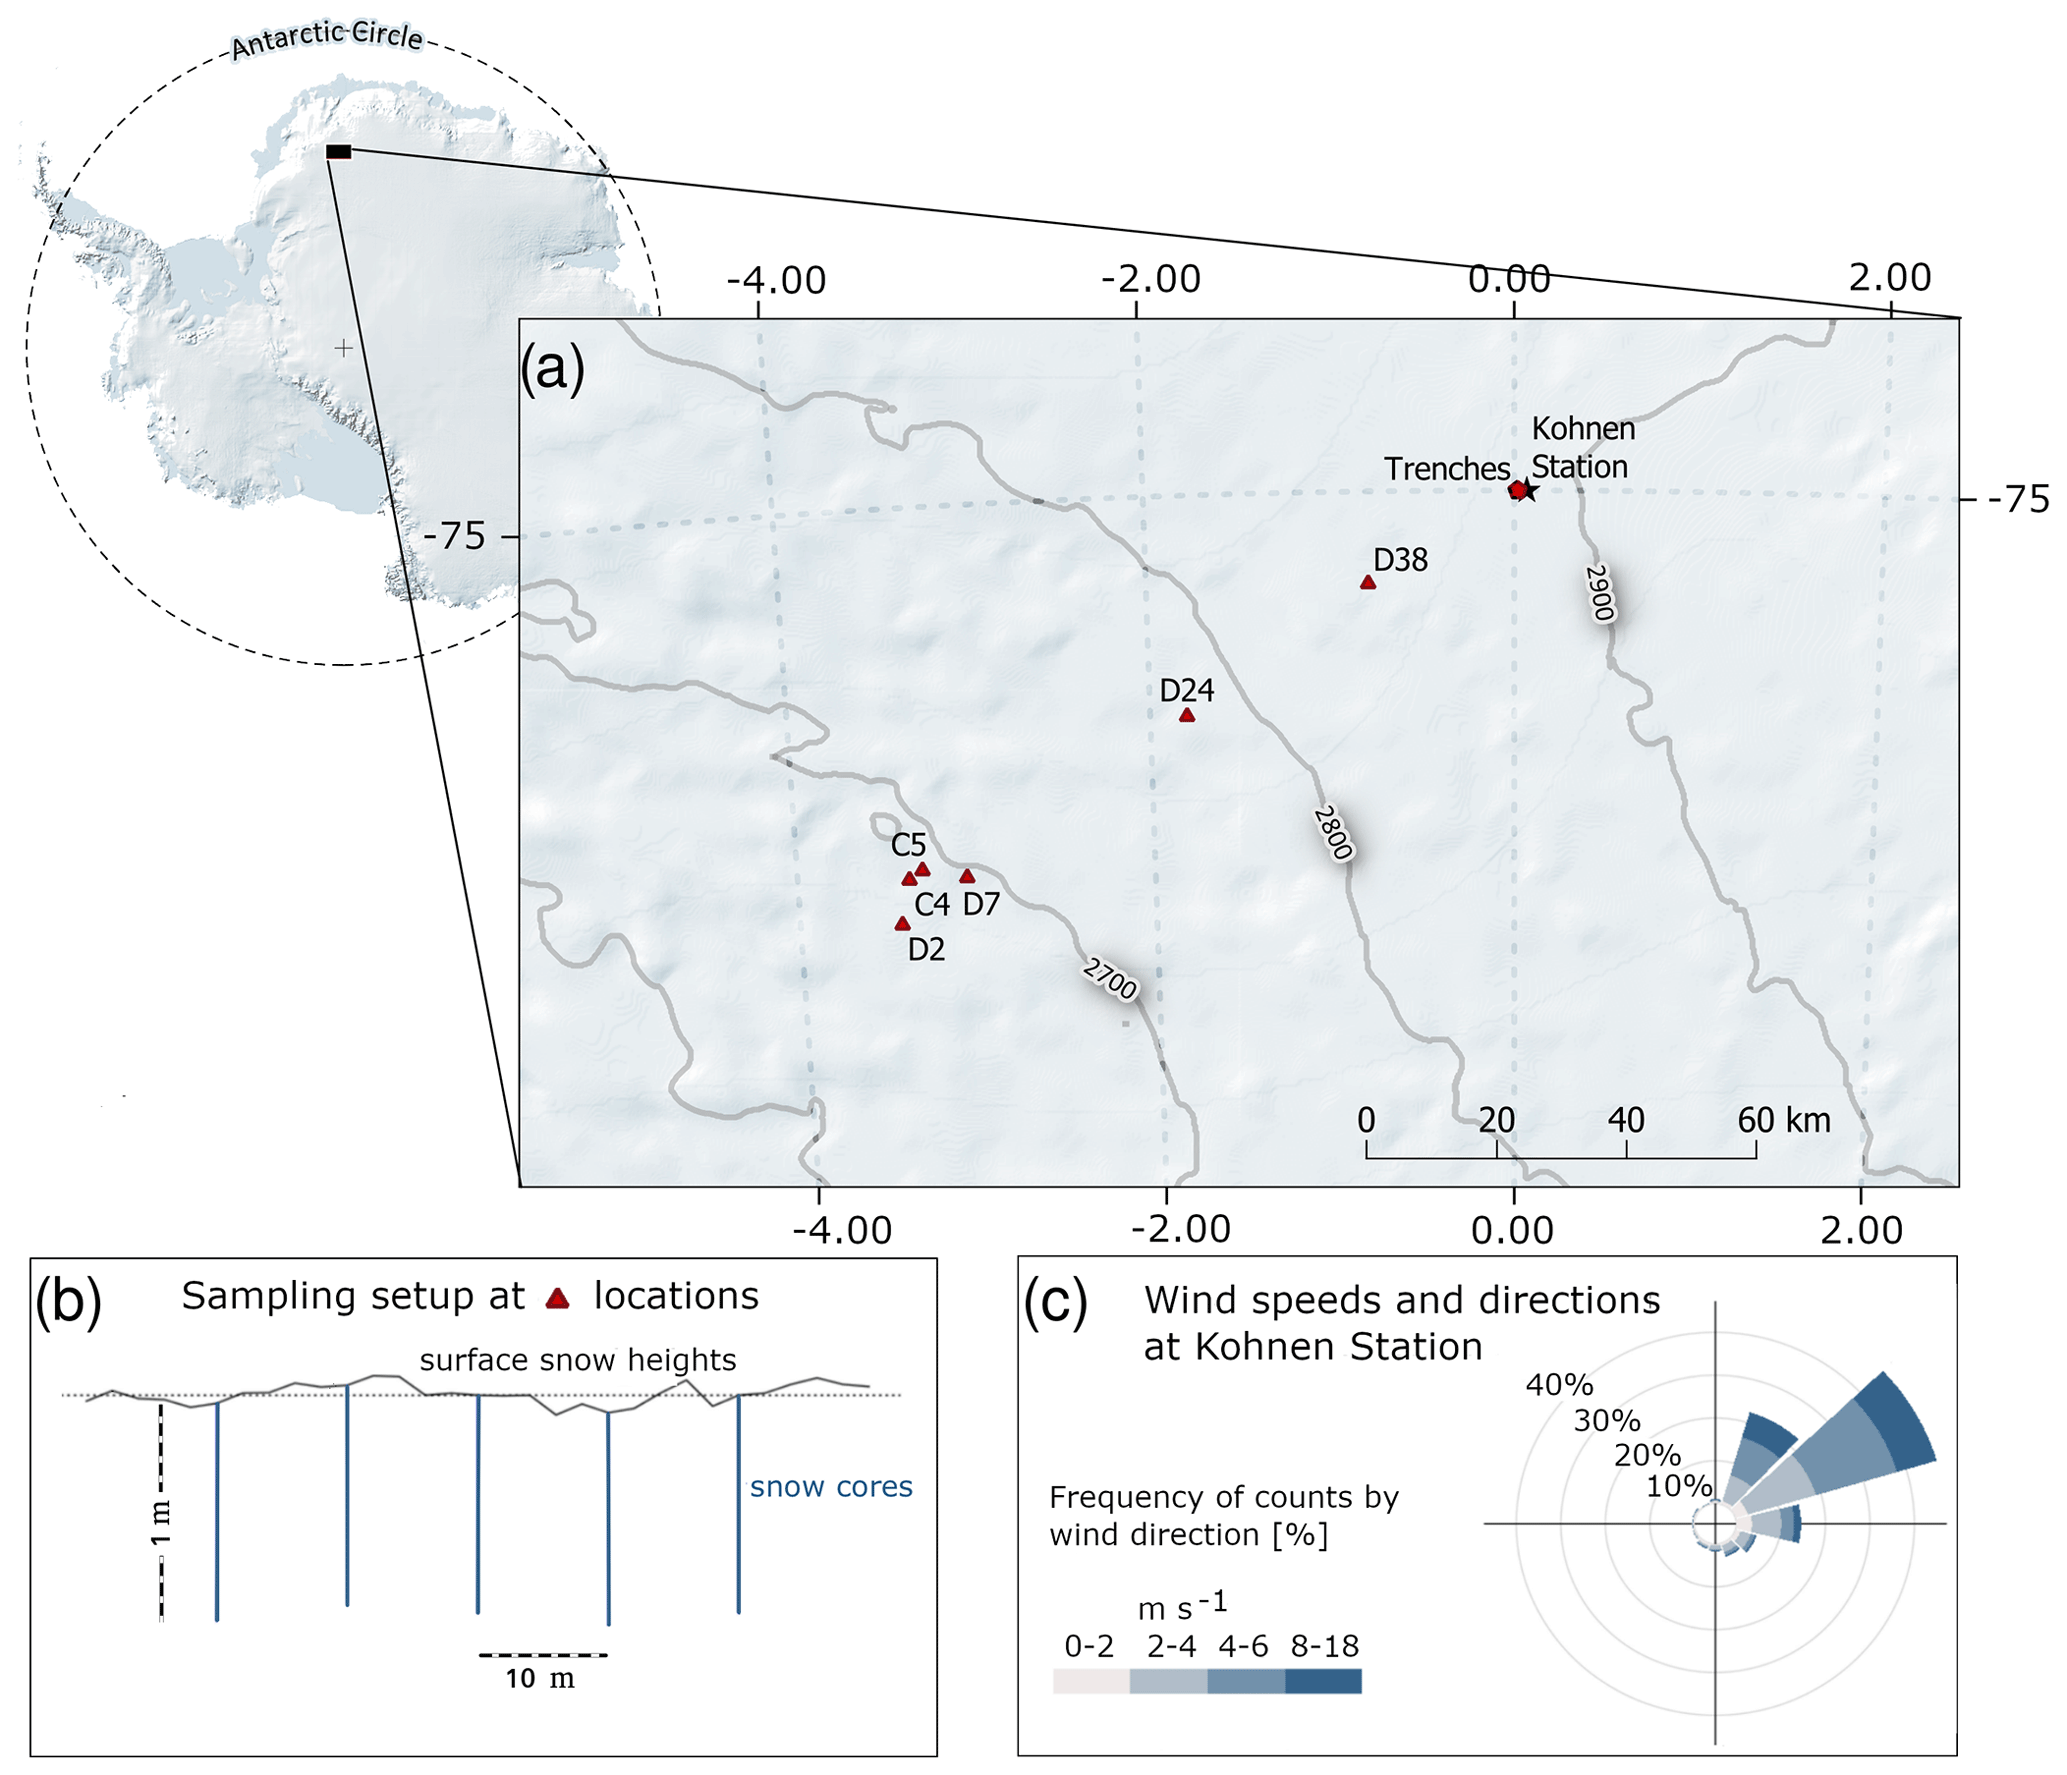
Figure 1(a) Study area on the plateau of Dronning Maud Land (DML), East Antarctica, with sampling sites D2, C4, C5, D7, D24 and D38 (red triangles) and Kohnen trenches (red circle) (Münch et al., 2016a, 2017). Shading represents the surface elevation above sea level (RAMP2; Liu et al., 2015). (b) Example schematic illustrating the collection of replicate snow cores at each sampling site. (c) Wind speeds and direction at Kohnen Station from the local automatic weather station (AWS 9, 2012–2018; Reijmer and van den Broeke, 2003).
2.1 Study area
The sampling sites are situated on the EAP along a 120 km transect that rises gently from 2685 to 2892 m a.s.l. near Kohnen Station (75.002∘ S, 0.007∘ W; 2892 m a.s.l.; Wesche et al., 2016) (Fig. 1a). Between 2012 and 2018, the annual mean temperature at Kohnen Station was −40.9 ∘C and the annual mean wind speed was 4.31 m s−1 (from an automatic weather station, AWS 9; Reijmer and van den Broeke, 2003). The region is characterised by katabatic winds consistently blowing downslope (e.g. Broeke and Lipzig, 2003; Parish and Cassano, 2003) from north-easterly directions (Fig. 1c), with wind speeds in excess of 10 m s−1 occurring about 10–20 times per year (Birnbaum et al., 2010; Reijmer and van den Broeke, 2003). Only a few precipitation events, introduced by low-pressure systems, bring most of the annual precipitation amount (Schlosser et al., 2010; Reijmer and van den Broeke, 2003; Noone et al., 1999). Average accumulation rates over the past 200 years have been ∼60 mm w.e. (Oerter et al., 2000), possibly with a considerable increase during the last century (Medley and Thomas, 2019). The snow surface around Kohnen Station is mainly comprised of small dunes and sastrugi with horizontal scales of the order of a few metres (Birnbaum et al., 2010).
2.2 Snow core sampling
A set of snow profiles was sampled in December 2018 at six sites along a ∼120 km transect south-west of Kohnen Station (Fig. 1a). At each of these sampling sites (D2, C4, C5, D7, D24 and D38) six 1 m snow cores were extracted along a line running perpendicularly to the dominant large-scale wind direction with a 10 m interprofile spacing – five of them were further processed and used in this study (Fig. 1b). The direction was chosen to allow a comparison with Kohnen trench studies (Münch et al., 2016a, 2017). As the snow dunes in the study region are predominantly parallel to the wind direction, measuring perpendicularly to the wind ensures better sampling of the dunes along the 60 m overall distance. Each snow profile was extracted by vertically inserting a 1 m carbon fibre pipe into the sidewall of a snow pit. The collected snow profiles were cut horizontally into slices of 1.1 cm (for the upper 16.5 cm) and 3.3 cm (for the lower part), accounting for the diffusion length of ∼3 cm at 1 m depth (Laepple et al., 2018). Compression or expansion during handling, transport and cutting of the snow cores resulted in a maximum depth uncertainty of 2 cm and slight variations in the number of samples per profile (41–43). Combined with the maximum uncertainty of 1 cm resulting from the snow height measurements (Sect. 2.6), the absolute depth values have a combined maximum uncertainty of 3 cm. All snow samples (N=1249) were packed in plastic bags and transported in frozen state to Germany for further analysis.
2.3 Stable water isotope measurements
The stable water isotopic composition (δ18O, δD) of the snow samples was measured using a cavity ring-down spectroscopy instrument of Picarro, Inc. (model L2140-i) in the Laboratory for Stable Isotopes at the Alfred-Wegener-Institut in Potsdam, Germany. Post-run corrections were applied as described in Münch et al. (2016a). Scaling to the VSMOW–SLAP (Vienna Standard Mean Ocean Water–Standard Light Antarctic Precipitation) scale results in the δ notation which describes the ratio of heavy to light isotopes in per mille (‰). In-house standards were used for quality control. The mean combined measurement uncertainty is 0.07 ‰ for δ18O and 0.5 ‰ for δD (root-mean-square deviation, RMSD). In the following we focus on the δ18O values.
2.4 Trench isotope subset
To complement the datasets from the six sites along the transect, we use already published δ18O profiles from Kohnen Station (Fig. 1a) derived in the years 2012/13 and 2014/15 by Münch et al. (2016a, b, 2017). Four snow trenches (Kohnen trenches) were excavated by a snow blower perpendicularly to the local snow dune direction. Snow profile samples were collected off the trench walls, resulting in snow profiles of high vertical as well as horizontal resolution (Table 1). For the comparison of the trench data with the new dataset, we divided the trench data into 10 subgroups, each composed of four to five 1 m deep δ18O profiles at distances of 10±1 m from one another (Table 1).
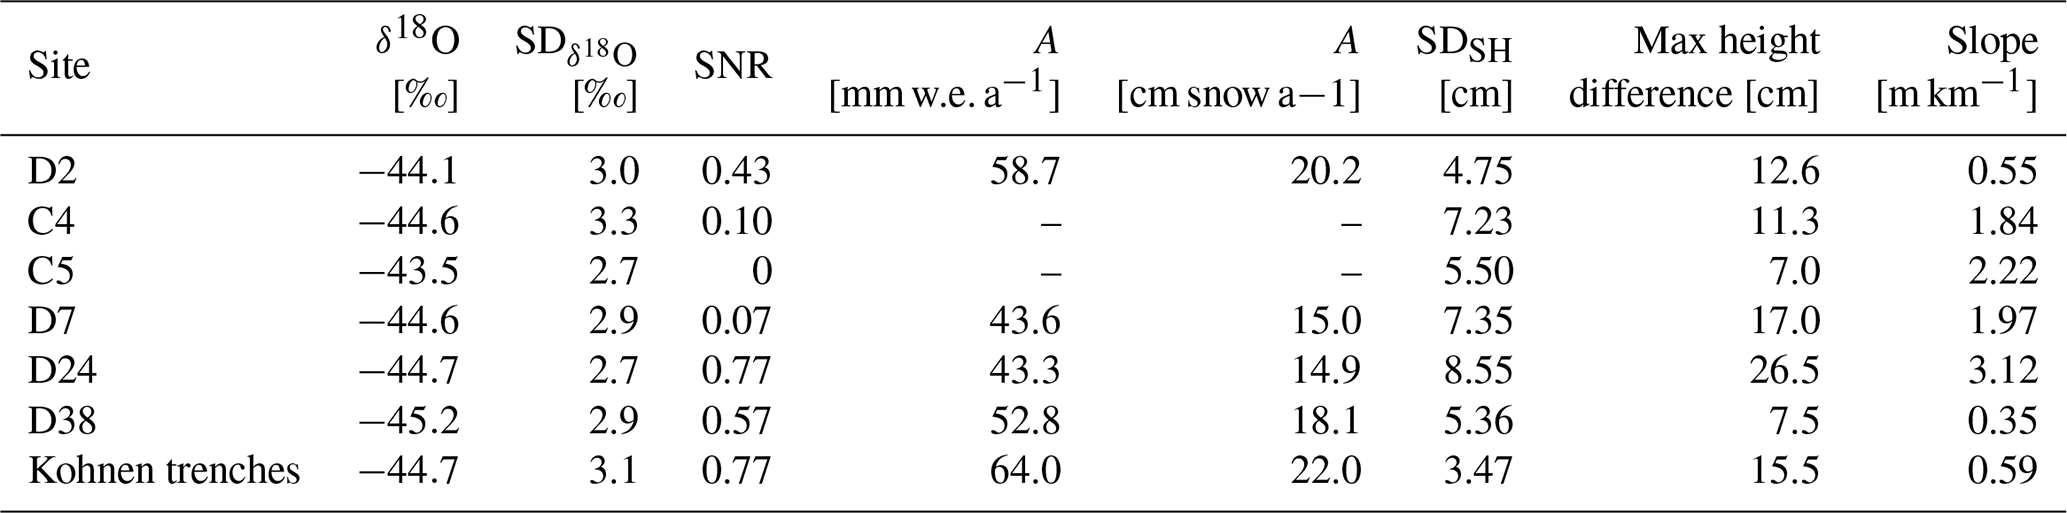
Table 1Summary of the datasets which are used within this study. Subgroups of the Kohnen trenches, described in Sect. 2.4, are used to compare the resulting signal-to-noise ratios (SNRs) to the ones of locations D2, C4, C5, D7, D24 and D38.
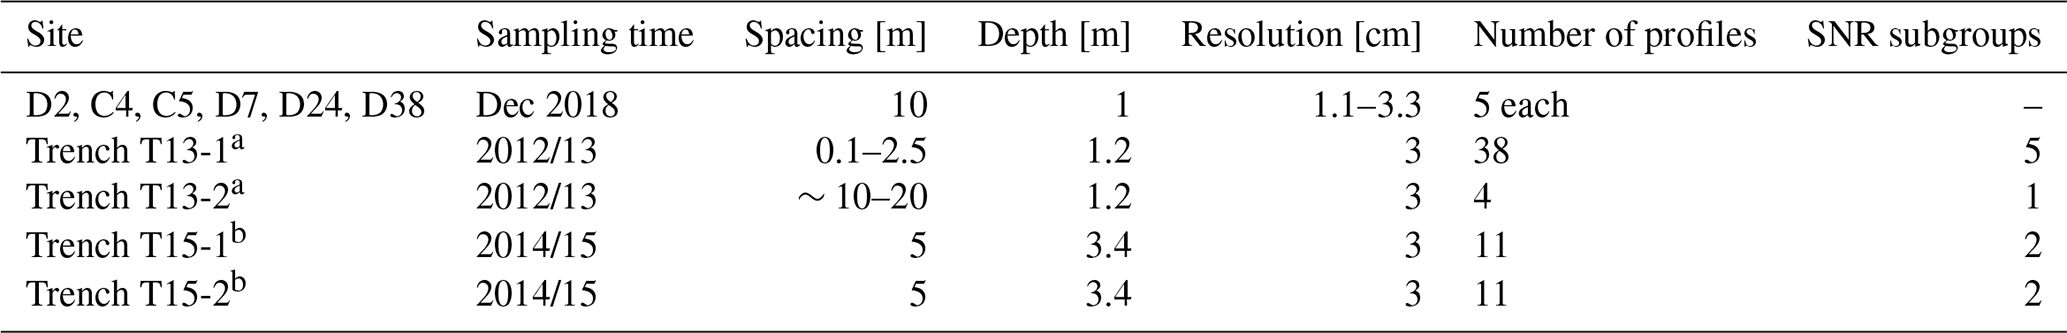
a Münch et al. (2016a). b Münch et al. (2017).
2.5 Definition and quantification of stratigraphic noise
The variations that are independent between adjacent isotope records are considered to be noise, while the signal is the isotope variations that those records have in common. The ratio of the common (signal variance) to the independent (noise variance) portion in the given data is the signal-to-noise ratio (SNR). This ratio can be derived based on the pairwise correlation coefficient, rXY, between two isotope profiles X and Y, with
(Fisher et al., 1985). In the absence of any noise, we would expect rXY=1, i.e. a perfectly stratified isotopic imprint. As the amount of stratigraphic noise increases, the pairwise correlations and hence the SNRs will decrease. The SNR thus provides a quantitative measure to objectively determine the proportion of stratigraphic noise in adjacent (intrasite) isotope records and to make intersite comparisons. At each sampling site, SNRs were estimated based on the mean pairwise correlation coefficient (n=10) between the five δ18O profiles (linearly interpolated to a 0.1 mm resolution) with respect to their absolute height reference (Appendix A). The SNR of the Kohnen trenches was determined from the mean of all pairwise correlations of all records of all subgroups (n=95). Due to statistical uncertainty, SNR estimates can be negative; as this has no physical meaning, SNR estimates <0 are set to 0. We assess the uncertainty in the SNR estimates by employing a bootstrap resampling procedure: we resample the pairwise correlation coefficients with replacement, calculate the SNR from the resamples and derive the confidence intervals from the distribution of the SNRs.
2.6 Environmental properties
We compare the amount of stratigraphic noise in the isotope records to the local slope inclination, accumulation rate and surface roughness.
Slope inclinations are hereby defined as the local inclination of 10 km long segments along the transect (azimuth of ∼57.1∘). They were derived using 200 m resolution data from the REMA digital elevation model (DEM; Howat et al., 2019) and vary between 0.3 and 3.1 m km−1. To assess the uncertainty in these estimates, we calculate the slope inclinations over 10 km segments with the same azimuth across 36 different points located at 200, 400 and 600 m around each study site (12 different directions in steps of 30∘) and extract the SD of these slope inclinations.
We use the average accumulation rates over the last 200 years as determined by Rotschky et al. (2004) for the same transect using ice-penetrating radar. For sites D2, D7, D24 and D38, they vary between ∼43 and ∼59 mm w.e. a−1 and are thus lower than the ∼ 64 mm w.e. a−1 at Kohnen Station (EPICA community members, 2006). To get an estimate for the uncertainty in these values, we use the accumulation records over the last 200 years from the B32 DML05 ice core at Kohnen Station (Oerter et al., 2000). We calculate the SD of the 5-year-block-averaged record, since 5 years roughly represents the accumulation period of the new snow cores. For each site, we scale the SD to the local mean accumulation rate.
Snow heights were measured with a 2 m horizontal resolution and a height accuracy of ±1 cm along the line of the five snow cores at each site (60 m length; see Fig. 1b) using a geodetic levelling device. Surface roughness is defined by the standard deviation of these surface heights, SDSH. Further, we resample the height values from each site 1000 times with replacement, estimate the surface roughness from the resamples and use the SD of these surface roughness values as a measure of uncertainty. To assess past snow surface heights and roughnesses, common isotopic extremes, i.e. isochrones, were manually traced wherever possible.
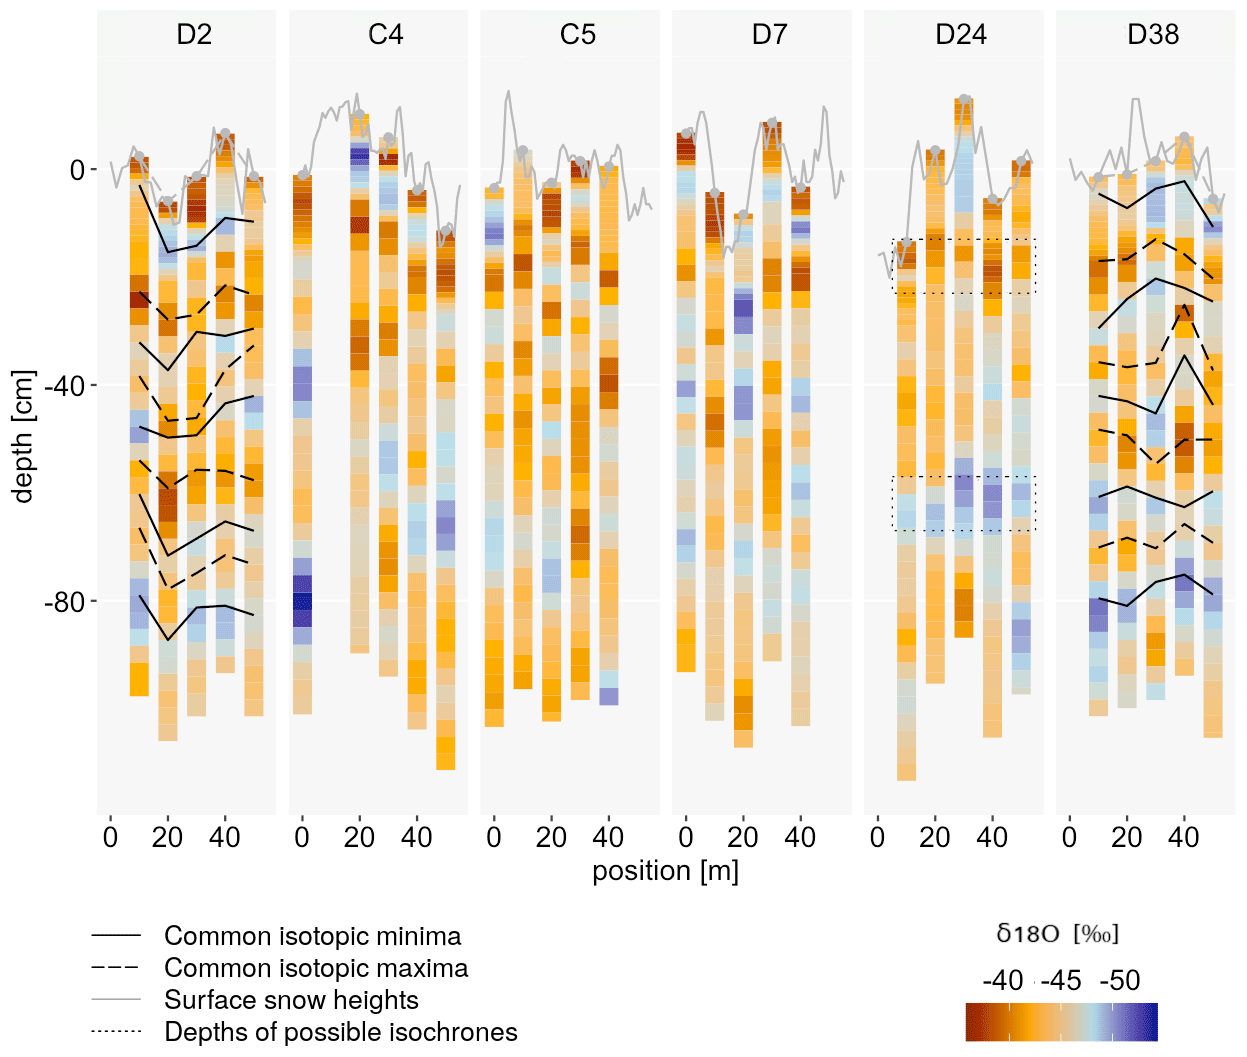
Figure 2δ18O profiles at each of the new sampling sites plotted against snow depth. The colour scale indicates the δ18O values. Black lines trace possible common isotope minima (solid lines) and maxima (dashed lines), wherever it was possible to identify common peaks (sites D2 and D38). Grey lines indicate the surface topography at 2 m (solid line) and 10 m (dashed line) horizontal resolutions. The dashed black boxes at site D24 indicate the depths of similar isotopic peaks, even if consecutive isochrones could not be assigned.
3.1 δ18O profiles
Mean δ18O values at the sampling sites range from −43.9 ‰ to −44.3 ‰ (Table 2, Fig. 2) with no significant differences between sites (two-sided Student t test; p>0.05). The mean vertical variance within the arrays of the isotope profiles is σ2=8.9 ‰2 (SD 2.9 ‰) and thus slightly higher than the mean horizontal variance of σ2=7.5 ‰2 (SD 5.5 ‰). Between four and nine local δ18O maxima were observed in the isotope profiles with a mean peak-to-peak amplitude of 5.0 ‰ (SD 3.0 ‰).
3.2 Recent and past snow surfaces and surface roughnesses
The surface roughness SDSH varies between 3.5 cm (Kohnen trenches) and 8.6 cm (D24) (Table 2). The variations at the Kohnen trench site are significantly smaller compared to the other sites (two-sided F test, p<0.05). Sites D24, D7 and C4 and sites D2, C5 and D38 form two distinct clusters, with no significant intracluster differences in surface roughness but significant intercluster variations.
At two sites (D2 and D38), it was possible to tentatively trace past snow surface variations by manually tracking local isotope extremes, i.e. isochrones (Fig. 2). This was also done, with a higher degree of confidence, at one of the Kohnen trenches (T13-1; Table 1) by Münch et al. (2016a). In contrast, here the assignment of common peaks was more ambiguous and uncertain at site D38 and particularly at D2, where one to two cycles might have been missed in the top 25 cm.
At all three sites (D38, D2 and Kohnen), the isochrones (horizontal black lines in Fig. 2) exhibit a similar degree of roughness (SDpast) to the snow surface (dashed grey lines in Fig. 2) with SDsurface=3 cm and SDpast=3.7 cm at the Kohnen trenches (Münch et al., 2016a), SDsurface=3.7 cm and SDpast=3.5 cm at D2, and SDsurface=4 cm and SDpast=3.4 cm at D38. At site D2, the correlation between the isochrone profiles and the local surface heights (dashed grey line, Fig. 2) ranges from 0.47 to 0.87, which suggests that the topography might have been preserved over the years. At site D38, the same test results in correlation coefficients between −0.79 and 0.90, indicating an annual reorganisation of the stratigraphy, which is consistent with earlier findings at the Kohnen trenches (Münch et al., 2016a).
At site D24, strong isotopic anomalies were found at depths of about −20 and −60 cm. Depending on the exact choice when tracing these isochrones, the resulting SDpast varies between 1 and 2.8 cm, which differs significantly from the SDsurface of 10 cm. However, as for sites C4, C5 and D7, consecutive δ18O isochrones at D24 could not be traced with sufficient confidence due to strong irregularities in the isotopic cycles.
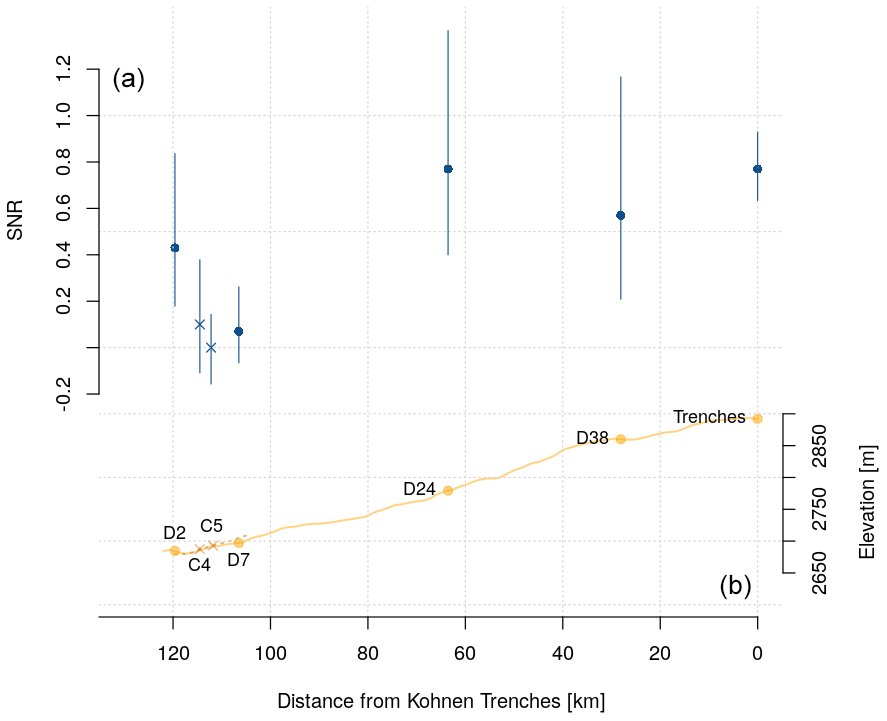
Figure 3Signal-to-noise ratio (SNR, blue circles and crosses) with 95 % confidence intervals (blue lines) at the different sampling sites (a) together with the positions of the sites along the transect and (b) with elevations from the RAMP2 DEM (yellow line; Liu et al., 2015). The elevation data at C4 and C5 (crosses) were collected along a transect that was slightly (∼7 km) offset to the north (dashed line).
3.3 Signal-to-noise ratios
SNRs range from 0 (C5) to 0.77 (Kohnen trenches and D24) (Fig. 3 and Table 2). The statistical uncertainty in SNR estimates is lower at sites with low SNRs (C4, C5, D7) as well as at the Kohnen trenches. For the latter, this is due to the larger number of available δ18O profiles. The highest uncertainty was estimated for sites D38 and D24. Considering these uncertainties, the SNR at the Kohnen trenches is significantly higher (p<0.05) compared to C4, C5 and D7. Furthermore, the SNR at D24 is significantly higher than at C5 and D7, while the SNR at D2 is significantly higher than at C5.
Table 2Statistical properties of the δ18O data and environmental parameters for all sampling sites. Listed are the mean and standard deviation of the isotope values, signal-to-noise ratios (SNRs), mean accumulation rates (A) derived from ground-penetrating radar (Rotschky et al., 2004) in water-equivalent [mm w.e. a−1] and snow-equivalent [cm snow a−1] units, surface roughness (SDSH [cm]), the maximum height difference between two adjacent snow cores [cm], and slope inclinations [m km−1]. For converting accumulation rates from water equivalent to snow equivalent, we assumed a snow density of 344 kg m−3, which is the overall arithmetic mean of all sites (n=19).
We found strong variations in the amount of stratigraphic noise between the seven sites on the 120 km transect. The sites are also characterised by varying snow surface features, slope inclinations, accumulation rates and surface roughnesses. In this section, we discuss the observed differences and possible relationships and conclude with recommendations for future studies.
4.1 Isotope profiles and snow height evolution related to sastrugi and glazed surfaces
In shallow isotope profiles, which are not yet superimposed by diffusion (Laepple et al., 2018), δ18O minima represent snow that fell at colder atmospheric temperatures, i.e. in austral winter, while the maxima represent warmer temperatures from summer (e.g. Stenni et al., 2016; Dansgaard, 1964). Common isotopic peaks are therefore assumed to represent snow which accumulated during the same season or even the same accumulation event. Within these estimated isochrones, the isotope values between the snow cores show some variations. Isotope values within isochrones at locations D2 and D38 have a mean SD of 1.6 ‰. Such variations can be expected within the same season (e.g. summer or winter). They also result from isotopic diffusion, as the thickness of a snow layer with a certain isotopic value will affect how much the amplitude is reduced.
Based on the accumulation rate estimates (Rotschky et al., 2004), we expect the 1 m profiles to have accumulated within ∼4.5 to ∼6.7 years and to exhibit an equal number of isotopic maxima and minima if from the same site. However, the absolute count of isotopic peaks varied considerably, also between adjacent profiles. Furthermore, the isotope profiles exhibited strongly varying cycle lengths and amplitudes, which made it difficult to assign common isotopic peaks and which suggests a considerable redistribution and irregular accumulation. This is further confirmed by the analysis of the evolution of snow heights at D2 and D38. Particularly at D38, a refilling of troughs combined with a lower accumulation in elevated parts shows typical processes of snow deposition (Zuhr et al., 2021). At D2, D38 and the Kohnen trenches, the surface snow heights (solid grey lines in Fig. 2) show similar variations to past snow heights, indicating similar surface roughnesses over time. Furthermore, these variations indicate the presence of pronounced snow features such as dunes (Fig. 4a) (Birnbaum et al., 2010).
The highest surface roughness was observed at site D24, where isotopic peaks were too variable to assign consecutive isochrones. Still, similar isotopic values indicate a very low surface roughness at depths of around −20 and −60 cm. These nearly flat past surfaces are consistent with present snow surface features observed around the site, namely glazed surfaces between patches of large sastrugi and dunes (Fig. 4b). Glazed surfaces are characterised by flat and very dense snow, permeated by “thermal” cracks (Fig. 4c) (Furukawa et al., 1996). Glazed surfaces were found to occur when high wind speeds coincide with a hiatus in accumulation, e.g. on the steep slopes in the katabatic wind region (Scambos et al., 2012; Furukawa et al., 1996), and could already be detected via satellite images within ∼200 km to the south, south-east and north-west of the transect (Rotschky et al., 2006).
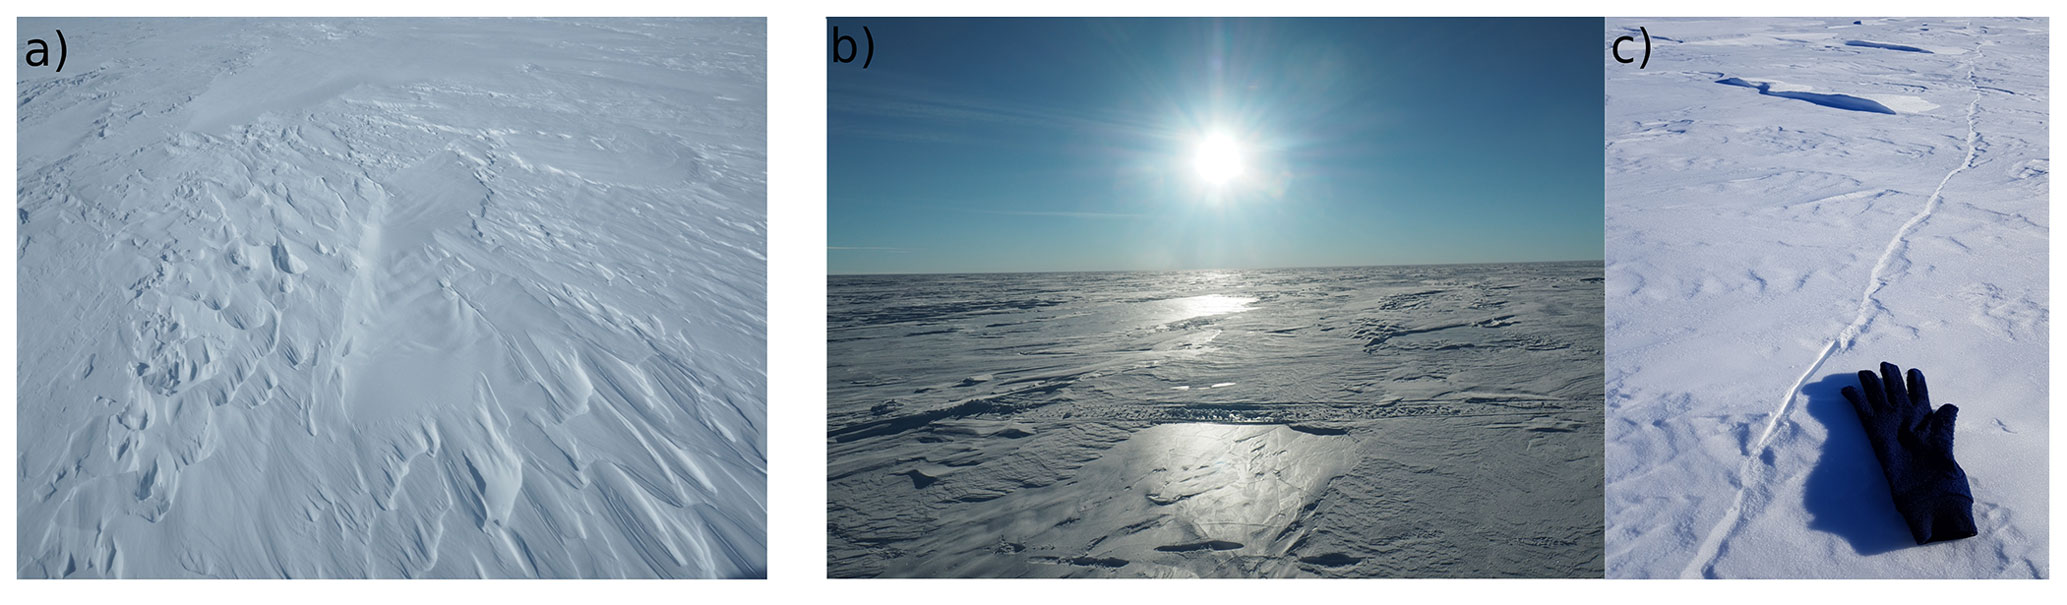
Figure 4The snow surface at site C4 in panel (a), showing the typical sastrugi, and at site D24 in panels (b) and (c), showing a mix of sastrugi and glazed surfaces and a thermal crack with a glove placed next to it for scale.
4.2 Amount and structure of stratigraphic noise
For the newly collected isotope profiles, the low mean pairwise correlation coefficient of r=0.19 (SD 0.31) indicates strong stratigraphic redistribution and irregular deposition. The pairwise correlations were independent of the spatial distance between profiles (Appendix B), which confirms that the decorrelation length of stratigraphic noise in the study area is <10 m, as proposed by Münch et al. (2016a) for Kohnen Station. The SNRs of <1 indicate that stratigraphic noise explains more than 50 % of the δ18O variability in the uppermost 1 m at all sites, which is consistent with previous findings for this region and confirms the low representativity of single isotope profiles (Münch et al., 2016a, 2017; Graf et al., 2002). Along the 120 km transect, SNRs varied strongly between 0 and 0.77, which emphasises the importance of understanding their drivers.
4.3 Relationships between stratigraphic noise and environmental properties
Despite the low number of data points, the strong variations between sites allow us to formulate some hypothesis regarding the origin of stratigraphic noise. For this aim, we compare the SNRs with the local environmental characteristics, namely accumulation rates, slope inclination and surface roughnesses (Fig. 5). We exclude spatial variations in precipitation or isotopic amplitudes as factors potentially affecting SNRs (Fisher et al., 1985) as we do not expect these features to differ strongly across the spatial scale considered here (Goursaud et al., 2018; Münch and Laepple, 2018).
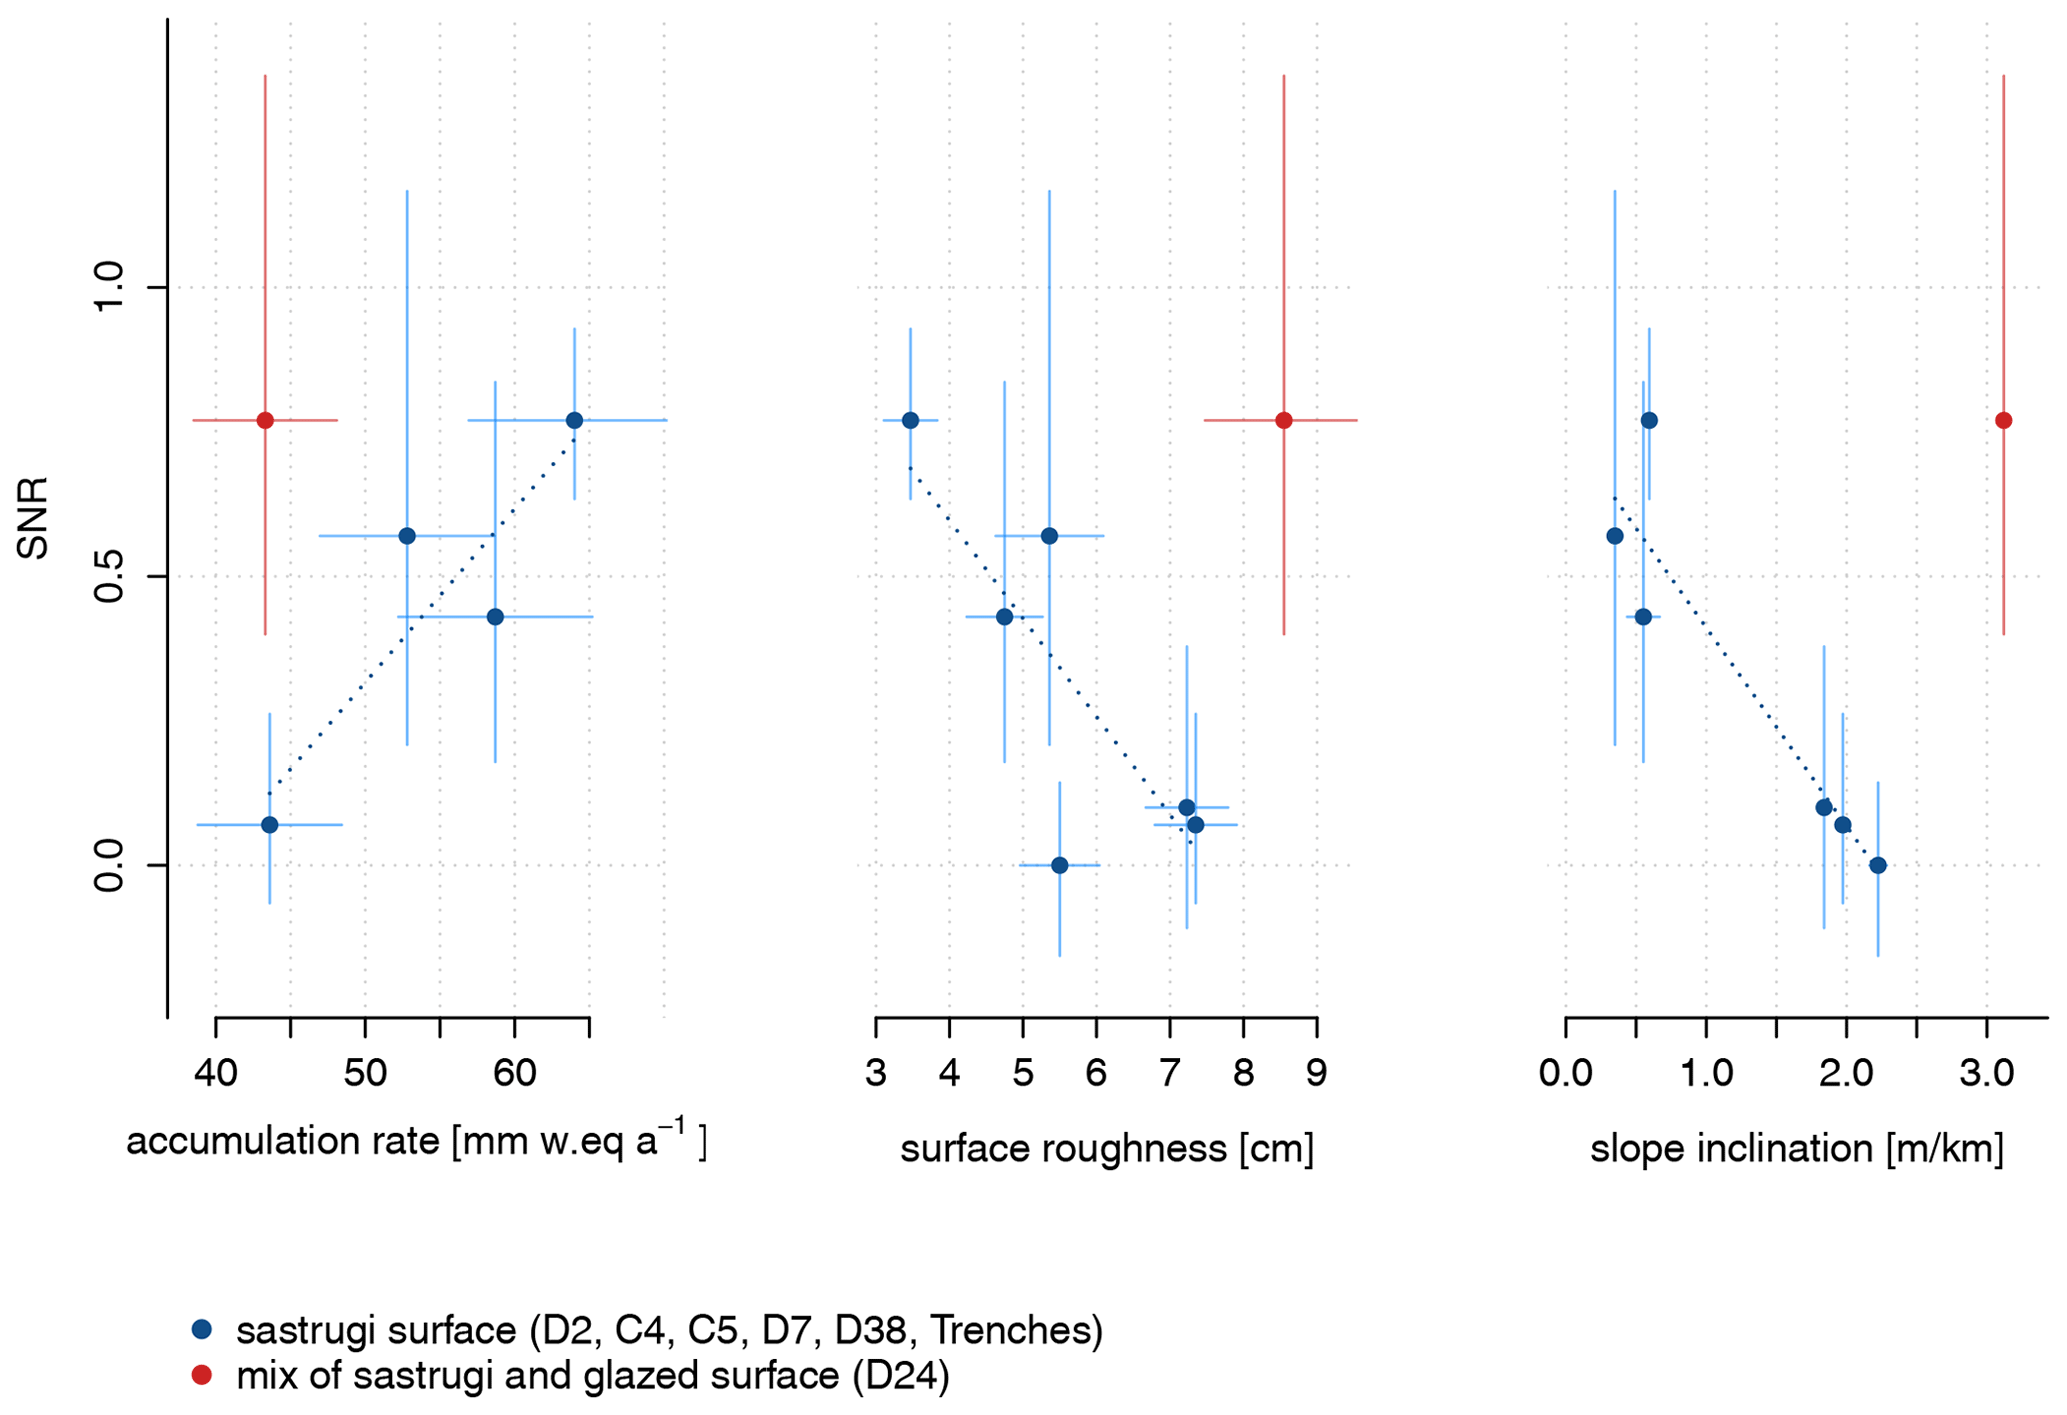
Figure 5Scatter plots of signal-to-noise ratios (SNRs) against accumulation rate A [mm w.e. a−1], surface roughness SDSH [cm] and slope inclination [m km−1]. Most sites were dominated by sastrugi, while at D24 (red dots), we observed a mix of sastrugi and glazed surfaces. The latter was therefore excluded in the linear regression analysis (dashed lines). Vertical lines indicate the 95 % confidence intervals of the SNR estimates, while horizontal lines represent the uncertainty in the environmental properties (2 ⋅ SD). Uncertainties in 10 km slope inclinations are very small such that they are not visible for most sites.
At the sites dominated by sastrugi (all except D24; see blue points, Fig. 5), SNRs show a strong positive correlation with accumulation rates (r=0.89, p=0.11) and strong negative correlations with surface roughnesses (, p=0.05) and slope inclinations (, p<0.05). This is consistent with earlier findings which showed that isotope records at coastal sites in East Antarctica with higher accumulation rates contain a more consistent climate signal than those at lower-accumulation sites in DML (Helsen et al., 2005) or near Dome Fuji (Hoshina et al., 2014). The negative correlation of the SNRs and surface roughness, thus higher undulations related to a higher noise level, is intuitive. It indicates that, while the surface roughness represents only a snapshot of a single summer season, it might be at least partly representative of the general surface roughness during the past years. If this is confirmed, the surface roughness, which is easy to measure, could be used as an indicator of the stratigraphic noise. The correlation between SNRs and slope inclinations is robust to the spatial scales over which the inclination is calculated (Appendix C).
At D24, past and present surface roughnesses were inconsistent, which could be related to the surface consisting of a mix of sastrugi and glazed surfaces that can alternate both spatially and temporally. This feature was (visually) unique compared to the other sites and coincided with the lowest accumulation rate, the highest slope inclination and the highest surface roughness. The relationships between SNR and environmental properties, as proposed for sites dominated by sastrugi, therefore do not seem to hold at a site with such extreme environmental properties and the related occurrence of glazed surfaces (e.g. Frezzotti et al., 2002; Furukawa et al., 1996). We speculate that D24 represents a discontinuous record in which the two flat anomalies or isochrones (Fig. 2) represent a summer and a winter layer, respectively, from any time within the nearly 7 years of accumulation. The SNR, as defined in this study, is the ratio of the shared signal between the records and the local variations. Therefore, the estimated SNR at site D24 is high, driven by the two anomalies. Between the two anomalies, the past surface roughnesses could have been as high as the present surface roughness. We therefore assume that the spatially coherent part at this site does not represent a seasonal or annual climatic signal and that the isotope records therefore do not provide any useful information for climate signal interpretations.
4.4 Relationships between slope inclination, surface roughness and the accumulation rate
The different environmental properties slope inclination, surface roughness and the accumulation rate also exhibit strong covariations (Fig. D11). Surface roughness is higher at sites with higher slope inclinations (r=0.82, p<0.05) and smaller accumulation rates (, p<0.05), while the latter correlates negatively with slope inclination (, p=0.09). These findings partly contrast Fisher et al. (1985), who proposed that sastrugi heights would be proportional to accumulation rates in Greenland. Studinger et al. (2020) furthermore question simple relationships between slope inclination, surface roughness and the accumulation rate across large spatial scales. However, close links were frequently confirmed at smaller scales: for example, accumulation rates tend to be lower in areas with steeper slopes in various EAP locations (e.g. Dattler et al., 2019), often associated with the underlying bedrock topography (e.g. Fujita et al., 2011; Arcone et al., 2005; Eisen et al., 2005; Black and Budd, 1964) or wind-driven sublimation (e.g. Frezzotti et al., 2004) and redistribution (King et al., 2004). Steeper slopes are associated with stronger wind speeds (e.g. Dattler et al., 2019; Parish and Cassano, 2003; Broeke and Lipzig, 2003; Whillans, 1975; Endo and Fujiwara, 1973), which in turn affect snow surface features (e.g. Furukawa et al., 1996; Whillans, 1975). High wind speeds increase both the propagation speed and the height of dunes and thereby increase surface roughness (Filhol and Sturm, 2015; Birnbaum et al., 2010; Endo and Fujiwara, 1973), at least within the physical constraints of maximum snow heights (e.g. about 1.5 m for sastrugi; Filhol and Sturm, 2015).
4.5 Implications for future studies on stratigraphic noise
Based on the presented dataset, we conclude that the assessed environmental properties affect the amount of stratigraphic noise. However, due to the low number of sampling sites and replicates, as well as shallow sampling depths, the SNR estimates are subject to considerable uncertainty, which renders our results somewhat speculative, even if they are supported by previous studies. Furthermore, the significant covariance among the different environmental properties makes it difficult to disentangle their individual contributions. Additional studies, ideally including more replicates and deeper profiles that cover a wider range of depositional conditions, are needed to test and refine the proposed relationships: in a first-order approximation, an increase in the number of snow cores or the length of the cores by a factor of n will reduce the standard error of the correlations by . That means that increasing the number of cores by a factor of 4 already decreases the uncertainty in the pairwise correlations by half. Given the significant cost and work associated with collecting samples in situ, it would be useful to test whether high-frequency ground-penetrating radar (e.g. Studinger et al., 2020; Rotschky et al., 2006) could serve to estimate stratigraphic noise. This would allow us to cover much larger spatial scales, which would provide information on possible large-scale drivers such as precipitation patterns (Fisher et al., 1985). Moreover, continuous monitoring of the snow surface and accumulation using a laser scanner or photogrammetry (Zuhr et al., 2021; Picard et al., 2019) could provide more detailed knowledge about variations in snow stratigraphy related to depositional conditions including wind speeds.
4.6 Suggestions for optimal site selection for high-resolution climate reconstructions from the Late Holocene
In most cases, the SNR and not the measurement resolution is the limiting factor for the temporal resolution of the climate signal that can be recovered from snow, firn and ice cores (Münch and Laepple, 2018). The higher the noise level, the more averaging in time is needed to reduce the uncorrelated (white) noise while preserving the more persistent (red) climate signal. As an example, when assuming a climate signal with a power spectral density of the form f−β, with β=1 and where f denotes frequency, and uncorrelated noise, a reduction in the noise by a factor of n would increase the attainable climate resolution by the same factor. Assuming that 50 % of the noise is stratigraphic noise (Laepple et al., 2018), we would expect up to 4 times the attainable climate resolution at Kohnen (SNR of 0.77) relative to C4 (SNR = 0.1). As stratigraphic noise strongly varies across ∼100 km, we suggest that an optimal site selection at such small spatial scales can already allow us to improve the SNRs in snow and firn cores and to considerably increase the effective resolution of climate reconstructions from the East Antarctic Plateau.
Site selection can be done by filtering for the most suitable environmental properties: while data on small-scale accumulation rates (Rotschky et al., 2004) and surface roughnesses (e.g. Studinger et al., 2020) are scarce, slope inclination data are available at high spatial resolutions for the entire Antarctic continent (e.g. Howat et al., 2019) and can easily be assessed. Furthermore, we assume that areas characterised by glazed surfaces are poorly suited sampling locations, as the archive of the climate signal might be intermittent. Such locations can be excluded by in situ observations, by employing remote sensing approaches to snow surface classification (Scambos et al., 2012; Rotschky et al., 2006), or by selecting locations with low slope inclinations and a certain amount of accumulation (e.g. Furukawa et al., 1996). Considering that the ice sheet topography was fairly constant over large parts of the EAP during the past millennium, related to the bedrock topography (Eisen et al., 2005; Steinhage et al., 1999), we hypothesise that the amount of stratigraphic noise imprinted in the snow over the past decade is representative of past centuries. This could be tested by collecting and analysing long (e.g. 100 m) high-resolution firn cores. Future studies should however also account for the fact that ice properties such as stratigraphic noise are advected horizontally due to ice flow (Arcone et al., 2005; Steinhage et al., 1999) by checking for similarly suitable environmental properties further upstream. The size of that area can be determined based on ice flow velocity (e.g. Rignot et al., 2019; Arthern et al., 2015) and the desired snow or firn core length.
The sampling setup at the selected sites should then follow the suggestions of Münch et al. (2016a): the distance of replicate cores should be larger than the expected decorrelation length of stratigraphic noise, for example 10 m in the DML plateau area. The number of cores should be chosen based on the expected amount of stratigraphic noise and the intended signal resolution. Based on the findings by Münch et al. (2016a), we suggest taking five replicates at locations with similar environmental properties to Kohnen Station. The sample direction should be perpendicular to the overall wind direction if the surface roughness is measured across the sampled cores as in this study.
Signal interpretation should further consider influences on the isotopic composition from, for example, sublimation (Wahl et al., 2021), snow metamorphism (Stuart et al., 2021) and precipitation intermittency. The latter can be responsible for up to 50 % of the noise variance across large spatial scales (Laepple et al., 2018). The sampling strategy we propose here could therefore be expanded by replicate cores taken at optimal distances to account for precipitation intermittency, as suggested by Münch et al. (2021).
In this work, we assessed stratigraphic noise and its spatial variations along a 120 km transect to the south-west of Kohnen Station, Dronning Maud Land, the East Antarctic Plateau. We analysed the local, non-climatic variability in δ18O compositions at high vertical resolution across spatial scales ranging from local (50 m) to regional (∼120 km), assessing their dependency on the following local environmental properties: the accumulation rate, surface roughness and slope inclination. Within the study area, we found that stratigraphic noise dominates the seasonal to interannual isotopic signal. The amount of noise also varies significantly across the different sites. At sites that are dominated by sastrugi, stratigraphic noise is lower if the terrain is flatter, the surface less rough and accumulation rates higher. All these environmental characteristics are typically associated with lower wind speeds. Sites characterised by these properties are likely more suitable for collecting isotope profiles that provide meaningful climate signals. Assuming that the proposed relationships are stationary over time, these findings could be applied to snow, firn and ice cores that are several hundred metres in length and thus increase the effective resolution of Late Holocene climate reconstructions from the East Antarctic Plateau.
When the snow surface variations stay similar during the deposition of the sampled snow, e.g. when dunes and troughs are persistent in size and location, snow samples can be processed at depths relative to each other. This is done, for example, for surface snow samples and shallow cores (e.g. Casado et al., 2016; Steen-Larsen et al., 2014). If the surface height variations are expected to have changed throughout the time of accumulation, snow cores are instead processed at absolute heights, which was decided for the Kohnen trenches (Münch et al., 2016a, 2017). We tested this method for the new dataset by calculating pairwise correlation coefficients for all possible pairs of isotope profiles at each site (Fig. A1), using both the absolute and the relative heights. We would expect the correlation to be stronger with more common signal located at a similar depth, at either absolute or relative heights.
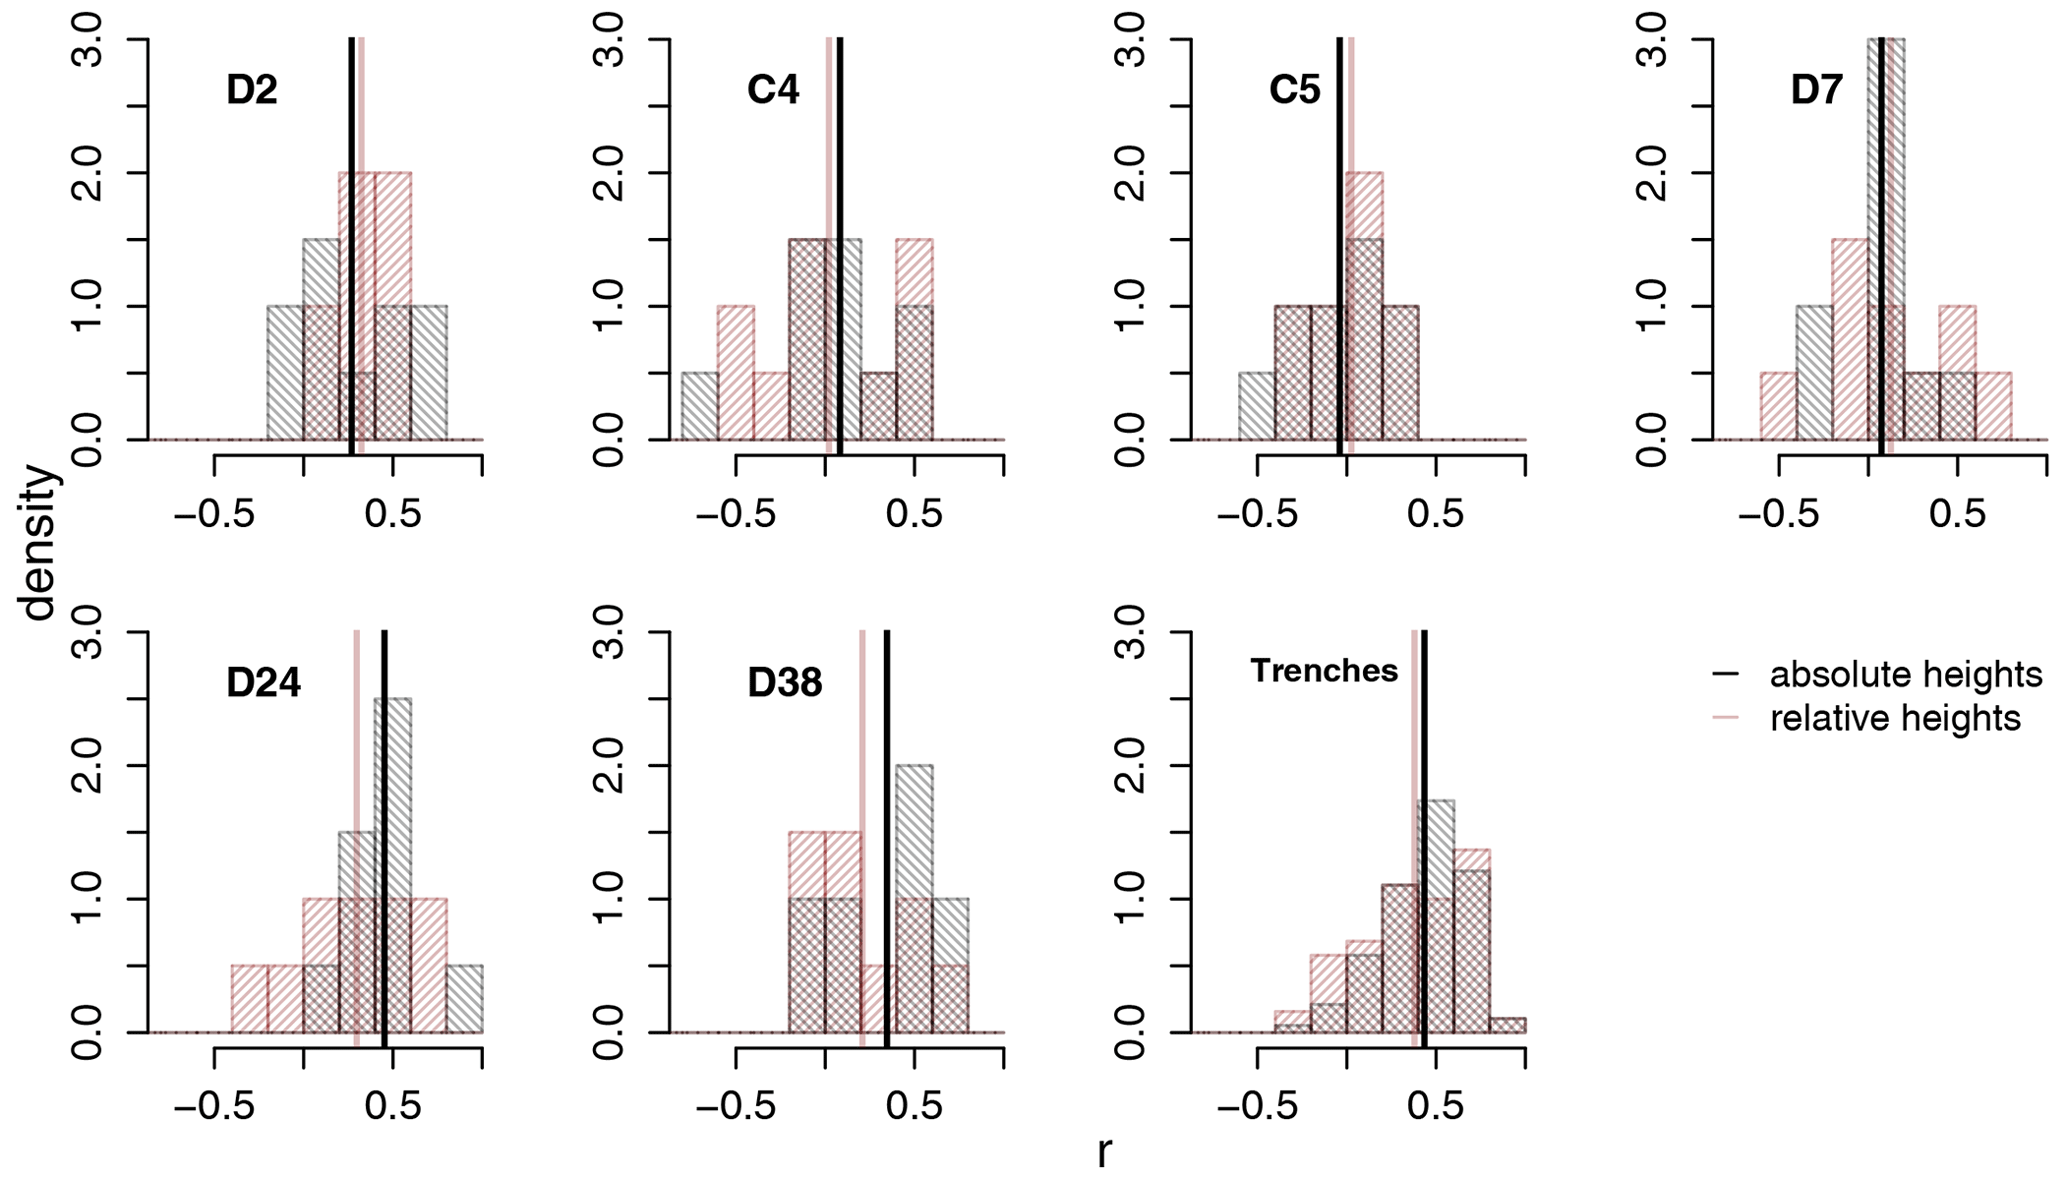
Figure A1Pairwise correlation coefficients, r, of isotope profiles from different sites using absolute (black) and relative (red) heights. Vertical lines show the mean correlation coefficients.
We obtained a mean correlation coefficient of r=0.19 (SD 0.31) when using absolute heights and 0.17 (SD 0.32) for relative heights. The difference in the mean correlations was statistically not significant for any of the sites (p<0.05, Fig. A1). Additionally, we were unable to identify common isotopic peaks at most sites, which also indicates that local snow heights generally changed fast. At the same time, we were able to confirm highly irregular snow accumulations, e.g. at site D38. These findings are consistent with previous findings (e.g. Münch et al., 2016a; Birnbaum et al., 2010). The snow cores in this study are therefore processed at the absolute height reference.
Pairwise correlation coefficients for isotope profiles collected at Kohnen Station were found to increase as the interprofile spacing drops to below 5–10 m (Münch et al., 2016a), indicating that less distant isotope profiles contain more dependent noise, probably due to the spatial scales of snow surface features like sastrugi. In order to quantify independent noise, we used a minimum interprofile spacing of 10 m in this study. With this setup, we did not find any relationship between spacing and pairwise correlation coefficients (Fig. B1), which indicates that the decorrelation length of stratigraphic noise which was found to be 5–10 m at Kohnen Station is valid for larger areas across the plateau of DML.
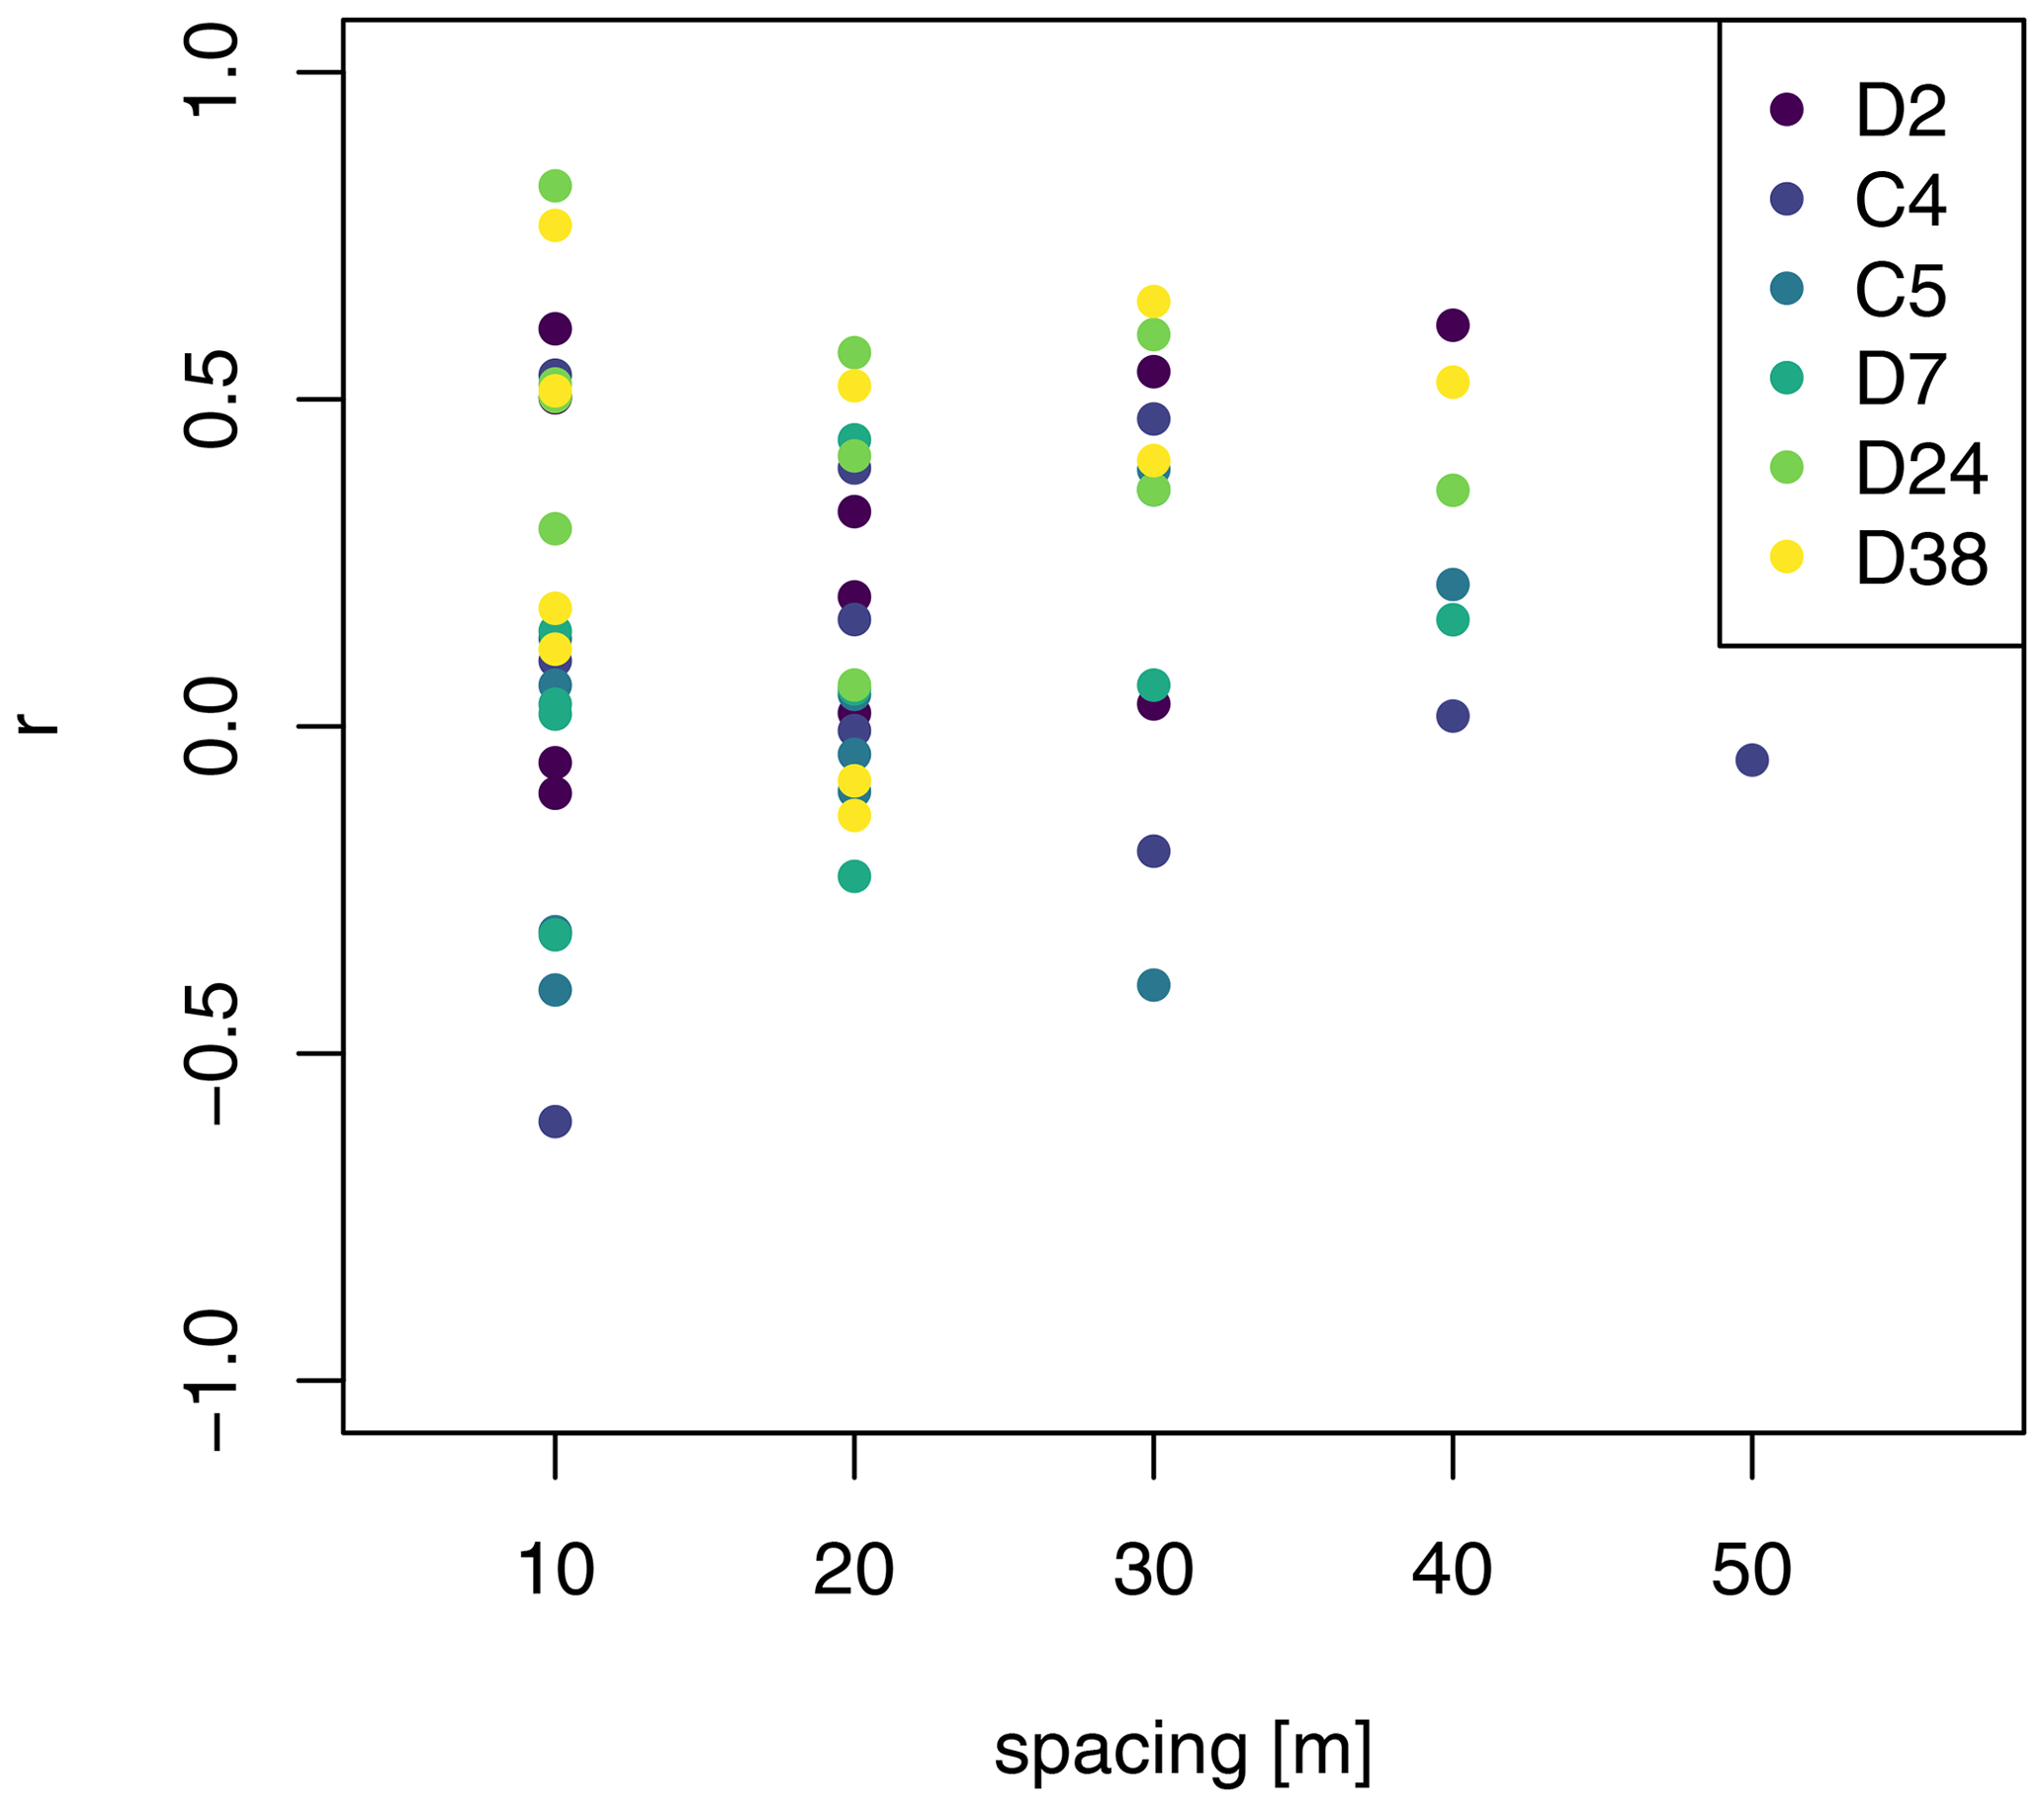
Figure B1Pairwise correlation coefficients, r, of the δ18O profiles as a function of their interprofile spacing. Colours indicate the different sites.
We calculated slope inclinations on spatial scales ranging from 1 to 15 km (REMA DEM; Howat et al., 2019) and tested how this affects the relationship with SNR, surface roughness and the accumulation rate. Regarding SNR, the absolute values of the correlation coefficient varied slightly for the different spatial scales, increasing from (p<0.05) at 1 km to (p<0.05) at 15 km (Fig. C1). A similar increase in correlation with increasing spatial scale was obtained for surface roughness and accumulation rates. Previous studies have already proposed the existence of relationships between the accumulation rate, slope inclination and snow surface features for slopes calculated at scales of 1–2 km (Eisen et al., 2005; Arcone et al., 2005; Frezzotti et al., 2002; Furukawa et al., 1996, e.g.) and 16 km (Black and Budd, 1964). While a link between wind speed and slope inclination has been established using coarse datasets (e.g. Broeke and Lipzig, 2003; Endo and Fujiwara, 1973; Mather and Miller, 1966), this link was expected to break down with higher resolutions (e.g. 50 km; Kikuchi and Ageta, 1989). Others proposed that small slope changes at scales <10 km and the commensurate changes in wind speed would be able to explain differences in accumulation rates (Lenaerts et al., 2012), e.g. by sublimation (Frezzotti et al., 2004) and redistribution (King et al., 2004), as well as snow surface features (Whillans, 1975). In this study, we found that correlation coefficients between SNR, the accumulation rate and surface roughness increased with increasing spatial scales. Yet considering the small size of our sample, the sensitivity of the correlation coefficients to different slope scales could be dependent on a single surface undulation in the sampling area. We therefore take into account earlier results from wind simulations (e.g. Lenaerts et al., 2012; Whillans, 1975) and variations in accumulation rates and surface features across smaller scales (e.g. Eisen et al., 2005; Arcone et al., 2005; Furukawa et al., 1996; Frezzotti et al., 2002) and do not exceed 10 km for calculating slope inclinations.
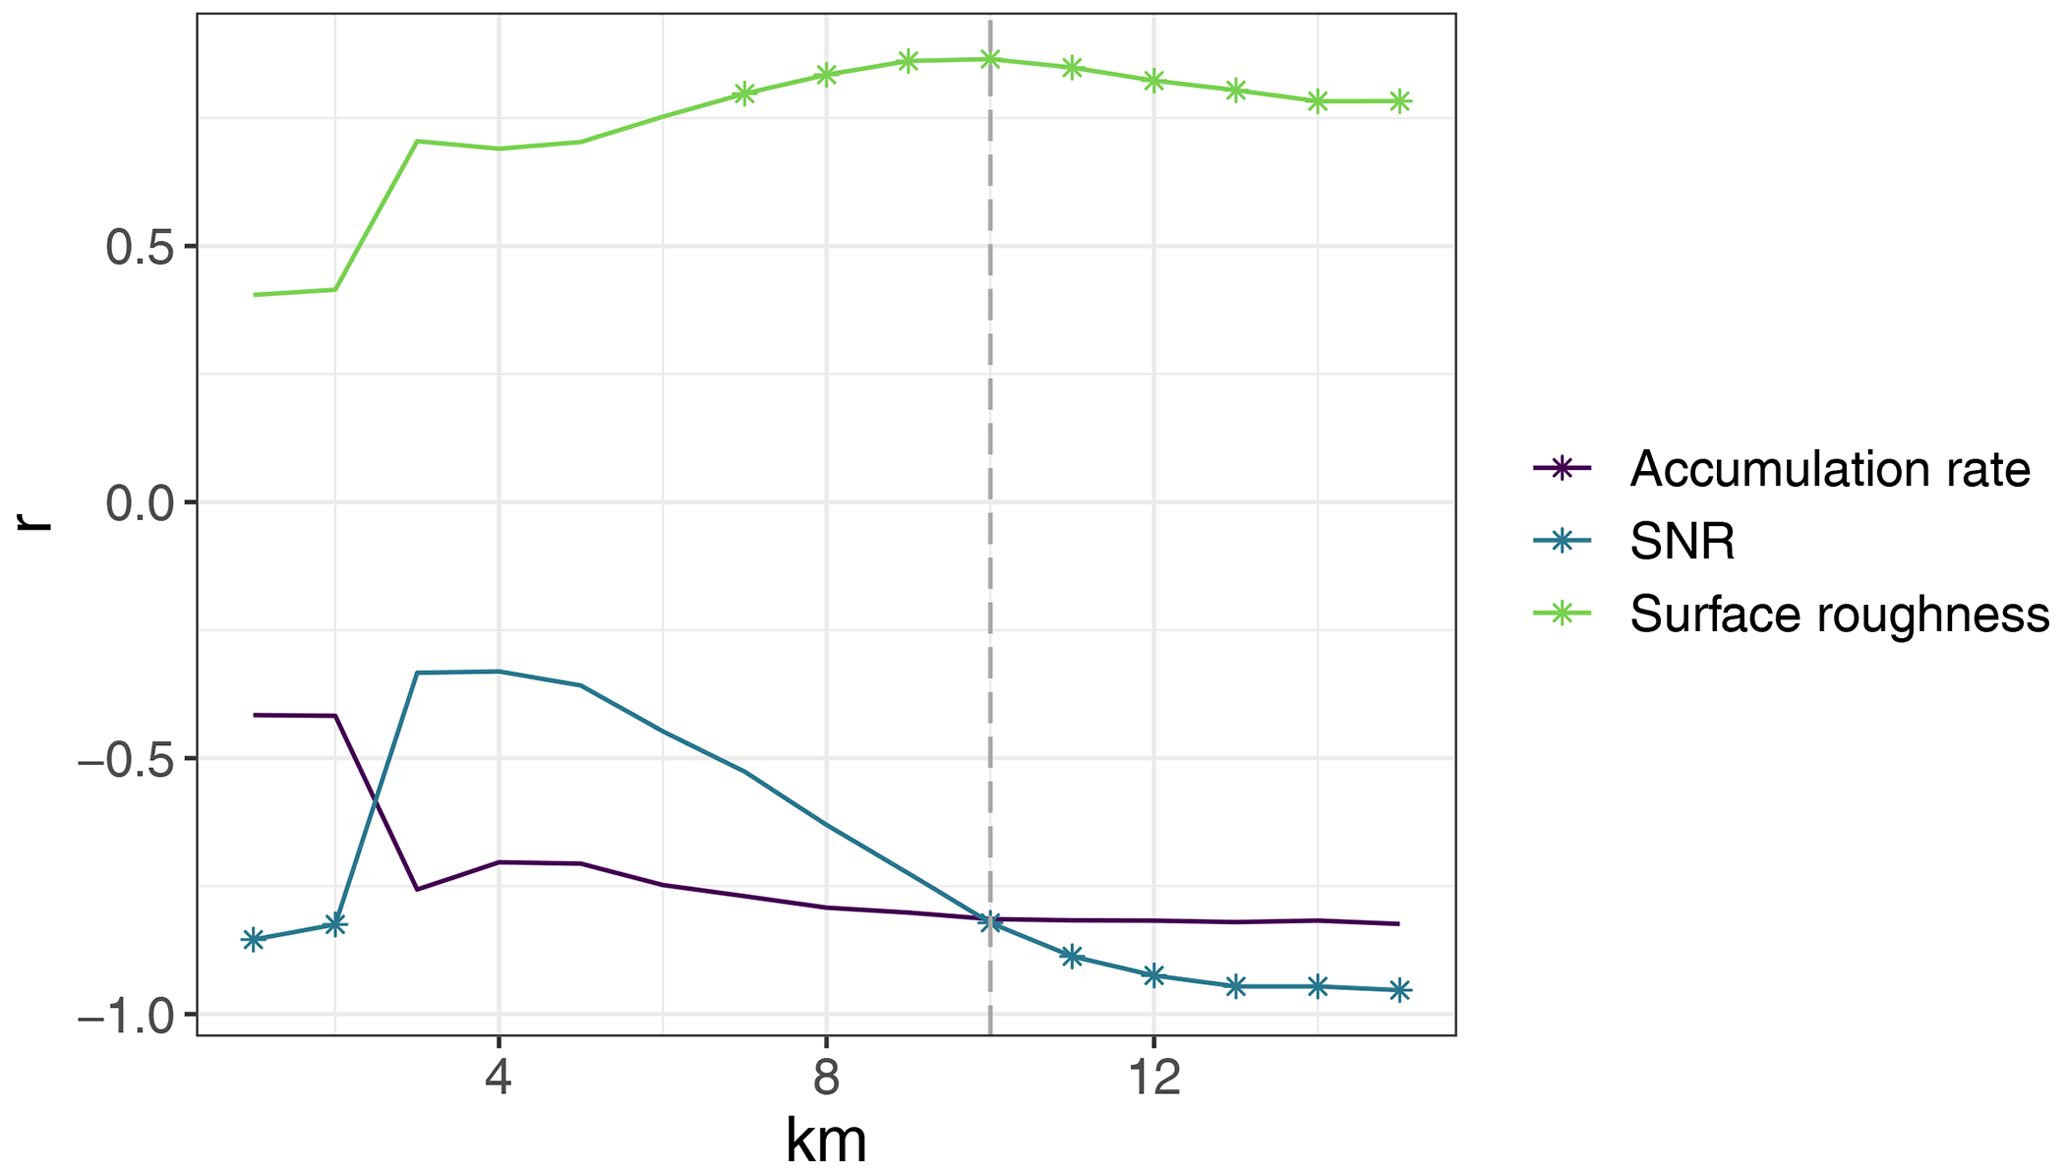
Figure C1Correlation coefficients, r, between SNRs, surface roughness (SDSH) and accumulation rates (A) with slope inclinations calculated using different scales (1–15 km). Stars indicate values with statistical significance (p<0.05).
Possible relationships between slope inclination, surface roughness and the accumulation rate are discussed in Sect. 4.4.
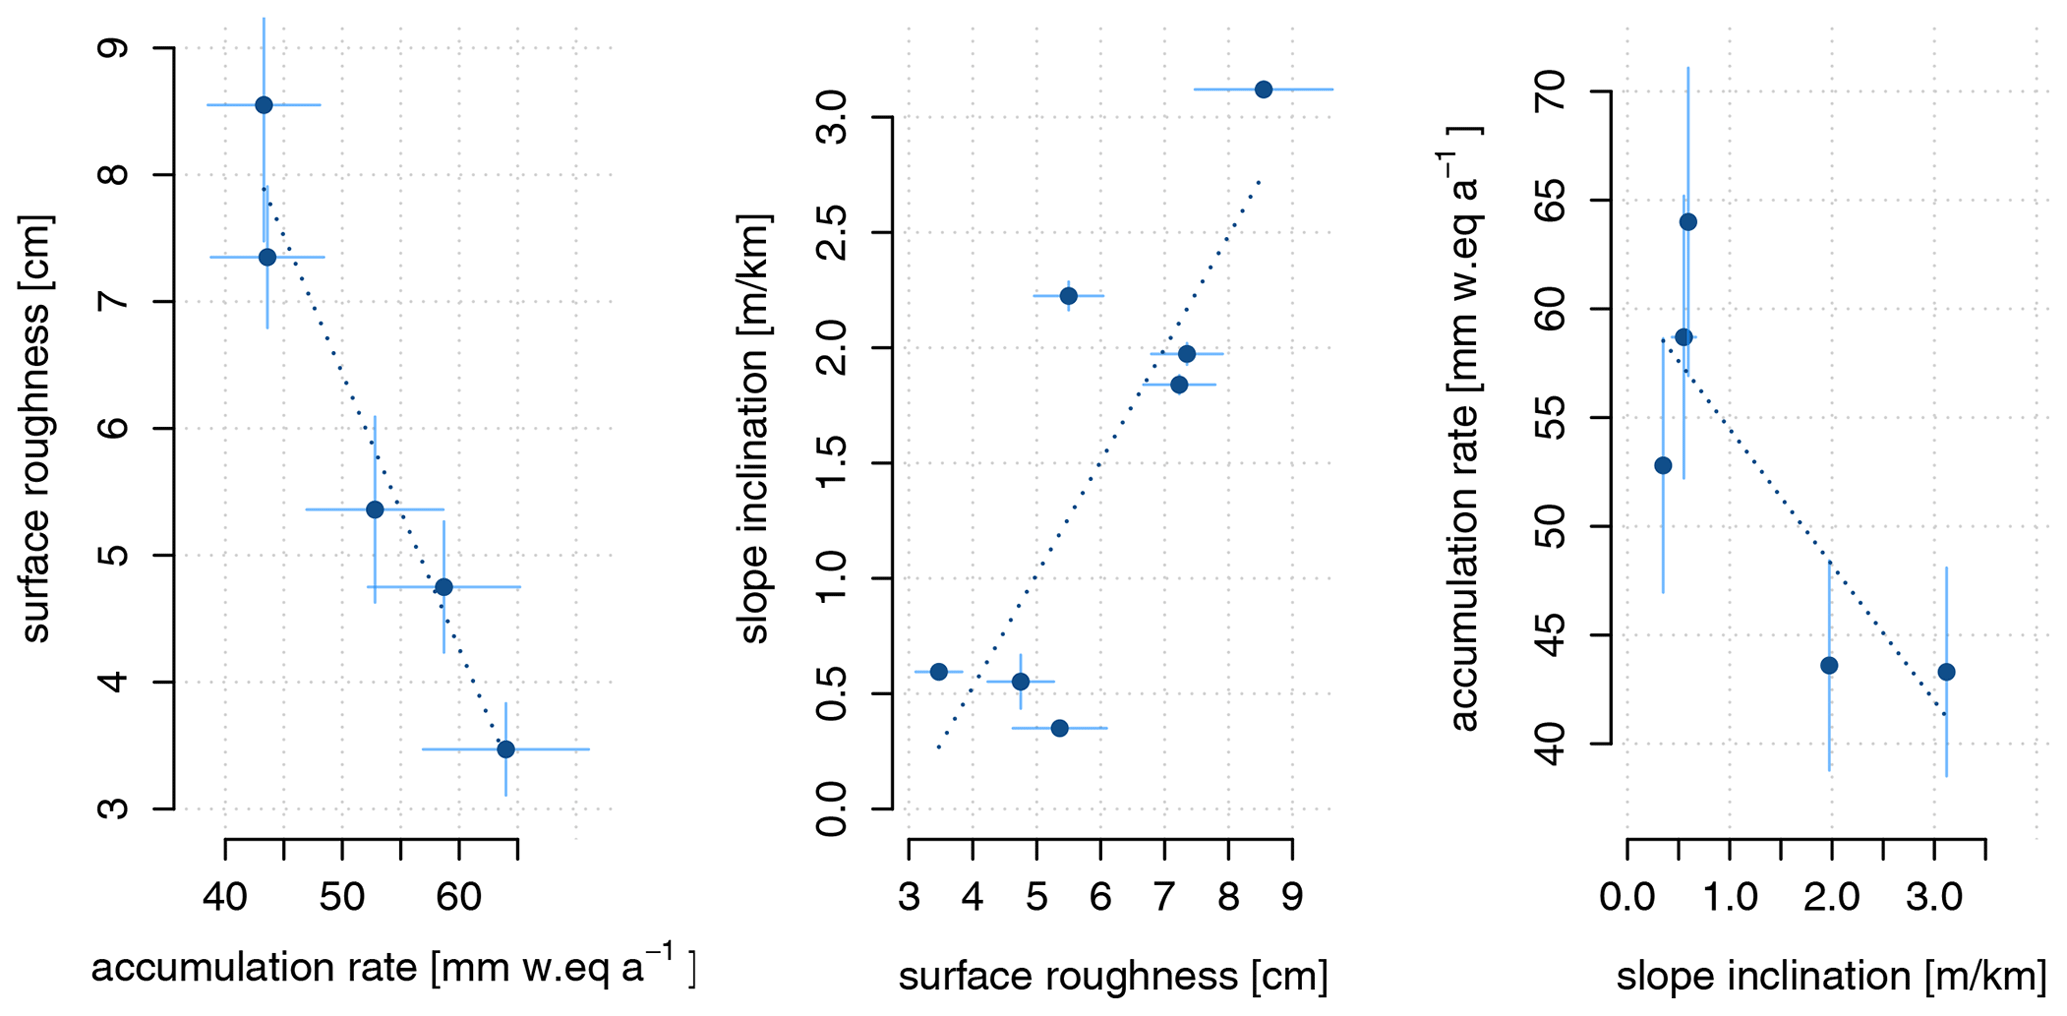
Figure D1Comparisons between the accumulation rate A [mm w.e. a−1], surface roughness SDSH [cm] and slope inclination [m km−1]. Linear regression lines (dashed) suggest possible relationships. Vertical and horizontal lines represent 2 ⋅ SD of the according environmental property as an indication of uncertainty. Uncertainties in 10 km slope inclinations are very small such that they are not visible for most sites.
All measurements are available in the PANGAEA database under https://doi.org/10.1594/PANGAEA.956273 (Hirsch et al., 2023) and https://doi.org/10.1594/PANGAEA.956663 (Laepple et al., 2023).
TL, MH and JF designed the expedition, and TL designed the sampling strategy. NH and TL designed the study. JF, RD, TL and MH carried out the sampling on the EAP. NH conducted the isotope measurements with the help of AZ and TM. All authors, especially TL, AZ and TM, contributed to the scientific analysis. NH performed the analysis and wrote the manuscript, which was reviewed by all authors.
The contact author has declared that none of the authors has any competing interests.
Publisher's note: Copernicus Publications remains neutral with regard to jurisdictional claims in published maps and institutional affiliations.
We thank the scientists, technicians and support staff at Kohnen Station for their assistance, especially Klaus Trimborn for his skilful support during sample collection. Furthermore, we would like to thank Hanno Meyer and Mikaela Weiner for their work in the isotope laboratory at AWI Potsdam and Christoph Schneider for scientific supervision of the initial draft. Data analysis was performed in R, a language and environment for statistical computing. The Antarctic map is based on Quantarctica datasets in QGIS, kindly provided by the Norwegian Polar Institute (Matsuoka et al., 2021).
This project received financial support from the Helmholtz Association through the Polar Regions and Coasts in the Changing Earth System (PACES II) programme (COMB-I project) and from the European Research Council (ERC) under the EU's Horizon 2020 Research and Innovation Programme (grant agreement no. 716092). It was furthermore supported by the Informationsinfrastrukturen Grant of the Helmholtz Association as part of the DataHub of the Research Field Earth and Environment.
The article processing charges for this open-access publication were covered by the Alfred Wegener Institute, Helmholtz Centre for Polar and Marine Research (AWI).
This paper was edited by Xavier Fettweis and reviewed by Massimo Frezzotti and two anonymous referees.
Arcone, S., Spikes, V., and Hamilton, G.: Stratigraphic Variation Within Polar Firn Caused by Differential Accumulation and Ice Flow: Interpretation of a 400 Mhz Short-Pulse Radar Profile from West Antarctica, J. Glaciol., 51, 407–422, https://doi.org/10.3189/172756505781829151, 2005. a, b, c, d
Arthern, R. J., Hindmarsh, R. C. A., and Williams, C. R.: Flow speed within the Antarctic ice sheet and its controls inferred from satellite observations: FLOW SPEED IN THE ANTARCTIC ICE SHEET, J. Geophys. Res.-Earth Surf., 120, 1171–1188, https://doi.org/10.1002/2014JF003239, 2015. a
Barnes, P. R. F., Wolff, E. W., and Mulvaney, R.: A 44 kyr paleoroughness record of the Antarctic surface, J. Geophys. Res.-Atmos., 111, D03102, https://doi.org/10.1029/2005JD006349, 2006. a
Birnbaum, G., Freitag, J., Brauner, R., König-Langlo, G., Schulz, E., Kipfstuhl, S., Oerter, H., Reijmer, C. H., Schlosser, E., Faria, S. H., Ries, H., Loose, B., Herber, A., Duda, M. G., Powers, J. G., Manning, K. W., and van den Broeke, M. R.: Strong-wind events and their influence on the formation of snow dunes: observations from Kohnen station, Dronning Maud Land, Antarctica, J. Glaciol., 56, 891–902, 2010. a, b, c, d, e
Black, H. P. and Budd, W.: Accumulation in the Region of Wilkes, Wilkes Land, Antarctica, J. Glaciol., 5, 3–15, https://doi.org/10.3189/S0022143000028549, 1964. a, b
Broeke, M. R. V. D. and Lipzig, N. P. M. V.: Factors Controlling the Near-Surface Wind Field in Antarctica, Mon. Weather Rev., 131, 733–743, https://doi.org/10.1175/1520-0493(2003)131<0733:FCTNSW>2.0.CO;2, 2003. a, b, c
Casado, M., Landais, A., Picard, G., Münch, T., Laepple, T., Stenni, B., Dreossi, G., Ekaykin, A., Arnaud, L., Genthon, C., Touzeau, A., Masson-Delmotte, V., and Jouzel, J.: Archival of the water stable isotope signal in East Antarctic ice cores, The Cryosphere Discuss. [preprint], https://doi.org/10.5194/tc-2016-263, 2016. a
Casado, M., Landais, A., Picard, G., Münch, T., Laepple, T., Stenni, B., Dreossi, G., Ekaykin, A., Arnaud, L., Genthon, C., Touzeau, A., Masson-Delmotte, V., and Jouzel, J.: Archival processes of the water stable isotope signal in East Antarctic ice cores, The Cryosphere, 12, 1745–1766, https://doi.org/10.5194/tc-12-1745-2018, 2018. a, b
Casado, M., Münch, T., and Laepple, T.: Climatic information archived in ice cores: impact of intermittency and diffusion on the recorded isotopic signal in Antarctica, Clim. Past, 16, 1581–1598, https://doi.org/10.5194/cp-16-1581-2020, 2020. a
Dansgaard, W.: Stable isotopes in precipitation, Tellus, 16, 436–468, https://doi.org/10.3402/tellusa.v16i4.8993, 1964. a, b
Dattler, M. E., Lenaerts, J. T. M., and Medley, B.: Significant Spatial Variability in Radar‐Derived West Antarctic Accumulation Linked to Surface Winds and Topography, Geophys. Res. Lett., 46, 13126–13134, https://doi.org/10.1029/2019GL085363, 2019. a, b
Dee, S., Emile-Geay, J., Evans, M. N., Allam, A., Steig, E. J., and Thompson, D. M.: PRYSM: An open-source framework for PRoxY System Modeling, with applications to oxygen-isotope systems, J. Adv. Model. Earth Sy., 7, 1220–1247, https://doi.org/10.1002/2015MS000447, 2015. a
Dolman, A. M. and Laepple, T.: Sedproxy: a forward model for sediment-archived climate proxies, Clim. Past, 14, 1851–1868, https://doi.org/10.5194/cp-14-1851-2018, 2018. a
Eisen, O., Rack, W., Nixdorf, U., and Wilhelms, F.: Characteristics of accumulation around the EPICA deep-drilling site in Dronning Maud Land, Antarctica, Ann. Glaciol., 41, 41–46, 2005. a, b, c, d
Endo, Y. and Fujiwara, K.: Characteristics of the snow cover in East Antarctica along the route of the JARE South Pole traverse and factors controlling such characteristics, JARE scientific reports. Ser. C, Earth sciences, 7, 1–38, 1973. a, b, c
EPICA community members: Eight glacial cycles from an Antarctic ice core, Nature, 429, 623–628, https://doi.org/10.1038/nature02599, 2004. a
EPICA community members: One-to-one coupling of glacial climate variability in Greenland and Antarctica, Nature, 444, 195–198, https://doi.org/10.1038/nature05301, 2006. a, b
Filhol, S. and Sturm, M.: Snow bedforms: A review, new data, and a formation model: Snow bedforms: Review and Modeling, J. Geophys. Res.-Earth Surf., 120, 1645–1669, https://doi.org/10.1002/2015JF003529, 2015. a, b
Fisher, D. A., Reeh, N., and Clausen, H. B.: Stratigraphic Noise in Time Series Derived from Ice Cores, Ann. Glaciol., 7, 76–83, https://doi.org/10.1017/S0260305500005942, 1985. a, b, c, d, e, f, g
Frezzotti, M., Gandolfi, S., La Marca, F., and Urbini, S.: Snow dunes and glazed surfaces in Antarctica: new field and remote-sensing data, Ann. Glaciol., 34, 81–88, https://doi.org/10.3189/172756402781817851, 2002. a, b, c
Frezzotti, M., Pourchet, M., Flora, O., Gandolfi, S., Gay, M., Urbini, S., Vincent, C., Becagli, S., Gragnani, R., Proposito, M., Severi, M., Traversi, R., Udisti, R., and Fily, M.: New estimations of precipitation and surface sublimation in East Antarctica from snow accumulation measurements, Clim. Dynam., 23, 803–813, https://doi.org/10.1007/s00382-004-0462-5, 2004. a, b
Fujita, S., Holmlund, P., Andersson, I., Brown, I., Enomoto, H., Fujii, Y., Fujita, K., Fukui, K., Furukawa, T., Hansson, M., Hara, K., Hoshina, Y., Igarashi, M., Iizuka, Y., Imura, S., Ingvander, S., Karlin, T., Motoyama, H., Nakazawa, F., Oerter, H., Sjöberg, L. E., Sugiyama, S., Surdyk, S., Ström, J., Uemura, R., and Wilhelms, F.: Spatial and temporal variability of snow accumulation rate on the East Antarctic ice divide between Dome Fuji and EPICA DML, The Cryosphere, 5, 1057–1081, https://doi.org/10.5194/tc-5-1057-2011, 2011. a
Furukawa, T., Kamiyama, K., and Maen, H.: Snow surface features along the traverse route from the coast to Dome Fuji Station, Queen Maud Land, Antarctica, Proc. NIPR Symp. Polar Meteorol. Glacial., 10, 13–24, 1996. a, b, c, d, e, f, g
Goursaud, S., Masson-Delmotte, V., Favier, V., Orsi, A., and Werner, M.: Water stable isotope spatio-temporal variability in Antarctica in 1960–2013: observations and simulations from the ECHAM5-wiso atmospheric general circulation model, Clim. Past, 14, 923–946, https://doi.org/10.5194/cp-14-923-2018, 2018. a, b
Graf, W., Oerter, H., Reinwarth, O., Stichler, W., Wilhelms, F., Miller, H., and Mulvaney, R.: Stable-isotope records from Dronning Maud Land, Antarctica, Ann. Glaciol., 35, 195–201, 2002. a, b
Helsen, M. M., van de Wal, R. S. W., van den Broeke, M. R., van As, D., Meijer, H. A. J., and Reijmer, C. H.: Oxygen isotope variability in snow from western Dronning Maud Land, Antarctica and its relation to temperature, Tellus B, 57, 423–435, https://doi.org/10.3402/tellusb.v57i5.16563, 2005. a, b, c, d
Hirsch, N., Hörhold, M., Dallmayr, R., Laepple, T., Freitag, J., Meyer, H., and Weiner, M.: Stable water isotopologues of arrays of high resolution 1 m snow cores from across Dronning Maud Land, East Antarctic Plateau, PANGAEA [data set], https://doi.org/10.1594/PANGAEA.956273, 2023. a
Hoshina, Y., Fujita, K., Nakazawa, F., Iizuka, Y., Miyake, T., Hirabayashi, M., Kuramoto, T., Fujita, S., and Motoyama, H.: Effect of accumulation rate on water stable isotopes of near-surface snow in inland Antarctica, J. Geophys. Res.-Atmos., 119, 274–283, https://doi.org/10.1002/2013JD020771, 2014. a
Howat, I. M., Porter, C., Smith, B. E., Noh, M.-J., and Morin, P.: The Reference Elevation Model of Antarctica, The Cryosphere, 13, 665–674, https://doi.org/10.5194/tc-13-665-2019, 2019. a, b, c
Johnsen, S. J., Clausen, H. B., Cuffey, K. M., Hoffmann, G., Schwander, J., and Creyts, T.: Diffusion of stable isotopes in polar firn and ice: the isotope effect in firn diffusion, in: Physics of Ice Core Records, edited by Hondoh, T., vol. 159, pp. 121–140, Hokkaido University Press, Sapporo, Japan, 2000. a
Jones, J. M., Gille, S. T., Goosse, H., Abram, N. J., Canziani, P. O., Charman, D. J., Clem, K. R., Crosta, X., de Lavergne, C., Eisenman, I., England, M. H., Fogt, R. L., Frankcombe, L. M., Marshall, G. J., Masson-Delmotte, V., Morrison, A. K., Orsi, A. J., Raphael, M. N., Renwick, J. A., Schneider, D. P., Simpkins, G. R., Steig, E. J., Stenni, B., Swingedouw, D., and Vance, T. R.: Assessing recent trends in high-latitude Southern Hemisphere surface climate, Nat. Clim. Change, 6, 917–926, https://doi.org/10.1038/nclimate3103, 2016. a
Jones, T. R., White, J. W. C., and Popp, T.: Siple Dome shallow ice cores: a study in coastal dome microclimatology, Clim. Past, 10, 1253–1267, https://doi.org/10.5194/cp-10-1253-2014, 2014. a
Jouzel, J. and Masson-Delmotte, V.: Paleoclimates: what do we learn from deep ice cores?, WIREs Climate Change, 1, 654–669, https://doi.org/10.1002/wcc.72, 2010. a
Karlöf, L., Winebrenner, D. P., and Percival, D. B.: How representative is a time series derived from a firn core? A study at a low-accumulation site on the Antarctic plateau, J. Geophys. Res., 111, F04001, https://doi.org/10.1029/2006JF000552, 2006. a
Kikuchi, T. and Ageta, Y.: A preliminary estimate of inertia effects in a bulk model of katabatic wind, Proc. NIPR Symp. Polar Meteorol. Glacial., 2, 61–69, 1989. a
King, J. C., Anderson, P., and Vaughan, D. G.: Wind-borne redistribution of snow across an Antarctic ice rise, J. Geophys. Res., 109, D11104, https://doi.org/10.1029/2003JD004361, 2004. a, b
Laepple, T., Werner, M., and Lohmann, G.: Synchronicity of Antarctic temperatures and local solar insolation on orbital timescales, Nature, 471, 91–94, https://doi.org/10.1038/nature09825, 2011. a
Laepple, T., Münch, T., and Dolman, A. M.: Inferring past climate variations from proxies: Separating climate and non-climate variability, Past Global Changes Magazine, 25, 140–141, https://doi.org/10.22498/pages.25.3.140, 2017. a
Laepple, T., Münch, T., Casado, M., Hoerhold, M., Landais, A., and Kipfstuhl, S.: On the similarity and apparent cycles of isotopic variations in East Antarctic snow pits, The Cryosphere, 12, 169–187, https://doi.org/10.5194/tc-12-169-2018, 2018. a, b, c, d, e, f
Laepple, T., Hörhold, M., Dallmayr, R., Freitag, J., and Hirsch, N.: Local snow dunes/sastrugi heights across the plateau of Dronning Maud Land, East Antarctica, PANGAEA [data set], https://doi.org/10.1594/PANGAEA.956663, 2023. a
Lenaerts, J. T., Van Den Broeke, M. R., Scarchilli, C., and Agosta, C.: Impact of model resolution on simulated wind, drifting snow and surface mass balance in Terre Adélie, East Antarctica, J. Glaciol., 58, 821–829, https://doi.org/10.3189/2012JoG12J020, 2012. a, b
Liu, H., Jezek, K., Li, B., and Zhao, Z.: Radarsat Antarctic Mapping Project Digital Elevation Model, Version 2. Boulder, Colorado USA. NASA National Snow and Ice Data Center Distributed Active Archive Center [data set], https://doi.org/10.5067/8JKNEW6BFRVD, 2015. a, b
Mather, K. B. and Miller, G. S.: Wind Drainage off the High Plateau of Eastern Antarctica, Nature, 209, 281–284, https://doi.org/10.1038/209281a0, 1966. a
Matsuoka, K., Skoglund, A., Roth, G., de Pomereu, J., Griffiths, H., Headland, R., Herried, B., Katsumata, K., Le Brocq, A., Licht, K., and Morgan, F.: Quantarctica, an integrated mapping environment for Antarctica, the Southern Ocean, and sub-Antarctic islands, Environ. Model. Softw., 140, 105015, https://doi.org/10.1016/j.envsoft.2021.105015, 2021. a
McMorrow, A. J., Curran, M. A. J., Van Ommen, T. D., Morgan, V. I., and Allison, I.: Features of meteorological events preserved in a high-resolution Law Dome (East Antarctica) snow pit, Ann. Glaciol., 35, 463–470, 2002. a
Medley, B. and Thomas, E. R.: Increased snowfall over the Antarctic Ice Sheet mitigated twentieth-century sea-level rise, Nat. Clim. Change, 9, 34–39, https://doi.org/10.1038/s41558-018-0356-x, 2019. a
Münch, T. and Laepple, T.: What climate signal is contained in decadal- to centennial-scale isotope variations from Antarctic ice cores?, Clim. Past, 14, 2053–2070, https://doi.org/10.5194/cp-14-2053-2018, 2018. a, b, c, d, e
Münch, T., Kipfstuhl, S., Freitag, J., Meyer, H., and Laepple, T.: Regional climate signal vs. local noise: a two-dimensional view of water isotopes in Antarctic firn at Kohnen Station, Dronning Maud Land, Clim. Past, 12, 1565–1581, https://doi.org/10.5194/cp-12-1565-2016, 2016a. a, b, c, d, e, f, g, h, i, j, k, l, m, n, o, p, q
Münch, T., Kipfstuhl, S., Freitag, J., Meyer, H., and Laepple, T.: Oxygen isotopes from two snow trenches from Kohnen Station, Dronning Maud Land, Antarctica from the 2012/13 field season, PANGEAE [data set], https://doi.org/10.1594/PANGAEA.861675, 2016b. a
Münch, T., Kipfstuhl, S., Freitag, J., Meyer, H., and Laepple, T.: Constraints on post-depositional isotope modifications in East Antarctic firn from analysing temporal changes of isotope profiles, The Cryosphere, 11, 2175–2188, https://doi.org/10.5194/tc-11-2175-2017, 2017. a, b, c, d, e, f
Münch, T., Werner, M., and Laepple, T.: How precipitation intermittency sets an optimal sampling distance for temperature reconstructions from Antarctic ice cores, Clim. Past, 17, 1587–1605, https://doi.org/10.5194/cp-17-1587-2021, 2021. a
Noone, D., Turner, J., and Mulvaney, R.: Atmospheric signals and characteristics of accumulation in Dronning Maud Land, Antarctica, J. Geophys. Res.-Atmos., 104, 19191–19211, https://doi.org/10.1029/1999JD900376, 1999. a
Oerter, H., Wilhelms, F., Jung-Rothenhäusler, F., Göktas, F., Miller, H., Graf, W., and Sommer, S.: Accumulation rates in Dronning Maud Land, Antarctica, as revealed by dielectric-profiling measurements of shallow firn cores, Ann. Glaciol., 30, 27–34, 2000. a, b, c
Parish, T. R. and Cassano, J. J.: The Role of Katabatic Winds on the Antarctic Surface Wind Regime, Mon. Weather Rev., 131, 317–333, https://doi.org/10.1175/1520-0493(2003)131<0317:TROKWO>2.0.CO;2, 2003. a, b
Picard, G., Arnaud, L., Caneill, R., Lefebvre, E., and Lamare, M.: Observation of the process of snow accumulation on the Antarctic Plateau by time lapse laser scanning, The Cryosphere, 13, 1983–1999, https://doi.org/10.5194/tc-13-1983-2019, 2019. a, b
Reijmer, C. H. and van den Broeke, M. R.: Temporal and spatial variability of the surface mass balance in Dronning Maud Land, Antarctica, as derived from automatic weather stations, J. Glaciol., 49, 512–520, 2003. a, b, c, d
Rignot, E., Mouginot, J., Scheuchl, B., van den Broeke, M., van Wessem, M. J., and Morlighem, M.: Four decades of Antarctic Ice Sheet mass balance from 1979–2017, P. Natl. Acad. Sci. USA, 116, 1095–1103, https://doi.org/10.1073/pnas.1812883116, 2019. a
Rotschky, G., Eisen, O., Wilhelms, F., Nixdorf, U., and Oerter, H.: Spatial distribution of surface mass balance on Amundsenisen plateau, Antarctica, derived from ice-penetrating radar studies, Ann. Glaciol., 39, 265–270, 2004. a, b, c, d
Rotschky, G., Rack, W., Dierking, W., and Oerter, H.: Retrieving Snowpack Properties and Accumulation Estimates From a Combination of SAR and Scatterometer Measurements, IEEE T. Geosci. Remote, 44, 943–956, https://doi.org/10.1109/TGRS.2005.862524, 2006. a, b, c
Scambos, T., Frezzotti, M., Haran, T., Bohlander, J., Lenaerts, J., Van Den Broeke, M., Jezek, K., Long, D., Urbini, S., Farness, K., Neumann, T., Albert, M., and Winther, J.-G.: Extent of low-accumulation `wind glaze' areas on the East Antarctic plateau: implications for continental ice mass balance, J. Glaciol., 58, 633–647, https://doi.org/10.3189/2012JoG11J232, 2012. a, b
Schlosser, E., Manning, K. W., Powers, J. G., Duda, M. G., Birnbaum, G., and Fujita, K.: Characteristics of high-precipitation events in Dronning Maud Land, Antarctica, J. Geophys. Res.-Atmos., 115, D14107, https://doi.org/10.1029/2009JD013410, 2010. a
Sommer, S., Wagenbach, D., Mulvaney, R., and Fischer, H.: Glacio-chemical study spanning the past 2 kyr on three ice cores from Dronning Maud Land, Antarctica: 2. Seasonally resolved chemical records, J. Geophys. Res.-Atmos., 105, 29423–29433, https://doi.org/10.1029/2000JD900450, 2000. a
Steen-Larsen, H. C., Masson-Delmotte, V., Hirabayashi, M., Winkler, R., Satow, K., Prié, F., Bayou, N., Brun, E., Cuffey, K. M., Dahl-Jensen, D., Dumont, M., Guillevic, M., Kipfstuhl, S., Landais, A., Popp, T., Risi, C., Steffen, K., Stenni, B., and Sveinbjörnsdottír, A. E.: What controls the isotopic composition of Greenland surface snow?, Clim. Past, 10, 377–392, https://doi.org/10.5194/cp-10-377-2014, 2014. a
Steinhage, D., Nixdorf, U., Meyer, U., and Miller, H.: New maps of the ice thickness and subglacial topography in Dronning Maud Land, Antarctica, determined by means of airborne radio-echo sounding, Ann. Glaciol., 29, 267–272, https://doi.org/10.3189/172756499781821409, 1999. a, b
Stenni, B., Scarchilli, C., Masson-Delmotte, V., Schlosser, E., Ciardini, V., Dreossi, G., Grigioni, P., Bonazza, M., Cagnati, A., Karlicek, D., Risi, C., Udisti, R., and Valt, M.: Three-year monitoring of stable isotopes of precipitation at Concordia Station, East Antarctica, The Cryosphere, 10, 2415–2428, https://doi.org/10.5194/tc-10-2415-2016, 2016. a
Stenni, B., Curran, M. A. J., Abram, N. J., Orsi, A., Goursaud, S., Masson-Delmotte, V., Neukom, R., Goosse, H., Divine, D., van Ommen, T., Steig, E. J., Dixon, D. A., Thomas, E. R., Bertler, N. A. N., Isaksson, E., Ekaykin, A., Werner, M., and Frezzotti, M.: Antarctic climate variability on regional and continental scales over the last 2000 years, Clim. Past, 13, 1609–1634, https://doi.org/10.5194/cp-13-1609-2017, 2017. a
Harris Stuart, R., Faber, A.-K., Wahl, S., Hörhold, M., Kipfstuhl, S., Vasskog, K., Behrens, M., Zuhr, A. M., and Steen-Larsen, H. C.: Exploring the role of snow metamorphism on the isotopic composition of the surface snow at EastGRIP, The Cryosphere, 17, 1185–1204, https://doi.org/10.5194/tc-17-1185-2023, 2023. a
Studinger, M., Medley, B. C., Brunt, K. M., Casey, K. A., Kurtz, N. T., Manizade, S. S., Neumann, T. A., and Overly, T. B.: Temporal and spatial variability in surface roughness and accumulation rate around 88° S from repeat airborne geophysical surveys, The Cryosphere, 14, 3287–3308, https://doi.org/10.5194/tc-14-3287-2020, 2020. a, b, c
Town, M. S., Warren, S. G., Walden, V. P., and Waddington, E. D.: Effect of atmospheric water vapor on modification of stable isotopes in near-surface snow on ice sheets, J. Geophys. Res., 113, D24, https://doi.org/10.1029/2008JD009852, 2008. a
van der Wel, G., Fischer, H., Oerter, H., Meyer, H., and Meijer, H. A. J.: Estimation and calibration of the water isotope differential diffusion length in ice core records, The Cryosphere, 9, 1601–1616, https://doi.org/10.5194/tc-9-1601-2015, 2015. a
Vinther, B. M., Jones, P. D., Briffa, K. R., Clausen, H. B., Andersen, K. K., Dahl-Jensen, D., and Johnsen, S. J.: Climatic signals in multiple highly resolved stable isotope records from Greenland, Quaternary Sci. Rev., 29, 522–538, https://doi.org/10.1016/j.quascirev.2009.11.002, 2010. a
Wahl, S., Steen-Larsen, H. C., Reuder, J., and Hörhold, M.: Quantifying the Stable Water Isotopologue Exchange Between the Snow Surface and Lower Atmosphere by Direct Flux Measurements, J. Geophys. Res.-Atmos., 126, e2020JD034400, https://doi.org/10.1029/2020JD034400, 2021. a, b
Wesche, C., Weller, R., König-Langlo, G., Fromm, T., Eckstaller, A., Nixdorf, U., and Kohlberg, E.: Neumayer III and Kohnen Station in Antarctica operate by the Alfred Wegener Institute, Journal of large-scale research facilities JLSRF, 2, 1–6, https://doi.org/10.17815/jlsrf-2-152, 2016. a
Whillans, I. M.: Effect Of Inversion Winds On Topographic Detail And Mass Balance On Inland Ice Sheets, J. Glaciol., 14, 85–90, https://doi.org/10.3189/S0022143000013423, 1975. a, b, c, d
Zuhr, A. M., Münch, T., Steen-Larsen, H. C., Hörhold, M., and Laepple, T.: Local-scale deposition of surface snow on the Greenland ice sheet, The Cryosphere, 15, 4873–4900, https://doi.org/10.5194/tc-15-4873-2021, 2021. a, b, c
- Abstract
- Introduction
- Materials and methods
- Results
- Discussion
- Conclusions
- Appendix A: Height reference
- Appendix B: Pairwise correlations with interprofile spacing
- Appendix C: Slope inclination scales
- Appendix D: Relations between slope inclination, surface roughness and the accumulation rate
- Data availability
- Author contributions
- Competing interests
- Disclaimer
- Acknowledgements
- Financial support
- Review statement
- References