the Creative Commons Attribution 4.0 License.
the Creative Commons Attribution 4.0 License.
 | 26 Jan 2023
Impact of icebergs on the seasonal submarine melt of Sermeq Kujalleq
Karita Kajanto
Fiammetta Straneo
Kerim Nisancioglu
The role of icebergs in narrow fjords hosting marine-terminating glaciers in Greenland is poorly understood, even though iceberg melt results in a substantial freshwater flux that can exceed the subglacial discharge. Furthermore, the melting of deep-keeled icebergs modifies the vertical stratification of the fjord and, as such, can impact ice–ocean exchanges at the glacier front. We model an idealised representation of the high-silled Ilulissat Icefjord in West Greenland with the MITgcm ocean circulation model, using the IceBerg package to study the effect of submarine iceberg melt on fjord water properties over a runoff season, and compare our results with available observations from 2014. We find the subglacial discharge plume to be the primary driver of the seasonality of circulation, glacier melt and iceberg melt. Furthermore, we find that melting of icebergs modifies the fjord in three main ways: first, icebergs cool and freshen the water column over their vertical extent; second, iceberg-melt-induced changes to fjord stratification cause the neutral buoyancy depth of the plume and the export of glacially modified waters to be deeper; third, icebergs modify the deep basin, below their vertical extent, by driving mixing of the glacially modified waters with the deep-basin waters and by modifying the incoming ambient waters. Through the combination of cooling and causing the subglacial-discharge-driven plume to equilibrate deeper, icebergs suppress glacier melting in the upper layer, resulting in undercutting of the glacier front. Finally, we postulate that the impact of submarine iceberg melt on the neutral buoyancy depth of the plume is a key mechanism linking the presence of an iceberg mélange with the glacier front, without needing to invoke mechanical effects.
- Article
(5059 KB) - Full-text XML
-
Supplement
(982 KB) - BibTeX
- EndNote


Marine-terminating outlet glaciers contribute to approximately half of the mass loss from the Greenland Ice Sheet (Goelzer et al., 2020; Mankoff et al., 2020). These glaciers are sensitive to the conditions in the glacial fjords where they terminate (Straneo et al., 2013; Slater et al., 2019), and the ice–ocean interface remains the main source of uncertainty in the future sea-level contribution estimates from the Greenland Ice Sheet (Goelzer et al., 2020). Increased ice loss from the ice sheet, in turn, leads to increased freshwater discharge into the North Atlantic, with the potential of altering the ocean circulation (Böning et al., 2016) and local marine ecosystems (Meire et al., 2017). Key to understanding the drivers of ice sheet change and the impact on the ocean is understanding water mass transformation and circulation in glacial fjords (Straneo and Cenedese, 2015). Unfortunately, these processes tend to be under-observed because of the challenges in making measurements in these remote and ice-covered regions (Straneo et al., 2019). Thus, fjord models parameterising the ice–ocean processes have been instrumental in understanding both ocean-driven melting of the glaciers and the export of meltwater (Jenkins, 2011; Sciascia et al., 2013; Carroll et al., 2017).
Until recently, models have ignored the impact of the many icebergs present in these fjords on fjord dynamics, meltwater export and glacier melting (Gladish et al., 2015; Carroll et al., 2017). However, many of the fast-flowing, marine-terminating glaciers in Greenland discharge the majority of their ice through the calving of icebergs (Mouginot et al., 2019; Wood et al., 2021), and recent studies show that iceberg melt can be a dominant freshwater source to the fjord for most of the year (Enderlin et al., 2016; Moon et al., 2018). A large fraction of the icebergs melt within the fjord (Moyer et al., 2019; Mortensen et al., 2020), releasing freshwater below the surface (Moon et al., 2018), with potential impacts both on the vertical stratification and on the circulation (Hughes, 2022). Subglacial-discharge-driven buoyant plumes are considered the key drivers of circulation within glacial fjords (Sciascia et al., 2013; Carroll et al., 2017), and the accompanying high glacier melt rate is significant for the dynamics at the ice–ocean interface (Slater et al., 2016; D. A. Slater et al., 2017a, b; Slater et al., 2018). Plumes are sensitive to the water column properties within the fjord, which directly impact the plume melt rate and the neutral buoyancy depth of the plume (Jenkins, 2011; Cowton et al., 2015). This implies that iceberg-induced changes in the hydrography of the fjord have the potential to impact both the direct melt of the glacier front and the properties of the plume. Moreover, the height reached by the plume along the glacier terminus has the potential to increase undercutting and thus impact the shape of the terminus, which again can cause further changes in the calving of the glacier front (D. A. Slater et al., 2017a; Slater et al., 2021). For marine-terminating glaciers, rigid iceberg mélange is interpreted to provide mechanical support, or buttressing, that suppresses calving (Joughin et al., 2008; Amundson et al., 2010; Burton et al., 2018; Joughin et al., 2020), since observations indicate a correlation between rigid iceberg mélange in front of a glacier and suppressed calving (Joughin et al., 2020). However, due to the lack of a comprehensive understanding of both calving and iceberg mélange, the dynamics controlling the iceberg mélange and its impact on buttressing and iceberg calving remain speculative.
Recent advances in including icebergs in fjord-scale ocean circulation models (Davison et al., 2020, 2022) show that buoyant meltwater from icebergs can drive circulation within the fjord and that iceberg melt can take up almost all available heat for melting and significantly freshen the upper layer of the fjord. Davison et al. (2022) find that the response of a fjord basin to iceberg-induced modification is reversed from warming to cooling when the sill is shallower than the deepest iceberg keels. However, they do not describe the processes causing this. Furthermore, Davison et al. (2022) find that icebergs reduce the overall melt of the glacier front but find little impact of icebergs on a single point-source plume. We find that the dynamics and the interactions between icebergs and the plume merit further study due to the potential significance for the response of marine-terminating glaciers to changes in calving.
In this study, we investigate how icebergs modify the seasonal stratification and circulation in a glacial fjord with a shallow sill. In particular, we are interested in how the presence of icebergs in the fjord impacts the melt of the glacier front. We construct an idealised model of the shallow-silled Ilulissat Icefjord, an iceberg-congested fjord in West Greenland. We apply the IceBerg toolbox (Davison et al., 2020) within the MITgcm ocean circulation model (Marshall et al., 1997) to include iceberg melt and quantify its impact on fjord stratification and circulation. We prescribe the seasonal evolution of the subglacial discharge from winter to the end of summer and characterise the role icebergs play in each phase of the runoff season. We study the sensitivity of the model to the distribution and draft of the icebergs, and the configuration of the subglacial discharge plume. The results are compared with available observational data from the fjord. Finally, we summarise and discuss the impact the icebergs have on the discharge of Sermeq Kujalleq (Jakobshavn Isbræ) and consider the implications for the future response of the glacier in a warming climate.
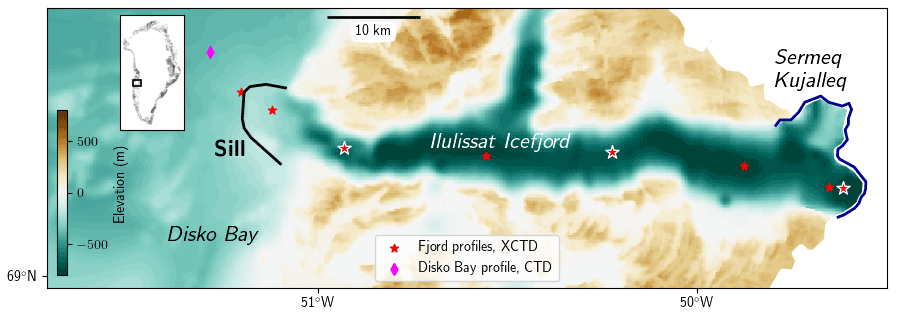
Figure 1Map of Ilulissat Icefjord, indicating the sill (black line) and Sermeq Kujalleq front location (blue line) in 2014. XCTD profile locations are marked with red stars, and the CTD profile location used for the boundary condition is marked with a pink diamond, all obtained in August 2014 (Beaird et al., 2017). Next-to-glacier, mid-fjord and close-to-sill profiles used in result plots are marked with a white outline. Bathymetry and topography are from BedMachine v3 (Morlighem et al., 2017).
Ilulissat Icefjord (also known as Kangia) is a 50 km long east–west-oriented fjord at the eastern edge of Disko Bay, West Greenland (also known as Qeqertarsuup tunua) (Fig. 1). The terminus of the fastest-flowing glacier of Greenland, Sermeq Kujalleq (also known as Jakobshavn Isbræ), is located at the eastern end of Ilulissat Icefjord. Sermeq Kujalleq is the most rapidly calving glacier of the Greenland Ice Sheet: during the high-discharge years of 2004–2014, its calving rate was estimated to reach over 55 Gt a−1 in the height of summer (Mankoff et al., 2020). The sill at the mouth of Ilulissat Icefjord is relatively high – approx. 250 m – compared to the fjord depth, which is 700–800 m (Morlighem et al., 2017). Iceberg drafts can reach down to 400–500 m (Enderlin et al., 2016), causing these large icebergs to spend substantial amounts of time on the sill, before melting enough to exit over the sill into Disko Bay. The high calving rate in combination with the high sill leaves the fjord clogged with icebergs, making the fjord difficult to study, as it is inaccessible by boat most of the year. However, expendable conductivity–temperature–depth (XCTD) instruments and instrumented seals provide observational data for peak and late summer (Gladish et al., 2015; Mernild et al., 2015; Fenty et al., 2016; Beaird et al., 2017).
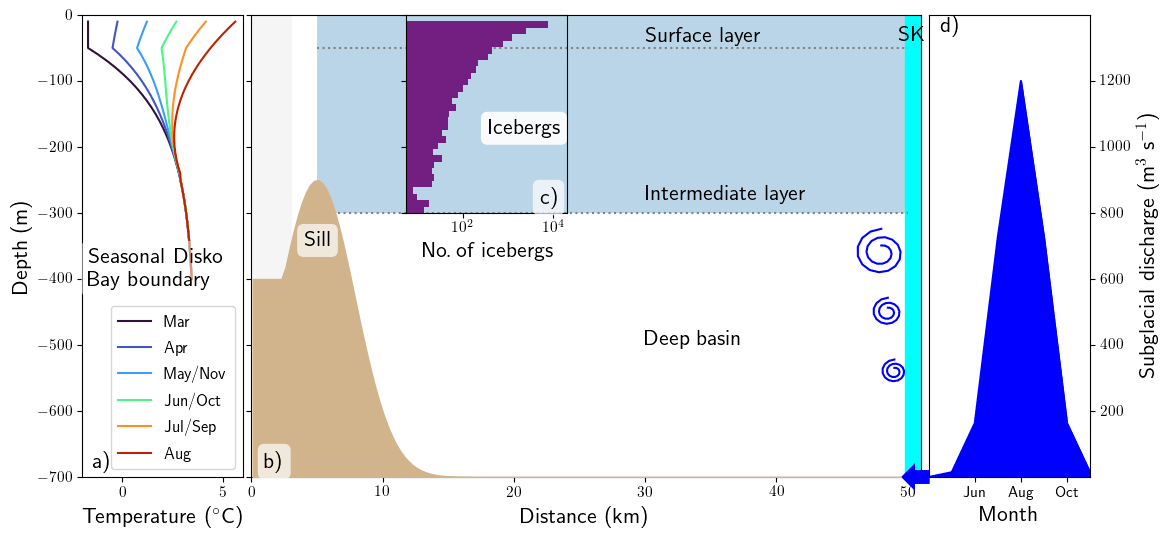
Figure 2Model domain and forcings: (a) Disko Bay temperature boundary condition from March to August. (b) A 2D section of the model domain: blue shading indicates iceberg extent; dotted lines separate vertical layers used in describing the results; light grey shading indicates the OBCS sponge layer where the western boundary is restored to the boundary conditions; the vertical turquoise block to the east indicates the vertical front of Sermeq Kujalleq (“SK”). (c) Number of icebergs of each depth at 10 m intervals. (d) Monthly subglacial discharge forcing.
Observations indicate that the fjord can be described with three different layers: the surface layer (0–50 m), the intermediate layer (50–300 m) and the deep basin (300–800 m); see Fig. 2b. The dominant characteristic of the surface layer is that it is cold and fresh, due to melt of the iceberg mélange and a smaller contribution from surface runoff (Gladish et al., 2015; Mernild et al., 2015; Beaird et al., 2017; Mojica et al., 2021). The intermediate layer is a weakly stratified layer of glacially modified water (GMW) – a mixture of ambient water, subglacial discharge and submarine meltwater – where the lower portion of the large icebergs resides (Beaird et al., 2017; Mojica et al., 2021). The deep basin is below the extent of most icebergs and contains the warmest and most saline water in the fjord (Gladish et al., 2015; Mernild et al., 2015; Beaird et al., 2017; Mojica et al., 2021), with water temperature varying interannually within 1.5–3 ∘C (Gladish et al., 2015; Khazendar et al., 2019). There is little information on the seasonality of water properties or circulation within the fjord (Mernild et al., 2015), but the conventional idea is that basin water renewal by warm water over the sill takes place only during summer and is driven by the subglacial discharge plume (Gladish et al., 2015; Carroll et al., 2017; Khazendar et al., 2019).
The high sill of Ilulissat Icefjord acts as a barrier in both directions, isolating the basin from the warmest and most saline water in Disko Bay while blocking large icebergs from leaving the fjord. Both Gladish et al. (2015) and Beaird et al. (2017) find a sharp gradient in the surface layer properties at the sill, as the cold and fresh surface conditions in the fjord switch to the relatively warm summer conditions of Disko Bay. Seasonal profiles from Disko Bay, close to Qeqertarsuaq on Disko Island, roughly 100 km west of Ilulissat Icefjord, show a strong seasonal signal, reaching down to 300 m depth, with significant warming and freshening during the summer and slow cooling during winter (Fig. S1 in the Supplement) (Greenland Ecosystem Monitoring, 2020). Summer profiles obtained west of the sill demonstrate a similarly strong summer surface warming (Fig. S1) (Beaird et al., 2017).
We use the Massachusetts Institute of Technology general circulation model, MITgcm, which solves the incompressible Navier–Stokes equations with finite-volume methods (Marshall et al., 1997). We use an idealised, hydrostatic, high-silled fjord setup in MITgcm (Marshall et al., 1997), illustrated in Fig. 2, based on Ilulissat Icefjord. The domain is a rectangular east–west-oriented fjord that has a high sill at the fjord entrance and a vertical glacier front at the eastern end. The domain is 50 km long and 8.5 km wide, and the sill is located at 5 km from the western boundary. The fjord is 700 m deep, the sill 250 m deep and the area west of the sill representing Disko Bay 400 m. Grid resolution is 312.5 m × 400 m × 10 m (Δx, Δy, Δz). The model is three dimensional; however, we focus on the along-fjord evolution and do not include rotation. We use the lateral dimension primarily for icebergs and plume width considerations. We run the model for 3 months with winter conditions, followed by a forward run with varying seasonal forcings (Figs. 2 and S2 in the Supplement).
The vertical glacier front is represented with the MITgcm IcePlume package (Cowton et al., 2015) that computes melt from the glacier front both with and in the absence of a subglacial discharge plume. The subglacial discharge outlet width is a key parameter of the model, since it determines the width of the plume and contributes to the melt rate and the neutral buoyancy depth (Jenkins, 2011). It is also a key uncertainty of our model, which we will discuss further in the sensitivity experiments in Sect. 4.4. Henceforth, we also refer to the subglacial discharge outlet width as plume width, since these widths are equal in our model. In 1985, the base of the floating tongue of Sermeq Kujalleq at the time showed a single wide channel (Motyka et al., 2011). The front has retreated more than 10 km since then and is now vertical, with two branches, although the southern branch is likely a much larger contributor to subglacial discharge. A large volume of surface runoff, as in the Sermeq Kujalleq catchment, does suggest a high degree of subglacial channelling and thus a narrow plume (Cuffey and Paterson, 2010). However, an investigation in a West Greenland fjord (Jackson et al., 2017) found that model–observation agreement was greatest when using a 200 m wide line plume, rather than a point-source plume. Cavanagh et al. (2017) find that large portions of the surface runoff of Sermeq Kujalleq drain through both shear margins relatively close to the front, which suggests that there could also be subglacial discharge outlets at the lateral margins. The model study by Cook et al. (2021) of the subglacial drainage and discharge from Store Glacier, West Greenland, shows that the degree of channelisation can vary significantly within the year, due to the evolution of the subglacial drainage system. In the case of low channelisation, the transport of subglacial discharge is laterally distributed. The absence of observations of the plume of Sermeq Kujalleq itself points towards laterally distributed discharge (D. Slater et al., 2017). In the absence of direct information, we assume that there is likely a wider subglacial discharge outlet at the 100 m scale but potentially also side outlets and that the degree of channelisation can vary due to the melt season, impacting the lateral distribution of the subglacial discharge.
Table 1Experiment naming and key parameters. IB denotes iceberg.
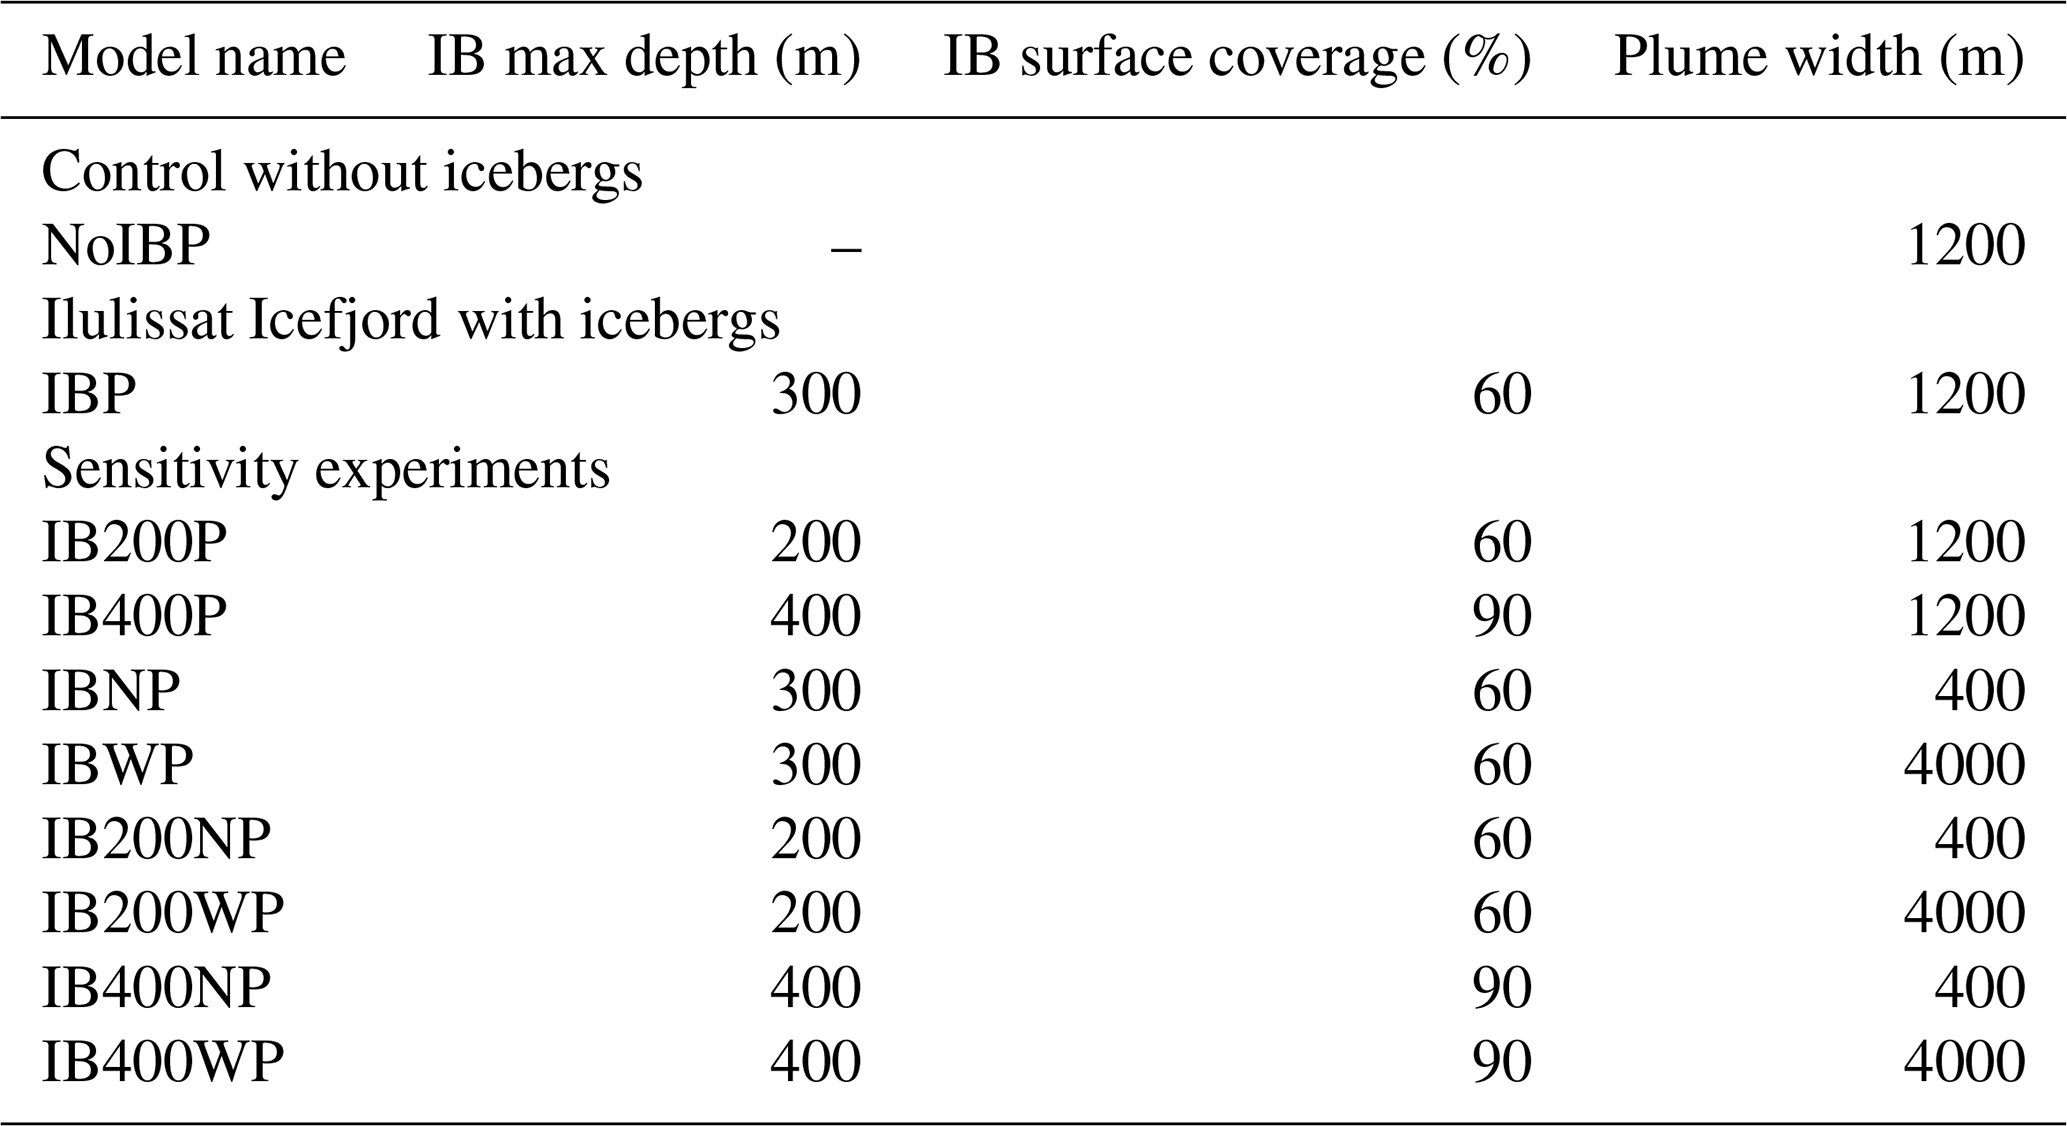
Here, we choose a 1.2 km wide sheet plume (Jenkins, 2011) as our default (spanning three grid cells, indicated with “P” in experiments IBP, NoIBP, IB200P and IB400P in Table 1), and for simplicity, the plume width is kept constant during each experiment. This is a middle-ground assumption, taking into account the likely variation in the degree of channelisation during the season and potential side outlets, which are all described with a single wider plume. To account for uncertainty in the plume width, we run sensitivity experiments with two additional plume widths: a wide plume of 4 km (IB200WP, IBWP and IB400WP in Table 1) and a narrow plume of 400 m (IB200NP, IBNP and IB400NP in Table 1). The wide plume corresponds to a situation where there is subglacial discharge along the whole southern branch of the glacier's calving front, while the narrow plume assumes that all runoff is routed into a single subglacial channel. We assume idealised, symmetric Gaussian seasonality of the subglacial discharge from May to November, peaking in August (Fig. 2d). We acknowledge that a small amount of discharge is also plausible in winter (Cook et al., 2021); however, for simplicity, we assume zero subglacial discharge during the winter. The maximum volume flux is set to 1200 m3 s−1, based on estimates by Enderlin et al. (2016) that the peak might reach up to 1200–1300 m3 s−1 in Sermeq Kujalleq. Nevertheless, uncertainty in the subglacial discharge volume is small compared to the uncertainty in the plume width.
We choose to impose no air–sea fluxes, similarly to Gladish et al. (2015) and Davison et al. (2020), as our primary focus is on subsurface processes. However, the seasonal surface forcing is partially accounted for by the Disko Bay boundary conditions. We also ignore the contribution from surface runoff, which we expect to mainly have an effect on the surface salinity in the fjord (Mernild et al., 2015). In the model, the western boundary is restored to idealised temperature and salinity profiles representing Disko Bay, using a 3.2 km long sponge layer of the OBCS package (Fig. 2b). The restoration timescale within the sponge layer ranges from 17 h on the outer boundary to up to 1 month on the inner boundary (see Fig. S2). A volume equal to the subglacial discharge is allowed to exit from the western boundary to ensure conservation of mass.
The summer boundary conditions replicate a conductivity–temperature–depth (CTD) profile taken in Disko Bay on August 2014, outside of the sill (Beaird et al., 2017) (pink diamond in Fig. 1). The winter boundary condition replicates observed profiles close to Qeqertarsuaq, further out in Disko Bay in 2018, available down to 150 m depth (Greenland Ecosystem Monitoring, 2020) (Fig. S1), below which we assume that the winter and summer conditions merge. As a consequence, seasonality is applied only above sill depth, and water properties at the sill depth are constant throughout the experiments (Figs. 2a and S1). In addition, we adjust salinity at sill depth to the highest value observed at depth in the fjord (Beaird et al., 2017) to ensure our boundary conditions allow for a sufficiently saline inflow to the fjord. Monthly boundary conditions are created by interpolating linearly between the winter and summer profiles (Fig. 2a). We initialise the fjord above sill depth with the winter profile and with constant temperature and salinity below sill depth, leading to no density gradient over the sill (Fig. S2). We do not include sea ice formation, since we do not expect it to play a major role during the melt season.
We implement the iceberg forcing with the IceBerg package of MITgcm, presented in Davison et al. (2020). In this package, the fjord is filled with a randomly created block iceberg distribution following a power law of exponent −2.1, derived for Ilulissat Icefjord icebergs (Enderlin et al., 2016). We define the minimum and maximum iceberg depth and the surface area coverage. Heat uptake due to iceberg melt and the accompanying negative salinity flux are then computed from each iceberg face, similarly to the sub-grid approach of Cowton et al. (2015), resulting in cell-averaged fluxes that force the ocean model. The effect of velocity on melt rate is taken into account by considering the flow field in each computational cell with respect to the iceberg face orientation (Davison et al., 2020). The effect of iceberg drift velocity – the average water velocity from the fjord surface to the iceberg keel depth – on iceberg melt is included, noting that there is little rigid mélange observed in 2014 (Joughin et al., 2020). The iceberg distribution remains fixed during the calculation, and the volume the icebergs uptake is accounted for in each computational cell occupied by icebergs. Other physical aspects, such as iceberg size decrease due to melt or the sub-grid-scale flow icebergs create, are not included. Surface melt of icebergs above sea level is not included and nor are deterioration mechanisms other than submarine melt.
Enderlin et al. (2016) find for Ilulissat Icefjord that there are often a significant number of icebergs with estimated draft deeper than 200 m but rarely many icebergs with drafts deeper than 400 m. Our default iceberg distribution covers uniformly 60 % of the surface area of the fjord from the highest point of the sill to the glacier (grey area in Fig. 2b), with an iceberg depth distribution from 10–300 m (Fig. 2c, experiments IBP, NoIBP, IBWP and IBNP in Table 1). To account for uncertainty in the iceberg distribution, we run two sets of sensitivity experiments with deeper and shallower icebergs (Fig. 10c). The deeper-iceberg distribution has a maximum depth of 400 m and a high surface coverage of 90 %, which is needed to fit the power law because deeper icebergs also mean more small icebergs (IB400WP, IB400P and IB400NP in Table 1). The shallow distribution has a maximum depth of 200 m and a surface coverage of 60 %, leading to a larger number of small icebergs than in the default distribution (IB200WP, IB200P and IB200NP in Table 1). For a comprehensive list of all model parameters, see Table S1 in the Supplement.

Figure 3Along-fjord temperature sections of Ilulissat Icefjord with icebergs (e–h, IBP) and without icebergs (a–d, NoIBP), for the winter (March), early season (June), peak summer (August) and late season (October), as a snapshot along the centreline of the fjord. (i) Observed temperature section from XCTD data in August 2014 (Beaird et al., 2017), interpolated from XCTD locations marked in Fig. 1. Red contours mark the isopycnals of 26.3, 26.5, 26.7 and 26.9 kg m−3. Black arrows indicate the centreline of the outflow of glacially modified water from the plume (see also Fig. 4).
We run our idealised Ilulissat Icefjord model, IBP, with monthly varying Disko Bay temperature and salinity, subglacial discharge, and a constant iceberg distribution (see Fig. 2) over a synthetic runoff season described in Sect. 3. We compare the results to a control experiment with no icebergs, NoIBP – otherwise identical to IBP, to investigate the impact icebergs have on fjord properties, circulation and the glacier melt rate. Our experiments start from the prescribed winter conditions of the fjord (Fig. 2a), before the onset of Disko Bay surface warming and the increase in subglacial discharge. We present results for the early season (May–June), peak (July–August–September) and late season (October–November).
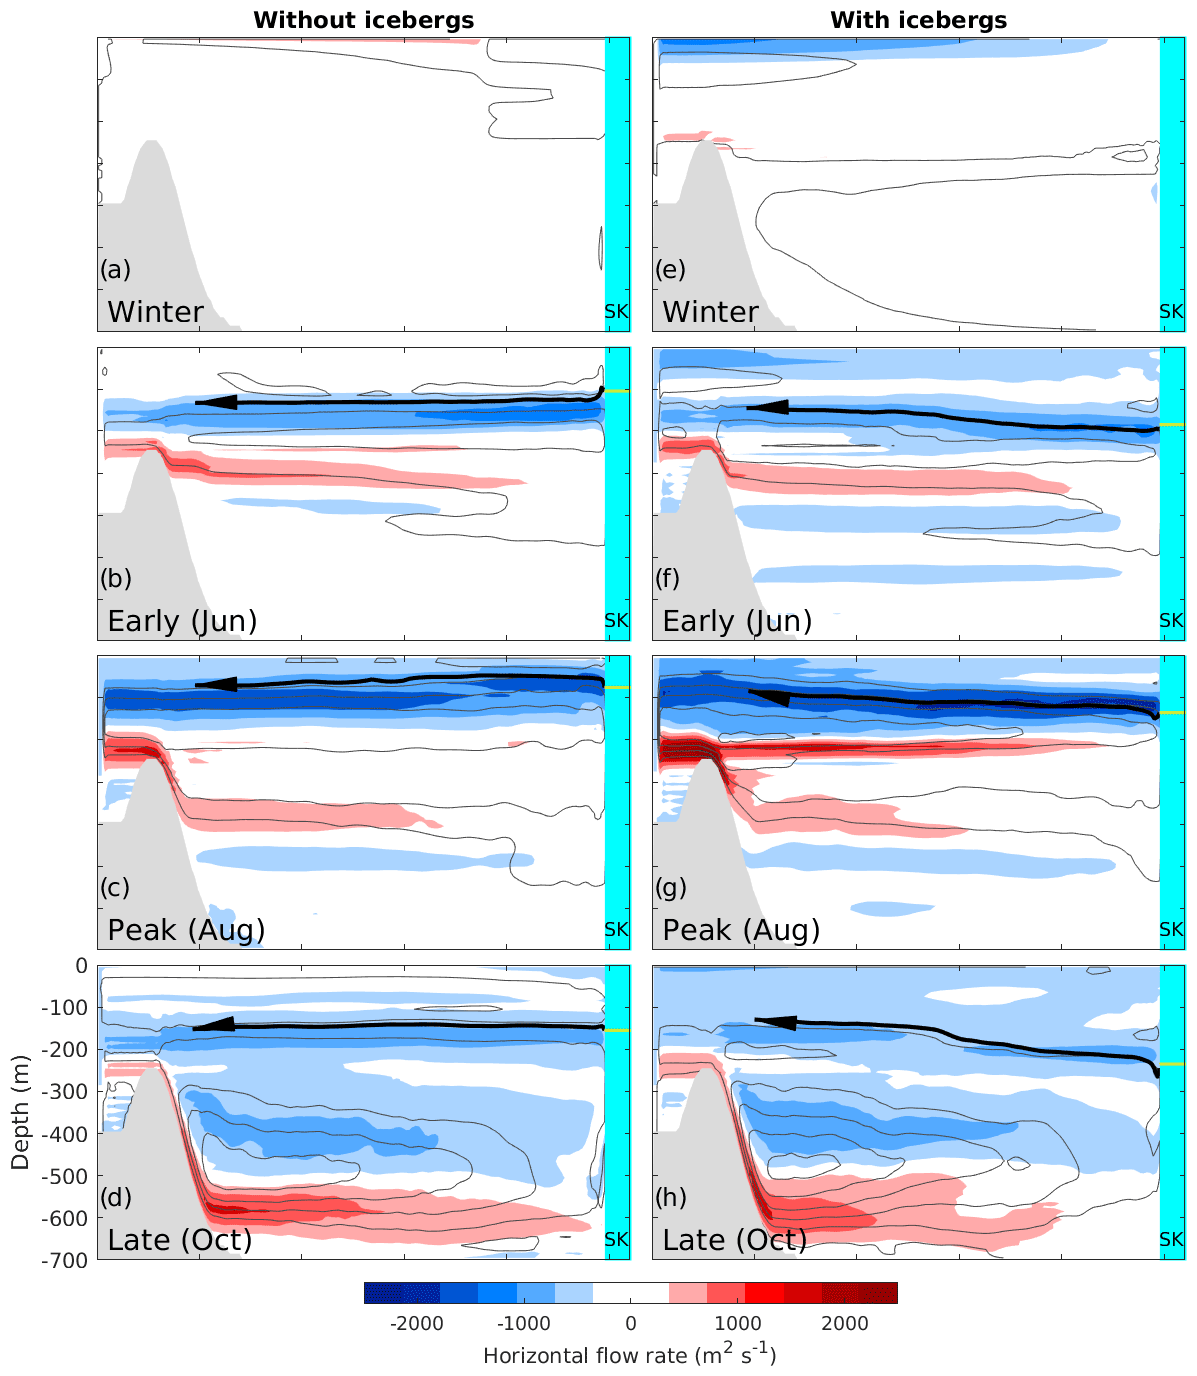
Figure 4Snapshots of the horizontal flow rate along the fjord for the winter (March), early (June), peak (August) and late (October) season, without icebergs (NoIBP, a–d) and including icebergs (IBP, e–h). Black arrows indicate the centreline of the GMW outflow from the plume and grey contours streamlines of the horizontal flow rate at 0.02 m3 d−1 intervals. The horizontal orange line marked on the pale blue glacier front indicates the neutral buoyancy depth of the plume.
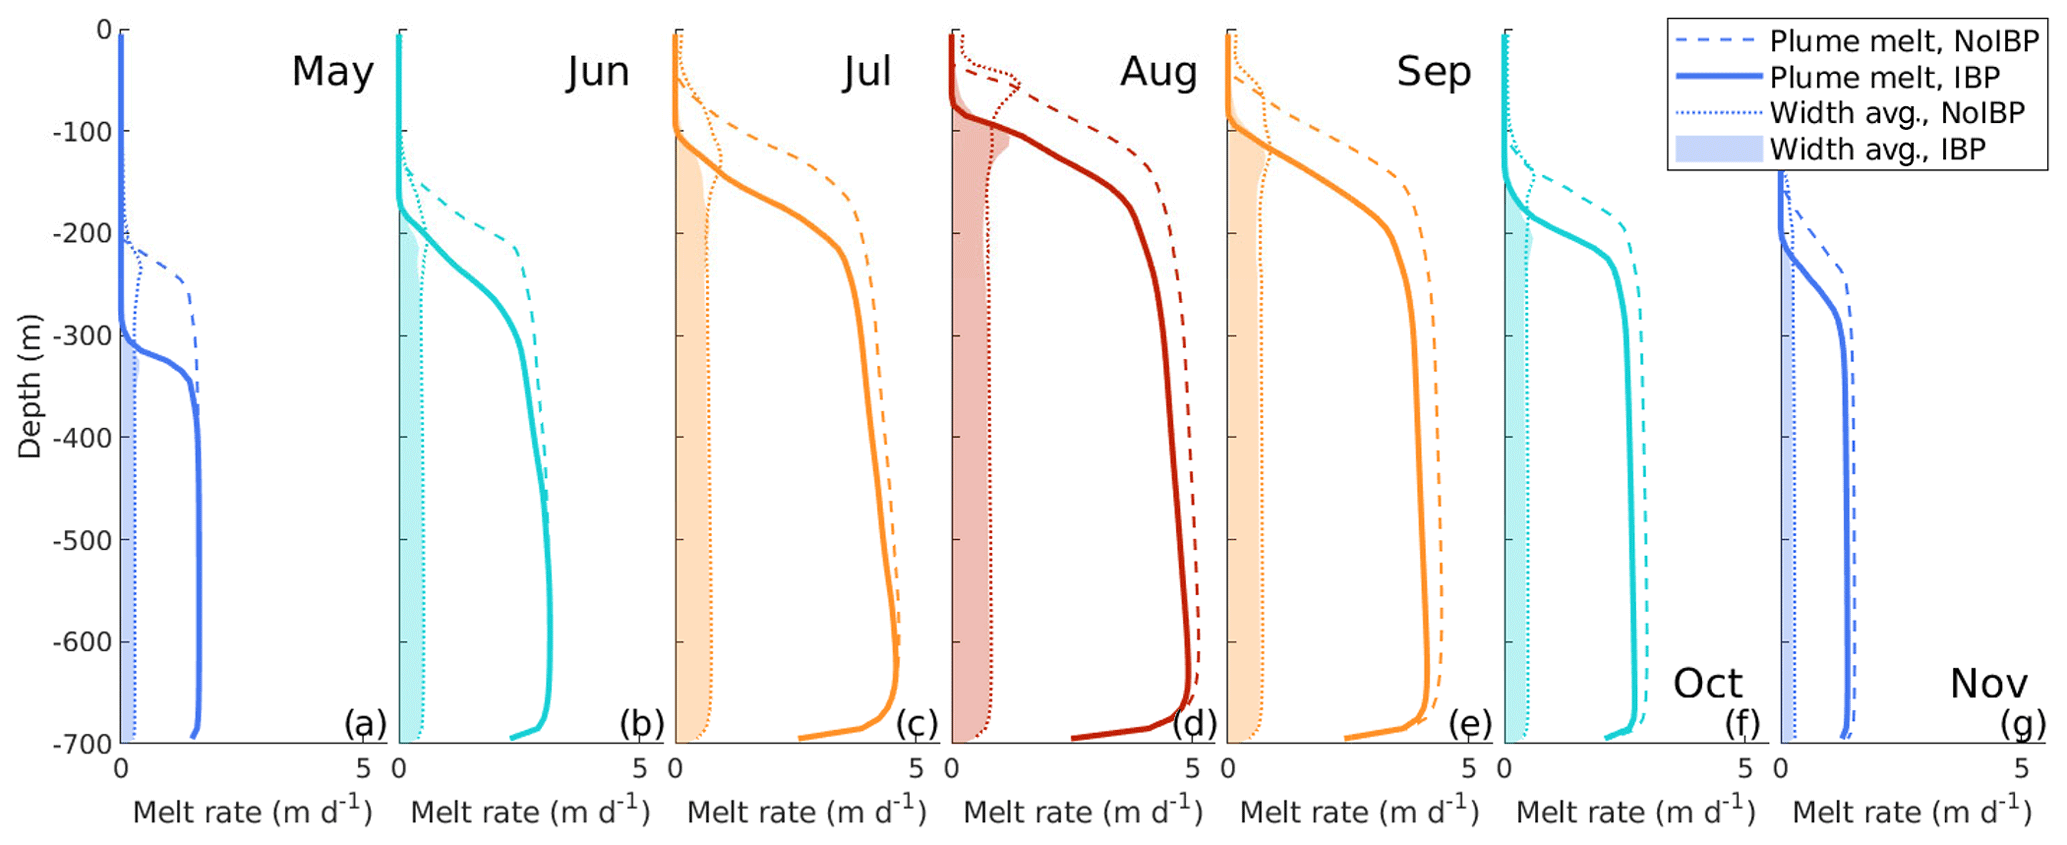
Figure 5Seasonality of the plume melt rate and width-averaged frontal melt rate throughout the runoff season for both NoIBP (dashed line, dotted line) and IBP (solid line, shaded area).
4.1 Seasonality without icebergs
4.1.1 Winter and early season
We consider first the seasonality in Ilulissat Icefjord in the control experiment, NoIBP, without icebergs but including the plume. Above the sill, winter conditions in the fjord are dominated by the cold Disko Bay boundary condition, while below the sill, properties remain virtually constant, since there is little circulation in the deep basin (Figs. 3a, 4a and S2). In the model, spring starts in April with a warming and freshening in Disko Bay (Figs. 2a and S1), increasing the surface temperature in the fjord (Fig. 3b). In May, the runoff season starts with a small subglacial discharge (Fig. 2d). Subglacial discharge creates a buoyant plume that ascends vertically along the glacier front, until it reaches neutral buoyancy relative to the fjord water properties (red lines in Fig. 4), and transforms into horizontal outflow of GMW (black arrows in Figs. 3 and 4), which is compensated for by inflow over the sill (Fig. 4b). We define the GMW outflow as streamlines originating from the computational cell wherein the plume reaches neutral buoyancy (black arrows in Figs. 3, 4 and S7 in the Supplement). The neutral buoyancy depth is at 225 m in May and at 105 m in June. Due to the deep neutral buoyancy depth in the early season, the GMW outflow partly exits over the sill and partly mixes and returns with the inflow to the basin (Figs. 4b and S7), slightly cooling and freshening the deep basin (Fig. 8). This mixing back into the deep basin at the sill is defined as sill-driven reflux in Hager et al. (2022). The plume melt rate is low during the early season due to the small volume of subglacial discharge, and plume melt is vertically limited due to the relatively deep neutral buoyancy depth (Fig. 5a and b).
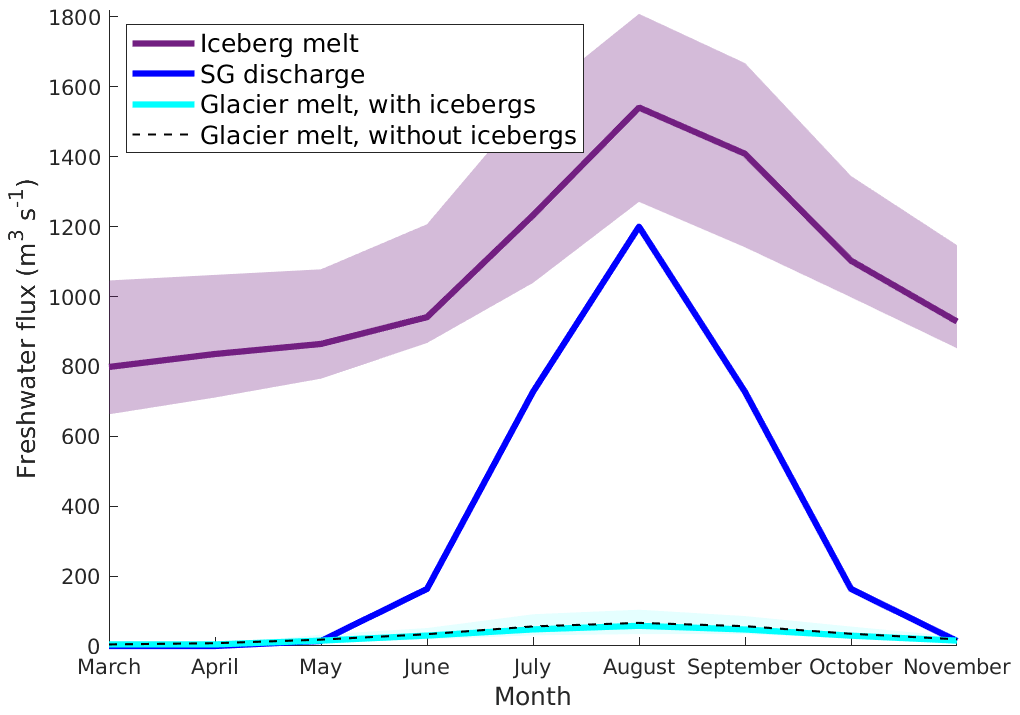
Figure 6Modelled seasonality of freshwater volume fluxes into Ilulissat Icefjord from three different sources: icebergs (IBP, purple), subglacial discharge forcing (blue line) and glacier melt for NoIBP (dashed black line) and IBP (pale blue). Shadings indicate the range covered by the sensitivity experiments (see Table 1 and Sect. 4.4).
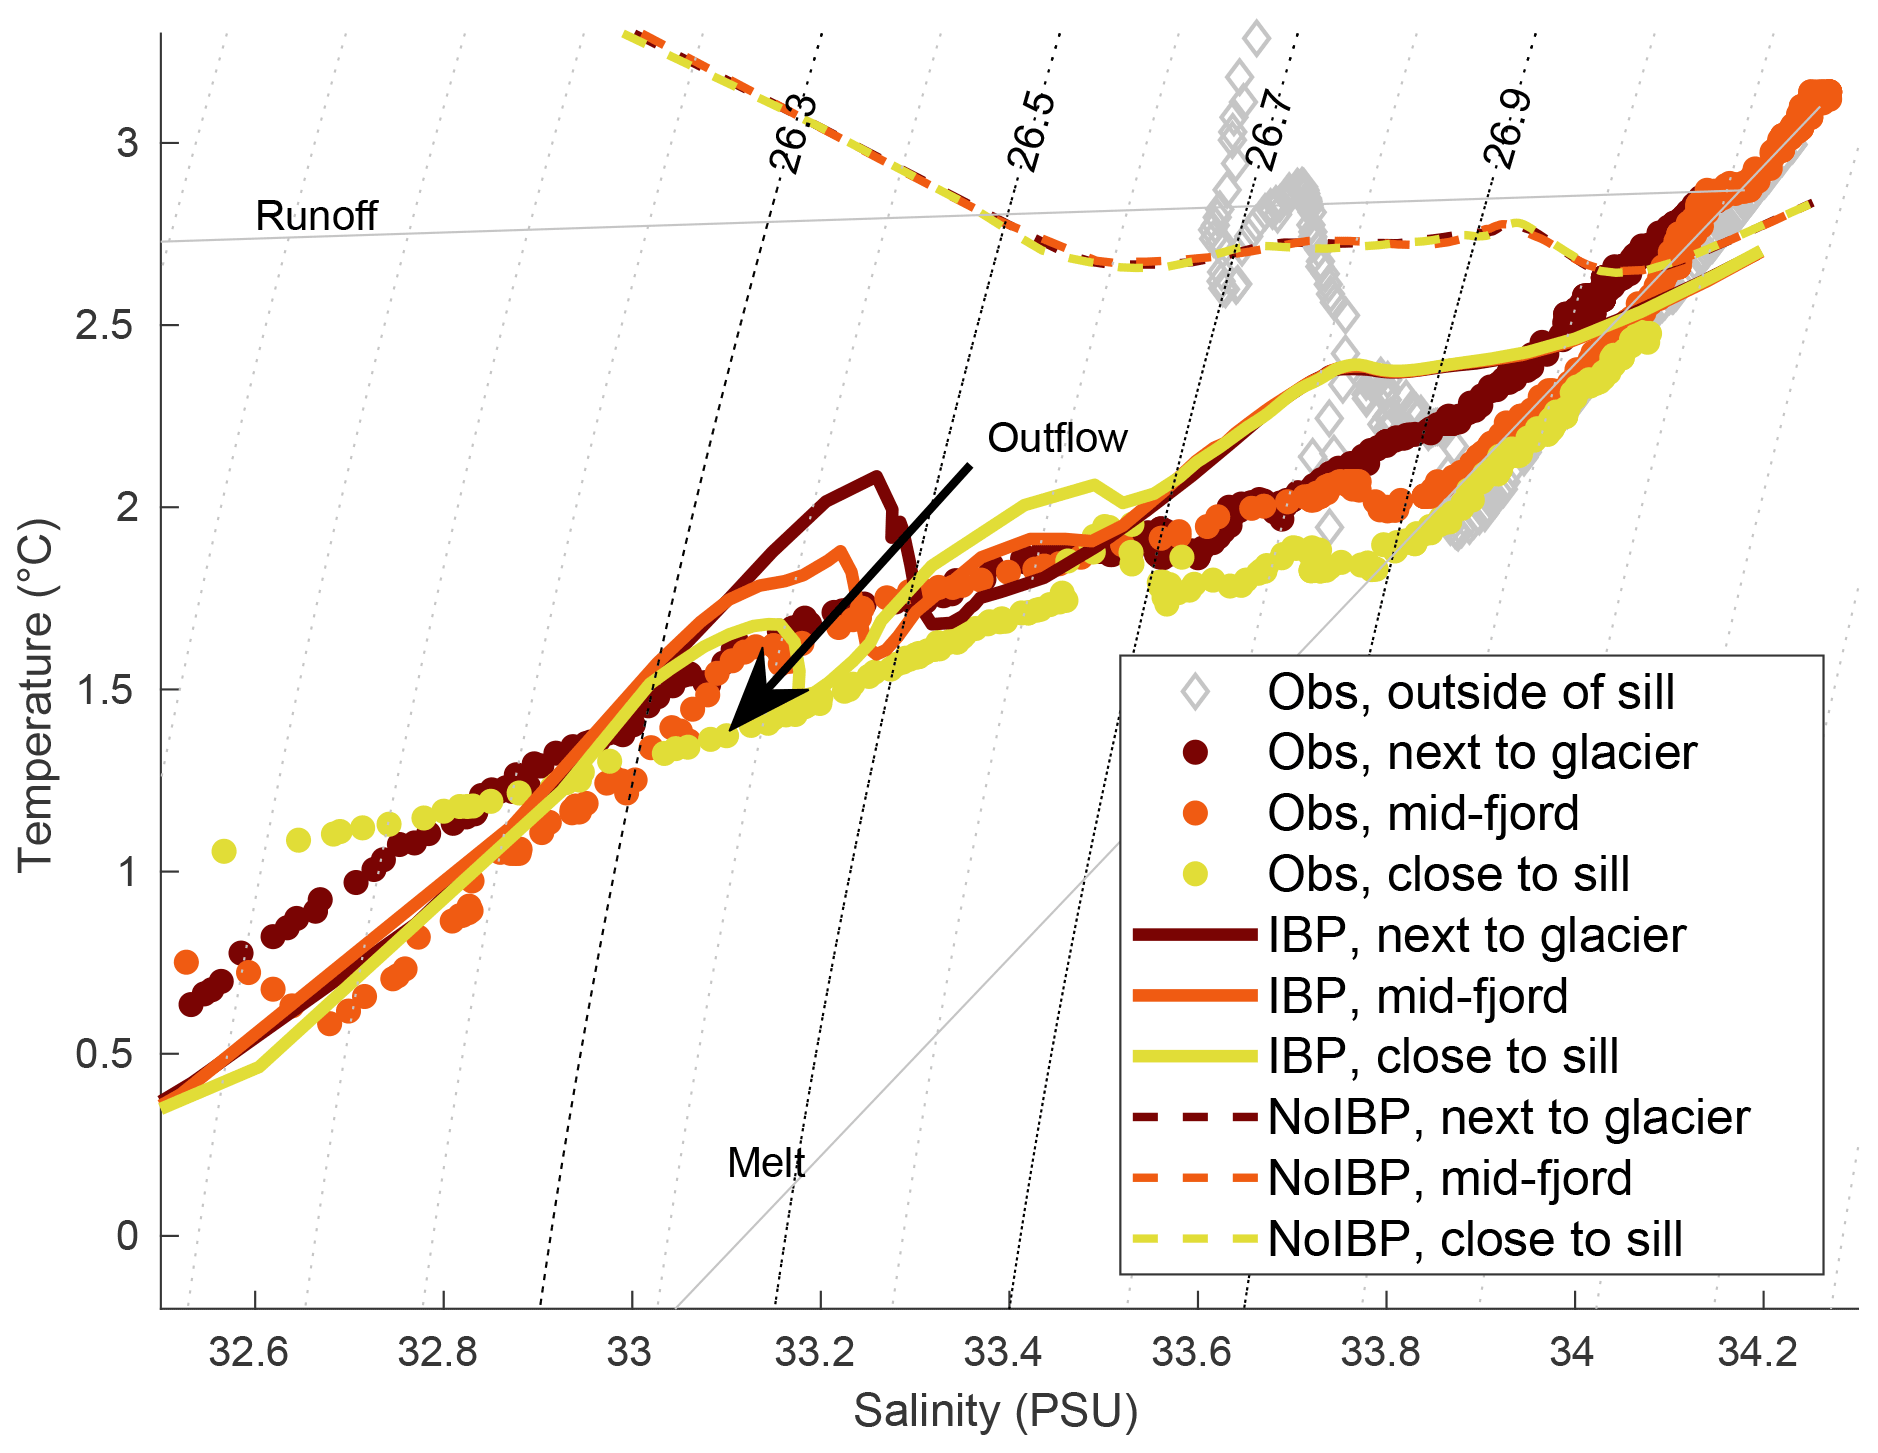
Figure 7August potential temperature versus salinity next to the glacier (brown), mid-fjord (orange) and close to the sill (yellow), for observations (circles) (Beaird et al., 2017), IBP (solid lines) and NoIBP (dashed lines), with runoff and melt lines (grey lines) and isopycnals (dotted grey lines). Dotted grey contours indicate isopycnals at 0.1 kg m−1 intervals, with 26.3, 26.5, 26.7 and 26.9 kg m−1 indicated in black (also plotted in Fig. 3).

Figure 8Mid-fjord temperature and salinity profiles for March (winter), June (early season), August (peak season) and October (late season) for both IBP (solid lines) and NoIBP (dashed lines). Grey circles indicate the XCTD profiles in August 2014 (Beaird et al., 2017). The dotted horizontal line marks 195 m depth, which coincides in IBP with isopycnal 26.5 kg m−3 and the inflow–outflow border in August and in the observations with isopycnal 26.9 kg m−3. The mid-fjord location is indicated with a red star and vertical dotted lines in Figs. 3 and 1 and as an outlined red star in Fig. 1.
4.1.2 Peak season
During the peak season, subglacial discharge volume is high, the plume rises up to 75 m depth and the GMW outflow is able to exit over the sill, with a compensating inflow bringing Disko Bay water into the deep basin (Fig. 4c). Since the GMW outflow exits over the sill during peak season, modification in the deep basin, below the 26.9 kg m−3 isopycnal, is the result of early-season sill-driven reflux (Figs. 3c and 7). This early-season refluxing causes a cooling of 0.2 ∘C in the deep basin by peak summer (Figs. 3c and 8). Meanwhile, the surface layer is 2 ∘C cooler compared to the Disko Bay surface layer, due to mixing with plume water. Overall, glacial modification leads the entire fjord to be almost uniformly 3 ∘C in peak summer (Fig. 3c). The freshwater flux into the fjord consists of 96 % subglacial discharge and only 4 % melt from the glacier front (Fig. 6). The plume melt rate reaches up to 5.1 m d−1 in peak summer and extends vertically close to the surface (Fig. 5c–e).
4.1.3 Late season
During the late season the subglacial discharge decreases again, and the surface of Disko Bay starts to cool down (Fig. 2a and d). The deep basin has freshened due to the early-season refluxing of GMW, and density-driven renewal of deep-basin water begins to dominate (Fig. 4d). Due to smaller subglacial discharge, the plume reaches neutral buoyancy deeper, and the correspondingly deeper GMW outflow again causes refluxing at the sill (Figs. 4d and S7). In spite of the refluxing, the basin starts to return to more saline conditions (Figs. 3d and 8). The plume melt rate also decreases as the subglacial discharge decreases, in both magnitude and vertical extent. However, the early and late seasons are not symmetrical despite the identical subglacial discharge, since the changed stratification of the fjord slightly decreases the maximum melt rate and the neutral buoyancy depth of the plume, from 105 m in the early season (June) to 155 m in the late season (October) (Figs. 3d and 4d). However, the cold surface and intermediate-layer conditions in the early season compared to the warm conditions in the late season balance out the differences in the melt rate (Fig. 5).
4.2 Impact of icebergs on the seasonality
4.2.1 Winter and early season
Introducing icebergs into the upper 300 m within the fjord leads to significant changes in both water properties and circulation. Since icebergs extend to the warm water layer throughout the year, there is a substantial freshwater flux from the icebergs, also during winter (Fig. 6). This fresh meltwater drives a weak mixing within the intermediate layer and surface during winter (Fig. 4e), which leads to no distinct thermocline and a notable freshening within the extent of the icebergs (Figs. 3f and 7). The stronger wintertime circulation also increases the frontal melt of the glacier to a total flux of 4.5 m3 s−1, compared to 0.7 m3 s−1 in NoIBP, although the freshwater flux from glacier melt is small compared to iceberg melt (Fig. 6).
Outflow of iceberg meltwater within the upper 100 m prevents warming within the surface layer of the fjord, which remains cold and increasingly fresh (Figs. 3f, 4f and 8). This additional outflow is compensated for by increased inflow over the sill compared to NoIBP (Fig. 4b and f). During the early season, wintertime changes in the stratification due to icebergs impact the neutral buoyancy depth of the plume: the plume equilibrates between 315–185 m depth in May to June, which is 80–120 m deeper in the water column than in NoIBP (Figs 4b and f and 5a and b). The GMW outflow starts out correspondingly deeper, but it is further modified by icebergs along the fjord and reaches the sill at a comparable depth to NoIBP and refluxes into the deep basin (Figs. 4f and S7). The changes in stratification and the neutral buoyancy depth of the plume are reflected in the plume melt rate; the peak melt rate value at depth is the same as in NoIBP, but the vertical extent is limited (Fig. 5a and b).
4.2.2 Peak season
During peak season, once subglacial discharge increases, the plume extends higher in the water column, although remaining 50 m deeper than in NoIBP (Fig. 4c and g). The modelled peak GMW outflow takes place within the 26.3 and 26.5 kg m−3 density layers, while the surface above 26.3 kg m−3 is dominated by iceberg melt (Figs. 7 and 3g). The relatively warm and rapid GMW outflow promotes iceberg melt, peaking at 1540 m3 s−1 (Figs. 6 and S3 in the Supplement), causing the surface and intermediate layers to cool significantly compared to NoIBP (Figs. 3c and g and 8). Meanwhile, the GMW outflow is further modified by iceberg melt along the fjord and rises up to exit the fjord at a depth similar to in NoIBP (Figs. 4c and g and S7). The additional outflow due to iceberg melt is compensated for by stronger inflow over the sill, increasing the peak value of up-fjord volume flux over the sill by 50 %, from 1 × 10⁵ m3 s−1 in NoIBP to 1.5 × 10⁵ m3 s−1 in IBP. The buoyancy-driven circulation due to iceberg melt draws a fraction of the inflowing water towards the base of the icebergs to compensate for the outflow, rather than deeper into the basin (Fig. 4g).
In addition to the modification of surface and intermediate layers, icebergs modify the deep basin through two separate processes: by mixing, or refluxing, of the GMW outflow into the inflowing water to the basin and by iceberg modification of inflowing ambient water. While the GMW is also iceberg-modified, we call the incoming ambient water modified by iceberg melt “iceberg-modified ambient water” (IMAW) to separate these two processes of ambient water modification: IMAW has not been in contact with the glacier terminus or the plume, as is the case for GMW. IMAW is always present in the deep basin when there is inflow over the sill and icebergs along the inflow route, whereas GMW will mix into the deep basin when outflow is too deep to exit over the sill. Both processes contribute to cooling and freshening of the deep basin throughout the season (Figs. 3g and 8). However, during peak summer, GMW exits the fjord completely, and thus all modification of the incoming ambient water at this time is due to iceberg melt (Fig. S7). The inflow region is located below approximately 200 m depth and below the isopycnal at 26.7 kg m−3 close to the sill and 26.5 kg m−3 next to the glacier and is near-parallel to the melt line, since it contains only IMAW (Fig. 7). Below 26.8 kg m−3 the basin contains IMAW mixed with early-season GMW.
The melt rate experienced by the glacier front reflects the iceberg-induced changes in the fjord properties: the deeper neutral buoyancy depth of the plume limits the vertical extent of plume melt, while the iceberg-melt-induced cooling of the surface and intermediate layers also decreases melt outside of the plume. The modification of the basin water is reflected in the plume melt rate, as cooler and fresher deep-basin water is entrained into the plume. This is seen as the deviation of the plume melt rate of IBP from NoIBP upwards from the depth where iceberg modification extends each month (Fig. 5). This results in an overall reduction in the freshwater flux from direct glacier melt in August from 66 in NoIBP to 58 in IBP.
4.2.3 Late season
Once the subglacial discharge decreases, density-driven inflow starts to dominate in IBP, as in NoIBP (Fig. 4h). The neutral buoyancy depth of the plume is deep, 235 m, but GMW outflow rises along the fjord due to iceberg modification to mostly exit the sill, with some refluxing into the deep basin (Figs. 4h and S7). The surface and intermediate layers are dominated by outflow of glacial meltwater (Fig. 4h). The freshwater flux from the icebergs does not decrease symmetrically compared to the increase in spring (Fig. 6), as it is 1100 in October compared to 940 in June with the same subglacial discharge. This is due to higher temperatures in the surface layer, where most of the icebergs are located (Fig. S3). As with NoIBP, the change in the deep-basin properties causes a decrease in the October and November maximum plume melt rates, compared to May and June in the early season (Fig. 5a, b, f and g).
4.3 Comparison to observations
The observed peak summer temperature in the fjord shows a cold and fresh surface layer, cooled intermediate-layer water, and a slightly modified deep basin (Figs. 3i and 8) – which is consistent with the results of experiment IBP (Fig. 3h). In the observations, the contribution of runoff is most significant between isopycnals 26.3 and 26.9 kg m−3, corresponding to a relatively narrow depth range of approximately 100–200 m (Figs. 3i and 7). Below 26.9 kg m−3, vertical changes in the observed properties are dominated by melt, following the melt line almost perfectly with negligible contribution of surface runoff, except for the profile directly next to the glacier (Fig. 7). We interpret this to indicate a large contribution of IMAW rather than GMW, due to the similarity to the modelled melt-dominated inflow region of 26.5–26.7 kg m−3. IMAW is, by definition, formed along the inflow route into the fjord, and thus, a layer in the fjord filled with purely IMAW would be a layer of inflow towards the glacier. In IBP, isopycnal 26.5 kg m−3 separates in- and outflow regions in the fjord, away from the sill. Although the observed properties are denser than in the model, we interpret that the shift from runoff-dominated to melt-dominated properties at 26.9 kg m−3 in the observations could distinguish between inflow and outflow in the fjord. Furthermore, following a similar reasoning, we interpret 26.3–26.9 kg m−3 in the observed profile as the GMW outflow. Despite the density difference between IBP and the observations, the separation between inflow and outflow takes place at approximately 200 m depth for both (dashed horizontal line in Fig. 8).
To sum up, icebergs modify the fjord properties and circulation in three main ways: firstly, by cooling and freshening the surface and intermediate layers through iceberg melt; secondly, by causing the neutral buoyancy depth of the plume and the GMW outflow to be deeper; and thirdly, by modifying the deep-basin water through iceberg modification of inflowing ambient water (IMAW) and increased refluxing of GMW into the inflow to the deep basin. These changes to the water column properties reduce the total submarine melt of the glacier front by 10 %–20 % and limit the vertical extent of the plume by 40–100 m, depending on the season (Fig. 5). Thus, iceberg modification of the fjord will cause less submarine melt of the glacier, and the melt will be limited to the deep part of the glacier front (Fig. 11).
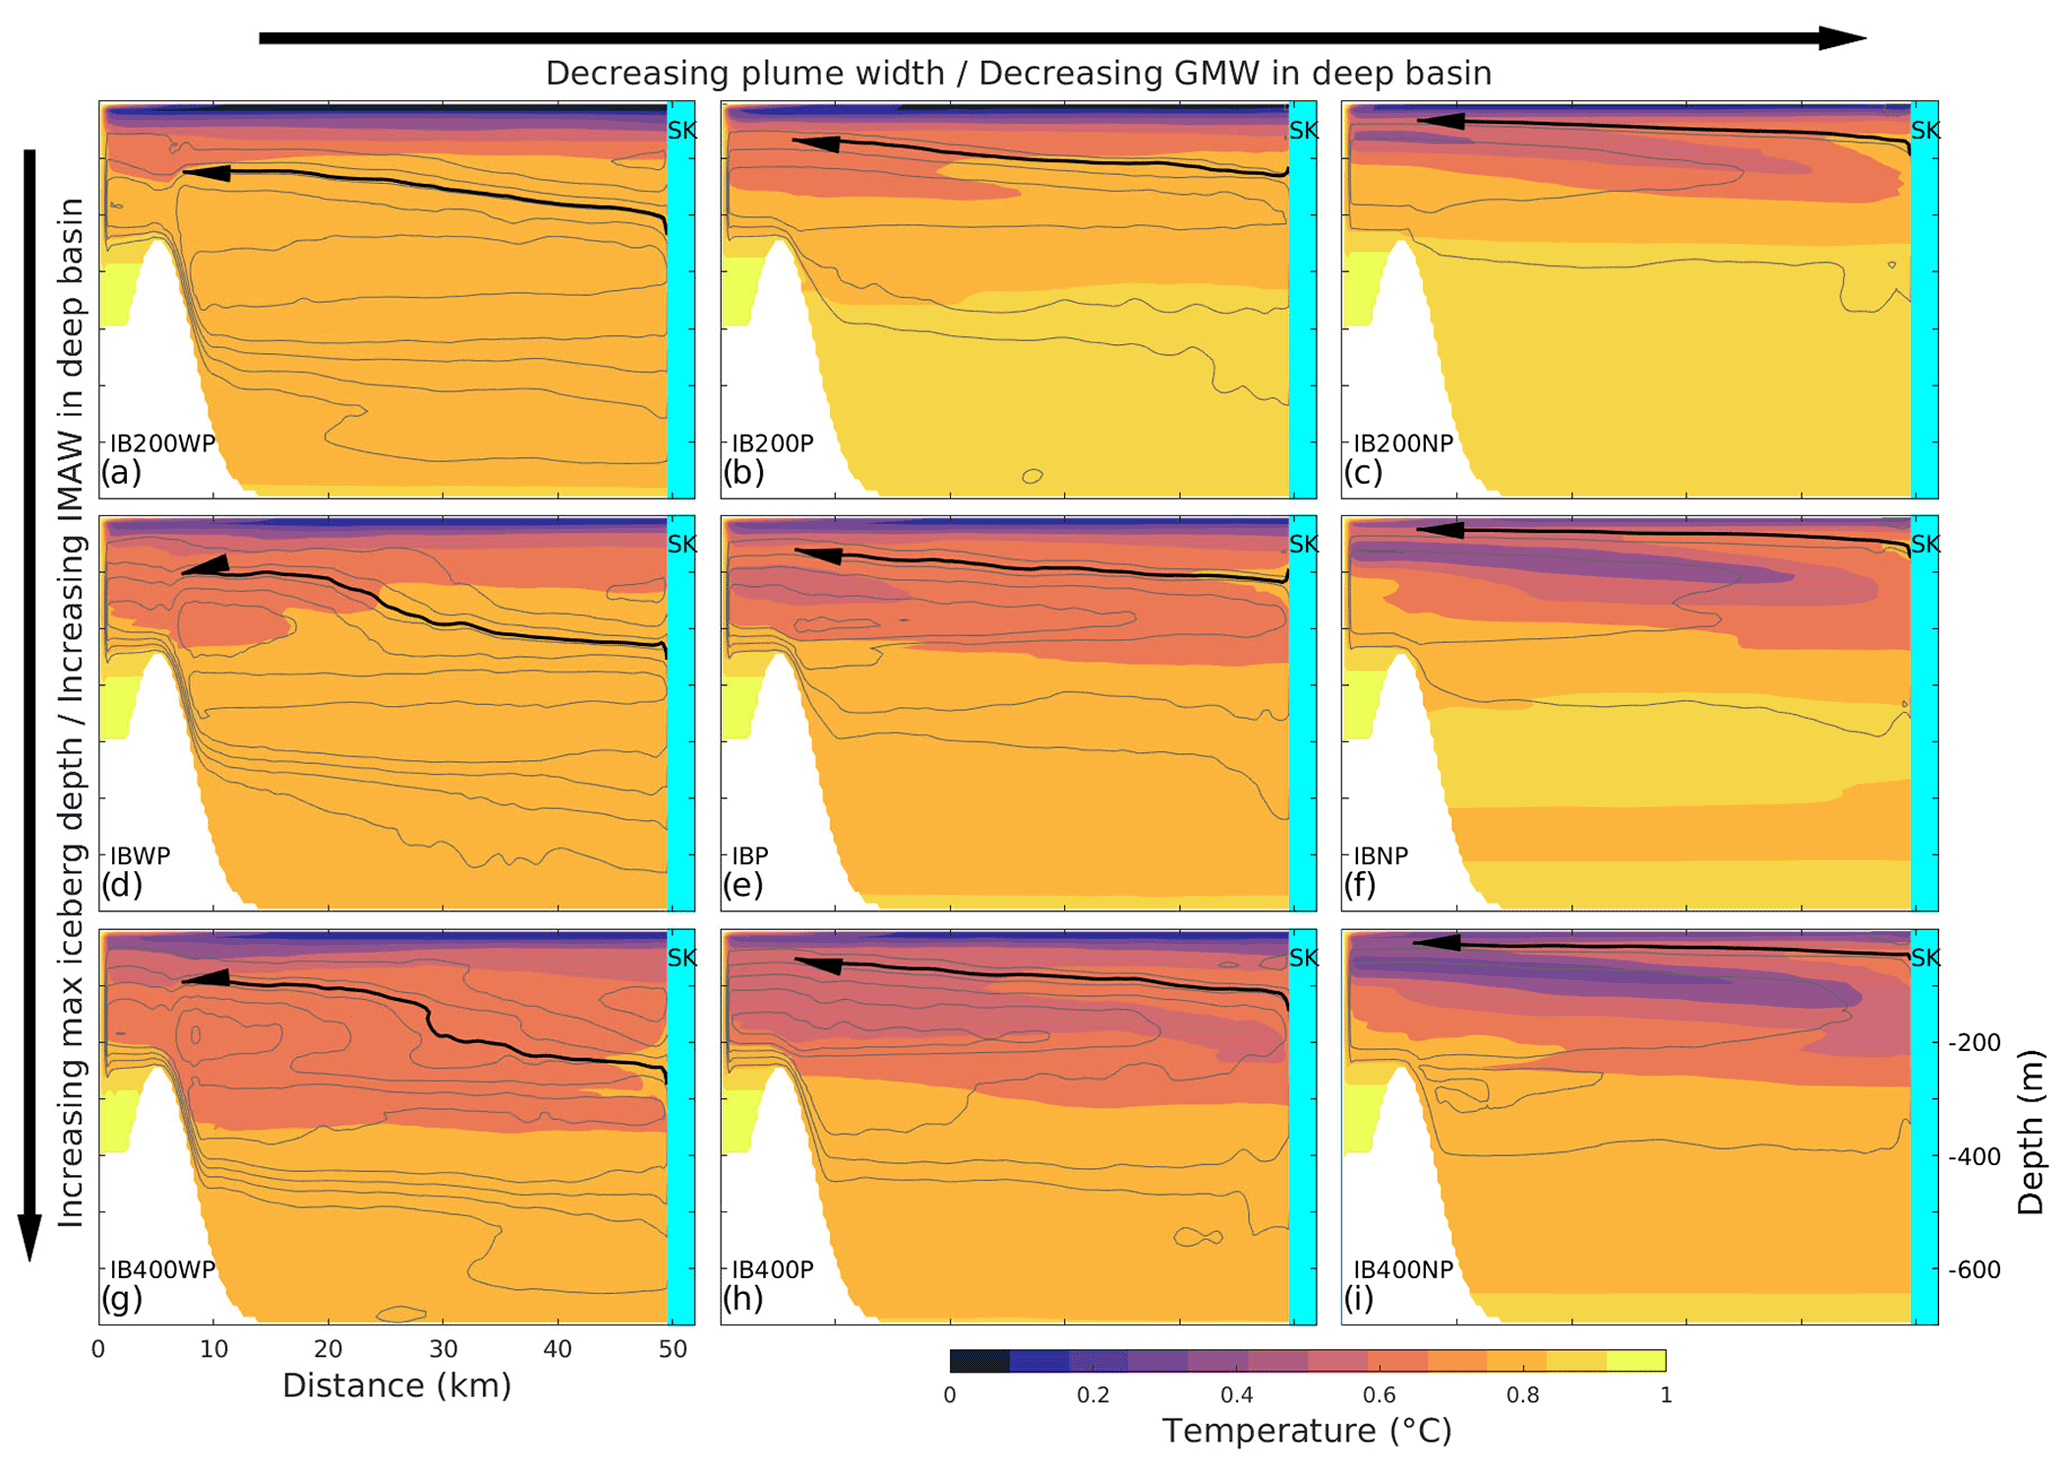
Figure 9August along-fjord sections of horizontally averaged temperature for all sensitivity experiments with three different plumes (columns) and three different iceberg distributions (rows). See Table 1 for experiment naming. Black arrows indicate the centreline of the GMW outflow from the plume and grey contours a snapshot of streamlines of the horizontal flow rate at 0.02 m3 d−1 intervals.
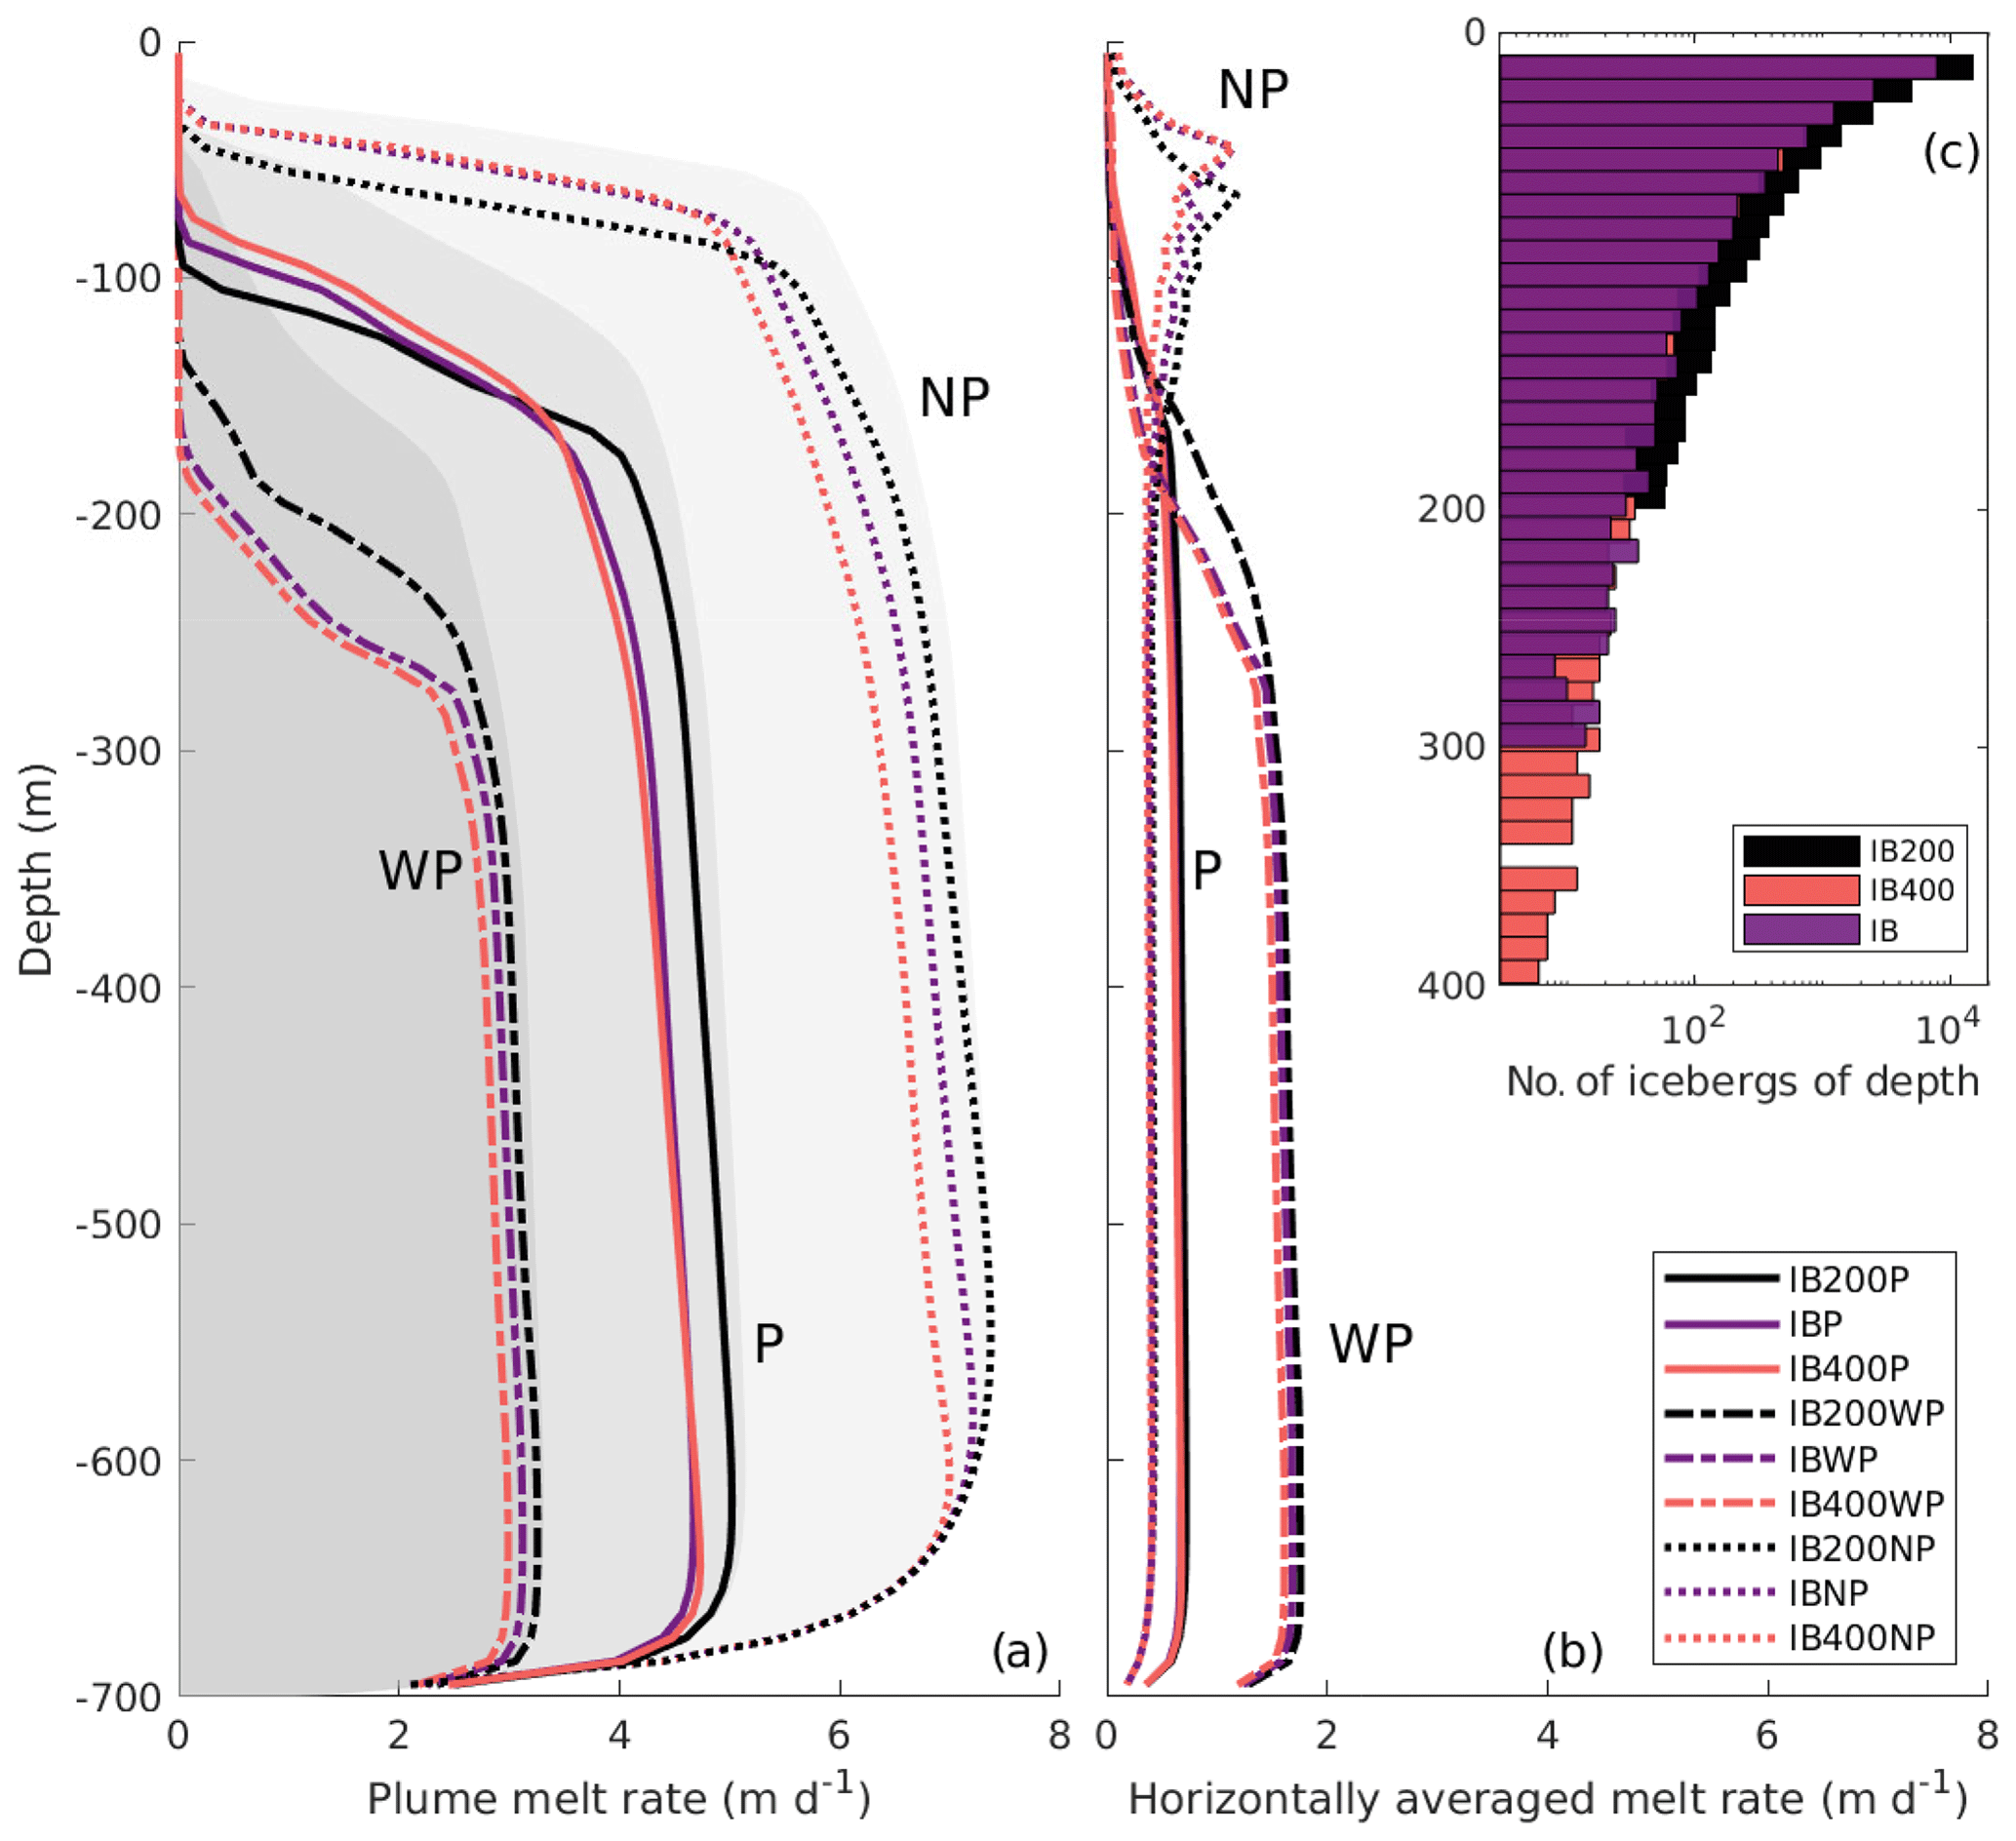
Figure 10August vertical melt rate profiles for (a) plume melt and (b) horizontally averaged frontal melt for the nine iceberg experiments with three different iceberg distributions (colours; see panel (c) for colour labels) and wide (WP), default (P) and narrow plumes (NP) (semi-dashed, solid and dotted lines, respectively). See Table 1 for experiment naming. The three different grey shades in panel (a) indicate the vertical melt rate profile of each of the three plumes without icebergs. Panel (c) shows the number of icebergs extending to a certain depth at 10 m intervals in the three used iceberg distributions.
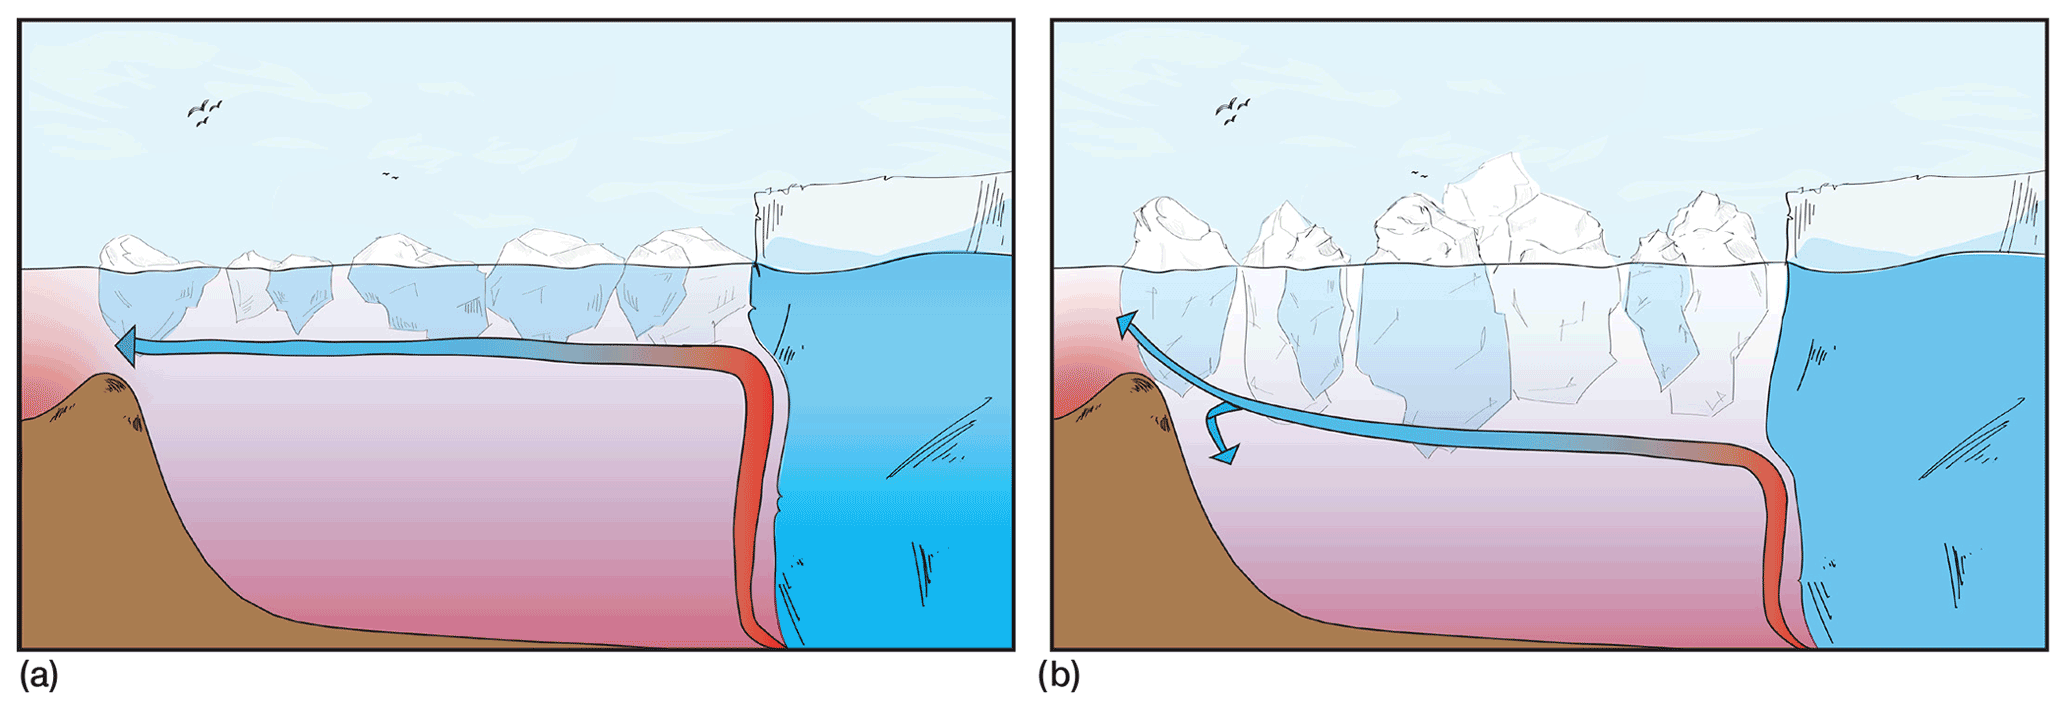
Figure 11Illustration of iceberg modification of the plume and GMW outflow. Icebergs depress the neutral buoyancy depth of the plume and the subsequent GMW outflow. The GMW outflow is further modified by icebergs and mixes partially back into the fjord when reaching a high sill.
4.4 The relative impact of plume width and iceberg distribution on fjord properties
We run simulations using three plume widths and three iceberg distributions (Table 1) from winter to peak summer in order to investigate the sensitivity of our results to plume width and iceberg distribution. Comparisons of temperature, circulation and the melt rate demonstrate the separate contributions of the plume and iceberg distribution and also the separate impact GMW and IMAW have on the deep-basin properties (Figs. 9 and 10). Plume width is the primary controlling factor of the vertical extent of the plume, which impacts fjord circulation and water properties. Decreasing plume width reduces the volume of deep-basin water entrained into the plume. The plume thus rises higher in the water column and exports GMW closer to the fjord surface (Fig. 9). The shallower and less vertically distributed outflow of GMW leads to reduced refluxing at the sill, leading to a less modified deep basin (Fig. 9c, f and i). For the wide plume, on the other hand, the total entrainment of the deep-basin water into the plume is larger because of the greater surface area of the plume, causing the plume to reach neutral buoyancy deeper in the water column. This leads to refluxing of the GMW outflow at the sill – even during peak summer – and significant modification of the deep-basin properties (Fig. 9a, d and g). While the peak plume melt rate for the wide plume is less than half that of the narrow plume, the horizontally averaged melt rate is doubled (Fig. 10).
Iceberg depth impacts directly the properties of the deep basin, as the extent of the cooling and freshening increases with increasing iceberg depth (Fig. 9). This modification of the deep basin is a result of the combined effect of the increased contribution of IMAW with iceberg depth and the refluxing of increasingly iceberg-modified GMW. Furthermore, changes in the properties of the deep-basin water are reflected in the properties of the plume as the plume becomes correspondingly cooler and fresher. This is reflected in a lower plume melt rate (Fig. 10a, grey-shaded areas compared to lines) and in a cooler GMW outflow and thus intermediate layer (Fig. 9).
The neutral buoyancy depth of the plume is slightly impacted by the change in the deep-basin properties but more so by the iceberg-induced modification of the intermediate layer. Iceberg distributions IB and IB400 have a similar number of icebergs within the top 300 m (Fig. 10c), and thus the differences in the neutral buoyancy depth are small between these two iceberg distributions. IB200, however, has approximately twice as many icebergs within the top 200 m as the other two distributions, leading to the neutral buoyancy depth being depressed by 20 m more than the other two iceberg distributions in IB200P and IB200NP. On the other hand, IB200WP has less iceberg modification of the plume than the other two distributions, since the neutral buoyancy depth is below the maximum iceberg extent (“WP” lines in Fig. 10a). Overall, this indicates that the number of icebergs extending down to the expected neutral buoyancy depth imposes a stronger control than the maximum iceberg depth. Iceberg-induced deep-basin cooling decreases the maximum plume melt rate at depth, but this effect causes only a small difference between the iceberg distributions (Fig. 10a).
The sensitivity experiments demonstrate the separate contributions of IMAW and GMW, as IMAW contribution in the deep basin increases with iceberg depth and GMW contribution decreases when decreasing the plume width. IB400NP has a narrow plume, causing GMW to exit right below the surface layer, leaving the deep basin unmodified by the GMW, except for a small early-season contribution. However, since IB400NP has deep icebergs, the resulting deep basin has a significant IMAW contribution (Fig. 9i). Conversely, IB200NP has icebergs shallower than the sill depth, leading to no IMAW and very little early-season GMW in the deep basin (Fig. 9c). IB200WP, meanwhile, has similarly negligible IMAW contribution (Fig. 9a); however, the overall mixing of the GMW into the basin is significant due to the deep neutral buoyancy depth of the wide plume, which leads to significant modification of the deep basin with little contribution from the icebergs. The significance of early-season processes to the summer temperature profile is clearly demonstrated by IBNP, where the early-season iceberg-modified water is located at 400–600 m depth, below less modified water inflowing during peak summer (Fig. 9f). These results show that – while the plume is a determining factor for the circulation in the fjord – increasing iceberg depth increases modification in the deep basin.
5.1 Iceberg modification in Ilulissat Icefjord
Our results show that icebergs must be included in order reproduce realistic water column properties of Ilulissat Icefjord (Figs. 8 and 7). Icebergs cool and freshen the entire water column of the fjord, most intensely in the top 50 m, which hosts a large number of small icebergs. Our simulation including icebergs matches well with the observed temperature profile in Ilulissat Icefjord in August 2014 (Fig. 3g and i), which is typical of Ilulissat Icefjord in peak summer (Gladish et al., 2015; Fenty et al., 2016; Beaird et al., 2017; Mojica et al., 2021). We find that iceberg modification is the main source of cooling in the surface and intermediate layers of the fjord, while the combined effect of subglacial discharge and frontal melt of the glacier only accounts for approximately 25 % of the simulated cooling (Fig. 8a); The iceberg-induced cooling and freshening reaches up to 4 ∘C and 0.7 PSU in peak summer (Fig. 8). This matches well with the cooling and freshening of 5 ∘C and 0.7 PSU simulated for Sermilik Fjord in south-eastern Greenland by Davison et al. (2020) with a similarly dense iceberg distribution, as well as with Davison et al. (2022) studies in an idealised fjord. Comparison of IBP and NoIBP to observations in temperature–salinity (TS) space further highlights the contribution of iceberg melt (Fig. 7). The small contribution of subglacial discharge and direct glacier melt to the cooling of the fjord is supported by findings from other West Greenland fjords, which show that the majority of glacial modification takes place along the fjord – through, for example, iceberg melt – while direct melt from the glacier terminus and subglacial discharge are small contributors (Mortensen et al., 2020; Muilwijk et al., 2021). Our model slightly underestimates the surface cooling and freshening, which we assume to be due to the exclusion of runoff to the surface of the fjord (Mernild et al., 2015) or possibly due to underestimating the contribution from small icebergs by the power law size distribution (Rezvanbehbahani et al., 2020).
We find that the iceberg-induced cooling and freshening in the intermediate layer depress the neutral buoyancy depth of the plume and the outflow route of the GMW (illustrated in Fig. 11). This is supported by Beaird et al. (2017), who find the water above 250 m close to the glacier to be anomalously cold compared to what is predicted by plume theory, indicating a depressed plume. They speculate that this mismatch is due to the impact of icebergs, which our model results confirm. Previous estimates of the neutral buoyancy depth of the plume of Sermeq Kujalleq in peak summer range from 350 m depth to the surface (Jenkins, 2011; Gladish et al., 2015; Carroll et al., 2016), depending on the subglacial discharge flux, ambient water properties and ice front shape. Truffer and Motyka (2016) briefly speculate on the possibility that the ice mélange could mechanically prevent the plume from reaching the surface in Ilulissat Icefjord. However, since the mélange is not rigid during peak summer (Joughin et al., 2020), we argue that the plume is deep due to the iceberg-induced stratification rather than a mechanical effect. A similar phenomenon but at a much smaller scale was observed in the nearby Saqqarleq Fjord, where extreme melt caused surface freshening and thus prevented the plume from reaching the surface as it normally does in this location (Andrés et al., 2020).
The depressed plume leads to enhanced basin water modification due to increased refluxing of the GMW outflow into inflowing Disko Bay water, as not all outflow is able to exit over the sill (Figs. 11b and S7). However, icebergs also modify directly the inflowing ambient water from Disko Bay, creating iceberg-modified ambient water (IMAW) that has not had any contact with the glacier front or the plume. Both GMW and IMAW are typically present in a high-silled fjord with a marine-terminating glacier, such as Ilulissat Icefjord; however, their origins are different. Thus, even if the GMW outflow is able to completely exit the fjord, the deep-basin water will still be modified by IMAW, as long as there are icebergs present along the inflow route. Modification of the deep basin of Ilulissat Icefjord is supported by Beaird et al. (2017), who find the fjord to be glacially modified to at least 600 m depth. We specify that in the deep basin the modified water is mostly IMAW, rather than GMW (Sect. 4.3). This interpretation is different from that of Gladish et al. (2015), who describe the basin to be filled with Disko Bay water at sill depth, with no significant glacial modification. Since their model lacks both icebergs and seasonal considerations, all GMW will exit the fjord, leading to no modification in the deep basin. Our results highlight the importance of including both icebergs and seasonal variations in subglacial discharge.
Davison et al. (2022) observe in a modelling study of an idealised steady-state fjord in summer conditions that when icebergs extend below sill depth, the deep basin is cooled, as it is in our model. On the other hand, without a sill the deep basin is warmed, due to increased up-fjord heat transport (Davison et al., 2020, 2022). Our analysis explains the dynamics of GMW depression and IMAW formation at the high sill that leads to this iceberg-induced deep-basin modification. Hager et al. (2022) also discover a similar mixing of GMW outflow down into the deep basin in a high-silled glacial fjord in LeConte Bay in Alaska. Our results together with Davison et al. (2022) and Hager et al. (2022) show that high sills in glacial fjords are significant not only as barriers preventing warm ambient water inflow but also because they contribute to deep-basin water modification.
Davison et al. (2022) study the impact of icebergs on plume melt in an idealised fjord setup but find only small changes in plume temperature and the melt rate. They study a 500 m deep fjord with a single point-source plume, which has limited entrainment of ambient water into the plume and is thus relatively unaffected by iceberg modification of the fjord water (Fig. 9 in Davison et al., 2022). The plume reaches the surface with all their different iceberg distributions, but since they do not discuss stratification or buoyancy, it is not clear if the neutral buoyancy depth changes with their different iceberg distributions. The fjord remains relatively warm at the surface in all of their scenarios (Figs. 4 and 6 in Davison et al., 2022), likely due to relatively low average iceberg concentrations along the fjord (Fig. 2 in Davison et al., 2022). Comparison to our results further highlights the significance of iceberg concentration to changes both within the fjord and at the glacier terminus. However, they do also find that the cooling caused by icebergs reduces submarine melt both within and outside of the plume.
5.2 Subglacial discharge as a driver of seasonality
In our model, as in previous studies of high-silled fjords (Gladish et al., 2015; Carroll et al., 2017), the plume drives the circulation in the fjord during peak summer. However, we find distinct circulation patterns for each season due to interaction with the high sill: subglacial discharge drives the early-season circulation in the fjord, with a significant amount of refluxing at the sill due to relatively deep GMW outflow, leading to basin water modification (Figs. 4b and f and S7). During peak summer, a strong GMW outflow is located high enough to fully exit the fjord, and the compensating inflow over the sill reaches buoyancy at the upper part of the deep basin (Fig. 4c and g). In the late season, GMW outflow is again refluxed at the sill (Fig. S7), but now the basin has freshened sufficiently for density-driven renewal of deep water to start dominating the circulation as the subglacial discharge wanes (Fig. 4d and h). This seasonality is very similar to the dynamics discovered by Hager et al. (2022) in LeConte Bay, Alaska, suggesting that this is a typical seasonality pattern for high-silled glacial fjords. We find that seasonal surface warming in Disko Bay has little impact in the fjord when icebergs are included (Figs. 3g and i and 7).
Subglacial discharge is also the driver of seasonality of the freshwater flux from icebergs in our model, which we estimate to be 660–1050 m3 s−1 in winter and 1270–1810 m3 s−1 in peak summer (Fig. 6). This is in line with previous satellite-derived estimates of iceberg melt of 678–1346 and 1300–1700 m3 s−1 for Sermeq Kujalleq in peak summer (Enderlin et al., 2016; Mankoff et al., 2020). Wintertime freshwater flux from iceberg melt is estimated to be several hundreds of m3 s−1 (Enderlin et al., 2016). Moon et al. (2018) estimate the peak iceberg freshwater flux for Sermilik Fjord to take place later in the season, September to November, due to an increase in the ocean temperature. We do not consider variability in the iceberg distribution during the experiments, which could contribute to a larger late-season freshwater flux from icebergs. However, our sensitivity experiments show that the variability in the freshwater flux due to the iceberg distribution is 200–400 m3 s−1, depending on the plume width, which is less than the increase due to subglacial discharge (Fig. 6).
Subglacial discharge drives the seasonality of the plume melt rate, both of the maximum melt rate and of the vertical reach of the plume (Fig. 5). Meanwhile, the melt rate is found to be connected to calving as a moderator, but the exact processes are elusive and location dependent (O'Leary and Christoffersen, 2013; Rignot et al., 2015; Benn and Åström, 2018; Cowton et al., 2019; Cook et al., 2021; Slater et al., 2021). Melt localised at depth promotes undercutting, which is considered to be the determining factor for calving style (Benn and Åström, 2018; Slater et al., 2021). Thus, we speculate that as subglacial discharge drives seasonality in the melt rate, it will also drive seasonality of undercutting and that will be reflected in calving of the glacier. Our results are in line with previous studies, indicating that subglacial discharge is a strong control on the melt rate, since the combination of subglacial discharge volume and drainage width – through the subglacial-drainage-system properties – controls plume velocity and the vertical reach of the plume (Jenkins, 2011; Cowton et al., 2015).
Observational studies of Sermeq Kujalleq indicate that there is a link between iceberg mélange and seasonal changes in the calving rate, as a reduction in calving during winter and the growth of rigid mélange seem to correlate (Joughin et al., 2008; Cassotto et al., 2015; Joughin et al., 2020). The connection between iceberg mélange and the suppression of calving is sometimes attributed to mechanical support by a rigid mélange that prevents calving (Joughin et al., 2008; Burton et al., 2018; Joughin et al., 2020). However, mechanical support disappears once the rigidity is lost, as the non-rigid mélange is a granular material, able to compact and relax under calving events (Peters et al., 2015). The presence of reliably rigid mélange in Ilulissat Icefjord varies interannually, and it has been present only sporadically in the previous decade (Cassotto et al., 2015; Joughin et al., 2020) and thus does not give a comprehensive explanation of the link between mélange and calving. Our results indicate that the plume transports heat up to the mélange and significantly increases currents within the iceberg mélange (Fig. S3), which likely inhibits rigid mélange formation during high subglacial discharge. Thus, we see the seasonal growth of rigid mélange as a consequence of the weakening plume, with concomitant weakening of the circulation, and the supply of heat to the mélange enables formation of rigid mélange. Our study covers only 1 year with constant iceberg conditions. However, interannually, the heat transported by the plume into the mélange will depend not only on the deep-basin water temperature, as discussed in Joughin et al. (2020), but also on changes in the subglacial discharge volume and the outlet properties (Jenkins, 2011; D. Slater et al., 2017). On the other hand, changes in the iceberg coverage will promote variability in the formation of the rigid mélange, as the ability of the mélange to remove heat depends on the iceberg coverage.
Our results indicate that icebergs impact the glacier front irrespective of mélange rigidity. Icebergs suppress glacier melt at the top 100–300 m of the glacier front (Fig. 5) by depressing the buoyancy of the plume. This suppression reduces the overall melt of the front and strengthens the uneven vertical distribution of glacier melt and thus promotes undercutting of the front. We hypothesise that icebergs moderate calving by increasing undercutting throughout the runoff season. Iceberg control over the neutral buoyancy depth of the plume provides a mechanism for the iceberg mélange to influence melt, even during peak summer discharge when the mélange is not rigid. This suppression is not sensitive to maximum iceberg keel depth but is sensitive to the density of icebergs at the depth of neutral buoyancy (Fig. 10), indicating that iceberg concentration within the intermediate layer is a controlling factor in the suppression of melt of the glacier. In the absence of a comprehensive understanding of calving and the role of undercutting, it is difficult to make quantitative estimates of how a certain deepening of the neutral buoyancy depth of the plume would impact calving, and we see this as a key point of further study. Further study is also needed on iceberg–plume–GMW dynamics and on how these dynamics will evolve in a warming climate. Much will depend on how the subglacial drainage system will react to longer and more intense melt seasons. Increased calving has the potential to strengthen the iceberg-induced modification in Ilulissat Icefjord: as Sermeq Kujalleq is predicted to retreat into even deeper geometry (Bondzio et al., 2018), maximum iceberg depth, overall discharge volume and thus iceberg modification in the deep basin can be expected to increase.
5.3 Model uncertainties
One of the key features of the IceBerg package is that the icebergs do not move or change volume when melting, and we choose not to edit the distribution manually during experiments. While the iceberg cover of Ilulissat Icefjord is a relatively constant feature due to the large calving flux of the glacier, observations indicate some annual variability (Cassotto et al., 2015; Enderlin et al., 2016; Joughin et al., 2020). We expect the range of iceberg distributions applied in the sensitivity experiments to span the natural variability and also along-fjord variations in the iceberg distribution in Ilulissat Icefjord (Sect. 4.4). We do not expect temporary reductions in the iceberg cover to impact the hydrography of the fjord to a large degree. Observations of summer surface conditions in Ilulissat Icefjord in 2000–2011 show consistently an iceberg-dominated surface at melting point (Cassotto et al., 2015), which makes us assume that any deviations are short in duration.
Our modelled iceberg distribution produces a slightly cooler and fresher deep basin than what is observed (Figs. 3g, 8), which seems to be a combination of slightly different properties of the deepest water in the basin and an overestimated contribution of subglacial discharge within the deep basin (Fig. 7). In the model, GMW in the basin is a product of early-season refluxing at the sill, which in reality could be reduced due to shallow or sparse iceberg distribution at the sill early in the season. The good correspondence between the observations and sensitivity experiment IB200P (Figs. 3i and 9b) indicates that icebergs could have been shallower in 2014 than modelled. Enderlin et al. (2016) show that in June 2014 icebergs in Ilulissat Icefjord were indeed relatively shallow, further supporting this interpretation. For simplicity, we keep the properties of Disko Bay water at sill depth constant. However, the variability in the water properties at the sill depth could cause dense water inflows, influencing the deep-basin properties. Also, the duration of the early season can vary, and a rapid increase in the subglacial discharge volume to the peak value would reduce early-season refluxing at the sill. The choice of model parameters can influence the deep-basin modification, as horizontal diffusivity and the restoration timescale have a slight impact on the deep-basin properties (Fig. S4 in the Supplement). However, this does not impact the overall results or processes discussed in this study. A thorough observational study focusing on the early-season processes in Ilulissat Icefjord is needed to constrain these uncertainties.
Our model setup is designed for the runoff season, ignoring potentially important wintertime processes, such as large tidal events, sea ice formation and decrease in iceberg draft. Thus, if extended over the following winter, the model does not fully recover from the summer conditions (Fig. S2). However, properties within the iceberg extent recover rapidly (Fig. S3), and dense water renewal in the deep basin continues over winter (Fig. S2c). We also keep the iceberg distribution constant during winter, although in reality iceberg drafts would significantly decrease (Enderlin et al., 2016), reducing modification of the inflowing water during winter and enabling faster recovery of the deep-basin properties. Furthermore, it is possible that weak subglacial discharge is also present during winter, contributing to the deep-basin circulation (Cook et al., 2021). This would mean an underestimated contribution of frontal melt from the glacier during winter.
The IceBerg package implements freshening due to iceberg melt by applying a negative salinity anomaly. In reality we would expect the icebergs to be a source of freshwater input to the fjord (Mernild et al., 2015; Enderlin et al., 2016; Moon et al., 2018). The negative-salinity approach forces the modelled inflow and outflow of the iceberg-melt-driven circulation to be equal in volume, instead of a net outflow as expected. Including icebergs leads to a 50 % increase in the volume flux over the sill due to the added freshwater export (Fig. 4d and h). It is uncertain, however, if this increase is realistic for the inflow. We track the GMW outflow primarily through the outflow (Fig. 4); additional tracer-injection experiments in Fig. S7 demonstrate that the outflow is a good tracer for the GMW, although details of the outflow margins and refluxing are hard to distinguish purely based on the flow field. We do not include tides or rotational effects, since their impacts are small in our high-silled setup (Carroll et al., 2017). However, both of these effects should be considered in a bathymetrically accurate study of Ilulissat Icefjord, since they could potentially impact the mixing at the sill: rotation could redistribute the GMW outflow laterally, while tides would increase mixing at the sill (Carroll et al., 2017), potentially increasing iceberg melt at the sill.
Icebergs are represented by cell-averaged temperature and salinity forcings in the IceBerg package (Davison et al., 2020) and are obstacles for flow only in a grid-cell-average sense. However, Hughes (2022) shows that individual icebergs alter the circulation by creating a complicated flow network, which slows down the near-surface current. This mechanical effect of the iceberg network would also cause depression of the GMW outflow, complementing our modelled stratification-driven depression. Furthermore, we do not consider variations to the melt rate parameterisations due to different flow regimes, as described in Fitzmaurice et al. (2018), which could be a further development point for the IceBerg package. For simplicity, we choose to use standard values of the turbulent transfer coefficients for both heat and salt transfer both for the glacier and for the icebergs (Table S1). Jackson et al. (2020) suggest new, higher values for the turbulence parameters, and Davison et al. (2020) test the possibility of varying these parameters for iceberg melt. Given that their study shows that increased values of turbulent transfer enhance the impacts of icebergs, we consider the standard values to be a conservative estimate. The contribution of direct melt from the glacier front is negligible in our simulations, representing only 2 % of the total peak freshwater flux (Fig. 6). This is likely a lower-end estimate, since melt outside of the plume is likely underestimated with the standard turbulent transfer parameters (Sutherland et al., 2019; Jackson et al., 2020). This will have most impact during winter when the other freshwater sources are at a minimum.
We find that iceberg melt is the key factor modifying the water mass properties of Ilulissat Icefjord and that omitting icebergs can lead to misleading interpretations of both water mass properties and the dynamics of the ice–ocean interface. Iceberg melt impacts Ilulissat Icefjord in three main ways: first, icebergs cool and freshen the water column over their vertical extent; second, iceberg melt causes the neutral buoyancy depth of the plume and the export of glacially modified waters to be deeper; third, icebergs modify the deep basin, below their vertical extent, by driving mixing of the glacially modified waters with the deep-basin waters and by modifying the incoming ambient waters. We describe the evolution of the fjord properties and circulation over a runoff season and find the subglacial discharge flux to be the driver of seasonality of both glacier and iceberg melt. Changes in the water column properties due to iceberg submarine melt decrease the total melt of the glacier front and depress the subglacial discharge plume. We postulate that submarine iceberg melt increases undercutting by limiting plume melt to the deep part of the glacier front and, through changes in undercutting, that iceberg melt also moderates glacier calving in Ilulissat Icefjord. We postulate that the impact of submarine iceberg melt on the frontal melt of the glacier provides a comprehensive link between iceberg mélange and glacier calving throughout the runoff season.
MITgcm is freely available at https://github.com/MITgcm/MITgcm/archive/master.zip (last access: 3 October 2022) and https://doi.org/10.5281/zenodo.4968496 (Campin et al., 2021; Marshall et al., 1997). The IcePlume module is available from Tom Cowton on request. The IceBerg module is available at https://doi.org/10.5281/zenodo.3979647 (Davison, 2020).
The model domain, boundary conditions and output are available from the corresponding author on request.
The supplement related to this article is available online at: https://doi.org/10.5194/tc-17-371-2023-supplement.
KK and KN conceived the study. KK designed and conducted the simulations and analysis and wrote the original manuscript. FS and KN supported the interpretation of the model results and contributed to the preparation of the manuscript.
At least one of the (co-)authors is a member of the editorial board of The Cryosphere. The peer-review process was guided by an independent editor, and the authors also have no other competing interests to declare.
Publisher's note: Copernicus Publications remains neutral with regard to jurisdictional claims in published maps and institutional affiliations.
Karita Kajanto and Kerim Nisancioglu were supported by the European Research Council under the European Community's Seventh Framework Programme (FP7 2007–2013) ERC grant agreement 610055 as part of the ice2ice project. Kerim Nisancioglu is also supported by the ClimateNarratives NRC grant (324520). Fiammetta Straneo is supported by the NSF and the Heising-Simons Foundation. The simulations were performed on resources provided by Sigma2 – the national infrastructure for high-performance computing and data storage in Norway. Data from the Greenland Ecosystem Monitoring programme were provided by the Greenland Institute of Natural Resources, Nuuk, Greenland, in collaboration with the Department of Bioscience, Aarhus University, Denmark. The authors thank the editor, Caroline Clason, for considering our paper for publication and the two anonymous reviewers for providing thorough reviews of the paper.
This research has been supported by the European Research Council, FP7 Ideas (ice2ice (grant no. 610055)), the Norwegian Research Council (grant no. 324520, Climate Narratives), the NSF and the Heising-Simons Foundation.
This paper was edited by Caroline Clason and reviewed by two anonymous referees.
Amundson, J. M., Fahnestock, M., Truffer, M., Brown, J., Lüthi, M. P., and Motyka, R. J.: Ice mélange dynamics and implications for terminus stability, Jakobshavn Isbræ, Greenland, J. Geophys. Res.-Earth, 115, F01005, https://doi.org/10.1029/2009JF001405, 2010. a
De Andrés, E., Slater, D. A., Straneo, F., Otero, J., Das, S., and Navarro, F.: Surface emergence of glacial plumes determined by fjord stratification, The Cryosphere, 14, 1951–1969, https://doi.org/10.5194/tc-14-1951-2020, 2020. a
Beaird, N., Straneo, F., and Jenkins, W.: Characteristics of meltwater export from Jakobshavn Isbræ and Ilulissat Icefjord, Ann. Glaciol., 58, 107–117, https://doi.org/10.1017/aog.2017.19, 2017. a, b, c, d, e, f, g, h, i, j, k, l, m, n, o
Benn, D. I. and Åström, J. A.: Calving glaciers and ice shelves, Adv. Phys. X, 3, 1048–1076, https://doi.org/10.1080/23746149.2018.1513819, 2018. a, b
Bondzio, J. H., Morlighem, M., Seroussi, H., Wood, M. H., and Mouginot, J.: Control of Ocean Temperature on Jakobshavn Isbræ's Present and Future Mass Loss, Geophys. Res. Lett., 45, 12912–12921, https://doi.org/10.1029/2018GL079827, 2018. a
Böning, C. W., Behrens, E., Biastoch, A., Getzlaff, K., and Bamber, J. L.: Emerging impact of Greenland meltwater on deepwater formation in the North Atlantic Ocean, Nat. Geosci., 9, 523–527, https://doi.org/10.1038/ngeo2740, 2016. a
Burton, J. C., Amundson, J. M., Cassotto, R., Kuo, C. C., and Dennin, M.: Quantifying flow and stress in ice mélange, the world's largest granular material, P. Natl. Acad. Sci. USA, 115, 5105–5110, https://doi.org/10.1073/PNAS.1715136115, 2018. a, b
Campin, J.-M., Heimbach, P., Losch, M., Forget, G., edhill3, Adcroft, A., amolod, Menemenlis, D., dfer22, Hill, C., Jahn, O., Scott, J., stephdut, Mazloff, M., Fox-Kemper, B., antnguyen13, Doddridge, E., Fenty, I., Bates, M., Eichmann, A., Smith, T., Martin, T., Lauderdale, J., Abernathey, R., samarkhatiwala, hongandyan, Deremble, B., dngoldberg, Bourgault, P., and Dussin, R.: MITgcm/MITgcm: checkpoint67z (Version checkpoint67z), Zenodo [code], https://doi.org/10.5281/zenodo.4968496, 2021. a
Carroll, D., Sutherland, D. A., Hudson, B., Moon, T., Catania, G. A., Shroyer, E. L., Nash, J. D., Bartholomaus, T. C., Felikson, D., Stearns, L. A., Noël, B. P. Y., and van den Broeke, M. R.: The impact of glacier geometry on meltwater plume structure and submarine melt in Greenland fjords, Geophys. Res. Lett., 43, 9739–9748, https://doi.org/10.1002/2016GL070170, 2016. a
Carroll, D., Sutherland, D. A., Shroyer, E. L., Nash, J. D., Catania, G. A., and Stearns, L. A.: Subglacial discharge-driven renewal of tidewater glacier fjords, J. Geophys. Res.-Oceans, 122, 6611–6629, https://doi.org/10.1002/2017JC012962, 2017. a, b, c, d, e, f, g
Cassotto, R., Fahnestock, M., Amundson, J. M., Truffer, M., and Joughin, I.: Seasonal and interannual variations in ice melange and its impact on terminus stability, Jakobshavn Isbræ, Greenland, J. Glaciol, 61, 76–88, https://doi.org/10.3189/2015JoG13J235, 2015. a, b, c, d
Cavanagh, J. P., Lampkin, D. J., and Moon, T.: Seasonal Variability in Regional Ice Flow Due to Meltwater Injection Into the Shear Margins of Jakobshavn Isbræ, J. Geophys. Res.-Earth, 122, 2488–2505, https://doi.org/10.1002/2016JF004187, 2017. a
Cook, S. J., Christoffersen, P., and Todd, J.: A fully-coupled 3D model of a large Greenlandic outlet glacier with evolving subglacial hydrology, frontal plume melting and calving, J. Glaciol, 68, 486–502, https://doi.org/10.1017/jog.2021.109, 2021. a, b, c, d
Cowton, T., Slater, D., Sole, A., Goldberg, D., and Nienow, P.: Modeling the impact of glacial runoff on fjord circulation and submarine melt rate using a new subgrid-scale parameterization for glacial plumes, J. Geophys. Res.-Oceans, 120, 796–812, https://doi.org/10.1002/2014JC010324, 2015. a, b, c, d
Cowton, T. R., Todd, J. A., and Benn, D. I.: Sensitivity of Tidewater Glaciers to Submarine Melting Governed by Plume Locations, Geophys. Res. Lett., 46, 11219–11227, https://doi.org/10.1029/2019GL084215, 2019. a
Cuffey, K. M. and Paterson, W. S. B.: The Physics of Glaciers, 4th editio edn., Elsevier Science & Technology Books, Butterworth-Heinemann/Elsevier, ISBN 9780123694614, 2010. a
Davison, B.: Iceberg melting substantially modifies oceanic heat flux towards a major Greenlandic tidewater glacier – data and code, Zenodo [code and data set], https://doi.org/10.5281/zenodo.3979647, 2020. a
Davison, B. J., Cowton, T. R., Cottier, F. R., and Sole, A. J.: Iceberg melting substantially modifies oceanic heat flux towards a major Greenlandic tidewater glacier, Nat. Commun., 11, 1–13, https://doi.org/10.1038/s41467-020-19805-7, 2020. a, b, c, d, e, f, g, h, i
Davison, B. J., Cowton, T., Sole, A., Cottier, F., and Nienow, P.: Modelling the effect of submarine iceberg melting on glacier-adjacent water properties, The Cryosphere, 16, 1181–1196, https://doi.org/10.5194/tc-16-1181-2022, 2022. a, b, c, d, e, f, g, h, i, j, k
Enderlin, E. M., Hamilton, G. S., Straneo, F., and Sutherland, D. A.: Iceberg meltwater fluxes dominate the freshwater budget in Greenland's iceberg-congested glacial fjords, Geophys. Res. Lett., 43, 11,287–11,294, https://doi.org/10.1002/2016GL070718, 2016. a, b, c, d, e, f, g, h, i, j, k
Fenty, I., Willis, J., Khazendar, A., Dinardo, S., Forsberg, R., Fukumori, I., Holland, D., Jakobsson, M., Moller, D., Morison, J., Meunchow, A., Rignot, E., Schodlock, M., Thompson, A., Tino, K., Rutherford, M., and Trenholm, N.: Oceans Melting Greenland: Early results from NASA's ocean-ice mission in Greenland, Oceanography, 29, 72–83, https://doi.org/10.5670/oceanog.2016.100, 2016. a, b
Fitzmaurice, A., Cenedese, C., and Straneo, F.: A Laboratory Study of Iceberg Side Melting in Vertically Sheared Flows, J. Phys. Oceanogr., 48, 1367–1373, https://doi.org/10.1175/JPO-D-17-0185.1, 2018. a
Gladish, C. V., Holland, D. M., Rosing-Asvid, A., Behrens, J. W., and Boje, J.: Oceanic boundary conditions for Jakobshavn Glacier. Part I: Variability and renewal of Ilulissat Icefjord waters, 2001-14, J. Phys. Oceanogr., 45, 3–32, https://doi.org/10.1175/JPO-D-14-0044.1, 2015. a, b, c, d, e, f, g, h, i, j, k, l
Goelzer, H., Nowicki, S., Payne, A., Larour, E., Seroussi, H., Lipscomb, W. H., Gregory, J., Abe-Ouchi, A., Shepherd, A., Simon, E., Agosta, C., Alexander, P., Aschwanden, A., Barthel, A., Calov, R., Chambers, C., Choi, Y., Cuzzone, J., Dumas, C., Edwards, T., Felikson, D., Fettweis, X., Golledge, N. R., Greve, R., Humbert, A., Huybrechts, P., Le clec'h, S., Lee, V., Leguy, G., Little, C., Lowry, D. P., Morlighem, M., Nias, I., Quiquet, A., Rückamp, M., Schlegel, N.-J., Slater, D. A., Smith, R. S., Straneo, F., Tarasov, L., van de Wal, R., and van den Broeke, M.: The future sea-level contribution of the Greenland ice sheet: a multi-model ensemble study of ISMIP6, The Cryosphere, 14, 3071–3096, https://doi.org/10.5194/tc-14-3071-2020, 2020. a, b
Hager, A. O., Sutherland, D. A., Amundson, J. M., Jackson, R. H., Kienholz, C., Motyka, R. J., and Nash, J. D.: Subglacial Discharge Reflux and Buoyancy Forcing Drive Seasonality in a Silled Glacial Fjord, J. Geophys. Res.-Oceans, 127, e2021JC018355, https://doi.org/10.1029/2021JC018355, 2022. a, b, c, d
Hughes, K. G.: Pathways, form drag, and turbulence in simulations of an ocean flowing through an ice mélange, J. Geophys. Res.-Oceans, 127, e2021JC018228, https://doi.org/10.1029/2021JC018228, 2022. a, b
Jackson, R. H., Shroyer, E. L., Nash, J. D., Sutherland, D. A., Carroll, D., Fried, M. J., Catania, G. A., Bartholomaus, T. C., and Stearns, L. A.: Near-glacier surveying of a subglacial discharge plume: Implications for plume parameterizations, Geophys. Res. Lett., 44, 6886–6894, https://doi.org/10.1002/2017GL073602, 2017. a
Jackson, R. H., Nash, J. D., Kienholz, C., Sutherland, D. A., Amundson, J. M., Motyka, R. J., Winters, D., Skyllingstad, E., and Pettit, E. C.: Meltwater Intrusions Reveal Mechanisms for Rapid Submarine Melt at a Tidewater Glacier, Geophys. Res. Lett., 47, e2019GL085335, https://doi.org/10.1029/2019GL085335, 2020. a, b
Jenkins, A.: Convection-driven melting near the grounding lines of ice shelves and tidewater glaciers, J. Phys. Oceanogr., 41, 2279–2294, https://doi.org/10.1175/JPO-D-11-03.1, 2011. a, b, c, d, e, f, g
Joughin, I., Howat, I. M., Fahnestock, M., Smith, B., Krabill, W., Alley, R. B., Stern, H., and Truffer, M.: Continued evolution of Jakobshavn Isbrae following its rapid speedup, J. Geophys. Res., 113, F04006, https://doi.org/10.1029/2008JF001023, 2008. a, b, c
Joughin, I., Shean, D. E., Smith, B. E., and Floricioiu, D.: A decade of variability on Jakobshavn Isbræ: ocean temperatures pace speed through influence on mélange rigidity , The Cryosphere, 14, 211–227, https://doi.org/10.5194/tc-14-211-2020, 2020. a, b, c, d, e, f, g, h, i
Khazendar, A., Fenty, I. G., Carroll, D., Gardner, A., Lee, C. M., Fukumori, I., Wang, O., Zhang, H., Seroussi, H., Moller, D., Noël, B. P. Y., van den Broeke, M. R., Dinardo, S., and Willis, J.: Interruption of two decades of Jakobshavn Isbrae acceleration and thinning as regional ocean cools, Nat. Geosci., 12, 277–283, https://doi.org/10.1038/s41561-019-0329-3, 2019. a, b
Mankoff, K. D., Solgaard, A., Colgan, W., Ahlstrøm, A. P., Khan, S. A., and Fausto, R. S.: Greenland Ice Sheet solid ice discharge from 1986 through March 2020, Earth Syst. Sci. Data, 12, 1367–1383, https://doi.org/10.5194/essd-12-1367-2020, 2020. a, b, c
Marshall, J., Adcroft, A., Hill, C., Perelman, L., and Heisey, C.: A finite-volume, incompressible Navier Stokes model for studies of the ocean on parallel computers, J. Geophys. Res.-Oceans, 102, 5753–5766, https://doi.org/10.1029/96JC02775, 1997. a, b, c, d
Meire, L., Mortensen, J., Meire, P., Juul-Pedersen, T., Sejr, M. K., Rysgaard, S., Nygaard, R., Huybrechts, P., and Meysman, F. J.: Marine-terminating glaciers sustain high productivity in Greenland fjords, Glob. Change Biol., 23, 5344–5357, https://doi.org/10.1111/GCB.13801, 2017. a
Mernild, S. H., Holland, D. M., Holland, D., Rosing-Asvid, A., Yde, J. C., Liston, G. E., and Steffen, K.: Freshwater flux and spatiotemporal simulated runoffvariability into Ilulissat Icefjord, West Greenland, linked to salinity and temperature observations near tidewater glacier margins obtained using instrumented ringed seals, J. Phys. Oceanogr., 45, 1426–1445, https://doi.org/10.1175/JPO-D-14-0217.1, 2015. a, b, c, d, e, f, g
Mojica, J. F., Djoumna, G., Holland, D. M., and Holland, D.: Interannual summer mixing processes in the Ilulissat Icefjord, Greenland, J. Marine Syst., 214, 103476, https://doi.org/10.1016/j.jmarsys.2020.103476, 2021. a, b, c, d
Greenland Ecosystem Monitoring: MarineBasis Disko – Water column – CTD measurements (Version 1.0), Aarhus University, Denmark [data set], https://doi.org/10.17897/WH30-HT61, 2020. a, b
Moon, T., Sutherland, D. A., Carroll, D., Felikson, D., Kehrl, L., and Straneo, F.: Subsurface iceberg melt key to Greenland fjord freshwater budget, Nat. Geosci., 11, 49–54, https://doi.org/10.1038/s41561-017-0018-z, 2018. a, b, c, d
Morlighem, M., Williams, C. N., Rignot, E., An, L., Arndt, J. E., Bamber, J. L., Catania, G., Chauché, N., Dowdeswell, J. A., Dorschel, B., Fenty, I., Hogan, K., Howat, I., Hubbard, A., Jakobsson, M., Jordan, T. M., Kjeldsen, K. K., Millan, R., Mayer, L., Mouginot, J., Noël, B. P. Y., O'Cofaigh, C., Palmer, S., Rysgaard, S., Seroussi, H., Siegert, M. J., Slabon, P., Straneo, F., van den Broeke, M. R., Weinrebe, W., Wood, M., and Zinglersen, K. B.: BedMachine v3: Complete Bed Topography and Ocean Bathymetry Mapping of Greenland From Multibeam Echo Sounding Combined With Mass Conservation, Geophys. Res. Lett., 44, 11,051–11,061, https://doi.org/10.1002/2017GL074954, 2017. a, b
Mortensen, J., Rysgaard, S., Bendtsen, J., Lennert, K., Kanzow, T., Lund, H., and Meire, L.: Subglacial Discharge and its Down-Fjord Transformation in West Greenland Fjords With an Ice Melange, J. Geophys. Res.-Oceans, 125, e2020JC016301, https://doi.org/10.1029/2020JC016301, 2020. a, b
Motyka, R. J., Truffer, M., Fahnestock, M., Mortensen, J., Rysgaard, S., and Howat, I.: Submarine melting of the 1985 Jakobshavn Isbræ floating tongue and the triggering of the current retreat, J. Geophys. Res.-Earth, 116, F01007, https://doi.org/10.1029/2009JF001632, 2011. a
Mouginot, J., Rignot, E., Bjørk, A. A., van den Broeke, M., Millan, R., Morlighem, M., Noël, B., Scheuchl, B., and Wood, M.: Forty-six years of Greenland Ice Sheet mass balance from 1972 to 2018, P. Natl. Acad. Sci. USA, 116, 9239–9244, https://doi.org/10.1073/PNAS.1904242116, 2019. a
Moyer, A. N., Sutherland, D. A., Nienow, P. W., and Sole, A. J.: Seasonal Variations in Iceberg Freshwater Flux in Sermilik Fjord, Southeast Greenland From Sentinel-2 Imagery, Geophys. Res. Lett., 46, 8903–8912, https://doi.org/10.1029/2019GL082309, 2019. a
Muilwijk, M., Straneo, F., Slater, D. A., Smedsrud, L. H., Holte, J., Wood, M., Andresen, C. S., and Harden, B.: Export of ice sheet meltwater from Upernavik Fjord, West Greenland, J. Phys. Oceanogr., 52, 363–382, https://doi.org/10.1175/JPO-D-21-0084.1, 2021. a
O'Leary, M. and Christoffersen, P.: Calving on tidewater glaciers amplified by submarine frontal melting, The Cryosphere, 7, 119–128, https://doi.org/10.5194/tc-7-119-2013, 2013. a
Peters, I. R., Amundson, J. M., Cassotto, R., Fahnestock, M., Darnell, K. N., Truffer, M., and Zhang, W. W.: Dynamic jamming of iceberg-choked fjords, Geophys. Res. Lett., 42, 1122–1129, https://doi.org/10.1002/2014GL062715, 2015. a
Rezvanbehbahani, S., Stearns, L. A., Keramati, R., Shankar, S., and van der Veen, C. J.: Significant contribution of small icebergs to the freshwater budget in Greenland fjords, Communications Earth & Environment, 1, 1–7, https://doi.org/10.1038/s43247-020-00032-3, 2020. a
Rignot, E., Fenty, I., Xu, Y., Cai, C., and Kemp, C.: Undercutting of marine-terminating glaciers in West Greenland, Geophys. Res. Lett., 42, 5909–5917, https://doi.org/10.1002/2015GL064236, 2015. a
Sciascia, R., Straneo, F., Cenedese, C., and Heimbach, P.: Seasonal variability of submarine melt rate and circulation in an East Greenland fjord, J. Geophys. Res.-Oceans, 118, 2492–2506, https://doi.org/10.1002/jgrc.20142, 2013. a, b
Slater, D., Nienow, P., Sole, A., Cowton, T., Mottram, R., Langen, P., and Mair, D.: Spatially distributed runoff at the grounding line of a large Greenlandic tidewater glacier inferred from plume modelling, J. Glaciol, 63, 309–323, https://doi.org/10.1017/jog.2016.139, 2017. a, b
Slater, D. A., Goldberg, D. N., Nienow, P. W., and Cowton, T. R.: Scalings for Submarine Melting at Tidewater Glaciers from Buoyant Plume Theory, J. Phys. Oceanogr., 46, 1839–1855, https://doi.org/10.1175/JPO-D-15-0132.1, 2016. a
Slater, D. A., Nienow, P. W., Goldberg, D. N., Cowton, T. R., and Sole, A. J.: A model for tidewater glacier undercutting by submarine melting, Geophys. Res. Lett., 44, 2360–2368, https://doi.org/10.1002/2016GL072374, 2017a. a, b
Slater, D. A., Nienow, P. W., Goldberg, D. N., Cowton, T. R., and Sole, A. J.: A model for tidewater glacier undercutting by submarine melting, Geophys. Res. Lett., 44, 2360–2368, https://doi.org/10.1002/2016GL072374, 2017b. a
Slater, D. A., Straneo, F., Das, S. B., Richards, C. G., Wagner, T. J. W., and Nienow, P. W.: Localized Plumes Drive Front-Wide Ocean Melting of A Greenlandic Tidewater Glacier, Geophys. Res. Lett., 45, 12,350–12,358, https://doi.org/10.1029/2018GL080763, 2018. a
Slater, D. A., Straneo, F., Felikson, D., Little, C. M., Goelzer, H., Fettweis, X., and Holte, J.: Estimating Greenland tidewater glacier retreat driven by submarine melting, The Cryosphere, 13, 2489–2509, https://doi.org/10.5194/tc-13-2489-2019, 2019. a
Slater, D. A., Benn, D. I., Cowton, T. R., Bassis, J. N., and Todd, J. A.: Calving Multiplier Effect Controlled by Melt Undercut Geometry, J. Geophys. Res.-Earth, 126, e2021JF006191, https://doi.org/10.1029/2021JF006191, 2021. a, b, c
Straneo, F. and Cenedese, C.: The Dynamics of Greenland's Glacial Fjords and Their Role in Climate, Annu. Rev. Marine Sci., 7, 89–112, https://doi.org/10.1146/annurev-marine-010213-135133, 2015. a
Straneo, F., Heimbach, P., Sergienko, O., Hamilton, G., Catania, G., Griffies, S., Hallberg, R., Jenkins, A., Joughin, I., Motyka, R., Pfeffer, W. T., Price, S. F., Rignot, E., Scambos, T., Truffer, M., and Vieli, A.: Challenges to understanding the dynamic response of Greenland's marine terminating glaciers to oc eanic and atmospheric forcing, B. Am. Meteorol. Soc., 94, 1131–1144, https://doi.org/10.1175/BAMS-D-12-00100.1, 2013. a
Straneo, F., Sutherland, D. A., Stearns, L., Catania, G., Heimbach, P., Moon, T., Cape, M. R., Laidre, K. L., Barber, D., Rysgaard, S., Mottram, R., Olsen, S., Hopwood, M. J., and Meire, L.: The case for a sustained Greenland Ice sheet-Ocean Observing System (GrIOOS), Frontiers in Marine Science, 6, 138, https://doi.org/10.3389/FMARS.2019.00138, 2019. a
Sutherland, D. A., Jackson, R. H., Kienholz, C., Amundson, J. M., Dryer, W. P., Duncan, D., Eidam, E. F., Motyka, R. J., and Nash, J. D.: Direct observations of submarine melt and subsurface geometry at a tidewater glacier, Science, 365, 369–374, https://doi.org/10.1126/SCIENCE.AAX3528, 2019. a
Truffer, M. and Motyka, R. J.: Where glaciers meet water: Subaqueous melt and its relevance to glaciers in various settings, Rev. Geophys., 54, 220–239, https://doi.org/10.1002/2015RG000494, 2016. a
Wood, M., Rignot, E., Fenty, I., An, L., Bjørk, A., van den Broeke, M., Cai, C., Kane, E., Menemenlis, D., Millan, R., Morlighem, M., Mouginot, J., Noël, B., Scheuchl, B., Velicogna, I., Willis, J. K., and Zhang, H.: Ocean forcing drives glacier retreat in Greenland, Sci. Adv., 7, eaba7282, https://doi.org/10.1126/sciadv.aba7282, 2021. a