the Creative Commons Attribution 4.0 License.
the Creative Commons Attribution 4.0 License.
 | 29 Aug 2023
Brief communication: The Glacier Loss Day as an indicator of a record-breaking negative glacier mass balance in 2022
Annelies Voordendag
Rainer Prinz
Lilian Schuster
Georg Kaser
In the hydrological year 2021/2022, Alpine glaciers showed unprecedented mass loss. On Hintereisferner (Ötztal Alps, Austria), the glacier-wide mass balance was −3319 kg m−2. Near-daily observations of the surface elevation changes from a permanent terrestrial laser scanning set-up allowed the determination of the day when the mass balance of Hintereisferner started to become negative. This Glacier Loss Day (GLD) was already reached on 23 June in 2022 and gave way to a long ice ablation period. In 2021/2022, this and the high cumulative positive degree days explain the record-breaking mass loss. By comparing the GLDs of 2019/2020–2021/2022, we found a gross yet expressive indicator of the glacier's imbalance with the persistently warming climate.
- Article
(698 KB) - Full-text XML
- BibTeX
- EndNote


During recent decades, climate-induced annual mass balances were persistently negative on most glaciers worldwide (Hugonnet et al., 2021). In the European Alps, the mass loss of the glaciers was particularly noteworthy in the hydrological year 2021/2022 (GLAMOS – Glacier Monitoring Switzerland, 2022; Copernicus Climate Change Service (C3S), 2023), as shown, in our example, in the 70-year long record of annual mass balances on Hintereisferner (HEF; Ötztal Alps, Austria) in Fig. 1. The return period for the 2021/2022 annual mass balance exceeds 1000 years when considering the 70-year mass balance series for the generalised extreme value distribution fit.
Early in the summer 2022, it became obvious that the day would soon be reached when all of the mass gained from the accumulation period would be lost. By assuming that after this day, during summer, the glacier loses mass irrecoverably for the rest of the mass balance year, we call this day the Glacier Loss Day (GLD) in an approximate analogy to the Earth Overshoot Day (e.g. Wackernagel et al., 2002; Collins et al., 2020), which marks the date on which humanity's annual consumption of ecological resources exceeds what Earth can regenerate in the same year. Following a steady-state concept, by reaching a GLD, the glacier obviously leaves the balance with the environmental conditions for the given mass balance year. The earlier the GLD is reached, the higher the probability of massive mass loss. The key to interpreting and using the GLD as a near-real-time gross but expressive indicator for a glacier's state of “illness” is to record its progressing volume and mass loss during an ablation season at a daily resolution.
A daily mass loss record of a glacier and the respective detection of a GLD can be retrieved from mass balance modelling in daily time steps in near-real time. Cremona et al. (2023) upscaled the mass loss on three Alpine glaciers from six automated ablation stake readings to the full area of the respective glaciers by applying a mass balance model; this model was eventually also upscaled to the scale of the entire Swiss Alps. The authors do not, however, explicitly indicate a GLD for these glaciers. A second way is to measure the daily volume changes over an entire glacier, as was done on HEF in the 3 consecutive mass balance years (2019/2020, 2020/2021, and 2021/2022) from daily terrestrial laser scanning (TLS) acquisitions (Voordendag et al., 2021, 2023a). From the 3 years with available data, we identify the GLD and compare the extremely negative mass balance of 2021/2022 with the two precedent and “normally” negative mass balance years for which near-daily TLS data are available. By analysing these records in light of the ablation season air temperature and winter mass balance records, we explore the GLD's potential for serving as a nearly instant indicator of a glacier's state under the respective year's climatic conditions.
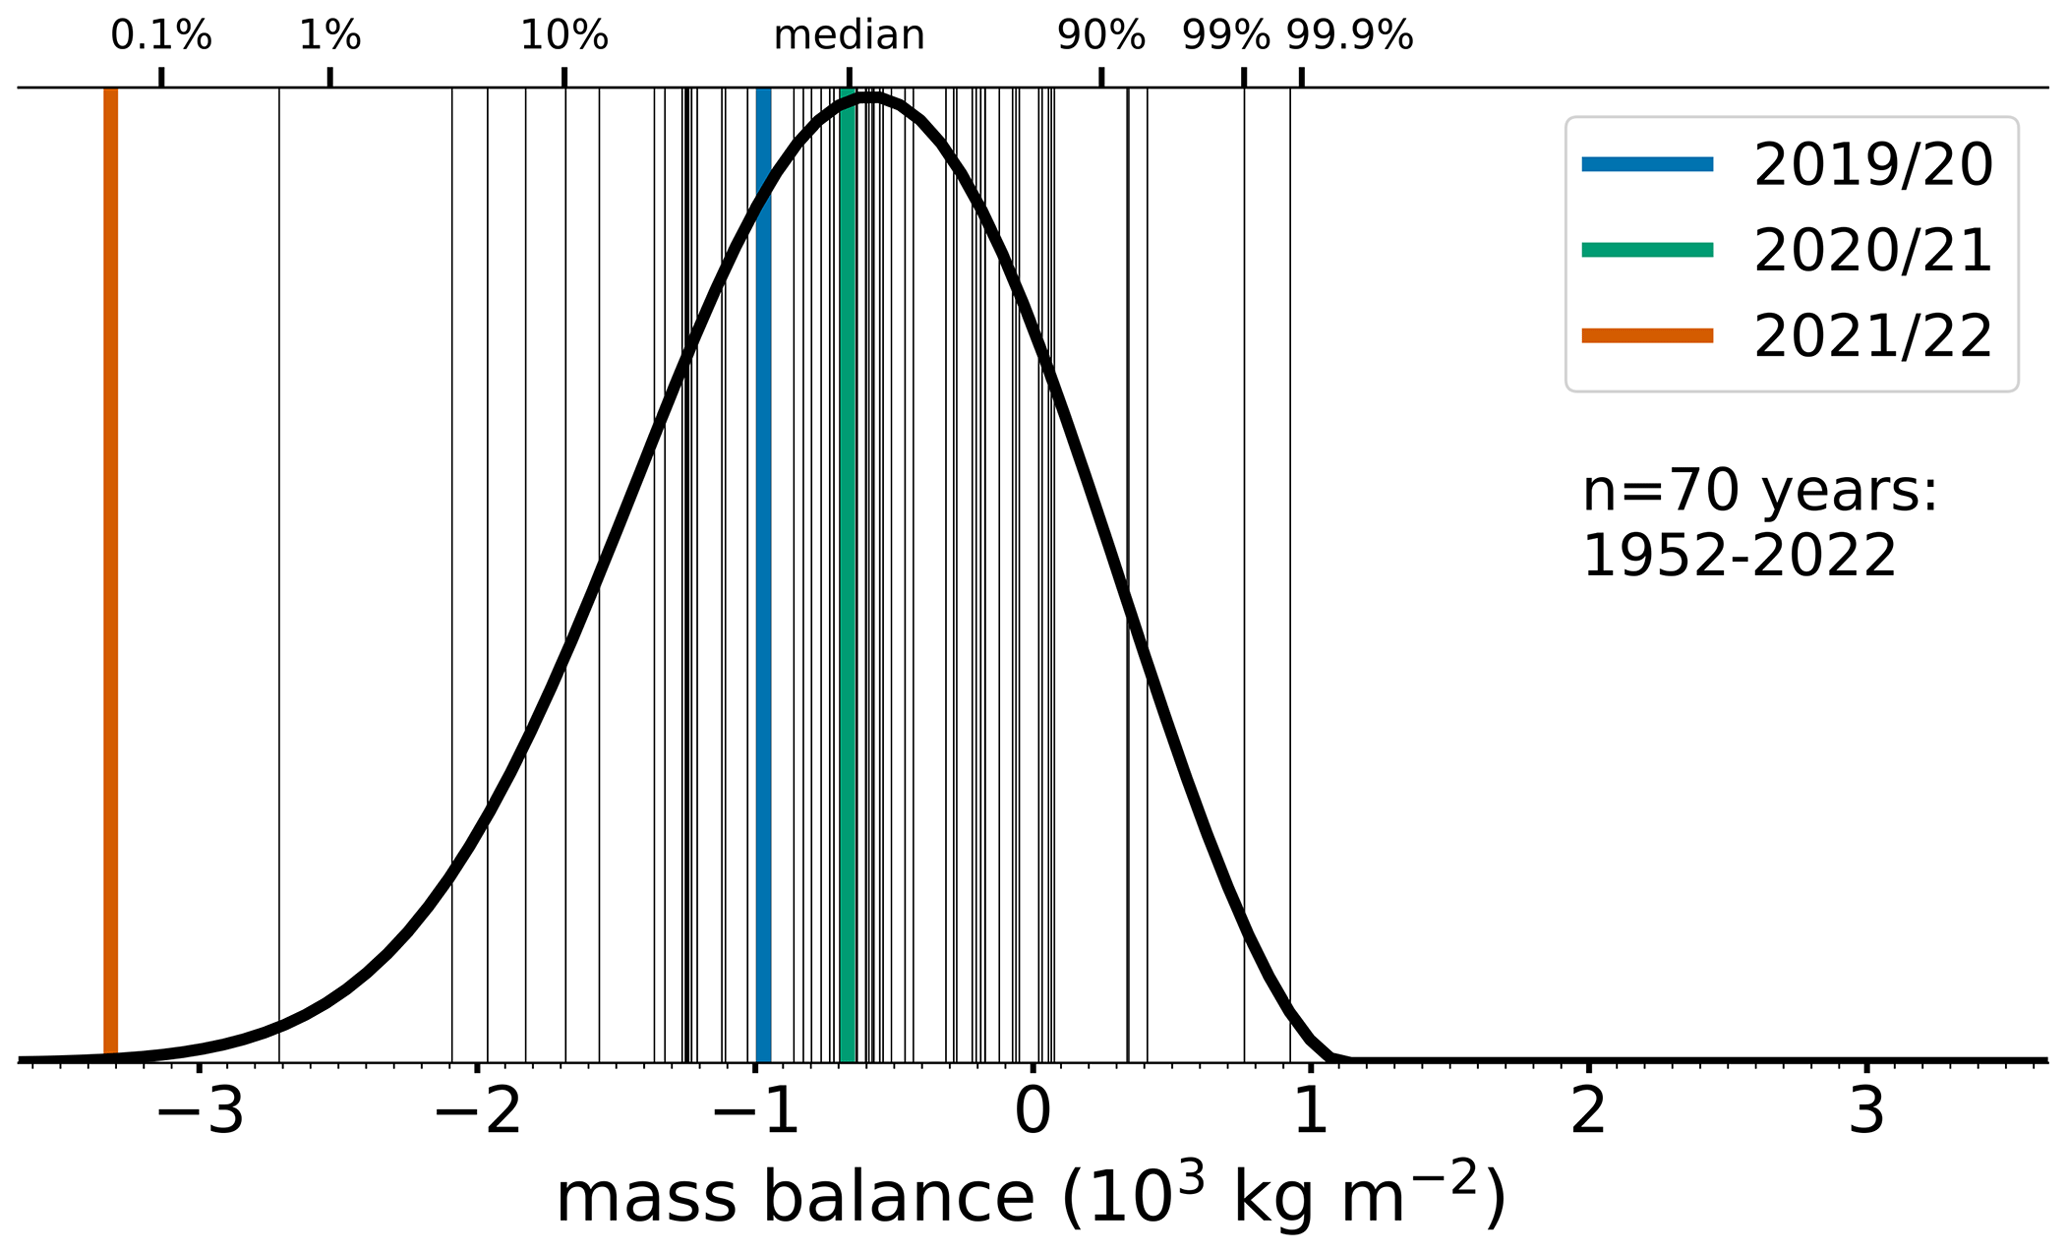
Figure 1The annual mass balance observations of Hintereisferner (in 103 kg m−2) over the full 70-year record are depicted as vertical lines. A fitted generalised extreme value distribution of these observations is added with the respective quantiles on the secondary x axis to emphasize the extreme nature of the year 2021/2022. The hydrological years used in this study are given in blue (2019/2020), green (2020/2021), and red (2021/2022). The idea of this figure was inspired by a post on Matthias Huss's Twitter profile (now called X; https://twitter.com/matthias_huss/status/1575539821493293058, last access: 15 March 2023).
The well-studied HEF is a valley glacier in the Ötztal Alps, Austria, which has had continuous mass balance observations since 1952/1953, providing a rich set of glacier, atmosphere, and hydrology data (Strasser et al., 2018), which makes it one of the key reference glaciers for the World Glacier Monitoring Service (WGMS; Zemp et al., 2009).
A permanently installed long-range TLS system called Im Hinteren Eis (Voordendag et al., 2021) allows the acquisition of a daily digital elevation model (DEM) of HEF. The TLS system was permanently installed in 2016, has been in daily operational use since March 2019, and was automated in June 2020 (Voordendag et al., 2021). Additionally, glaciological mass balance observations since 1952/1953 with an uncertainty of ±210 kg m−2 (Klug et al., 2018) and common meteorological observations from Station Hintereis (3026 m a.s.l.), located on the slope opposite to the TLS system (Strasser et al., 2018), have been available.
The data from the TLS are acquired as point clouds and registered manually in the RiSCAN PRO software (RIEGL, 2019). For this study, it is chosen to calculate grids with a 10 m horizontal grid spacing, where a mean value is taken over all returned laser pulses in a 10 m × 10 m grid. Although grid sizes of 1 m × 1 m could also be provided from the TLS measurements, the 10 m × 10 m grid cells are a compromise between the high spatial resolution and a good coverage of the glacier. The spatial coverage increases with a higher horizontal grid spacing. Only few laser pulses are returned per 100 m2 at long ranges (> 3000 m) and unfavourable incidence angles (Voordendag et al., 2023a), so not every 1 m × 1 m grid cell would be covered. However, these few pulses are still assumed to be representative of the surrounding area of 10 m × 10 m, and with 1 m × 1 m grids, several grid cells would be lost within the 100 m2. The 1 m × 1 m DEMs have an accuracy of ±10 cm (Voordendag et al., 2023a), and the same accuracy is assumed for the 10 m × 10 m DEMs. This accuracy is within previously reported errors in the airborne laser scanning acquisitions (Klug et al., 2018) and enables the calculation of volume change rates and, ultimately, the GLD.
Each DEM is cropped to the 2018 glacier outlines of HEF, and the DEM of difference (DoD) between each registered DEM to the reference DEM of 1 October of the corresponding hydrological year is calculated. Given the scanning geometry of the system, between 81 % and 83 % of the glacier area are covered. The unmeasured areas are mainly comprised of tributary basins (∼ 10 %) that are no longer connected to the glacier and some areas in the upper part of the main glacier. The basins are still included in the glacier mass balance data of HEF to ensure the continuity of the mass balance data set (Klug et al., 2018) and are also included in this study to enable a comparison with the glaciological mass balance measurements. A total of 125 usable DoDs are available in 2019/2020, 151 in 2020/2021, and 164 in 2021/2022 after omitting scans disturbed by clouds or technical problems (e.g. a power shortage in winter 2019/2020 and the impossibility of reaching the set-up during the COVID-19 lockdown) and outlier filtering. No interpolation has been applied to the data set, as an interpolation would introduce additional uncertainties. Furthermore, the coverage seems to have limited influence on the GLD analysis, as our geodetic and glaciological mass balance observations over the last 6 hydrological years on HEF are in agreement with respect to their mean seasonal and annual values within the uncertainty range of ±210 kg m−2 found by Klug et al. (2018). The effects of ice flow divergence on the surface elevation changes (see Cuffey and Paterson, 2010; Sect. 8.5.5) are omitted, as ice flow velocities are very low (< 10 m yr−1; Stocker-Waldhuber et al., 2019), by integrating the elevation changes over the entire glacier area (e.g. Kuhn et al., 1999; Zemp et al., 2010; Klug et al., 2018).
Subsequently, the average elevation change in the covered glacier area is calculated and plotted over the hydrological year. The day on which the elevation change graphically crosses the reference elevation from the past autumn is assigned the GLD. As data points may not always be exactly available at the GLD, we interpolate linearly between the last positive and first negative surface elevation change to assign the GLD. Finally, a linear trend is calculated between the first day of the melt season and the GLD to calculate the melt rate until the GLD is reached. We manually select the first day of the melt season, which is the first day after which surface elevation decrease is continuously observed.
The density for converting the daily glacier-wide volume into mass change varies over the course of the year between densities for fresh snow and ice. However, as we assume that on the GLD both volume and mass change equal zero, the determination of a conversion density is not necessary. To strengthen this assumption, we compare the accumulation area ratio for years with observed equilibrium mass balances to the accumulation area ratio (AAR) at the GLD derived from the TLS. With the extensive glaciological mass balance record at HEF, it was found that the AAR at the end of hydrological years with equilibrium mass balance conditions (0 ± 100 kg m−2) is between 0.63 and 0.75 (mean 0.69). In the hydrological years of this study, the AAR is observed with the time-lapse cameras and derived from the reflectance images of the TLS (Prantl et al., 2017). Similar AARs at the GLD are found between 0.66 and 0.71, and so, the glacier must be in equilibrium mass balance conditions on the GLD. Moreover, only small inter-annual variations in the snowline retreat pattern occur during the ablation season, indicating a persistence in this correlation.
A given GLD is the result of (i) the amount of mass gained during the accumulation season starting on 1 October, (ii) the start of the ablation season, and (iii) the strength of the ablation rate until the GLD is reached (Fig. 2a).
- i.
At the end of the accumulation season, the average (or glacier-wide) elevation change peaks at a maximum of only 2.1 m of snow in 2022 (Fig. 2a), which equals a glaciological winter mass balance of only 691 kg m−2. In 2020 (2021), the winter accumulation was significantly higher, with an average elevation change over HEF of 3.5 m (3.9 m) at maximum, which resulted in a long-term “normal” winter mass balance of 1396 (1219) kg m−2. However, the glaciological measurements were corrected to 30 April, whereas the maximum surface elevation changes were found at different dates. The winter mass balance of 2022 was 43 % below the decadal average of 2011–2020. Additionally, the day of peak snow height was 29 April in 2022, whereas this was on 7 (28) May for 2020 (2021). Here, we also note that the TLS measurements in 2020 are sparse due to problems with the power supply, and thus, the day of peak snow height might have occurred later in May 2020. The low winter mass accumulation in 2022 paved the way for an early GLD and an extreme glacier mass loss.
- ii.
In addition, the melting season started earlier in 2022, i.e. on 11 May compared to 23 June 2020 and 28 May 2021, providing a second reason for an extraordinarily early GLD. Figure 2b shows the cumulative positive degree days (CPDDs), starting from 1 May, with air temperature measurements from the automatic weather station, Station Hintereis. The first positive degree days (PDDs) already occurred on 11 May in 2022, which initiated a nearly uninterrupted melting season. In 2020 and 2021, PDDs were also measured in May but often followed by cold days that halted ablation. The period with continuous and significant PDDs started at the end of June in 2020 and at the end of May in 2021.
- iii.
The surface elevation change rate between the start of the melting season and the GLD for 2020 (2021) was 5.6 (5.2) cm d−1 but only 4.4 cm d−1 in 2022. The surface elevation change rates until the GLD are a combination of the compaction of fresh snow and melt. The compaction of fresh snow was likely the case in May–June 2021, as strong snowfall occurred just before this period. The potential for melt in this period is generally a combination of positive air temperatures, global radiation, albedo, clouds, and event-based heat release from rain on snow. In 2022, the lower surface elevation change rate was caused by the early start of the ablation season, when potential melt energy is generally lower due to lower radiation, but there were high PDDs in that year.
The GLD of the extreme hydrological year 2021/2022 was reached on 23 June and 11 August in 2019/2020 and 2020/2021, respectively. Years with an early GLD allow for more ice to be exposed to high potential melt energy and a longer ice ablation season and thus generally offer more negative mass balances. However, the course of the ablation season might be variable, and periods with strong melt alternate with periods of no melt or even slight accumulation. Thus, a mass balance prediction from the GLD alone seems questionable, and mass balance projections must follow scenarios of assumed ablation conditions. In 2022, 100 d remain from the GLD until the end of the hydrological year, whereas only 51 d remain in the 2 preceding years. The end of the ablation season, which is here defined as the minimum surface elevation change, is almost the same in the 3 studied years, i.e. on 18 September 2020, on 26 September 2021, and 14 September 2022. Note that the end of the ablation season is variable, as it can either end with late summer snowfall and/or low temperatures or can extend into the following hydrological year. In 2021/2022, the early GLD, which enabled a long ice ablation season, and the high CPDDs (Fig. 2b) explain the record-breaking mass loss of 3319 kg m−2, which is 3.4 and 5.0 times higher than in the 2 preceding years (Fig. 1) and 3.2 times higher than the long-term mean for 1991–2020.
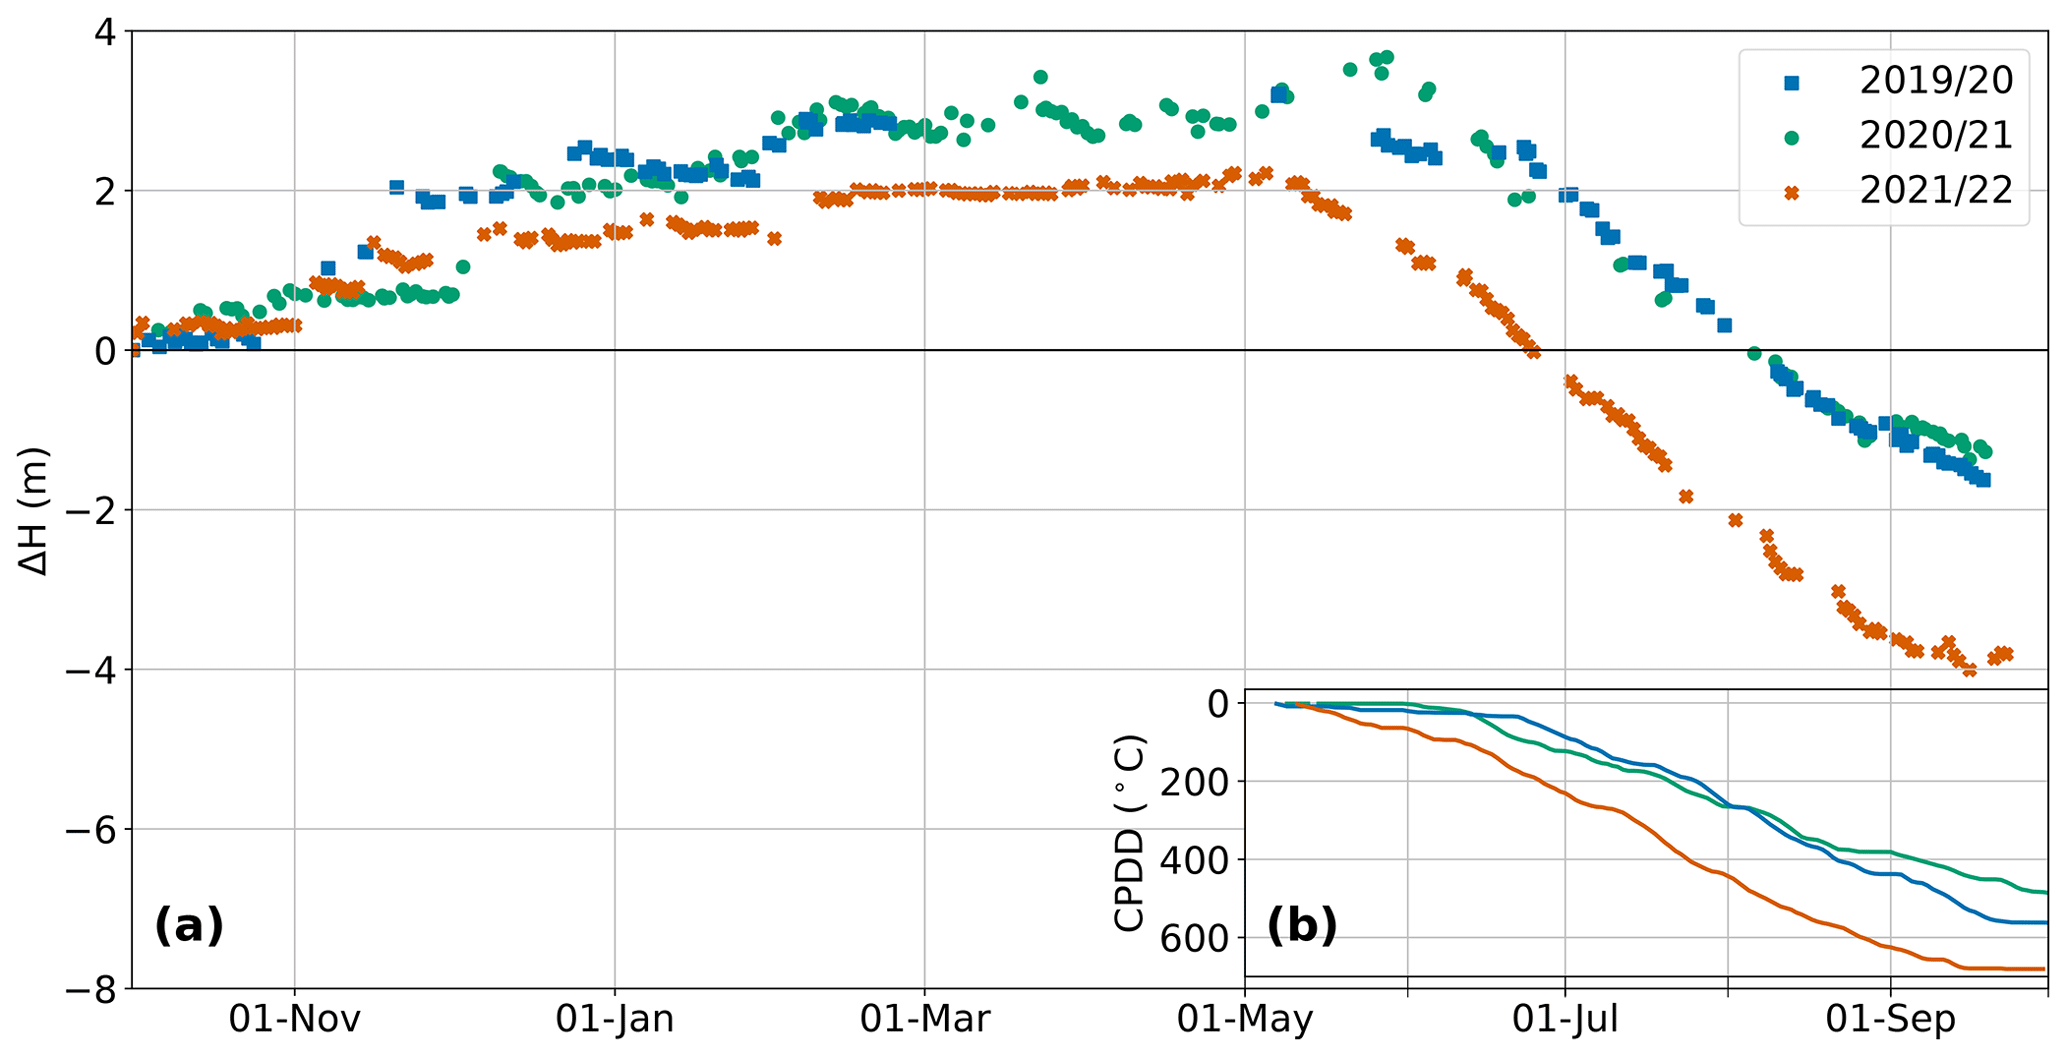
Figure 2(a) The average surface elevation change ΔH over HEF for the hydrological years 2019/2020 (blue), 2020/2021 (orange), and 2021/2022 (green). (b) The cumulative positive degree days (CPDDs) calculated from 1 May until 30 September for the same hydrological years.
Tracking the volume and mass changes of a glacier in daily time steps allows a nearly instant evaluation of the state of a glacier in a particular year. We introduce the Glacier Loss Day (GLD) as being the day in the hydrological year on which the mass accumulated during winter is lost, and the glacier loses mass irrecoverably for the rest of the mass balance year. Near-daily TLS observations of glacier surface elevation changes at HEF are used, and 3 years of GLD observations are available. The GLD of the extreme hydrological year 2021/2022 was already reached on 23 June, whereas this was 49 d later in 2019/2020 and 2020/2021 (on 11 August). In 2021/2022, the low winter accumulation and the early start of the ablation season defined the early GLD and gave way to a long and extensive ice ablation period. This and the high CPDDs in 2021/2022 explained the record-breaking mass loss of 3319 kg m−2.
The GLD summarises the mass balance development of the respective year and indicates the basis for the remaining mass loss potential before accumulation starts. A very early GLD means that there is higher potential for a substantial mass loss year. It contains information that is highly relevant for the public and is, similar to the Earth Overshoot Day, a valid and powerful communication tool. Additionally, the GLD could serve to aid water management strategies and help to schedule scientific fieldwork. However, assumptions must be made on the ablation rates and duration of the ablation season after the GLD has been reached.
Nevertheless, we are aware that a set-up such as the one at HEF is unique and only feasible on specific glaciers. However, with ongoing developments in modelling approaches (e.g. Landmann et al., 2021) and improvements in glaciological and geodetic measurements, mainly with automated ablatometers (e.g. Landmann et al., 2021; Cremona et al., 2023; Carturan et al., 2019; A2 Photonic Sensors, 2022), uncrewed aerial vehicles, and the increasing availability of high-resolution satellite data (Pandey et al., 2022), the GLD of other glaciers can be studied and communicated in the future.
The RiSCAN PRO software is used to register the TLS point clouds and can be obtained from the manufacturer (RIEGL, 2019). The data and script to reproduce the plots in this article are publicly available via Zenodo at https://doi.org/10.5281/zenodo.7684347 (Voordendag et al., 2023b).
The contact author has declared that none of the authors has any competing interests.
Publisher's note: Copernicus Publications remains neutral with regard to jurisdictional claims in published maps and institutional affiliations.
This research is embedded in the SCHISM project (Snow Cover Dynamics and High-resolution Modelling) and is funded by the Austrian Science Fund (FWF) and the German Research Foundation (DFG) research project (grant no. I3841-N32). Lilian Schuster is the recipient of a DOC Fellowship from the Austrian Academy of Sciences (ÖAW). Further funding was granted by the University of Innsbruck.
This paper was edited by Etienne Berthier and reviewed by Aaron Cremona and one anonymous referee.
A2 Photonic Sensors: SmartStake – Monitor the glacier ablation with sub-hourly time step and millimetric accuracy, https://a2photonicsensors.com/smartstake-monitor-glacier-ablation/ (last access: 15 March 2023), 2022. a
Carturan, L., Cazorzi, F., Fontana, G. D., and Zanoner, T.: Automatic measurement of glacier ice ablation using thermistor strings, J. Glaciol., 65, 188–194, https://doi.org/10.1017/jog.2018.103, 2019. a
Collins, A., Galli, A., Hipwood, T., and Murthy, A.: Living within a One Planet reality: the contribution of personal Footprint calculators, Environ. Res. Lett., 15, 025008, https://doi.org/10.1088/1748-9326/ab5f96, 2020. a
Copernicus Climate Change Service (C3S): European State of the Climate 2022, https://doi.org/10.24381/GVAF-H066, 2023. a
Cremona, A., Huss, M., Landmann, J. M., Borner, J., and Farinotti, D.: European heat waves 2022: contribution to extreme glacier melt in Switzerland inferred from automated ablation readings, The Cryosphere, 17, 1895–1912, https://doi.org/10.5194/tc-17-1895-2023, 2023. a, b
Cuffey, K. M. and Paterson, W. S. B.: The Physics of Glaciers, Elsevier LTD, Oxford, ISBN 978-0-12-369461-4, 2010. a
GLAMOS – Glacier Monitoring Switzerland: Swiss Glacier Mass Balance (release 2022), Glacier Monitoring Switzerland [data set], https://doi.org/10.18750/MASSBALANCE.2022.R2022, 2022. a
Hugonnet, R., McNabb, R., Berthier, E., Menounos, B., Nuth, C., Girod, L., Farinotti, D., Huss, M., Dussaillant, I., Brun, F., and Kääb, A.: Accelerated global glacier mass loss in the early twenty-first century, Nature, 592, 726–731, https://doi.org/10.1038/s41586-021-03436-z, 2021. a
Klug, C., Bollmann, E., Galos, S. P., Nicholson, L., Prinz, R., Rieg, L., Sailer, R., Stötter, J., and Kaser, G.: Geodetic reanalysis of annual glaciological mass balances (2001–2011) of Hintereisferner, Austria, The Cryosphere, 12, 833–849, https://doi.org/10.5194/tc-12-833-2018, 2018. a, b, c, d, e
Kuhn, M., Dreiseitl, E., Hofinger, S., Markl, G., Span, N., and Kaser, G.: Measurements and Models of the Mass Balance of Hintereisferner, Geograf. Ann. A., 81, 659–670, https://doi.org/10.1111/j.0435-3676.1999.00094.x, 1999. a
Landmann, J. M., Künsch, H. R., Huss, M., Ogier, C., Kalisch, M., and Farinotti, D.: Assimilating near-real-time mass balance stake readings into a model ensemble using a particle filter, The Cryosphere, 15, 5017–5040, https://doi.org/10.5194/tc-15-5017-2021, 2021. a, b
Pandey, M., Pandey, P. C., Ray, Y., Arora, A., Jawak, S. D., and Shukla, U. K. (Eds.): Advances in Remote Sensing Technology and the Three Poles, Wiley, https://doi.org/10.1002/9781119787754, 2022. a
Prantl, H., Nicholson, L., Sailer, R., Hanzer, F., Juen, I., and Rastner, P.: Glacier Snowline Determination from Terrestrial Laser Scanning Intensity Data, Geosciences, 7, 60, https://doi.org/10.3390/geosciences7030060, 2017. a
RIEGL: RiSCAN PRO, RIEGL Laser Measurement Systems, Horn, Austria, Version 2.8.0, Computer software, 2019. a, b
Stocker-Waldhuber, M., Fischer, A., Helfricht, K., and Kuhn, M.: Long-term records of glacier surface velocities in the Ötztal Alps (Austria), Earth Syst. Sci. Data, 11, 705–715, https://doi.org/10.5194/essd-11-705-2019, 2019. a
Strasser, U., Marke, T., Braun, L., Escher-Vetter, H., Juen, I., Kuhn, M., Maussion, F., Mayer, C., Nicholson, L., Niedertscheider, K., Sailer, R., Stötter, J., Weber, M., and Kaser, G.: The Rofental: a high Alpine research basin (1890–3770 m a.s.l.) in the Ötztal Alps (Austria) with over 150 years of hydrometeorological and glaciological observations, Earth Syst. Sci. Data, 10, 151–171, https://doi.org/10.5194/essd-10-151-2018, 2018. a, b
Voordendag, A., Goger, B., Klug, C., Prinz, R., Rutzinger, M., Sauter, T., and Kaser, G.: Uncertainty assessment of a permanent long-range terrestrial laser scanning system for the quantification of snow dynamics on Hintereisferner (Austria), Front. Earth Sci., 11, https://doi.org/10.3389/feart.2023.1085416, 2023a. a, b, c
Voordendag, A., Prinz, R., Schuster, L., and Kaser, G.: The glacier loss day as indicator for extreme glacier melt in 2022, Zenodo [code and data set], https://doi.org/10.5281/zenodo.7684347, 2023b. a
Voordendag, A. B., Goger, B., Klug, C., Prinz, R., Rutzinger, M., and Kaser, G.: AUTOMATED AND PERMANENT LONG-RANGE TERRESTRIAL LASER SCANNING IN A HIGH MOUNTAIN ENVIRONMENT: SETUP AND FIRST RESULTS, ISPRS Ann. Photogramm. Remote Sens. Spatial Inf. Sci., V-2-2021, 153–160, https://doi.org/10.5194/isprs-annals-V-2-2021-153-2021, 2021. a, b, c
Wackernagel, M., Schulz, N. B., Deumling, D., Linares, A. C., Jenkins, M., Kapos, V., Monfreda, C., Loh, J., Myers, N., Norgaard, R., and Randers, J.: Tracking the ecological overshoot of the human economy, P. Natl. Acad. Sci. USA, 99, 9266–9271, https://doi.org/10.1073/pnas.142033699, 2002. a
Zemp, M., Hoelzle, M., and Haeberli, W.: Six decades of glacier mass-balance observations: a review of the worldwide monitoring network, Ann. Glaciol., 50, 101–111, https://doi.org/10.3189/172756409787769591, 2009. a
Zemp, M., Jansson, P., Holmlund, P., Gärtner-Roer, I., Koblet, T., Thee, P., and Haeberli, W.: Reanalysis of multi-temporal aerial images of Storglaciären, Sweden (1959–99) – Part 2: Comparison of glaciological and volumetric mass balances, The Cryosphere, 4, 345–357, https://doi.org/10.5194/tc-4-345-2010, 2010. a