the Creative Commons Attribution 4.0 License.
the Creative Commons Attribution 4.0 License.
 | 19 Jul 2023
Identifying mountain permafrost degradation by repeating historical electrical resistivity tomography (ERT) measurements
Johannes Buckel
Jan Mudler
Rainer Gardeweg
Christian Hauck
Christin Hilbich
Regula Frauenfelder
Christof Kneisel
Sebastian Buchelt
Jan Henrik Blöthe
Andreas Hördt
Matthias Bücker
Ongoing global warming intensifies the degradation of permafrost. Permafrost thawing impacts landform evolution, reduces freshwater resources, enhances the potential of natural hazards and thus has significant socio-economic impacts. Electrical resistivity tomography (ERT) has been widely used to map the ice-containing permafrost by its resistivity contrast compared to the surrounding unfrozen medium. This study aims to reveal the effects of ongoing climate warming on mountain permafrost by repeating historical ERT and analyzing the temporal changes in the resistivity distribution. In order to facilitate the measurements, we introduce and discuss the employment of textile electrodes. These newly developed electrodes significantly reduce working effort, are easy to deploy on blocky surfaces and yield sufficiently low contact resistances. We analyze permafrost evolution on three periglacial landforms (two rock glaciers and one talus slope) in the Swiss and Austrian Alps by repeating historical surveys after 10, 12 and 16 years, respectively. The resistivity values have been significantly reduced in ice-poor permafrost landforms at all study sites. Interestingly, resistivity values related to ice-rich permafrost in the studied active rock glacier partly increased during the studied time period. To explain this apparently counterintuitive (in view of increased resistivity) observation, geomorphological circumstances, such as the relief and increased creep velocity of the active rock glacier, are discussed by using additional remote sensing data. The present study highlights ice-poor permafrost degradation in the Alps resulting from ever-accelerating global warming.
- Article
(13028 KB) - Full-text XML
- BibTeX
- EndNote


Permafrost as a thermal phenomenon of perennially cryotic ground (Ballantyne, 2018) responds directly to atmospheric temperature increase by warming and, subsequently, thawing (Biskaborn et al., 2019; Smith et al., 2022). Significant socio-economic impacts are projected for human livelihoods as a result of mountain permafrost degradation (Beniston et al., 2018; Hock et al., 2019). Perennial subsurface ice content acts as a significant freshwater resource, although the timescales of melting and corresponding runoff contributions are still unclear (Arenson et al., 2022; Hilbich et al., 2022; Jones et al., 2018; Villarroel et al., 2021). Rock and debris-slope instability results in increased rockfall and debris-flow frequency and intensity, as well as landslide activity (Chiarle et al., 2021; Deline et al., 2015; Frauenfelder et al., 2018; Haeberli et al., 2017; Patton et al., 2019). These permafrost-related natural hazards threaten infrastructure, habitants, tourists and sport activities in high-mountain regions (Duvillard et al., 2019; Keuschnig et al., 2017; Mourey et al., 2022).
Systematic mountain permafrost observations have a long tradition in the Alps (e.g., Haeberli et al., 1993). A Swiss network of thermistors installed in boreholes directly monitors ground temperatures, giving the mean annual ground temperature (MAGT) (Etzelmüller et al., 2020; Vonder Mühll et al., 2008), which can be used to differentiate between ice-poor and ice-rich permafrost (Haberkorn et al., 2021; Kenner et al., 2019). As the installation of boreholes is cost and time intensive, indirect methods are often applied for subsurface ice detection and permafrost characterization (Halla et al., 2021; Maurer and Hauck, 2007; Vonder Mühll et al., 2002). The application of direct-current (DC) soundings in early studies (Barsch and King, 1989; Fisch et al., 1977; King et al., 1987) and electrical resistivity tomography (ERT) more recently (Hauck, 2002; Kellerer-Pirklbauer and Kaufmann, 2018; Kneisel and Hauck, 2008) has enabled the localization and characterization of permafrost in a variety of high-mountain settings. ERT measurements differentiate ice-containing debris and bedrock from unfrozen material based on the significantly increased electrical resistivity of frozen material (Hauck and Kneisel, 2008; Mewes et al., 2017). As electrical current conduction in subsurface materials is mainly promoted by water filling the pore space or covering grain surfaces, the electrical resistivity (i.e., the inverse of the electrical conductivity) strongly increases as the aqueous phase freezes out (Barsch, 1996; Hauck, 2002; Hilbich et al., 2009; Mewes et al., 2017; Mudler et al., 2019). However, the thawing and freezing processes around the freezing point can be delayed by latent heat fluxes associated with phase change (ice–water), rather than warming or cooling of the subsurface (Mollaret et al., 2019).
ERT measurements have also been successfully applied to detect and characterize permafrost on periglacial landforms as protalus ramparts (e.g., Fukui, 2002; Scapozza, 2015), talus slopes (e.g., Kenner et al., 2017; Kneisel et al., 2000; Lambiel and Pieracci, 2008; Scapozza et al., 2011) and rock glaciers (e.g., Buckel et al., 2022; Frauenfelder et al., 2008; Halla et al., 2021; Kellerer-Pirklbauer and Kaufmann, 2018; Maurer and Hauck, 2007; Villarroel et al., 2021). ERT surveys have also been applied to study bedrock permafrost on several mountains in the Alps (Keuschnig et al., 2017; Krautblatter et al., 2010; Krautblatter and Hauck, 2007; Magnin et al., 2015, 2017). Some of these latter studies employed permanently installed ERT profiles to monitor changes in the ground ice content and the active-layer thickness over several years. ERT applications in high-mountain areas (Hauck, 2002; Hilbich et al., 2011; Supper et al., 2014) or polar environments (Farzamian et al., 2020; Oldenborger and LeBlanc, 2018; Uhlemann et al., 2021) have shown that repeated ERT data are capable of monitoring the long-term permafrost evolution. Monitoring intervals can vary from hourly to multi-year intervals, depending on the research objective, whereby longer intervals are suitable for recording long-term permafrost changes due to climate change (Etzelmüller et al., 2020; Kneisel et al., 2014). Emerging challenges such as changing contact resistances, different instruments or inversion artifacts can be addressed, for example, by statistical analysis (Supper et al., 2014) or adapted data processing schemes (Oldenborger and LeBlanc, 2018).
However, quantitative analyses of mountain permafrost degradation related to subsurface ice content are scarce (e.g., Hilbich et al., 2008; Mollaret et al., 2019) or do not exist at all, especially for longer time periods (>10 years). We fill this gap by repeating ERT measurements along existing transects from the years 2005 to 2011 published in Frauenfelder et al. (2008) and Otto et al. (2012). Compared to regular and continuous measurements, for example by automated ERT systems (e.g., Farzamian et al., 2020; Hilbich et al., 2011; Supper et al., 2014), this is a cost-effective application that can provide a high gain in knowledge. Applying a direct comparison of historical and remeasured ERT profiles, our study aims to identify warming-induced permafrost degradation on periglacial landforms in two regions of the European Alps over the past decade. Conducting the measurements at the very same location of the historical ERT profiles allows for a quantitative detection of degradation-induced resistivity changes as well as for a comparison of historical and remeasured resistivities.
Since mountain permafrost landforms are often difficult to access due to their remote location in highly elevated areas, several challenges arise: if no infrastructure such as roads, cable cars or airborne transport is available, the heavy weight of the equipment has to be transported by human power (Frauenfelder et al., 2008; Buckel et al., 2021; Halla et al., 2021; Villarroel et al., 2021). The standard measuring equipment includes the control unit, cables, steel pikes, sponges, salt, hammers, canisters and an adequate amount of water depending on subsurface moisture and the number of electrodes needed for the measurement. Additionally, many permafrost-related ERT surveys were conducted on coarse and blocky surfaces or directly on bedrock lacking vegetation cover, which increases contact resistance. Establishing an optimal galvanic coupling on these hard surfaces is challenging as pointed out in former studies (Buckel et al., 2021; Hauck et al., 2003; Maurer and Hauck, 2007; Pavoni et al., 2022; Schrott and Sass, 2008; Vonder Mühll et al., 2002). An insufficient galvanic coupling results in high contact resistances, which reduce or completely prevent the current flow into the subsurface. Establishing an optimum galvanic coupling on dry and blocky surfaces, as is the case with rock glacier and talus-slope surfaces, is very effortful and time intensive when sponges soaked in saltwater are used by wedging them between the blocks (Hauck and Kneisel, 2008). To address these practical challenges, the present study tests the application of electrodes manufactured from an electrically conductive textile. The use of these newly developed textile electrodes aims at (1) improving galvanic coupling by increasing the electrically conductive contact area with the surface, (2) reducing equipment weight and (3) reducing the effort when placing/hammering conventional electrodes (steel pikes).
Three different sites were selected in collaboration with the team of the newly initiated International Database of Geoelectrical Surveys on Permafrost (IDGSP) (https://www.unifr.ch/geo/cryosphere/en/projects/permafrost-monitoring-and-dynamics/idgsp.html, last access: 20 May 2022), which aims at promoting and coordinating the repetition of historical ERT surveys on permafrost worldwide (Hauck et al., 2020). Three investigated periglacial landforms are located in two regions of the Alps. In the Corvatsch catchment (eastern Swiss Alps) we remeasured an ERT transect on a talus-derived rock glacier and evaluated the performance of the newly developed textile electrodes. The Gianda Grischa rock glacier (eastern Swiss Alps) represents a test site of different creep behavior and a complex geomorphological background. The rock glacier consists of an active and an inactive lobe, where two profiles on each were measured as repetition measurements. The third study site is located on a periglacial talus slope in a different climatic region in the Austrian Alps. The descriptions of the study areas are reduced to information relevant to the interpretation of the results.
2.1 Corvatsch catchment
The Corvatsch catchment is located on the northern slope of Piz Corvatsch (3451 m a.s.l.), in the Upper Engadin, and includes the Murtèl, Marmugnun and Chastelets rock glaciers. The catchment, which is surrounded by a steep northwest-facing headwall, is situated at about 2700 m a.s.l. and can be regarded as one of the best-investigated permafrost sites in the European Alps, with several long-term ERT observations (e.g., Mollaret et al., 2019; PERMOS, 2021; Schneider et al., 2012) and borehole measurements (e.g., Haeberli et al., 1993; Vonder Mühll and Haeberli, 1990). Climate data are available from a micrometeorological station at the Murtèl rock glacier. Between 1997 and 2018 the MAAT (mean annual air temperature) was −1.66 ∘C, with a long-term temperature increase of about 0.7 ∘C during this period (Hoelzle et al., 2022). The talus-derived rock glacier on a talus slope (46∘25′38′′ N, 9∘48′54′′ E) investigated in this study is located north of the Chastelets rock glacier. A steep front and a relatively small flat body characterize the periglacial landform (Fig. 1). The substrate layer consists of small-grained material at the front and inhomogeneous boulders of differing size in the plateau area. Lithological granodiorite and metamorphosed basalt of the Corvatsch nappe as well as muscovite and calcite marble of the Chastelets series are predominant at the study site (Schneider et al., 2013). In August 2011, the first ERT measurements were conducted along a 380 m long profile, which was aligned with the creep direction of the talus-derived rock glacier (Sina Schneider, Martin Hölzle, Christian Hauck, unpublished). Yellow markings from 2011 were used to tag the profile for easier relocation. The historical profile was remeasured at the end of August 2021 during dry and sunny weather conditions. This profile is also used to compare the performance of the different coupling methods under field conditions (i.e., steel pikes vs. textile electrodes).
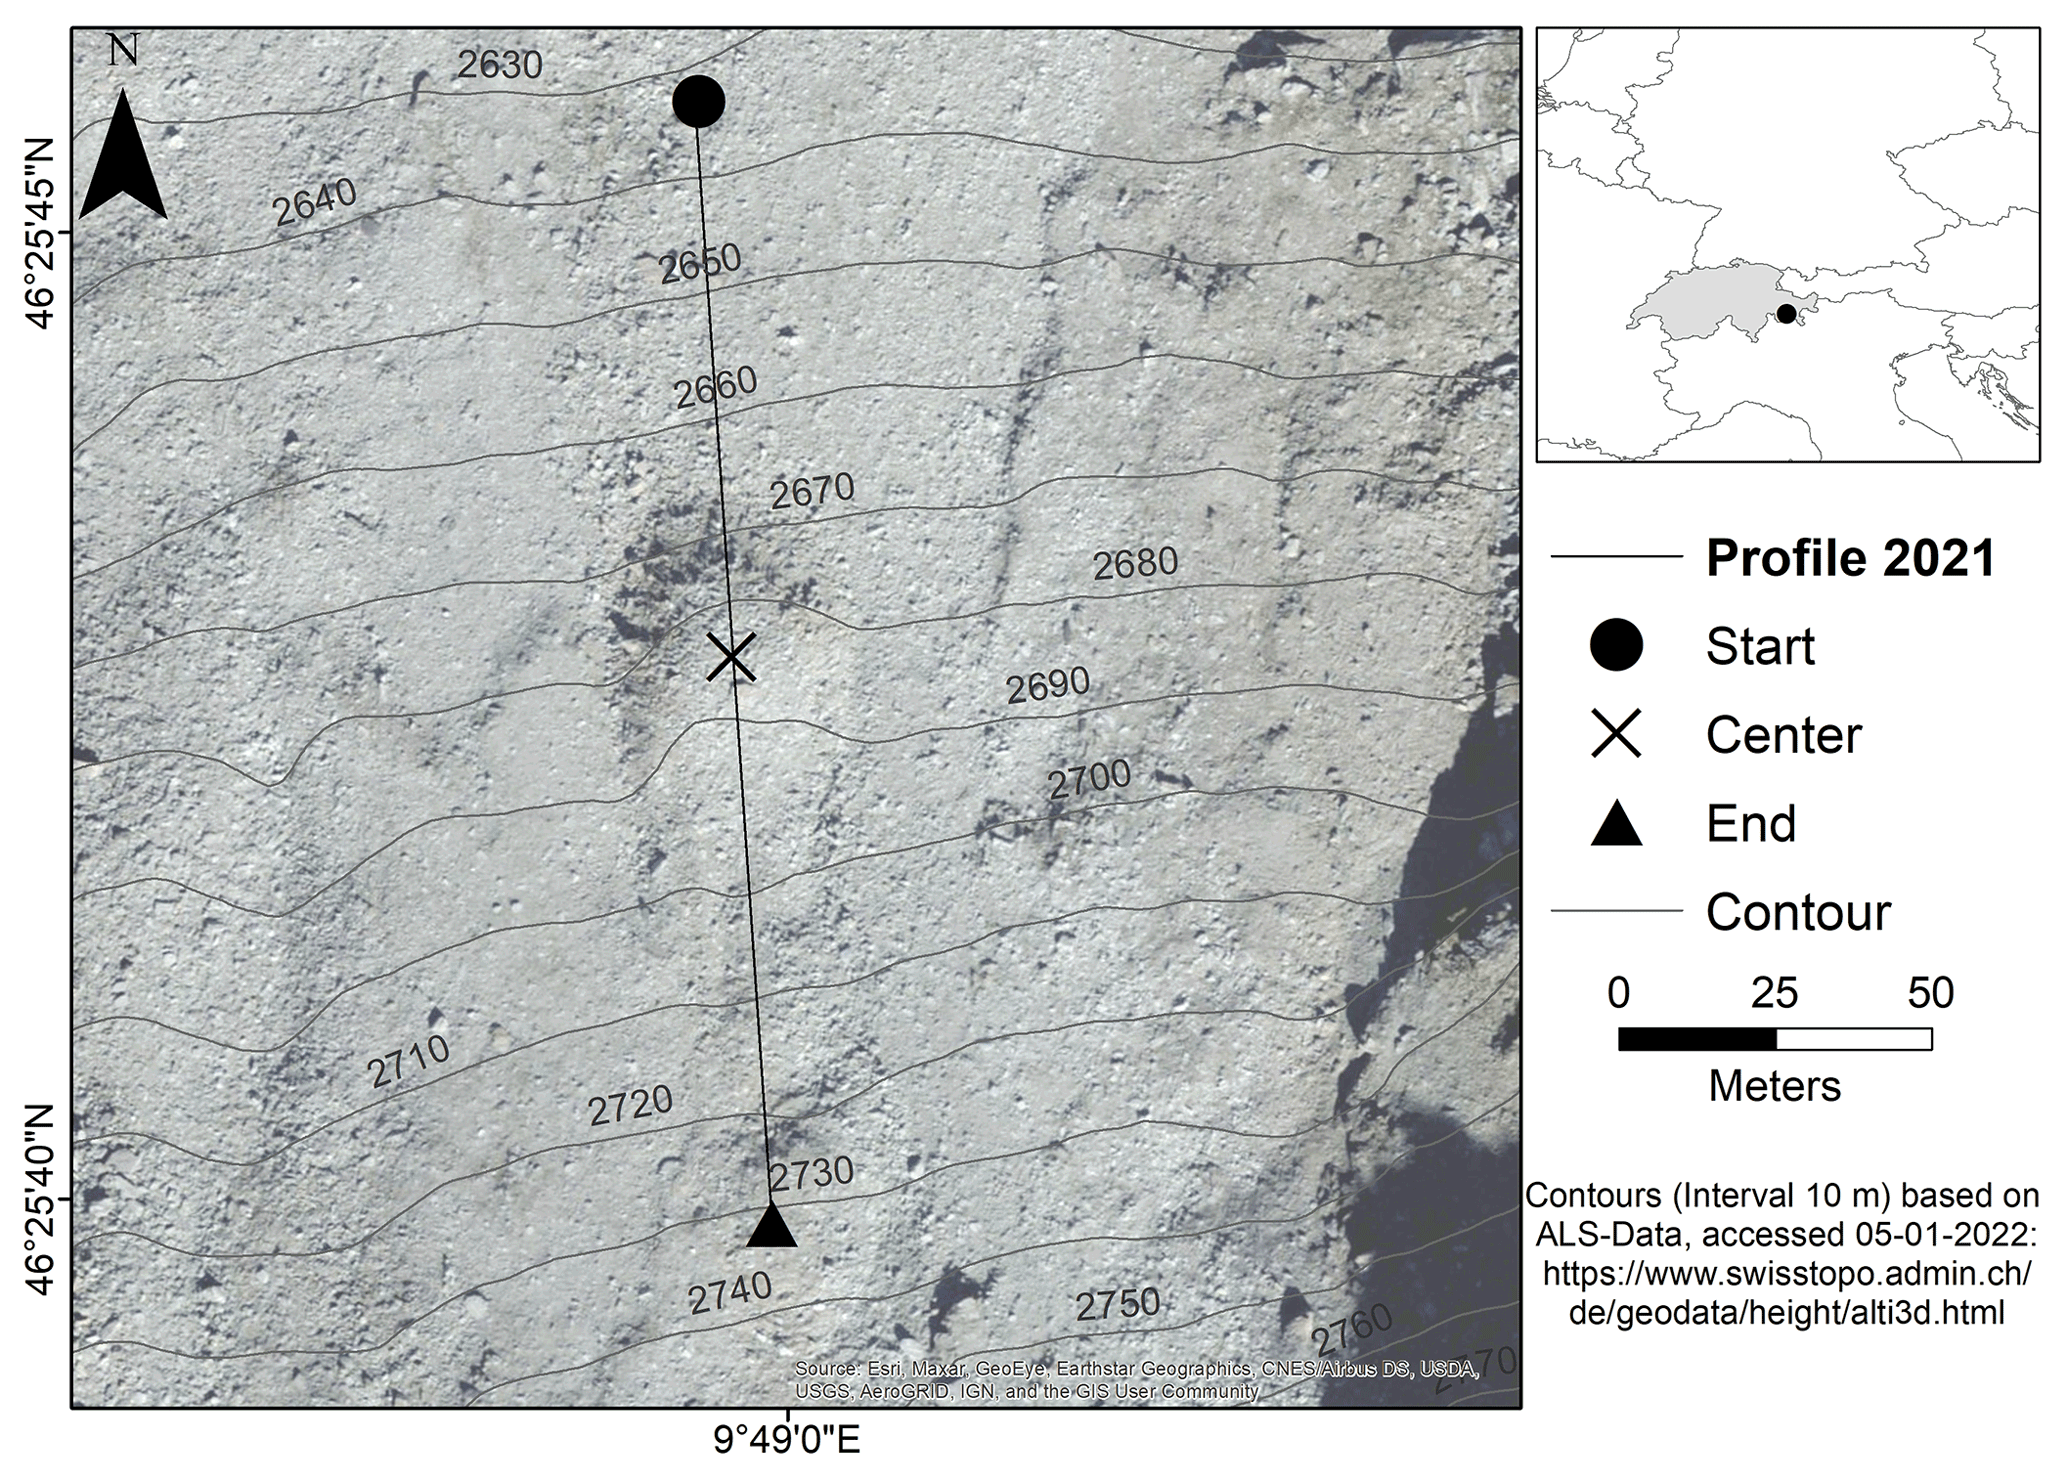
Figure 1Location of the ERT profile on the talus-derived rock glacier in the Murtèl catchment, Upper Engadin. The repeated profile (2021) is based on the blocks marked in the field in 2011; therefore the location of the new and the historical profiles are identical.
2.2 Gianda Grischa rock glacier
The Gianda Grischa rock glacier (46∘29′24′′ N, 9∘44′41′′ E) in the Upper Engadin (eastern Swiss Alps) was investigated in 2005 using ERT, among other methods (Frauenfelder, 2005; Frauenfelder et al., 2005, 2008). This double-tongued rock glacier is located on the western slopes of Piz Julier (3380 m a.s.l.). The headwall provides debris consisting of granites, diorites and paragneiss as a part of the Err-Bernina nappe (Spicher, 1980). Three parts of different activity stages are described by Frauenfelder et al. (2008): an active part (labeled “A” in Fig. 2), an inactive part (not visible in Fig. 2) and a possibly relict part (“B” in Fig. 2). The active rock glacier, which is located at an elevation between 2540 and 2800 m a.s.l., has a length of 1000 m and a width of 170 to 390 m. The active part is characterized by a steep front as well as furrows and ridges, which are typical features of active rock glaciers (Barsch, 1996). The inactive part of the rock glacier, south of the active part, is largely overridden by the active rock glacier. Therefore, the length and width (about 100 m) of the inactive part are significantly smaller. Unlike the active part, a considerable amount of vegetation is present on the inactive part. The surface is mostly fine-grained with some larger boulders in between. Of the five profile lines used for the ERT measurements conducted in August 2005 by Frauenfelder et al. (2008), four tomograms were repeated at the end of August 2021 during dry and sunny weather conditions (Fig. 2). The active part hosts the intersecting profiles P2 and P3; the inactive part hosts the intersecting profiles P1 and P4 of the rock glacier.
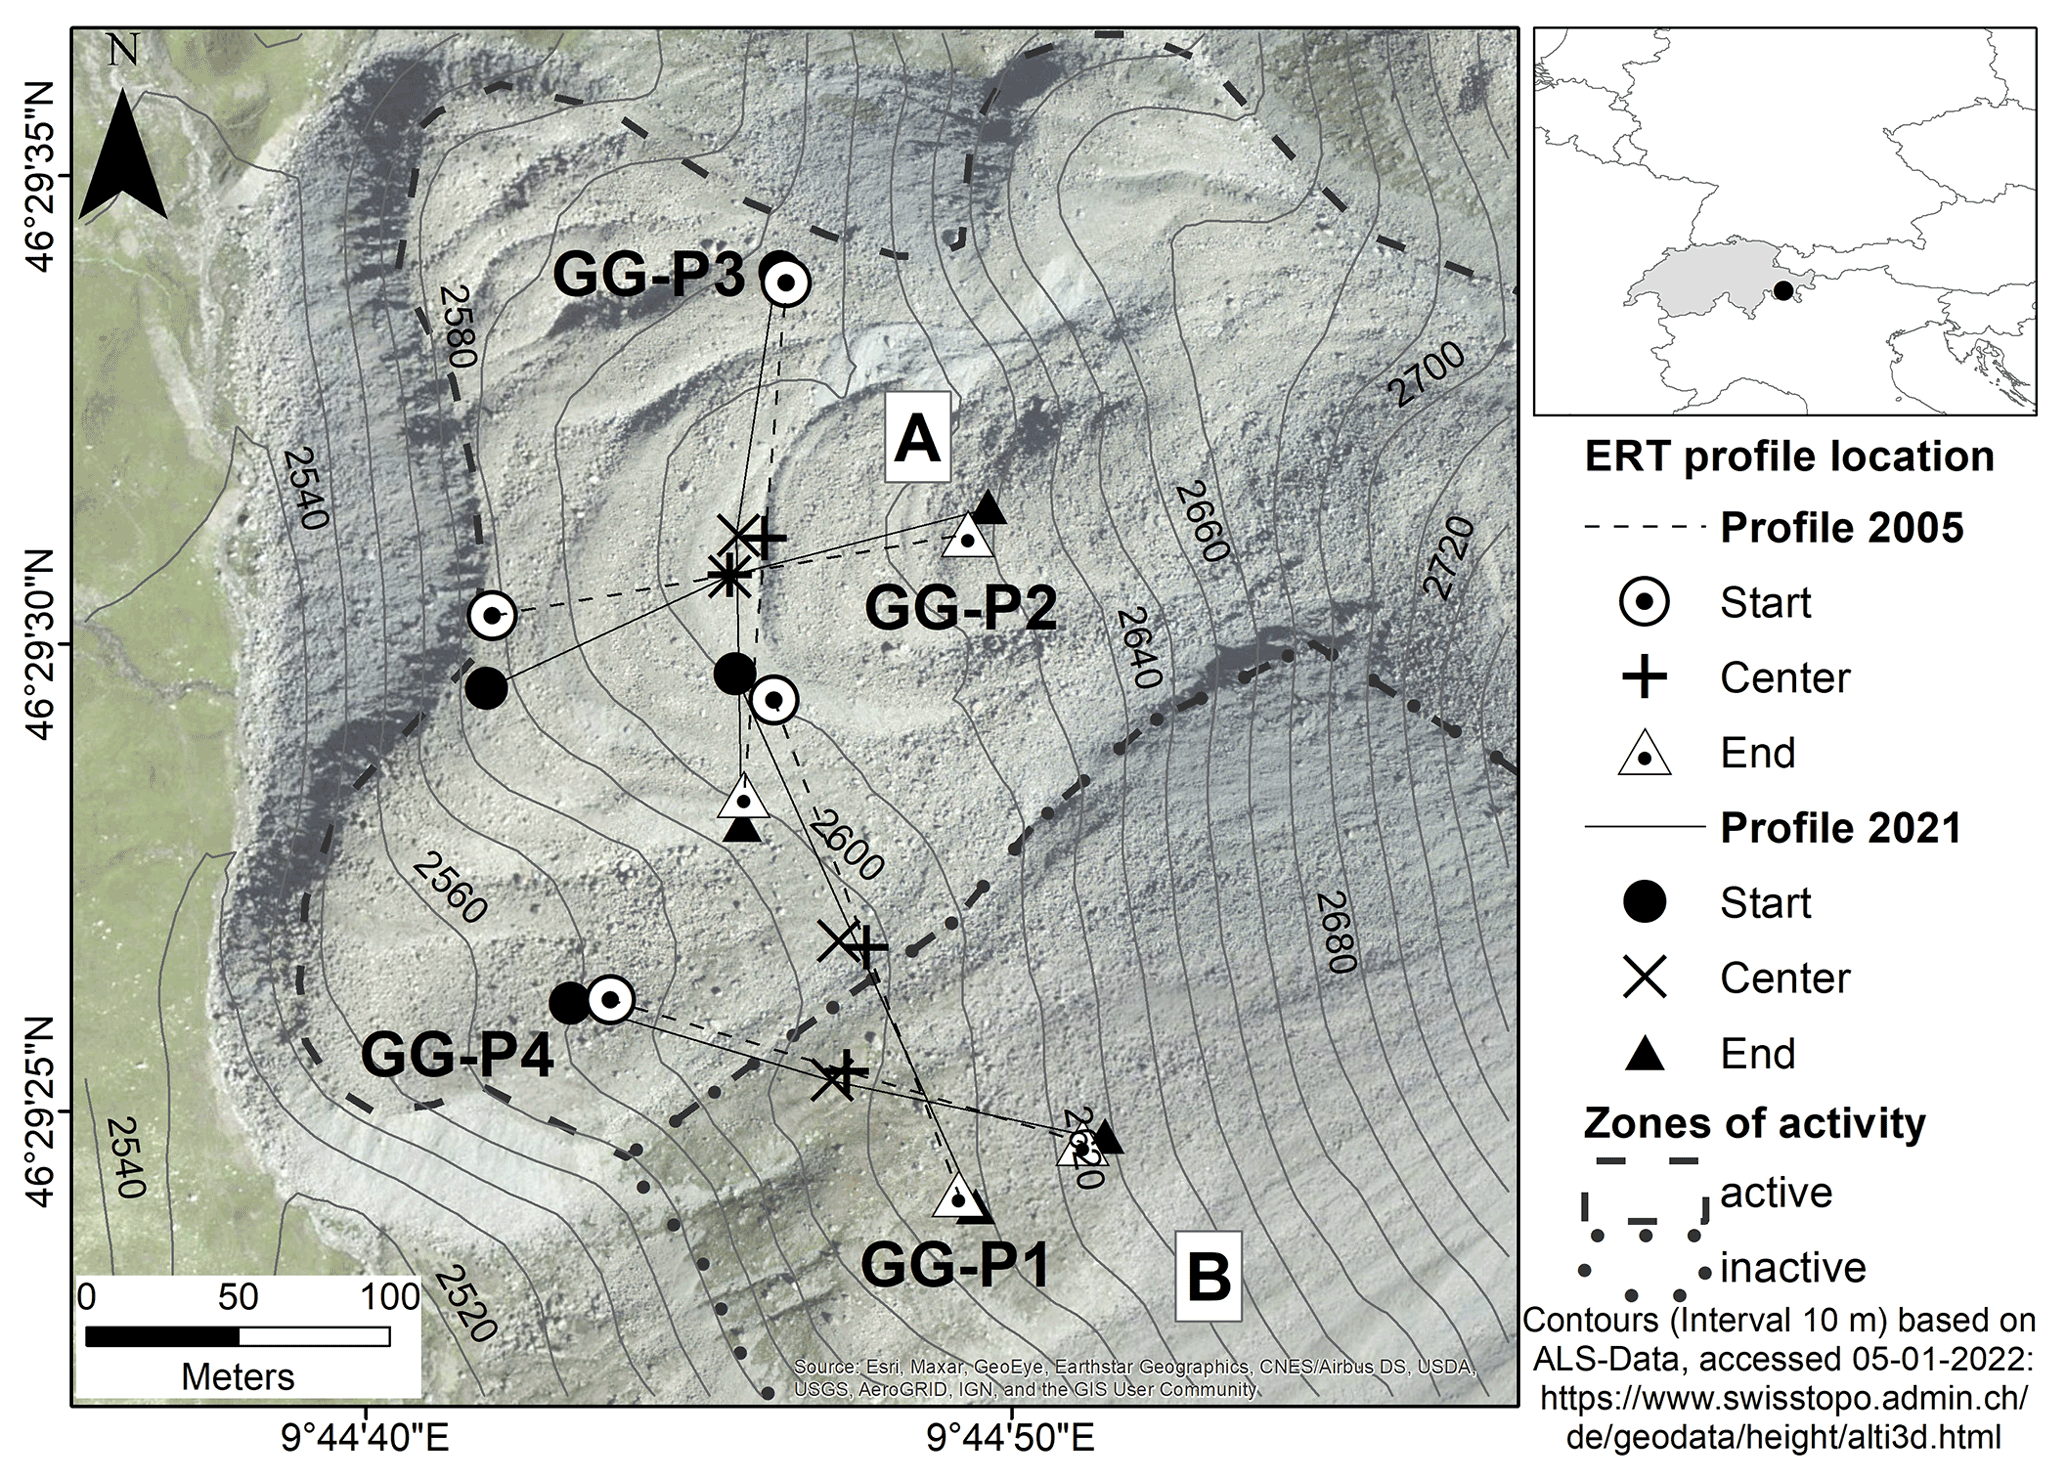
Figure 2Location of the historical (2005, dashed line) and the repeated (2021, solid line) ERT profiles on the Gianda Grischa rock glacier, Upper Engadin. The status of activity (A: active; B: inactive) is based on this study and Frauenfelder et al. (2008). The area around A is characterized by furrows and ridges and hosts profiles P2 and P3.
2.3 Glatzbach catchment
The Glatzbach catchment in the Tauern range (central Austrian Alps) was surveyed by Otto et al. (2012) in 2008 and 2009. These authors used a multi-method approach including ERT measurements to detect mountain permafrost. The investigated northeast-exposed talus slope (47∘2′22′′ N, 12∘42′33′′ E) ranges between 2700 and 2900 m a.s.l. in elevation with an average inclination from 25 to 45∘. The talus slope is characterized by a coarse-grained block field consisting of quartzite and dolomitic marble. The surrounding areas are dominated by a fine-grained, phyllitic substrate layer originating from the weak Matreier Schuppenzone. This zone forms the transition from the Obere Schieferhülle (Penninic) in the north to the crystalline basement (Austroalpine) in the south (Stingl et al., 2010). The MAAT at an elevation of 2650 m a.s.l. increased between 1997 and 2010 from −2.5 to −1.2 ∘C (Otto et al., 2012).
Two ERT profiles of 96 m length each, measured in July 2009 by Otto et al. (2012), were repeated in September 2021 during sunny weather but wet surface conditions due to melting snow. GL-P1 cuts in an east–west direction through the block field, while the intersecting profile GL-P2 runs in a north–south direction (Fig. 3).
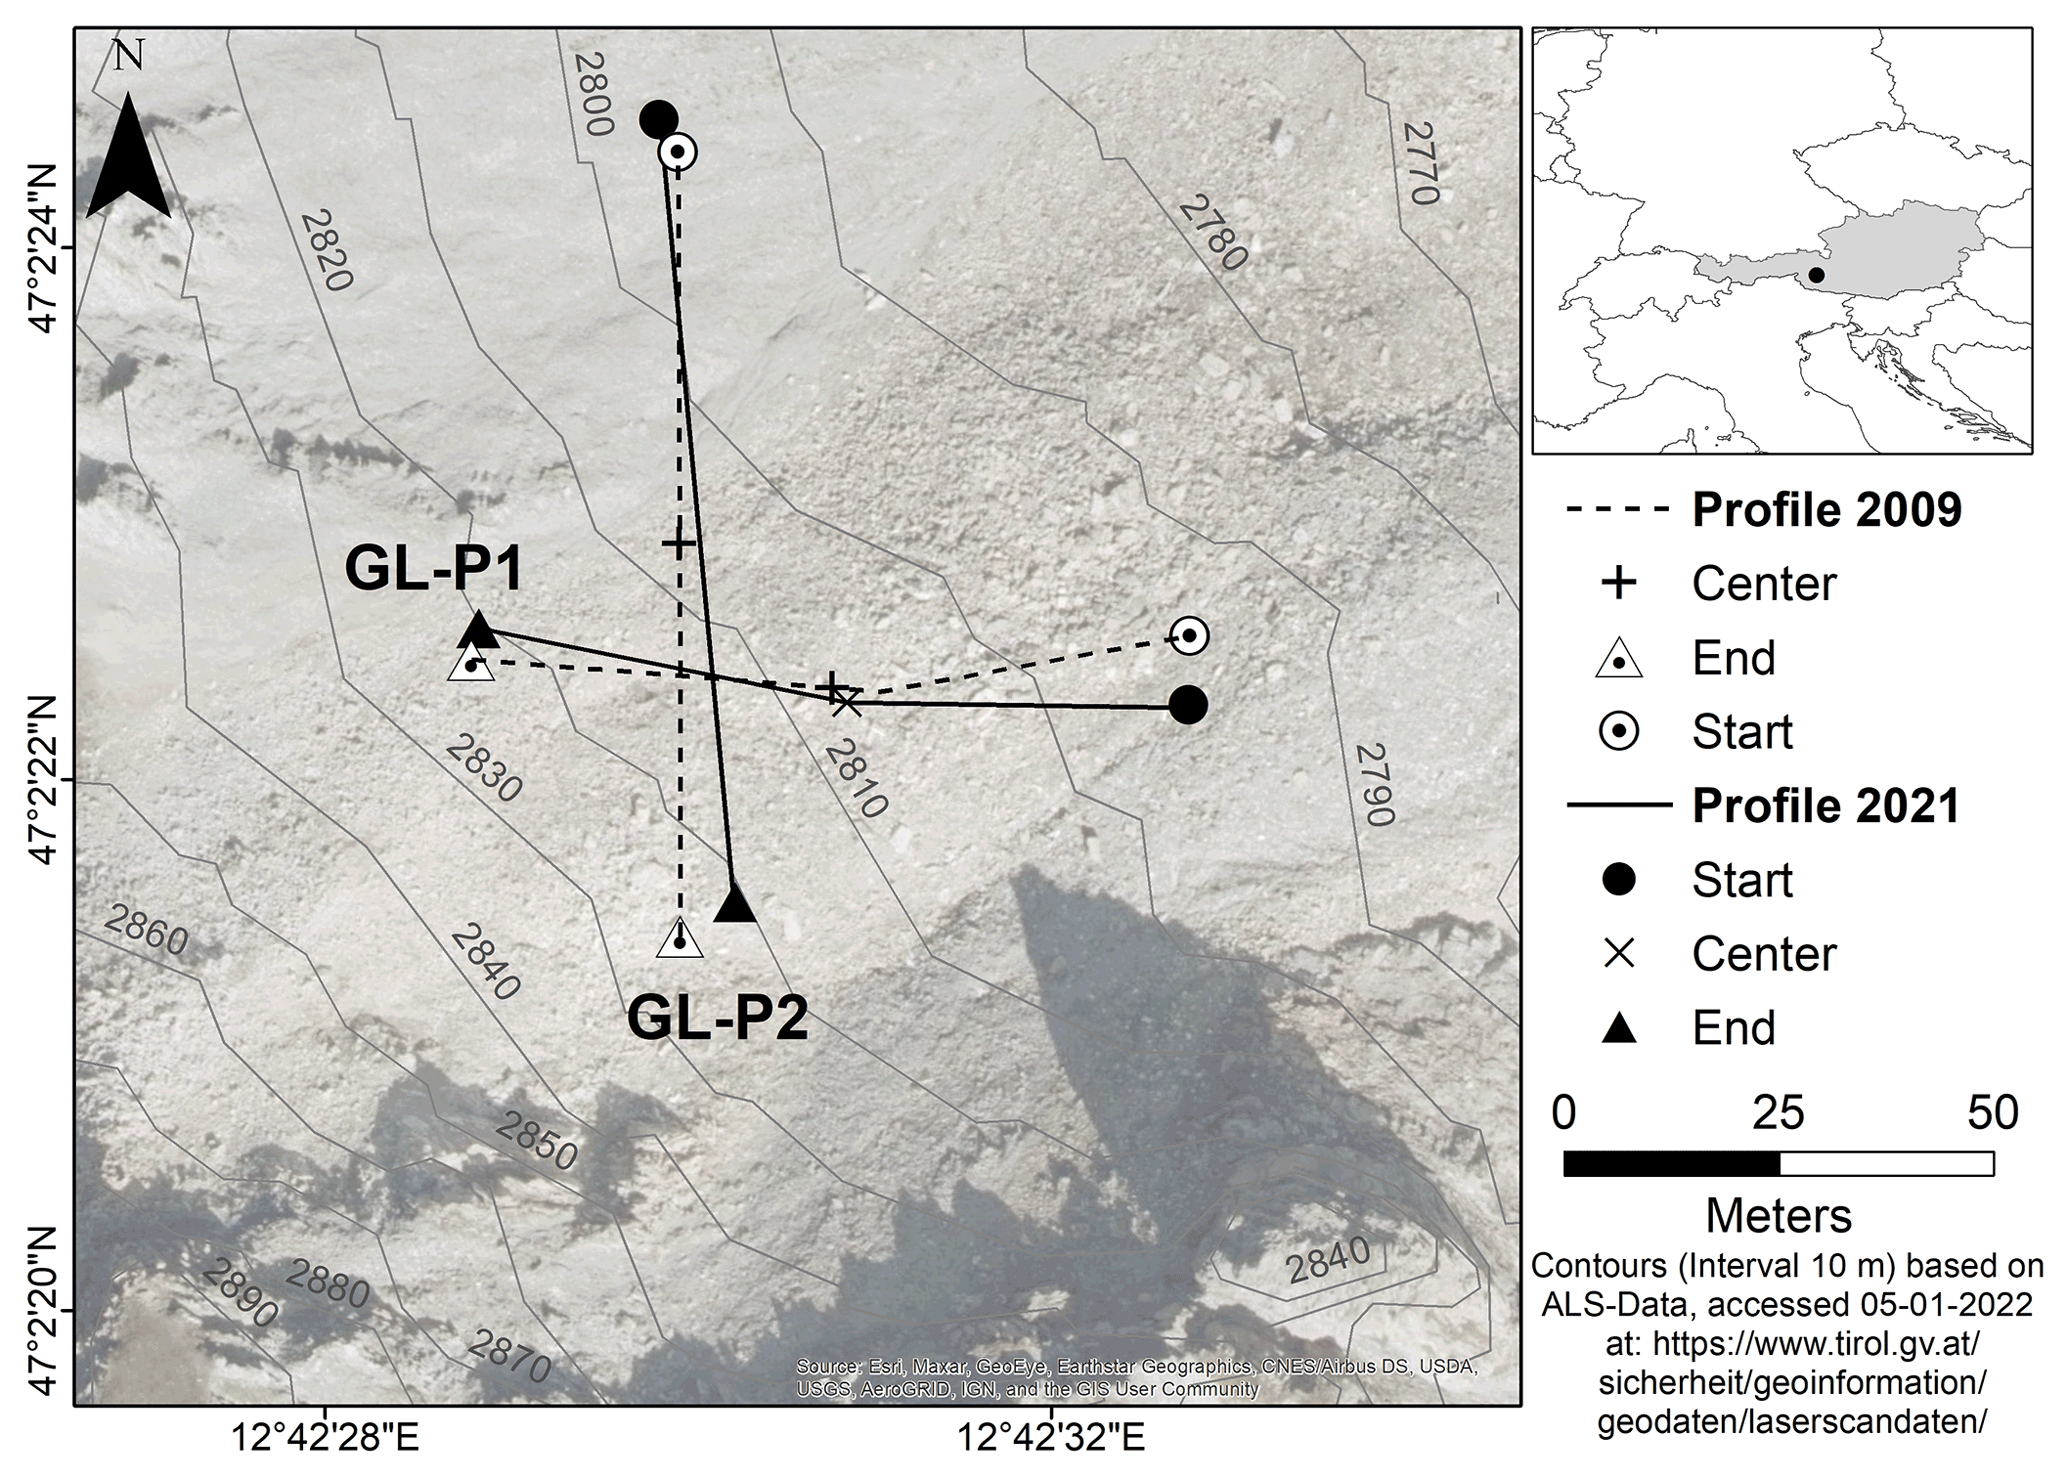
Figure 3Location of the historical (2009, dashed lines) and the repeated (2021, solid lines) ERT profiles on the block field in the Glatzbach catchment, Tauern range.
3.1 Electrical resistivity tomography (ERT)
The electrical resistivity of the subsurface is measured using a quadrupole setup: two electrodes are used to inject an electrical current into the ground. This current generates an electrical field, which depends on the spatial variation in electrical resistivity in the subsurface. The characteristics of this electrical field are then captured by measuring a potential difference (voltage) between another pair of electrodes. From the measured potential difference; the injected current; and a geometric factor, which relates the measured voltage to the quadrupole geometry, an apparent resistivity of the ground below the quadrupole can be calculated, which represents an average resistivity of the half-space below the quadrupole. The investigation depth scales with the total length of a linear array of electrodes, while the (near-surface) resolution is higher for short electrode spacings. The Wenner configuration used for the historical and the repeated measurements provides an optimal signal-to-noise ratio combined with a high resolution of horizontal structures (Kneisel and Hauck, 2008). In this configuration, the distances between the four electrodes of the individual quadrupole measurements are all the same. In order to obtain information on the 2D variation in electrical resistivity below the profile, the position of the four-electrode setup along the line has to be varied to assess the lateral variation in resistivity and the array length has to be varied to resolve vertical variations (Kneisel and Hauck, 2008).
An initial quality assessment of the field data was achieved during the data acquisition 2021 by using the GeoTom software (v7.19, GEOLOG 2000). In a first step, the data quality of each quadrupole measurement is checked visually by comparing its value with neighboring points in the pseudo section. Large deviations or outliers (e.g., given by a defect in one cable which produced random values for measurements with one specific electrode) indicate poor data quality. In a second step, (a) all data points with a relative standard deviation of all stacks (stack error) above 0.3 and (b) all data points collected with the maximum value of the input voltage, which indicates that no sufficient signal strength can be achieved, were identified. Visually identified outliers as well as the values identified by (a) and (b) were remeasured after checking the placement of the electrodes and improving the contact between the electrode and the surface by adding salted water. Remeasured data points still meeting one of the criteria (a) or (b) or being obvious outliers were deleted and reconstructed by interpolating the neighboring values before the inversion. Because information on stack error and input voltage was unavailable, this process could not be performed on the historical data. Instead, the historical data were filtered manually using the “Exterminate bad datum points” function in the Res2DInv software. Bad datum points are values with apparent resistivity that are apparently too large or too small compared to the neighboring values. The overall number of filtered data points is given in Tables 2 to 4 for the three surveyed catchments. The measured apparent resistivity corresponds to the true resistivity only for a homogenous substrate. Therefore, in the second step, so-called inversion methods have to be applied to model the spatial variation in an inhomogeneous substrate in the subsurface (Kneisel and Hauck, 2008). We used the Res2DInv software package, which is based on a smoothness-constrained least-squares inversion process (Loke and Barker, 1995) to obtain ERT tomograms from the measured data. During this iterative process, the differences between the measured apparent resistivities and the modeled ones are minimized by adjusting the resistivities assigned to discrete blocks representing the subsurface. The remaining discrepancy between measured and modeled apparent resistivity values is expressed in terms of the root mean square error (RMSE).
Besides the ice content, other characteristics, such as lithology, porosity, (unfrozen) water content, latent heat fluxes, grain size and packing density, control the resistivity of the subsurface. Consequently, the resistivity of permafrost varies over a wide range (Hauck and Kneisel, 2008; Herring and Lewkowicz, 2022). Here, we describe the subsurface for a more detailed interpretation by the use of common terms like unfrozen, ice-poor permafrost and ice-rich permafrost. The resistivity anomalies regarding frozen and unfrozen sediment are visually distinguishable in the ERT tomograms. A clear definition of a threshold resistivity for the transition between unfrozen and frozen conditions is difficult due to the factors mentioned above, but many previous studies assume a rough value of 10 kΩm as a guideline to distinguish frozen from unfrozen sediment (bedrock permafrost excluded: Fortier et al., 1994; Halla et al., 2021; Hauck and Kneisel, 2008; Mewes et al., 2017; Palacky, 1988). It is however strongly subjective and should be adjusted towards much lower values in the case of conductive lithology or towards much higher values in the case of, e.g., coarse-blocky and very porous substrate. Ice-poor permafrost may occur in terms of patches or larger zones of ground ice. Ice-rich permafrost is characterized by high resistivity values (usually >150 kΩm). The interpretation of the ERT tomograms considers the different regolith subsurface properties for the Upper Engadin (Gianda Grischa and Corvatsch) and the southern edge of the Tauern Window (Glatzbach catchment). However, we limit our interpretation to resistivity values and resistivity changes exceeding 10 kΩm as fast-changing small-scale and seasonal effects (e.g., unfrozen water content; compare Fortier et al., 1994) induce resistivity changes that cannot be distinguished from resistivity changes associated with perennial external temperature changes. This also excludes a detailed interpretation of an active-layer thickness increase as an indication of permafrost body thaw. The color scale of resistivity was determined for each homogeneous subsurface individually. Similar ice content and similar lithology of the subsurface determine the homogeneity. The non-logarithmic classification is based on a higher resolution in the range of low resistivity values, since larger variations and anomalies are expected within this range. However, to ensure direct comparability, the historical and the recent tomograms are displayed using identical color scales and classifications.
3.2 Location and repetition of historical ERT measurements
Since the main goal of this study is to compare the recent and historical measurements, the historical profile locations had to be correctly located in the field. The IDGSP (Hauck et al., 2020) provides GPS data and basic information on the coordinate system and precision. In preparation of the 2021 fieldwork, historical GPS data were plotted on a map, which contained additional information based on high-resolution orthophotos (Bing Maps) and terrain analyses from a digital elevation model (Otto and Smith, 2013). The orthophotos visualize large boulders, which helped to locate the start and end points in the field. The highest priority was given to localizing the center point of the historical profile, as (due to technical constraints) we could not always use the same geometrical setup in terms of the total number of electrodes and electrode spacing as in the historical measurements. Like the data collectors of the historical ERT profiles, we used a non-differential GPS. Therefore, the accuracy of the historical as well as the newly measured location data is within the range of a standard handheld GPS (Garmin eTrex 10 used in 2021), i.e., depending on the satellite availability roughly 5–10 m in the horizontal direction.
The availability of historical markers facilitated a proper localization in the field: stone cairns, historical GPS data and yellow strokes on prominent blocks were available as historical markers at the Swiss study sites. Historical profiles in the Austrian Glatzbach catchment were only documented by GPS locations. In addition, easily identifiable markers like large boulders in aerial photographs were also used to localize the profile lines in the field. At the Gianda Grischa rock glacier, cairns were still present at the start and end point as well as the center point of the profiles. In the Corvatsch catchment, yellow markers indicated the location and orientation of the historical 380 m long profile. An exact localization of the start, center and end point along the profile was, however, not possible due to the absence of historical GPS coordinates. Instead, prominent topographic features were used to relocate the profile along the along the profile direction. The length of the historical tomogram was shortened by 132 m at the beginning and 52 m from the end to yield a 196 m long profile for enhanced comparability. In the Glatzbach catchment, due to the absence of any markers in the field, only the relatively rough historical GPS locations were available to relocate the historical profile. Generally, profile topography was estimated by measuring the differences between consecutive electrode positions with a yardstick.
The Glatzbach catchment contains two historical ERT profiles, which were measured in July 2008. These were repeated during early September 2021 (Table 3). The fact that the profiles were measured at different times challenges the interpretation due to the large seasonal variability close to the surface. Therefore, we focus the discussion of the results on depths below the assumed active layer to exclude misinterpretations of seasonally conditioned resistivity changes. The value of 10 kΩm to distinct the active layer from the frozen part is given by Otto et al. (2012).
3.3 Measurement setup and newly developed textile electrodes
For this study, we used the GeoTomMK (GEOLOG 2000, Augsburg, Germany) with a unit electrode spacing of 4 m and a total of 50 electrodes, resulting in a maximum profile length of 196 m. The instrument automatically determines the optimum input current by predefined levels (0.005, 0.05, 0.5, 5.0, 50.0 mA). A higher required current indicates (1) poorer coupling conditions due to higher contact resistance or (2) high subsurface resistivity. Conventionally, a combination of stainless steel rods and watered or saltwater-soaked sponges, which are placed between individual blocks, are used on debris-covered surfaces (e.g., Hauck et al., 2003). On rock faces or large bedrock surfaces, electrodes can be drilled into the rock, e.g., by using climbing bolts and copper contact paste (Krautblatter and Hauck, 2007). Although yielding sufficient galvanic contact, this approach is effortful and involves an invasive intervention by drilling into the ground material. However, in very coarse substrate with huge boulders, both approaches can be very time-consuming and good galvanic coupling cannot always be achieved.
In the present study, we test the performance of a newly developed alternative electrode made of conductive textile. The commercially available textile (Holland Shielding Systems BV) consists of polyester with woven-in copper and nickel threads. The cost of one textile electrode made of this material is ∼ EUR 15; manufacturing one electrode takes about 10 min. We cut the textile into square pieces (30 cm × 30 cm) and form small bags, which are filled with 200 g of fine sand (e.g., available in the field as glacial till) and closed by a cable tie (Fig. 4). The fine sand is wrapped in plastic film, which prevents moistening of the sand. The sand weighs down the bag so that the conductive textile is pressed onto the ground maximizing the contact area.
The key parameter for the electrical coupling between electrodes and subsurface material is the contact resistance (e.g., Hördt et al., 2013; Rücker and Günther, 2011), which is controlled by the electric contact area of the two materials. Our design results in an approximately circular contact area with a diameter of roughly 15 cm. Contact resistances were investigated prior to the campaign over different surfaces and compared with those of conventional steel electrodes. It was found that the textile electrodes generally perform as well as steel electrodes as long as a small amount of water (e.g., 80 mL) is being used to moisten the textile. For example, on a semi-paved surface, both electrode types provided resistances between 2 and 5 kΩ, and even on a hard gravelly path where the steel electrodes could not be used, the average contact resistance of the textile electrodes was below 6 kΩ, which is far below the threshold above which the equipment cannot reliably measure anymore (>1 MΩ for the GeoTom).
During the survey described here, the surfaces were generally rugged, blocky and not flat, and therefore additional measures had to be taken. We placed wet sediment and sediment containing biotic material (e.g., roots, moss) between the textile electrode and the rugged surface of boulders. Additional salted water further reduces contact resistances of the textile electrodes and improves required contacts between the boulders in the near subsurface (e.g., the active layer). However, a generally poor electric contact between large blocks in the subsurface cannot be compensated by the use of the textile electrodes. Possible effects of the large electrode size and the violation of the point-source assumption during the inversion of the ERT data will be addressed in the Discussion section.
We chose the talus-derived rock glacier in the Corvatsch catchment to test and evaluate the textile electrodes due to its smooth profile topography as well as the easy retrieval of the historical profile location by yellow markers. The measurement setup consists of a first baseline measurement using steel pikes in moist ground. In the second measurement we placed wet sponges at the same location, and the third measurement was conducted with textile electrodes. The data were analyzed to assess the performance of the textile electrodes for subsequent measurements. The (successful) evaluation of the textile electrodes at this first test site resulted in a mixed application of textile and steel electrodes at the subsequent profiles on the Gianda Grischa rock glacier and in the Glatzbach catchment, depending on the surface characteristics. Blocky surfaces were investigated using textile electrodes and fine-grained and vegetated surfaces by steel pikes.
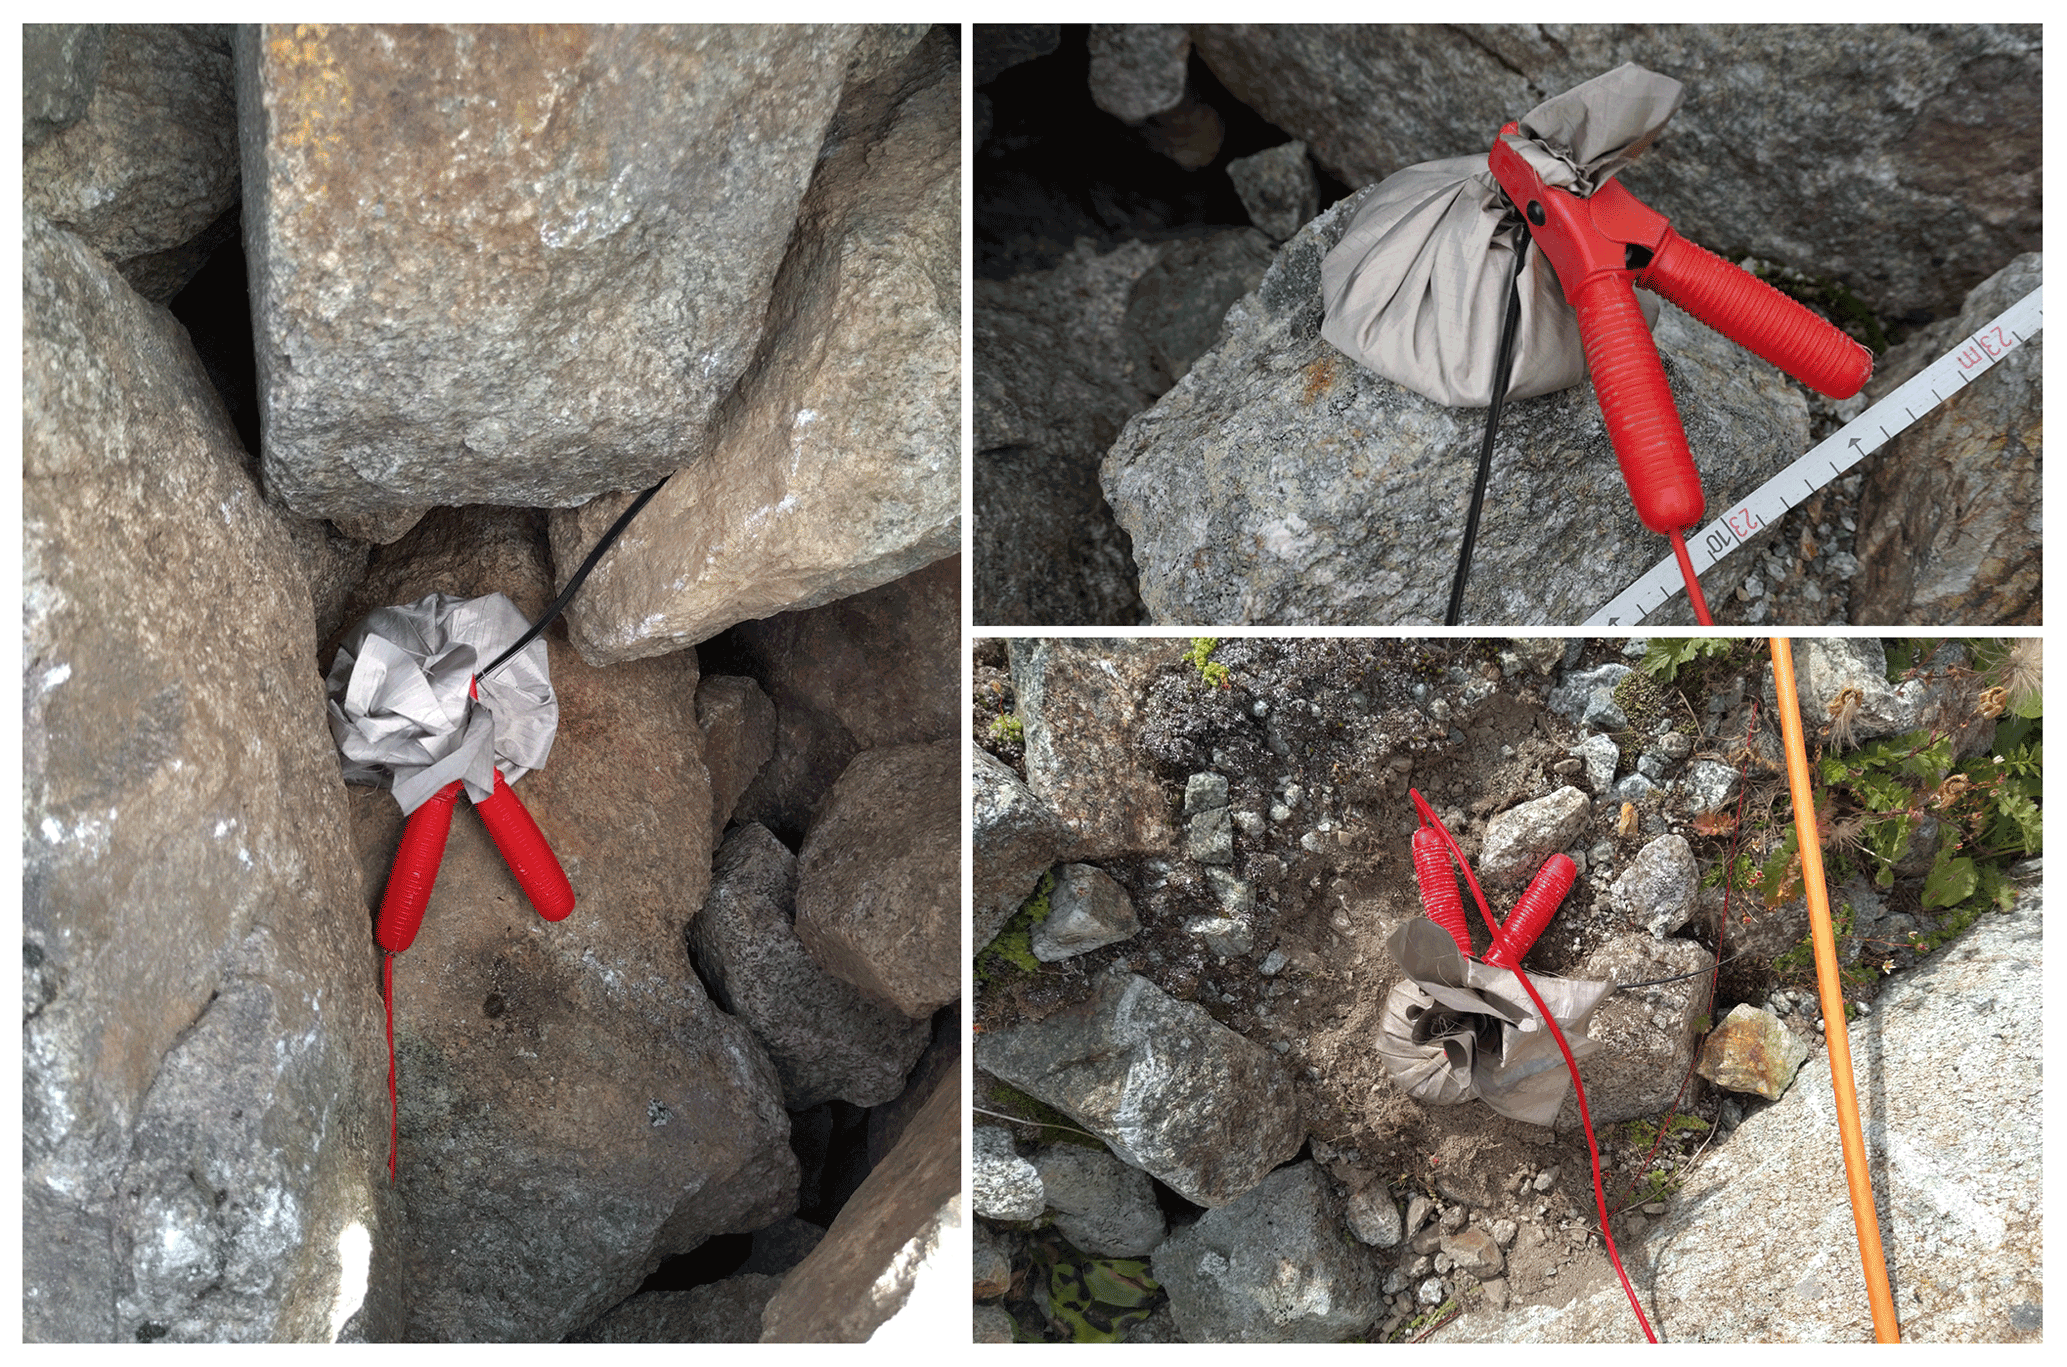
Figure 4Prototype of the textile electrodes in use. The bag made of conductive textile is filled with 200 g of fine sand. The electrode is connected to the measuring cable by the red clip.
4.1 Textile electrodes
In order to investigate the data quality obtained with the new textile electrodes, we directly compare ERT measurements (Fig. 5) carried out with steel pike electrodes connected to the ground by watered sponges (Fig. 6c) and the textile electrode (Fig. 6d). For the quantitative analysis, the apparent resistivity, the relative standard deviation and the input voltage used for current injection of the device were compared for all 377 quadrupoles of the measurement; 15 quadrupoles result in unrealistic values due to a cable defect, which are not considered in the quantitative comparison.
In a first step, all quadrupole measurements were filtered according to the criteria defined in Sect. 3.1. On average, the (unfiltered) data collected with conventional electrodes show slightly higher values of the required input current for conventional (1.0 mA) than for the textile electrodes (0.7 mA) as well as for the relative standard deviation (7.8 % vs. 6.7 %). Consequently, more data points collected with steel pike electrodes had to be removed (6 %) than for the textile electrodes (4 %). The percentage of removed data itself is comparable to multi-channel measurements by earlier studies on harsh surface conditions of a rock glacier (e.g., Halla et al., 2021). In summary, these first observations (i.e., differences in input current, standard deviation and percentage of removed data) indicate a slightly higher quality of the data collected with the new textile electrodes.
From a more practical point of view, both electrode types – if placed at the very same locations – should at least result in the same measured apparent resistivity values. Therefore, we also analyze the relative difference between the two measured apparent resistivities. The median of the relative difference in the apparent resistivity is 2.1 %. Furthermore, the histogram in Fig. 5 shows that most of the deviations are small and only few outliers with larger discrepancies exist. Only 10 % of all compared quadrupoles show relative differences >14 %.
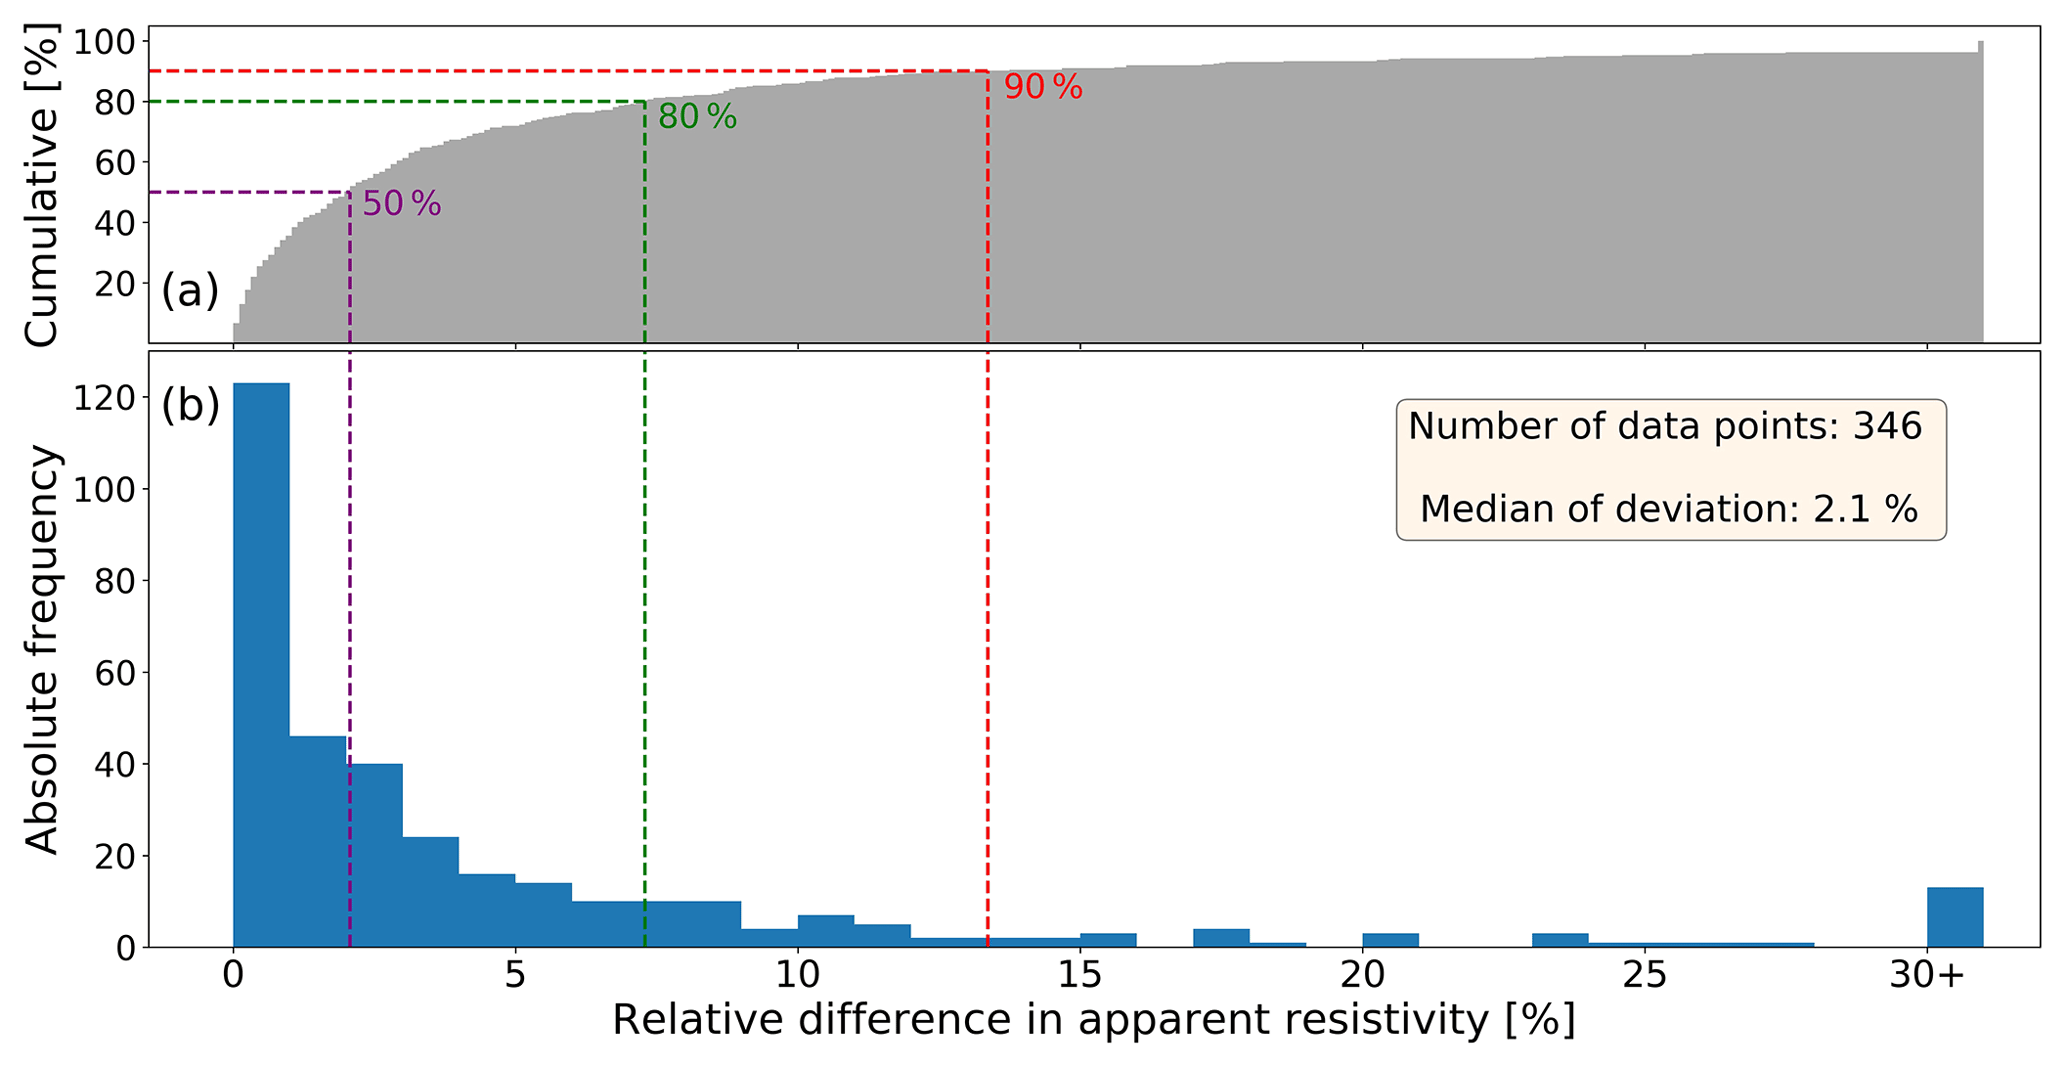
Figure 5Histogram of the percentage deviation of the measured apparent resistivity for pairwise comparison between quadrupole measurements collected with the new textile electrodes and conventional steel pike electrodes: (a) cumulative distribution and (b) absolute frequency. The dashed lines show defined portions of all data pairs with the corresponding limit of deviation in apparent resistivity.
Nevertheless, the comparison of both electrode types indicates sufficiently good comparability of the measurements with reliable and even slightly better results for the textile electrodes, hence justifying the application of the novel textile electrodes at the other survey sites.
4.2 ERT-based permafrost detection
4.2.1 Corvatsch catchment
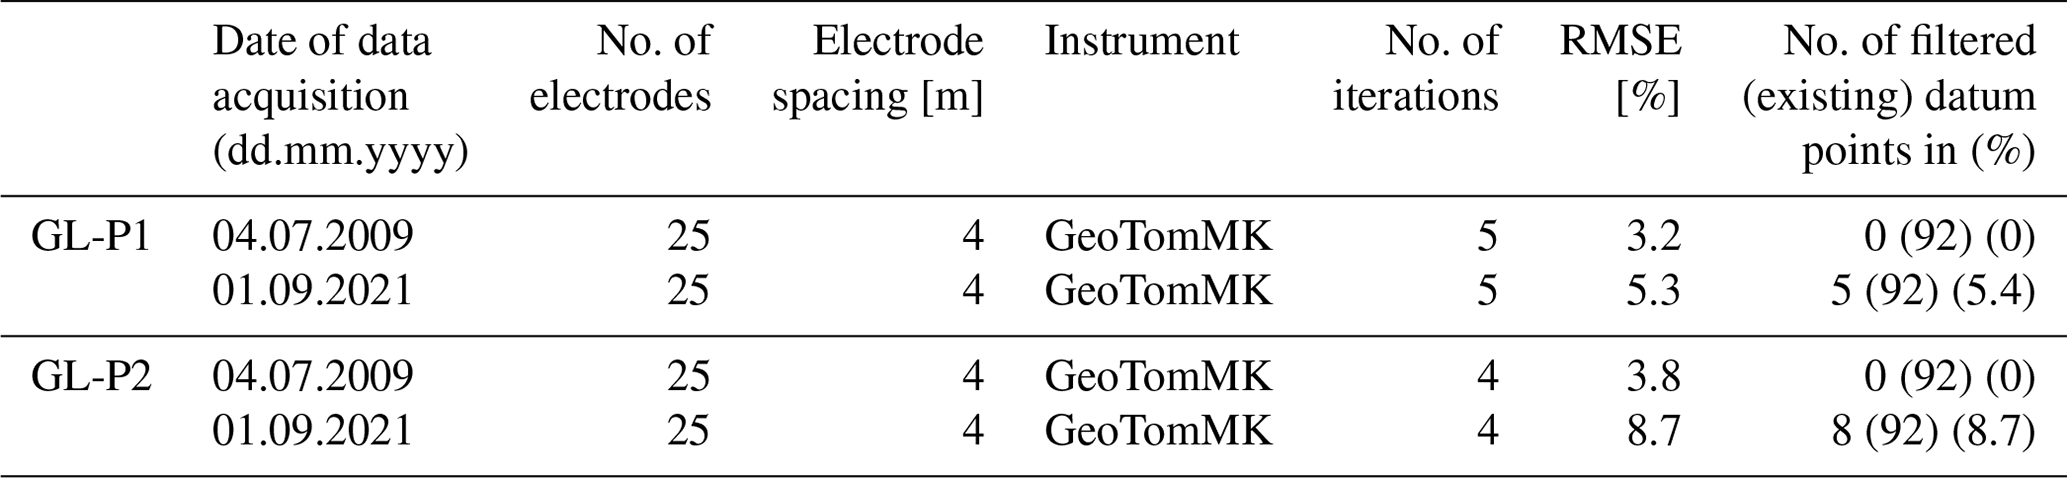
Four ERT profiles are presented from the talus-derived rock glacier at the Corvatsch catchment (Table 1; Fig. 6). The original survey from 18 August 2011 was repeated on 25 August 2021 in order to assess the temporal evolution of the permafrost in this profile over 10 years and to further compare the data collected with different electrode types. The inversion yields an RMSE of 4.6 % for the historical data (Table 2). The RMSE of the repeated data varies between 5.5 % and 5.9 % despite the different electrode types used. Additionally, the visual comparison of the three tomograms representing different electrode types only shows small deviations and an overall reliable fit of the resistivity distributions (Fig. 6b to d). This observation further confirms the applicability of the newly developed textile electrodes, which required an additional supply of water to reduce contact resistance between larger blocks at the surface.
Table 1Overview of the historical and repeated ERT profiles of the Corvatsch catchment. In 2021, the same profile was measured three times using different electrode types.
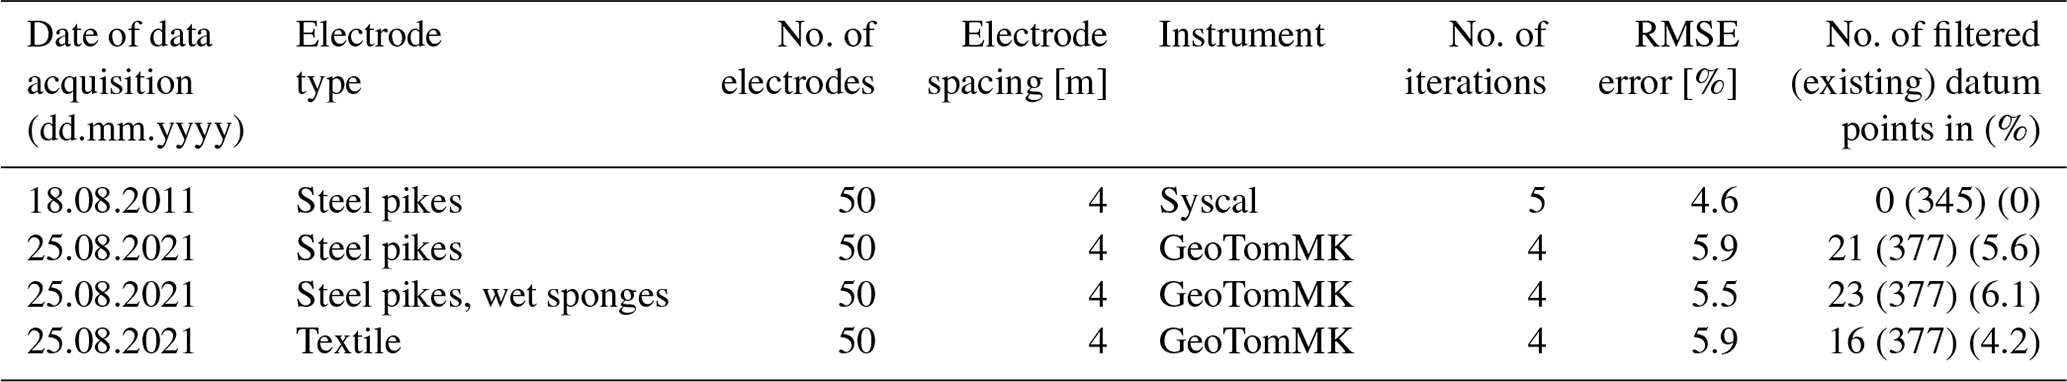
The historical tomogram displays the highest resistivity values of around 40 kΩm (bluish color between 32–56 m) (Fig. 6a) which indicate presumably ice-poor permafrost zones that are less pronounced in the repeated profile(s). Here, the maximum resistivity has reduced to 30 kΩm (green colors in Fig. 6b to d), suggesting an overall decrease in the ice content of the talus-derived rock glacier and probably an increase in moisture.
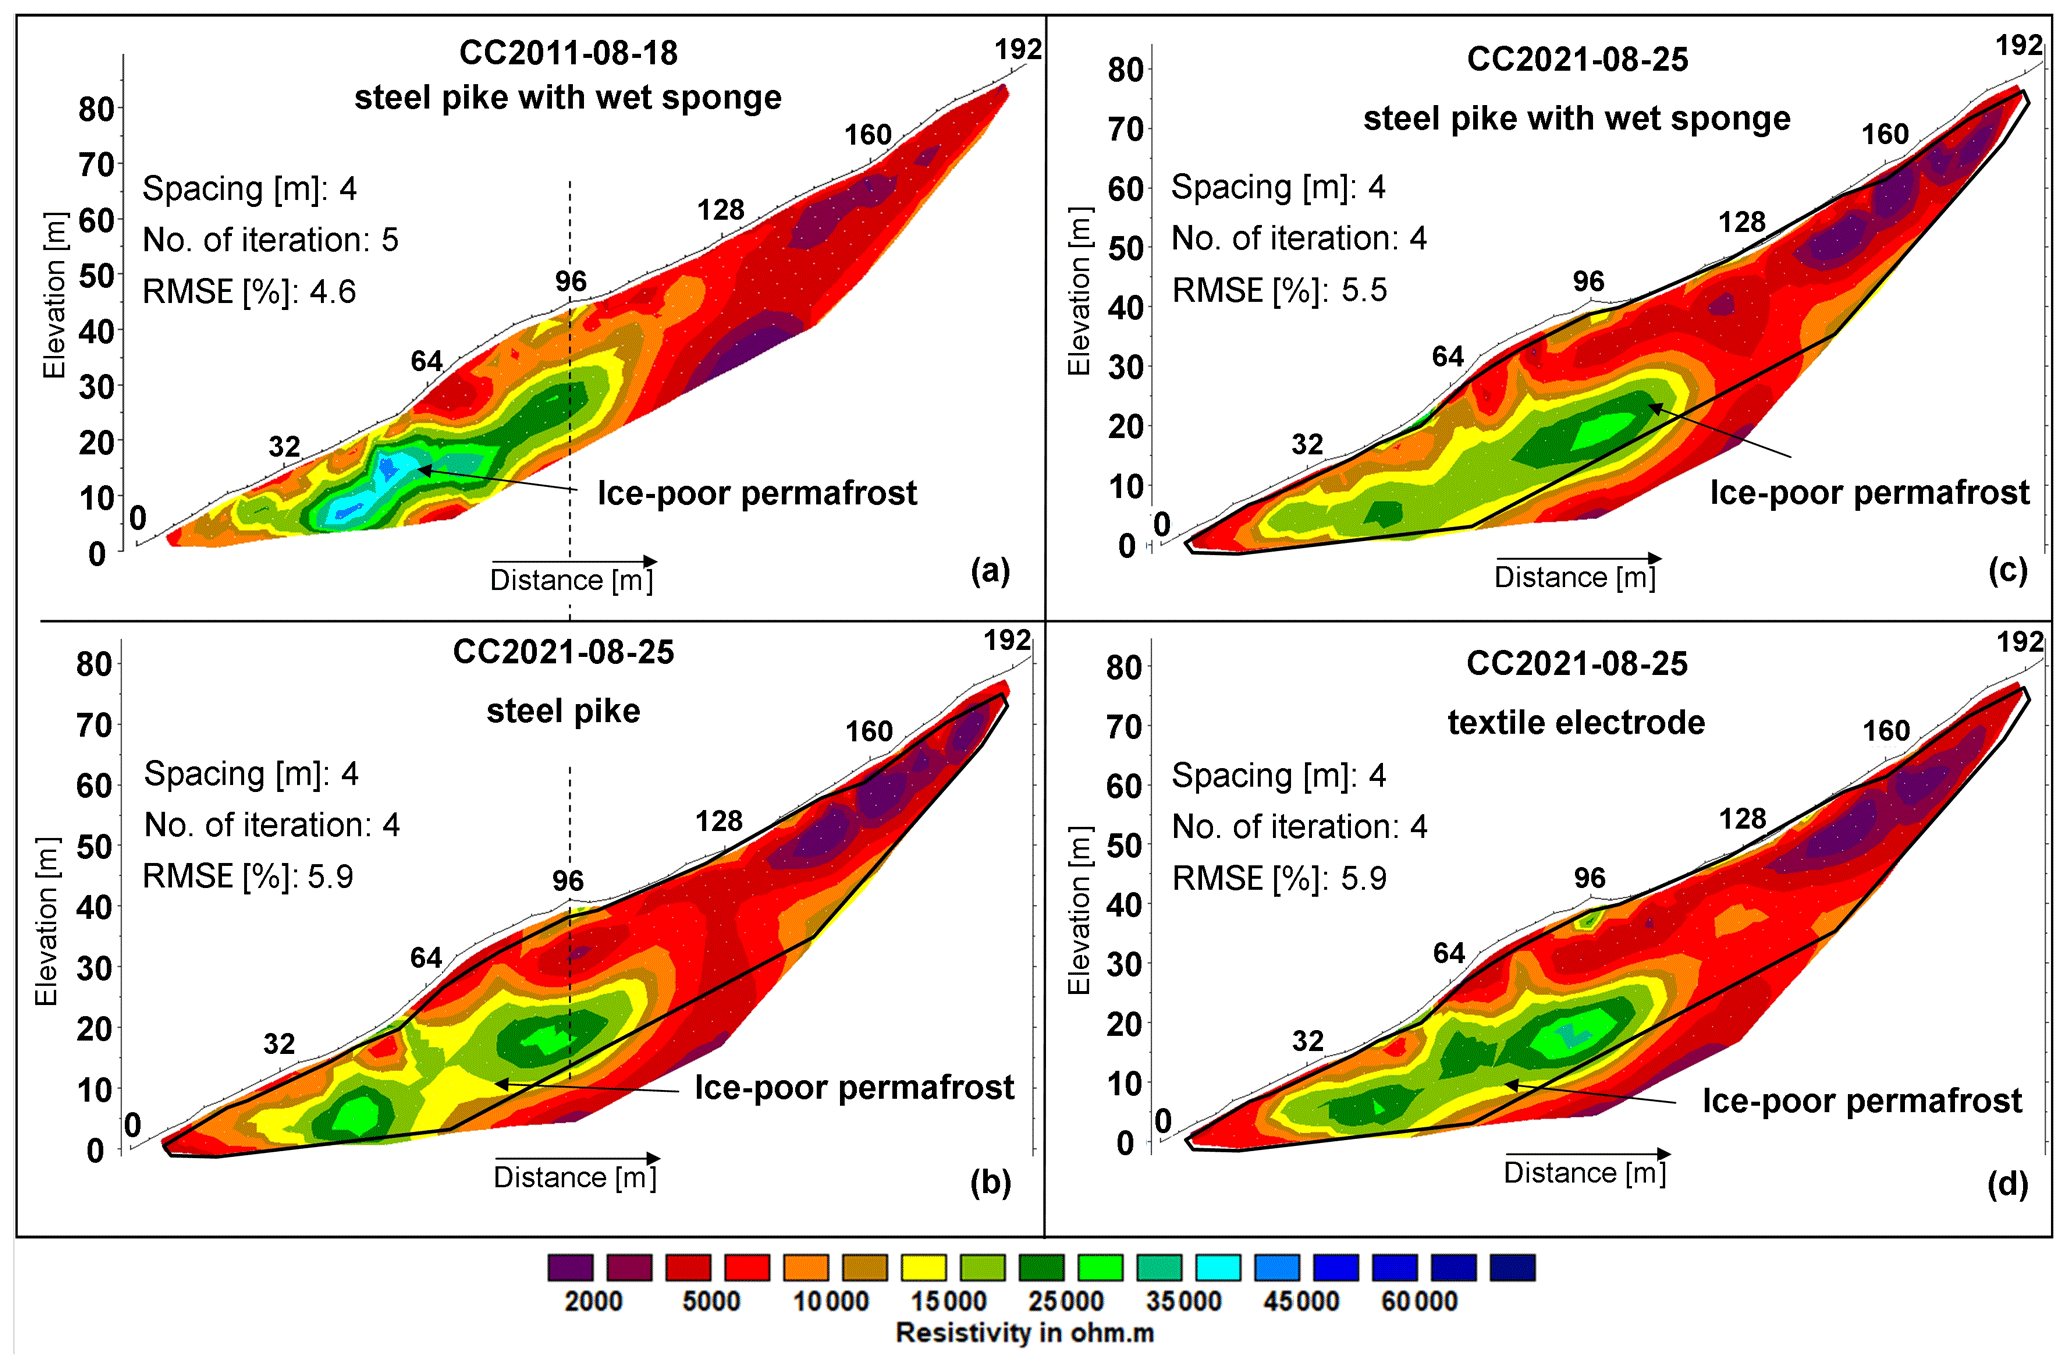
Figure 6Tomograms of the historical (2011) and the repeated (2021) profiles in the Corvatsch catchment: (a) historical profile, (b) repeated profile measured with steel pikes, (c) repeated profile measured with steel pikes and wet sponges, and (d) repeated profile measured with textile electrodes. The black lines in (b) to (d) indicate the outline of the historical tomogram.
4.2.2 Gianda Grischa
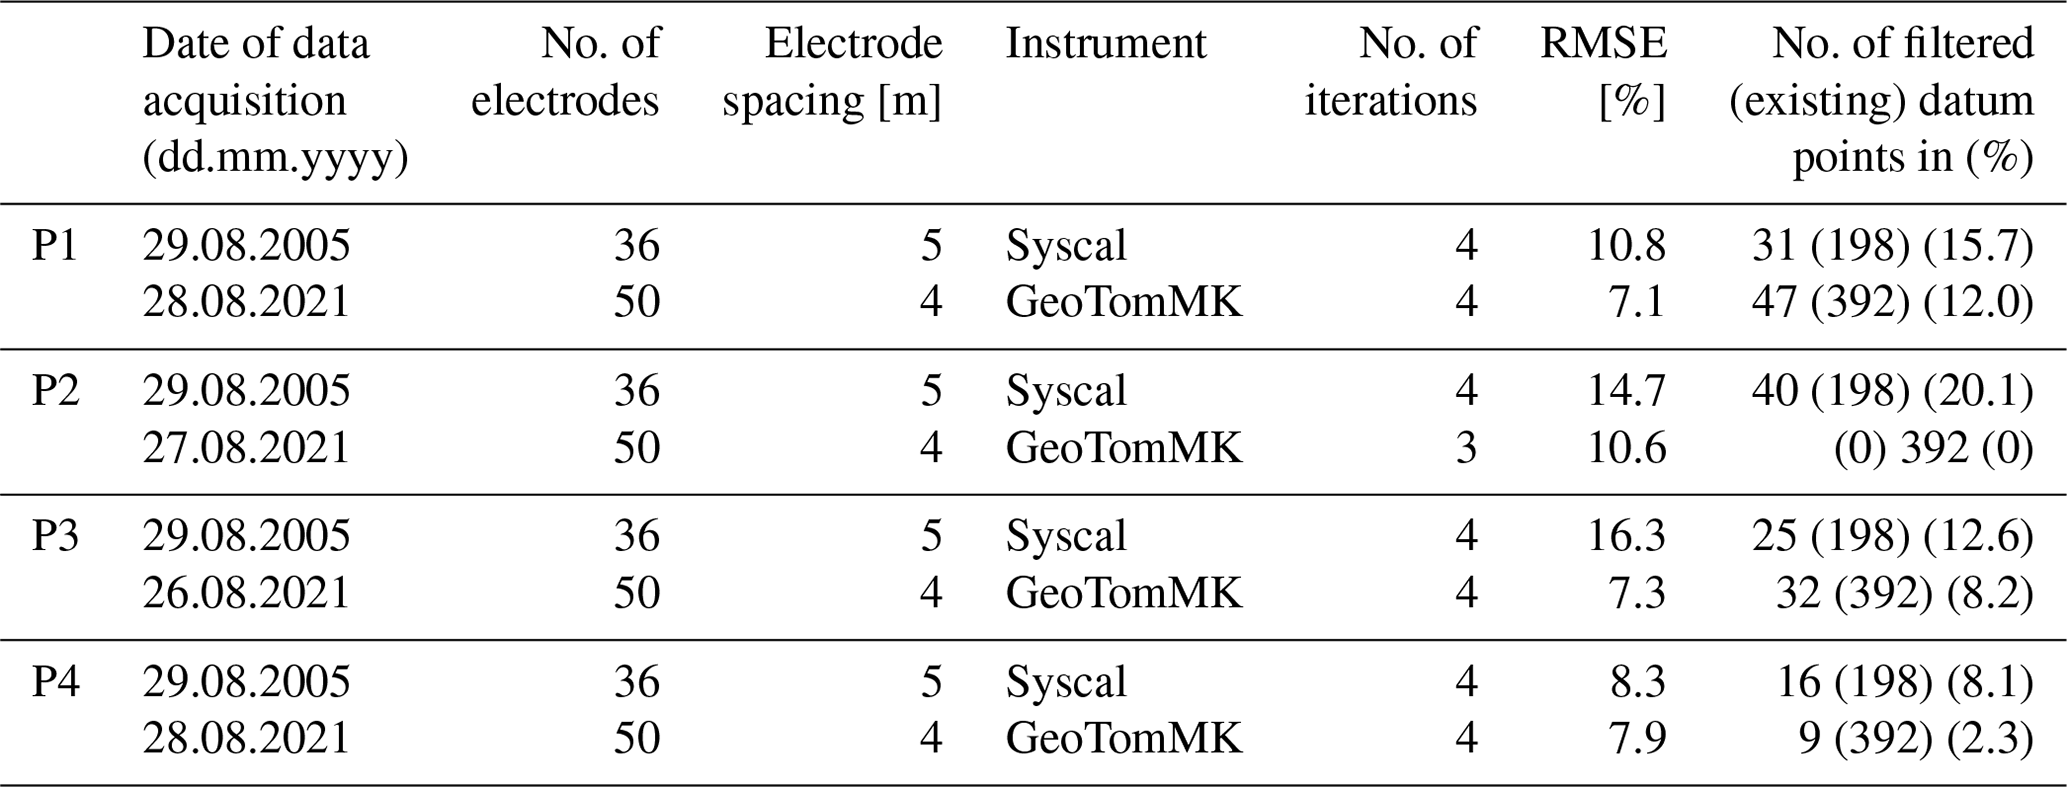
Four historical ERT profiles on the Gianda Grischa rock glacier collected on 29 August 2005 were repeated on 26–28 August 2021 (Table 2) using a combination of watered steel pikes and textile electrodes. Differences in the number of electrodes and electrode spacings between the historical and repeated measurements (Table 2) result in different lengths of the historical and repeated profiles. The RMSE of the inversion results is significantly smaller for all newly measured data compared to the historical data, for a similar number of iterations. This difference in data quality is probably due to significantly different surface and weather conditions (measurements in 2005 were obtained under very dry surface conditions). We suspect that the larger contact interfaces of the textile electrodes compared to the steel pikes also added to the better data quality.
Table 2Overview of the historical and repeated ERT profiles on the Gianda Grischa rock glacier. The second column indicates historical (2005) and newly measured data (2021).
Profiles GG-P1 and GG-P4 are mainly located on the inactive part of the rock glacier (Fig. 2), which is characterized by significantly lower overall resistivity values (<50 kΩm; see reddish color in Figs. 7 and 8) compared to the higher values observed in the active part of the rock glacier (left-hand parts of GG-P1 and GG-P4, as well as profiles GG-P2 and GG-P3; >100 kΩm, blue color in Figs. 9 and 10). The latter correspond to the central lobe of the active part of the rock glaciers. This general pattern in the resistivity distribution did not change with time, although a general resistivity decrease is observed.
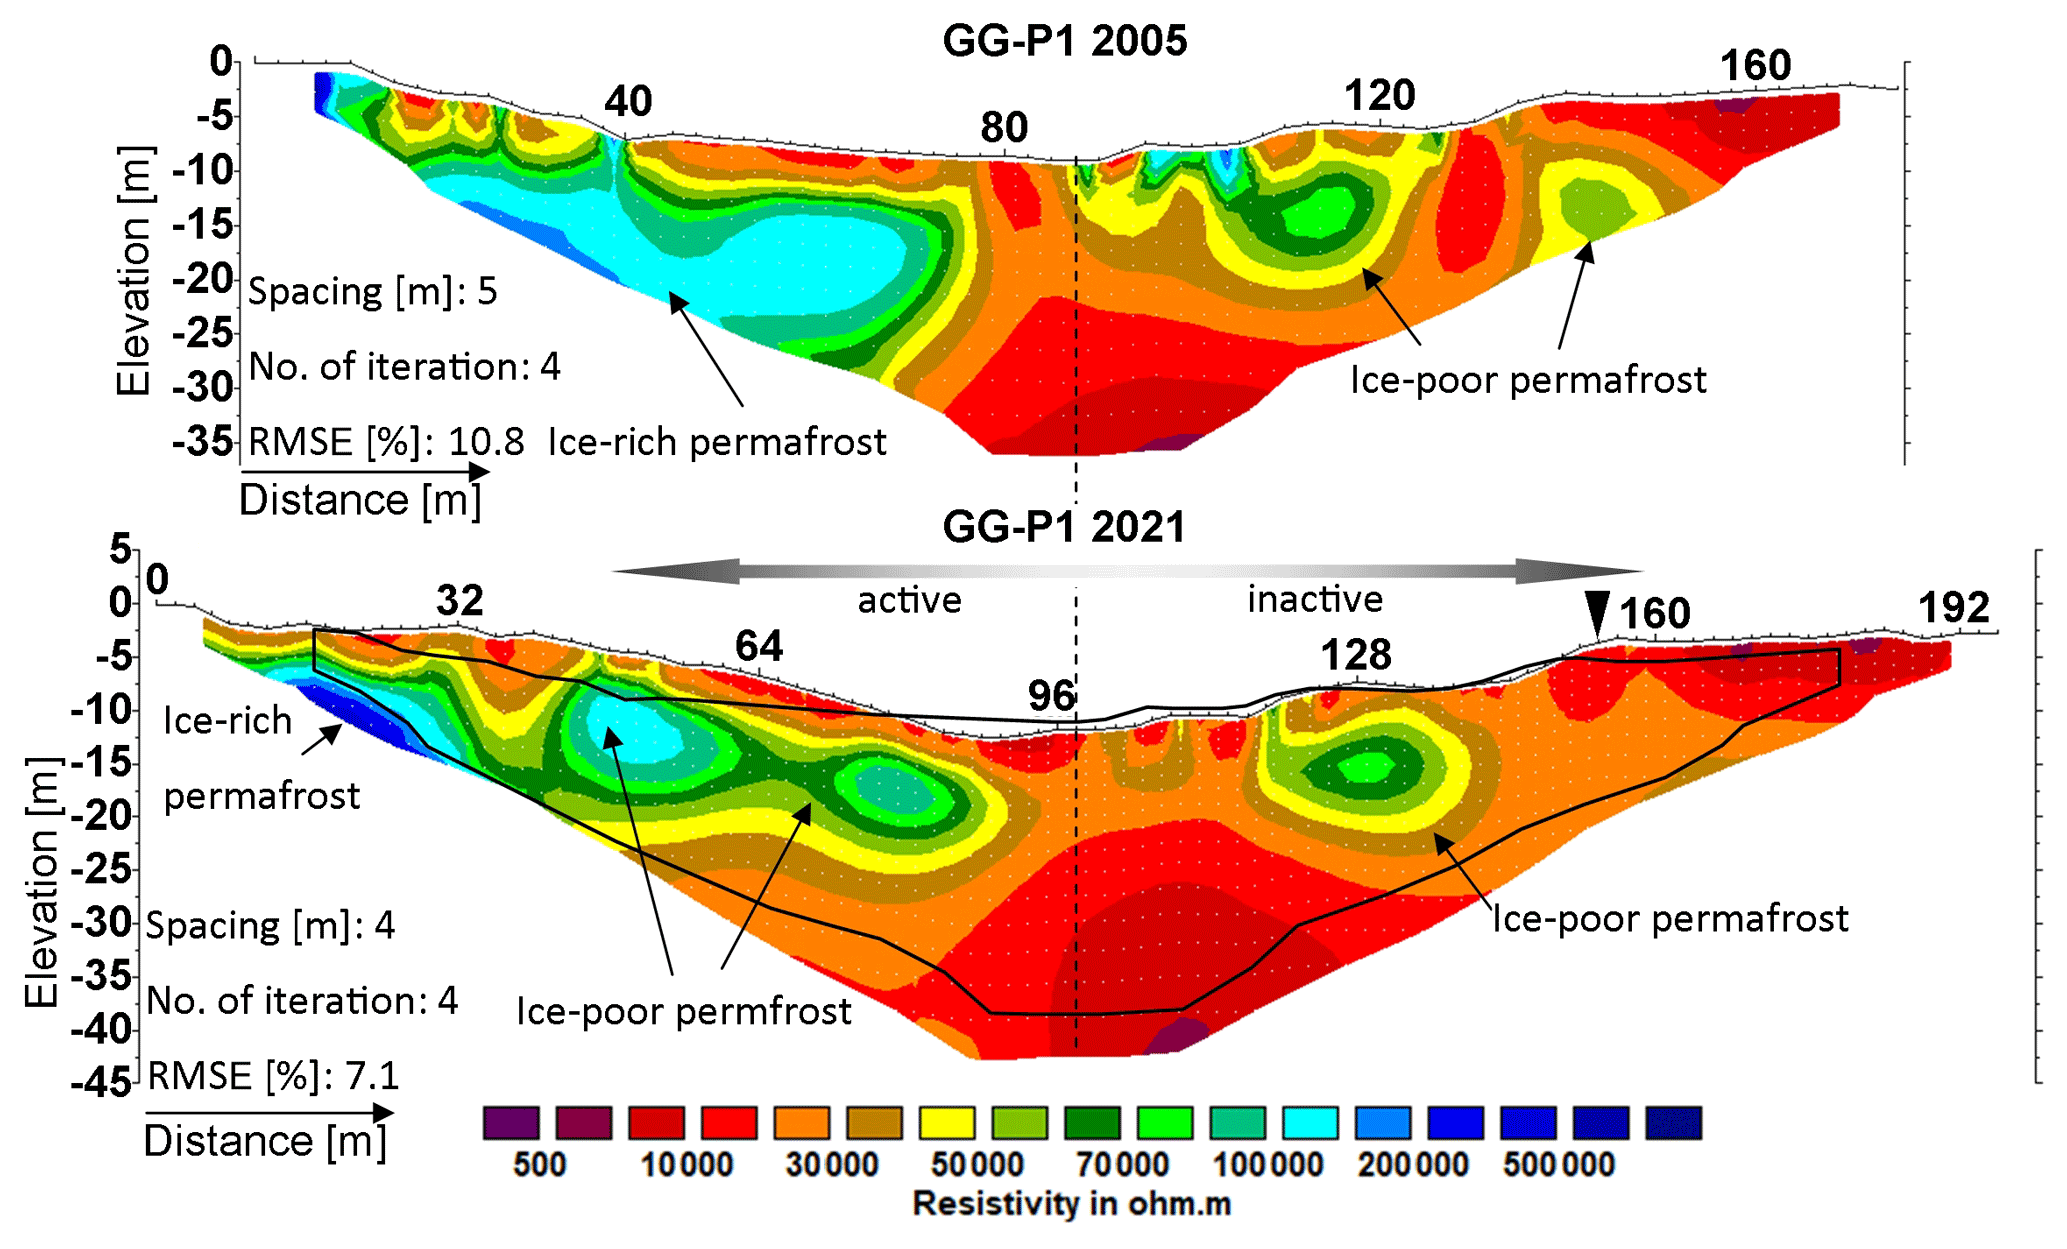
Figure 7Tomograms of the historical (2005) and the repeated (2021) profile GG-P1 on the Gianda Grischa rock glacier. The dashed line indicates the common center point. The point of intersection with tomogram GG-P4 is indicated by the black triangle. The black line indicates the outline of the historical tomogram.
Profile GG-P1 starts at a central lobe on the active part of the rock glacier and continues towards the inactive part to the south (Fig. 2). Both profiles, the historical and the repeated, show resistivity values higher than 200 kΩm for the part of the profile located on the active rock glacier (left part of Fig. 7). Below the first 80 m of the historical profile, resistivity values lower than 50 kΩm at shallow depths <5 m represent the active layer. This surface layer is heterogeneous with more resistive zones (representing drier conditions) between 0 and 15 m and around 40 m. The overall resistivity of this surface layer decreased between 2005 and 2021. At larger depths, the historical profile shows resistivity values around 150 kΩm, which we interpret as ice-rich permafrost with a thickness of ∼ 15 m. In the 2021 tomogram, this formerly compact resistive anomaly became patchier with an overall decrease in resistivity values which might indicate a transition from ice-rich permafrost to ice-poor permafrost.
Similarly, an overall resistivity decrease between 2005 and 2021 is also observed in the second half of the tomogram between 2005 and 2021. Two more resistive anomalies with high resistivity values (>50 kΩm) appear around 110 and 140 m along the profile. In 2021, the resistive anomaly around 140 m has completely disappeared, while the other anomaly displays reduced resistivity values. We conclude that ice-poor permafrost degraded strongly during the investigation period.
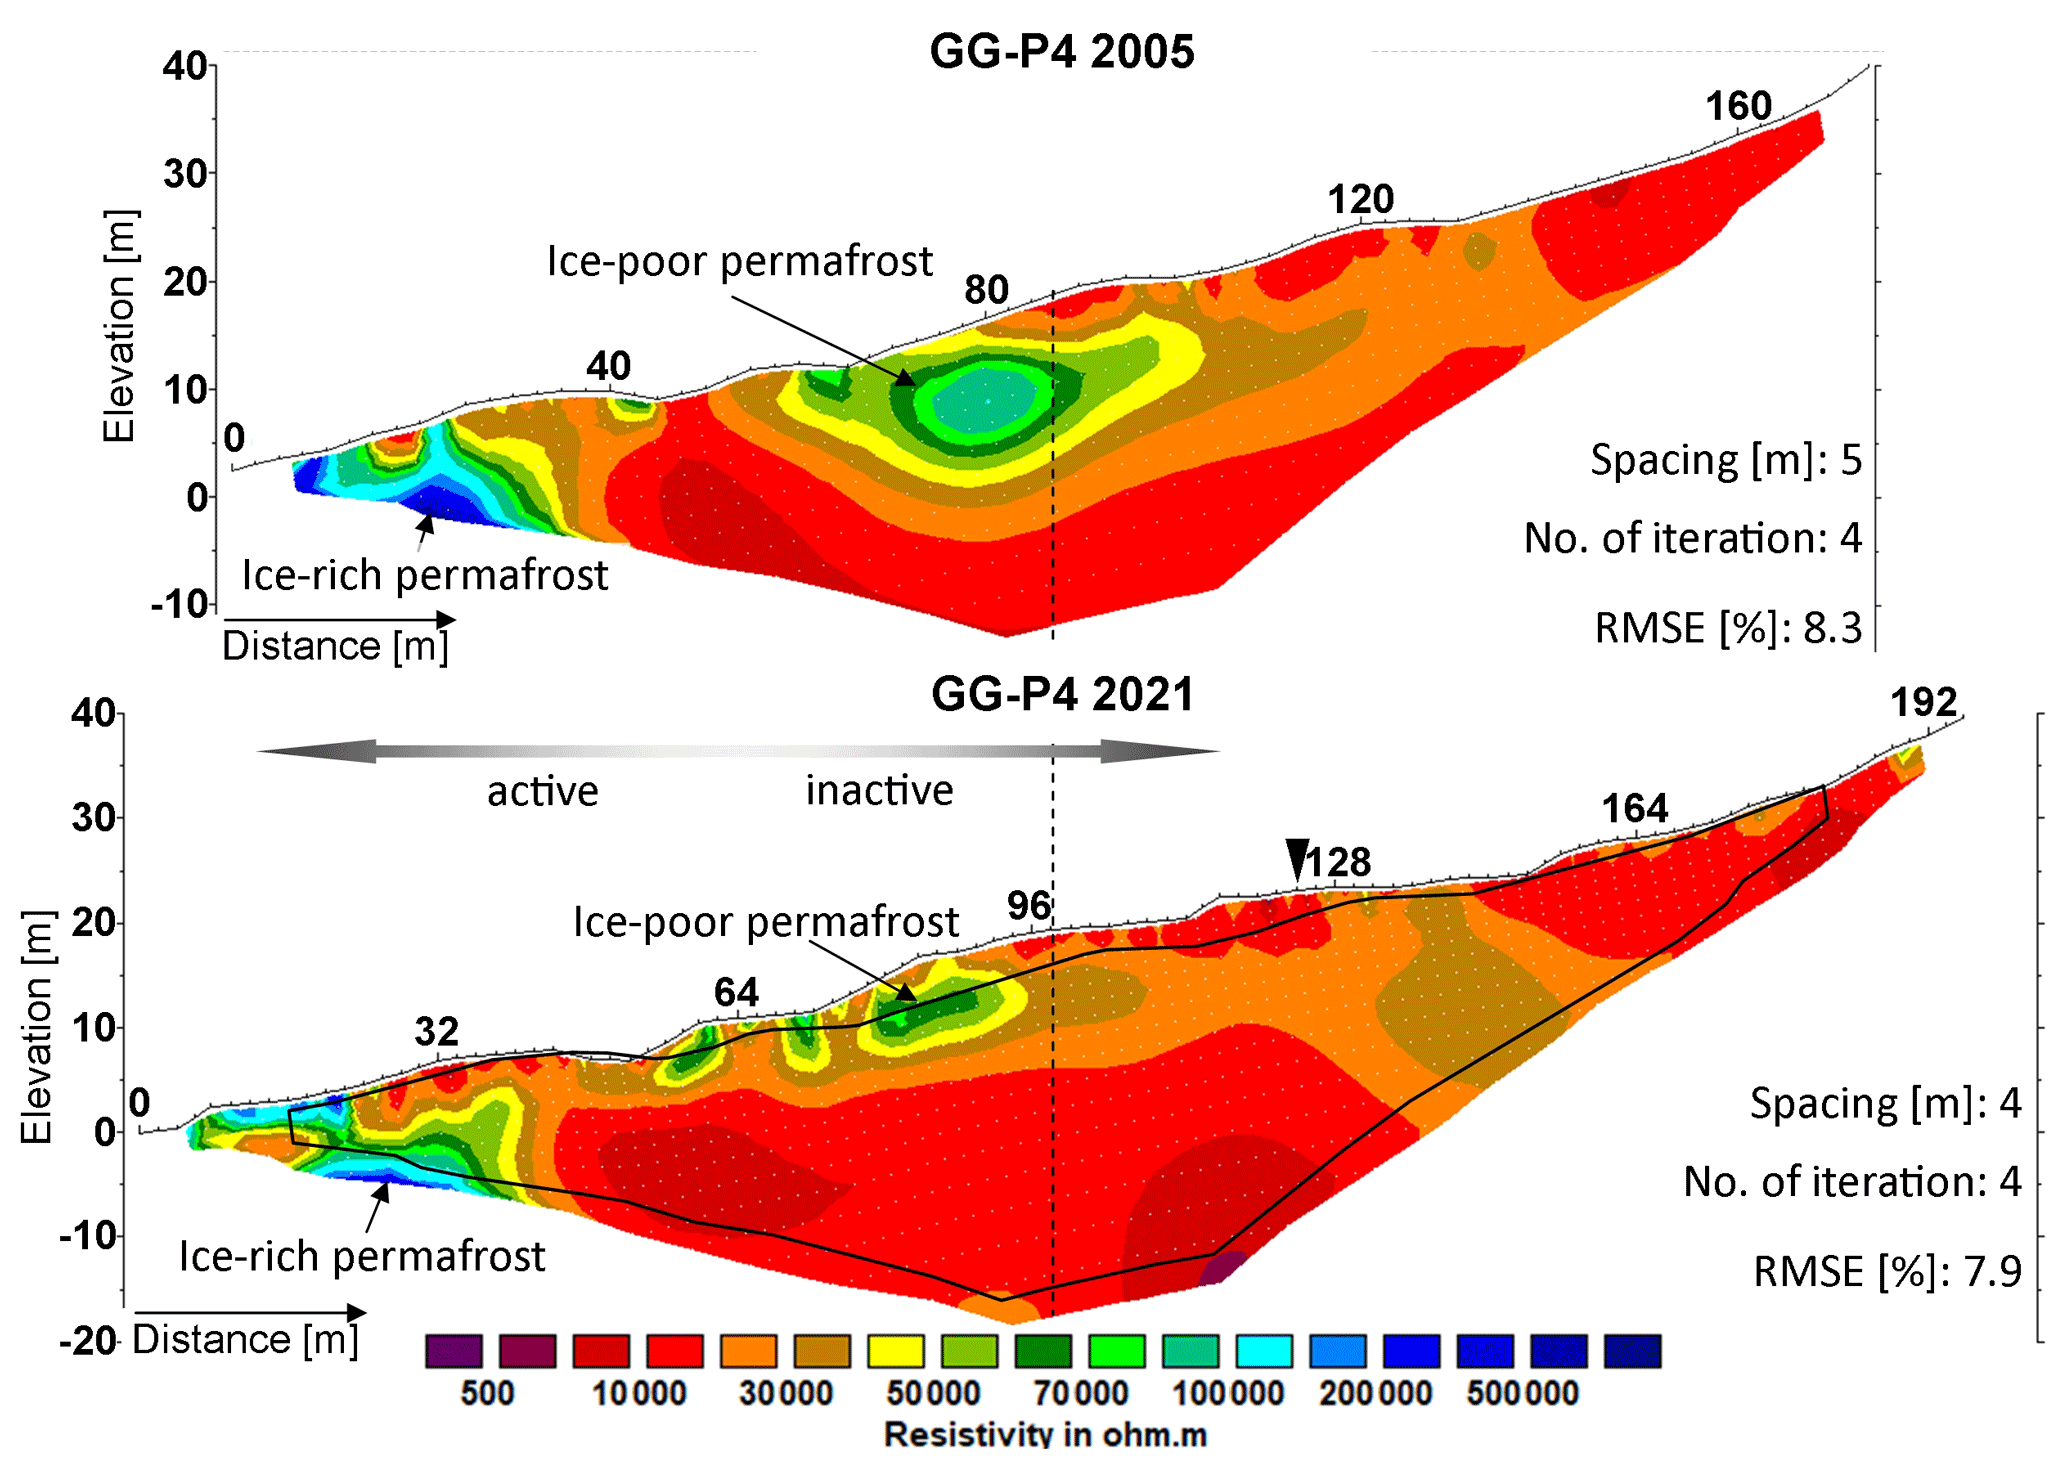
Figure 8Tomograms of the historical (2005) and the repeated (2021) profile GG-P4 on the Gianda Grischa rock glacier. The dashed line indicates the common center point. The point of intersection with tomogram GG-P1 is indicated by a black triangle. The black line displays the outline of the historical tomogram.
Profile GG-P4 stretches in a west–east direction, starting on the active part and extending into the inactive part of the rock glacier (Fig. 2). It is intersected by P1 at 124 m. The highest resistivity values (>150 kΩm) are observed on the still active part (Fig. 8), suggesting ice-rich permafrost. A highly resistive anomaly of values with up to 100 kΩm, which is clearly visible in the historical tomogram around 80 m along the profile, has strongly reduced in size in the 2021 tomogram, indicating a degradation of formerly ice-poor permafrost. However, the proximity to the surface also allows for the interpretation that the resistivity anomalies relate to air voids due to ice melt. Below ∼ 10 m depth, values <10 kΩm characterize the remaining part of the repeated profile as unfrozen. In the historical tomogram, the frozen area partly extended down to >15 m depth. This clearly indicates a degradation of permafrost during the 16-year period.
The main lobe of the rock glacier hosts profiles GG-P2 (Fig. 9) and GG-P3 (Fig. 10). These differ significantly from profiles GG-P1 and GG-P4 by a roughly two-layered structure and resistivity values of >1 MΩm. The upper layer represents the coarse-blocky active layer with resistivity values of <50 kΩm. Below, the extremely high resistivity values of >200 kΩm indicate the presence of ice-rich permafrost.

Figure 9Tomograms of the historical (2005) and the repeated (2021) profile GG-P2 on the Gianda Grischa rock glacier. The thin black dashed line indicates the common center point. The point of intersection with tomogram GG-P3 is given by a black triangle. The thick dashed line and the arrow highlight the observed downgradient shift in furrow. The black line displays the outline of the historical tomogram.
Lower resistivity (below ∼ 50 kΩm) characterizes the unfrozen parts as the active layer (dark-red color in Fig. 9). This active layer consists of coarse and blocky boulders with air-filled interstices. The 2021 measurement shows a smaller overall resistivity of the active layer as well as indications for a general thickening. At a depth of ∼ 25 m resistivity strongly decreases to <100 kΩm, indicating the lower boundary of the ice-rich permafrost and a thickness of ∼ 15–20 m. Interestingly, from 2005 to 2021 the position of the furrow shifted downward by ∼ 10 m (Fig. 9, black arrow). The highly resistive anomaly in the first part of the tomogram shifted downward by ∼ 20 m. In addition, a considerable resistivity increase to values >1 MΩm is observed in the upper part of the profile in the 2021 tomogram between 128 and 164 m. This phenomenon is further discussed in Sect. 5.2.
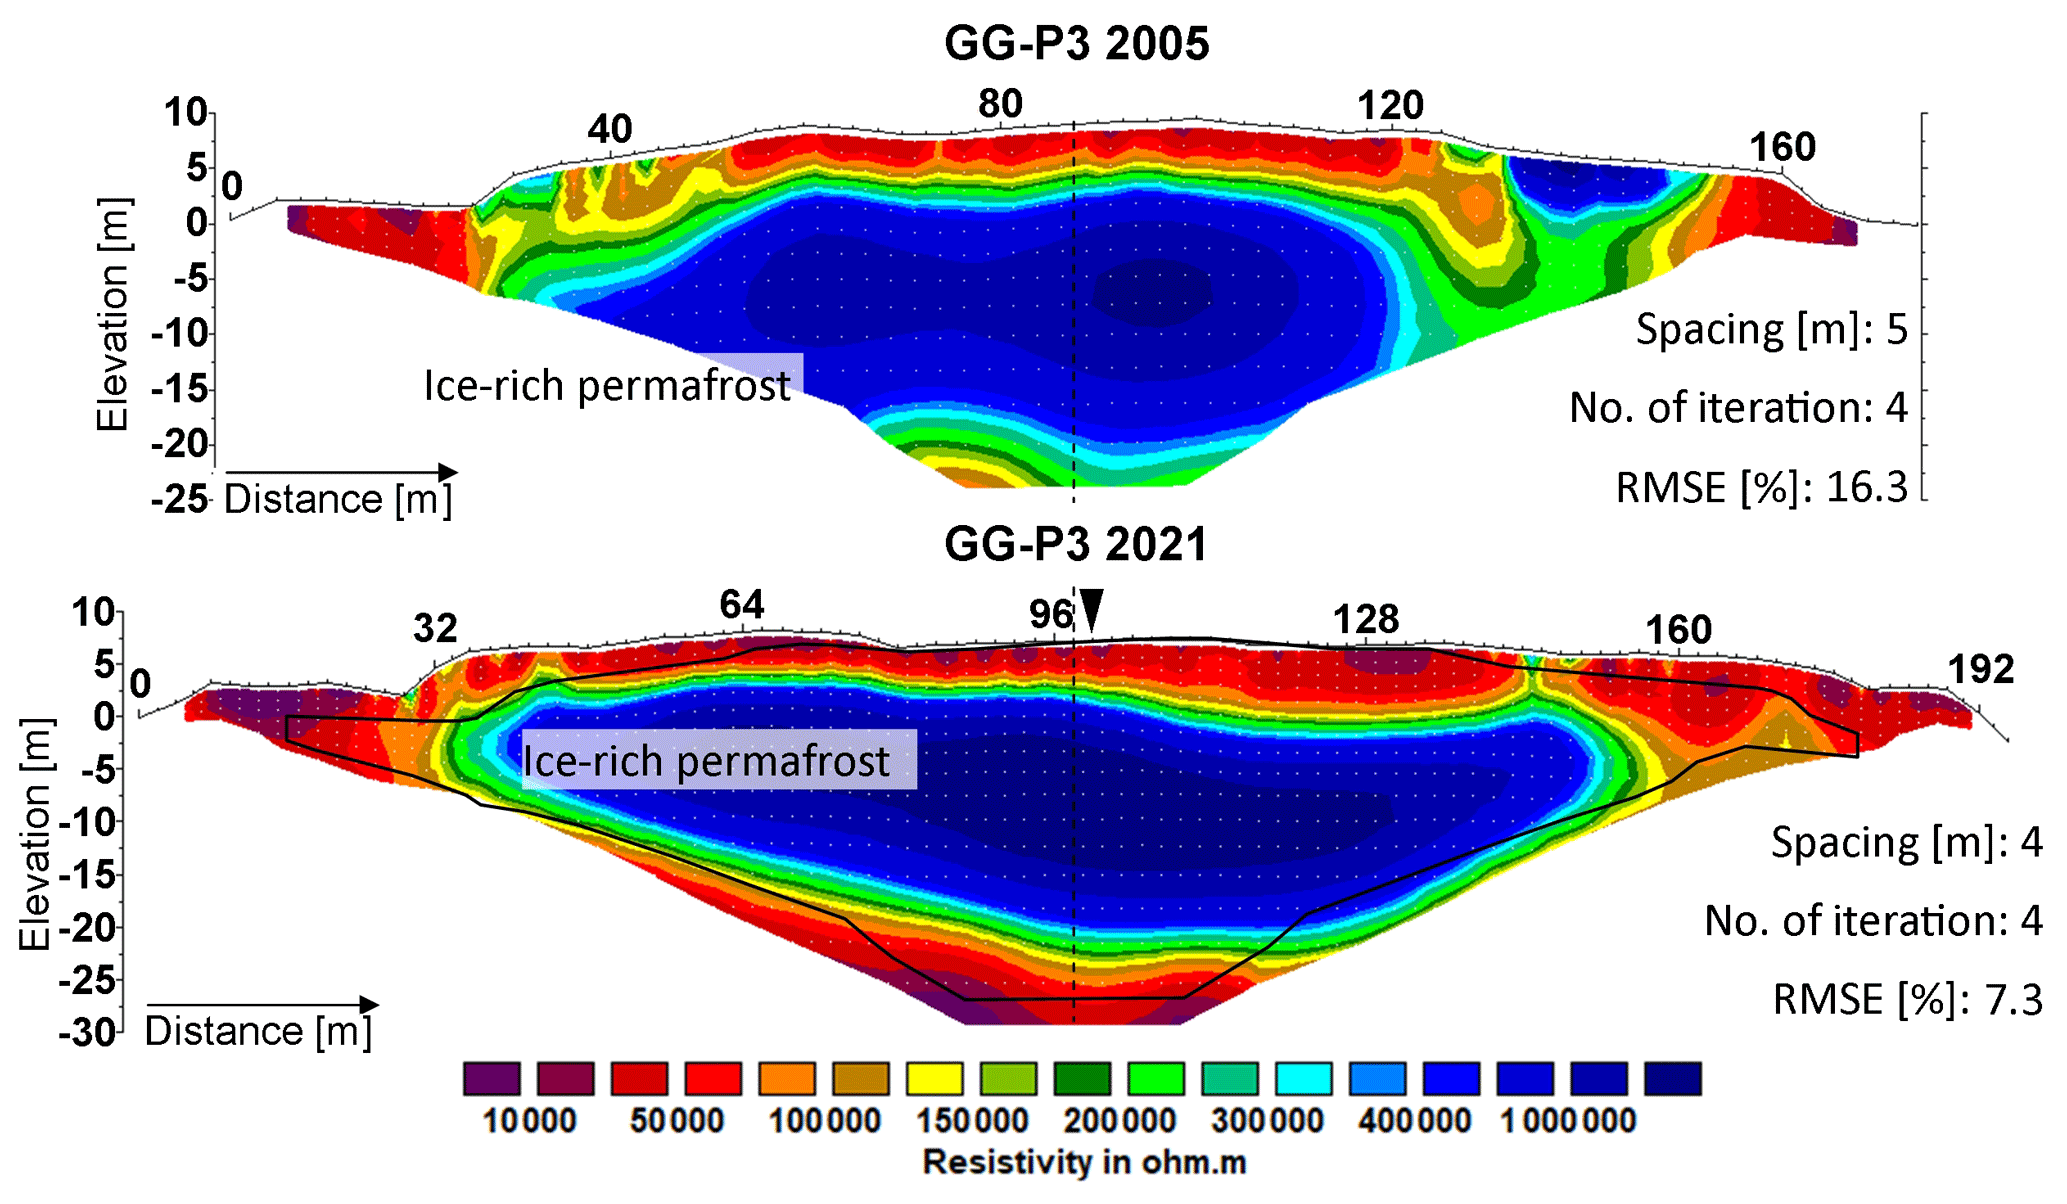
Figure 10Tomograms of the historical (2005) and the repeated (2021) profile GG-P3 on the Gianda Grischa rock glacier. The dashed line indicates the common center point. The point of intersection with tomogram GG-P2 is indicated by a black triangle. The black line displays the outline of the historical tomogram.
Profile GG-P3 intersects profile GG-P2 at 2615 m a.s.l. parallel to the contours (see Fig. 2). The tomogram represents a cross-section of the active lobe. Similar to profile GG-P2, the active layer is clearly visible and shows higher and more heterogeneous resistivity values in the historical data set compared to the repeated profile. The very high resistivity values (>1 MΩm) in the central part of both the historical and the new tomograms clearly indicate ice-rich permafrost. Additionally, the resistivity values in the central section of ice-rich permafrost increased from 1 MΩm in 2005 to 2 MΩm in 2021, which is also observed in the upper part from profile GG-P2 (see Sect. 5.2 for further discussion).
4.2.3 Glatzbach catchment
Given the seasonal difference in data acquisition, we limit our data description and interpretation to the area below the seasonally conditioned active layer. Values around 10 kΩm given by the dark-green color mark the transition from the unfrozen to the frozen zone in the repeated tomograms (Fig. 11).
Table 3Overview of the historical and repeated ERT profiles in the Glatzbach catchment.
Profile GL-P1 crosses the talus slope in an east–west direction. The general pattern of subsurface resistivity is characterized by a section of higher resistivity values at ∼ 5 m depth below the center, embedded in a more conductive surrounding (Fig. 11a). The resistivity values (>30 kΩm) in the center of the historical tomogram indicate ice-poor permafrost. While the historical tomogram reaches maximum resistivity values of around 80 kΩm, the newly measured profile only reaches maximum values of ∼ 30 kΩm; i.e., the resistivity of the central anomaly of ice-poor permafrost is reduced by around 50 kΩm.
This significant reduction in overall resistivity is also evident in the upslope part of profile GL-P2 (Fig. 11b). While the historical profile GL-P2 contains a highly resistive zone with values higher than 30 kΩm (64–82 m), values between 10 and 20 kΩm appear at the same location in the newly measured profile. Below the first half of the profile (0–54 m), values of up to 3 kΩm in the historical tomograms of GL-P2 indicate unfrozen substrate. The similarity in the resistivity values below the first half of the profile (0–60 m) at two different times of the year (July 2009 and September 2021) indicates practically constant electrical resistivities of the ice-free subsurface, which highlights the usefulness of ERT tomograms for the identification of permafrost degradation over longer periods of time.
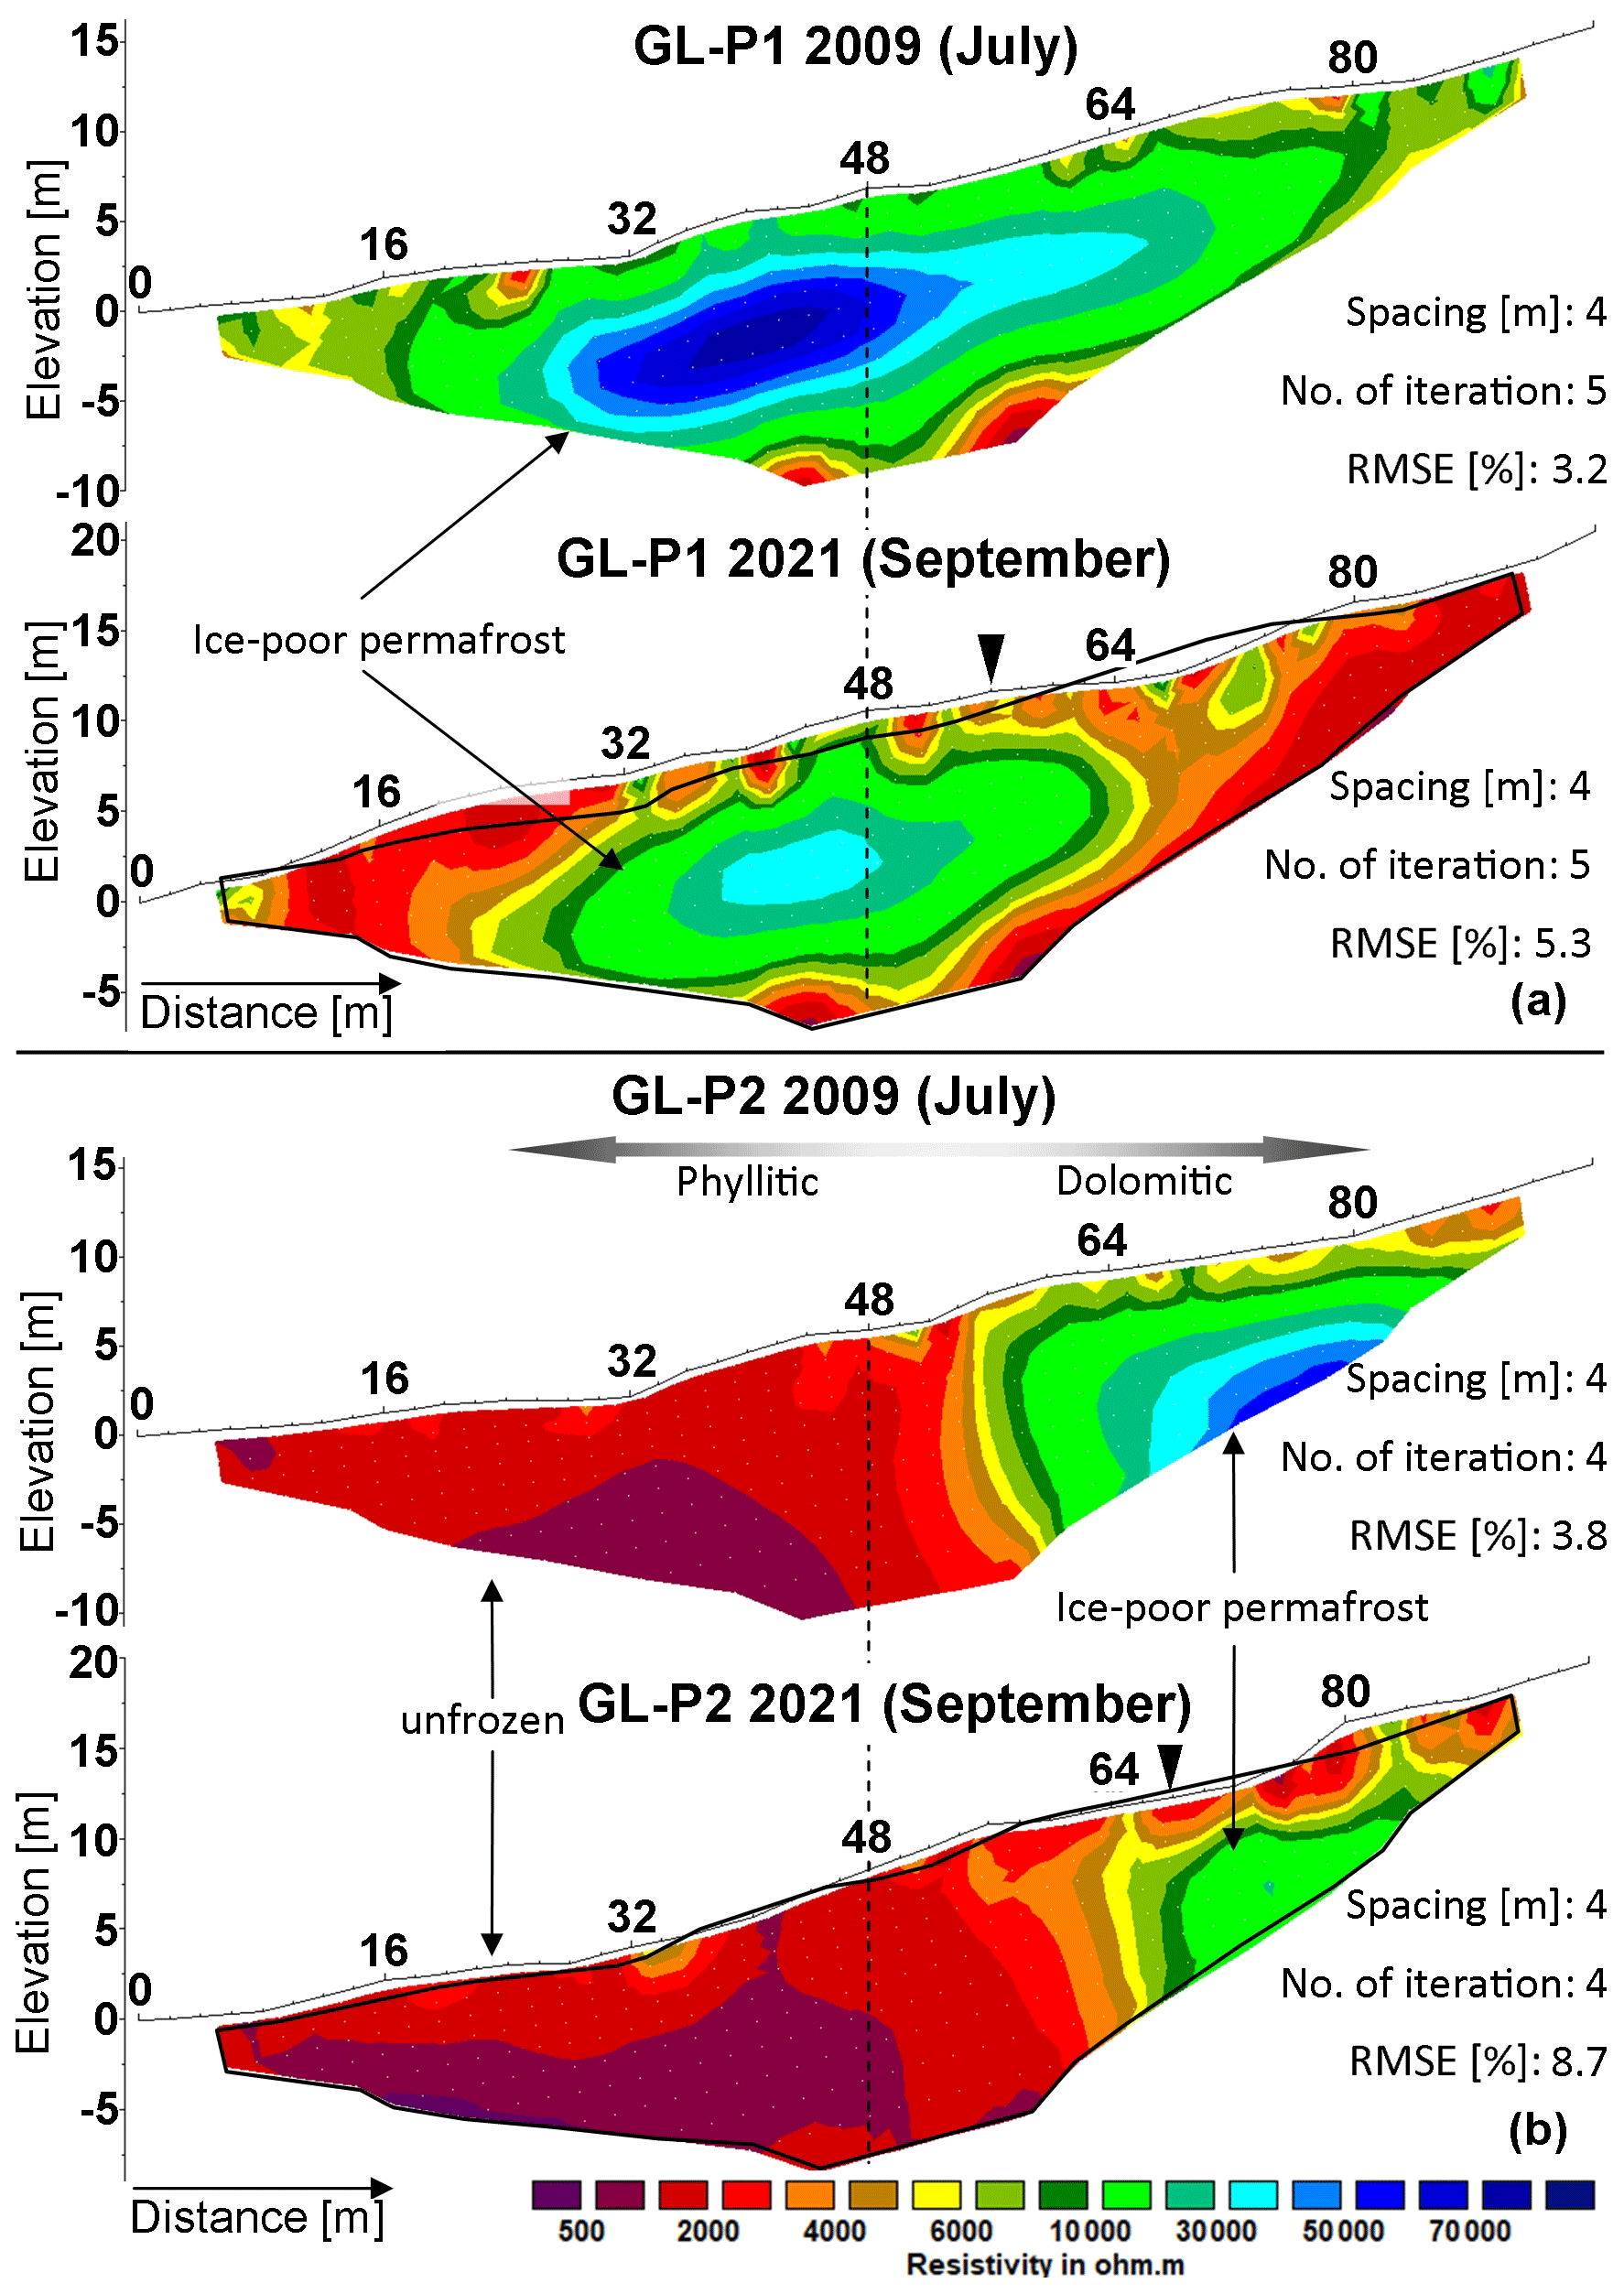
Figure 11Tomograms of the historical (July 2009) and the repeated (September 2021) profiles GL-P1 and GL-P2 in the Glatzbach catchment. The dashed lines indicate the common center points. The points of intersection of the two perpendicular profiles are indicated by black triangles. The black lines display the outlines of the historical tomograms.
5.1 Textile electrodes
In order to overcome the difficulties of galvanically coupling electrodes to the ground for ERT measurements in mountainous settings, we designed, manufactured and tested textile electrodes under field conditions. Our results show a good (and even slightly better) quality of the apparent resistivity data measured with the textile electrodes compared to conventional steel pike electrodes (Sect. 4.1). This is most likely due to the good galvanic contact, which can be established between the flexible material of the electrodes and the uneven surface of outcropping bedrock or loose blocky material covering the surface. It is also possible to combine steel pikes and textile electrodes in a multi-electrode field setup (as realized on the Gianda Grischa rock glacier and in the Glatzbach catchment): simple steel pikes are better suited for fine-grained sediment and/or vegetation-covered surfaces, while textile electrodes are much easier to install and perform better on hard and blocky surfaces. For capacitively coupled electrodes, Uhlemann and Kuras (2014) argue that the point-pole approximation is valid if the electrode spacing is at least 4 times the diameter of the contact area. Since the diameter of the contact area of our new textile electrode is <15 cm and our minimum electrode spacing is 4 m, we are well above these limits. To assess the size effect of square surface electrodes on ERT measurements, Cardarelli and De Donno (2019) carry out finite-element modeling studies. They find that errors fall well below 1 % for electrode separations 5 times the electrode size or larger if compared to a point source, further supporting the feasibility of our relatively small textile electrodes.
In non-geoscientific applications, non-invasive electrodes are widely used for moisture measurements on hard surfaces or for medical applications (e.g., for the recording of electrocardiograms). In geophysics, various materials and geometrical shapes of non-invasive electrodes have already been investigated in other studies, such as small medical electrodes (Sass and Viles, 2006) and metallic mesh electrodes (Tomaškovičová et al., 2016). For capacitive resistivity measurements, where a galvanic contact between the electrode and ground is unwanted, non-invasive electrodes can be considered part of the measurement principle (Kuras et al., 2006; Mudler et al., 2019).
Despite these similarities, our new textile electrodes differ from these existing non-invasive electrode types. One important aspect is the flexibility of the electrode shape, which optimizes the coupling conditions by maximizing the contact surface between the electrode and surface. The electrodes used in this study are prototypes and can still be improved for future studies. Due to the simple processability, different shapes and sizes of electrodes can be realized, which makes this electrode type very versatile and easily adaptable to measurements on different scales (from centimeters to kilometers). Also, regarding the filling material, the textile electrode is highly flexible. Besides applications in mountain environments, our new non-invasive textile electrodes will be very useful for electrical measurements on other hard surfaces. In particular, we foresee many interesting applications in urban geophysics, where – due to the type of investigated objects (roads, buildings or infrastructure) – only non-invasive methods are feasible.
5.2 Tomogram comparability and accuracy assessment
The exact relocation of the historical profiles, different measurement equipment, electrode array and spacing as well as profile length make a comparison of historical and repeated tomograms challenging, resulting in a different data resolution and in a different depth of investigation indicated by the varying black tomogram outlines (see Figs. 6–11). Therefore, some constraints must be taken into account when comparing the tomograms. For instance, we are limited to a visual comparison based on significant anomalies greater than 10 kΩm in both historical and repeated tomograms. By using this threshold, we suppose that most of the uncertainties (proper location, unfrozen water content, water chemistry and saturation, pore connectivity, mineralogy, and grain size characteristics) can be excluded (compare Fortier et al., 1994; Mollaret et al., 2019). A direct, algorithm-based comparison seems to be an important and challenging task for the future. Temperature-related changes in active-layer thickness, which is strongly sensitive to climate warming (Scherler et al., 2013), cannot be inferred reliably due to the limitation of a visual comparison.
Regarding the tomogram comparability, we used the smoothness-constrained least-squares inversion (L2 norm) instead of the often applied robust inversion scheme (L1 norm) (e.g., Emmert and Kneisel, 2017; Halla et al., 2021; Supper et al., 2014). This way, we avoid the tomograms being dominated by sharp boundaries, the comparison of which would be misleading due to the location errors discussed above. The resulting RMSE values vary in a range from 3.2 % to 16.3 %, whereby the RMSE values are slightly higher in the tomograms from the Gianda Grischa rock glacier. Yet these values are well within the range of other ERT applications on rock glaciers (Hauck and Kneisel, 2008; Hauck and Vonder Mühll, 2003; Villarroel et al., 2021). The number of iterations required to fit the measured apparent resistivity to the calculated resistivity model is 4 ± 1, which is in a similar range of values as in the comparable studies mentioned above. Another aspect of data quality concerns the number of filtered values compared to all collected data points. The raw data of the Gianda Grischa rock glacier were filtered by 0 %–20 % of all data points, whereby only 0 %–6.1 % from the raw data were filtered at the Corvatsch catchment and 0 %–8.7 % were filtered at the Glatzbach catchment. A filter approach similar to what we used (compare Sect. 3.1) is presented by Rosset et al. (2013) and is called a technical and magnitude filter. The authors filtered an average of 8.79 % of all data points in six tomograms of four comparable study sites. The similar filtering approach used for the 16 tomograms of this study results in an average of 6.8 % filtered values.
5.3 Geomorphological interpretation of resistivity change
In addition to the technical aspects for a proper installation of the historical profile (see Sect. 3.2), geomorphological conditions must also be taken into account, with respect to the interpretation of permafrost degradation on the basis of the resistivity distribution. The nature of active rock glaciers involves downslope creep of the debris–ice mixture (Barsch, 1996). Creep patterns and velocities of rock glaciers vary as a function of their ice content and the slope angle (Haeberli et al., 2006) and are preconditioned by morphometric, topoclimatic and lithological catchment characteristics (e.g., Blöthe et al., 2020; Buckel et al., 2022).
The results from the profiles on the active part of the Gianda Grischa rock glacier (GG-P2 and GG-P3) both reveal higher resistivity values in the ice-rich permafrost zone (Fig. 9) in the 2021 tomograms as compared to those measured in 2005. Due to the global temperature increase, which accelerates permafrost degradation and leads to generally decreasing resistivities in the Swiss Alps (Mollaret et al., 2019), we would rather expect a general decrease in resistivity due to the melting of subsurface ice along most other profiles in this study. We attribute this unexpected increase in resistivity to an effect of a compressive flow pattern of the ice-rich rock glacier material, which was formerly located further up. Today, this rock glacier material accumulates and compresses in the flatter area of the location of profiles GG-P2 and GG-P3, which reveals itself by the shorter distances between the contour lines on the map in Fig. 2.
Analyzing aerial imagery, Frauenfelder et al. (2005) identified an average creep rate of 0.4 to 0.5 m a−1 (1971–1998) for the active part of the Gianda Grischa rock glacier (Fig. 12a) with the highest creep rates of approximately 1 m a−1 (1971–1998) within these steeper areas (Fig. 12a). The location of the general fastest creep remains in the steeper area of the rock glacier in the most recent time period (2015–2019), while the area of the fastest creep extended downslope (Fig. 12b). Additionally, the map illustrates a general velocity increase in the entire lower part of the rock glacier by a factor of 1.5 to 2. The general pattern of the superficial appearance, such as the rock-glacier-typical furrow-ridge sequence, is preserved in the newly obtained topography of the longitudinal profile GG-P2 (Fig. 9). In 2021, these prominent topographic features were shifted ∼ 10 m downwards along profile P2 (Fig. 9). This shift roughly fits the creep rate derived by Frauenfelder (2005). The same creep behavior can also be observed at the transversal profile GG-P3, which is situated parallel to the contour lines and crosses profile GG-P2 (Fig. 2). Between 2005 and 2021, the central point of profile GG-P2 was shifted downgradient by ∼ 9 m. Especially the area encompassed by the dotted polygon indicates an acceleration of the average annual creep rate from 0.17–0.26 m a−1 (green) to 0.47–0.56 m a−1 (orange) due to climate-induced temperature increase (Fig. 12b; compare Marcer et al., 2021; Hartl et al., 2023). The resulting faster creep behavior supplies the zone marked by the dotted polygon close to profiles GG-P2 and GG-P3 with rock glacier material including ice-rich permafrost, which is reflected by the high resistivity values along the transversal profile GG-P3. This creep behavior also affected the marked starting points of profiles GG-P1 and GG-P4, and the downslope movement of the markers (cairns) is consistent with the flow pattern (see Fig. 2).
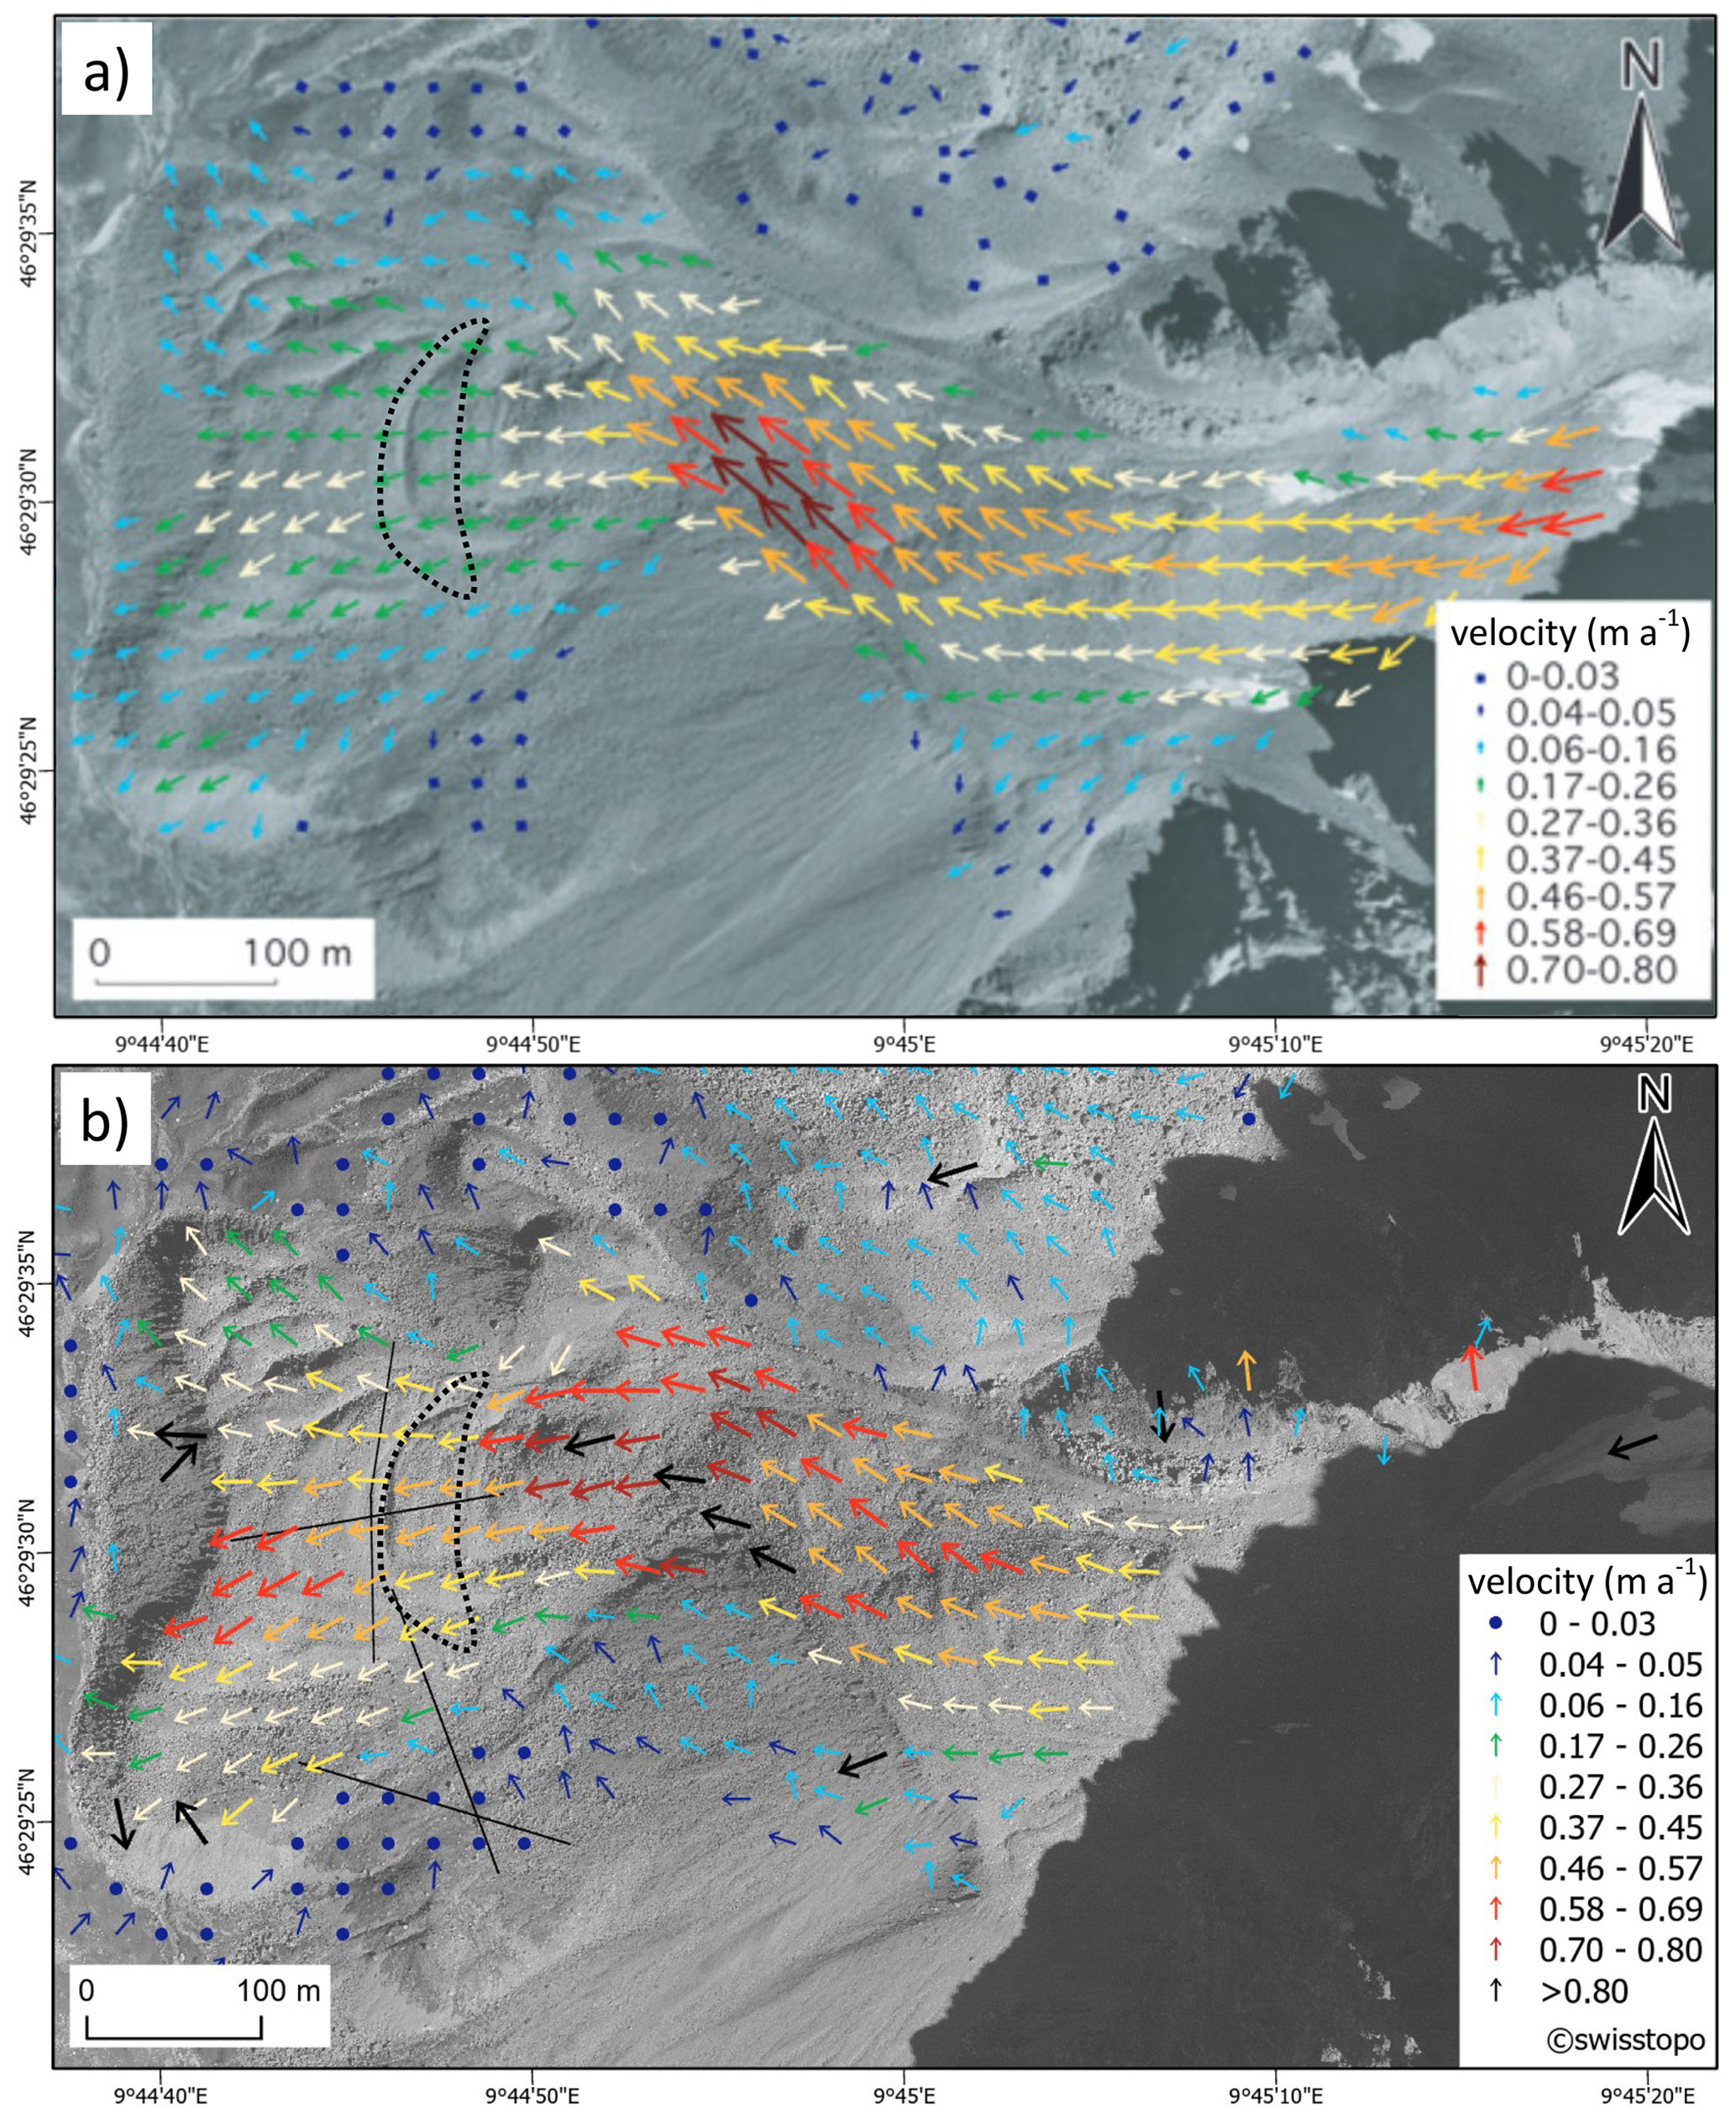
Figure 12The average annual creep rate in the time period (a) 1978–1998 (modified from Frauenfelder et al., 2008) and (b) 2015–2019, as obtained from repeated aerial imagery. The arrows encompassed by the dotted polygon illustrate the velocity increase, highlighted by the color change from green (0.17–0.26 m a−1) to orange (0.47–0.56 m a−1) between the two observation periods. The black thin lines in (b) indicate the recently measured ERT profiles.
All other profiles in our study, which neither are situated on an active part of a periglacial landform nor contain ice-rich material, show an almost unchanged topography and a significant reduction in resistivity values over the last decade. This is particularly true for the Glatzbach catchment, where the topography remained practically unchanged. Here, no significant movement rates are expected due to the absence of furrows and ridges, indicating creep permafrost and the generally lower ice content. However, the profiles in the Glatzbach catchment were remeasured significantly later during the course of the year (early September instead of early July), and observed resistivity changes also partly reflect seasonal differences in temperature, humidity or snow cover (compare Pogliotti et al., 2015; Scherler et al., 2013) as well as the seasonal advance of the thawing front (Hilbich et al., 2008), which results in decreasing resistivity values within the active layer (64–96 m; Fig. 11b).
In the Glatzbach catchment we focused on the description of the resistivity changes below the active layer (<2 m, given by Otto et al., 2012) without influence from seasonally varying conditions. The particular (almost identical in shape) resistivity distribution along the historical and the repeated profile GL-P2 in Fig. 11b supports an adequate profile recovery. Resistivity values of up to 3 kΩm below the lower part (0–52 m) of the profile can be linked to a fine-grained, phyllitic substrate outside of the coarse-grained and ice-containing block field (Otto et al., 2012). The regolith and the underlying bedrock are highly conductive due to the lithology and additional tectonic fracturing, as reflected by low resistivity values of <1 kΩm. The range and distribution of low resistivity values is in the same range and distribution away from the block field in the repeated, non-permafrost-related part of profile GL-P2.
5.4 Permafrost degradation in terms of resistivity change and temperature increase
Resistivity values reflect different subsurface conditions (see Sect. 3.1) and are especially sensitive to the occurrence of ground ice. However, unfrozen water content and infiltration of precipitation as well as snow and ice melt lower resistivity values, even if the subsurface temperature is below the freezing point (Hilbich et al., 2011; Kneisel et al., 2008; Mollaret et al., 2019). Unfrozen water content is available between 0 and −5 ∘C depending on the material characteristics and lowers resistivity up to 600 Ωm for sandy soil in a laboratory experiment (Tang et al., 2020). The effect of unfrozen water content in the investigated study sites should occur at higher resistivity values due to the larger grain sizes and the resistive lithology. Fortier et al. (1994) examined the effect of unfrozen water content on apparent resistivity during active-layer thickening (April–June). The unfrozen water content significantly affects the apparent resistivity up to a value of about 10 kΩm, while the ice content increases above this value: in the frozen layer characterized by high content of ice (mass proportion of ice >30 %) below the active layer, the unfrozen water content decreases significantly and the apparent resistivity exceeds the value of around 10 kΩm. Therefore, we assess the effect of unfrozen water content on the interpretation of permafrost degradation in this study as minor due to the used threshold (10 kΩm). Additionally, values around 10 kΩm indicate the presence of ice also in other studies (cf. Hauck and Kneisel, 2008; Otto et al., 2012) based on subsurface materials different than those in the study of Fortier et al. (1994). A delay in resistivity change can be observed during thawing/freezing due to the effect of latent heat around 0 ∘C, the so-called zero-curtain effect (Farzamian et al., 2020; Mollaret et al., 2019). In general, resistivity–temperature relationships show exponential behavior below the freezing point (Hauck, 2002). Furthermore, ice-poor permafrost is more sensitive to temperature warming than ice-rich permafrost (Haberkorn et al., 2021), as more latent heat is required to thaw permafrost with high ice content than with low ice content (Harris et al., 2009).
Our study shows a stronger ice degradation of ice-poor permafrost compared to ice-rich permafrost. All ERT profiles containing ice-poor permafrost tomograms display a significant reduction in resistivity in the repeated tomograms: the resistivity change in the Corvatsch catchment shows a decrease of more than 10 kΩm to a current maximum of 30 kΩm. The Austrian Glatzbach catchment follows the same trend: the former maximum of about 80 kΩm is reduced to a present maximum of about 30 kΩm along both repeated ERT profiles within 12 years (Fig. 11). We attribute the resistivity decrease in both catchments to the possibly stronger regional warming (see Sect. 5.3.1). The subsurface characterized by ice-poor permafrost of the Gianda Grischa rock glacier follows the same trend of a strong decrease in resistivity (Figs. 7 and 8).
At the same time, the ice-rich permafrost at the Gianda Grischa rock glacier partly shows a resistivity increase. Besides the increase in resistivity along profiles GG-P2 and GG-P3 (Figs. 9 and 10), as discussed in Sect. 5.2, the resistive distribution of ice-rich permafrost remains almost identical of both the historical and the repeated profile GG-P2 (Fig. 9). With this finding along profile GG-P2 we see a similar trend as Haberkorn et al. (2021), i.e., that ice-poor permafrost is affected by a more pronounced resistivity decrease than ice-rich permafrost. However, we emphasize that further comparisons between historical and repeated profiles regarding ice-rich permafrost are needed to support a more general statement.
Additionally, the observed creep acceleration of the Gianda Grischa rock glacier also indicates a degradation of the permafrost by potentially increased water supply (Eriksen et al., 2018) following general warming (Marcer et al., 2021). However, in spite of the observed resistivity increase in the compression zone, we observe a stronger thawing of the ice-related permafrost in other areas of Gianda Grischa (compare Figs. 7 and 8).
Overall, we interpret the measured resistivity decrease over time as an indication of permafrost degradation due to a general increase in air temperature. The closer region of our Swiss study sites hosts long-term air temperature monitoring sites: during the time period 2003 to 2018, the air temperature increased by 1.1 ∘C (MAAT = 0.07 ∘C a−1) at the Murtèl rock glacier (within the same Corvatsch catchment), by 0.9 ∘C (MAAT = 0.06 ∘C a−1) at Schilthorn (Berner Oberland) and by 0.6 ∘C (MAAT = 0.04 ∘C a−1) at Stockhorn (Pennine Alps) (Hoelzle et al., 2022). Weather stations around the Austrian study site follow a similar or slightly stronger trend for the same time period of 2003 to 2018: temperature data indicate an increase of 1.2 ∘C (MAAT = 0.08 ∘C a−1) at Hoher Sonnblick (3106 m a.s.l.) and of 1.1 ∘C (MAAT = 0.07 ∘C a−1) at Rudolfshütte (2315 m a.s.l.) (ZAMG, 2021).
For warm permafrost with temperatures close to 0 ∘C, which is the case at many permafrost sites in the European Alps, the average warming of the MAGT is usually below 0.03 ∘C a−1 (Smith et al., 2022). The MAGT derived from borehole measurements at the Murtèl rock glacier, which is a comparatively cold permafrost site (PERMOS, 2021), shows an average temperature increase of slightly more than 0.03 ∘C a−1 at 10 m depth during the last 30 years (PERMOS, 2021). No MAGT data exist in the closer environment of the Austrian study area. However, we also expect an increase in MAGT as a consequence of the air temperature warming.
Our study reveals permafrost degradation by repeating historical ERT measurements on different periglacial landforms in two regions of the European Alps. The repetition of the profiles was carried out after a period of 10, 16 and 12 years on a talus-derived rock glacier, a rock glacier and a periglacial talus slope. The comparison of the historical ERT profiles with repeated surveys includes (a) a data enquiry (historical ERT data, GPS coordinates, historical photographs, profile characteristics), (b) a proper recovery of the historical profile location for an optimal match of both tomograms for a visual comparison, (c) identical data processing of the historical and the repeated ERT data, and (d) the discussion of the resistivity and topography changes in their respective geomorphological and climate-change context.
Our findings reveal an extensive degradation of ice-poor permafrost at all study sites as indicated by a significant decrease in resistivity and ice-poor permafrost degraded over the course of 10 to 16 years of observation. Surprisingly, ice-rich permafrost of the active rock glacier displayed no resistivity decrease but shows a significant resistivity increase. We suggest that a steep active and accelerating section above the profile location supplies an increasing amount of ice and debris to the shallower profile position. Additionally, the average annual creep rate of this section increased in the period 2005–2019 compared to 1978–1998, supporting the notion of permafrost degradation in reaction to rising temperatures.
Repeating ERT profiles to detect permafrost degradation is challenged by accurate recovery, by different data acquisition (measurement equipment, electrode array, spacing, profile length) and by geomorphological circumstances that need to be considered for the comparative interpretation of the resistivity data. A useful future task will be to develop an algorithm-based approach that goes beyond a visual comparison of the historical and the repeated ERT tomograms. The application of textile electrodes leads to a significant reduction in time and effort for the deployment of the electrodes and thus provides important advantages on coarse and blocky surfaces in high-mountain environments. Our tests provide convincing evidence that the contact resistance and the related data quality are at least comparable to, if not better than, those of conventional steel pikes. However, insufficient boulder coupling in the subsurface can not be compensated, irrespective of the electrode design. The repeated remote sensing approach tracking the local rock glacier kinematics supplements the ERT-based findings of permafrost degradation by observed velocity increase. However, the use of InSAR data (interferometric synthetic-aperture radar; e.g., Reinosch et al., 2020) would provide additional information about vertical changes, such as uplift and subsidence rates. Therefore, we recommend the combination of geophysical data and InSAR time series analyses for future studies of permafrost degradation to reveal volumetric changes in ice-containing permafrost. We conclude that the repetition of historical ERT campaigns combined with remote sensing is a useful approach to decipher the impact of atmospheric warming on permafrost-affected landforms in the European Alps.
The used data set is available for download at https://doi.org/10.5281/zenodo.7348526 (Buckel and Gardeweg, 2022). Additional metadata can be received by the IDGSP database (https://www.unifr.ch/geo/cryosphere/en/projects/permafrost-monitoring-and-dynamics/idgsp.html, Hauck, 2022) via ertdb@unifr.ch.
JB applied for funding, designed the study, conducted fieldwork, processed and interpreted ERT data, wrote the manuscript, and conceptualized figures. RG participated in fieldwork, collected temperature data and the information about the study areas, and contributed to the discussion. JB, JM, AH and MB developed and designed the textile electrodes and contributed to the discussion. JM carried out the quantitative comparison of different electrode designs. CHa, CHi, CK and RF provided historical ERT data and contributed to the discussion. SB and JHB processed remote sensing data and contributed to the discussion. All authors revised the manuscript carefully.
At least one of the (co-)authors is a member of the editorial board of The Cryosphere. The peer-review process was guided by an independent editor, and the authors also have no other competing interests to declare.
Publisher’s note: Copernicus Publications remains neutral with regard to jurisdictional claims in published maps and institutional affiliations.
We thank all colleagues who contributed to this study, especially Robin Zywczok, Quirin Gloor and Emanuel Berchtold for their enormous working effort. We thank Wolfgang Heinz from the Glorer Hütte mountain hut and the Corvatsch AG Station Surlej for their support with the equipment transport. This study is supported by TransTip startup financing, provided by the International Research Training Group (GRK 2309/1) “Geo-ecosystems in transition on the Tibetan Plateau (TransTiP)”, funded by Deutsche Forschungsgemeinschaft (DFG).
Work by Christian Hauck and Christin Hilbich was conducted within the GCOS Switzerland-financed project “Permafrost monitoring by reprocessing and repeating historical geophysical measurements (REP-ERT)”.
This research has been supported by the Deutsche Forschungsgemeinschaft (grant no. GRK 2309/1) and the International Permafrost Association (Action Group “Towards an International Database of Geoelectrical Surveys on Permafrost (IDGSP)”).
This open-access publication was funded by Technische Universität Braunschweig.
This paper was edited by Jürg Schweizer and reviewed by Jacopo Boaga and Lukas U. Arenson.
Arenson, L. U., Harrington, J. S., Koenig, C. E. M., and Wainstein, P. A.: Mountain Permafrost Hydrology – A Practical Review Following Studies from the Andes, Geosci., 12, 48, https://doi.org/10.3390/geosciences12020048, 2022.
Ballantyne, C. K.: Periglacial geomorphology, first edn., J. Wiley and & Sons, Wiley-Blackwell, Oxford, ISBN 978-1-405-10006-9, https://doi.org/10.1002/ppp.2108, 2018.
Barsch, D.: Rockglaciers: Indicators for the Present and Former Geoecology in High Mountain Environments, Springer Berlin Heidelberg, Berlin, Heidelberg, Softcover ISBN 978-3-642-80095-5, https://doi.org/10.1007/978-3-642-80093-1, 1996.
Barsch, D. and King, L.: Origin and geoelectrical resistivity of rockglaciers in semi-arid subtropical mountains (Andes of Mendoza, Argentinia), Z. Geomorphol., 33, 151–163, https://doi.org/10.1127/zfg/33/1989/151, 1989.
Beniston, M., Farinotti, D., Stoffel, M., Andreassen, L. M., Coppola, E., Eckert, N., Fantini, A., Giacona, F., Hauck, C., Huss, M., Huwald, H., Lehning, M., López-Moreno, J.-I., Magnusson, J., Marty, C., Morán-Tejéda, E., Morin, S., Naaim, M., Provenzale, A., Rabatel, A., Six, D., Stötter, J., Strasser, U., Terzago, S., and Vincent, C.: The European mountain cryosphere: a review of its current state, trends, and future challenges, The Cryosphere, 12, 759–794, https://doi.org/10.5194/tc-12-759-2018, 2018.
Biskaborn, B. K., Smith, S. L., Noetzli, J., Matthes, H., Vieira, G., Streletskiy, D. A., Schoeneich, P., Romanovsky, V. E., Lewkowicz, A. G., Abramov, A., Allard, M., Boike, J., Cable, W. L., Christiansen, H. H., Delaloye, R., Diekmann, B., Drozdov, D., Etzelmüller, B., Grosse, G., Guglielmin, M., Ingeman-Nielsen, T., Isaksen, K., Ishikawa, M., Johansson, M., Johannsson, H., Joo, A., Kaverin, D., Kholodov, A., Konstantinov, P., Kröger, T., Lambiel, C., Lanckman, J. P., Luo, D., Malkova, G., Meiklejohn, I., Moskalenko, N., Oliva, M., Phillips, M., Ramos, M., Sannel, A. B. K., Sergeev, D., Seybold, C., Skryabin, P., Vasiliev, A., Wu, Q., Yoshikawa, K., Zheleznyak, M., and Lantuit, H.: Permafrost is warming at a global scale, Nat. Commun., 10, 264, https://doi.org/10.1038/s41467-018-08240-4, 2019.
Blöthe, J. H., Halla, C., Schwalbe, E., Bottegal, E., Trombotto Liaudat, D., and Schrott, L.: Surface velocity fields of active rock glaciers and ice-debris complexes in the Central Andes of Argentina, Earth Surf. Proc. Land., 46, 504–522, https://doi.org/10.1002/esp.5042, 2020.
Buckel, J. and Gardeweg, R.: Identifying mountain permafrost degradation by repeating historical ERT-measurements – supplement (V1.1), Zenodo [data set], https://doi.org/10.5281/zenodo.7348526, 2022.
Buckel, J., Reinosch, E., Hördt, A., Zhang, F., Riedel, B., Gerke, M., Schwalb, A., and Mäusbacher, R.: Insights into a remote cryosphere: a multi-method approach to assess permafrost occurrence at the Qugaqie basin, western Nyainqêntanglha Range, Tibetan Plateau, The Cryosphere, 15, 149–168, https://doi.org/10.5194/tc-15-149-2021, 2021.
Buckel, J., Reinosch, E., Voigtländer, A., Dietze, M., Bücker, M., Krebs, N., Schroeckh, R., Mäusbacher, R., and Hördt, A.: Rock glacier characteristics under semiarid climate conditions in the Western Nyainqêntanglha range, Tibetan Plateau, J. Geophys. Res.-Earth, 127, e2021JF006256, https://doi.org/10.1029/2021jf006256, 2022.
Cardarelli, E. and De Donno, G.: Chapter 2 – Advances in electric resistivity tomography: Theory and case studies, in: Innovation in Near-Surface Geophysics, edited by: R. Persico, S. Piro, and N. Linford, Elsevier, 23–57, ISBN 9780128124291, https://doi.org/10.1016/B978-0-12-812429-1.00002-7, 2019.
Chiarle, M., Geertsema, M., Mortara, G., and Clague, J. J.: Relations between climate change and mass movement: Perspectives from the Canadian Cordillera and the European Alps, Glob. Planet. Change, 202, 103499, https://doi.org/10.1016/j.gloplacha.2021.103499, 2021.
Deline, P., Gruber, S., Delaloye, R., Fischer, L., Geertsema, M., Giardino, M., Hasler, A., Kirkbride, M., Krautblatter, M., Magnin, F., McColl, S., Ravanel, L., and Schoeneich, P.: Ice Loss and Slope Stability in High-Mountain Regions, in: Snow and Ice-Related Hazards, Risks and Disasters, edited by: Shroder, J. F., Haeberli, W., and Whiteman, C., Academic Press, Boston, 521–561, ISBN 9780123948496, https://doi.org/10.1016/B978-0-12-394849-6.00015-9, 2015.
Duvillard, P.-A., Ravanel, L., Marcer, M., and Schoeneich, P.: Recent evolution of damage to infrastructure on permafrost in the French Alps, Reg. Environ. Chang., 19, 1281–1293, https://doi.org/10.1007/s10113-019-01465-z, 2019.
Emmert, A. and Kneisel, C.: Internal structure of two alpine rock glaciers investigated by quasi-3-D electrical resistivity imaging, The Cryosphere, 11, 841–855, https://doi.org/10.5194/tc-11-841-2017, 2017.
Eriksen, H., Rouyet, L., Lauknes, T. R., Berthling, I., Isaksen, K., Hindberg, H., Larsen, Y., and Corner, G. D.: Recent Acceleration of a Rock Glacier Complex, Ádjet, Norway, Documented by 62 Years of Remote Sensing Observations, Geophys. Res. Lett., 45, 8314–8323, https://doi.org/10.1029/2018GL077605, 2018.
Etzelmüller, B., Guglielmin, M., Hauck, C., Hilbich, C., Hoelzle, M., Isaksen, K., Noetzli, J., Oliva, M., and Ramos, M.: Twenty years of European mountain permafrost dynamics-the PACE legacy, Environ. Res. Lett., 15, 104070, https://doi.org/10.1088/1748-9326/abae9d, 2020.
Farzamian, M., Vieira, G., Monteiro Santos, F. A., Yaghoobi Tabar, B., Hauck, C., Paz, M. C., Bernardo, I., Ramos, M., and de Pablo, M. A.: Detailed detection of active layer freeze–thaw dynamics using quasi-continuous electrical resistivity tomography (Deception Island, Antarctica), The Cryosphere, 14, 1105–1120, https://doi.org/10.5194/tc-14-1105-2020, 2020.
Fisch Sr., W., Fisch Jr., W., and Haeberli, W.: Electrical DC resistivity soundings with long profiles on rock glaciers and moraines in the alps of Switzerland, Zeitschrift für Gletscherkd. und Glaziolgeologie, 13, 239–260, 1977.
Fortier, R., Allard, M., and Seguin, M. K.: Effect of physical properties of frozen ground on electrical resistivity logging, Cold Reg. Sci. Technol., 22, 361–384, https://doi.org/10.1016/0165-232X(94)90021-3, 1994.
Frauenfelder, R.: Regional-scale modelling of the occurrence and dynamics of rockglaciers and the distribution of paleopermafrost, Schriftenreihe Physische Geographie, Glaziologie und Geomorphodynamik, 45, University of Zurich, 2005.
Frauenfelder, R., Laustela, M., and Kääb, A.: Relative age dating of Alpine rockglacier surfaces, Z. Geomorphol., 49, 145–166, 2005.
Frauenfelder, R., Hauck, C., Hilbich, C., Kneisel, C., and Hoelzle, M.: An integrative observation of kinematics and geophysical parameters of Gianda Grischa rockglacier, Upper Engadine, Swiss Alps, in: Proceedings of the 9th International Conference on Permafrost, Fairbanks, Alaska, vol. 8, edited by: Kane, D. L. and Hinkel, K. M., Institute of Northern Engineering, University of Alaska Fairbanks, Fairbanks, Alaska, 463–468, https://www.permafrost.org/event/icop9/ (last access: 6 July 2023), 2008.
Frauenfelder, R., Isaksen, K., Lato, M. J., and Noetzli, J.: Ground thermal and geomechanical conditions in a permafrost-affected high-latitude rock avalanche site (Polvartinden, northern Norway), The Cryosphere, 12, 1531–1550, https://doi.org/10.5194/tc-12-1531-2018, 2018.
Fukui, K.: Permafrost and Surface Movement of the Protalus Rampart in the Kuranosuke Cirque, Tateyama Mountains, Japan, Journal of Geography (Chigaku Zasshi), 111, 564–573, https://doi.org/10.5026/jgeography.111.4_564, 2002.
Haberkorn, A., Kenner, R., Noetzli, J., and Phillips, M.: Changes in Ground Temperature and Dynamics in Mountain Permafrost in the Swiss Alps, Front. Earth Sci., 9, https://doi.org/10.3389/feart.2021.626686, 2021.
Haeberli, W., Hoelzle, M., Keller, F., Schmid, W., Muhll, S. V., and Wagner, S.: Monitoring the long-term evolution of mountain permafrost in the Swiss Alps, Proc. 6th Int. Conf. Permafrost, Beijing, China, 214–219, 1993.
Haeberli, W., Hallet, B., Arenson, L., Elconin, R., Humlum, O., Kääb, A., Kaufmann, V., Ladanyi, B., Matsuoka, N., Springman, S., and Mühll, D. V.: Permafrost creep and rock glacier dynamics, Permafr. Periglac. Process., 17, 189–214, https://doi.org/10.1002/ppp.561, 2006.
Haeberli, W., Schaub, Y., and Huggel, C.: Increasing risks related to landslides from degrading permafrost into new lakes in de-glaciating mountain ranges, Geomorphology, 293, 405–417, https://doi.org/10.1016/j.geomorph.2016.02.009, 2017.
Halla, C., Blöthe, J. H., Tapia Baldis, C., Trombotto Liaudat, D., Hilbich, C., Hauck, C., and Schrott, L.: Ice content and interannual water storage changes of an active rock glacier in the dry Andes of Argentina, The Cryosphere, 15, 1187–1213, https://doi.org/10.5194/tc-15-1187-2021, 2021.
Harris, C., Arenson, L. U., Christiansen, H. H., Etzelmüller, B., Frauenfelder, R., Gruber, S., Haeberli, W., Hauck, C., Hölzle, M., Humlum, O., Isaksen, K., Kääb, A., Kern-Lütschg, M. A., Lehning, M., Matsuoka, N., Murton, J. B., Nötzli, J., Phillips, M., Ross, N., Seppälä, M., Springman, S. M., and Vonder Mühll, D.: Permafrost and climate in Europe: Monitoring and modelling thermal, geomorphological and geotechnical responses, Earth-Sci. Rev., 92, 117–171, https://doi.org/10.1016/j.earscirev.2008.12.002, 2009.
Hartl, L., Zieher, T., Bremer, M., Stocker-Waldhuber, M., Zahs, V., Höfle, B., Klug, C., and Cicoira, A.: Multi-sensor monitoring and data integration reveal cyclical destabilization of the Äußeres Hochebenkar rock glacier, Earth Surf. Dynam., 11, 117–147, https://doi.org/10.5194/esurf-11-117-2023, 2023.
Hauck, C.: Frozen ground monitoring using DC resistivity tomography, Geophys. Res. Lett., 29, 12-1–12-4, https://doi.org/10.1029/2002GL014995, 2002.
Hauck, C.: IPA Action Group: Towards an International Database of Geoelectrical Surveys on Permafrost (IDGSP), University of Fribourg [data set], https://www.unifr.ch/geo/cryosphere/en/projects/permafrost-monitoring-and-dynamics/idgsp.html, last access: 15 June 2022.
Hauck, C. and Kneisel, C.: Applied Geophysics in Periglacial Environments, Cambridge University Press, Cambridge, https://doi.org/10.1017/CBO9780511535628, 2008.
Hauck, C. and Vonder Mühll, D.: Evaluation of geophysical techniques for application in mountain permafrost studies, Zeitschrift für Geomorphologie, Supplementband, 132, 161–190, 2003.
Hauck, C., Vonder Mühll, D. and Maurer, H.: Using DC resistivity tomography to detect and characterize mountain permafrost, Geophys. Prospect., 51, 273–284, https://doi.org/10.1046/j.1365-2478.2003.00375.x, 2003.
Hauck, C., Hilbich, C., Coline, M., and Pellet, C.: Permafrost monitoring by reprocessing and repeating historical geoelectrical measurements, in EGU General Assembly 2020, online, 4–8 May 2020, EGU2020-14047, https://presentations.copernicus.org/EGU2020/EGU2020-14047_presentation.pdf (last access: 6 July 2023), 2020.
Herring, T. and Lewkowicz, A. G.: A systematic evaluation of electrical resistivity tomography for permafrost interface detection using forward modeling, Permafr. Periglac. Process., 33, 134–146, https://doi.org/10.1002/ppp.2141, 2022.
Hilbich, C., Hauck, C., Hoelzle, M., Scherler, M., Schudel, L., Völksch, I., Vonder Mühll, D., and Mäusbacher, R.: Monitoring mountain permafrost evolution using electrical resistivity tomography: A 7-year study of seasonal, annual, and long-term variations at Schilthorn, Swiss Alps, J. Geophys. Res.-Earth, 113, F01S90, https://doi.org/10.1029/2007JF000799, 2008.
Hilbich, C., Marescot, L., Hauck, C., Loke, M. H., and Mausbacher, R.: Applicability of electrical resistivity tomography monitoring to coarse blocky and ice-rich permafrost landforms, Permafr. Periglac. Process., 20, 269–284, https://doi.org/10.1002/ppp.652, 2009.
Hilbich, C., Fuss, C., and Hauck, C.: Automated time-lapse ERT for improved process analysis and monitoring of frozen ground, Permafr. Periglac. Process., 22, 306–319, https://doi.org/10.1002/ppp.732, 2011.
Hilbich, C., Hauck, C., Mollaret, C., Wainstein, P., and Arenson, L. U.: Towards accurate quantification of ice content in permafrost of the Central Andes – Part 1: Geophysics-based estimates from three different regions, The Cryosphere, 16, 1845–1872, https://doi.org/10.5194/tc-16-1845-2022, 2022.
Hock, R., Rasul, G., Adler, C., Cáceres, B., Gruber, S., Hirabayashi, Y., Jackson, M., Kääb, A., Kang, S., Kutuzov, S., Milner, A., Molau, U., Morin, S., Orlove, B., and Steltzer, H.: High Mountain Areas, in IPCC Special Report on the Ocean and Cryosphere in a Changing Climate, edited by: Pörtner, H.-O., Roberts, D. C., Tignor, M., Poloczanska, E. S., Mintenbeck, K., Alegría, A., Craig, M., Langsdorf, S., Löschke, S., Möller, V., Okem, A., and Rama, B., The Intergovernmental Panel on Climate Change (IPCC), 94 pp., https://doi.org/10.1017/9781009157964.004, 2019.
Hoelzle, M., Hauck, C., Mathys, T., Noetzli, J., Pellet, C., and Scherler, M.: Long-term energy balance measurements at three different mountain permafrost sites in the Swiss Alps, Earth Syst. Sci. Data, 14, 1531–1547, https://doi.org/10.5194/essd-14-1531-2022, 2022.
Hördt, A., Weidelt, P., and Przyklenk, A.: Contact impedance of grounded and capacitive electrodes, Geophys. J. Int., 193, 187–196, https://doi.org/10.1093/gji/ggs091, 2013.
Jones, D. B., Harrison, S., Anderson, K., and Betts, R. A.: Mountain rock glaciers contain globally significant water stores, Sci. Rep., 8, 2834, https://doi.org/10.1038/s41598-018-21244-w, 2018.
Kellerer-Pirklbauer, A. and Kaufmann, V.: Deglaciation and its impact on permafrost and rock glacier evolution: New insight from two adjacent cirques in Austria, Sci. Total Environ., 621, 1397–1414, https://doi.org/10.1016/j.scitotenv.2017.10.087, 2018.
Kenner, R., Phillips, M., Hauck, C., Hilbich, C., Mulsow, C., Bühler, Y., Stoffel, A., and Buchroithner, M.: New insights on permafrost genesis and conservation in talus slopes based on observations at Flüelapass, Eastern Switzerland, Geomorphology, 290, 101–113, https://doi.org/10.1016/j.geomorph.2017.04.011, 2017.
Kenner, R., Noetzli, J., Hoelzle, M., Raetzo, H., and Phillips, M.: Distinguishing ice-rich and ice-poor permafrost to map ground temperatures and ground ice occurrence in the Swiss Alps, The Cryosphere, 13, 1925–1941, https://doi.org/10.5194/tc-13-1925-2019, 2019.
Keuschnig, M., Krautblatter, M., Hartmeyer, I., Fuss, C., and Schrott, L.: Automated Electrical Resistivity Tomography Testing for Early Warning in Unstable Permafrost Rock Walls Around Alpine Infrastructure, Permafrost Periglac. Process., 171, 158–171, https://doi.org/10.1002/ppp.1916, 2017.
King, L., Fisch Sr., W., Haeberli, W., and Wächter, H. P.: Comparison of resistivity and radio-echo soundings on rock glacier permafrost, Zeitschrift für Gletscherkd. und Glaziolgeologie, 23, 77–97, 1987.
Kneisel, C. and Hauck, C.: Electrical methods, in: Applied Geophysics in Periglacial Environments, https://doi.org/10.1017/CBO9780511535628.002, 2008.
Kneisel, C., Hauck, C., and Mühll, D. V.: Permafrost below the Timberline confirmed and characterized by geoelectrical resistivity measurements, Bever Valley, eastern Swiss Alps, Permafr. Periglac. Process., 11, 295–304, https://doi.org/10.1002/1099-1530(200012)11:4<295::AID-PPP353>3.0.CO;2-L, 2000.
Kneisel, C., Hauck, C., Fortier, R., and Moorman, B.: Advances in geophysical methods for permafrost investigations, Permafr. Periglac. Process., 19, 157–178, https://doi.org/10.1002/ppp.616, 2008.
Kneisel, C., Rödder, T., and Schwindt, D.: Frozen ground dynamics resolved by multi-year and year-round electrical resistivity monitoring at three alpine sites in the Swiss Alps, Near Surf. Geophys., 12, 117–132, 2014.
Krautblatter, M. and Hauck, C.: Electrical resistivity tomography monitoring of permafrost in solid rock walls, J. Geophys. Res.-Earth, 112, F02S20, https://doi.org/10.1029/2006JF000546, 2007.
Krautblatter, M., Verleysdonk, S., Flores-Orozco, A. A., and Kemna, A.: Temperature-calibrated imaging of seasonal changes in permafrost rock walls by quantitative electrical resistivity tomography (Zugspitze, German/Austrian Alps), J. Geophys. Res.-Earth, 115, F02003, https://doi.org/10.1029/2008JF001209, 2010.
Kuras, O., Beamish, D., Meldrum, P. I., and Ogilvy, R. D.: Fundamentals of the capacitive resistivity technique, Geophysics, 71, G135–G152, https://doi.org/10.1190/1.2194892, 2006.
Lambiel, C. and Pieracci, K.: Permafrost distribution in talus slopes located within the alpine periglacial belt, Swiss Alps, Permafr. Periglac. Process., 19, 293–304, 2008.
Loke, M. H. and Barker, R. D.: Least-squares deconvolution of apparent resistivity pseudosections, Geophysics, 60, 1682–1690, https://doi.org/10.1190/1.1443900, 1995.
Magnin, F., Krautblatter, M., Deline, P., Ravanel, L., Malet, E., and Bevington, A.: Determination of warm, sensitive permafrost areas in near-vertical rockwalls and evaluation of distributed models by electrical resistivity tomography, J. Geophys. Res.-Earth, 120, 745–762, https://doi.org/10.1002/2014JF003351, 2015.
Magnin, F., Josnin, J.-Y., Ravanel, L., Pergaud, J., Pohl, B., and Deline, P.: Modelling rock wall permafrost degradation in the Mont Blanc massif from the LIA to the end of the 21st century, The Cryosphere, 11, 1813–1834, https://doi.org/10.5194/tc-11-1813-2017, 2017.
Marcer, M., Cicoira, A., Cusicanqui, D., Bodin, X., Echelard, T., Obregon, R., and Schoeneich, P.: Rock glaciers throughout the French Alps accelerated and destabilised since 1990 as air temperatures increased, Commun. Earth Environ., 2, 81, https://doi.org/10.1038/s43247-021-00150-6, 2021.
Maurer, H. and Hauck, C.: Instruments and methods: Geophysical imaging of alpine rock glaciers, J. Glaciol., 53, 110–120, https://doi.org/10.3189/172756507781833893, 2007.
Mewes, B., Hilbich, C., Delaloye, R., and Hauck, C.: Resolution capacity of geophysical monitoring regarding permafrost degradation induced by hydrological processes, The Cryosphere, 11, 2957–2974, https://doi.org/10.5194/tc-11-2957-2017, 2017.
Mollaret, C., Hilbich, C., Pellet, C., Flores-Orozco, A., Delaloye, R., and Hauck, C.: Mountain permafrost degradation documented through a network of permanent electrical resistivity tomography sites, The Cryosphere, 13, 2557–2578, https://doi.org/10.5194/tc-13-2557-2019, 2019.
Mourey, J., Lacroix, P., Duvillard, P.-A., Marsy, G., Marcer, M., Malet, E., and Ravanel, L.: Multi-method monitoring of rockfall activity along the classic route up Mont Blanc (4809 m a.s.l.) to encourage adaptation by mountaineers, Nat. Hazards Earth Syst. Sci., 22, 445–460, https://doi.org/10.5194/nhess-22-445-2022, 2022.
Mudler, J., Hördt, A., Przyklenk, A., Fiandaca, G., Maurya, P. K., and Hauck, C.: Two-dimensional inversion of wideband spectral data from the capacitively coupled resistivity method – first applications in periglacial environments, The Cryosphere, 13, 2439–2456, https://doi.org/10.5194/tc-13-2439-2019, 2019.
Oldenborger, G. A. and LeBlanc, A. M.: Monitoring changes in unfrozen water content with electrical resistivity surveys in cold continuous permafrost, Geophys. J. Int., 215, 965–977, https://doi.org/10.1093/GJI/GGY321, 2018.
Otto, J. C. and Smith, M. J.: Geomorphological mapping, in: Geomorphological Techniques, edited by: Clarke, L., British Society for Geomorphology, https://www.researchgate.net/publication/257263871_Geomorphological_Mapping (last access: 6 July 2023), 2013.
Otto, J. C., Keuschnig, M., Götz, J., Marbach, M., and Schrott, L.: Detection of mountain permafrost by combining high resolution surface and subsurface information – an example from the glatzbach catchment, austrian alps, Geogr. Ann. Ser. A Phys. Geogr., 94, 43–57, https://doi.org/10.1111/j.1468-0459.2012.00455.x, 2012.
Palacky, G. J.: 3. Resistivity Characteristics of Geologic Targets, in Electromagnetic Methods in Applied Geophysics: Volume 1, Theory, Society of Exploration Geophysicists, 52–129, https://doi.org/10.1190/1.9781560802631.ch3, 1988.
Patton, A. I., Rathburn, S. L., and Capps, D. M.: Landslide response to climate change in permafrost regions, Geomorphology, 340, 116–128, https://doi.org/10.1016/j.geomorph.2019.04.029, 2019.
Pavoni, M., Carrera, A., and Boaga, J.: Improving the galvanic contact resistance for geoelectrical measurements in debris areas: A case study, Near Surf. Geophys., 20, 178–191, https://doi.org/10.1002/nsg.12192, 2022.
PERMOS: Swiss Permafrost Bulletin 2019/2020, edited by: Noetzli, J. and Pellet, C., Swiss Permafrost Monitoring Network (PERMOS), https://www.permos.ch/fileadmin/Files/publications/swiss_permafrost_bulletin/PERMOS_bulletin_2020.pdf (last access: 6 July 2023), 2021.
Pogliotti, P., Guglielmin, M., Cremonese, E., Morra di Cella, U., Filippa, G., Pellet, C., and Hauck, C.: Warming permafrost and active layer variability at Cime Bianche, Western European Alps, The Cryosphere, 9, 647–661, https://doi.org/10.5194/tc-9-647-2015, 2015.
Reinosch, E., Buckel, J., Dong, J., Gerke, M., Baade, J., and Riedel, B.: InSAR time series analysis of seasonal surface displacement dynamics on the Tibetan Plateau, The Cryosphere, 14, 1633–1650, https://doi.org/10.5194/tc-14-1633-2020, 2020.
Rosset, E., Hilbich, C., Schneider, S., and Hauck, C.: Automatic filtering of ERT monitoring data in mountain permafrost, Near Surf. Geophys., 11, 423–434, https://doi.org/10.3997/1873-0604.2013003, 2013.
Rücker, C. and Günther, T.: The simulation of finite ERT electrodes using the complete electrode model, Geophysics, 76, F227–F238, https://doi.org/10.1190/1.3581356, 2011.
Sass, O. and Viles, H. A.: How wet are these walls? Testing a novel technique for measuring moisture in ruined walls, J. Cult. Herit., 7, 257–263, https://doi.org/10.1016/j.culher.2006.08.001, 2006.
Scapozza, C.: Investigation on protalus ramparts in the Swiss Alps, Geogr. Helv., 70, 135–139, https://doi.org/10.5194/gh-70-135-2015, 2015.
Scapozza, C., Lambiel, C., Baron, L., Marescot, L., and Reynard, E.: Internal structure and permafrost distribution in two alpine periglacial talus slopes, Valais, Swiss Alps, Geomorphology, 132, 208–221, https://doi.org/10.1016/j.geomorph.2011.05.010, 2011.
Scherler, M., Hauck, C., Hoelzle, M., and Salzmann, N.: Modeled sensitivity of two alpine permafrost sites to RCM-based climate scenarios, J. Geophys. Res.-Earth, 118, 780–794, https://doi.org/10.1002/jgrf.20069, 2013.
Schneider, S., Hoelzle, M., and Hauck, C.: Influence of surface and subsurface heterogeneity on observed borehole temperatures at a mountain permafrost site in the Upper Engadine, Swiss Alps, The Cryosphere, 6, 517–531, https://doi.org/10.5194/tc-6-517-2012, 2012.
Schneider, S., Daengeli, S., Hauck, C., and Hoelzle, M.: A spatial and temporal analysis of different periglacial materials by using geoelectrical, seismic and borehole temperature data at Murtèl–Corvatsch, Upper Engadin, Swiss Alps, Geogr. Helv., 68, 265–280, https://doi.org/10.5194/gh-68-265-2013, 2013.
Schrott, L. and Sass, O.: Application of field geophysics in geomorphology: advances and limitations exemplified by case studies, Geomorphology, 93, 55–73, https://doi.org/10.1016/j.geomorph.2006.12.024, 2008.
Smith, S. L., O'Neill, H. B., Isaksen, K., Noetzli, J., and Romanovsky, V. E.: The changing thermal state of permafrost, Nat. Rev. Earth Environ., 3, 10–23, https://doi.org/10.1038/s43017-021-00240-1, 2022.
Spicher, A.: Tektonische Karte der Schweiz 1:500 000, Carte tectonique de la Suisse 1:500 000, 2nd edn., Schweizerische Geologische Kommission, 1980.
Stingl, H., Garleff, K., Höfner, T., Huwe, B., Jaesche, P., John, B., and Veit, H.: Grundfragen des alpinen Periglazials – Ergebnisse, Probleme und Perspektiven periglazialmorphologischer Untersuchungen im Langzeitprojekt “Glorer Hütte” in der Südlichen Glockner-/Nördlichen Schobergruppe (Südliche Hohe Tauern, Osttirol), Salzburg, Geogr. Arb., 15–42, ISBN 978-3-85283-030-3, 2010.
Supper, R., Ottowitz, D., Jochum, B., Römer, A., Pfeiler, S., Kauer, S., Keuschnig, M., and Ita, A.: Geoelectrical monitoring of frozen ground and permafrost in alpine areas: Field studies and considerations towards an improved measuring technology, Near Surf. Geophys., 12, 93–115, https://doi.org/10.3997/1873-0604.2013057, 2014.
Tang, L., Wang, X., Lan, F., Qiu, P., and Jin, L.: Measuring the content of unfrozen water in frozen soil based on resistivity, Int. J. Electrochem. Sci., 15, 9459–9472, https://doi.org/10.20964/2020.09.57, 2020.
Tomaškovičová, S., Ingeman-Nielsen, T., Christiansen, A. V., Brandt, I., Dahlin, T., and Elberling, B.: Effect of electrode shape on grounding resistances – Part 2: Experimental results and cryospheric monitoring, Geophysics, 81, WA159–WA172, https://doi.org/10.1190/GEO2015-0148.1, 2016.
Uhlemann, S. and Kuras, O.: Numerical Simulations of Capacitive Resistivity Imaging (CRI) Measurements, Near Surf. Geophys., 12, 523–537, https://doi.org/10.3997/1873-0604.2014008, 2014.
Uhlemann, S., Dafflon, B., Peterson, J., Ulrich, C., Shirley, I., Michail, S., and Hubbard, S. S.: Geophysical Monitoring Shows that Spatial Heterogeneity in Thermohydrological Dynamics Reshapes a Transitional Permafrost System, Geophys. Res. Lett., 48, e2020GL091149, https://doi.org/10.1029/2020GL091149, 2021.
Villarroel, C. D., Ortiz, D. A., Forte, A. P., Tamburini Beliveau, G., Ponce, D., Imhof, A., and López, A.: Internal structure of a large, complex rock glacier and its significance in hydrological and dynamic behavior: A case study in the semi-arid Andes of Argentina, Permafr. Periglac. Process., 33, 78–95, https://doi.org/10.1002/ppp.2132, 2021.
Vonder Mühll, D. and Haeberli, W.: Thermal characteristics of the permafrost within an active rock glacier (Murtèl/Corvatsch, Grisons, Swiss Alps), J. Glaciol., 36, 151–158, https://doi.org/10.3189/S0022143000009382, 1990.
Vonder Mühll, D., Hauck, C., and Gubler, H.: Mapping of mountain permafrost using geophysical methods, Prog. Phys. Geogr., 26, 643–660, https://doi.org/10.1191/0309133302pp356ra, 2002.
Vonder Mühll, D., Nötzli, J., and Roer, I.: PERMOS – A comprehensive monitoring network of mountain permafrost in the Swiss Alps, Proc. 9th Int. Conf. Permafr., 1869–1874, https://www.permafrost.org/event/icop9/ (last access: 6 July 2023), 2008.
ZAMG: Jahrbuch der Zamg, Vienna, Austria, https://www.zamg.ac.at/cms/de/klima/klimauebersichten/jahrbuch (last access: 24 March 2023), 2021.