the Creative Commons Attribution 4.0 License.
the Creative Commons Attribution 4.0 License.
 | 13 Jul 2023
Post-Little Ice Age rock wall permafrost evolution in Norway
Justyna Czekirda
Bernd Etzelmüller
Sebastian Westermann
Ketil Isaksen
Florence Magnin
The ground thermal regime and permafrost development have an important influence on geomorphological processes in periglacial regions and ultimately landscape development. About 10 % of unstable rock slopes in Norway are potentially underlain by widespread permafrost. Permafrost thaw and degradation may play a role in slope destabilisation, and more knowledge about rock wall permafrost in Norway is needed to investigate possible links between the ground thermal regime, geomorphological activity and natural hazards. We assess spatio-temporal permafrost variations in selected rock walls in Norway over the last 120 years. Ground temperature is modelled using the two-dimensional ground heat flux model CryoGrid 2D along nine profiles crossing instrumented rock walls in Norway. The simulation results show the distribution of permafrost is sporadic to continuous along the modelled profiles. Results suggest that ground temperature at 20 m depth in steep rock faces increased by 0.2 ∘C per decade on average since the 1980s, and rates of change increase with elevation within a single rock wall section. Heat flow direction is primarily vertical within mountains in Norway. Nevertheless, narrow ridges may still be sensitive to even small differences in ground surface temperature and may have horizontal heat fluxes. This study further demonstrates how rock wall temperature increase rates and rock wall permafrost distribution are influenced by factors such as surface air temperature uncertainties; surface offsets arising from the incoming shortwave solar radiation; snow conditions on, above and below rock walls; and rock wall geometry and size together with adjacent blockfield-covered plateaus or glaciers.
- Article
(6990 KB) - Full-text XML
-
Supplement
(3994 KB) - BibTeX
- EndNote


Permafrost thaw has decreased the stability of the world's cold mountain slopes (Hock et al. 2019). Numerous studies infer that thawing permafrost induced rapid mass movement events around the world, e.g. in the European Alps, the New Zealand Southern Alps, Alaska and the Caucasus (Dramis et al., 1995; Haeberli et al., 2004; Fischer et al., 2006; Allen et al., 2009; Huggel et al., 2010; Ravanel et al., 2010). Inventories from the European Alps document an enhanced frequency of rockfalls from permafrost rock walls since the 1990s, especially at the lower permafrost limit, in response to accelerated global warming (Ravanel and Deline, 2011; Fischer et al., 2012). An example of a fast response was the exceptional rockfall activity reported during the extremely hot summers of 2003 and 2015 in the European Alps, likely due to permafrost degradation (Gruber et al., 2004; Ravanel et al., 2017). Deep permafrost requires longer timescales to degrade, and its warming or degradation may have influenced the activation of slowly creeping rock masses in the warmer period of the Holocene thermal maximum, thousands of years after local deglaciation (Lebrouc et al., 2013; Böhme et al., 2019; Hilger et al., 2021). The stability of rock faces underlain by permafrost with the consequent hazards, such as rockfalls and rock avalanches, is of growing concern considering global surface warming projections. Rock wall permafrost is highly susceptible to atmospheric warming because (1) small latent heat effects and high thermal conductivity cause more rapid ground temperature (GT) increase (Gruber and Haeberli, 2007), (2) the three-dimensional nature of heat flow leads to faster degradation of deeper permafrost in some locations than would be the case in flatter terrain (Noetzli et al., 2007) and (3) thermal conditions in steep bedrock and the atmosphere are strongly coupled since steep slopes typically have shallow snow or surface material, if any (e.g. Boeckli et al., 2012; Myhra et al., 2017).
Permafrost degradation is suggested to have had an impact on the dynamics of recent rock slope instabilities at a few sites in Norway, e.g. the unstable rock slope Gámanjunni 3 in northern Norway that accelerated recently (Böhme et al., 2019; Etzelmüller et al., 2022), the Polvartinden rock avalanche in northern Norway that occurred in 2008 (Frauenfelder et al., 2018) or possibly the north-facing Veslemannen in southern Norway that fell in 2019, where at least seasonal freezing controlled the rock stability (Kristensen et al., 2021). Moreover, Blikra et al. (2006) proposed permafrost thawing as a possible triggering mechanism for rock slope failures that have occurred since the deglaciation of Norway. Hilger et al. (2021) modelled permafrost distribution in the Holocene and suggested that permafrost likely had a stabilising effect on some rock slopes in Norway for several millennia after deglaciation. Magnin et al. (2019) estimated that 11 % of potentially unstable slopes in Norway are currently underlain by at least discontinuous permafrost.
Numerous studies concerning permafrost in the flatter parts of the Scandinavian Mountains have been published since the 1980s, attributing variations in mountain permafrost occurrence to mean annual air temperature (Etzelmüller et al., 1998), elevation (Sollid et al., 2003; Heggem et al., 2005), snow cover (Farbrot et al., 2008, 2011; Isaksen et al., 2011; Gisnås et al., 2017), blockfield cover or surface materials (Farbrot et al., 2011; Gisnås et al., 2017), and vegetation cover (Farbrot et al., 2013; Gisnås et al., 2017). Studies indicate that recent atmospheric warming has led to the degradation of mountain permafrost in flatter terrain in Norway, especially since the 1990s (Isaksen et al., 2007; Hipp et al., 2012; Westermann et al., 2013; Etzelmüller et al., 2020).
The earliest rock wall permafrost studies in Norway provided (1) the first rock wall temperature measurements from rock faces in the Jotunheimen Mountains, central southern Norway (Hipp et al., 2014), and from small rock cliffs in Troms, northern Norway (Frauenfelder et al., 2018); (2) a first-order rock wall permafrost map for mainland Norway based on a statistical permafrost model relating permafrost distribution to both elevation and potential incoming shortwave radiation (Steiger et al., 2016); and (3) the first 2D modelling for three north-facing rock walls in Norway based on the interpolated air temperature, variable snow cover and presence of glaciers (Myhra et al., 2017). Systematic field observations were taken at selected sites in the Jotunheimen Mountains (Hipp et al., 2014). From 2015 through 2017, other sites across southern and northern Norway were also logged (Magnin et al., 2019), allowing for the improvement of earlier approaches by Hipp et al. (2014) and Steiger et al. (2016). The acquired data helped to calibrate a near-surface thermal regime model for rock wall permafrost in Norway by using mean annual air temperature (MAAT) and potential incoming solar radiation as explanatory variables instead of elevation.
The aim of this study is to improve knowledge about the spatio-temporal variations in ground temperature in steep rock walls in Norway on the inter-decadal scale. We employ the 2D slope-scale transient heat flow model CryoGrid 2D (Myhra et al., 2017) to simulate the thermal evolution of mountain permafrost since 1900 along nine transects crossing the instrumented rock walls in mainland Norway. We advance the methods presented in the study by Myhra et al. (2017) by utilising an observation-constrained model for ground surface temperature (GST), i.e. including the field observations from rock walls in various expositions. All sites considered in this study have at least one rock wall logger in a vertical rock face for temperature monitoring, and displacement at three unstable sites is monitored by the Norwegian Water Resources and Energy Directorate (NVE). Thus, this study aims to establish an important baseline for the development of the ground thermal regime in potentially unstable mountain terrain.
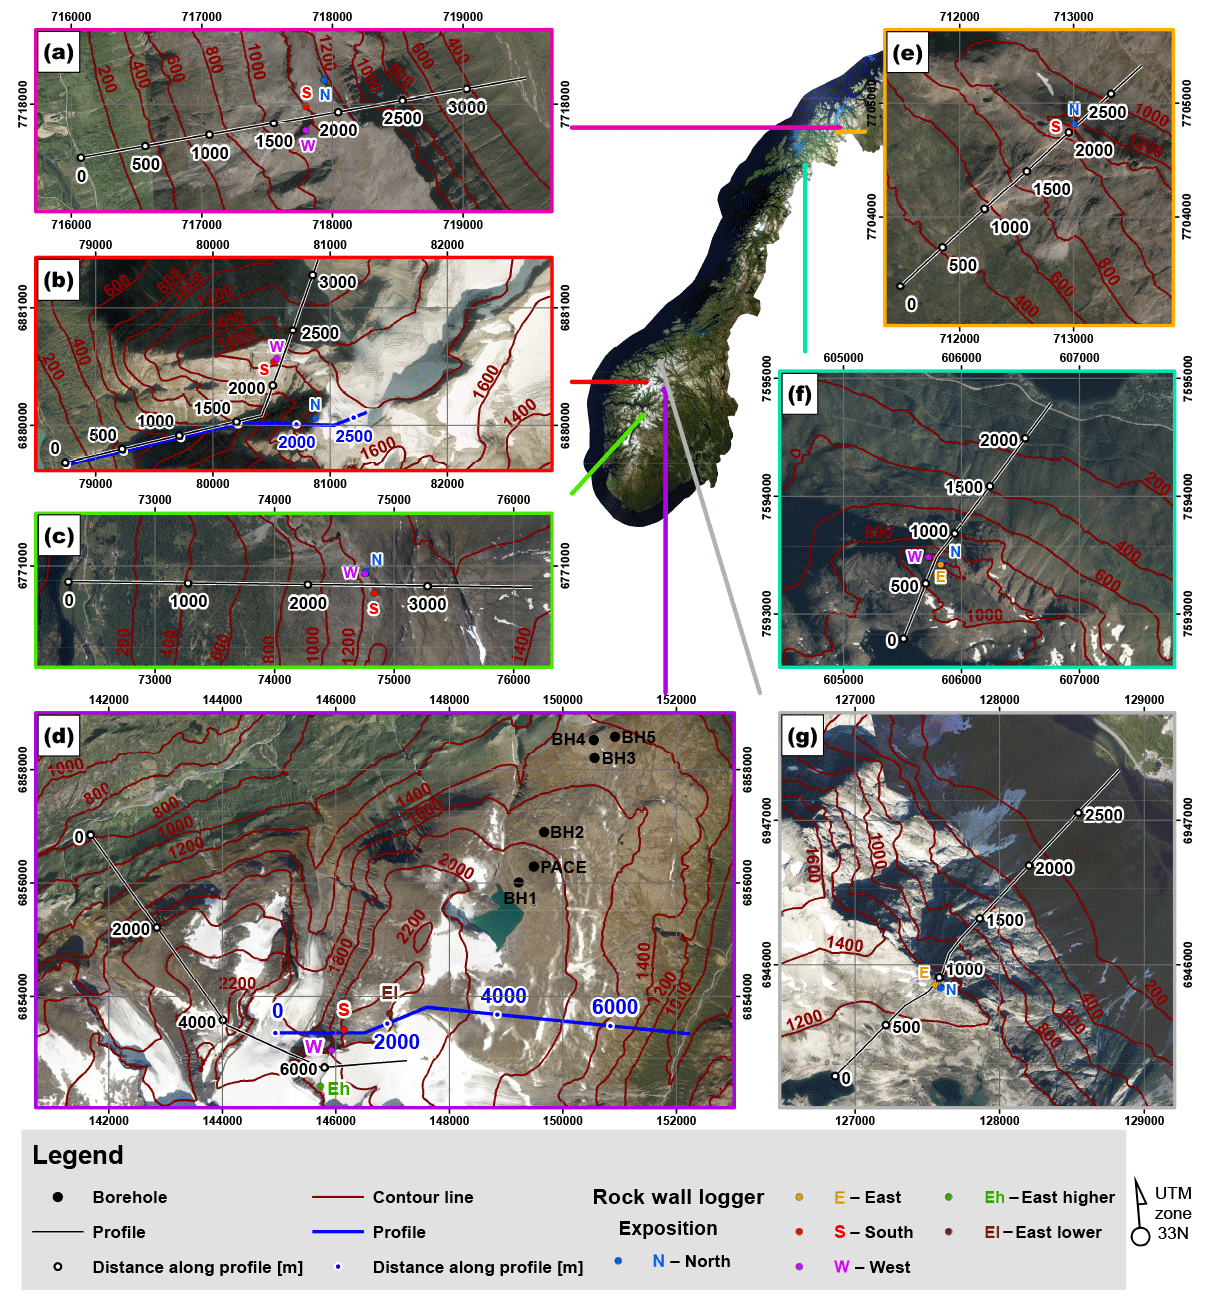
Figure 1Transects for the two-dimensional modelling: (a) Gámanjunni 3, Kåfjord; (b) Hogrenningsnibba (the northernmost profile or the black line) and Kvernhusfjellet (the southernmost profile or the blue line), Stryn; (c) Ramnanosi, Aurland; (d) Veslpiggen (the southernmost profile or the black line) and Galdhøe (the northernmost profile or the blue line), the Jotunheimen Mountains; (e) Ádjit, Storfjord; (f) Rombakstøtta, Narvik; and (g) Mannen, Rauma. Map background credits: ©Statens kartverk, Geovekst og kommunene.
2.1 Western Norway
Western Norway is characterised by alpine mountains, deep glacial valleys and fjords, which were formed after multiple mountain and full-sized Fennoscandian ice sheets linearly eroded the pre-existing fluvially eroded valleys (Kleman et al., 2008). The region's climate is maritime, with annual total precipitation of more than 2000 mm (Lussana, 2018). Normal mean annual air temperature (the normal period 1971–2000) varies between −5 and −4 ∘C at the highest mountain peaks to between 6 and 8 ∘C in the coastal areas (Lussana, 2020), and the annual range of mean monthly air temperature is less than 18 ∘C (Tveito et al., 2000). The permafrost limit is higher in this part of Norway, as high-elevation areas are often occupied by glaciers or deeper winter snow, which insulates the ground (Etzelmüller et al., 2003). During 2015–2017, nine GEOprecision, M-Log 5W Rock loggers with at least 0.1 ∘C at 0 ∘C accuracy were installed at selected rock walls to measure surface temperature in western Norway (Magnin et al., 2019). The lower rock wall permafrost limits in the area at present can be expected at 1300–1400 m elevation in north-facing slopes (Magnin et al., 2019). We chose four profiles in western Norway for this study: (1) Mannen (Fig. 1g), (2) Hogrenningsnibba (Fig. 1b), (3) Kvernhusfjellet (Fig. 1b) and (4) Ramnanosi (Fig. 1c). The name Mannen is used for both a mountain peak at 1294 m elevation and a large active rockslide. Over the last few years, the Mannen instability has been moving with a velocity of more than 20 mm a−1 in the upper part of the slope above about 1000 m elevation (Etzelmüller et al., 2022). Hogrenningsnibba (1670 m) and Kvernhusfjellet (1740 m) in the Loen area are two mountains located north of the Jostedalsbreen ice cap. Around the Ramnanosi Mountain (1421 m), both gravitational faults and fractures were mapped in the phyllite nappes. Below a west-facing 200 m high slide scar, there are deposits from the rock avalanche and rockfall events (Blikra et al., 2006; Böhme et al., 2012, 2013).
2.2 The Jotunheimen Mountains
The Jotunheimen Mountain Range is located in the central part of southern Norway and represents one of the highest mountain areas in Norway, including its highest peak, Galdhøpiggen (2469 m). The Jotunheimen area receives less precipitation than western Norway, with normal (1961–1990) mean precipitation typically less than 1000 mm a−1 (Lussana, 2018). Normal mean annual air temperature (1971–2000) is below −6 ∘C at the highest mountain peaks to between 0 and 2 ∘C in the valleys (Lussana, 2020). The area has an annual range of mean monthly air temperature normally greater than 18 ∘C (Tveito et al., 2000). Most mountain permafrost research in southern Norway has been conducted in central and eastern Norway, especially in the Jotunheimen Mountain Range (Ødegård et al., 1992; Farbrot et al., 2011; Isaksen et al., 2011). In 1982, the first 10 m deep borehole at 1851 m elevation was drilled in Jotunheimen (Ødegård et al., 1992), and then in August 1999, the deepest permafrost borehole (129 m) in Norway was drilled in the continuous permafrost zone at Juvvasshøe (1894 m) as part of the PACE project (Fig. 1d; Sollid et al., 2000; Harris et al., 2001). Additional boreholes have been drilled at various elevations in the Juvvasshøe area on its north-eastern slope in August 2008 (Fig. 1d; Farbrot et al., 2011). The measured GTs show that permafrost occurs in all boreholes at and above 1559 m elevation. Furthermore, GEOprecision, M-Log 5W Rock loggers (at least 0.1 ∘C at 0 ∘C accuracy) were installed at selected sites in Jotunheimen (Hipp et al., 2014). Statistical model results (Magnin et al. 2019) suggested that the lower limit of rock wall permafrost in the Jotunheimen area is at approximately 1550 and 1150 m elevation in the south- and north-facing rock walls, respectively. We define two profiles in Jotunheimen in this study (Fig. 1d) for (1) Veslpiggen (2369 m) and (2) Galdhøe (2283 m).
2.3 Northern Norway
The geomorphology of northern Norway is generally similar to southern Norway, with multiple glaciations leading to the formation of fjords and U-valleys (Kleman et al., 2008; Olsen et al., 2013). The climate in northern Norway is mostly subarctic in the lowland and tundra type in the mountains. The climate varies from maritime in the coastal areas, with the highest annual total precipitation reaching > 2000 mm in 1961–1990 (Lussana, 2018), to a more continental character further inland, where annual total precipitation averaged less than 750 mm in 1961–1990 (Lussana, 2018). Normal mean annual air temperature (1971–2000) is between −6 and −5 ∘C at the highest mountains to between 2 and 6 ∘C in the coastal areas (Lussana, 2020). For the gentle terrain, the permafrost limits decrease from 800–900 m elevation in the western areas of northern Norway to around 200–300 m elevation further inland (Farbrot et al., 2013). Three transects in the coastal areas of northern Norway are established in this study: (1) Gámanjunni 3 (Fig. 1a), (2) Ádjit (Fig. 1e) and (3) Rombakstøtta (Fig. 1f). All sites are instrumented with GEOprecision, M-Log 5W Rock loggers with at least 0.1 ∘C at 0 ∘C accuracy. Gámanjunni 3 (Fig. 1a) is one of the most unstable rock slopes in Norway, recently moving up to 60 mm a−1 (Böhme et al., 2016b, 2019; Etzelmüller et al., 2022). The unstable part has moved approximately 150 m downslope since the end of the Holocene thermal maximum (Böhme et al., 2019; Hilger et al., 2021). Ádjit (Fig. 1e) is a mountain ridge where several periglacial and mass movement landforms were mapped below its south-western rock wall, such as active and inactive talus-derived rock glaciers (Nopper, 2015; Eriksen et al., 2018).
3.1 CryoGrid 2D
A transient 2D heat conduction model, CryoGrid 2D (Myhra et al., 2017), is employed to model GT evolution along the selected profiles. The subsurface temperature is modelled by solving the heat diffusion equation following Fourier's law of heat conduction with the material- and temperature-dependent thermal parameters. The effective volumetric heat capacity, which includes the latent heat effects due to water–ice phase transitions, and the thermal conductivity are functions of the volumetric contents of soil components (mineral, water or ice, air, organic) and their individual thermal properties, as defined in the one-dimensional CryoGrid 2 model (Westermann et al., 2013). In CryoGrid 2D, the MATLAB-based finite element solver MILAMIN package (Dabrowski et al., 2008) generates an unstructured triangular mesh for a given slope geometry and is used for space discretisation, whereas time discretisation is based on the finite-difference backward Euler scheme. The spatial resolution in CryoGrid 2D is prescribed by the maximum triangle area (MTA), i.e. a maximum area for the three-node triangular elements. Dirichlet boundary conditions are used at the upper model boundary, and the model is forced by GST at the air–ground interface, i.e. temperature below the snowpack. A more thorough description of the model and equations can be found in Myhra et al. (2017). Note that since CryoGrid 2D is a conductive model, convective or advective heat transport is unaccounted for. The model is constructed as a 2D cross section through a slope, assuming translational symmetry along the third dimension.
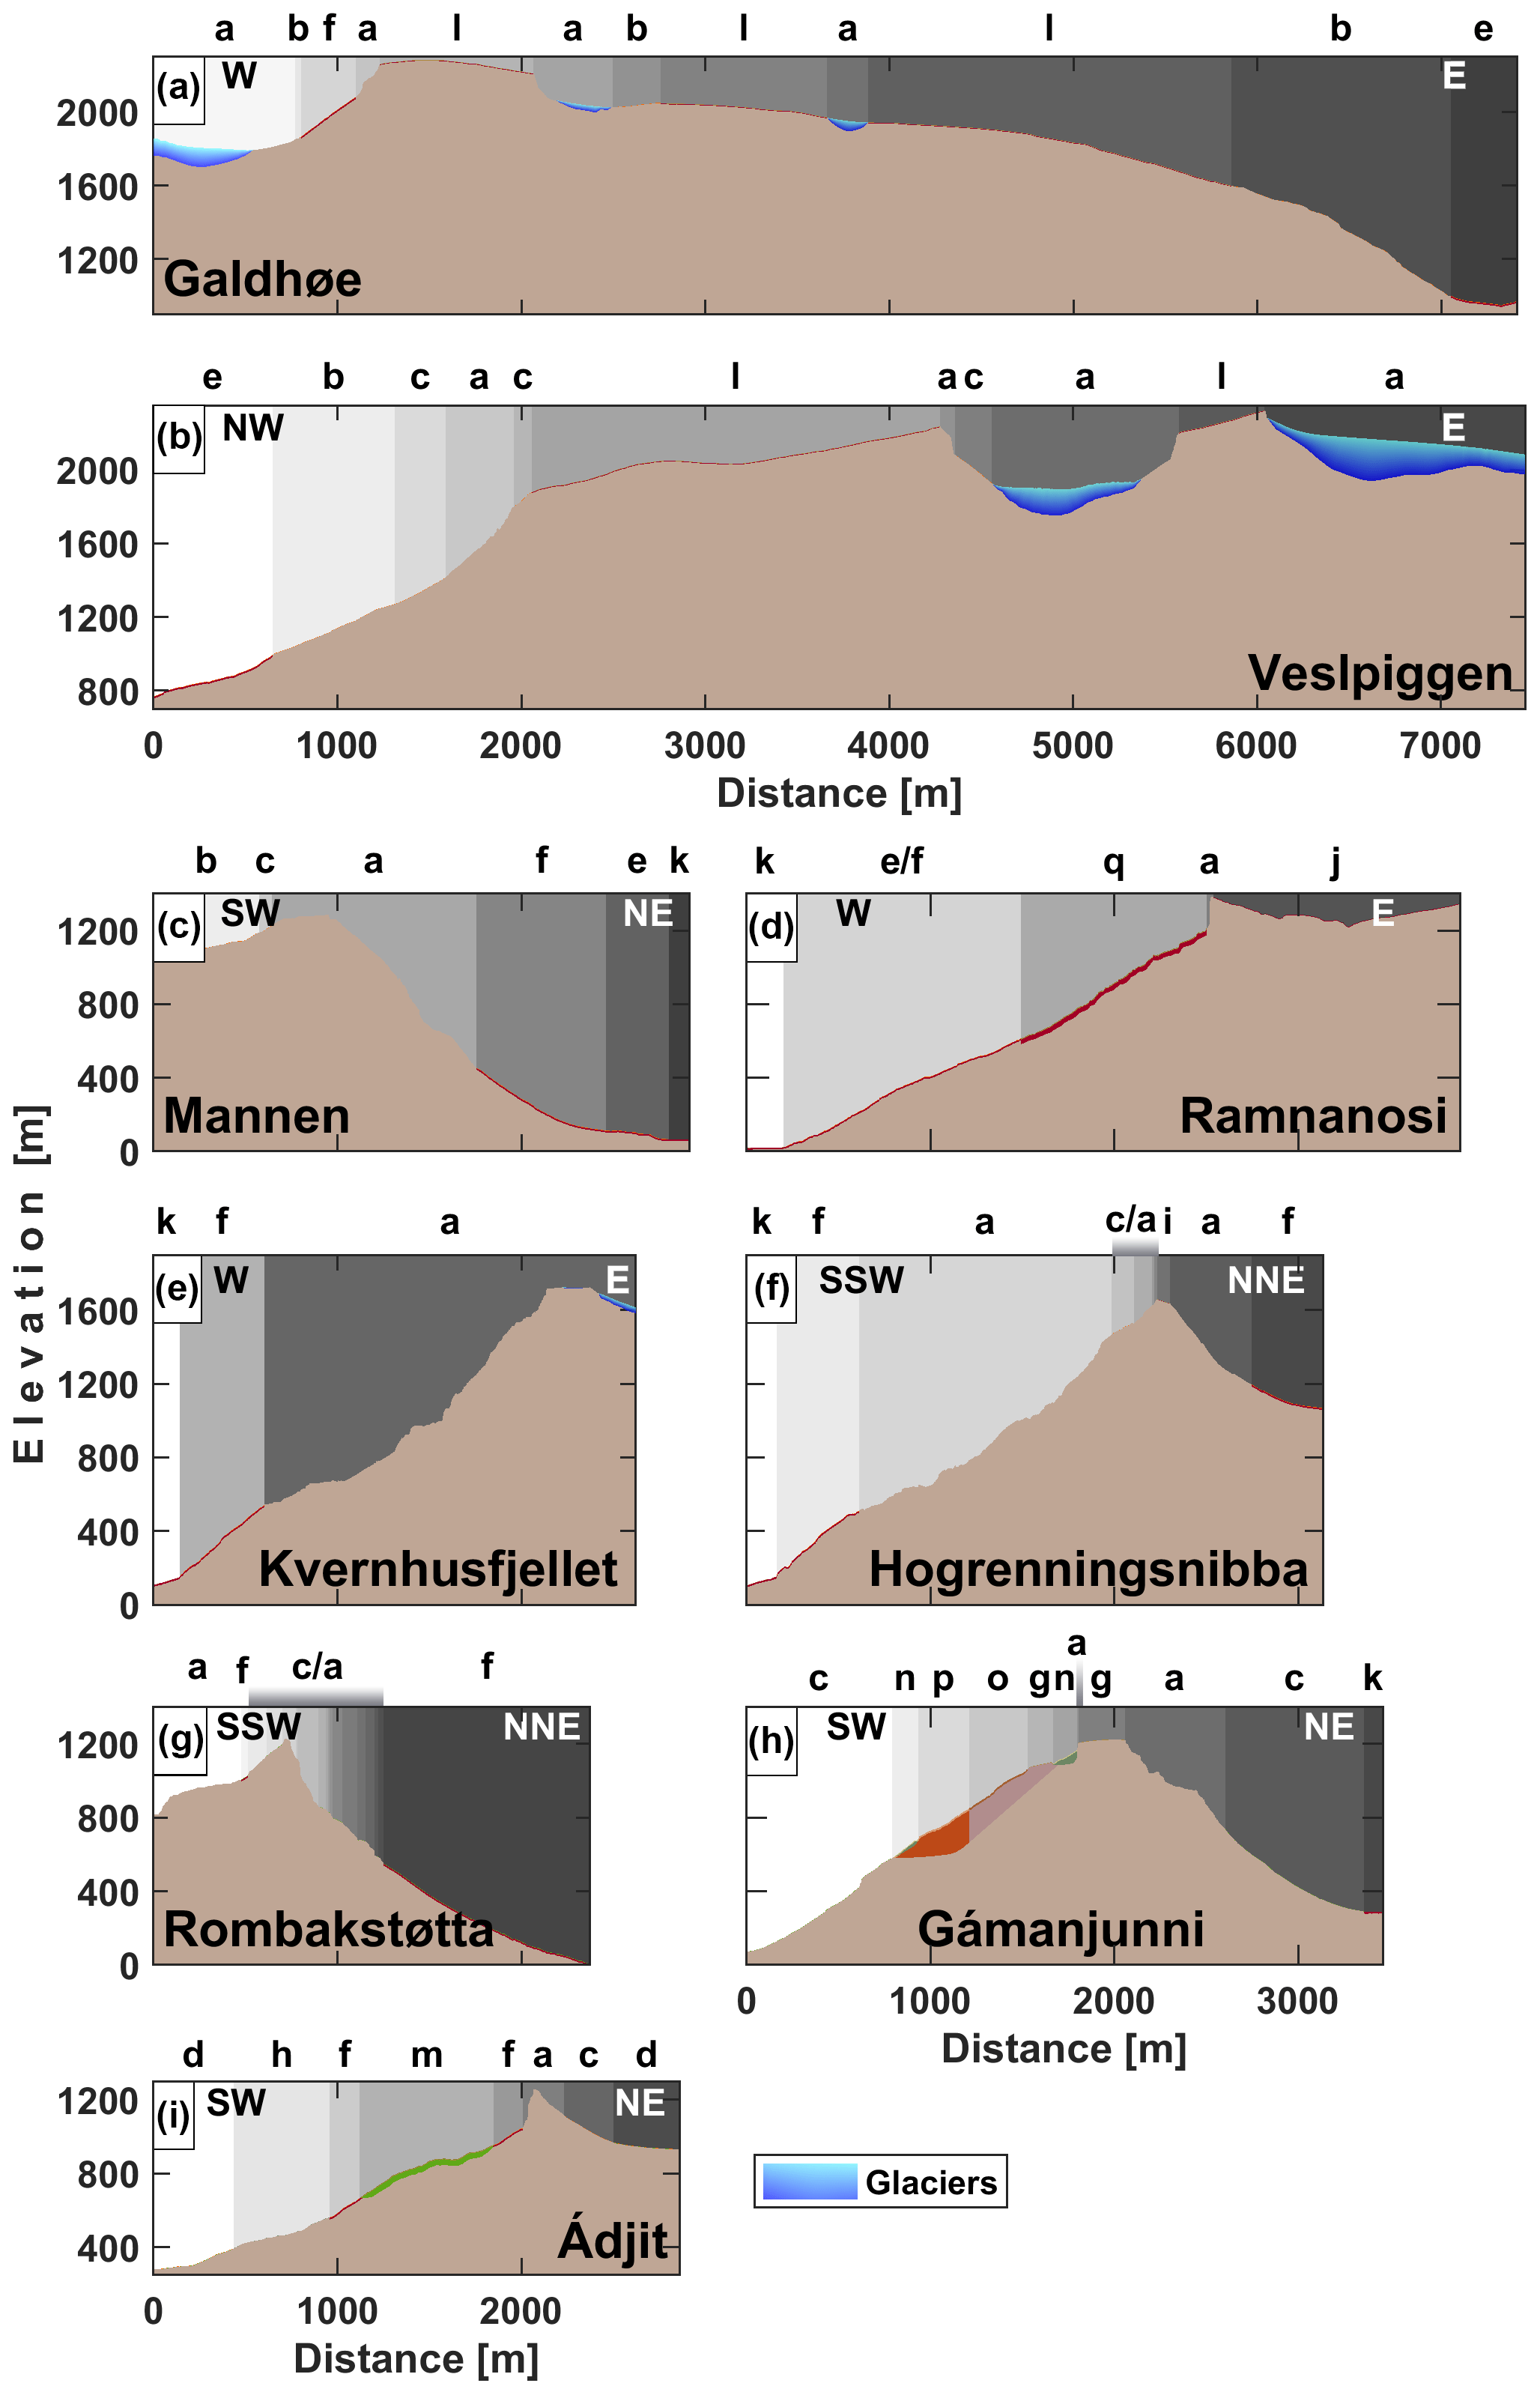
Figure 2Slope geometry and stratigraphy. The small case letters are stratigraphy codes, described in detail in Table S1 in the Supplement. The label “c/a” indicates alternating stratigraphy of bedrock and thin colluvium. Blue patches depict glaciers or perennial snow. Different colours near the surface show various stratigraphic layers (see Table S1 for details). Note that the meshes extend down to 6000 m below sea level and the parts below the valley bottoms are not shown.
3.2 Model geometry and ground stratigraphy
The upper boundary for the selected profiles was extracted from the 0.5–1 m digital elevation models (DEMs) available from the Norwegian Mapping Authority at https://www.hoydedata.no (last access: 18 February 2021), whereas the lower boundary extends down to 6000 m below sea level. Most profiles are approximately 2.5–4 km long, except for the ∼ 7.5 km long profiles in Jotunheimen (Fig. 2a and b). Because of the profiles in Jotunheimen, together with the profile at Kvernhusfjellet traverse glaciers, we compute glacier bed elevation by extracting glacier thickness provided by NVE, where ice thickness was estimated using a distributed model (Andreassen et al., 2015). At Kvernhusfjellet, we add a 5 m thick snow patch on the top plateau, as observed on the orthophotos from the Norwegian Public Roads Administration, the Norwegian Institute of Bioeconomy Research and the Norwegian Mapping Authority (https://www.norgeibilder.no, last access: 11 March 2021). Meshes for each profile are constructed with nodes at a 0.05 m distance at the upper boundary and an MTA that increases with depth. The constructed meshes have an MTA of 0.05 m2 between the ground surface and 2 m depth, 0.20 m2 at depths between 2 and 10 m, 0.50 m2 at depths between 10 and 20 m, 5.00 m2 at depths between 20 and 100 m, and 50 m2 below 100 m depth. The model domains consist of approximately 500 000 vertices, except for the longer profiles in Jotunheimen, where each mesh has ∼ 1 250 000 nodes. No mechanical aspect is considered in this study; hence, the meshes remain static throughout the entire simulation period.
A digital map of surface materials is available for all of Norway from the Geological Survey of Norway (NGU) at 1:250 000 scale. Due to the small scale of the map, we refine the geomorphological mapping along the upper profile boundaries based on the available orthophotos from https://www.norgeibilder.no (last access: 11 March 2021). The ground composition (Table S1) is based on the sediments mapped on the surface for most profiles, where we define hard vertical boundaries between the sediment classes also at depth because such an approach allows for an effective and almost automated generation of nodes for an unstructured mesh. Similar volumetric contents and layers for the NVE sediment classes are assumed as in Westermann et al. (2013) for the one-dimensional CryoGrid 2. However, we apply a higher rock porosity than Westermann et al. (2013) and follow the higher porosity of 5 % vol. to account for rock discontinuities, as in Myhra et al. (2017). The thermal conductivity for the mineral fraction is extracted from the same data as in Westermann et al. (2013) and varies for the sites between 2.3 and 3.1 (Table S2). The NVE sediment classes and their stratigraphy as defined in Westermann et al. (2013) lack a suitable representation for some sediments mapped along the profiles. Therefore, we added several sediment classes to fill this gap (Table S1). The Ádjit profile intersects a rock glacier at lower elevations, where we used a similar geometry, as presented in Eriksen et al. (2018). For Gámanjunni we use a slightly modified version of a geological profile for the unstable part (Böhme et al., 2016a), in conjunction with the geomorphological mapping outside of the geological model. The scree class is defined with the same parameters as in Myhra et al. (2019). At Ramnanosi, 30 m thick colluvium deposits are assumed just below the rock wall down to around 600 m elevation, and 4 m thick regolith is assumed at the plateau. Bedrock class (Class “a” in Table S1) is assumed below glaciers and perennial snow.
3.3 Model forcing
3.3.1 Surface air temperature
The modelled daily surface air temperature (SAT) data set for mainland Norway, hereafter seNorge, is available for 1 km2 grid cells for the period 1957–present (Lussana, 2020). However, the seNorge data set overestimates SAT trends and often shows positive SAT trends with elevation for our study sites, leading to, for example, a 3 ∘C SAT increase in Jotunheimen between the 1980s and 2010s. This is the result of the inhomogeneity in the network of meteorological stations, particularly the lack of meteorological stations at mountain plateaus in some periods. Cold periods are overestimated if the gridded data set is based mainly on meteorological stations in valleys, where air temperature inversions are frequent during winter. Therefore, we choose to force the model with the regional monthly data set at 2 km spatial resolution provided by the Norwegian Meteorological Institute, described in detail in Hanssen-Bauer et al. (2006). This regional model yields robust temporal estimates at a regional scale; however, the data provide rather poor temperature series at local scales. Therefore, we superimpose a local component on the regional data. Regional SAT data sets were provided for valleys at the bottom of each profile. We use the following procedure for each profile.
-
Since we begin to run the model at the end of the Little Ice Age (LIA) in Norway and the regional SAT data sets start in 1900, we reconstruct SAT back in time by using SATs from the long-term meteorological stations described in Table S3. The latter data allow for SAT reconstruction back to 1861 for western Norway, 1864 for Jotunheimen and 1872 for northern Norway. We account for average offsets in the overlapping period between SAT from the long-term meteorological stations and the regional SAT.
-
We adjust regional SATs by subtracting offsets between the regional and local SATs from a nearby meteorological station or seNorge for valleys over the last few years.
-
We compute the average monthly lapse rate between two meteorological stations, typically one at the bottom of the valley and one at or close to the mountain plateau over the last few years. The selected SAT data are listed in Table S3.
-
We compute monthly SAT along the profiles using monthly lapse rates.
The selected last few years used in this analysis are periods when temperature measurements in the rock walls are available. This allows for a comparison of SAT with GST determined from rock wall loggers in months with minimal shortwave radiation, e.g. December, and gives more reliability. The aforementioned procedure allows for the reproduction of similar SAT trends at mountain plateaus, as provided for valleys, hence removing elevation dependency in the SAT trends present in the seNorge data. Appendix A describes decadal running mean surface air temperature (SAT10a) evolution for the highest elevations along each profile. After the generation of the SAT data sets, we account for the nival offsets and surface offsets arising from the shortwave solar radiation (see Sects. 3.3.2 and 3.3.3) by modifying SAT along the profiles.
3.3.2 Nival offsets
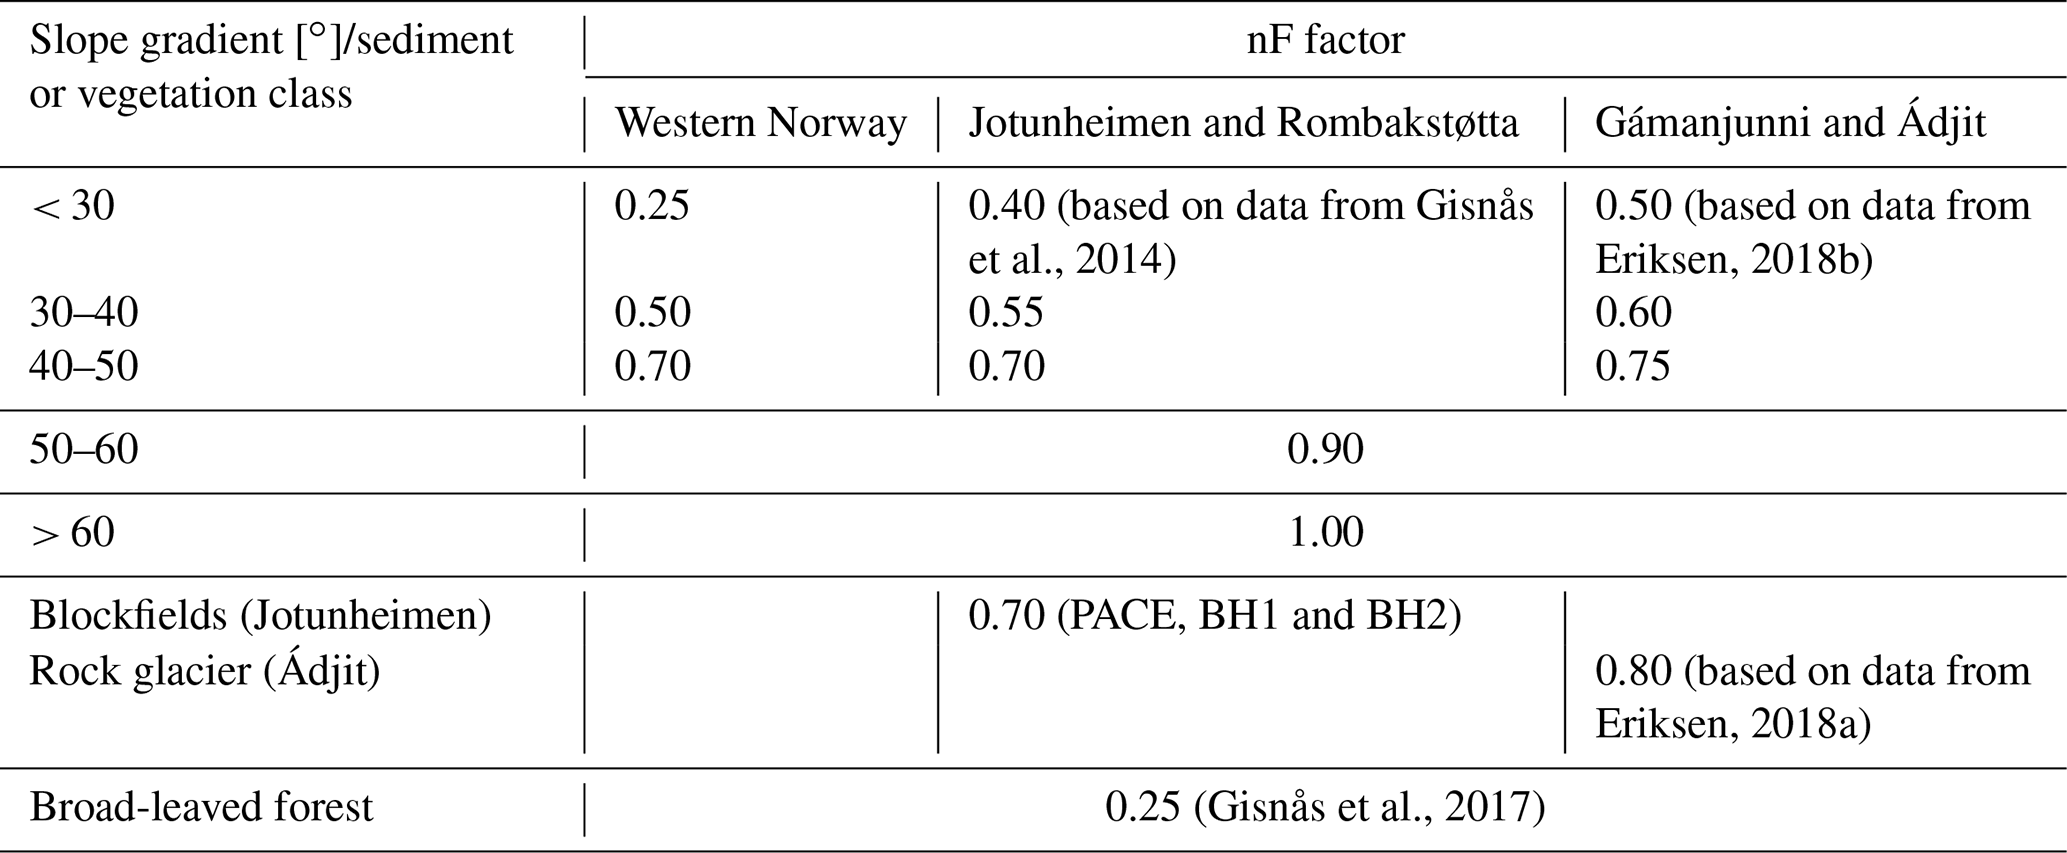
We lack observations of snow cover dynamics and snow depths from the rock walls in Norway. In this study, we are mostly interested in the thermal insulation effect of snow cover and not snow depth itself, especially because our permafrost model lacks an explicit snow domain. In equilibrium permafrost models such as the TTOP model (Smith and Riseborough, 2002), insulating snow effects are accounted for by using semi-empirical transfer functions, so-called freezing n factors (nF). The nF factors link SATs and GSTs by relating the freezing degree days at the surface to the air. In Norway, the freezing n factors vary between 0.1 for the attenuation effects of deep snow cover to 1.0 for very thin or absent snow cover (Gisnås et al., 2013). We follow an easy-to-implement hypothesis that snow thickness and its insulating effect on the GST depend on the slope gradient. Hence, we assign various nF values along the profiles according to the computed slope gradient; however, certain sediment or vegetation cover types have distinct values for nF (Table 1). We assume that steep slopes, i.e. steeper than 60∘, are snow-free (discussed in Sect. 5.1.4). Snow redistribution towards the lower portion of the slope is not considered. Furthermore, we detect 1 m deep sinks along the profiles using fill sinks from TopoToolbox 2 (Schwanghart and Scherler, 2014) and assume that these are areas where snow may accumulate and use the same nF as for the gentlest gradient (slope < 30∘) in each profile. Additionally, we assign a special nF value of 0.25, as computed by Gisnås et al. (2017), for broad-leaved forest (code 311) based on CORINE land cover 2018 (Aune-Lundberg and Strand, 2010).
For the top block at Gámanjunni (slope gradient < 30∘), we compute nF = 0.50 based on the SAT and GST measurements conducted by Eriksen (2018b). For the rock glacier at Ádjit, we found an nF value of 0.80 (Eriksen, 2018a). Measurements from the three uppermost boreholes, BH1 (nF = 0.78 in 2008–2019), PACE (nF = 0.89 in 1999–2018) and BH2 (nF = 0.37 in 2008–2019), in Jotunheimen yield an average rounded nF value of 0.70 that we apply for the blockfield locations. We note that nF for the blocky terrain (blockfields and rock glaciers) is not necessarily due to nival offsets and is rather caused by air convection (discussed in Sect. 5.1.1).
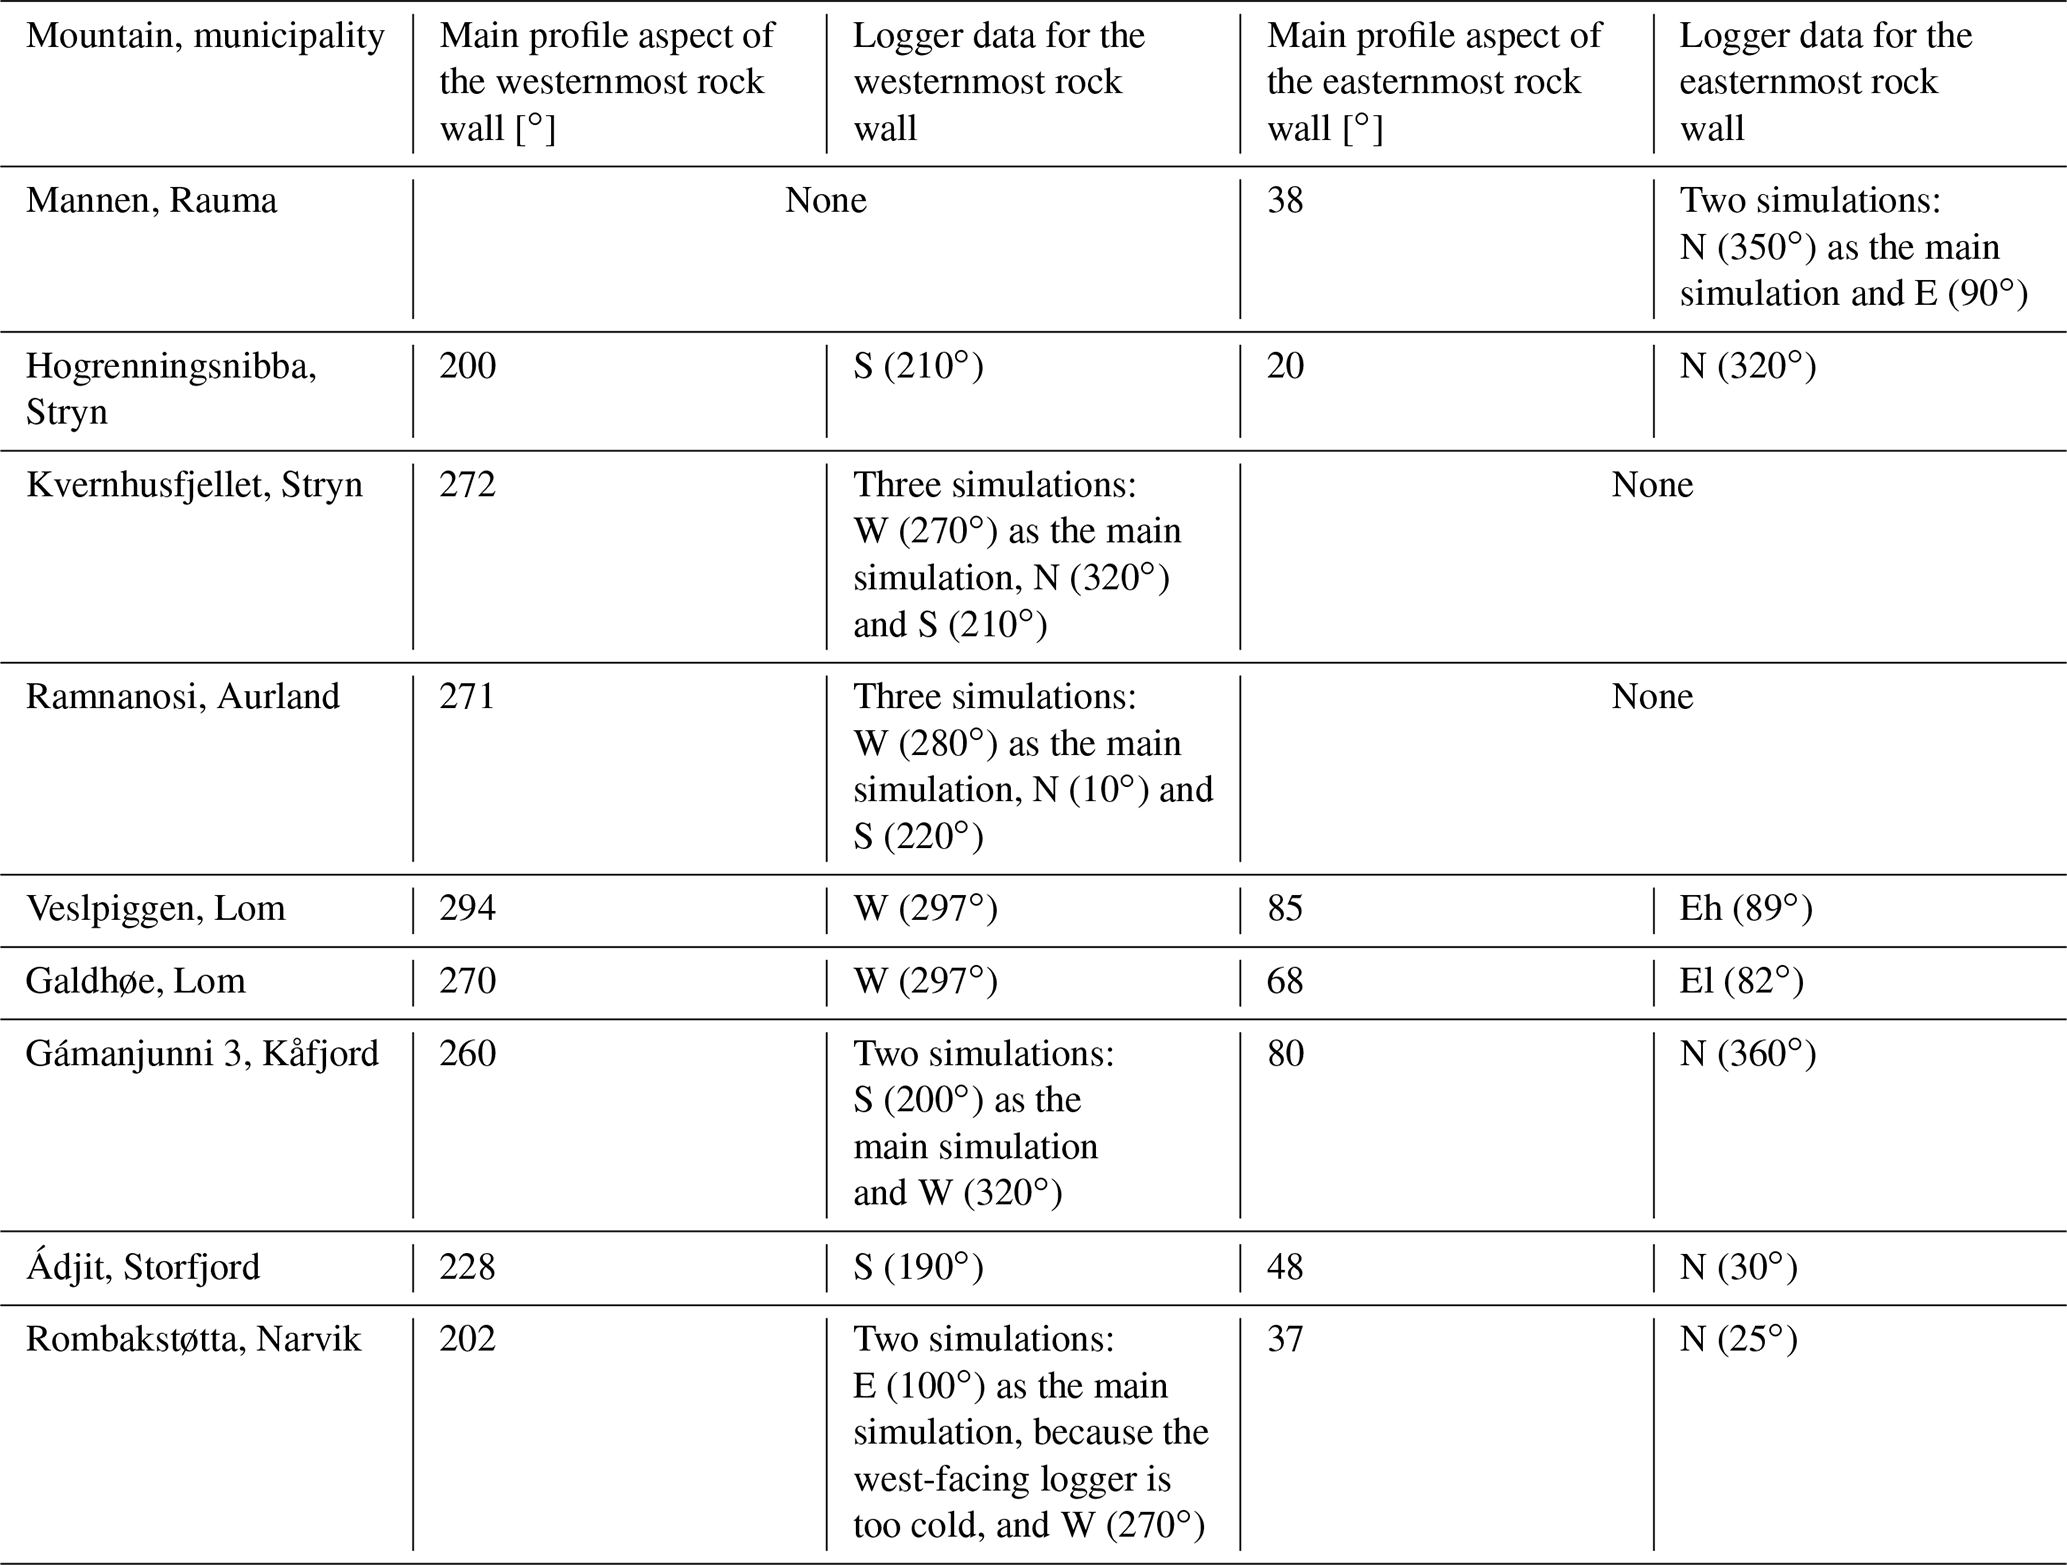
Table 2Summary of the rock wall aspects and selected logger data along profiles. “Easternmost” – aspects between 0 and 180∘; “westernmost” – aspects between 180 and 360∘.
3.3.3 Surface offsets
Our analysis of the measured 2 h rock wall temperature indicates that rock wall temperature in Norway is influenced by solar radiation as early as February in northern Norway and in all months of the year in southern Norway. Due to their steep vertical slopes, incoming shortwave solar radiation may not necessarily be the largest during June, as expected for a horizontal surface at the latitudes in Norway. In the case of rock walls, thawing n factors (nT; Smith and Riseborough, 2002) may not be able to account for surface offsets (SOs) due to the shortwave solar radiation in the months when solar radiation is maximum and SAT is still negative, which may occur in the spring months. Additionally, reflected solar radiation from the surrounding terrain is likely an important factor during spring and early summer, when snow cover may be present, or during a whole year in the rock walls above glaciers. Instead of using temperature transfer factors, we add measured average monthly SOs to SATs at the location of rock walls along profiles. Measured monthly SOs are computed as a difference between monthly mean ground surface (GSTmonth) and surface air (SATmonth) temperature:
Note that we refer to both rock surface and soil surface temperatures as GSTs in this study. We apply the same SOs to all steep parts of slopes (> 60∘) along profiles and to all months during the entire modelling period. Table 2 summarises the aspects along profiles and selected rock wall loggers to account for the monthly SOs. Figure S1 in the Supplement shows more details about the loggers used along profiles. In this study, SOs are referred to as SOs arising mainly from solar radiation, unless other indicated.
3.4 Model initialisation, model simulations and sensitivity tests
Model simulations start around the end of the LIA in Norway when the long-term SAT data from meteorological stations are available (1861 or 1864 for the profiles in southern Norway, 1874 for the profiles in northern Norway). CryoGrid 2D is initialised in a two-step procedure: (1) by running a steady-state version of the model using the average GST for the first decade of the available data and the geothermal heat flux at the lower boundary and (2) a spin-up of the model at monthly time steps around 50 times, which yields temperature differences between the consecutive simulations on the order of 10−4 ∘C. After this initialisation procedure, we continue to run the model at monthly time steps. Accounting for at least an additional 20 years of initialisation period, we present the results of the model simulations since 1900. A zero heat flux condition is assumed along the vertical left and right boundaries. An average value of geothermal heat flux of 50 mW m−2 (Slagstad et al., 2009) is applied at the lower boundary at all sites, except for the profiles in Jotunheimen, where a value of 33 mW m−2 is used (Isaksen et al., 2001). Beneath modern glaciers or perennial snow, we apply GST of 0 ∘C, corresponding to the temperate bed conditions, except for the shallower glaciers or ice patches along the Galdhøe profile in Jotunheimen, where we apply cold basal conditions at −3 ∘C, as measured in the Juvfonne ice patch (Ødegård et al., 2017). We note, however, that the assumed temperate bed conditions should be represented by polythermal bed conditions because the thinnest parts of glaciers likely have temperatures below the pressure melting point (Etzelmüller and Hagen, 2005).
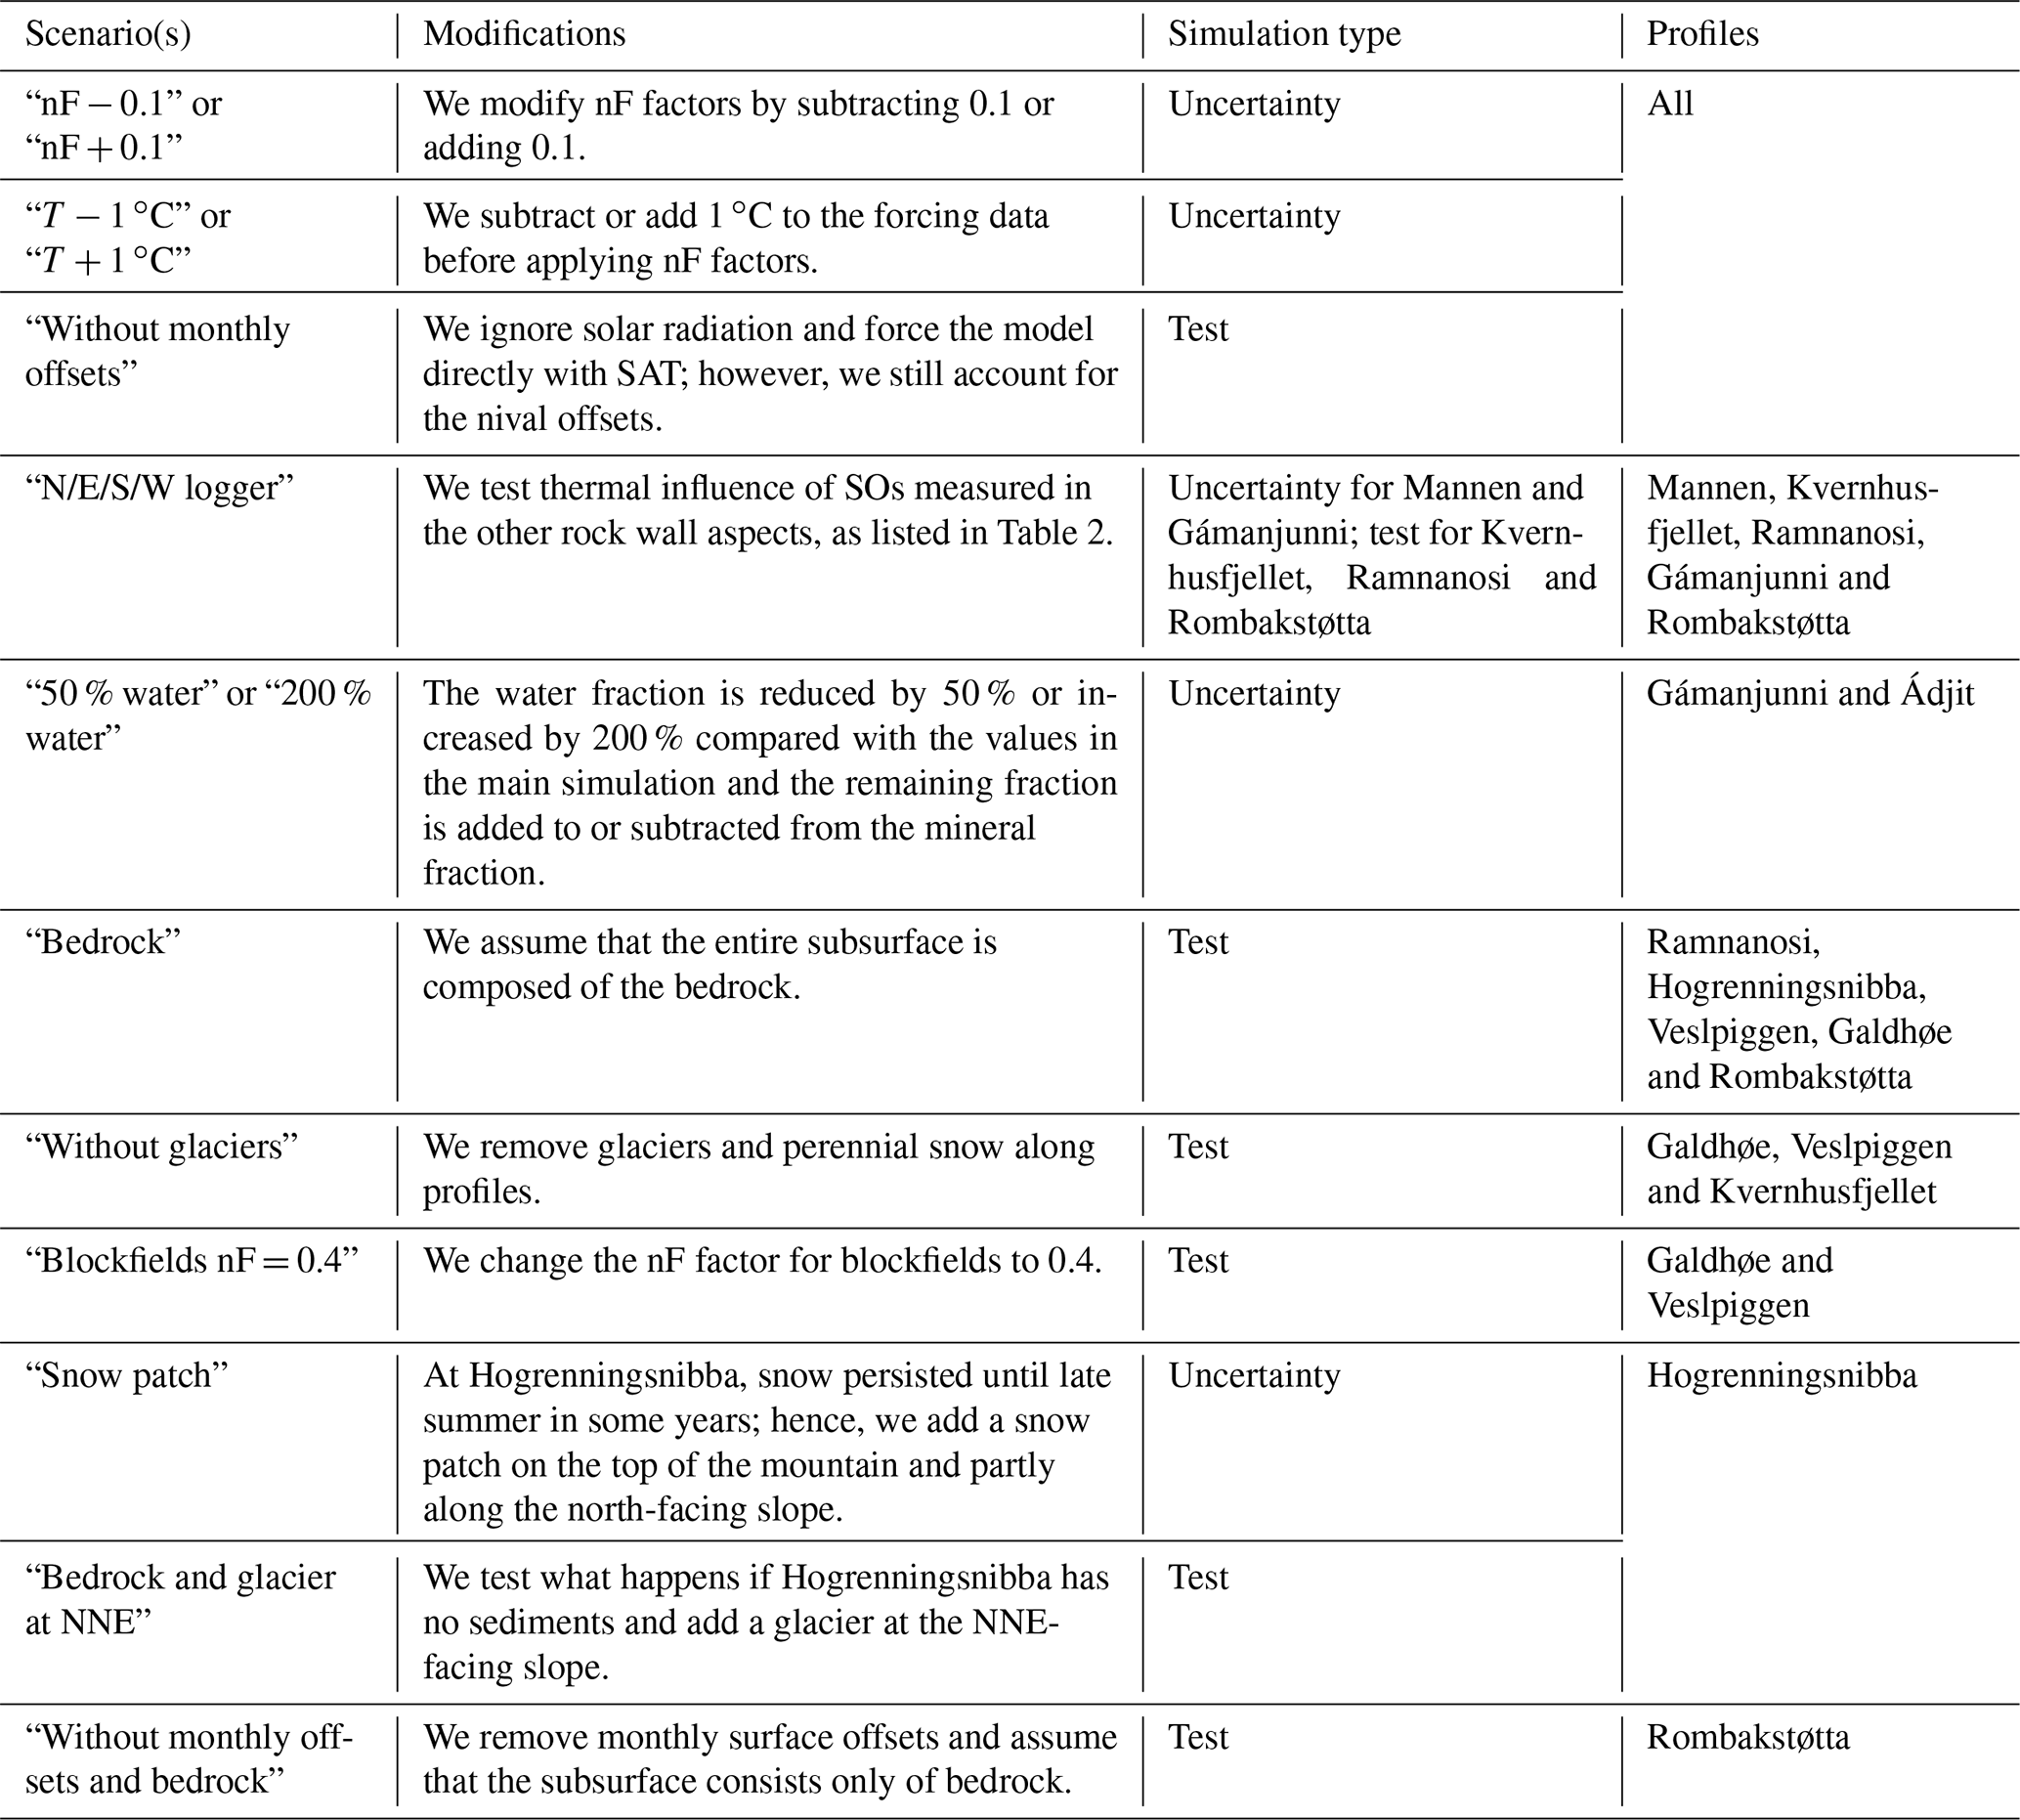
We evaluate model sensitivity for all profiles by rerunning the model, including the initialisation steps. Certain simulations are conducted to verify the thermal influence of likely uncertainties in the model forcing or parameters (“uncertainty simulations”), and the others are “test simulations” to investigate the thermal influence of, for example, nearby glaciers, sediments or SOs in the rock walls. Uncertainty and test simulations are listed in Table 3.
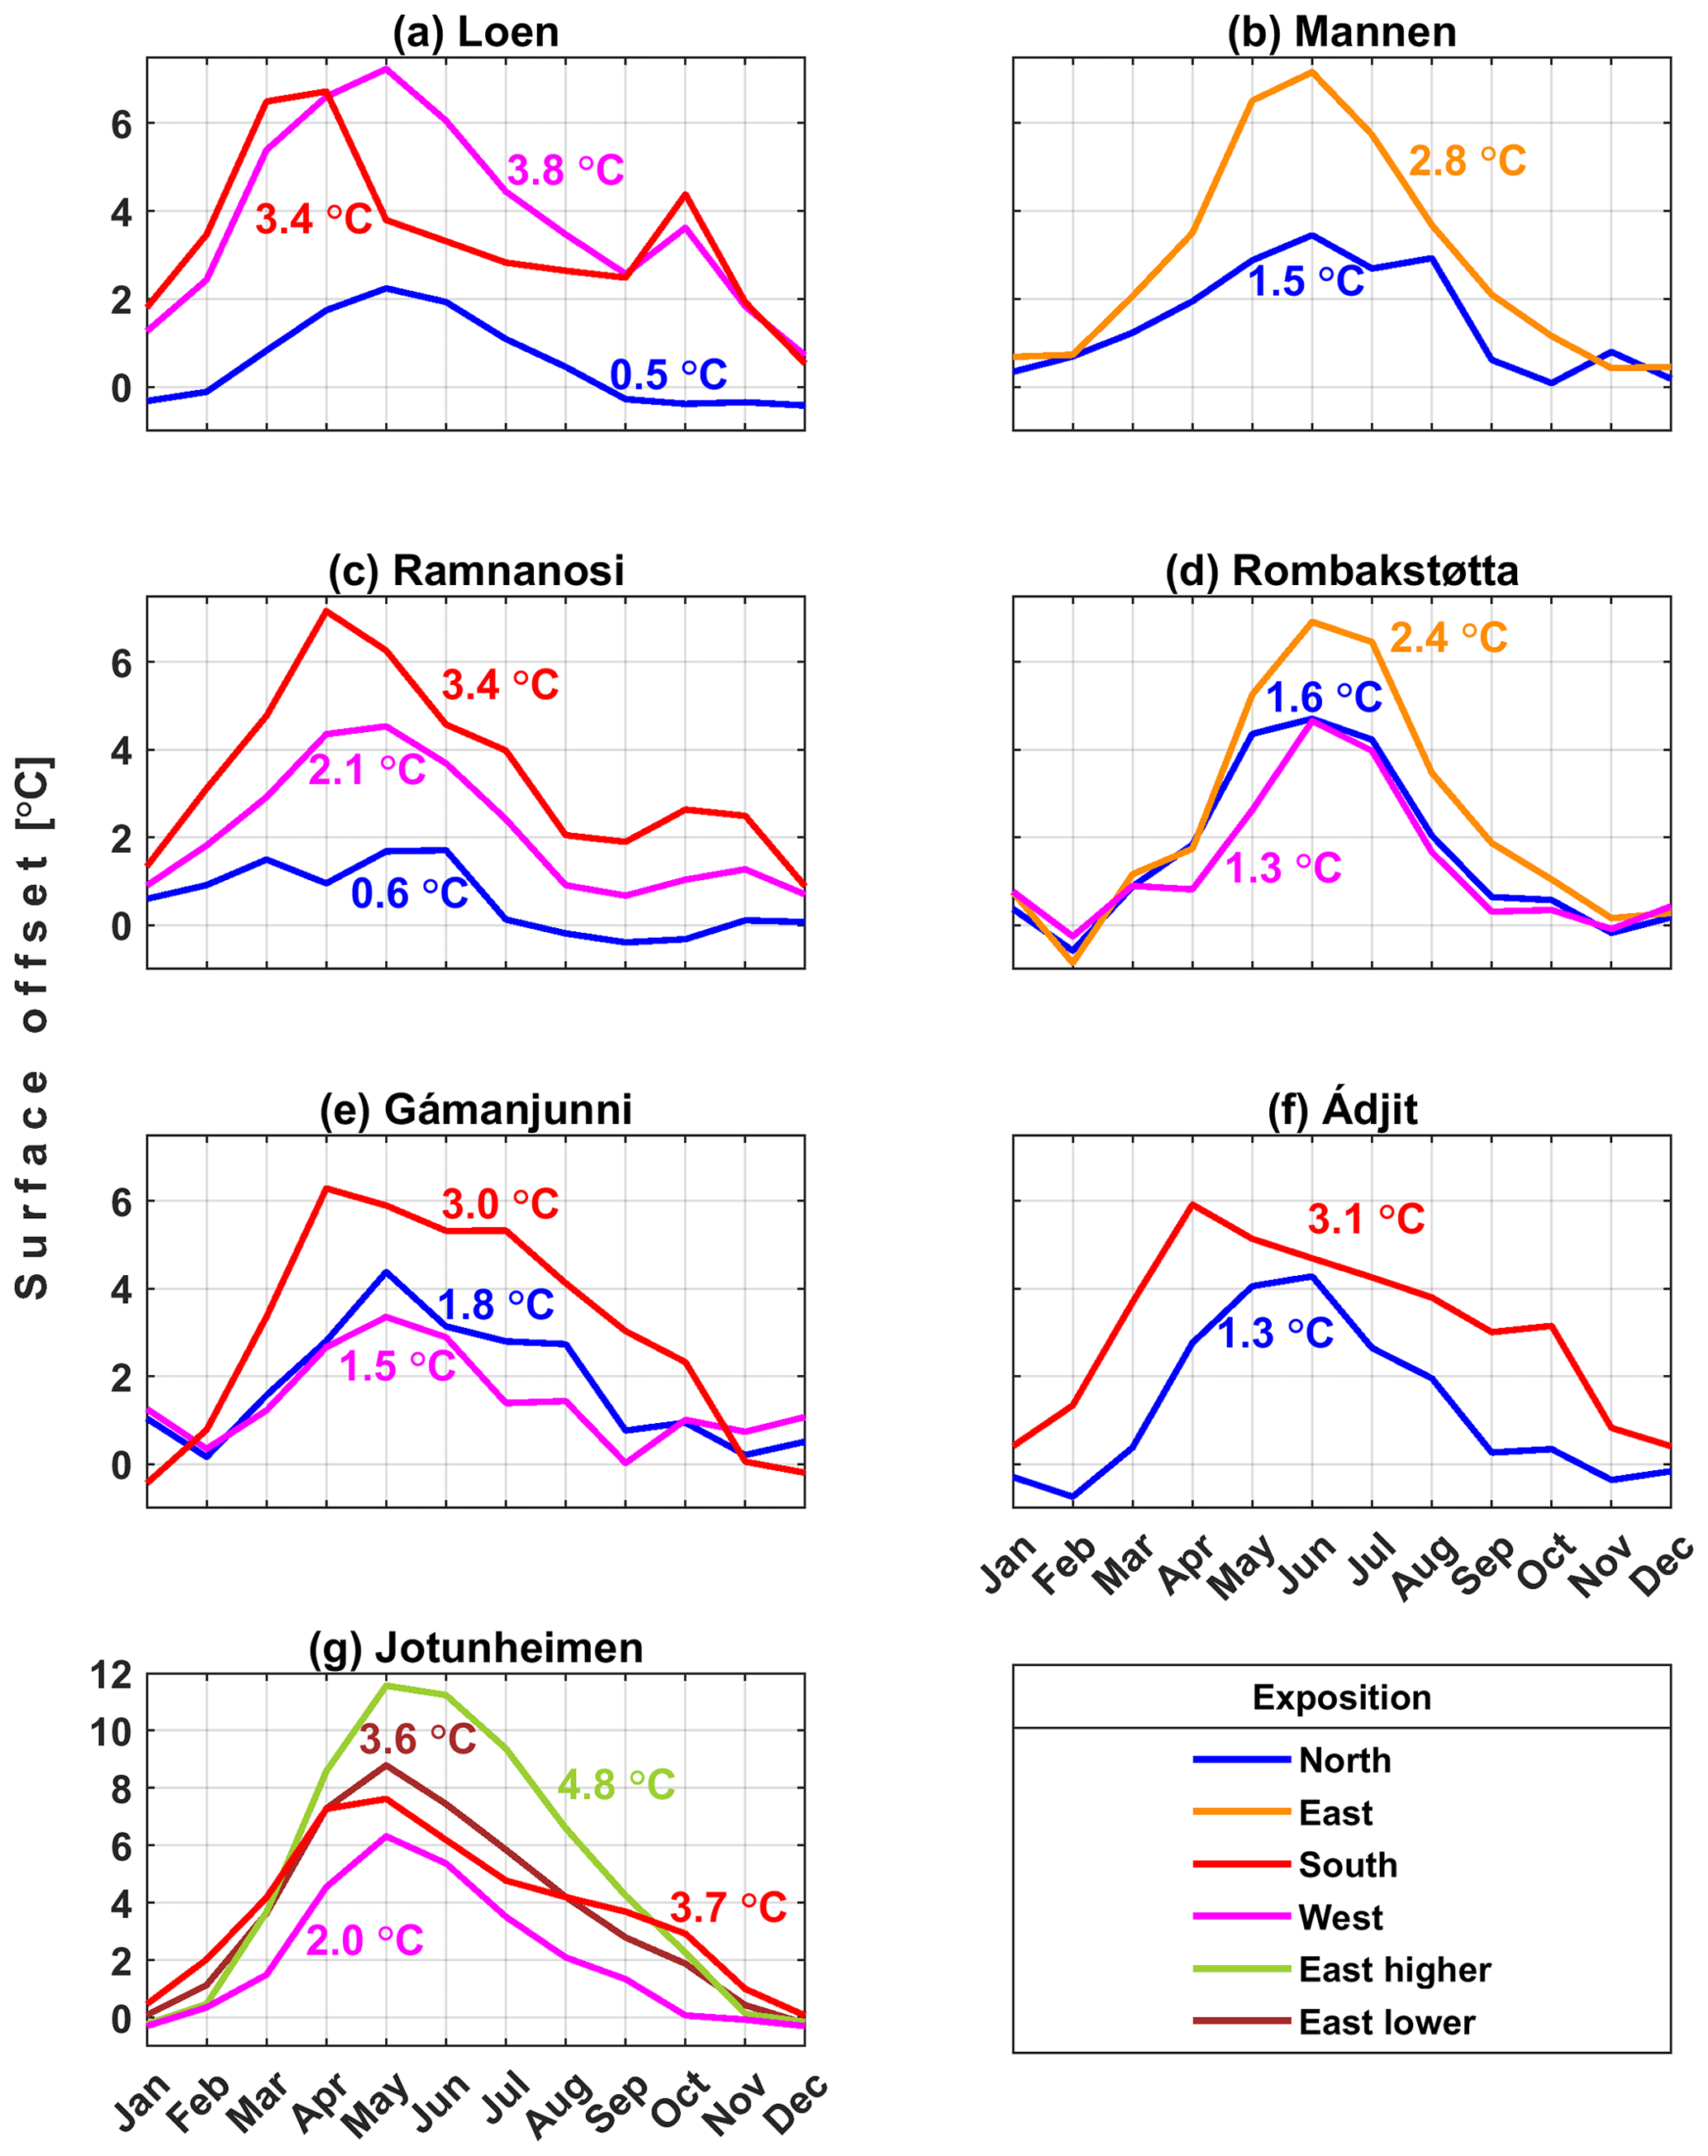
Figure 3Monthly surface offsets between air and rock wall temperature for each site and logger exposition. Numbers along the plot lines are average values. Note that Jotunheimen has a different y axis than the other subplots.
4.1 Surface offsets and logger data
Figure 3 shows the monthly SOs for rock wall loggers in Norway. The south-facing slopes usually have the maximum monthly SOs in April compared with May elsewhere. There are a few exceptions, e.g. the temperatures from the rock wall loggers at Mannen and Rombakstøtta indicate the maximum monthly offsets occur only in June. The calibration of GST forcing input using the measured SOs yields zero mean error and an RMSE below 1.40 ∘C for the monthly GSTs and significantly improves the correlation between the forcing data and the rock wall measurements (Figs. S2–S21).
Table S4 includes information about the measured GSTs at the study sites. Mean rock wall temperature at or below 0 ∘C over at least 2 consecutive years usually indicates permafrost; however, due to lateral heat fluxes and the preservation of long-term temperature signals at depth, permafrost may occur even if mean rock wall temperature is above 0 ∘C (Noetzli et al., 2007; Noetzli and Gruber, 2009). All recorded logger temperatures at Mannen and the W-facing logger at Ramnanosi suggest an unlikeliness of permafrost presence in these rock wall expositions over the last few years. The north-facing logger at Ramnanosi measured mean rock wall temperature at 0.02 ∘C (August 2016–July 2020; 1370 m); hence, permafrost was likely in the north-facing parts of the slope, at least before the measurement period started. The temperature from the north-facing logger in the Loen area indicates that permafrost is likely, whereas the temperatures from the west- and south-facing loggers are positive. In Jotunheimen, most temperatures from the rock wall loggers indicate that even cold permafrost (< −2 ∘C) exists in the Jotunheimen Mountains. In the Gámanjunni area, at least warm permafrost conditions can be expected in the rock walls. For Ádjit, the temperatures measured in both loggers indicate permafrost, although the south-facing rock wall is close to non-permafrost conditions. The temperatures from all loggers at Rombakstøtta, except from the east-facing logger, indicate that at least warm permafrost may be present in the rock walls.
4.2 Distribution of modelled ground temperature
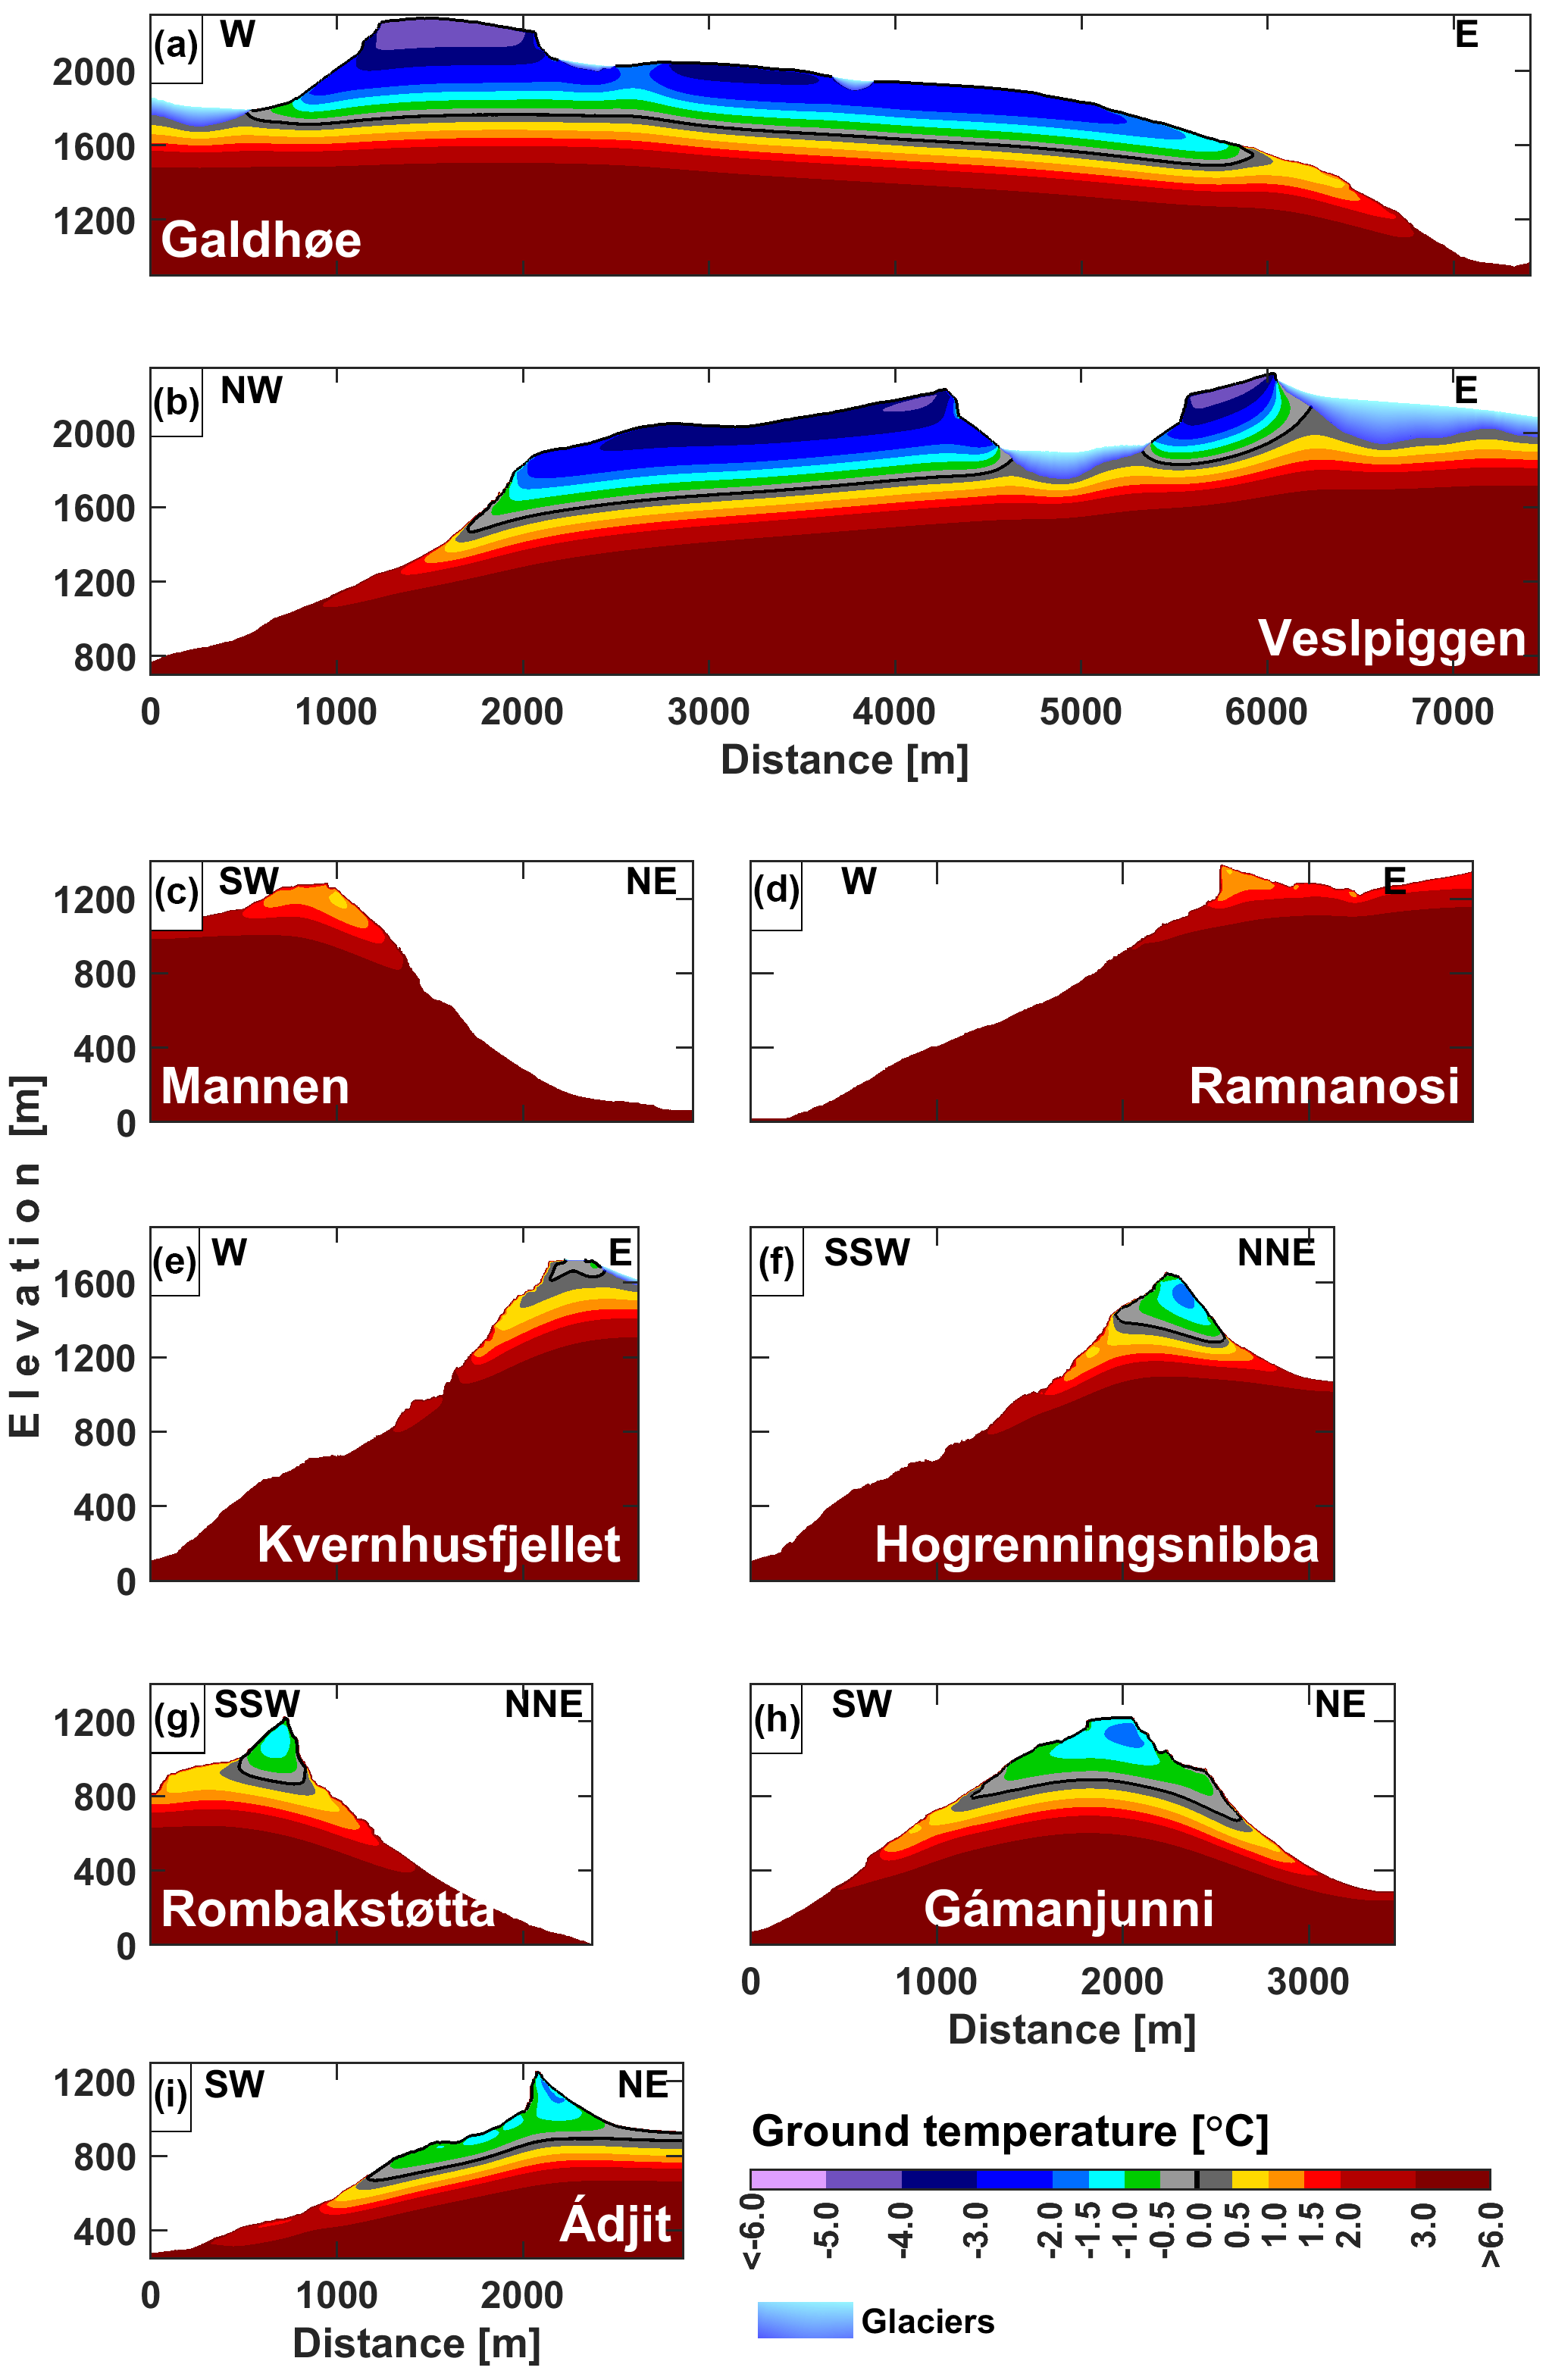
We modelled GT at four sites in western Norway, two sites in Jotunheimen and three sites in northern Norway (Fig. 4). These results are also presented in Videos 1–20.
4.2.1 The permafrost limits
Western Norway. The main simulations for the two profiles with the mountain peaks at an elevation below 1400 m (Mannen and Ramnanosi) suggest no permafrost in these mountains since 1900 (Fig. 4c and d; Videos 1–4). The simulations for the two profiles with higher mountain peaks (Hogrenningsnibba and Kvernhusfjellet) indicate that sporadic (10 %–50 % area) to discontinuous (50 %–90 % area) permafrost likely occurs in these mountains, even below glaciers and snow patches (Fig. 4e and f; Videos 5–8). The lower permafrost limits vary between 1300 m for the NNE-facing slope at Hogrenningsnibba to around 1600 m at the west-facing slope of Kvernhusfjellet over the 2010s.
Jotunheimen. For both profiles in Jotunheimen, sporadic to discontinuous permafrost is simulated down to an elevation of 1530–1590 m over the 2010s (Fig. 4a and b; Videos 9–14). Considering the simplified forcing for the gentle terrain in our modelling, a boundary between discontinuous and continuous permafrost can only be established assuming a particular isotherm, here −2 ∘C, as the lower limit for continuous permafrost. In that case, the continuous permafrost limit is at ∼ 1780–1860 m for the gentle terrain over the 2010s.
Northern Norway. Modelled GT field for Gámanjunni shows a colder NE-facing slope compared with the SW-facing slope, and the lower permafrost limits are approximately 100 m higher at the SW-facing slope, at an elevation of around 850 m over the 2010s (Fig. 4h; Videos 15–16). At Ádjit, the SW-facing rock wall is warmer than the NE-facing slope at Ádjit, even though the modelled permafrost limits are lower on the SW-facing slope than on the NE-facing one, at around 700 m over the 2010s, roughly where the active rock glacier has its front (Fig. 4i; Videos 17–18). The permafrost limits at Rombakstøtta are modelled slightly higher than at the other sites in northern Norway (Fig. 4g; Videos 19–20), at approximately 900–950 and 1000 m for the NNE- and SSW-facing slopes over the 2010s.
4.2.2 Ground heat flux direction
The heat flux direction is shown in Videos 2, 4, 6, 8, 11, 14, 16, 18 and 20. The main ground heat flux direction is generally vertical beneath larger plateaus (e.g. Ramnanosi, Mannen, Galdhøe). For the latter simulations, the main heat flux direction tilts slightly outwards in simulations without monthly SOs, where relatively colder zones are simulated below rock walls. Simulations with large SOs in the rock walls show that heat flux may be forced towards the colder plateaus if SOs are large enough (e.g. Veslpiggen, Ramnanosi). The main heat flux direction is more tilted towards colder zones for the mountains, with more pronounced differences in GST between opposite mountainsides (e.g. Hogrenningsnibba, Kvernhusfjellet, Gámanjunni). The tilt between opposite mountainsides may in certain cases even be horizontal beneath the mountain peaks, with a shorter distance between two mountainsides and larger differences in GST (e.g. Ádjit, Hogrenningsnibba). If GST between the opposite mountainsides is similar (e.g. Rombakstøtta), the main heat flux direction remains vertical. Glaciers may modify the main heat flux direction below the plateaus (see Sect. 4.2.4).
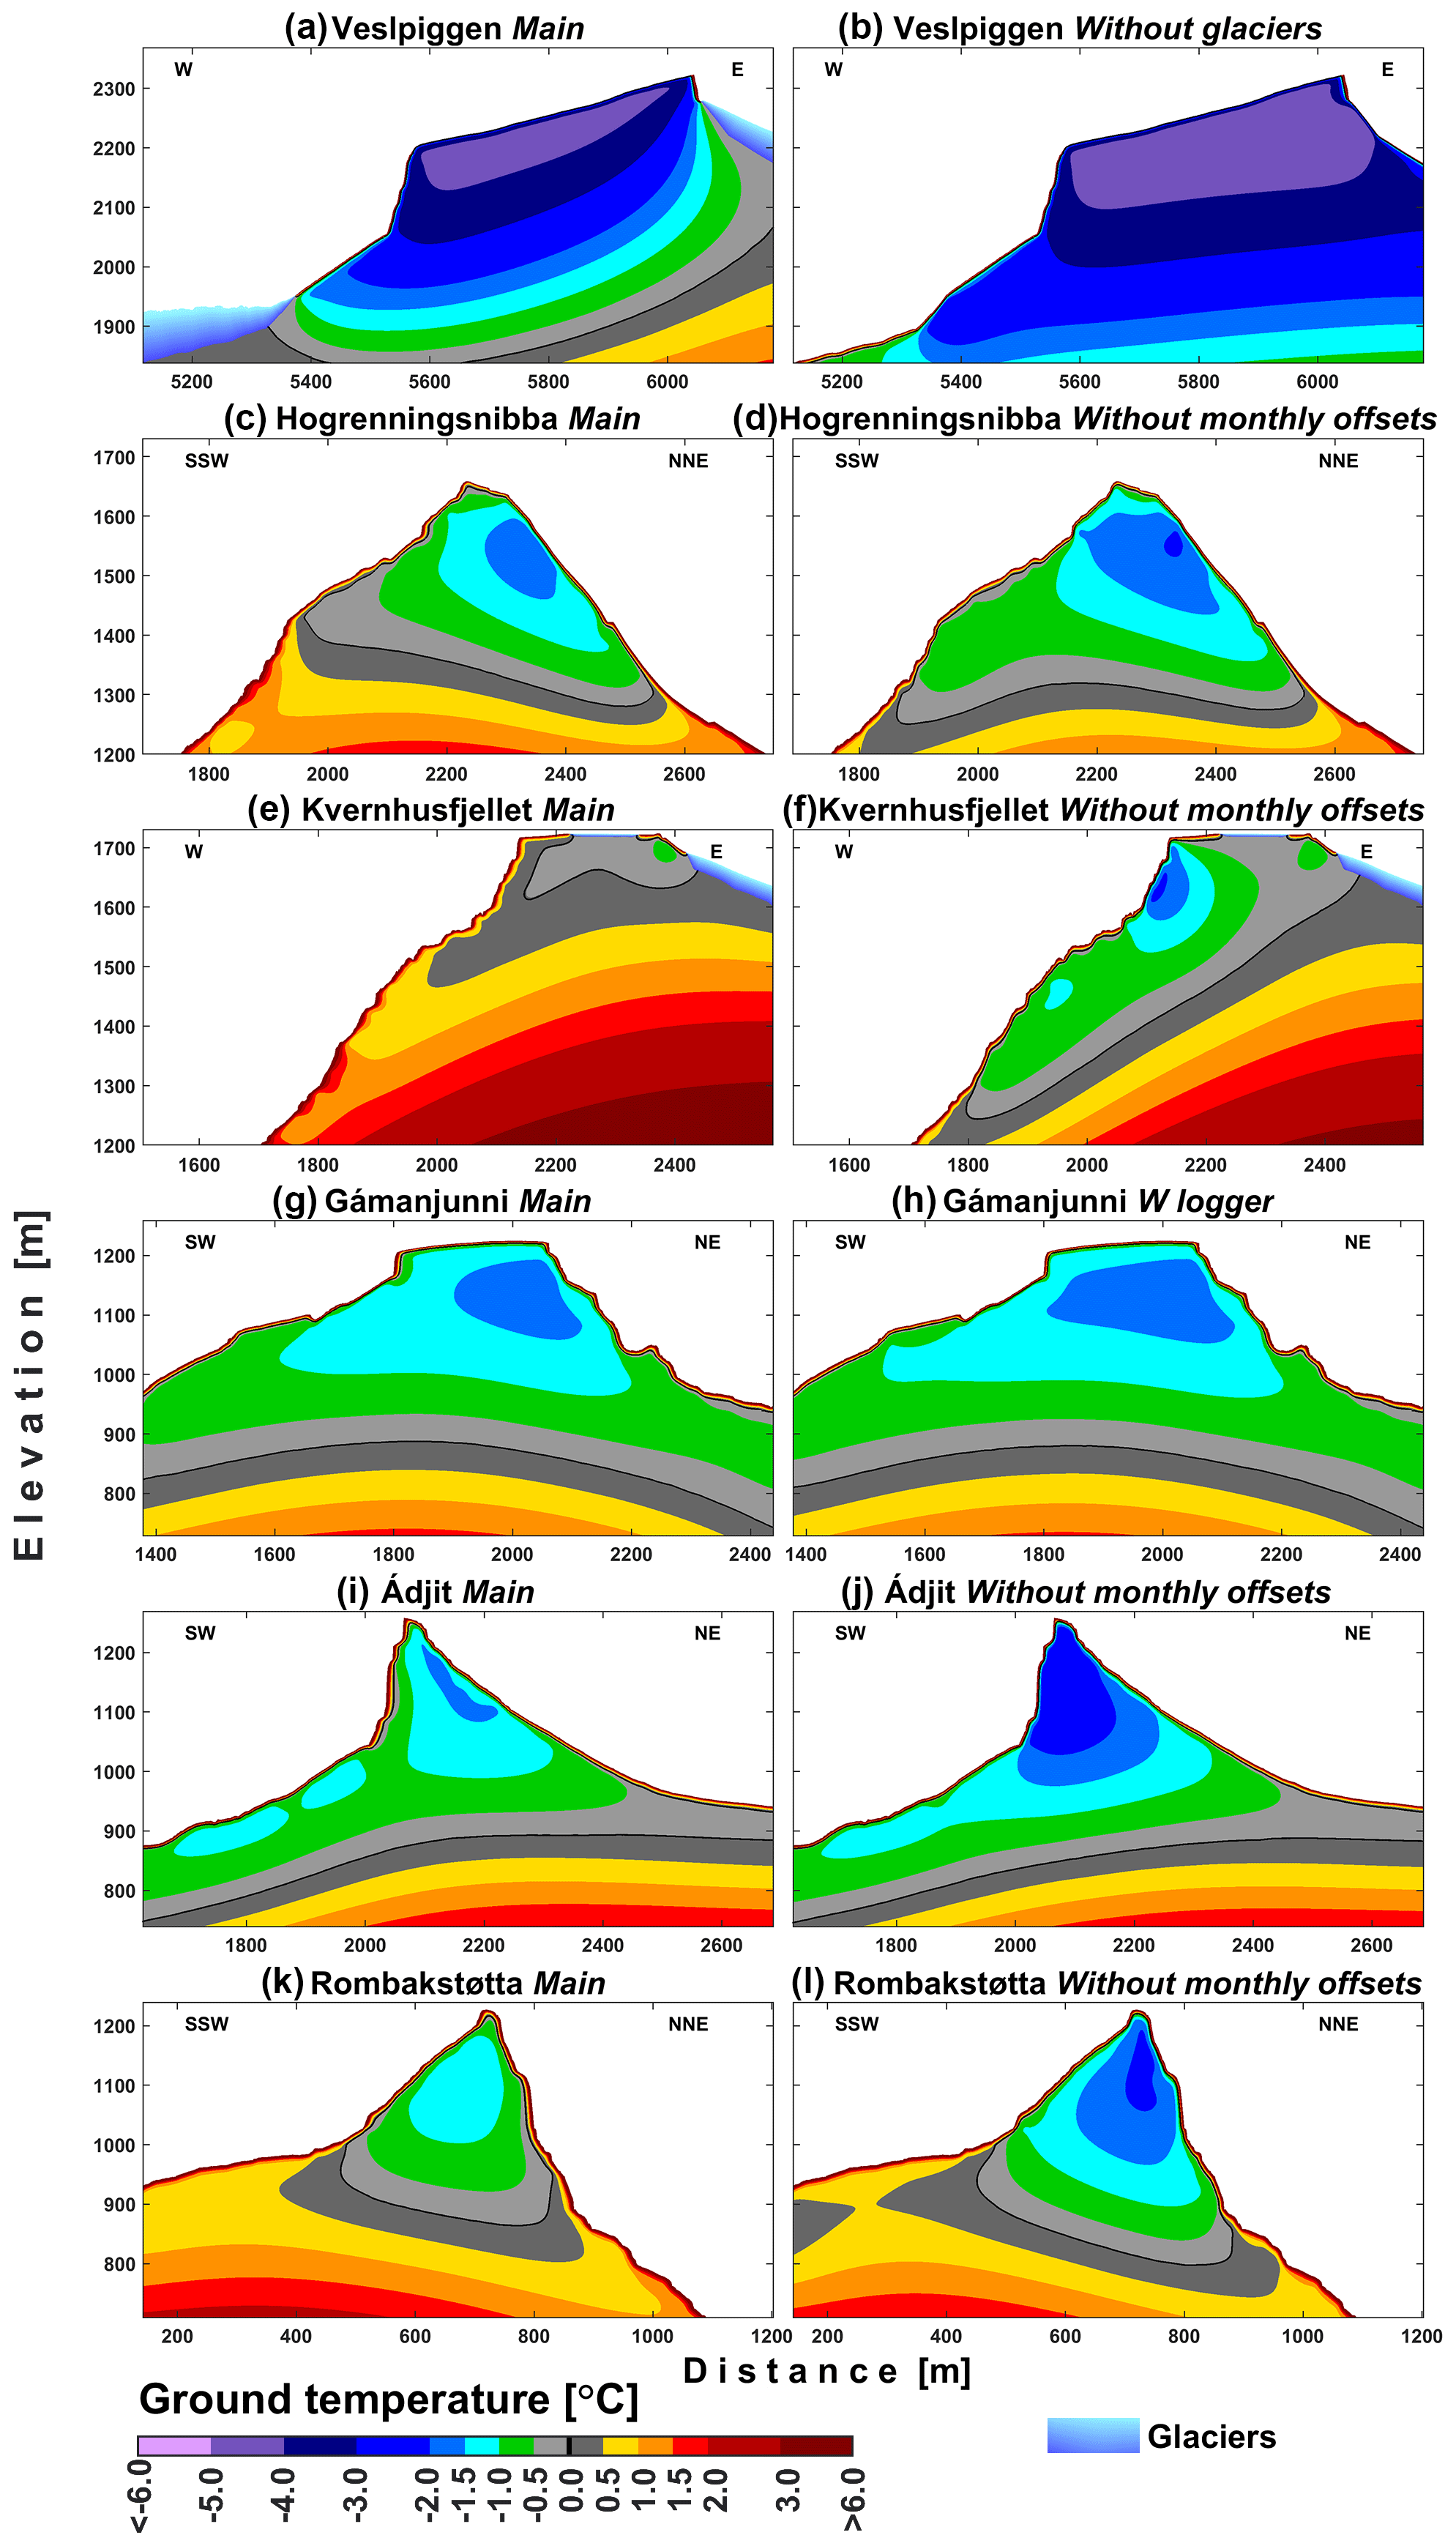
Figure 5Simulated average annual maximum ground temperature over the 2010s for various simulations.
4.2.3 Steepness and SOs
Even though Kvernhusfjellet and Hogrenningsnibba lie close together, the permafrost limits are at a higher elevation at the W–E Kvernhusfjellet profile than at the SSW–NNE Hogrenningsnibba profile. This difference results from the extent of the steepest parts, where we applied SOs, and is particularly clear when comparing the “Main” simulations with the “Without monthly offsets” simulations (Fig. 5c–f); i.e. ignoring SOs at the steeper Kvernhusfjellet leads to much lower GTs in the whole mountain than when ignoring SOs at the moderately steep Hogrenningsnibba. In the “Without monthly offsets” simulation for Kvernhusfjellet, permafrost is modelled down to 1300 m over the 2010s, whereas in the warmer main simulation the permafrost limit is at 1600 m over the 2010s. Moreover, the simulations with “Bedrock and glacier at NNE” for Hogrenningsnibba and “S logger” for Kvernhusfjellet show how the differences in geometry influence permafrost distribution, e.g. the permafrost limit is modelled at 150 m lower elevation in the former simulation (Videos 5 and 7). Furthermore, our results show that permafrost may underlie parts of the mountain where mean annual ground surface temperature (MAGST) is above 0 ∘C. For instance, the temperature from the logger at Hogrenningsnibba indicates positive MAGST at the SSW-facing slope, and permafrost underlies this slope in even the warmest simulation (“T + 1 ∘C”) due to permafrost extending there from the NNE-facing slope. The Kvernhusfjellet profile lacks a substantially colder slope, since there is a warm-based glacier on the E-facing slope; hence, permafrost in the W-facing slope is unrelated to permafrost extending from a colder slope and is degrading.
Asymmetric lower permafrost limits at Gámanjunni are not related to the higher SOs applied to the SW-facing rock wall and are rather caused by the extent of steeper terrain in the profile. The NE-facing slope is rougher and consists of several smaller rock walls, whereas the SW-facing slope encompasses mainly one smoother rock wall, less than 50 m in height. The influence of geometry is especially clear in the “W logger” simulation (Fig. 5h), where we applied slightly colder forcing to the SW-facing rock walls, and the results still show lower GT in the NE-facing slope. The results for Gámanjunni show that in the simulations with SOs, the scree slope is often colder than the sun-exposed, SW-facing rock wall. The scree slope is also less coupled to atmospheric conditions due to snow cover and greater ice content; hence, permafrost degradation occurs slower than in the rock wall, further amplifying the differences in GT between the sun-exposed rock face and scree slope during warmer periods. In the simulation “Without monthly offsets”, the rock wall is colder than the scree slope. For the Ádjit profile, the SW-facing rock wall is much steeper than the NE-facing slope, which is the reverse of Gámanjunni geometry. The simulation “Without monthly offsets” (Fig. 5j) shows the SW-facing slope as colder than the NE-facing slope due to the extent of the rock walls.
Permafrost temperatures at Rombakstøtta are slightly higher in parts of the NNE-facing slope (> 60∘) than the SSW-facing slope (< 60∘ steep), as we only applied monthly SOs on slopes steeper than 60∘. In the simulation “Without monthly offsets” for Rombakstøtta, GTs are much lower on the NNE-facing rock wall than on the SSW-facing slope (Fig. 5l).
4.2.4 Thermal impact of glaciers
GTs are simulated to be higher beneath the warm-based glaciers at Veslpiggen, with no permafrost beneath the thickest parts of the glaciers (Fig. 5a). The ground below the thinner glacier sections is, nevertheless, underlain by permafrost. Removing glaciers below the Veslpiggen Plateau leads to major changes in the main heat flux direction, from the tilted heat flux (between the E-facing slope towards the blockfield-covered plateau), to the one-dimensional vertical heat flux in the “Without glaciers” simulation (Fig. 5b; Video 11). The modelled GT in the Galdhøe Plateau is much less thermally affected by glaciers than the Veslpiggen Plateau and is almost the same in the main simulation and the simulation without glaciers (Video 14), since there are no glaciers reaching as high up the mountainside as on the flanks below the Veslpiggen Plateau. The warm-based glacier also contributes to slightly higher GTs in Kvernhusfjellet (Video 7).
4.2.5 Model sensitivity: coldest and warmest simulations
Modelled GT is lowest in the simulations without SOs (“Without monthly offsets”) or with 1 ∘C lower SAT (“T-1 ∘C”) for all profiles (Videos 1–20). The coldest simulations for Mannen and Ramnanosi reveal that warm permafrost (> −2 ∘C) or permafrost pockets could have existed in these mountains over colder periods or at the beginning of the 20th century (Videos 1 and 3). The simulations with less snow (“nF + 0.1”) show almost as low GT as the “T − 1 ∘C” simulations for some profiles (e.g. Veslpiggen, Galdhøe). For Ádjit and Gámanjunni, tested uncertainties in the water content affect the results much less than the uncertainty in the GST forcing and slightly less than the uncertainty in snow conditions.
Highest GT is most often modelled in the simulations with “T + 1 ∘C”, except for Jotunheimen. In Jotunheimen, the sensitivity simulations display the highest GTs for “Blockfields nF = 0.4”, where snow conditions are changed substantially for the widespread blockfield-covered plateaus (Videos 9, 10, 12, 13). The assumed snow conditions at the blockfield locations at Veslpiggen have a large thermal influence on deeper GTs in the rock walls. For the Veslpiggen and Galdhøe profiles, the warmest simulation “Blockfields nF = 0.4” indicates that the coldest permafrost areas are below the NW- or W-facing rock walls, whereas in the main simulation the coldest permafrost is modelled below the blockfield-covered plateaus (Video 9 and 12). SOs arising from solar radiation and SAT forcing are thus the most important factors for modelled GT within the tested values for most profiles; however, snow conditions may have a larger influence if the nF factor is changed substantially for large areas.
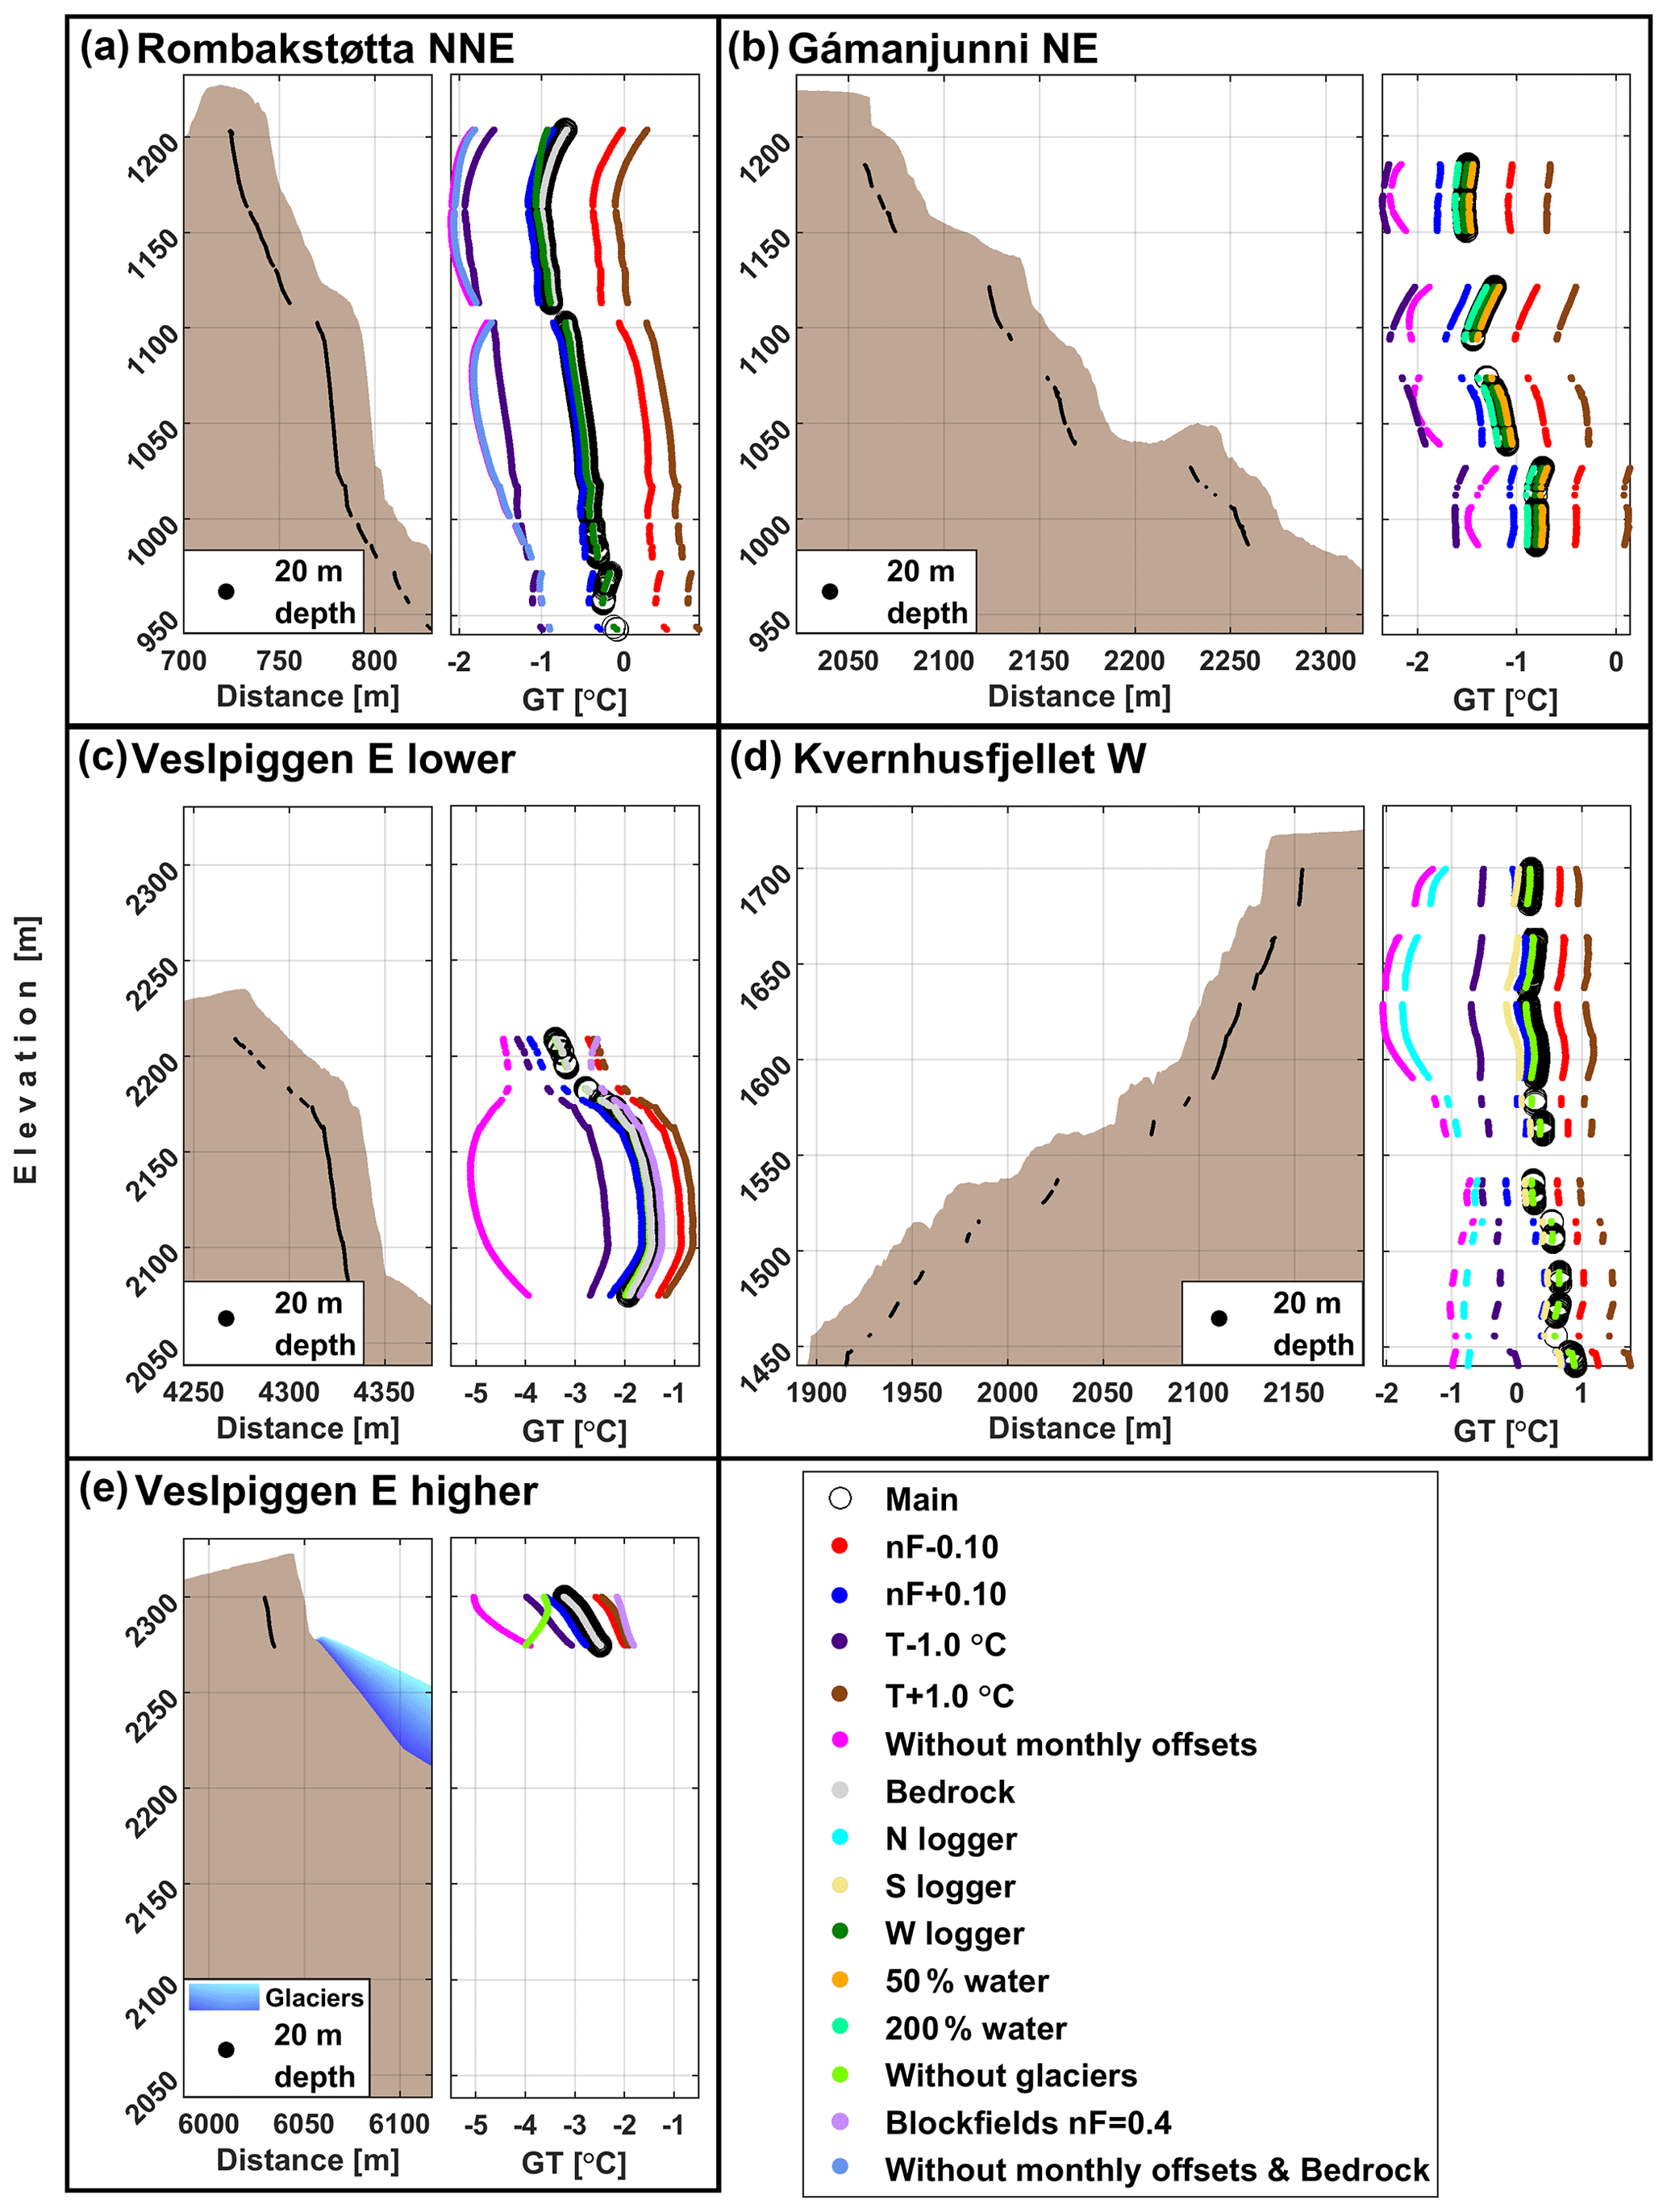
Figure 6Simulated ground temperature (GT) in rock walls at 20 m depth for various profiles over the 2010s. Right subplots show ground temperature in nodes depicted in the left subplots.
4.2.6 Elevational distribution of GT at 20 m depth
We also analyse the distribution of GT in rock walls at 20 m depth, in relation to elevation for all simulations and profiles (Fig. S22). Simulations “Without monthly offsets” generally yield the coldest midsection in a single rock wall, whereas most other simulations differ from these results, except for the simulations using data from the north-facing loggers for Kvernhusfjellet and Ramnanosi, which have small average annual SOs (∼ 0.5 ∘C). Higher rock walls (> 50 m high, e.g. Veslpiggen) have the highest GTs in their midsection for simulations with large SOs (Fig. 6c). For the smaller rock walls (e.g. Gámanjunni, Kvernhusfjellet), the GT at 20 m depth changes with elevation, depending on the distribution of the various terrain types in the vicinity of a single rock wall (Fig. 6b and d). GT increases with elevation if the terrain above a single rock wall is gentler than the terrain below this single rock wall, and the opposite is modelled if the terrain above is steeper than the terrain below. Thus, 20 m GT distribution in smaller rock walls is predominantly due to snow cover distribution in the rock wall vicinity. The thermal influence of snow cover on the plateau is also evident for larger rock walls below mountain plateaus (e.g. Rombakstøtta), where the GT increases with elevation from the midpoint of a rock wall section (Fig. 6). The uppermost east-facing rock wall at ∼ 2300 m at Veslpiggen in Fig. 6e has glaciers below and blockfields above, and GT decreases with elevation due to the large thermal influence of the glaciers.
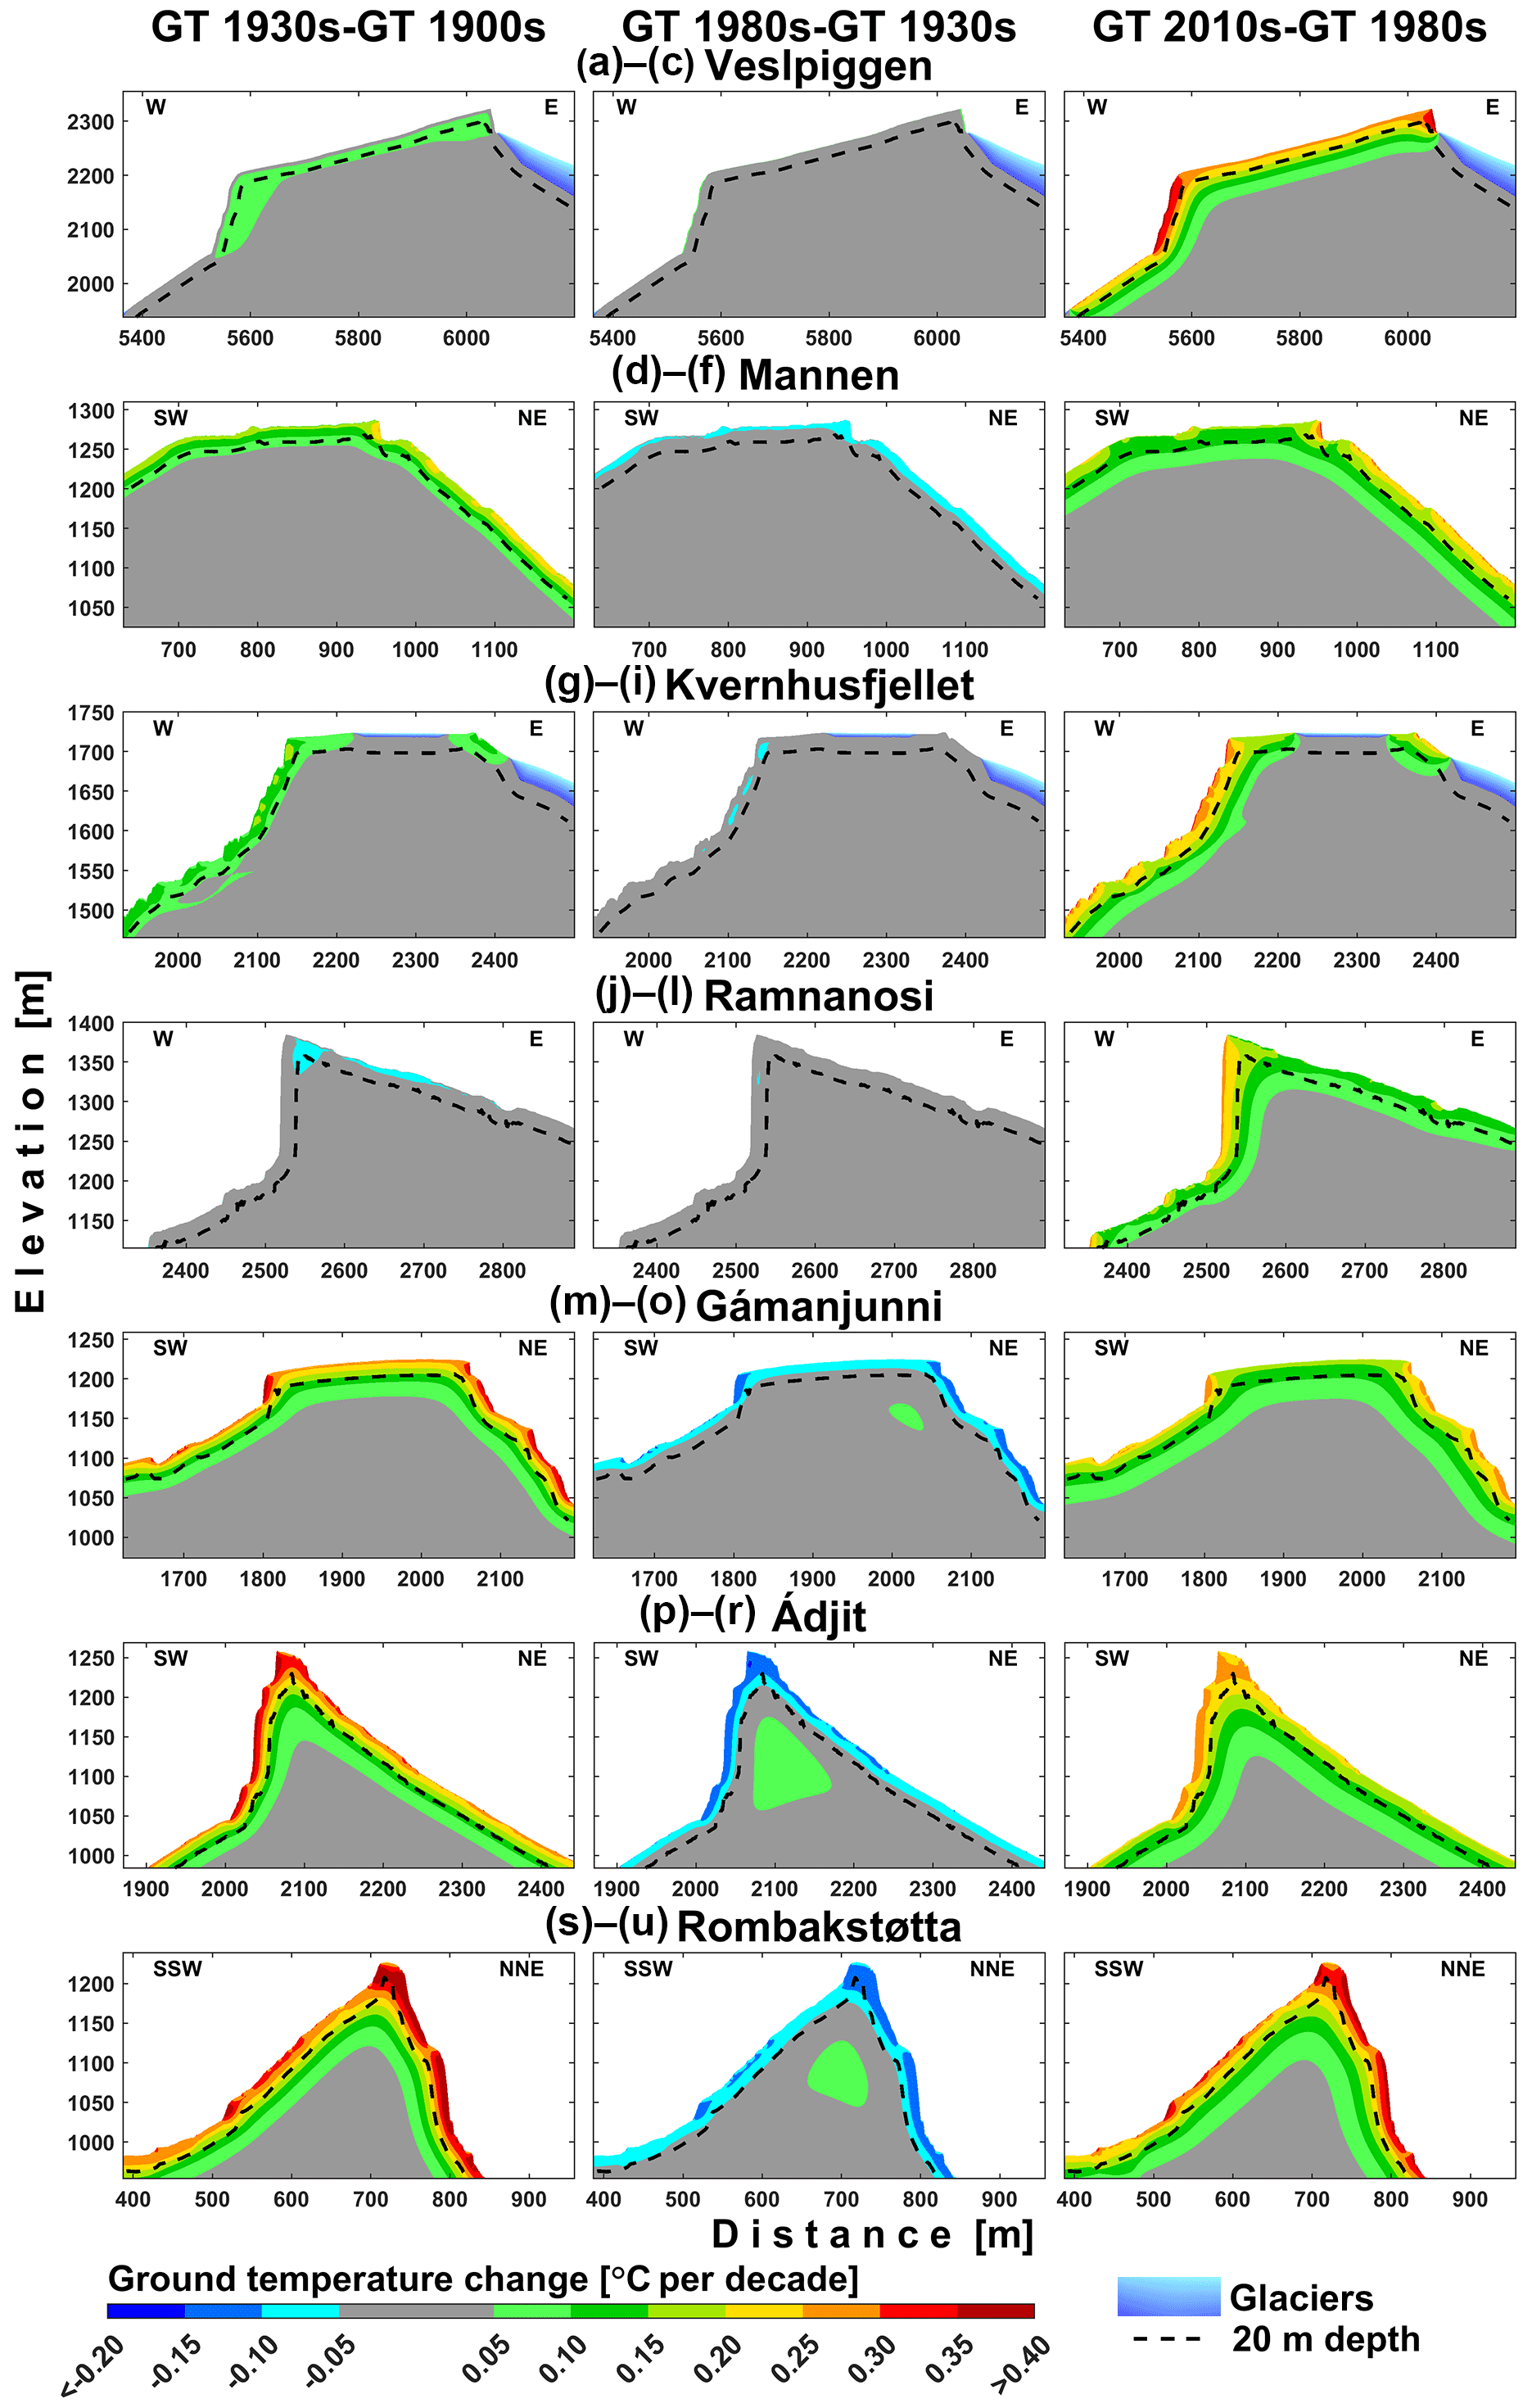
Figure 7Rate of change in simulated decadal mean ground temperature (GT) for the various profiles between the following decades: (1) the 1900s and 1930s, (2) the 1930s and 1980s, and (3) the 1980s and 2010s.
4.3 Ground temperature trends in rock walls
Modelled GT trends since the 1900s are shown in Fig. 7. The steepest parts of the profiles are the most responsive to both warming and cooling trends in GST. However, modelled GT in the blockfields in Jotunheimen is also strongly coupled with SAT in our simulations, since we applied a high nF factor. Furthermore, 2D effects largely influence modelled GT trends in the uppermost parts of the narrow mountain peaks (Ádjit, Rombakstøtta).
The 1900s–1930s
Modelled GT at 20 m depth increased by less than 0.1 ∘C per decade at the sites in southern Norway, except for Ramnanosi, which had a negative trend in SAT10a at the beginning of the 20th century (Fig. A1). The sites in northern Norway had the largest SAT10a rise at the beginning of the 20th century (Fig. A1); therefore, simulated GT increase is larger between the 1900s and 1930s than between the 1980s and 2010s.
The 1930s–1980s
Modelled GTs at 20 m depth remained similar (< 0.05 ∘C per decade) between the 1930s and 1980s for the sites in southern Norway. Modelled GT in northern Norway slightly decreased at depths below 20 m and increased at depths deeper than 20 m in some areas due to a rise in atmospheric temperature in the early 20th century.
The 1980s–2010s
Simulated GTs at 20 m depth increased between the 1980s and 2010s with a rate of 0.1–0.35 ∘C per decade (Fig. 7). The 1980s–2010s ground warming reaches deeper than the 1900s–1930s ground warming. Rombakstøtta has similar cooling and warming trends to the other sites in northern Norway; however, increases of both SAT10a and simulated GT are higher since the 1980s (Fig. 7u).
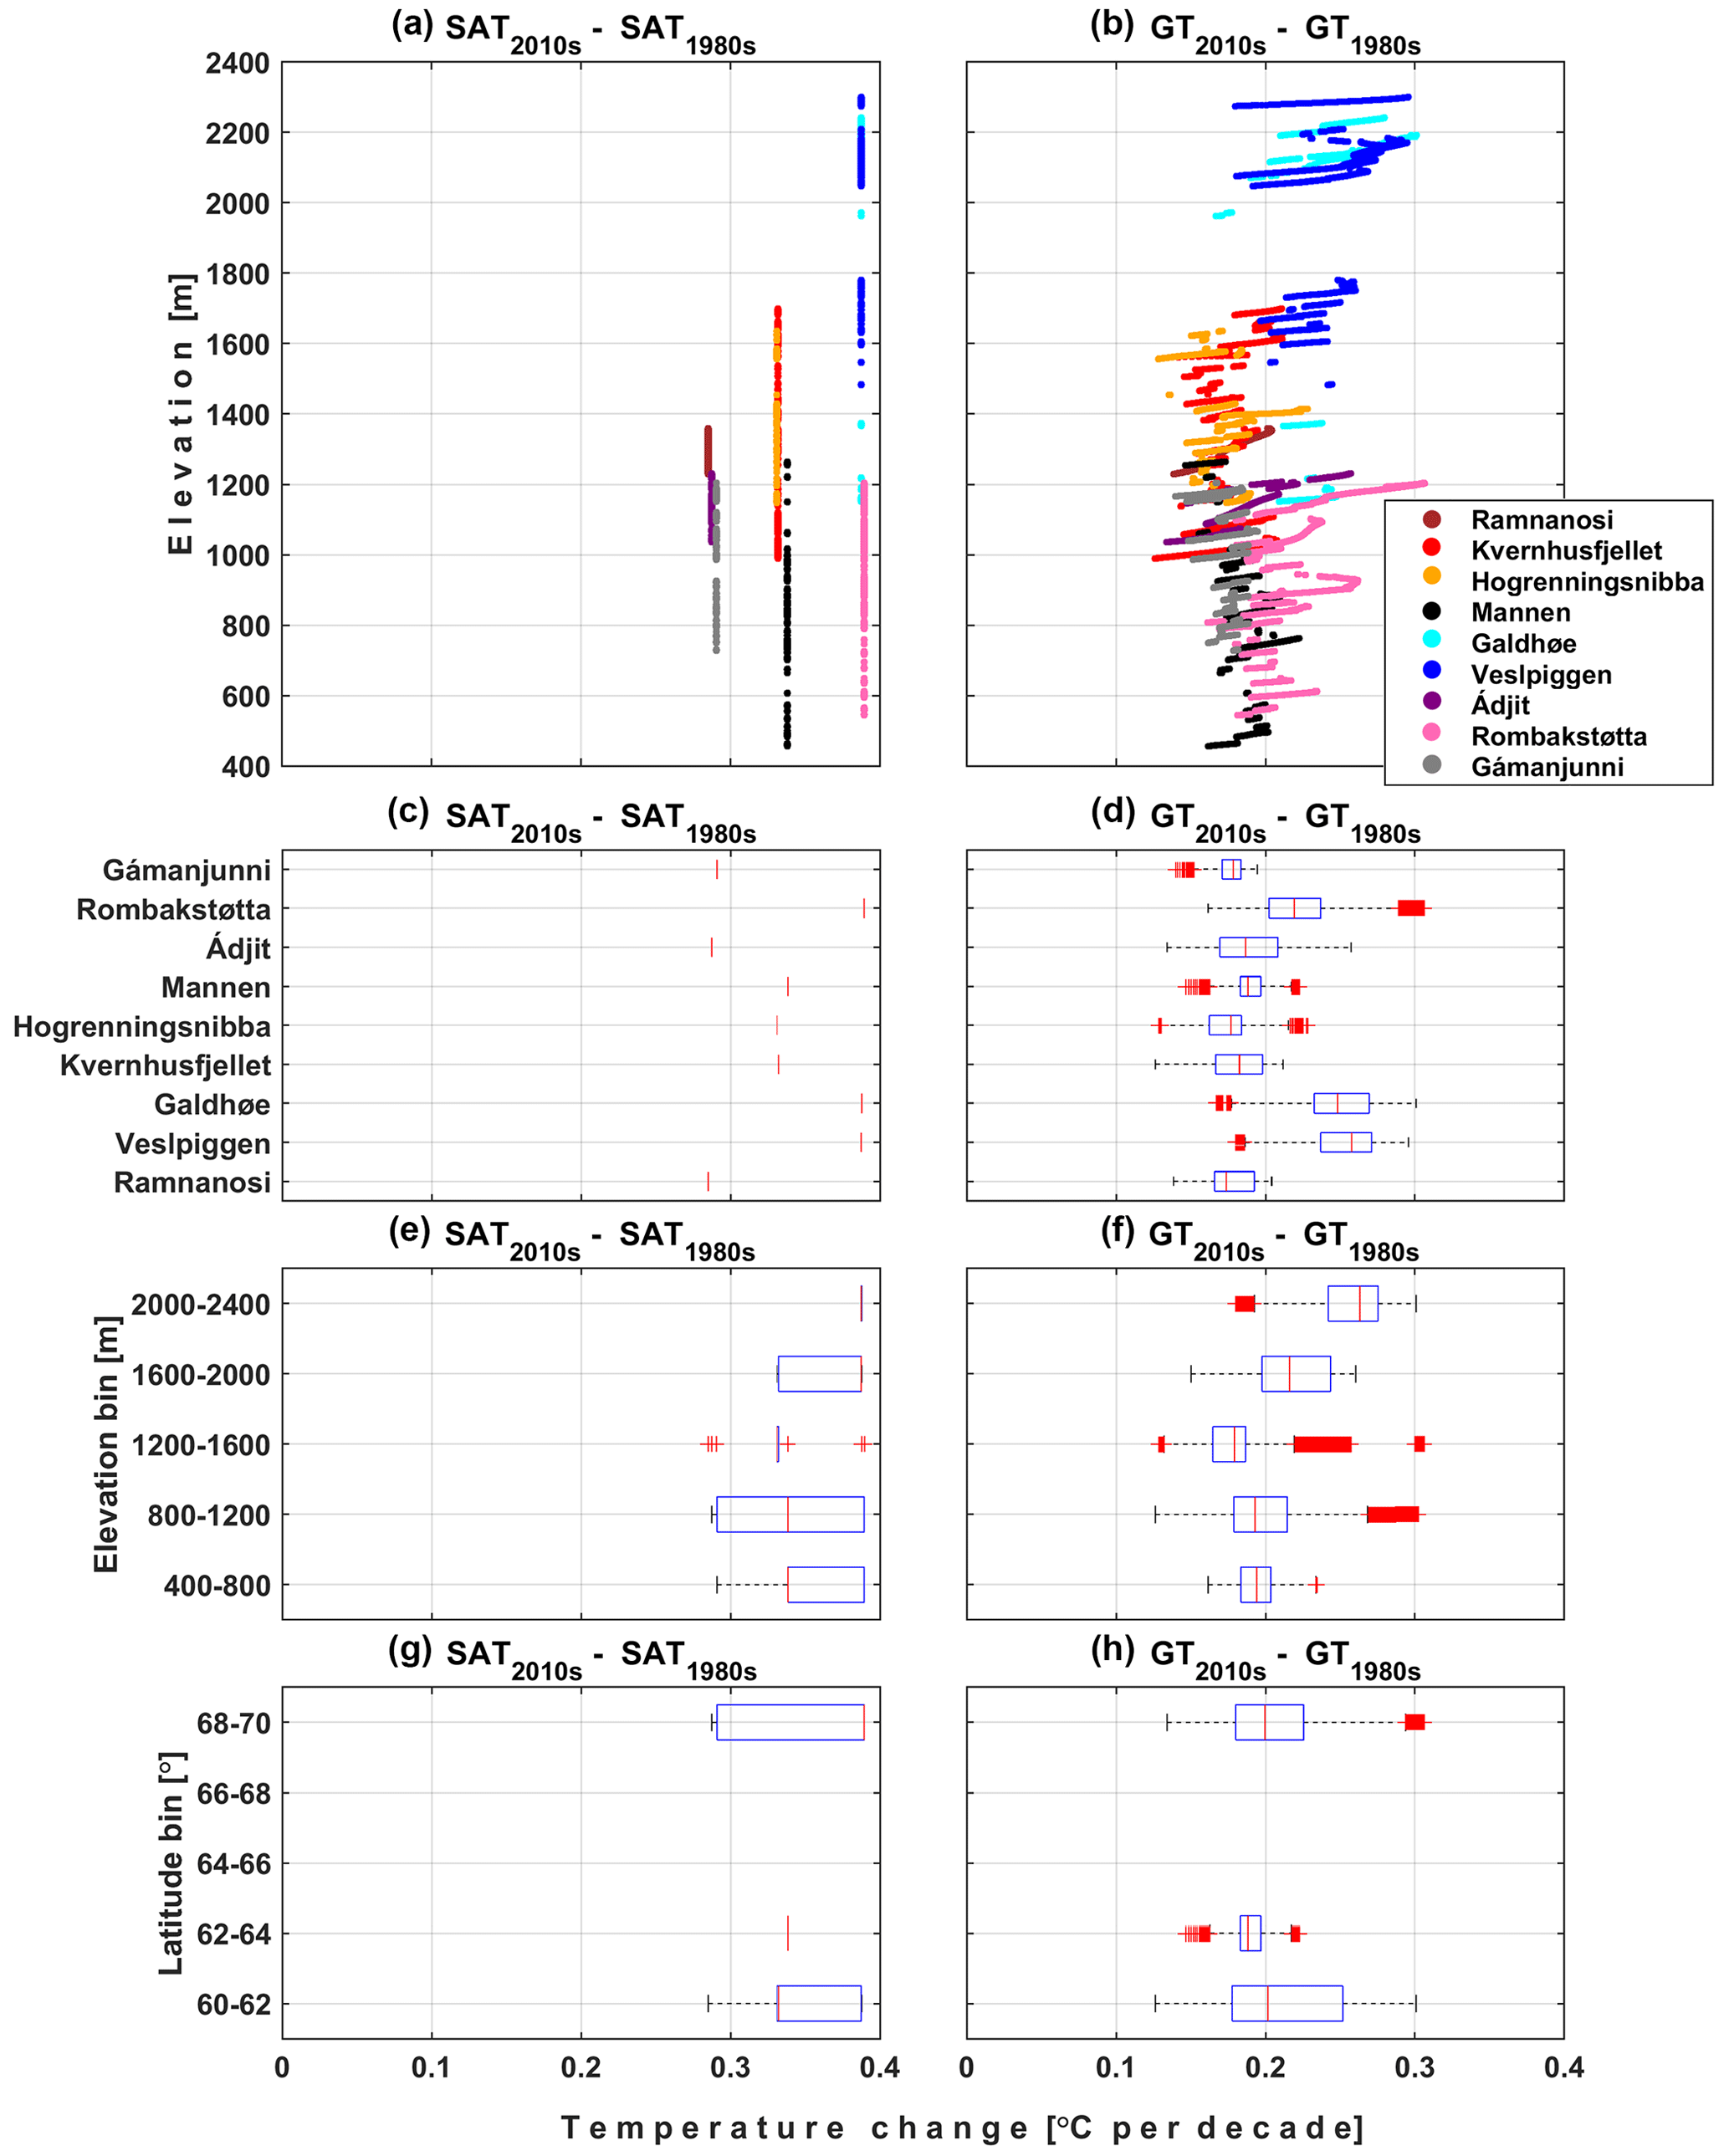
Figure 8Modelled rates of surface air temperature (SAT) and ground temperature (GT) change at 20 m depth between the 1980s and 2010s for all nodes below steep rock slopes (slope gradient > 60∘). Lower subplots: boxplots with SAT and GT rise between the 1980s and 2010s for (c, d) every profile, (e, f) 400 m elevation bins and (g, h) 2∘ latitude bins.
Over the last 4 decades, SAT at the rock wall elevations along the profiles increased by 0.25–0.4 ∘C per decade, with the largest warming rates in Jotunheimen and at Rombakstøtta (Fig. 8a, c, e and g). We reconstructed the same SAT trends along each profile elevation wise, whereas modelled trends of GT at 20 m depth have a more complex pattern elevation wise (Fig. 8b, d, f, and h); however, the largest simulated values are still in Jotunheimen and at Rombakstøtta. The simulation results show that GT at 20 m depth increased on average by 0.2 ∘C per decade in the rock walls. The Jotunheimen area has the largest modelled mean 20 m GT increase (0.25 ∘C per decade), likely because we allowed blockfield-covered plateaus to be relatively strongly coupled with SAT; hence two-dimensional warming is more effective in rock walls below plateaus. Ádjit has larger warming rates than Gámanjunni, especially at higher elevations, pointing to the increasing importance of the two-dimensionality since the former has a sharper peak. In general, modelled warming rates seem to increase towards the uppermost part of a single rock wall section. We simulated similar patterns in the previous simulations using the seNorge data set when SAT increase rates in some cases decreased with elevation. The 2D effects are expected to increase with elevation in a single rock wall just based on the topography of the study sites. For a 2D profile, the distance from surface above a rock wall to a 20 m depth in a rock wall below is shorter than the distance from surface below a rock wall to a 20 m depth in a rock wall above. Generally, ground warming rates at 20 m depth seem to be independent of latitude (Fig. 8h) and slightly increase with elevation (Fig. 8f).
Sensitivity of the modelled GT rise at 20 m depth between the 1980s and 2010s (Fig. S23) shows that for most simulations warming rates increase with elevation. There are, nevertheless, a few exceptions.
-
Warming rates may decrease with elevation for rock walls that are convex in the upper parts due to the assumed snow accumulation in the less steep parts.
-
For parts of rock walls where permafrost thawed at 20 m depth between the 1980s and 2010s, warming rate is larger (some simulations for Ádjit, Hogrenningsnibba, Ramnanosi, Rombakstøtta). Even small latent heat effects in permafrost slightly retard warming, and this effect disappears when permafrost is absent. However, warming retardation due to the latent heat effects depends on the ice content and results from the assumed 5 % vol. ice content for fully frozen ground; thus, for lower ice contents, latent heat effects are smaller.
Glaciers reduce ground warming in nearby steep rock faces, e.g. the east-facing rock wall in Jotunheimen has higher modelled GT increase in the simulation “Without glaciers” (Fig. S23). Otherwise, the assumed snow conditions have the greatest influence on simulated warming rates, i.e. any snow accumulation in rock walls leads to lower warming rates. Snow cover in the rock wall vicinity also influences modelled warming rates, e.g. rock walls below plateaus or rock ledges in Jotunheimen have smaller warming rates if more snow is applied above them.
5.1 Limitations and strengths
5.1.1 Subsurface heat transfer
The CryoGrid 2D model is based entirely on thermal conduction, which is the dominant heat transfer process in the ground (Williams and Smith, 1989). However, non-conductive thermal processes along with discontinuities and within the cracks, such as air convection or advection by moving water, may contribute to the subsurface thermal regime (e.g. Draebing et al., 2014; Magnin and Josnin, 2021). Many discontinuities may exist in the bedrock and may be further widened by frost weathering processes, allowing for the generation of pathways for advective heat transfer to occur. The exact configuration of bedrock discontinuities is unavailable, making it unfeasible to include them in our modelling. A study by Hasler et al. (2011b) in the Swiss Alps showed that whereas heat advection by percolating water has a negligible thermal impact, air ventilation likely causes thermal offsets similar to the offsets in coarse sediments, and values of up to 3 ∘C are reported. Since cracks exist on the plateau above Mannen (Saintot et al., 2012) and Ramnanosi, air ventilation could lower GT in the area; however, since thick snow cover accumulates on the Mannen Plateau, plugging of the cracks with snow could prevent air ventilation (e.g. Blikra and Christiansen, 2014). Another study by Moore et al. (2011) analysed deep GT profiles and attributed their disturbed profiles to localised convection cells in the fractures, whereas seasonal water infiltration had a minor influence on GTs. Nevertheless, several studies still emphasise the importance of advective heat input for GTs in permafrost-underlain terrain (e.g. Krautblatter and Hauck, 2007; Hasler et al., 2011a; Magnin and Josnin, 2021). A study by Magnin et al. (2017a) showed, however, that non-conductive thermal processes are only relevant in the upper 6 m below the ground surface. It is also noteworthy that conductive heat transfer in discontinuities filled with ice would alter GTs, i.e. ice infills in permafrost could act as major heat sinks (Magnin and Josnin, 2021). If ice- or water-filled fractures exist inside the bedrock, this would locally delay permafrost thawing or formation due to latent heat effects (Magnin and Josnin, 2021).
Air convection is likely responsible for the observed negative thermal anomalies in coarse-sediment landforms, such as blockfields (Heggem et al., 2005), rock glaciers (Wicky and Hauck, 2020) and talus slopes (Lambiel and Pieracci, 2008; Wicky and Hauck, 2017). Studies by Juliussen and Humlum (2008) and Gruber and Hoelze (2008) show examples of how conductive heat transfer could account for the negative thermal anomalies in the blockfields. Even though views of these authors on the governing mechanisms could be implemented in our model, the thermal processes responsible are yet to be proven. In our study, negative thermal anomalies in the blockfields and rock glaciers are at least partly accounted for through the larger nF factors than in the other sediment cover types.
Furthermore, the CryoGrid 2D model considers the 2D heat diffusion, which is an advance compared with the 1D case; nevertheless, heat transfer processes in complex terrain occur three-dimensionally (Noetzli et al., 2007; Noetzli and Gruber, 2009). Myhra et al. (2017) argued that even though this is a limitation of the CryoGrid 2D model, applying it to the Norwegian mountains with flat plateaus and long valleys could be adequate. We note that our transects are only approximately suitable for two-dimensional heat conduction, yet they still follow the general characteristics of the slope and are representative of their surroundings. Magnin et al. (2017a) employed a similar 2D model to ours and validated their data against rock wall boreholes. The authors claimed that the 3D effects were likely of little importance for GT, and the 2D modelling approach was sufficient for sharp topography in the European Alps. Despite these findings, our 2D approach could potentially underestimate the GT trends in areas where the GST signal penetrates from more than two sides, as modelled in Noetzli and Gruber (2009).
5.1.2 Model forcing
The CryoGrid 2D model was forced using lapse-rate-adjusted SATs, together with the measured average monthly SOs in steep rock faces. Even though the number of meteorological stations is low in the mountains in Norway, they are still well correlated with the rock wall logger data after adjustments for the monthly SOs. There are uncertainties in lapse rates, and the reconstructed long-time forcing is especially uncertain. Moreover, we had to use the seNorge data set for certain sites, which is based on the spatial interpolation between the in situ data (Lussana et al., 2018).
Furthermore, we only force the model directly with GST, instead of including a surface energy balance, as for instance in Noetzli et al. (2007). We applied the same SOs to each year, based on the average offsets between GST and SAT, which could otherwise be modelled using surface energy balance. However, we lack data to be able to implement such an approach at the timescales used in this study. Snow cover and solar radiation are the main controlling factors for GST in the rock walls (Haberkorn et al., 2015), and snow cover governs the distribution of GST in the gentle terrain in Norway (Farbrot et al., 2011; Gisnås et al., 2014); hence, our methods account for the most important SOs measured in Norway. Magnin et al. (2017a) showed that a similar approach, i.e. without energy balance and consideration of snow accumulation in rock walls, was appropriate to reproduce temperature below steep flanks of sharp mountain peaks at depths > 6 or > 8 m by comparing the modelled temperature to the measured temperature profiles in boreholes. For shallower depths, additional effects of non-conductive heat transfer and local snow accumulations, that were ignored in the modelling, caused substantial temperature differences.
Our analysis of the 2 h temperature suggests that solar radiation is most likely the main controlling factor for SOs in Norwegian rock walls, as also shown in Magnin et al. (2019). Large increases in maximum daily temperature can be seen in the rock wall temperature series, pointing to solar radiation as the dominant source of energy that modifies GSTs. North-facing slopes in Norway can receive enough shortwave radiation to have mean annual SOs of around 0.5–1.5 ∘C (Fig. 3); hence, ignoring SOs would lead to much lower GTs even for this exposition. Similar ranges of average SOs were measured in the small cliffs in the north-facing loggers in northern Norway (Frauenfelder et al., 2018). Furthermore, we note that we did not apply non-nival SOs to moderately steep slopes (< 60∘ gradient), since it is unlikely that the observed non-nival SOs are as large as in the monitored slopes. For instance, Hasler et al. (2011b) suggested that late-lying snow lowers GST in moderately steep slopes, due to the reduction of the incoming shortwave radiation.
5.1.3 Snow distribution
One of the CryoGrid 2D model limitations is the lack of a snow domain; hence, we apply nF factors for the gentle and medium-steep terrain. Preferably, snow depth should be described dynamically, both temporally and spatially, including snow redistribution by avalanching and wind. However, research concerning snow distribution on steep rock walls in Norway is lacking; hence there are large uncertainties in snow depth and its timing. Studies we reviewed from elsewhere had contrasting results about snow distribution in the steep rock walls: (1) certain studies suggest that steep slopes above a certain threshold (e.g. more than 45, 50, 60 or 70∘) cannot accumulate permanent snow cover due to avalanching or wind drift (Blöschl et al., 1991; Kirnbauer et al., 1991; Blöschl and Kirnbauer, 1992; Winstral et al., 2002; Machguth et al., 2006), and (2) other studies, often using airborne or terrestrial laser scanning, show that almost any slope gradient can accumulate snow (Wirz et al., 2011; Sommer et al., 2015). The latter group of studies, nevertheless, recognises that snow cover is limited in steeper terrain and accumulates less snow than gentler terrain. Furthermore, the studies use various parameters as the most crucial to explain snow distribution in steep terrain, e.g. (1) snow-free slope angle (Blöschl and Kirnbauer, 1992; Sommer et al., 2015), (2) terrain–wind interaction (Winstral et al., 2002; Wirz et al., 2011) and (3) elevation and terrain roughness, which possibly correlates with the summer slope angle (Lehning et al., 2011). We note, however, that we used a high-resolution DEM of at least 1 m resolution to construct each profile, and 1 m DEM was considered precise enough to detect rock ledges in the Swiss Alps, where snow can accumulate (Haberkorn et al., 2017), and such areas have snow cover in our study. Snow distribution in rock walls in Norway remains to be quantified, e.g. using LIDAR-scanning, and its governing factors recognised.
5.1.4 Thermal influence of snow
Snow cover could either insulate or cool the ground. The overall effect of snow cover on GT is complex because it depends on snow thickness, duration, timing, melting processes within a snowpack, snow structure (Zhang, 2005), sun exposure (Magnin et al., 2017b), MAAT, substrate, the thickness of the active layer, and ground moisture (Throop et al., 2012) or snow density. Snow cover affects GT in both steep and gentle terrain in multiple ways.
-
As an additional buffer layer with low thermal conductivity, snow insulates the ground, given that SAT is lower than GT and snow cover is sufficiently thick, e.g. at least 0.6 m in the gentle terrain (Luetschg et al., 2008) or even 0.2 m in the rock walls (Haberkorn et al., 2015). This is likely the most important net thermal impact of snow on the GTs in Norway. Observed differences between GST and SAT are positive at most permafrost sites in Norway (Farbrot et al., 2011), and as shown in this study (Fig. 3), all measured mean annual SOs in the rock walls are positive; hence, the overall annual cooling of the ground surface due to snow cover is not observed in Norway. We note that the installed rock wall loggers in Norway should measure only snow-free rock walls by design (Magnin et al., 2019); hence, the available measurements are insufficient to preclude cooling due to snow cover.
We assumed that rock walls are snow-free because our analysis of the measured rock wall temperature in Norway indicates only minor thermal influence of snow, as also mentioned in Magnin et al. (2019). We note, however, that the computed mean monthly SOs (Fig. 3) also account for thermal effects of snow cover if there are any; hence, rock walls are not sensu stricto snow free in this study. For instance, W- and N-facing loggers at Gámanjunni have approximately 1 ∘C higher temperature than the south-facing logger (Fig. 3e) in December and January, which is likely due to snow cover. The temperatures from the rock wall loggers at Rombakstøtta are probably the most influenced by snow, e.g. the temperature from the W-facing logger is lower than the temperature from the N-facing logger in May (Fig. 3d), and the temperatures from both the E- and W-facing loggers sometimes show much smaller standard deviation of daily temperatures compared with the temperature from the N-facing logger, which is likely the least snow-influenced logger in this area.
-
Snow cover increases albedo of the surface, thus reducing absorbed shortwave radiation, meaning late-lying snow would delay or reduce the spring warming of the ground (e.g. Hasler et al., 2011b; Magnin et al., 2017b). This cooling effect was concluded to be a major cooling mechanism on the thinly snow-covered rock walls in the Mont Blanc massif (Magnin et al., 2015). However, this cooling hypothesis was concluded to be of little importance in the study by Haberkorn et al. (2017), who show that sun-exposed snow-covered rock walls are typically warmer than snow-free rock walls due to reduced ground heat loss in winter, i.e. point 1 above. Moreover, snow requires large energy inputs to melt; hence GT is lower than SAT during snowmelt; however, this usually lasts for a short time and may be unimportant on annual timescales (Zhang, 2005). However, meltwater percolating inside cracks can refreeze and act as an additional heat source or favour accelerated melting of the cleft ice (Hasler et al., 2011a).
-
High emissivity of snow increases the outgoing longwave radiation; however, its high absorptivity has the opposite effect. Hence, thermal impact of emissivity and absorptivity on snow temperature is influenced by atmospheric conditions (Zhang, 2005).
-
During autumn, thin snow cover could lead to an enhanced conductive heat flux from the ground due to large thermal gradients between the cooled snow surface and warmer upper ground layers (Keller and Gubler, 1993; Luetschg et al., 2008). Furthermore, in the low-snow years, GT at the top of permafrost is relatively constant during freezeback and may be higher than GST that is coupled to SAT, leading to positive thermal offsets (Palmer et al., 2012). In addition, temporary ground cooling was observed at several sites across Switzerland during one or two winters in 2015–2017, when snow cover arrived very late and was thinner than usual (PERMOS, 2019; Noetzli et al., 2020). The latter cooling effect was not recorded at steep bedrock sites, where GT is usually insensitive or less sensitive to snow cover changes (PERMOS, 2019; Noetzli et al., 2020).
-
Deposition of snow may reduce ventilation effects in clefts (Hasler et al., 2011b).
-
If snow accumulates under rock walls or on rock ledges, the incoming shortwave radiation may be reflected diffusively towards snow-free parts of the rock wall, hence warming it. The latter effect is less investigated in permafrost studies, although its importance was emphasised in the surface energy balance modelling of the high-arctic rock walls in Svalbard by Schmidt et al. (2021) and mentioned in Fiddes et al. (2015). We speculate that the reflected shortwave from surrounding snow-covered surfaces may be important in some rock wall aspects in Norway because measured rock wall temperatures at 2 h intervals often show a distinct daily temperature distribution due to shortwave solar radiation during late winter or spring. Such a temperature increase is even measured in February in northern Norway. A similar temperature increase is not observed at the same magnitude during autumn, when snow is less common. We recognise, however, that this seasonality could be related to cloud cover, issues with lapse rate or cooling effects of thin snow cover during autumn. Additionally, rock walls just above glaciers, e.g. in Jotunheimen, may likely be affected by reflected solar radiation from the glaciers all year round, and measurements from the east-facing rock walls just above the glaciers show particularly large SOs (Fig. 3g). Hasler et al. (2011b) also state that south- and east-facing rock faces above glaciers in the Swiss Alps experience extreme solar radiation. Nevertheless, the observed SOs in Jotunheimen could be a result of the dark rocks in this area, which have a lower albedo compared with the bedrock at the other sites presented in this study.
5.2 Comparison to borehole data, geophysical surveys and other studies
5.2.1 Western Norway
At Mannen, both the geophysical surveys presented in Etzelmüller et al. (2022) and our thermal modelling suggest that permafrost may only occur sporadically in this area. Nevertheless, high resistivity values (> 20 kΩm) measured in this area could also reflect very good water drainage conditions, due to highly fractured bedrock or even ion-poor pore water (Dalsegg and Rønning, 2012).
5.2.2 The Jotunheimen Mountains
Results from thermal simulations, both the modelled GTs and deeper warming rates, are in good agreement with the available borehole data in the Jotunheimen Mountains (Fig. S24 and Table S5), although there are variations in snow conditions between the boreholes; hence, we compared the measurements to various snow sensitivity simulations. For the BH5 borehole in Jotunheimen (Fig. 1d) and nearby gentle slopes, geophysical surveys performed in 1999 and 2010, together with numerical modelling, indicated the degradation of permafrost over the intervening decade (Isaksen et al. 2011). We compared the modelled subsurface thermal fields for Galdhøe to the geophysical surveys from 1999 and 2010, and our results show a similar pattern of possible permafrost degradation in this marginal permafrost area (Fig. S25). The results are especially similar for the sensitivity simulation with less snow (“nF + 0.1”).
5.2.3 Northern Norway
Three-dimensional GT modelling of the Polvartinden Mountain, around 30 km north-east of Ádjit, which suggested the lower permafrost limits at 600–650 m over the last few years (Frauenfelder et al., 2018), is in agreement with our results. Furthermore, the local permafrost limit at an elevation of around 700 m, derived from various temperature measurements at the Jettan rockslide (Blikra and Christiansen, 2014), 12 km NW of Gámanjunni, is in accordance with our modelled permafrost limit for less sun-exposed slopes. The simulations by Etzelmüller et al. (2022) for Gámanjunni show a slightly different subsurface GT field, due to different model forcing. However, geophysical surveys reproduce the main patterns of the modelled subsurface thermal field at Gámanjunni presented in our study and Etzelmüller et al. (2022). The geophysical surveys at Gámanjunni indicate (1) the thermal influence of the NW and SW facing rock walls, (2) higher resistivity (i.e. cooler conditions) in the scree below the SW-facing rock wall and (3) a warmer subsurface below the snow-covered plateau. In comparison with Etzelmüller et al. (2022), our thermal fields show that (1) and (2) agree even better with the geophysical surveys because we accounted for the additional surface offsets in the SW-facing rock wall. The conductive thermal field is slightly perturbed by the non-conductive heat transfer mechanisms in larger fractures. Etzelmüller et al. (2022) argued that comparison of the modelled ground temperature and geophysical surveys is useless at smaller scales, due to high resistivity variations in rough terrain, influenced by cracks and fractures, strong topographic variations and local water infiltration.
5.3 Thermal regime in steep slopes
Due to the strong coupling of GST and SAT in rock walls, rock walls may have lower GT compared with the surrounding terrain, and permafrost aggradation may occur much faster in them than in other types of terrain in the decreasing SAT conditions, as shown by Myhra et al. (2017). However, sun-exposed large rock walls may allow more heat to enter the mountain. One example is Kvernhusfjellet, where the lower limit of permafrost is modelled at 1620 m over the last few years, which is higher than at the moderately steep Hogrenningsnibba, where the modelled permafrost limit has been at 1450 m. In Norway, permafrost research on moderately steep terrain is yet to be conducted, since there are large uncertainties in both snow distribution and SOs in moderately steep terrain in Norway. However, our results agree with the conclusions of Magnin et al. (2019) that the permafrost limits may be higher in the sun-exposed rock walls than in the less-steep terrain.
We constructed meshes for various topographies and extended the previously presented 2D modelling for Norway (Myhra et al., 2017), mainly by including SOs. Whereas previous results mostly showed the midsection along a single rock wall as the coldest, our simulations show the midsection, or more precisely the lower portions of the midsection, in some cases as the warmest along the rock wall (at 20 m depth), barring the north-facing rock walls. The sensitivity simulations where we omitted SOs show the same results as in Myhra et al. (2017) with the much colder midsections. Because the rock wall data from Norway indicated average annual SOs of at least 0.5 ∘C, the colder midsections in the north-facing slopes are less pronounced in the main simulations when compared with the simulations without SOs. Our results also show that scree slopes may be warmer than rock walls if SOs are large enough, e.g. 3 ∘C. The latter is in discordance with the study by Myhra et al. (2019), where rock walls had a cooling effect on scree slopes; however, we note that they still agree for rock walls with minimal SOs. The simulated subsurface thermal fields are more similar to the results from 3D modelling in the European Alps (Noetzli and Gruber, 2009), especially for Hogrenningsnibba, which has the most similar geometry to the one presented in that study. Our simulations show similar distribution of the isotherms to the ones from the European Alps, except that the isotherms inside Hogrenningsnibba are less inclined. This is expected since the difference in rock surface temperature between the north- and south-facing slopes is smaller than in the European Alps, as discussed in Magnin et al. (2019). Slope steepness is, however, also an important factor influencing the subsurface thermal field. Ádjit is the narrowest ridge presented in this study and although the measured mean annual GST difference between the north- and south-facing slopes is below 2 ∘C, almost horizontal heat flux direction between the opposite mountainsides is often modelled. This suggests an increasing sensitivity of the subsurface thermal fields to small differences in forcing for the steep and narrow terrain. For instance, the modelled subsurface thermal field for the nearby less steep and less narrow Polvartinden indicates almost horizontal isotherms (Frauenfelder et al., 2018). We note, however, that the differences in SOs for various aspects presented in the latter study were smaller, around 1 ∘C. The modelled GT in the Hogrenningsnibba profile also indicates that permafrost may underlie a warmer mountainside with positive MAGSTs, due to permafrost occurrence in a colder mountainside, as shown in the studies of Noetzli et al. (2007) and Noetzli and Gruber (2009).
The importance of multi-dimensionality for the rates of GT rise was previously investigated in the studies by Noetzli et al. (2007) and Noetzli and Gruber (2009), where it was shown that surface warming penetrates steeper topography from several sides, thus leading to a faster pace of ground warming compared with flatter topography. Our study also suggests that multi-dimensionality in mountain ridges is an important factor, although we only investigated a 2D case. The simulated rise in GT increases with elevation, generally when the terrain is more exposed to surface warming penetration. The modelled warming rate of on average 0.25 ∘C per decade in rock walls in Jotunheimen over the 1980s–2010s is slightly higher than the warming rate of 0.2 ∘C per decade measured at 20 m depth in the deep borehole at Juvvasshøe since 1999 (Smith et al., 2021). GT in this borehole is strongly coupled with SAT, and the borehole has an nF factor of around 0.9.
5.4 Geomorphological implications
Our study focuses on rock wall permafrost evolution in Norway since the end of the Little Ice Age. The results indicate a substantial increase of GT at 20 m depth since the 1980s at all sites in Norway. Although the mechanical implications of this warming are not considered in our modelling, the ground thermal regime itself has an important influence on geomorphological processes in periglacial regions (e.g. Berthling and Etzelmüller, 2011) and ultimately landscape development (e.g. Egholm et al., 2015). The ground thermal regime and its temporal development in steep slopes is associated with the weakening of rock bonds, the widening of cracks and the potential for frost weathering processes. Several authors have linked permafrost degradation and destabilisation of slopes (e.g. Davies et al., 2000, 2001; Gruber and Haeberli, 2007; Krautblatter et al., 2013). Conductive warming of ice-filled fractures, which stabilise permafrost-underlain mountains (e.g. Dramis et al., 1995), may result in (1) loss of joint bonding and reduction of shear strength of the joint due to water release through ice melting and (2) shear strength changes due to mechanical ice properties that are a function of the normal stress and temperature (Davies et al., 2001). Furthermore, advective heat transport by percolating meltwater may result in rapid, local degradation of rock wall permafrost, which can trigger rockfalls even in cold permafrost areas (Hasler et al., 2011a). In addition, rock-mechanical properties depend on rock temperature (Krautblatter et al., 2013); hence, thawing can lead to a substantial drop in rock strength. Frost weathering processes caused by ice segregation or volumetric expansion of in situ water contribute to the generation of weakness planes or fracture widening in frost-affected rocks (Gruber and Haeberli, 2007; Krautblatter et al., 2013). It is uncertain how the modelled spatial and temporal variations in GT may affect slope stability. Our results suggest that ground warming increases with elevation within a single rock wall section; hence, this may indicate that instability risk increases with elevation for a single rock wall section. However, GT may be highest in the middle of the rock wall; hence, this part may be more susceptible to permafrost degradation in the sun-exposed rock walls. Furthermore, shaded rock walls may act as “refrigerators” in the landscape due to low snow cover within the rock walls and small amounts of solar radiation (e.g. Myhra et al., 2017). Thus, these landscape areas are locations for steep thermal gradients on the transition of snow-free steep rock walls and snow-covered more gentle terrain. This is exemplified in other studies and formerly addressed by Myhra et al. (2019) for the upper parts of talus slopes or rock glaciers below shaded rock walls, for cirques (Sanders et al., 2012) and below coastal cliffs in Arctic settings (Ødegård and Sollid, 1993; Wangensteen et al., 2007; Schmidt et al., 2021). All these settings influence frost weathering, as these strong thermal gradients favour frost segregation and frost cracking (Hales and Roering, 2007). Similar processes are also discussed for snow patches in relation to nivation processes (Berrisford, 1991). Thus, especially the constant change of ground thermal regime associated with rock walls and their vicinity facilitates material production and further geomorphological transport processes.
From this study, the following conclusions could be drawn.
-
Permafrost is likely discontinuous along most of the modelled profiles. Rock walls at the highest elevations in the Jotunheimen Mountains are in the continuous permafrost zone. The simulations suggest no permafrost in Mannen and Ramnanosi. However, convective heat transfer along discontinuities at both Mannen and Ramnanosi could lower GT; hence, both sites could be underlain by sporadic permafrost.
-
Rock walls in northern Norway experienced larger GT variations after LIA than rock walls in southern Norway, since both the 1930s atmospheric warming and the 1970s–80s cooling were more pronounced in the north. All simulations show increasing GT since the 1980s. Rock walls in Norway are warming by 0.2 ∘C per decade on average at 20 m depth over the last 3 decades.
-
Many of the modelled sites lie close to the lower boundary of mountain permafrost; hence, the modelled GT is sensitive to the changes in the forcing. Within the tested forcing, uncertainties in the SAT led to the largest changes in the modelled GT. Neglecting SOs may lead to much lower GT in the rock walls, even in Norway.
-
The rock wall exposition and its size appear to be important modifying factors for permafrost distribution in the mountains. High rock walls, higher than 50 m, or several small rock walls (< 50 m high) allow effective ground cooling and lead to lower permafrost limits in the mountain if SOs are not too large (e.g. Gámanjunni). High rock walls or several small rock walls may also allow more heat to enter a mountain and sun-exposed rock walls may even have higher permafrost limits than moderately steep terrain (e.g. Kvernhusfjellet).
-
The elevational distribution of GT at 20 m depth is influenced by the assumed snow conditions above and below rock walls; this is especially pronounced for smaller rock walls. Larger rock walls and in some cases even smaller rock walls may have the coldest or warmest midsection depending on SOs. The north-facing rock walls usually have small SOs; hence their midsection is coldest. The rock walls with large SOs have warmest midsection.
-
The main ground heat flux direction is often one dimensional inside the mountains in Norway, especially below mountain plateaus or mountains with minimal difference in GST forcing between the opposite mountainsides (e.g. Rombakstøtta). The narrow ridges in Norway are, however, sensitive to even small differences in GSTs between opposite mountain faces (e.g. Ádjit).
-
Ground heat flux is modified in rock walls in Jotunheimen by blockfields and glaciers. GST in blockfields may be relatively strongly coupled with SAT, leading to lower GT and higher rates of GT increase (at 20 m depth) in rock walls close to blockfields. Glaciers reduce the magnitude of increases in GT in nearby parts of rock walls; however, in view of their potential future retreat, warming rates may increase in the closest parts of rock walls.
-
In rock walls with large SOs, plateaus above or talus below may be colder than the rock wall, forcing ground heat flux towards colder plateaus or talus slopes.
Atmospheric temperature has in general had a positive trend in Norway since the end of the LIA, with the largest changes occurring over the last 40 years. Figure A1 shows the decadal running mean surface air temperature (SAT10a) evolution for the highest elevations along each profile. In the first decade of the 20th century, SAT10a were −0.59 to −1.75 ∘C lower than over the last decade (2011–2020).
The warming during the early 20th century was largest in northern Norway, which experienced at least 1 ∘C warming between the 1900s and 1930s, whereas western Norway had around 0.4–0.7 ∘C warming in the same period. Ramnanosi is the site with the largest cooling trend at the beginning of the 20th century. Jotunheimen had only a small cooling between these decades. SAT10a was 0.5–0.7 ∘C lower in northern and western Norway between the 1930s and 1980s. In Jotunheimen, SAT10a increased between the 1930s and 1980s by around 0.4 ∘C, although we note that there was a slight cooling in the area in the early 1980s; however, it vanishes when the results are presented as a mean value for the whole 1980s. SAT10a increased by 0.86–1.16 ∘C at all study sites after the 1970s–1980s cooling. The recent warming is largest in Jotunheimen and at Rombakstøtta.
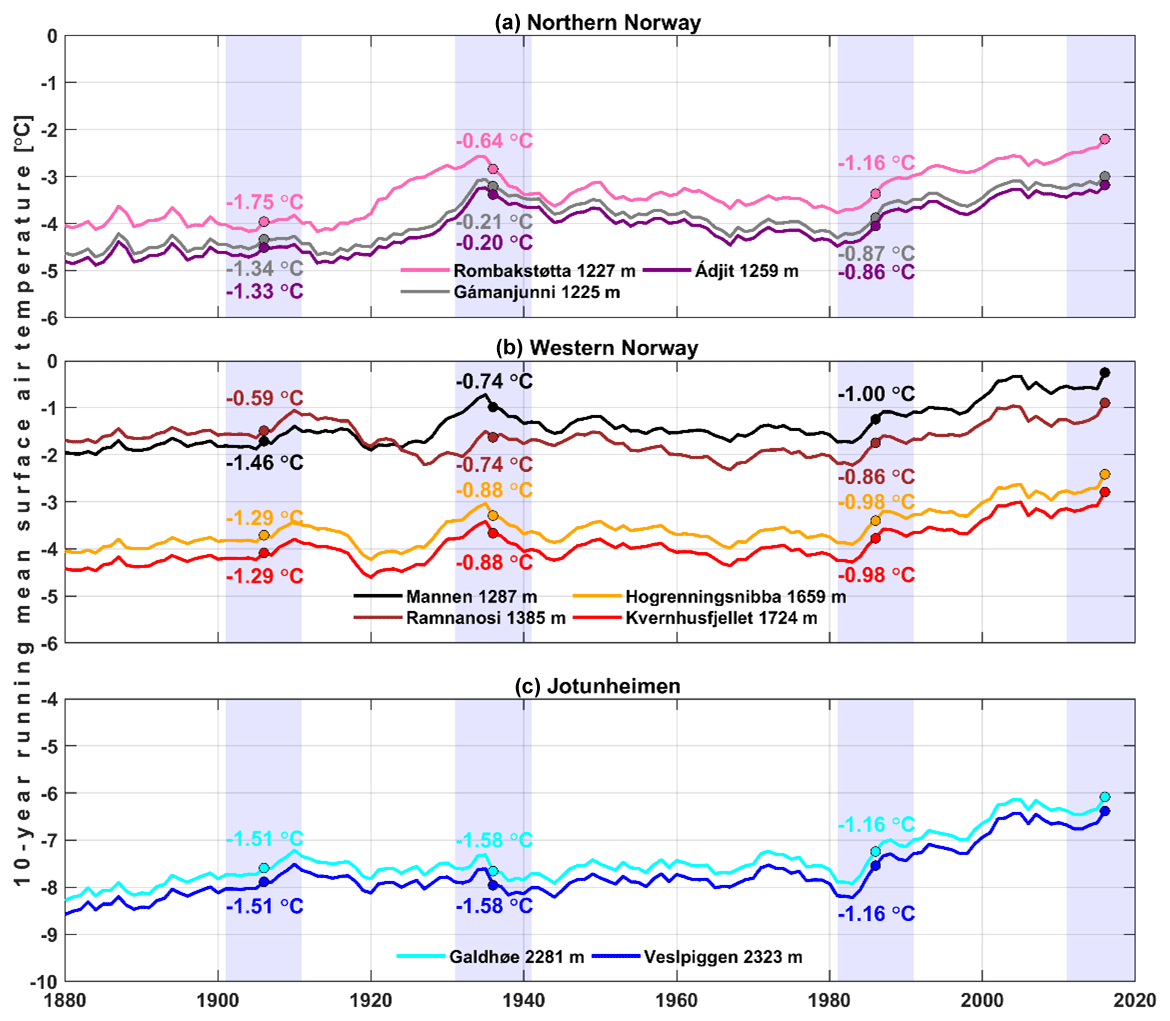
Figure A1Decadal running mean surface air temperature (SAT10a) for peak elevations along each of the constructed profiles in northern and western Norway, together with Jotunheimen. Numbers along the plot lines are mean decadal temperature offsets in the 1900s, 1930s and 1980s relative to the 2010s. Data from Hanssen-Bauer et al. (2006), Lussana (2020) and meteorological stations.
The data can be found at Zenodo: https://doi.org/10.5281/Zenodo.8014400 (Czekirda et al., 2023a).
Videos are available at Zenodo: https://doi.org/10.5281/Zenodo.8014756 (Czekirda et al., 2023b).
The supplement related to this article is available online at: https://doi.org/10.5194/tc-17-2725-2023-supplement.
JC performed the simulations and prepared the paper, with contributions from all co-authors. BE prepared the first version of the forcing data and supervised the study. JC, BE and SW contributed to the conceptualisation of this study and developed the methods. KI prepared the regional SAT data sets and contributed to the analysis of the SAT trends. FM contributed to the discussion on the thermal regime in steep slopes.
The contact author has declared that none of the authors has any competing interests.
Publisher's note: Copernicus Publications remains neutral with regard to jurisdictional claims in published maps and institutional affiliations.
This study uses rock wall loggers installed by Tobias Hipp and Bas Altena within the CRYOLINK project in 2011, together with rock wall loggers installed later during the project “CryoWALL – Permafrost slopes in Norway” (243784/CLE). Both projects were funded by the Research Council of Norway. Installation and data retrieval from the loggers were actively supported by the Geological Survey of Norway (NGU) and the Norwegian Water Resources and Energy Directorate (NVE). Particular thanks are due to Reginald L. Hermanns (NGU) and Lars Harald Blikra (NVE). Paula Hilger, Thorben Dunse (both the University College of Western Norway), Ove Brynhildsvoll, Trond Eiken, Jaroslav Obu, Bas Altena, Juditha Aga, Harald Wathne Hestad and Erling Thokle Hovden (all University of Oslo) helped with retrieving the rock wall logger data. Ole Einar Tveito from the Norwegian Meteorological Institute assisted in preparing the climatic data. Kristin Sæterdal Myhra (the University College of Western Norway) provided the CryoGrid 2D code, and ice thickness data for the selected glaciers in Norway were provided by Liss Marie Andreassen (NVE). Thomas Barnes (University of Oslo) proofread the paper. Three anonymous referees provided insightful reviews and suggestions that improved the paper. We want to thank the mentioned institutions and individuals.
This study was funded by the Department of Geosciences, University of Oslo, Norway. Additional funding was provided by the project “CryoWALL – Permafrost slopes in Norway” (243784/CLE), funded by the Research Council of Norway.
This paper was edited by Ylva Sjöberg and reviewed by three anonymous referees.
Allen, S. K., Gruber, S., and Owens, I. F.: Exploring Steep Bedrock Permafrost and its Relationship with Recent Slope Failures in the Southern Alps of New Zealand, Permafrost Periglac., 20, 345–356, https://doi.org/10.1002/ppp.658, 2009.
Andreassen, L. M., Huss, M., Melvold, K., Elvehøy, H., and Winsvold, S. H.: Ice thickness measurements and volume estimates for glaciers in Norway, J. Glaciol., 61, 763–775, https://doi.org/10.3189/2015JoG14J161, 2015.
Aune-Lundberg, L. and Strand, G.-H.: CORINE Land Cover classes. Examination of the content of CLC classes in Norway, Norwegian Forest and Landscape Institute, Ås, Norway, Report 05/2010, 42 pp., 2010.
Berrisford, M. S.: Evidence for enhanced mechanical weathering associated with seasonally late-lying and perennial snow patches, Jotunheimen, Norway, Permafrost Periglac., 2, 331–340, https://doi.org/10.1002/ppp.3430020408, 1991.
Berthling, I. and Etzelmüller, B.: The concept of cryo-conditioning in landscape evolution, Quaternary Res., 75, 378–384, https://doi.org/10.1016/j.yqres.2010.12.011, 2011.
Blikra, L. H. and Christiansen, H. H.: A field-based model of permafrost-controlled rockslide deformation in northern Norway, Geomorphology, 208, 34–49, https://doi.org/10.1016/j.geomorph.2013.11.014, 2014.
Blikra, L. H., Longva, O., Braathen, A., Anda, E., Dehls, J., and Stalsberg, K.: Rock slope failures in Norwegian fjord areas: examples, spatial distribution and temporal pattern, in: Landslides from Massive Rock Slope Failure, edited by: Evans, S. G., Mugnozza, G. S., Strom, A., Hermanns, R. L., NATO Science Series, vol. 49, Springer, Dordrecht, the Netherlands, https://doi.org/10.1007/978-1-4020-4037-5_26, 2006.
Blöschl, G. and Kirnbauer, R.: An analysis of snow cover patterns in a small alpine catchment, Hydrol. Process., 6, 99–109, https://doi.org/10.1002/hyp.3360060109, 1992.
Blöschl, G., Kirnbauer, R., and Gutknecht, D.: Distributed Snowmelt Simulations in an Alpine Catchment: 1. Model Evaluation on the Basis of Snow Cover Patterns, Water Resour. Res., 27, 3171–3179, https://doi.org/10.1029/91WR02250, 1991.
Boeckli, L., Brenning, A., Gruber, S., and Noetzli, J.: A statistical approach to modelling permafrost distribution in the European Alps or similar mountain ranges, The Cryosphere, 6, 125–140, https://doi.org/10.5194/tc-6-125-2012, 2012.
Böhme, M., Hermanns, R. L., Fischer, L., Oppikofer, T., Bunkholt, H., Derron, M. H., Carrea, D., Jaboyedoff, M., and Eiken, T.: Detailed assessment of the deep-seated gravitational deformation at Stampa above Flåm, Norway, Landslides and Engineered Slopes: Protecting Society through Improved Understanding, Taylor & Francis Group, London, 647–652, ISBN 978-0-415-62123-6, 2012.
Böhme, M., Hermanns, R. L., Oppikofer, T., Fischer, L., Bunkholt, H. S. S., Eiken, T., Pedrazzini, A., Derron, M.-H., Jaboyedoff, M., Blikra, L. H., and Nilsen, B.: Analyzing complex rock slope deformation at Stampa, western Norway, by integrating geomorphology, kinematics and numerical modeling, Eng. Geol., 154, 116–130, https://doi.org/10.1016/j.enggeo.2012.11.016, 2013.
Böhme, M., Bunkholt, H. S. S., Dehls, J. F., Oppikofer, T., Hermanns, R., Dalsegg, E., Kristensen, L., Lauknes, T. R., and Eriksen, H. Ø.: Geologisk modell og fare-og risikoklassifisering av det ustabile fjellpartiet Gamanjunni 3 i Manndalen, Troms, Norges Geologiske Undersøkelse, Trondheim, Norway, Report 2016.031, 63 pp., 2016a (in Norwegian).
Böhme, M., Bunkholt, H. S. S., Oppikofer, T., Dehls, J. F., Hermanns, R. L., Eriksen, H. Ø., Lauknes, T. R., and Eiken, T.: Using 2D InSAR, dGNSS and structural field data to understand the deformation mechanism of the unstable rock slope Gamanjunni 3, northern Norway, in: Proceedings of the 12th International Symposium on Landslides, Napoli, Italy, 12–19 June 2016, 443–449, ISBN 978-1-138-02988-0, 2016b.
Böhme, M., Hermanns, R. L., Gosse, J., Hilger, P., Eiken, T., Lauknes, T. R., and Dehls, J. F.: Comparison of monitoring data with paleo-slip rates: Cosmogenic nuclide dating detects acceleration of a rockslide, Geology, 47, 339–342, https://doi.org/10.1130/G45684.1, 2019.
Czekirda, J., Etzelmüller, B., Westermann, S., Isaksen, K., and Magnin, F.: Data: Post-Little Ice Age rock wall permafrost evolution in Norway, Zenodo [data set], https://doi.org/10.5281/zenodo.8014400, 2023a.
Czekirda, J., Etzelmüller, B., Westermann, S., Isaksen, K., and Magnin, F.: Videos: Post-Little Ice Age rock wall permafrost evolution in Norway, Zenodo [video], https://doi.org/10.5281/zenodo.8014756, 2023b.
Dabrowski, M., Krotkiewski, M., and Schmid, D. W.: MILAMIN: MATLAB-based finite element method solver for large problems, Geochem. Geophy. Geosy., 9, Q04030, https://doi.org/10.1029/2007gc001719, 2008.
Dalsegg, E. and Rønning, J. S.: Geofysiske målinger på Mannen i Rauma kommune, Møre og Romsdal, Norges geologiske undersøkelse, Trondheim, Norway, Report 2012.024, 18 pp., 2012 (in Norwegian).
Davies, M. C. R., Hamza, O., Lumsden, B. W., and Harris, C.: Laboratory measurement of the shear strength of ice-filled rock joints, Ann. Glaciol., 31, 463–467, https://doi.org/10.3189/172756400781819897, 2000.
Davies, M. C. R., Hamza, O., and Harris, C.: The effect of rise in mean annual temperature on the stability of rock slopes containing ice-filled discontinuities, Permafrost Periglac., 12, 137–144, https://doi.org/10.1002/ppp.378, 2001.
Draebing, D., Krautblatter, M., and Dikau, R.: Interaction of thermal and mechanical processes in steep permafrost rock walls: A conceptual approach, Geomorphology, 226, 226–235, https://doi.org/10.1016/j.geomorph.2014.08.009, 2014.
Dramis, F., Govi, M., Guglielmin, M., and Mortara, G.: Mountain Permafrost and Slope Instability in the Italian Alps – the Val-Pola Landslide, Permafrost Periglac., 6, 73–81, https://doi.org/10.1002/ppp.3430060108, 1995.
Egholm, D. L., Andersen, J. L., Knudsen, M. F., Jansen, J. D., and Nielsen, S. B.: The periglacial engine of mountain erosion – Part 2: Modelling large-scale landscape evolution, Earth Surf. Dynam., 3, 463–482, https://doi.org/10.5194/esurf-3-463-2015, 2015.
Eriksen, H. Ø.: Instrumentation and temperature data (2014–2017) for the Ádjet Mountain in Skibotn, Troms, Figshare [data set], https://doi.org/10.6084/m9.figshare.6225056.v3, 2018a.
Eriksen, H. Ø.: Instrumentation and temperature data (2013–2017), Gámanjunni 3 Rockslide and Rock Glacier, Manndalen, Troms, Figshare [data set], https://doi.org/10.6084/m9.figshare.6254750.v1, 2018b.
Eriksen, H. Ø., Rouyet, L., Lauknes, T. R., Berthling, I., Isaksen, K., Hindberg, H., Larsen, Y., and Corner, G. D.: Recent Acceleration of a Rock Glacier Complex, Ádjet, Norway, Documented by 62 Years of Remote Sensing Observations, Geophys. Res. Lett., 45, 8314–8323, https://doi.org/10.1029/2018GL077605, 2018.
Etzelmüller, B. and Hagen, J. O.: Glacier-permafrost interaction in Arctic and alpine mountain environments with examples from southern Norway and Svalbard, Geological Society, London, Special Publications, 242, 11–27, https://doi.org/10.1144/gsl.Sp.2005.242.01.02, 2005.
Etzelmüller, B., Berthling, I., and Sollid, J. L.: The distribution of permafrost in Southern Norway; a GIS approach, in: Proceedings of the Seventh International Conference on Permafrost, Yellowknife, Canada, 23–27 June 1998, 251–258, 1998.
Etzelmüller, B., Berthling, I., and Sollid, J. L.: Aspects and concepts on the geomorphological significance of Holocene permafrost in southern Norway, Geomorphology, 52, 87–104, https://doi.org/10.1016/S0169-555X(02)00250-7, 2003.
Etzelmüller, B., Guglielmin, M., Hauck, C., Hilbich, C., Hoelzle, M., Isaksen, K., Noetzli, J., Oliva, M., and Ramos, M.: Twenty years of European mountain permafrost dynamics – the PACE legacy, Environ. Res. Lett., 15, 104070, https://doi.org/10.1088/1748-9326/abae9d, 2020.
Etzelmüller, B., Czekirda, J., Magnin, F., Duvillard, P.-A., Ravanel, L., Malet, E., Aspaas, A., Kristensen, L., Skrede, I., Majala, G. D., Jacobs, B., Leinauer, J., Hauck, C., Hilbich, C., Böhme, M., Hermanns, R., Eriksen, H. Ø., Lauknes, T. R., Krautblatter, M., and Westermann, S.: Permafrost in monitored unstable rock slopes in Norway – new insights from temperature and surface velocity measurements, geophysical surveying, and ground temperature modelling, Earth Surf. Dynam., 10, 97–129, https://doi.org/10.5194/esurf-10-97-2022, 2022.
Farbrot, H., Isaksen, K., and Etzelmüller, B.: Present and past distribution of mountain permafrost in Gaissane Mountains, Northern Norway, in: Proceedings of the Ninth International Conference on Permafrost, Fairbanks, Alaska, 29 June–3 July 2008, 427–432, 2008.
Farbrot, H., Hipp, T. F., Etzelmüller, B., Isaksen, K., Ødegård, R. S., Schuler, T. V., and Humlum, O.: Air and Ground Temperature Variations Observed along Elevation and Continentality Gradients in Southern Norway, Permafrost Periglac., 22, 343–360, https://doi.org/10.1002/ppp.733, 2011.
Farbrot, H., Isaksen, K., Etzelmüller, B., and Gisnås, K.: Ground Thermal Regime and Permafrost Distribution under a Changing Climate in Northern Norway, Permafrost Periglac., 24, 20–38, https://doi.org/10.1002/ppp.1763, 2013.
Fiddes, J., Endrizzi, S., and Gruber, S.: Large-area land surface simulations in heterogeneous terrain driven by global data sets: application to mountain permafrost, The Cryosphere, 9, 411–426, https://doi.org/10.5194/tc-9-411-2015, 2015.
Fischer, L., Kääb, A., Huggel, C., and Noetzli, J.: Geology, glacier retreat and permafrost degradation as controlling factors of slope instabilities in a high-mountain rock wall: the Monte Rosa east face, Nat. Hazards Earth Syst. Sci., 6, 761–772, https://doi.org/10.5194/nhess-6-761-2006, 2006.
Fischer, L., Purves, R. S., Huggel, C., Noetzli, J., and Haeberli, W.: On the influence of topographic, geological and cryospheric factors on rock avalanches and rockfalls in high-mountain areas, Nat. Hazards Earth Syst. Sci., 12, 241–254, https://doi.org/10.5194/nhess-12-241-2012, 2012.
Frauenfelder, R., Isaksen, K., Lato, M. J., and Noetzli, J.: Ground thermal and geomechanical conditions in a permafrost-affected high-latitude rock avalanche site (Polvartinden, northern Norway), The Cryosphere, 12, 1531–1550, https://doi.org/10.5194/tc-12-1531-2018, 2018.
Gisnås, K., Etzelmüller, B., Farbrot, H., Schuler, T. V., and Westermann, S.: CryoGRID 1.0: Permafrost Distribution in Norway estimated by a Spatial Numerical Model, Permafrost Periglac., 24, 2–19, https://doi.org/10.1002/ppp.1765, 2013.
Gisnås, K., Westermann, S., Schuler, T. V., Litherland, T., Isaksen, K., Boike, J., and Etzelmüller, B.: A statistical approach to represent small-scale variability of permafrost temperatures due to snow cover, The Cryosphere, 8, 2063–2074, https://doi.org/10.5194/tc-8-2063-2014, 2014.
Gisnås, K., Etzelmüller, B., Lussana, C., Hjort, J., Sannel, A. B. K., Isaksen, K., Westermann, S., Kuhry, P., Christiansen, H. H., Frampton, A., and Akerman, J.: Permafrost Map for Norway, Sweden and Finland, Permafrost Periglac., 28, 359–378, https://doi.org/10.1002/ppp.1922, 2017.
Gruber, S. and Haeberli, W.: Permafrost in steep bedrock slopes and its temperature-related destabilization following climate change, J. Geophys. Res.-Earth, 112, F02S18, https://doi.org/10.1029/2006jf000547, 2007.
Gruber, S. and Hoelze, M.: The cooling effect of coarse blocks revisited: a modeling study of a purely conductive mechanism, in: Proceedings of the Ninth International Conference on Permafrost, Fairbanks, Alaska, 29 June–3 July 2008, 557–561, 2008.
Gruber, S., Hoelzle, M., and Haeberli, W.: Permafrost thaw and destabilization of Alpine rock walls in the hot summer of 2003, Geophys. Res. Lett., 31, L13504, https://doi.org/10.1029/2004gl020051, 2004.
Haberkorn, A., Phillips, M., Kenner, R., Rhyner, H., Bavay, M., Galos, S. P., and Hoelzle, M.: Thermal regime of rock and its relation to snow cover in steep alpine rock walls: Gemsstock, Central Swiss Alps, Geogr. Ann. A, 97, 579–597, https://doi.org/10.1111/geoa.12101, 2015.
Haberkorn, A., Wever, N., Hoelzle, M., Phillips, M., Kenner, R., Bavay, M., and Lehning, M.: Distributed snow and rock temperature modelling in steep rock walls using Alpine3D, The Cryosphere, 11, 585–607, https://doi.org/10.5194/tc-11-585-2017, 2017.
Haeberli, W., Huggel, C., Kaab, A., Zgraggen-Oswald, S., Polkvoj, A., Galushkin, I., Zotikov, I., and Osokin, N.: The Kolka-Karmadon rock/ice slide of 20 September 2002: an extraordinary event of historical dimensions in North Ossetia, Russian Caucasus, J. Glaciol., 50, 533–546, https://doi.org/10.3189/172756504781829710, 2004.
Hales, T. C. and Roering, J. J.: Climatic controls on frost cracking and implications for the evolution of bedrock landscapes, J. Geophys. Res.-Earth, 112, F02033, https://doi.org/10.1029/2006JF000616, 2007.
Hanssen-Bauer, I., Tveito, O., and Szewczyk-Bartnicka, H.: Comparison of grid-based and station-based regional temperature and precipitation series, Norwegian Meteorological Institute, Oslo, Norway, Report 04/2006, 26 pp., 2006.
Harris, C., Haeberli, W., Vonder Mühll, D., and King, L.: Permafrost monitoring in the high mountains of Europe: the PACE Project in its global context, Permafrost Periglac., 12, 3–11, https://doi.org/10.1002/ppp.377, 2001.
Hasler, A., Gruber, S., Font, M., and Dubois, A.: Advective Heat Transport in Frozen Rock Clefts: Conceptual Model, Laboratory Experiments and Numerical Simulation, Permafrost Periglac., 22, 378–389, https://doi.org/10.1002/ppp.737, 2011a.
Hasler, A., Gruber, S., and Haeberli, W.: Temperature variability and offset in steep alpine rock and ice faces, The Cryosphere, 5, 977–988, https://doi.org/10.5194/tc-5-977-2011, 2011b.
Heggem, E. S. F., Juliussen, H., and Etzelmüller, B.: Mountain permafrost in Central-Eastern Norway, Norsk Geogr. Tidsskr. – Norwegian Journal of Geography, 59, 94–108, https://doi.org/10.1080/00291950510038377, 2005.
Hilger, P., Hermanns, R. L., Czekirda, J., Myhra, K. S., Gosse, J. C., and Etzelmüller, B.: Permafrost as a first order control on long-term rock-slope deformation in (Sub-) Arctic Norway, Quaternary Sci. Rev., 251, 106718, https://doi.org/10.1016/j.quascirev.2020.106718, 2021.
Hipp, T., Etzelmüller, B., Farbrot, H., Schuler, T. V., and Westermann, S.: Modelling borehole temperatures in Southern Norway – insights into permafrost dynamics during the 20th and 21st century, The Cryosphere, 6, 553–571, https://doi.org/10.5194/tc-6-553-2012, 2012.
Hipp, T., Etzelmüller, B., and Westermann, S.: Permafrost in Alpine Rock Faces from Jotunheimen and Hurrungane, Southern Norway, Permafrost Periglac., 25, 1–13, https://doi.org/10.1002/ppp.1799, 2014.
Hock, R., Rasul, G., Adler, C., Cáceres, B., Gruber, S., Hirabayashi, Y., Jackson, M., Kääb, A., Kang, S., Kutuzov, S., Milner, A., Molau, U., Morin, S., Orlove, B., and Steltzer, H.: High Mountain Areas, in: IPCC Special Report on the Ocean and Cryosphere in a Changing Climate, edited by: Pörtner, H.-O., Roberts, D. C., Masson-Delmotte, V., Zhai, P., Tignor, M., Poloczanska, E., Mintenbeck, K., Alegriìa, A., Nicolai, M., Okem, A., Petzold, J., Rama, B., and Weyer, N. M., Cambridge University Press, Cambridge, UK and New York, NY, USA, 131–202, https://doi.org/10.1017/9781009157964.004, 2019.
Huggel, C., Salzmann, N., Allen, S., Caplan-Auerbach, J., Fischer, L., Haeberli, W., Larsen, C., Schneider, D., and Wessels, R.: Recent and future warm extreme events and high-mountain slope stability, Philos. T. R. Soc. A, 368, 2435–2459, https://doi.org/10.1098/rsta.2010.0078, 2010.
Isaksen, K., Holmlund, P., Sollid, J. L., and Harris, C.: Three deep Alpine-permafrost boreholes in Svalbard and Scandinavia, Permafrost Periglac., 12, 13–25, https://doi.org/10.1002/ppp.380, 2001.
Isaksen, K., Sollid, J. L., Holmlund, P., and Harris, C.: Recent warming of mountain permafrost in Svalbard and Scandinavia, J. Geophys. Res.-Earth, 112, F02S04, https://doi.org/10.1029/2006JF000522, 2007.
Isaksen, K., Ødegård, R. S., Etzelmüller, B., Hilbich, C., Hauck, C., Farbrot, H., Eiken, T., Hygen, H. O., and Hipp, T. F.: Degrading Mountain Permafrost in Southern Norway: Spatial and Temporal Variability of Mean Ground Temperatures, 1999–2009, Permafrost Periglac., 22, 361–377, https://doi.org/10.1002/ppp.728, 2011.
Juliussen, H. and Humlum, O.: Thermal regime of openwork block fields on the mountains Elgåhogna and Sølen, central-eastern Norway, Permafrost Periglac., 19, 1–18, https://doi.org/10.1002/ppp.607, 2008.
Keller, F. and Gubler, H.: Interaction between snowcover and high mountain permafrost Murtel/Corvatsch, Swiss Alps, in: Proceedings of the Sixth International Conference on Permafrost, Beijing, China, 5–9 July 1993, 332–337, 1993.
Kirnbauer, R., Blöschl, G., Waldhäusl, P., and Hochstöger, F.: An analysis of snow cover patterns as derived from oblique aerial photographs, in: Proc. Vienna Symp. – Snow, Hydrology and Forests in High Alpine Areas, Vienna, Austria, 11–24 August 1991, 91–99, 1991.
Kleman, J., Stroeven, A. P., and Lundqvist, J.: Patterns of Quaternary ice sheet erosion and deposition in Fennoscandia and a theoretical framework for explanation, Geomorphology, 97, 73–90, https://doi.org/10.1016/j.geomorph.2007.02.049, 2008.
Krautblatter, M. and Hauck, C.: Electrical resistivity tomography monitoring of permafrost in solid rock walls, J. Geophys. Res.-Earth, 112, F02S20, https://doi.org/10.1029/2006JF000546, 2007.
Krautblatter, M., Funk, D., and Günzel, F. K.: Why permafrost rocks become unstable: a rock-ice-mechanical model in time and space, Earth Surf. Proc. Land., 38, 876–887, https://doi.org/10.1002/esp.3374, 2013.
Kristensen, L., Czekirda, J., Penna, I., Etzelmüller, B., Nicolet, P., Pullarello, J. S., Blikra, L. H., Skrede, I., Oldani, S., and Abellan, A.: Movements, failure and climatic control of the Veslemannen rockslide, Western Norway, Landslides, 18, 1963–1980, https://doi.org/10.1007/s10346-020-01609-x, 2021.
Lambiel, C. and Pieracci, K.: Permafrost distribution in talus slopes located within the alpine periglacial belt, Swiss Alps, Permafrost Periglac., 19, 293–304, https://doi.org/10.1002/ppp.624, 2008.
Lebrouc, V., Schwartz, S., Baillet, L., Jongmans, D., and Gamond, J. F.: Modeling permafrost extension in a rock slope since the Last Glacial Maximum: Application to the large Sechilienne landslide (French Alps), Geomorphology, 198, 189–200, https://doi.org/10.1016/j.geomorph.2013.06.001, 2013.
Lehning, M., Grünewald, T., and Schirmer, M.: Mountain snow distribution governed by an altitudinal gradient and terrain roughness, Geophys. Res. Lett., 38, L19504, https://doi.org/10.1029/2011GL048927, 2011.
Luetschg, M., Lehning, M., and Haeberli, W.: A sensitivity study of factors influencing warm/thin permafrost in the Swiss Alps, J. Glaciol., 54, 696–704, https://doi.org/10.3189/002214308786570881, 2008.
Lussana, C.: seNorge_2018 daily total precipitation amount 1957–2017, version 18.12, Zenodo [data set], https://doi.org/10.5281/zenodo.2082320, 2018.
Lussana, C.: seNorge observational gridded datasets, seNorge_2018, version 20.05, Norwegian Meteorological Institute, Oslo, Norway, Report 07/2020, 33 pp., 2020.
Lussana, C., Tveito, O. E., and Uboldi, F.: Three-dimensional spatial interpolation of 2 m temperature over Norway, Q. J. Roy. Meteor. Soc., 144, 344–364, https://doi.org/10.1002/qj.3208, 2018.
Machguth, H., Paul, F., Hoelzle, M., and Haeberli, W.: Distributed glacier mass-balance modelling as an important component of modern multi-level glacier monitoring, Ann. Glaciol., 43, 335–343, https://doi.org/10.3189/172756406781812285, 2006.
Magnin, F., Deline, P., Ravanel, L., Noetzli, J., and Pogliotti, P.: Thermal characteristics of permafrost in the steep alpine rock walls of the Aiguille du Midi (Mont Blanc Massif, 3842 ), The Cryosphere, 9, 109–121, https://doi.org/10.5194/tc-9-109-2015, 2015.
Magnin, F., Etzelmüller, B., Westermann, S., Isaksen, K., Hilger, P., and Hermanns, R. L.: Permafrost distribution in steep rock slopes in Norway: measurements, statistical modelling and implications for geomorphological processes, Earth Surf. Dynam., 7, 1019–1040, https://doi.org/10.5194/esurf-7-1019-2019, 2019.
Magnin, F. and Josnin, J.-Y.: Water Flows in Rock Wall Permafrost: A Numerical Approach Coupling Hydrological and Thermal Processes, J. Geophys. Res.-Earth, 126, e2021JF006394, https://doi.org/10.1029/2021JF006394, 2021.
Magnin, F., Josnin, J.-Y., Ravanel, L., Pergaud, J., Pohl, B., and Deline, P.: Modelling rock wall permafrost degradation in the Mont Blanc massif from the LIA to the end of the 21st century, The Cryosphere, 11, 1813–1834, https://doi.org/10.5194/tc-11-1813-2017, 2017a.
Magnin, F., Westermann, S., Pogliotti, P., Ravanel, L., Deline, P., and Malet, E.: Snow control on active layer thickness in steep alpine rock walls (Aiguille du Midi, 3842 m asl, Mont Blanc massif), Catena, 149, 648–662, https://doi.org/10.1016/j.catena.2016.06.006, 2017b.
Moore, J. R., Gischig, V., Katterbach, M., and Loew, S.: Air circulation in deep fractures and the temperature field of an alpine rock slope, Earth Surf. Proc. Land., 36, 1985–1996, https://doi.org/10.1002/esp.2217, 2011.
Myhra, K. S., Westermann, S., and Etzelmüller, B.: Modelled Distribution and Temporal Evolution of Permafrost in Steep Rock Walls Along a Latitudinal Transect in Norway by CryoGrid 2D, Permafrost Periglac., 28, 172–182, https://doi.org/10.1002/ppp.1884, 2017.
Myhra, K. S., Westermann, S., and Etzelmüller, B.: Modeling Conductive Heat Flow Between Steep Rock Walls and Talus Slopes – Thermal Processes and Geomorphological Implications, Front. Earth Sci., 7, 192, https://doi.org/10.3389/feart.2019.00192, 2019.
Noetzli, J. and Gruber, S.: Transient thermal effects in Alpine permafrost, The Cryosphere, 3, 85–99, https://doi.org/10.5194/tc-3-85-2009, 2009.
Noetzli, J., Gruber, S., Kohl, T., Salzmann, N., and Haeberli, W.: Three-dimensional distribution and evolution of permafrost temperatures in idealized high-mountain topography, J. Geophys. Res.-Earth, 112, F02S13, https://doi.org/10.1029/2006jf000545, 2007.
Noetzli, J., Christiansen, H., Deline, P., Gugliemin, M., Isaksen, K., Romanovsky, V., Smith, S., Zhao, L., and Streletskiy, D.: Permafrost thermal state, in: State of the Climate in 2019, B. Am. Meteorol. Soc., 101, 20–22, https://doi.org/10.1175/BAMS-D-20-0104.1, 2020.
Nopper, H.: Geomorphological study of the rock-slope failure at Adjet, Storfjord, Troms, Master's thesis, The Arctic University of Norway, Tromsø, Norway, 2015.
Ødegård, R. S. and Sollid, J. L.: Coastal cliff temperatures related to the potential for cryogenic weathering processes, western Spitsbergen, Svalbard, Polar Res., 12, 95–106, https://doi.org/10.3402/polar.v12i1.6705, 1993.
Ødegård, R. S., Sollid, J. L., and Liestøl, O.: Ground temperature measurements in mountain permafrost, Jotunheimen, southern Norway, Permafrost Periglac., 3, 231–234, https://doi.org/10.1002/ppp.3430030310, 1992.
Ødegård, R. S., Nesje, A., Isaksen, K., Andreassen, L. M., Eiken, T., Schwikowski, M., and Uglietti, C.: Climate change threatens archaeologically significant ice patches: insights into their age, internal structure, mass balance and climate sensitivity, The Cryosphere, 11, 17–32, https://doi.org/10.5194/tc-11-17-2017, 2017.
Olsen, L., Sveian, H., Ottesen, D., and Rise, L.: Quaternary glacial, interglacial and interstadial deposits of Norway and adjacent onshore and offshore areas, in: Quaternary Geology of Norway, edited by: Olsen, L., Fredin, O., and Olesen, O., Geological Survey of Norway, Trondheim, Norway, Special Publication, 13, 79–144, 2013.
Palmer, M. J., Burn, C. R., and Kokelj, S. V.: Factors influencing permafrost temperatures across tree line in the uplands east of the Mackenzie Delta, 2004–2010, Can. J. Earth Sci., 49, 877–894, https://doi.org/10.1139/e2012-002, 2012.
PERMOS: Permafrost in Switzerland 2014/2015 to 2017/2018, edited by: Noetzli, J., Pellet, C., and Staub, B., Glaciological Report (Permafrost) No. 16-19 of the Cryospheric Commission of the Swiss Academy of Sciences, Fribourg, Switzerland, 104 pp., https://doi.org/10.13093/permos-rep-2019-16-19, 2019.
Ravanel, L. and Deline, P.: Climate influence on rockfalls in high-Alpine steep rockwalls: The north side of the Aiguilles de Chamonix (Mont Blanc massif) since the end of the 'Little Ice Age', Holocene, 21, 357–365, https://doi.org/10.1177/0959683610374887, 2011.
Ravanel, L., Allignol, F., Deline, P., Gruber, S., and Ravello, M.: Rock falls in the Mont Blanc Massif in 2007 and 2008, Landslides, 7, 493–501, https://doi.org/10.1007/s10346-010-0206-z, 2010.
Ravanel, L., Magnin, F., and Deline, P.: Impacts of the 2003 and 2015 summer heatwaves on permafrost-affected rock-walls in the Mont Blanc massif, Sci. Total Environ., 609, 132–143, https://doi.org/10.1016/j.scitotenv.2017.07.055, 2017.
Saintot, A., Oppikofer, T., Derron, M.-H., and Henderson, I.: Large gravitational rock slope deformation in Romsdalen valley (Western Norway), Revista de la Asociación Geológica Argentina, 69, 354–371, 2012.
Sanders, J. W., Cuffey, K. M., Moore, J. R., MacGregor, K. R., and Kavanaugh, J. L.: Periglacial weathering and headwall erosion in cirque glacier bergschrunds, Geology, 40, 779–782, https://doi.org/10.1130/g33330.1, 2012.
Schmidt, J. U., Etzelmüller, B., Schuler, T. V., Magnin, F., Boike, J., Langer, M., and Westermann, S.: Surface temperatures and their influence on the permafrost thermal regime in high-Arctic rock walls on Svalbard, The Cryosphere, 15, 2491–2509, https://doi.org/10.5194/tc-15-2491-2021, 2021.
Schwanghart, W. and Scherler, D.: Short Communication: TopoToolbox 2 – MATLAB-based software for topographic analysis and modeling in Earth surface sciences, Earth Surf. Dynam., 2, 1–7, https://doi.org/10.5194/esurf-2-1-2014, 2014.
Slagstad, T., Balling, N., Elvebakk, H., Midttømme, K., Olesen, O., Olsen, L., and Pascal, C.: Heat-flow measurements in Late Palaeoproterozoic to Permian geological provinces in south and central Norway and a new heat-flow map of Fennoscandia and the Norwegian–Greenland Sea, Tectonophysics, 473, 341–361, https://doi.org/10.1016/j.tecto.2009.03.007, 2009.
Smith, M. W. and Riseborough, D. W.: Climate and the limits of permafrost: a zonal analysis, Permafrost Periglac., 13, 1–15, https://doi.org/10.1002/ppp.410, 2002.
Smith, S. L., Romanovsky, V. E., Isaksen, K., Nyland, K. E., Kholodov, A. L., Shiklomanov, N. I., Streletskiy, D. A., Farquharson, L. M., Drozdov, D. S., Malkova, G. V., and Christiansen, H. H.: Permafrost, in: State of the Climate in 2020, B. Am. Meteorol. Soc., 102, 290–292, https://doi.org/10.1175/BAMS-D-21-0086.1, 2021.
Sollid, J. L., Holmlund, P., Isaksen, K., and Harris, C.: Deep permafrost boreholes in western Svalbard, northern Sweden and southern Norway, Norsk Geogr. Tidsskr. – Norwegian Journal of Geography, 54, 186–191, https://doi.org/10.1080/002919500448567, 2000.
Sollid, J. L., Isaksen, K., Eiken, T., and Ødegård, R. S.: The transition zone of mountain permafrost on Dovrefjell, southern Norway, in: Proceedings of the Eighth International Conference on Permafrost, Zürich, Switzerland, 21–25 July 2003, 1085–1090, 2003.
Sommer, C. G., Lehning, M., and Mott, R.: Snow in a Very Steep Rock Face: Accumulation and Redistribution During and After a Snowfall Event, Front. Earth Sci., 3, 73, https://doi.org/10.3389/feart.2015.00073, 2015.
Steiger, C., Etzelmüller, B., Westermann, S., and Myhra, K. S.: Modelling the permafrost distribution in steep rock walls in Norway, Norwegian Journal of Geology/Norsk Geologisk Forening, 96, 329–341, https://doi.org/10.17850/njg96-4-04, 2016.
Throop, J., Lewkowicz, A. G., and Smith, S. L.: Climate and ground temperature relations at sites across the continuous and discontinuous permafrost zones, northern Canada, Can. J. Earth Sci., 49, 865–876, https://doi.org/10.1139/e11-075, 2012.
Tveito, O., Førland, E., Heino, R., Hanssen-Bauer, I., Alexanders- son, H., Dahlström, B., Drebs, A., Kern-Hansen, C., Jónsson, T., and Vaarby Laursen, E.: Nordic temperature maps, Norwegian Meteorological Institute, Oslo, Norway, Report 09/00 KLIMA, 54 pp., 2000.
Wangensteen, B., Eiken, T., Ødegård, R. S., and Ludvig Sollid, J.: Measuring coastal cliff retreat in the Kongsfjorden area, Svalbard, using terrestrial photogrammetry, Polar Res., 26, 14–21, https://doi.org/10.1111/j.1751-8369.2007.00002.x, 2007.
Westermann, S., Schuler, T. V., Gisnås, K., and Etzelmüller, B.: Transient thermal modeling of permafrost conditions in Southern Norway, The Cryosphere, 7, 719–739, https://doi.org/10.5194/tc-7-719-2013, 2013.
Wicky, J. and Hauck, C.: Numerical modelling of convective heat transport by air flow in permafrost talus slopes, The Cryosphere, 11, 1311–1325, https://doi.org/10.5194/tc-11-1311-2017, 2017.
Wicky, J. and Hauck, C.: Air Convection in the Active Layer of Rock Glaciers, Front. Earth Sci., 8, 335, https://doi.org/10.3389/feart.2020.00335, 2020.
Williams, P. J. and Smith, M. W.: The frozen earth: fundamentals of geocryology, Cambridge University Press, Cambridge, UK, https://doi.org/10.1017/CBO9780511564437, 1989.
Winstral, A., Elder, K., and Davis, R. E.: Spatial Snow Modeling of Wind-Redistributed Snow Using Terrain-Based Parameters, J. Hydrometeorol., 3, 524–538, https://doi.org/10.1175/1525-7541(2002)003<0524:Ssmowr>2.0.Co;2, 2002.
Wirz, V., Schirmer, M., Gruber, S., and Lehning, M.: Spatio-temporal measurements and analysis of snow depth in a rock face, The Cryosphere, 5, 893–905, https://doi.org/10.5194/tc-5-893-2011, 2011.
Zhang, T.: Influence of the seasonal snow cover on the ground thermal regime: An overview, Rev. Geophys., 43, RG4002, https://doi.org/10.1029/2004RG000157, 2005.
- Abstract
- Introduction
- Study areas and field installations
- Methods
- Results
- Discussion
- Conclusions
- Appendix A: Surface air temperature trends
- Data availability
- Video supplement
- Author contributions
- Competing interests
- Disclaimer
- Acknowledgements
- Financial support
- Review statement
- References
- Supplement