the Creative Commons Attribution 4.0 License.
the Creative Commons Attribution 4.0 License.
 | 22 Jun 2023
Change in the potential snowfall phenology: past, present, and future in the Chinese Tianshan mountainous region, Central Asia
Xinyu Liu
Kaixin Zhao
Xu Zhang
Lanhai Li
The acceleration of climate warming has led to a faster solid–liquid water cycle and a decrease in solid water storage in cold regions of the Earth. Although snowfall is the most critical input for the cryosphere, the phenology of snowfall, or potential snowfall phenology (PSP), has not been thoroughly studied, and there is a lack of indicators for PSP. For this reason, we have proposed three innovative indicators, namely, the start of potential snowfall season (SPSS), the end of potential snowfall season (EPSS), and the length of potential snowfall season (LPSS), to characterize the PSP. We then explored the spatial–temporal variation in all three PSP indicators in the past, present, and future across the Chinese Tianshan mountainous region (CTMR) based on the observed daily air temperature from 26 meteorological stations during 1961–2017/2020 combined with data from 14 models from CMIP6 (Phase 6 of the Coupled Model Intercomparison Project) under four different scenarios (SSP126, SSP245, SSP370, and SSP585, where SSP represents Shared Socioeconomic Pathway) during 2021–2100. The study showed that the SPSS, EPSS, and LPSS indicators could accurately describe the PSP characteristics across the study area. In the past and present, the potential snowfall season started on 2 November, ended on 18 March, and lasted for about 4.5 months across the CTMR on average. During 1961–2017/2020, the rate of advancing the EPSS (−1.6 d per decade) was faster than that of postponing the SPSS (1.2 d per decade). It was also found that there was a significant delay in the starting time (2–13 d) and advancement in the ending time (1–13 d), respectively, resulting in a reduction of 3–26 d for the LPSS. The potential snowfall season started earlier, ended later, and lasted longer in the north and center compared with the south. Similarly, the SPSS, EPSS, and LPSS indicators are also expected to vary under the four emission scenarios during 2021–2100. Under the highest emission scenario, SSP585, the starting time is expected to be postponed by up to 41 d, while the ending time is expected to be advanced by up to 23 d across the study area. This change is expected to reduce the length of the potential snowfall season by up to 61 d (about 2 months), and the length of the potential snowfall season will only last 2.5 months in the 2100s under the SSP585 scenario. The length of the potential snowfall season in the west and southwest of the CTMR will be compressed by more days due to a more delayed starting time and an advanced ending time under all four scenarios. This suggests that, with constant snowfall intensity, annual total snowfall may decrease, including the amount and frequency, leading to a reduction in snow cover or mass, which will ultimately contribute to more rapid warming through the lower reflectivity to solar radiation. This research provides new insights into capturing the potential snowfall phenology in the alpine region and can be easily extended to other snow-dominated areas worldwide. It can also help inform snowfall monitoring and early warning for solid water resources.
- Article
(13022 KB) - Full-text XML
- BibTeX
- EndNote


Snowfall, as a solid form of precipitation, exerts a significant impact on human society, ecological environment, and hydrological processes in mountainous areas, making it a crucial water resource (Barnett et al., 2005; Jonas et al., 2008; Krasting, 2008; McAfee et al., 2014; Bai et al., 2019; X. Zhang et al., 2019; Tamang et al., 2020). The warming rate in the mountains is about twice that of the rest of the planet (Sabine et al., 2022). Due to the significant variation in topography and massive solid water storage (glacier and snowpack) as well as the latter's high sensitivity to climate change in the mountains, mountainous regions are particularly vulnerable to increasing temperature and changing precipitation patterns (Dedieu et al., 2014; Piazza et al., 2014; Le Roux et al., 2021). Hence, mountains are often referred to as water towers of the world and outposts of global climate change (Sorg et al., 2012; Huss et al., 2017; Immerzeel et al., 2020).
One of the most prominent impacts of climate warming has been a shift from snow to rain, including the frequent occurrence of rain-on-snow events in temperate and cold regions across the globe (Knowles et al., 2006; Trenberth, 2011; Jennings and Molotch, 2019). While it is estimated that 1773 km3 a−1 of snow (about 5 % of the global snowfall accumulations) could fall over international mountains on average, rapid climate warming is reducing snowfall frequencies and fractions over many regions crucial to water resources and the global climate system (Mankin et al., 2015; Harpold et al., 2017; Bintanja and Andry, 2017). This is leading to predicted reductions in snow mass of up to 25 % over the next 10 to 30 years (Daloz et al., 2020; Hock et al., 2022). Furthermore, changes in snowfall phenology, such as the start of the snowfall season, the end of the snowfall season, and the length of the snowfall season, have been observed. Less snowfall in winter was caused by higher surface temperature due to increased greenhouse gas emissions (Sun et al., 2016). In late winter, the increased occurrence of above-zero temperatures reduces the fraction of snowfall and enhances snow melting in the midwinter (Räisänen, 2016). Postponed snowfall occurrence and advanced snowfall ending have also been observed across the Eurasian continent (Bai et al., 2019; Lin and Chen, 2022).
The annual variation in air temperature in the Northern Hemisphere adheres to a specific pattern that is primarily influenced by solar radiation: air temperature gradually increases from the beginning of the year until the middle of the year and then subsequently decreases steadily until the end of the year (Marshall and Plumb, 2008). Precipitation falls on the ground in various phases, such as rainfall, snowfall, and sleet, with each having a significant impact on the surface runoff and energy balance (Loth et al., 1993; Han et al., 2018). When the air temperature reaches the rain–snow threshold (RST), precipitation falls as rain and snow with equal frequency, whereas precipitation falls primarily as rain above the threshold and primarily as snow below the threshold (Jennings et al., 2018). Consequently, with an air temperature below the RST in winter, there is the possibility of potential snowfall if all other conditions (e.g., water vapor, air pressure, and condensation nodules) are satisfied. The potential snowfall season could cover the period when the air temperature is below the RST within 2 consecutive years, reflecting the intra-annual fluctuation in air temperature, timing allocation and capacity of snowfall, and water and energy balance in a region. A shorter potential snowfall season would result in an expanded potential rainfall season, thereby changing the potential water and energy needed by snowfall. Potential snowfall phenology (PSP), the start of potential snowfall season (SPSS), the end of potential snowfall season (EPSS), and the length of potential snowfall season (LPSS) are utilized to identify the possible onset, end, and duration of snowfall. The advancement or delay of the SPSS indicates that potential snowfall arrives earlier or later in late autumn or early winter, affecting the accumulation and storage of solid water resources as snow cover. Similarly, the advancement or delay of the EPSS implies that potential snowfall ends earlier or later in late winter or early spring, which is likely to alter snow melting, snow albedo, and groundwater and streamflow dynamics due to diminished and more ephemeral snowpacks (Siirila-Woodburn et al., 2021) in mountainous areas such as the Chinese Tianshan mountainous region (CTMR).
The CTMR represents a prototypical alpine area with considerable topographic heterogeneity (Li et al., 2022). Regional warming amplification and altitude warming amplification in the CTMR have been identified (Gao et al., 2021). The mean annual snowfall is expected to decrease by 26.5 % during the period from 2070 to 2099 under the Representative Concentration Pathway 8.5 (RCP8.5) scenario in the CTMR (Yang et al., 2017). Snowfall is a critical resource in the alpine region of Asia, and its sensitivity to climate change has been well established (Kapnick et al., 2014). Air temperature is a crucial driving factor with respect to snowfall variation and the transition from snowfall to rainfall in the CTMR (Zhang et al., 2019; Ren et al., 2020, 2022). In Northwestern China, including the CTMR, a semi-sinusoid curve is capable of accurately fitting the intra-annual distribution of air temperature (Li et al., 2015). Similar to the diverse RSTs observed across the Northern Hemisphere (Jennings et al., 2018), precipitation phase records from the 1950s to 1979 can be utilized to obtain spatially inconsistent RSTs in the CTMR using the approach of Dai (Dai, 2008; Zhang et al., 2017).
Quantifying changes in the PSP is crucial for enhancing our comprehension of current and future climate change, which in turn facilitates the development of adaptation policies. However, few technical studies have focused on the PSP and its variability in the CTMR. Therefore, to address these knowledge gaps, we first define three indicators of the PSP in combination with the semi-sinusoid curve and RST line. Subsequently, we explore the variation in the PSP in the past, present, and future using available meteorological station observations in the CTMR and data from 14 models from the CMIP6 (Phase 6 of the Coupled Model Intercomparison Project) under four distinct scenarios. The following section of the paper provides further details regarding the study area, data, and methods, including the definition of three indicators of the PSP. We then evaluate changes in the PSP throughout the CTMR in Sect. 3. The paper ends with the discussion and conclusions.
2.1 Study area
Situated in the heart of the Eurasian continent, Tianshan is the largest mountain system in Central Asia, spanning about 2500 km in length and approximately 250–350 km in width, covering an area of 8×10⁵ km2 that extends over parts of Uzbekistan, Kyrgyzstan, southeastern Kazakhstan, and Xinjiang (China) (Aizen et al., 1997; Yang et al., 2019; Li et al., 2020). The CTMR, located within Xinjiang, China, comprises about 5.7×10⁵ km2 (about 1700 km in length) and accounts for 34.5 % of the total area of the Xinjiang Uygur Autonomous Region (Fig. 1; Hu, 2004; Li et al., 2020). The average altitude of the mountain ridge is 4000 m a.s.l. (meters above sea level), with the highest peak being Tomor (7435 m a.s.l.). The CTMR exhibits a typical alpine mountainous environment with a continental climate that features significant seasonal differences. Mainly influenced by the westerly circulation and topography, the CTMR receives abundant precipitation and is considered to be the main source of water resources in Xinjiang. The annual mean air temperature and the annual precipitation are 7.7 ∘C and 189.58 mm, respectively (Li et al., 2016, 2020). The warming trend in the CTMR is widespread and characterized by significant seasonal variation (Li et al., 2022). Snowfall in the CTMR is primarily observed from November to February, while rainfall, snowfall, or sleet coexist in March and April. In recent years, both snowfall and rainfall in the CTMR have displayed a significant increasing trend, with the growth rate of rainfall being greater than that of snowfall and the S / P (the fraction of snowfall to precipitation) showing a significant decreasing trend (Guo and Li, 2015; Zhang et al., 2019). Winter snowfall can reach 84.53 mm with a slight increase (Yang et al., 2022). Moreover, there has been a noticeable shift from solid to liquid precipitation, with the frequency of rainfall increasing and that of snowfall decreasing (Tian et al., 2020; Li, 2021).
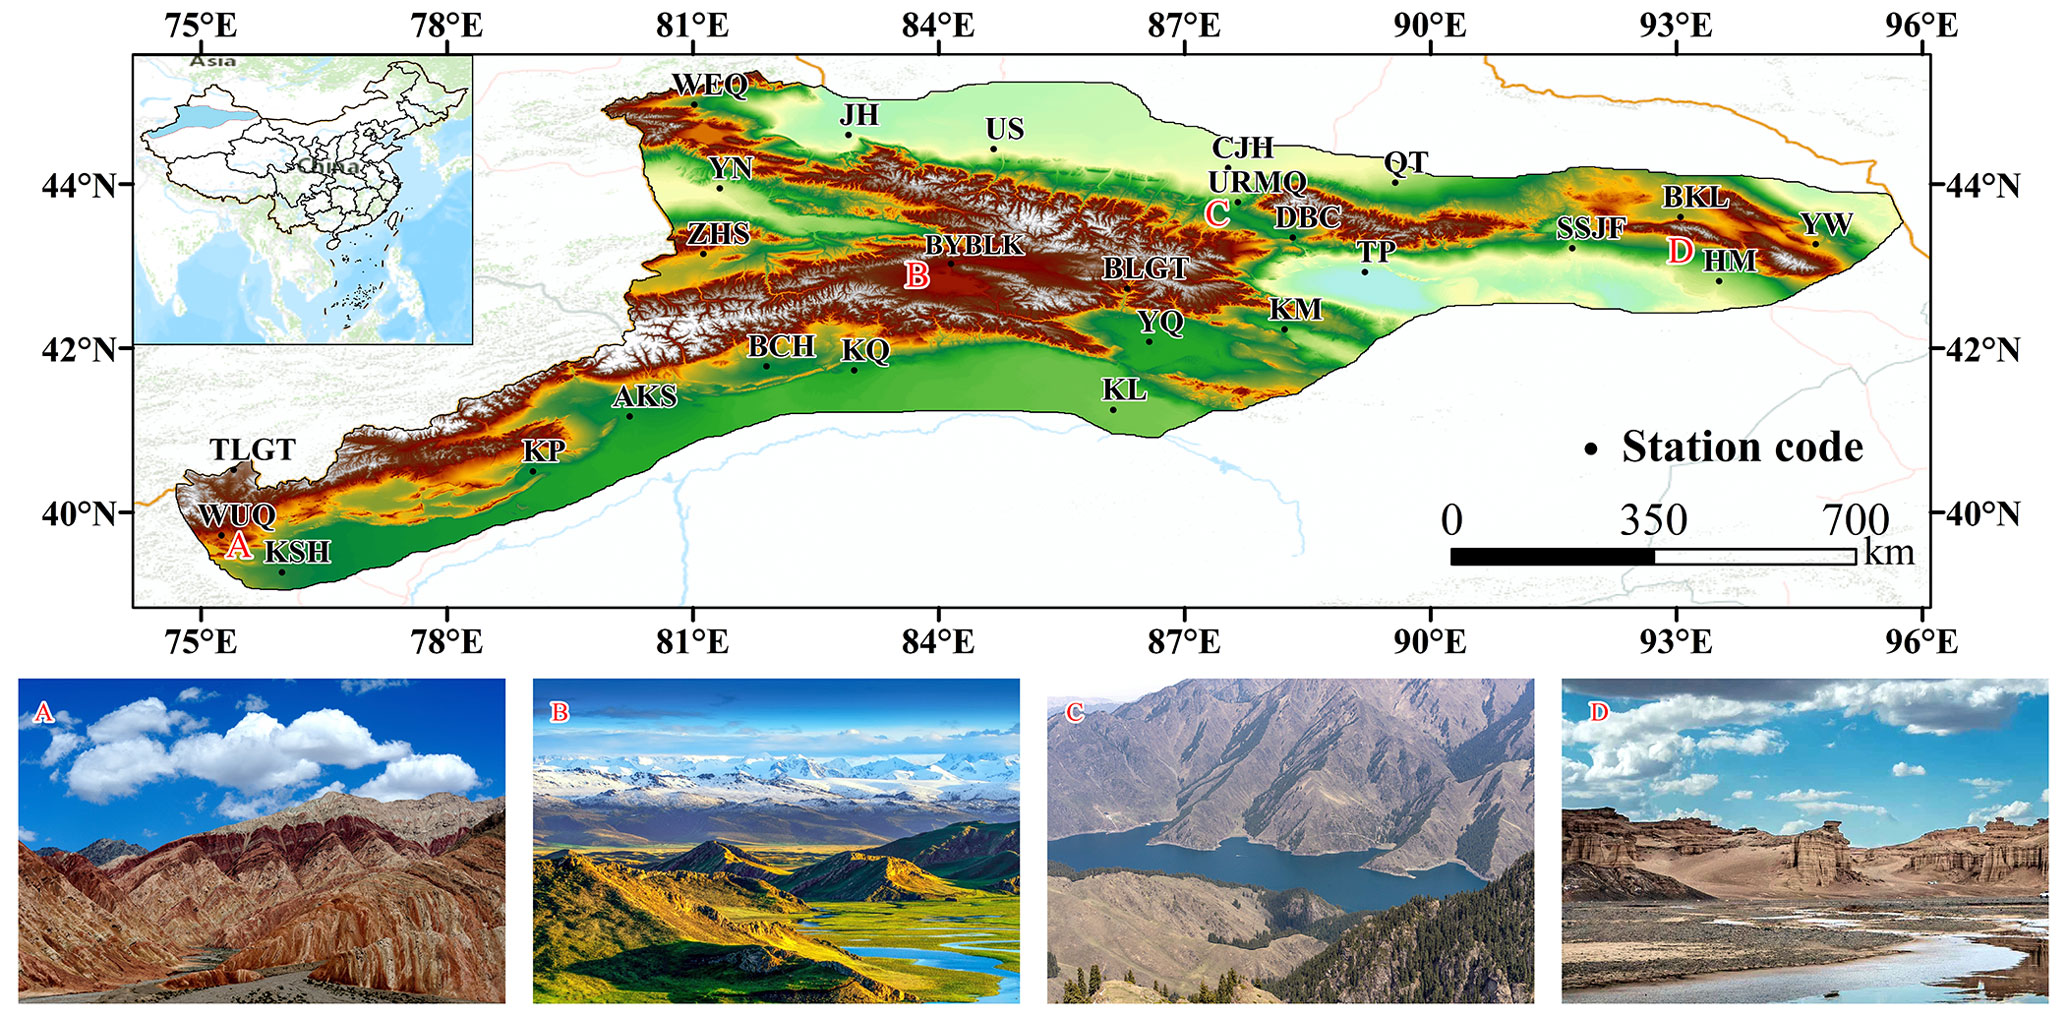
Figure 1Distribution of meteorological stations in the CTMR. The full name and descriptive information of all of the selected meteorological stations are given in Table 1. Panels (a)–(d) show photos of Wuqia, Bayanbulak Plain, Tianchi Lake, and Hami, from https://dp.pconline.com.cn/photo/2130372_8.html (last access: 29 March 2023), http://www.chuquwanwanba.com/mobile/index/show/catid/25/id/714.html (last access: 29 March 2023), https://www.zcool.com.cn/work/ZMzUyODcyODg=.html (last access: 29 March 2023), and http://lvyou.ycwb.com/2019-07/15/content_30297912.htm (last access: 29 March 2023), respectively.
2.2 Data
2.2.1 Observed historical daily air temperature data
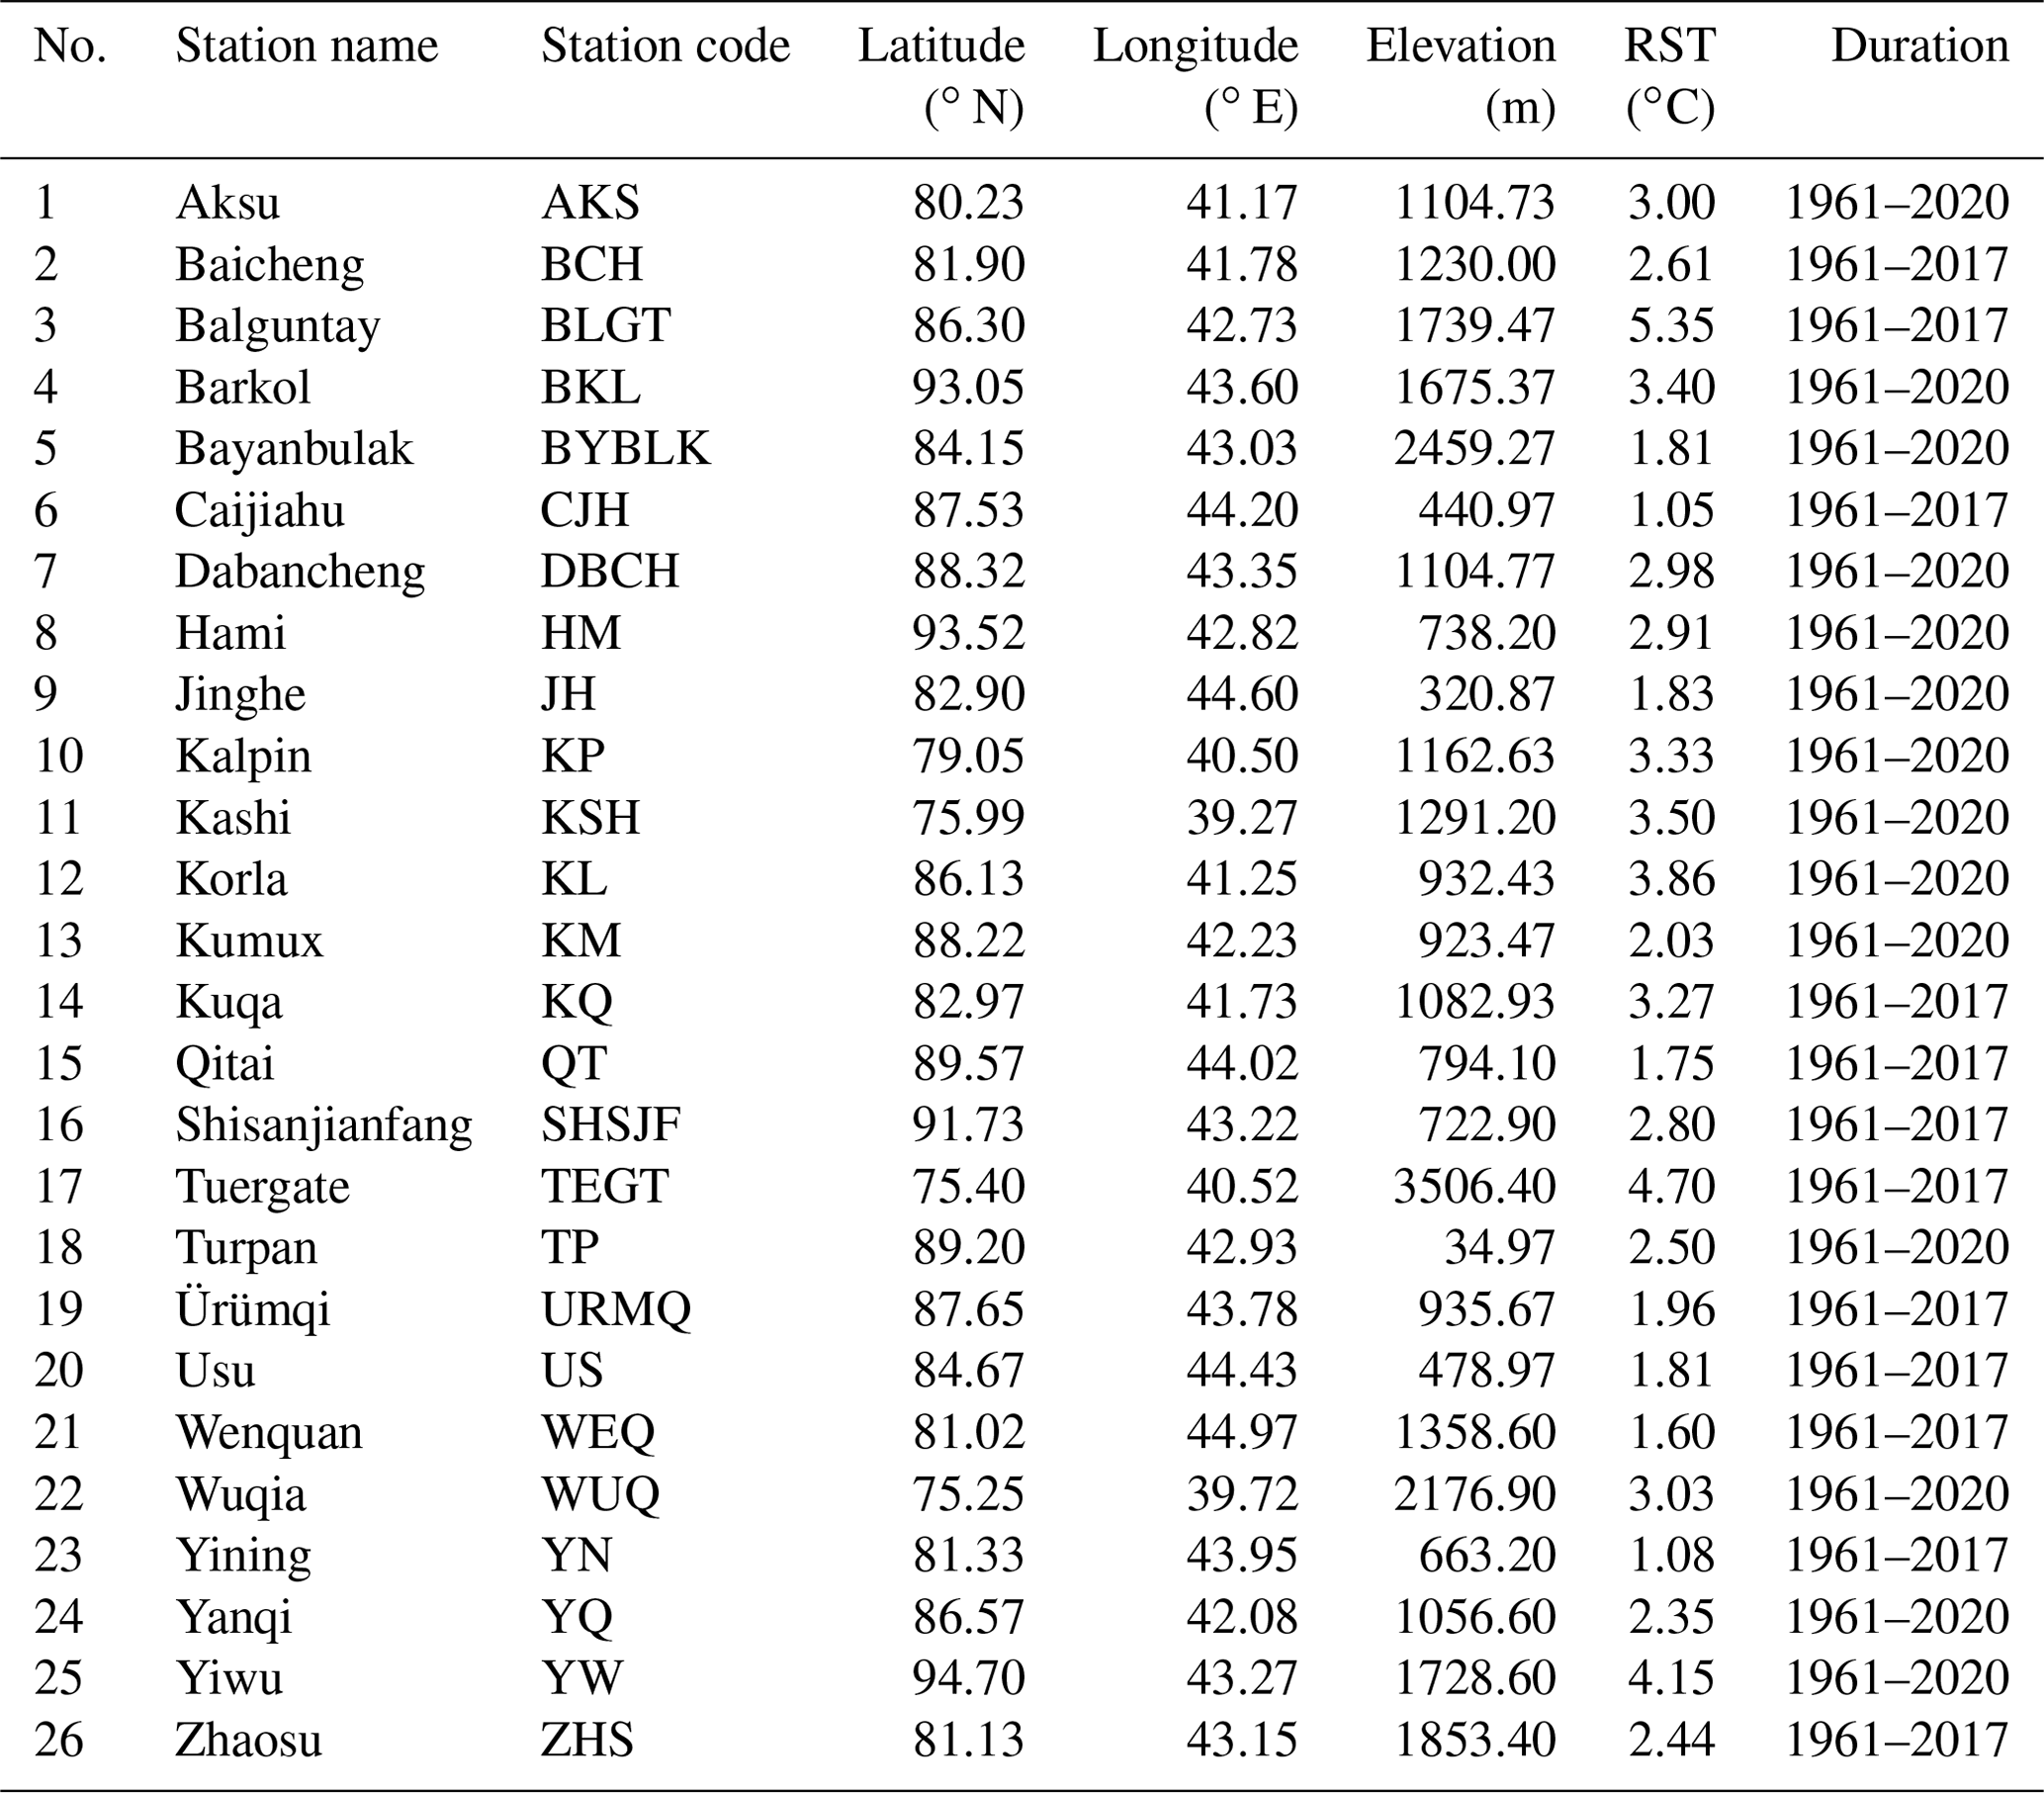
This study used the observed daily air temperature data covering 1961–2017/2020 from 26 meteorological stations in the CTMR (see Fig. 1), provided by the China Meteorological Data Service Centre (http://data.cma.cn, last access: 30 June 2021). Prior to release, the data quality was meticulously checked, and homogeneity tests were conducted, as described in previous studies (Jiang et al., 2009; X. Li et al., 2015, 2020). Subsequently, the daily air temperature data were subjected to a quality control process involving visualizing individual stations or grid records to identify outliers, which were either removed or corrected. Only a small fraction of the data required correction, and missing daily values, which accounted for less than 2 % of the total data, were estimated for a given day by extrapolating the average value of the data from the one or two preceding and following records. Time series with more than 1 year of missing data from meteorological stations were excluded from this study. Finally, daily air temperature data from 12 meteorological stations during 1961–2017 and from 14 meteorological stations during 1961–2020 were used for analysis. Furthermore, the precipitation phase after 1979 in the CTMR, and even across China, is not recorded (Ding et al., 2014). Visual observer reports of daily precipitation phase are only available from the 1950s to 1979 from 26 meteorological stations across the CTMR, with a total number of 237 115 records. Although values of the RST or proportions were not included in the observational data, we used daily precipitation phase data to calculate the RSTs using two methods: the frequency intersection method and the probability guarantee method (Zhang et al., 2017), which evolved from the approach of Dai (2008) and Jennings et al. (2018), respectively. The average value of the RSTs computed by these two methods for each station was used as the threshold to differentiate between potential rainfall and snowfall. The average accuracy rates for snowfall and rainfall from the 1950s to 1979 were 0.96 and 0.94, respectively. For details on the methods, the reader is referred to work from Dai (2008) and Zhang et al. (2017). Figure 2 and Table 1 present the accuracy rate of discriminating snowfall and rainfall using the RST value for each meteorological station in the CTMR and the details of the 26 meteorological stations, respectively.
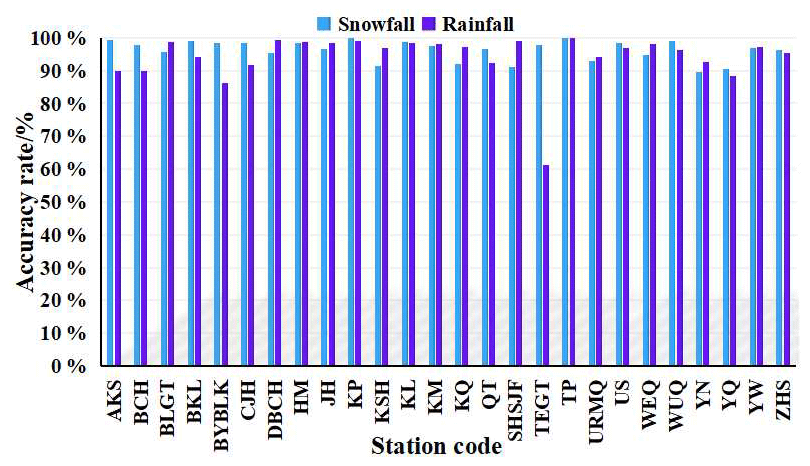
Figure 2Accuracy rate of discriminating snowfall and rainfall using the RST value for each meteorological station in the CTMR.
Table 1Descriptive information for the selected meteorological stations in the CTMR, including their name, code, latitude, longitude, elevation, RST, and measurement duration.
2.2.2 The modeled future daily air temperature data
The Shared Socioeconomic Pathways (SSPs) describe social change in the future in the absence of climate policy intervention within CMIP6 (O'Neill et al., 2016). The SSP126, SSP245, SSP370, and SSP585 scenarios correspond to the anthropogenic radiative forcing stabilized at 2.6, 4.5, 7.0, and 8.5 W m−2 in 2100, respectively (Zhang et al., 2019). Daily air temperature data from 14 models, namely, ACCESS-ESM1-5, BCC-CSM2-MR, CanESM5, CESM2-WACCM, CMCC-ESM2, CNRM-CM6-1, CNRM-ESM2-1, INM-CM4-8, INM-CM5-0, IPSL-CM6A-LR, MIROC6, MRI-ESM2-0, NorESM2-LM, and NorESM2-MM were chosen for this paper (see Table 2). The models were capable of providing daily air temperature under the SSP126, SSP245, SSP370, and SSP585 scenarios spanning from 2021 to 2100. As the model resolutions were unsuitable for regional change and differed from the horizontal resolution of observation data, the horizontal resolution was resampled to 0.25∘ × 0.25∘. The multi-model ensemble averaging method and the bilinear interpolation method were used to interpolate the model data to meteorological stations across the CTMR in order to mitigate uncertainty among modes and to facilitate better comparison and analysis of model data with the observation data. The delta-deviation correction method was employed to correct the deviation between the bilinearly interpolated, multi-model-averaged, and observed daily temperature data (Li, 2021). The period, 2021–2100, was divided into 2021–2040, 2041–2070, and 2071–2100, respectively. Finally, the daily 14-model ensemble-averaged air temperature under four scenarios during three periods was used to analyze the future change in PSP indicators in the CTMR.
Table 2Basic information for 14 models from the CMIP6.
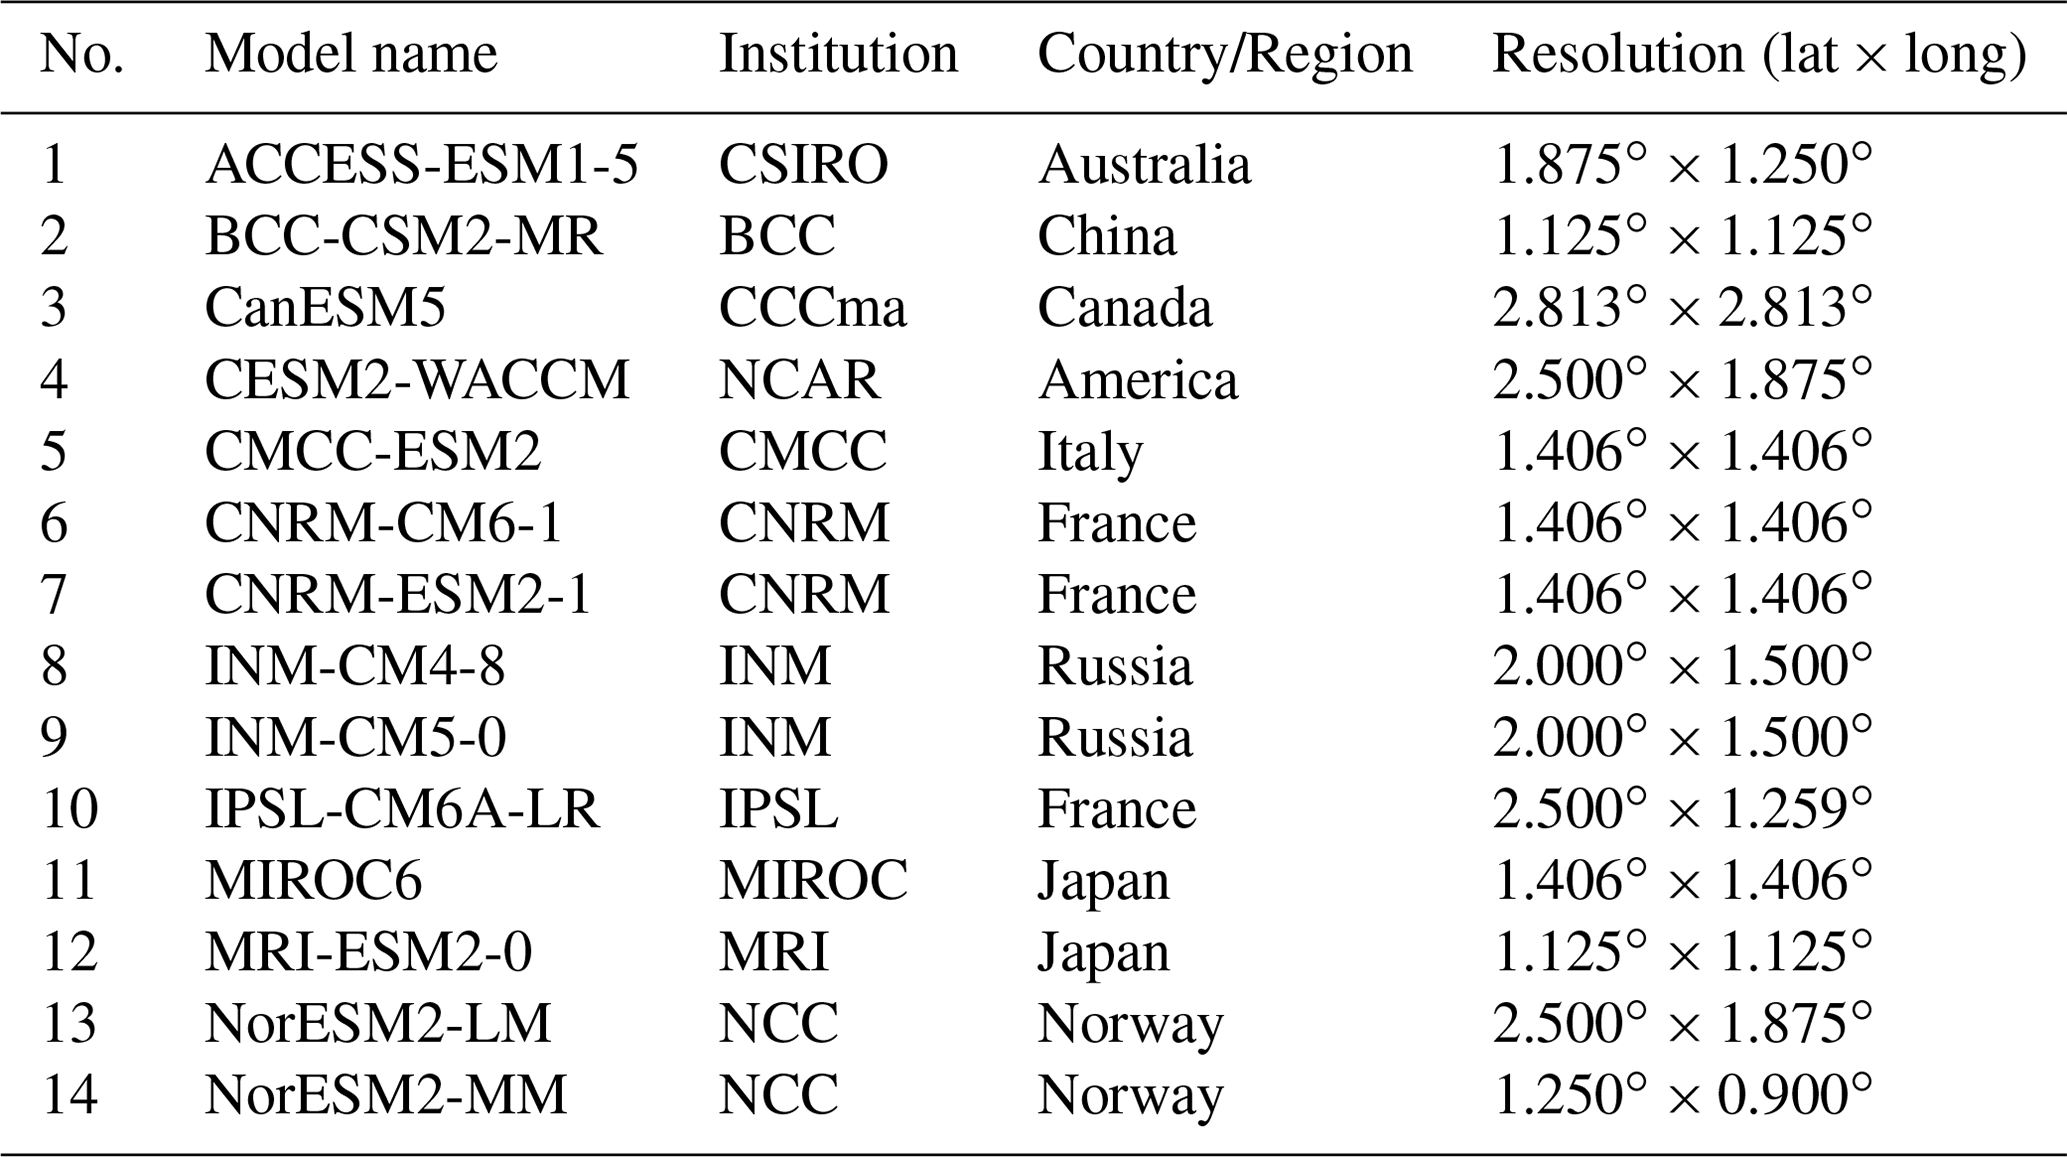
The institutions mentioned in the table are as follows: CSIRO – Commonwealth Scientific and Industrial Research Organisation; BCC – Beijing Climate Centre; CCCma – Environment and Climate Change Canada; NCAR – National Center for Atmospheric Research; CMCC – Centro Euro-Mediterraneo sui Cambiamenti Climatici; CNRM – National Centre for Meteorological Research; INM – Institute of numerical mathematics, Russian Academy of Sciences; IPSL – Institute Pierre-Simon Laplace; MIROC – Model for Interdisciplinary Research on Climate; MRI – Meteorological Research Institute; and NCC – Norway Climate Centre
2.3 Methods
2.3.1 Definition of PSP indicators
The intra-annual distribution of daily mean air temperature for a site can be described using the semi-sinusoidal curve function, which has been previously shown to fit the 10 d air temperature distribution well across Northwestern China (Li et al., 2015). The equations for the EPSS, SPSS, and LPSS for a site are as follows:
Here, i represents the year (i=1961, 1962, 1963, …, 2100) and t represents the day of the Julian year (DOY, t=1, 2, 3, …, 365 or 366). The semi-sinusoidal curve function simulates the daily mean air temperature time series of the ith year, Ti, based on shape parameters Ai, ωi, and φi, which are estimated using the nonlinear least-squares method. RST is the rain–snow threshold. EPSSi stands for the left intersection point and SPSSi for the right intersection point within the ith year for a site. Similarly, EPSSi+1 stands for the left intersection point and SPSSi+1 for the right intersection point within the (i+1)th year for a site (see Fig. 3). In addition, LPSS is the horizontal distance from SPSSi to EPSSi+1 and can be calculated by Eq. (4). Therefore, for a site, EPSS and SPSS are from 1961 to 2017/2020, whereas the LPSS is from 1962 to 2017/2020.
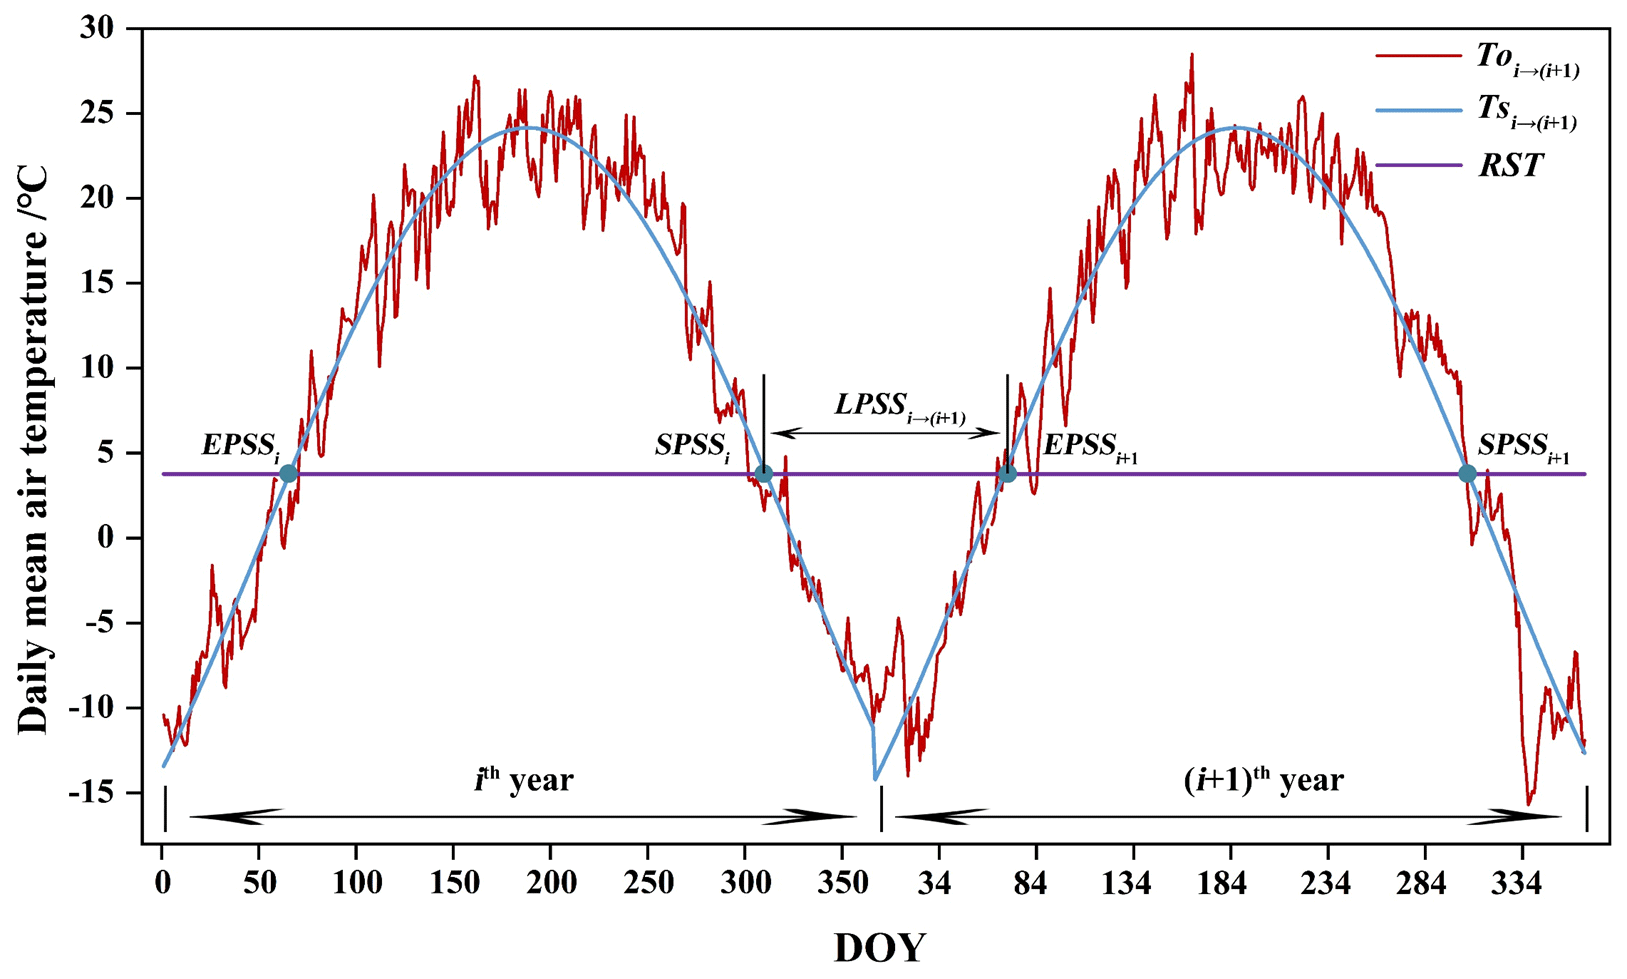
Figure 3The fitting curve, the observed curve of daily mean air temperature within 2 consecutive years (the ith year and the (i+1)th year), and three PSP indicators for a location in the CTMR. The abbreviations used in the figure are as follows: EPSS – the end of the potential snowfall season, SPSS – the start of the potential snowfall season, and LPSS – the length of the potential snowfall season.
2.3.2 Mann–Kendall monotonic test method
The nonparametric Mann–Kendall (M-K) test method has the advantages of not requiring data to follow a specific distribution and of being less sensitive to outliers and missed values (Kendall, 1990). This method is widely applied for detecting the significance of long-term trends in a time series from hydrology and climatology, such as air temperature, precipitation, and runoff (Li et al., 2011, 2022). For detailed information about this method, the reader is referred to Kendall (1990) and Li et al. (2011). This paper employed the M-K test method to test the changing trends in PSP indicators throughout the study area.
3.1 General characteristic of PSP indicators in the past and present
Three PSP indicators, the SPSS, the EPSS, and the LPSS, for each station across the CTMR, were calculated using Eqs. (2)–(4). The SPSS, the EPSS, and the LPSS values differed among 26 stations. The average values of the SPSS, the EPSS, and the LPSS were DOY 307, the DOY 78, and 136 d, respectively. Figure 4 shows the spatial distribution of the SPSS, EPSS, and LPSS across the CTMR. The SPSS mainly occurred after DOY 301 (approximately 27 October) and ranged from the 256 to DOY 326 (approximately 12 September to 21 November). The EPSS values mainly happened before DOY 61 (2 March) and ranged from DOY 50 to 139 (approximately 19 February to 18 May). The LPSS ranged from 90 to 248 d (approximately 3 months to 8 months) and was shorter than 150 d (approximately 5 months) in most of the region. The SPSS was earlier, the EPSS was later, and the LPSS was longer in the north and center than in the south. In some areas like BYBLK and TEGT, where the LPSS was longer than 200 d (approximately 7 months). On average, the potential snowfall started on 2 November, ended on about 18 March, and lasted about 136 d across the CTMR.
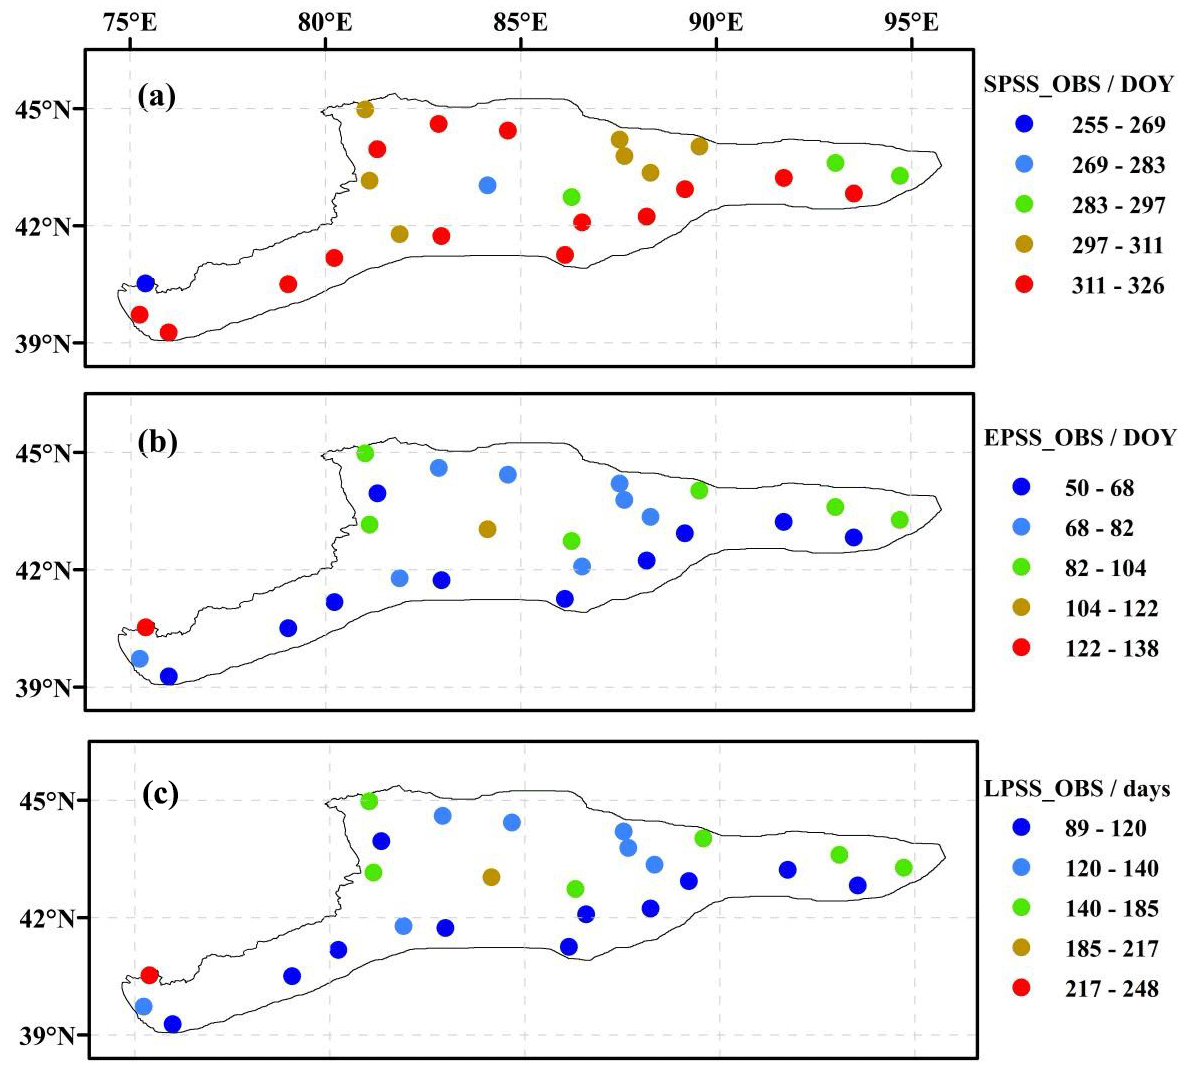
Figure 4Spatial distribution of the average value of the SPSS (a), the EPSS (b), and the LPSS (c) in the CTMR.
3.2 Temporal variation in the PSP indicators in the past and present
All three indicators of the PSP exhibited a noticeable trend during the study period. The SPSS and EPSS both had a significant increasing and decreasing trend, respectively, with a 0.05 confidence level over the last 6 decades (see Fig. 5a). Similar to the EPSS, a statistically significant decreasing trend was observed for the LPSS from 1962 to 2017/2020 (see Fig. 5b). The slopes of the SPSS, EPSS, and LPSS were 1.2, −1.6, and −2.8 d per decade, respectively. This means that the potential snowfall season had a delayed start rate of 1.2 d per decade, an earlier ending rate of 1.6 d per decade, and a reduction of 2.8 d per decade in the duration of the potential snowfall. Moreover, the rate of advancement for the EPSS was higher than that of the SPSS delay.
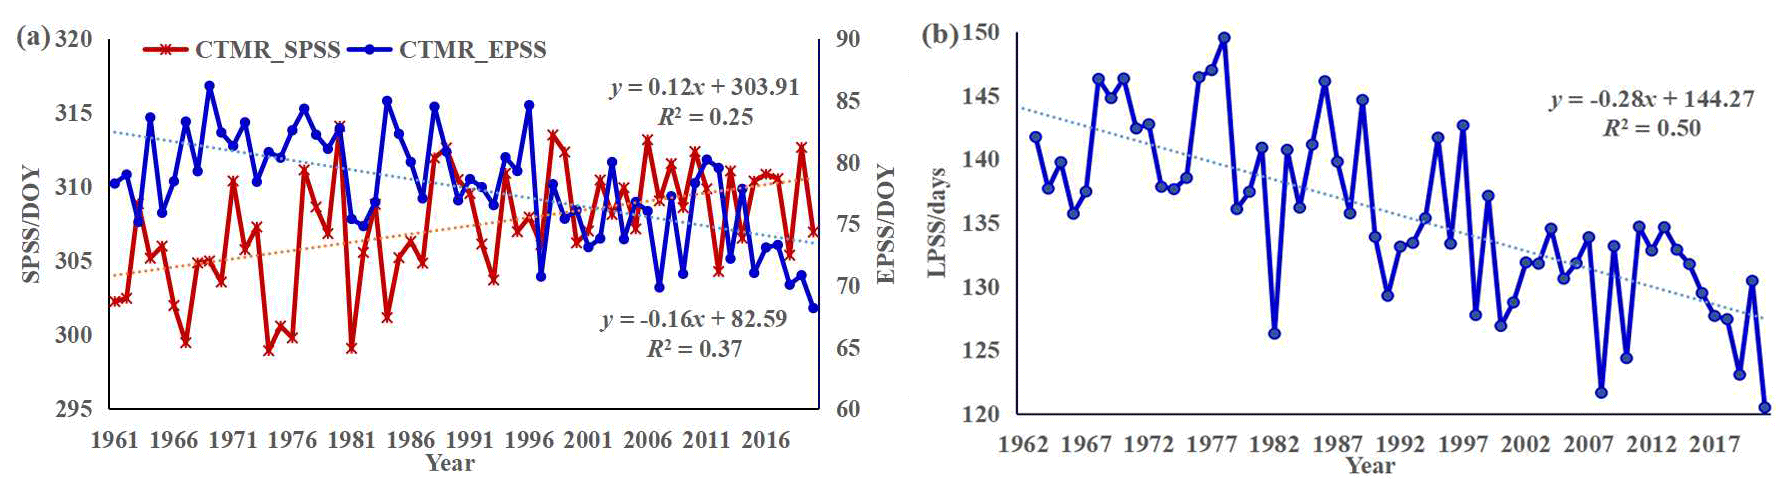
Figure 5Annual time series and their trends in the SPSS and EPSS (a) during 1961–2020 and the LPSS (b) during 1962–2020 in the CTMR.
3.3 Spatial pattern of PSP indicators in the past and present
During 1961–2017/2020, a majority of the studied region experienced an upward trend in the SPSS and a downward trend in both the EPSS and LPSS, respectively. This implies that potential snowfall mostly started later, ended earlier, and lasted for a shorter duration. Five stations, namely, DBCH, HM, KL, KQ, and KP, did not exhibit any significant changing trends for the SPSS. Additionally, BYBLK, KQ, and TEGT showed no significant changes in the EPSS. The LPSS did not exhibit a significant changing trend in KQ and TEGT due to the nonsignificant changing trend in the SPSS or EPSS. The SPSS, which increased in most of the area, caused the potential snowfall season to start approximately 2–13 d later. Conversely, the EPSS decreased across the area, causing the potential snowfall season to end about 1–13 d earlier. Consequently, the LPSS experienced a reduction of approximately 3–26 d across the area (see Fig. 6). This reduction in potential snowfall days may cause a decrease in the annual total snowfall (Räisänen, 2016).
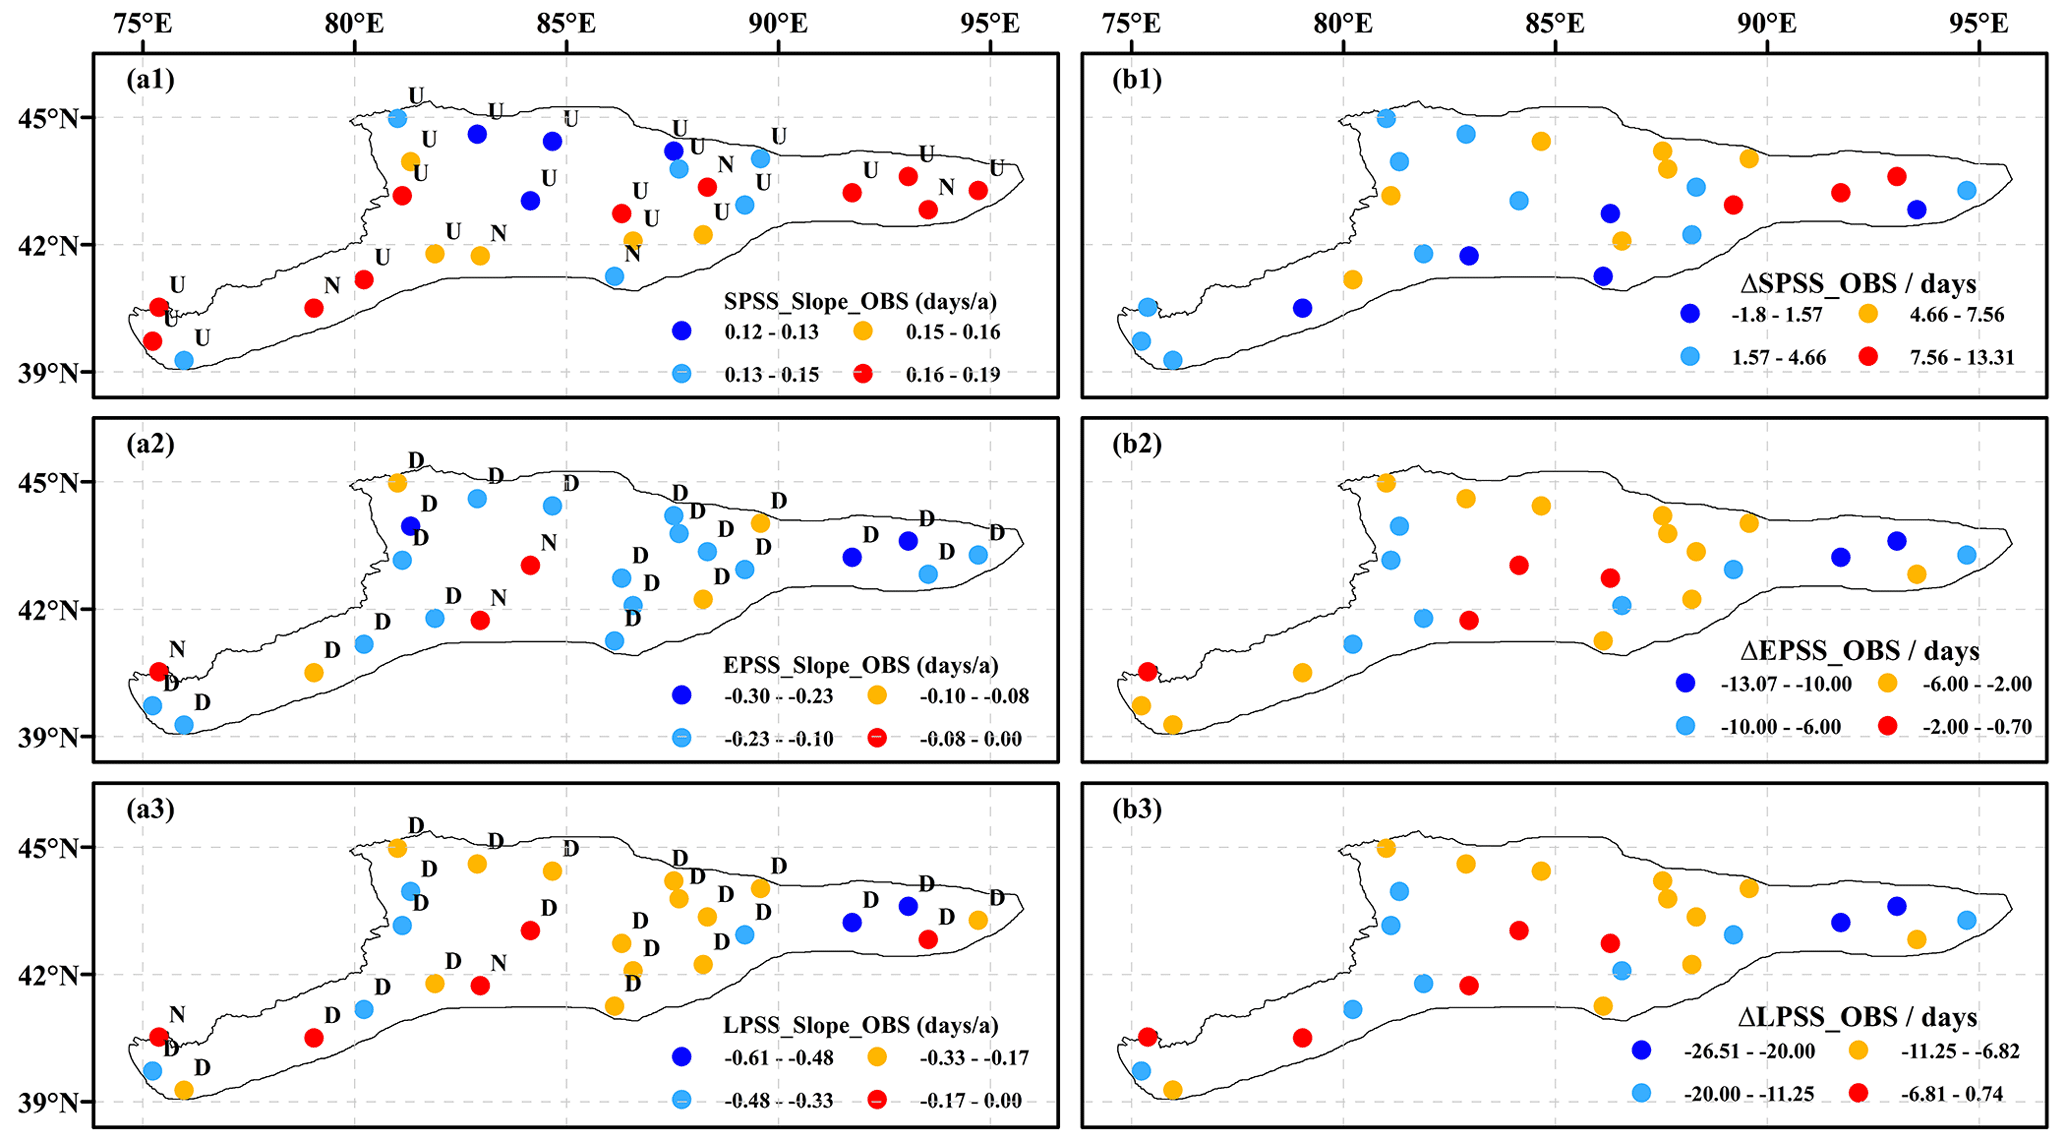
Figure 6Changing trends and slopes of the SPSS (a1), EPSS (a2), and LPSS (a3) and their amplitude of variation (b1–b3) across the CTMR during 1961/1962–2017/2020. The abbreviations used in the figure are as follows: D is a significant downward trend at the 0.05 significance level, N is no trend, and U is a significant upward trend at the 0.05 significance level.
3.4 Temporal tendency of PSP indicators in the future
Figure 7 shows the time series of three PSP indicators in the CTMR from 2021 to 2100 and their average values during three periods (2021–2040, 2041–2070, and 2071–2100) under four different scenarios.
The SPSS is projected to increase under all four scenarios from 2021 to 2100, and the rate of increase is steeper under the higher emission scenario compared with that under the lower emission scenario (see Fig. 7a1). The average values of the SPSS are expected to increase from 2021–2040 to 2071–2100 under all four scenarios, with the SSP585 scenario showing the steepest rise (see Fig. 7a2). Under the SSP585 scenario, the average value of the SPSS is projected to reach DOY 326 during 2071–2100, indicating a potential snowfall season starting on 21 November in the 2100s.
In contrast, the EPSS will initially remain constant and then increase under the SSP126 scenario, while decreasing trends in the EPSS are expected under the other three scenarios. Values of the EPSS are projected to decrease slightly from the SSP245 scenario to the SSP585 scenario (see Fig. 7b1). Average values of the EPSS will change less during the first two periods and increase slightly during 2071–2100 under the SSP126 scenario. Nevertheless, average values of the EPSS drop in an increasingly steep manner in the three future periods under the SSP245 scenario to the SSP585 scenario (see Fig. 7b2). Under the SSP585 scenario, the average value of the EPSS is expected to reach DOY 65 during 2071–2100, implying that the potential snowfall season ending will occur before 5 March in the 2100s across the CTMR.
Furthermore, the LPSS is projected to decrease in the coming 80 years under all four scenarios, with a steeper downward slope from the SSP126 scenario to the SSP585 scenario (see Fig. 7c1). Average values of the LPSS are expected to decrease from 2021–2040 to 2071–2100 under all four scenarios. The drop will become more pronounced from the SSP126 scenario to the SSP585 scenario. Under the SSP585 scenario, the potential snowfall season is expected to be shortened by up to 48 d, lasting only 88 d in 2071–2100 (see Fig. 7c2).
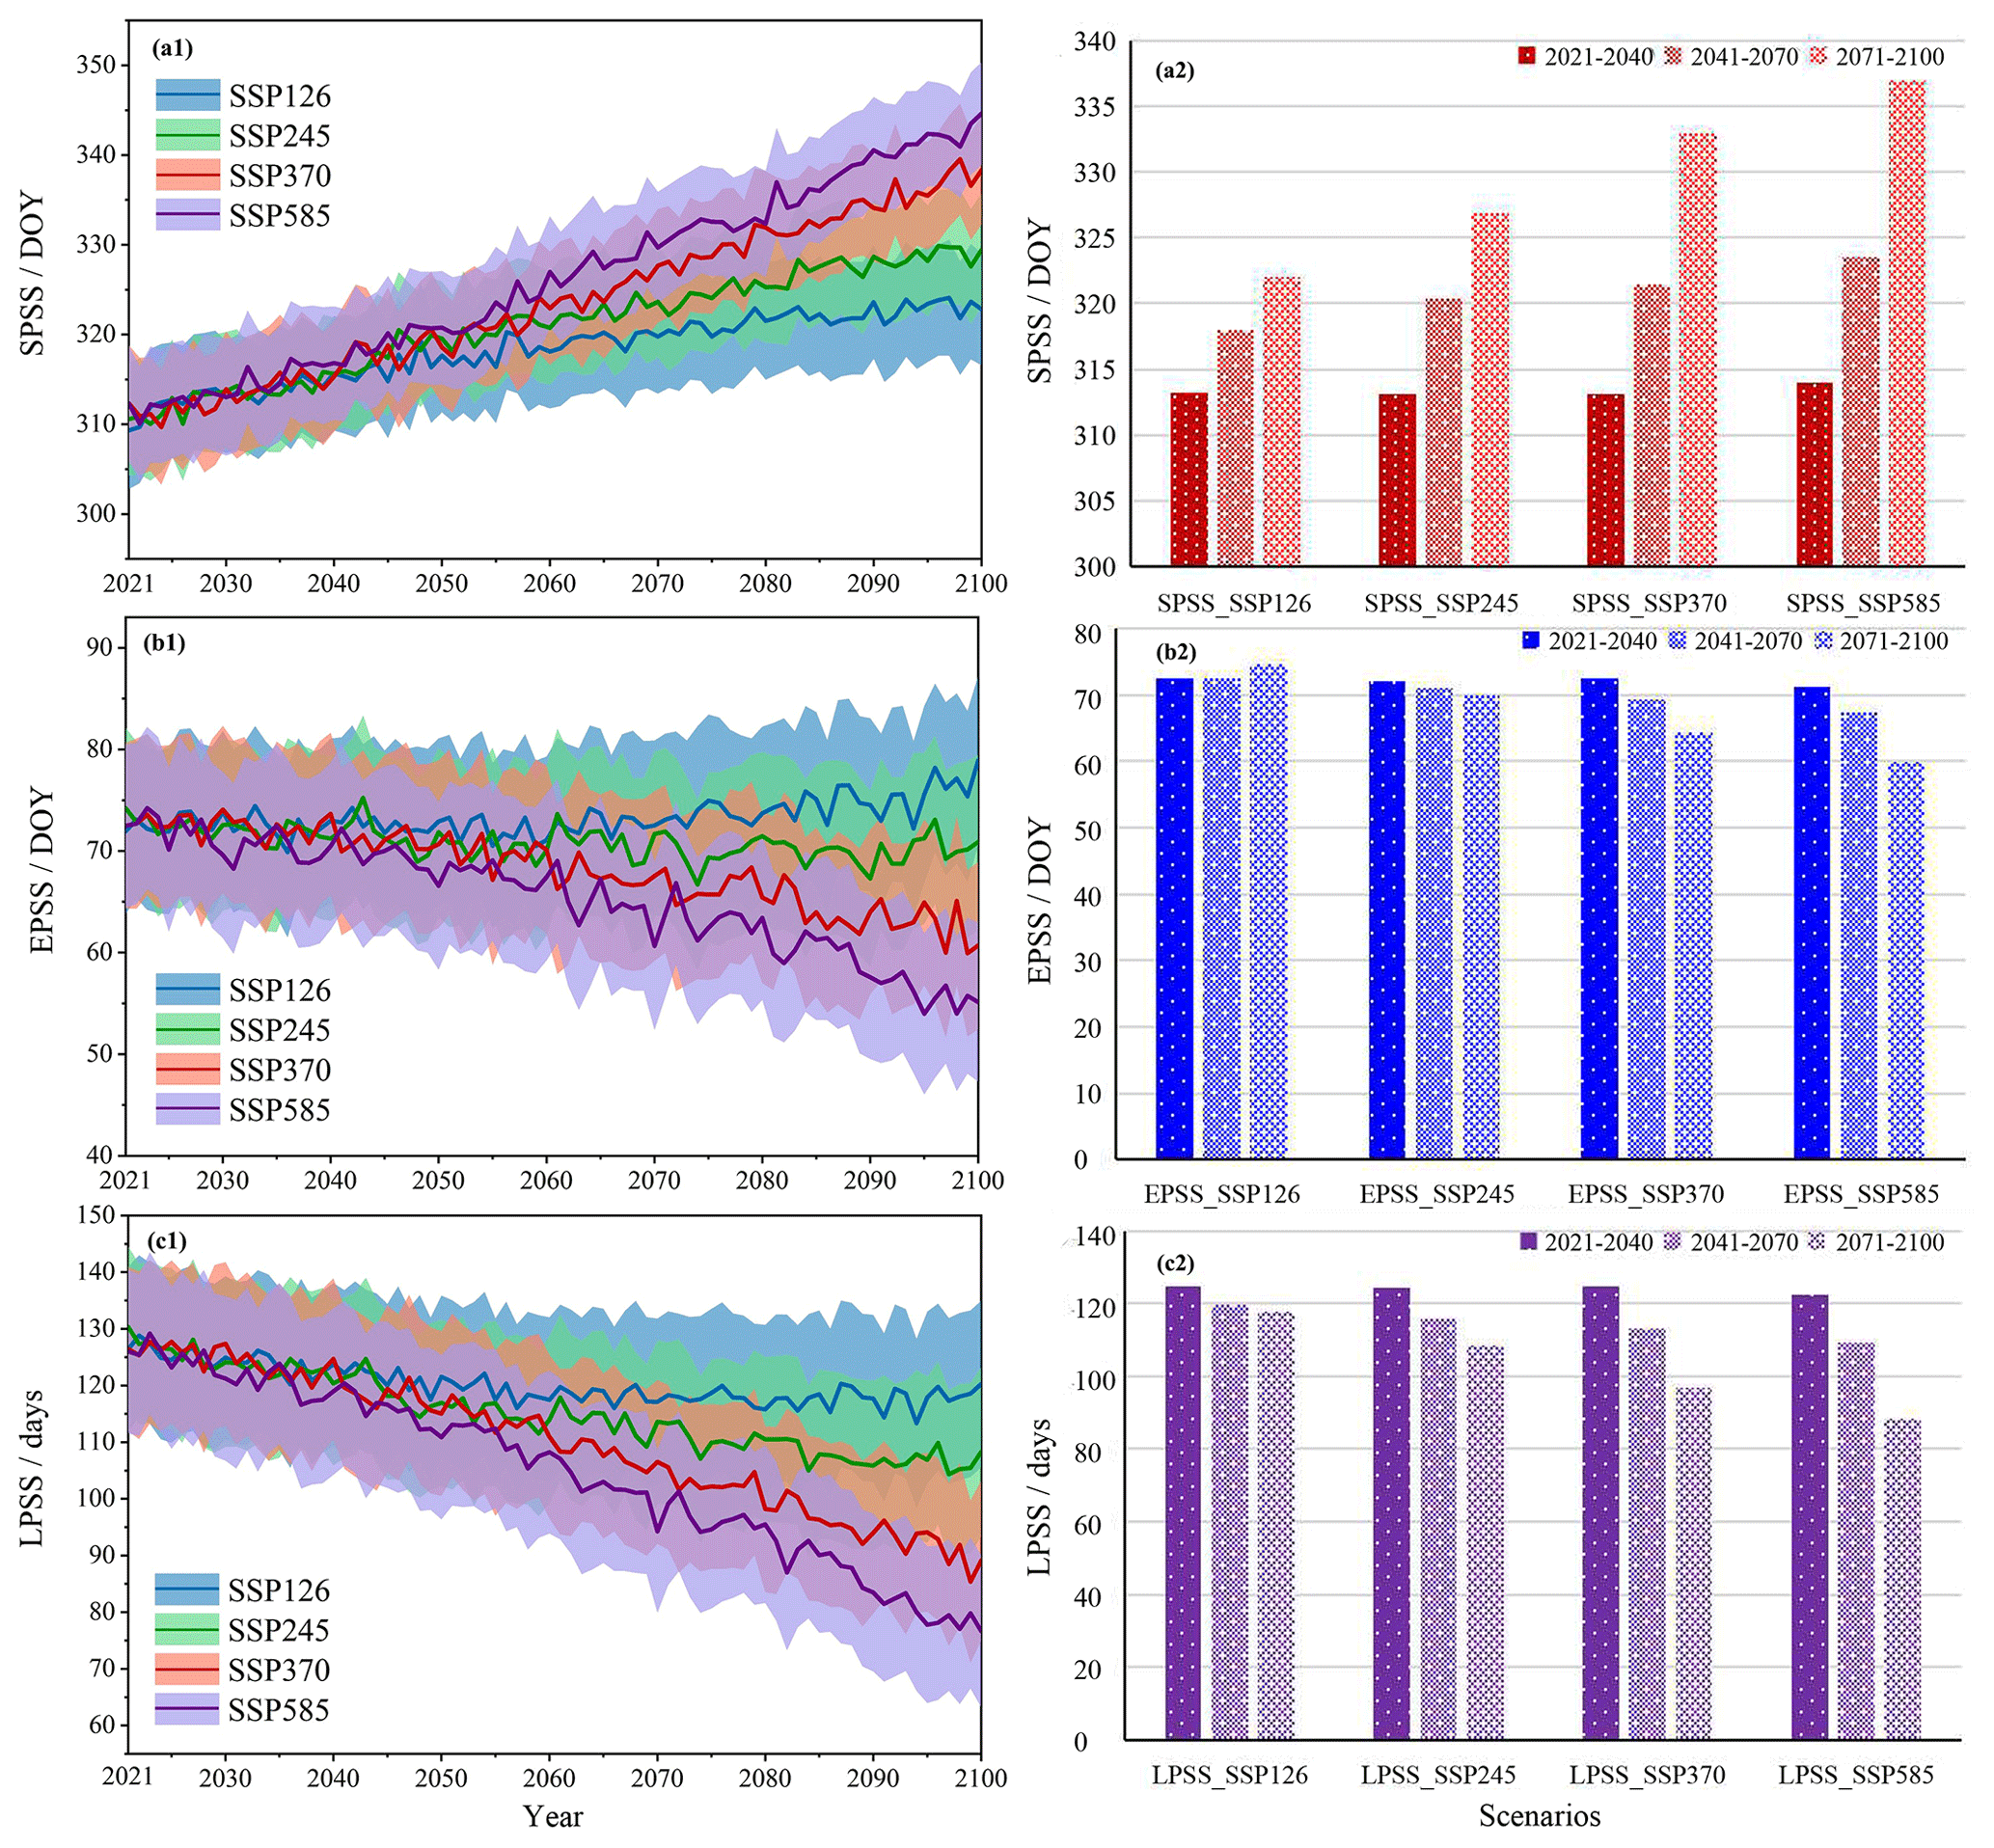
Figure 7Time series of the SPSS (a1), the EPSS (b1), and the LPSS (c1) during 2021–2100 and their average values (a2–c2) during three periods (2021–2040, 2041–2070, and 2071–2100) under all four scenarios (SSP126, SSP245, SSP370, and SSP585) in the CTMR.
3.5 Spatial image of PSP indicators in the future
Figure 8 shows the spatial distribution of the SPSS, EPSS, and LPSS under four scenarios across the CTMR. Values of the SPSS are expected to fall between DOY 266 and 337 (approximately 22 September and 1 December) under the SSP126 scenario, between DOY 269 and 340 (approximately 25 September and 4 December) under the SSP245 scenario, between DOY 273 and 342 (approximately 30 September and 6 December) under the SSP370 scenario, and between DOY 278 and 346 (approximately 4 October and 10 December) under the SSP585 scenario. The EPSS is expected to happen between DOY 46 and 140 (approximately 15 February and 19 May) under the SSP126 scenario, between DOY 44 and 138 (approximately 13 February and 17 May) under the SSP245 scenario, between DOY 42 and 135 (11 February and 14 May) under the SSP370 scenario, and between DOY 40 and 130 (approximately 9 February and 9 May) under the SSP585 scenario. The LPSS is expected to last between 78 and 239 d (approximately 2 months and 18 d to 8 months) under the SSP126 scenario, between 73 and 234 d (approximately 2 months and 13 d to 7 months and 24 d) under the SSP245 scenario, between 69 and 227 d (approximately 2 months and 9 d to 7 months and 17 d) under the SSP370 scenario, and between 64 and 217 d (approximately 2 months and 4 d to 7 months and 7 d) under the SSP585 scenario. As in the past and present, the SPSS will occur earlier, the EPSS will occur later, and the LPSS will last longer in the north and center compared with the south, particularly in BYBLK and TEGT, where the LPSS will last for more than 6 months under all four scenarios.
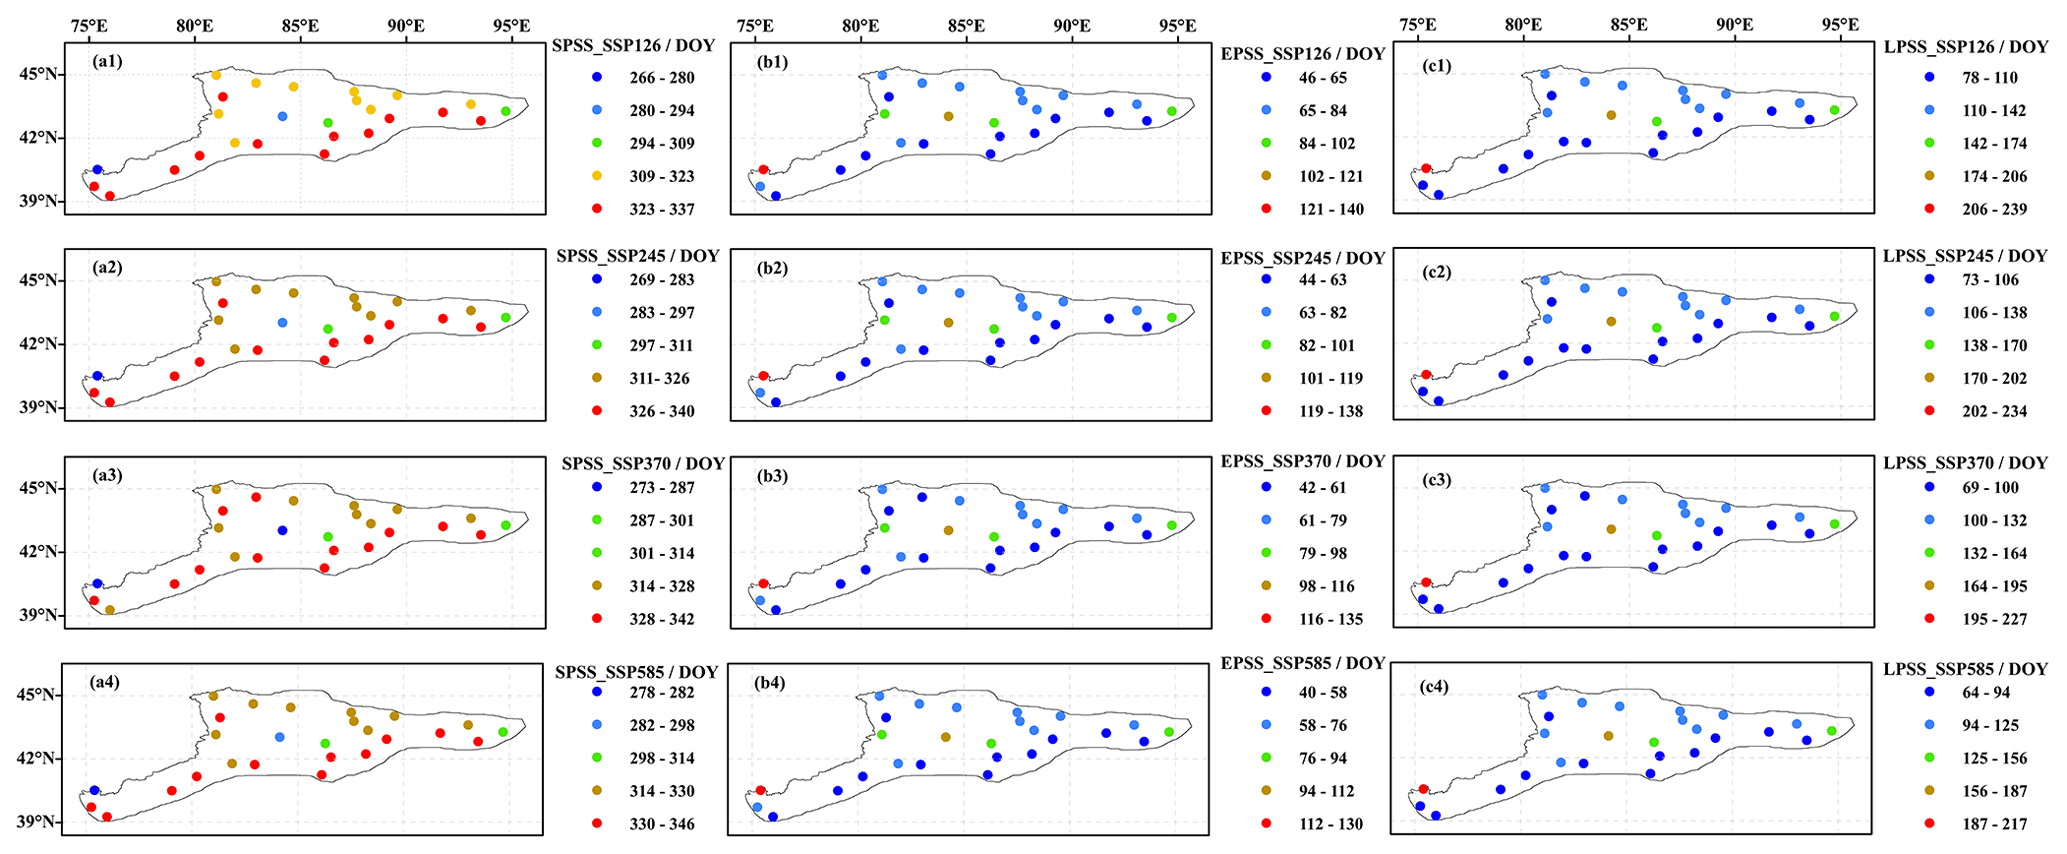
Figure 8Spatial distribution of the average value of the SPSS (a1–a4), EPSS (b1–b4), and LPSS (c1–c4) under four different scenarios (SSP126, SSP245, SSP370, and SSP585) across the CTMR during 2021–2100.
In the coming 80 years (2021–2100), the SPSS in the entire region is expected to have significant upward trends with gradually increasing rates under the SSP126 scenario to the SSP585 scenario, indicating that the potential snowfall season will start much later under the higher emission scenario. The amplitude of variation in the SPSS will increase with the enhancement of scenarios from the SSP126 to the SSP585. The SPSS under the SSP585 scenario is expected to be delayed by 24–41 d. The west and southwest parts will have a faster postponement of the SPSS than the center, and it will delay the starting time of the potential snowfall season more in the west and southwest under all four scenarios (see Fig. 9).
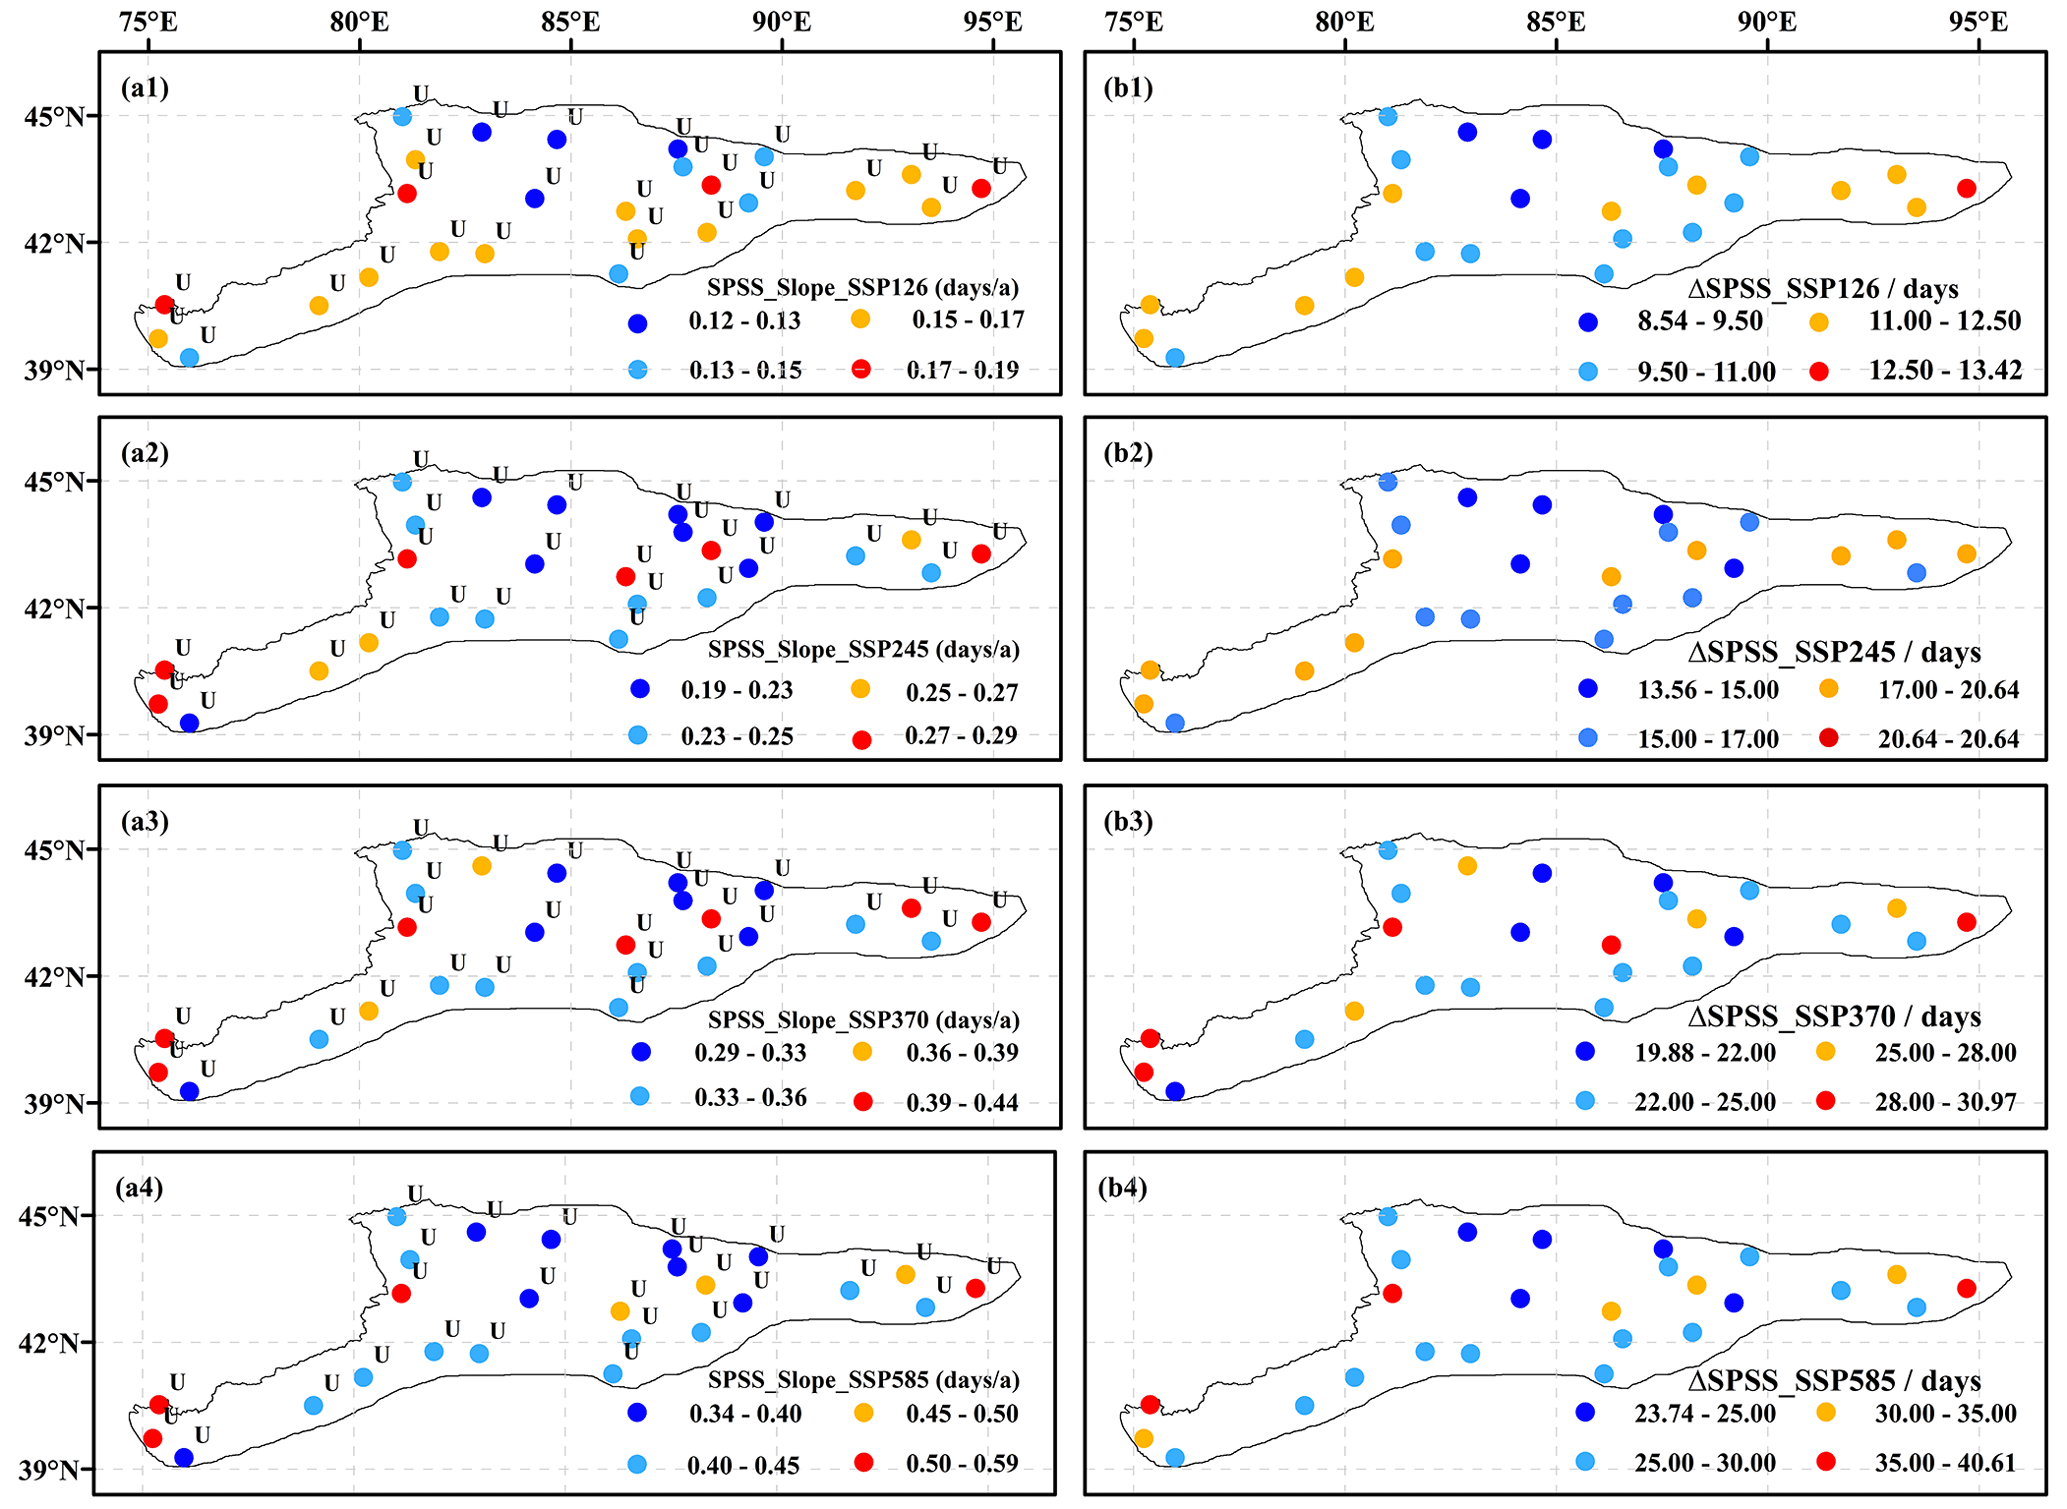
Figure 9Changing trends and slopes of the SPSS under the SSP126 (a1), SSP245 (a2), SSP370 (a3), and SSP585 (a4) scenarios and its amplification (b1–b4) across the CTMR during 2021–2100. The abbreviations used in the figure are as follows: D is a significant downward trend at the 0.05 significance level, N is no trend, and U is a significant upward trend at the 0.05 significance level.
Under the SSP245, SSP370, and SSP585 scenarios, the EPSS displays significant downward trends with gradually increasing rates (slopes) in most of the region. Conversely, under the SSP126 scenario, the EPSS will exhibit significant upward trends ranging from 0.1 to 1.1 d per decade across the whole region. Therefore, the amplitude of variation in the EPSS will also be nonuniform under four future scenarios. Under the SSP126 scenario, the end of the potential snowfall season will be delayed by 1–7 d across the whole region, whereas it will be advanced by 9–23 d under the SSP585 scenario. In the west and southwest of the CTMR, the EPSS will decrease more rapidly, and the ending time will advance further under the SSP245, SSP370, and SSP585 scenarios (see Fig. 10).
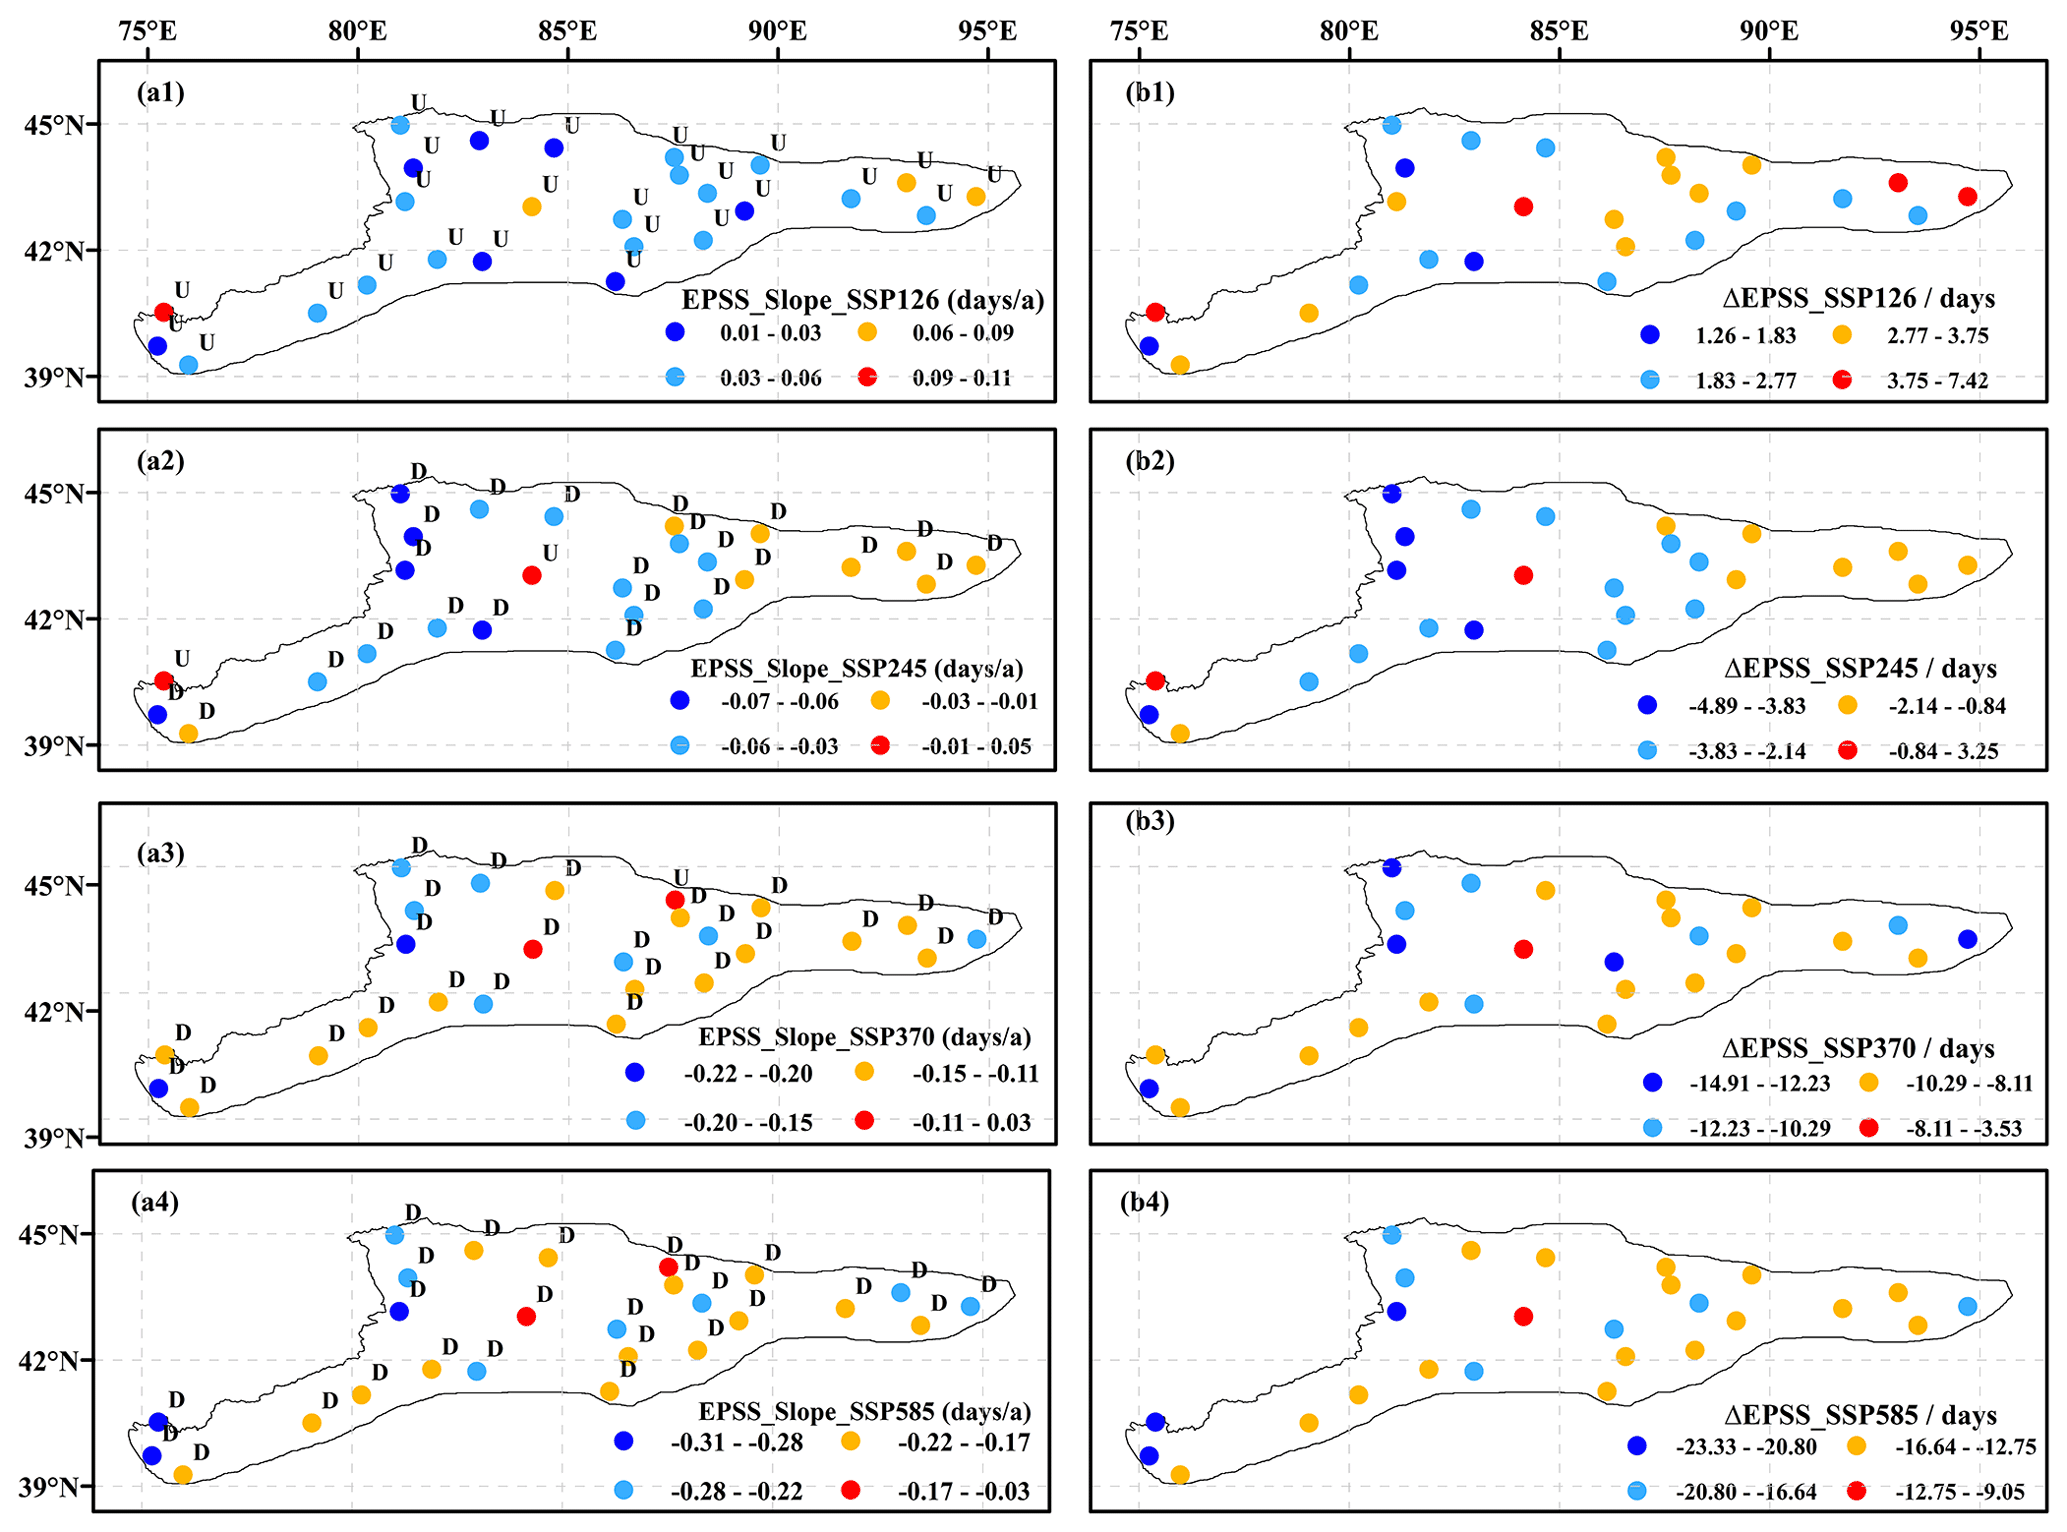
Figure 10Changing trends and slopes of the EPSS under the SSP126 (a1), SSP245 (a2), SSP370 (a3), and SSP585 (a4) scenarios and its amplification (b1–b4) across the CTMR during 2021–2100. The abbreviations used in the figure are as follows: D is a significant downward trend at the 0.05 significance level, N is no trend, and U is a significant upward trend at the 0.05 significance level.
Consequently, the LPSS exhibits notable negative trends with progressively increasing slopes from the SSP126 scenario to the SSP585 scenario. It will contract the duration of the potential snowfall season by 5–10, 12–26, 24–45, and 33–61 d under the SSP126, SSP245, SSP370, and SSP585 scenarios, respectively. In the west and southwest of the CTMR, the LPSS will be truncated even further under all four scenarios (see Fig. 11).
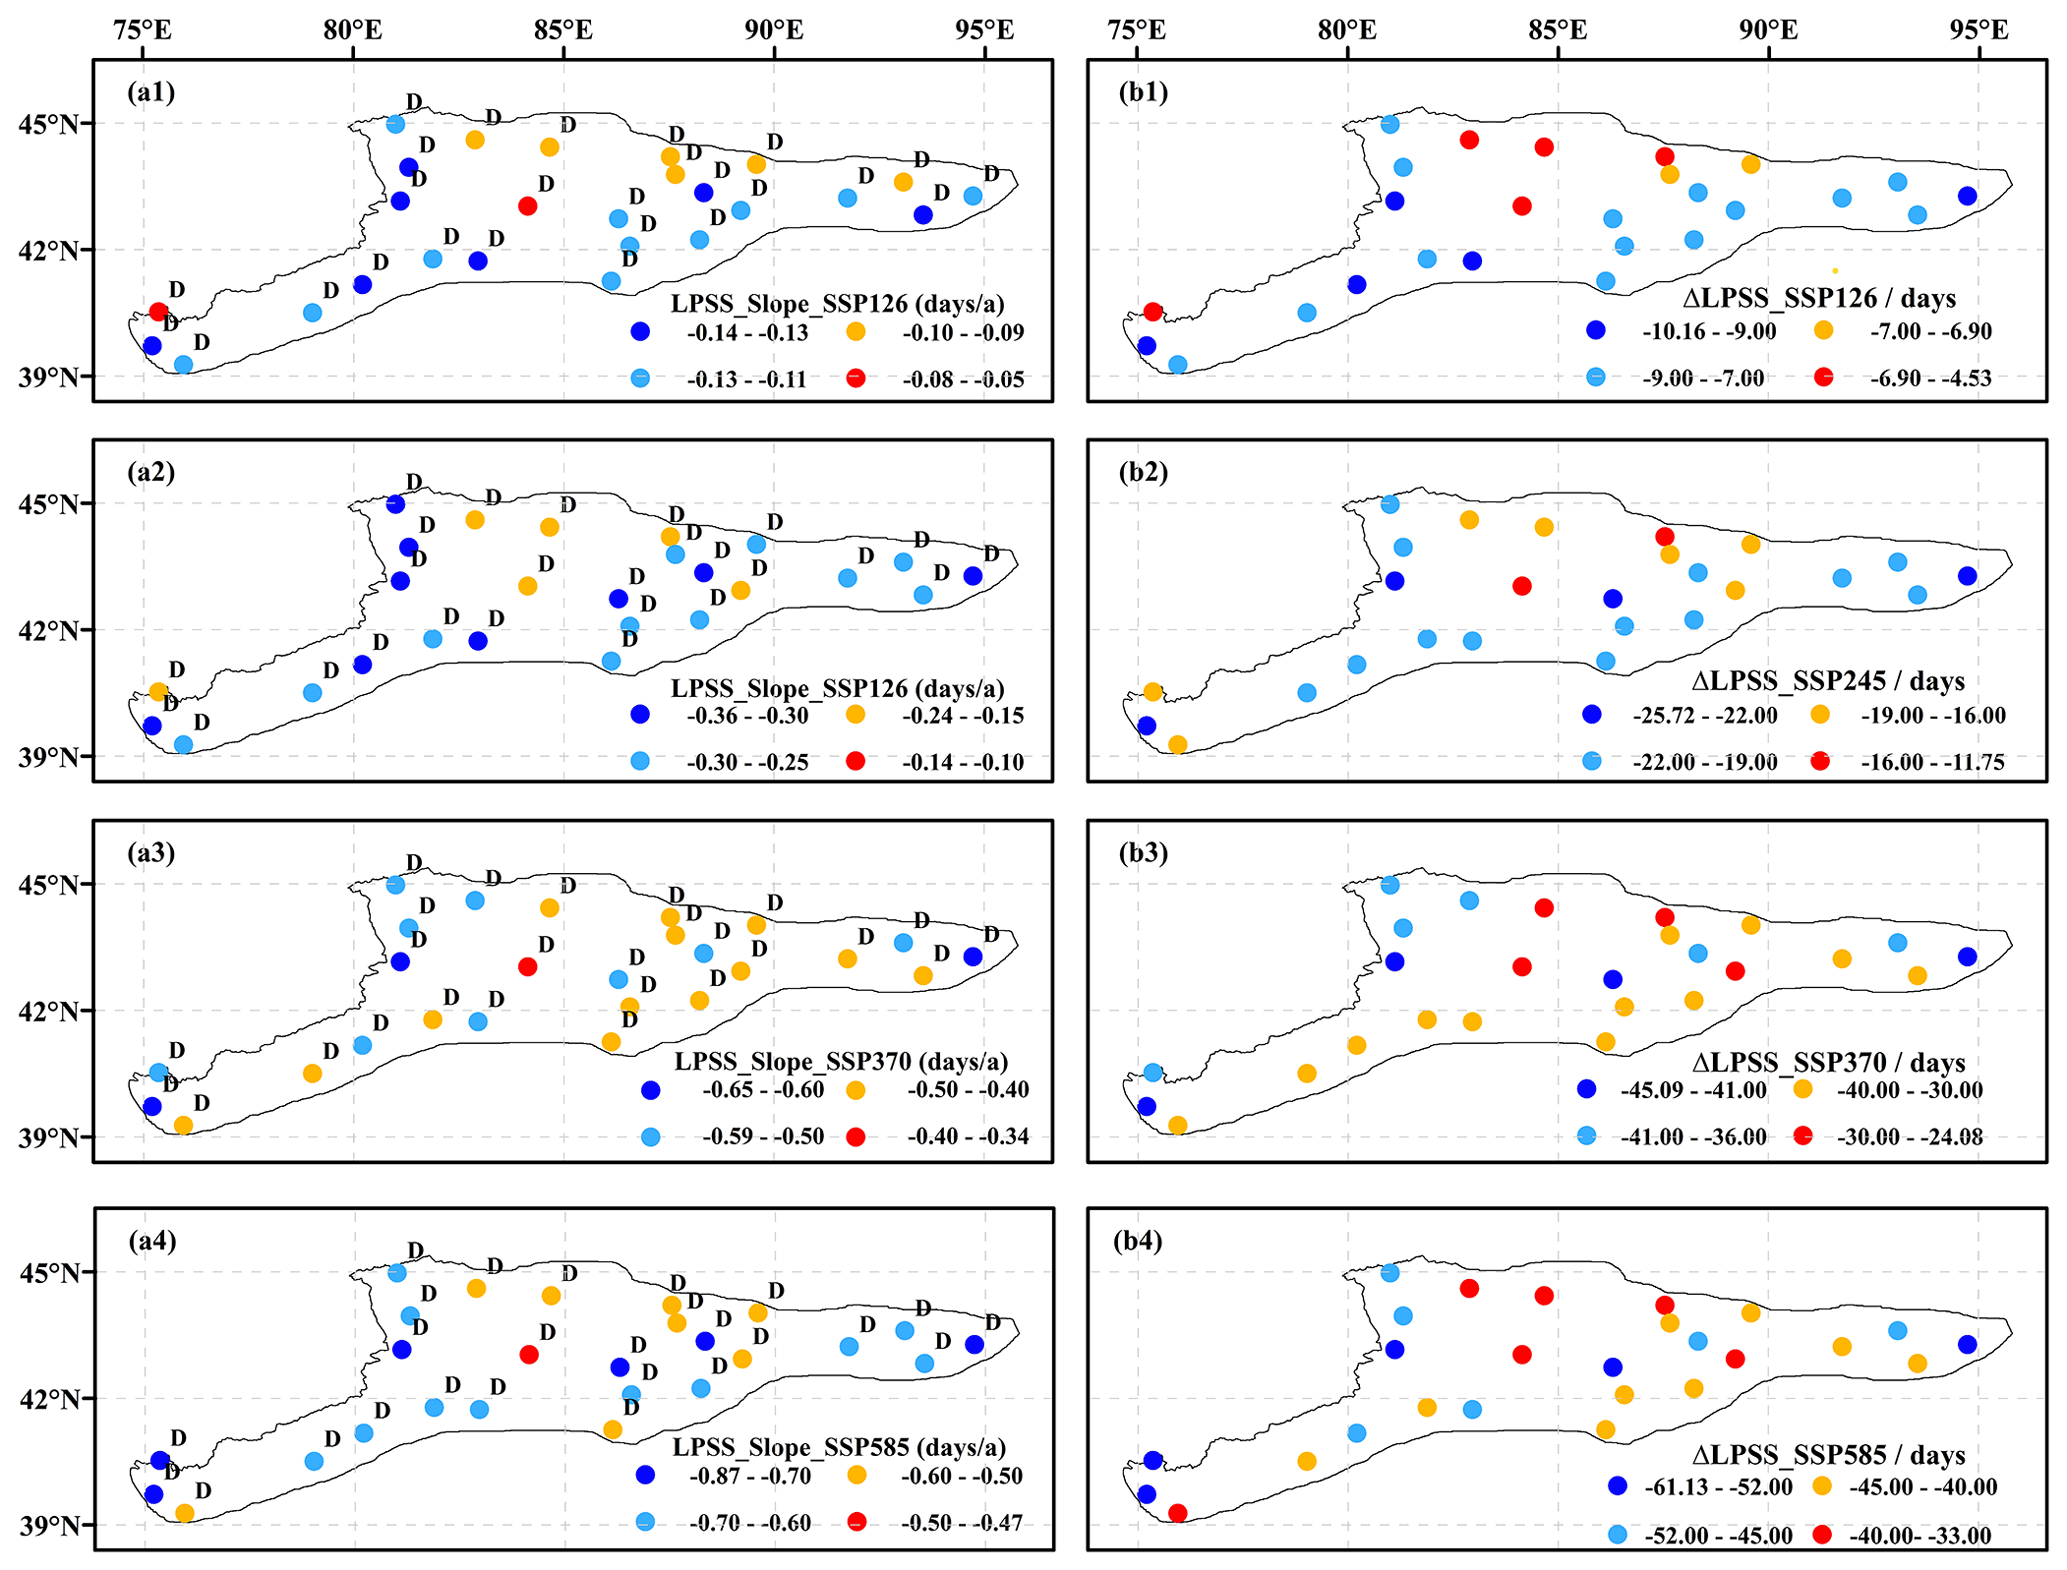
Figure 11Changing trends and slopes of the LPSS under the SSP126 (a1), SSP245 (a2), SSP370 (a3), and SSP585 (a4) scenarios and its amplification (b1–b4) across the CTMR during 2021–2100. The abbreviations used in the figure are as follows: D is a significant downward trend at the 0.05 significance level, N is no trend, and U is a significant upward trend at the 0.05 significance level.
In summary, while the SPSS will increase significantly with the scenario increase from SSP126 to SSP585, both the EPSS and LPSS will undergo substantial declines. By the end of this century, the start of the potential snowfall season is projected to be delayed by 24–41 d under the SSP585 scenario, while the end of the potential snowfall season is projected to be delayed by 1–7 d under the SSP126 scenario or advanced by 9–23 d under the SSP585 scenario. Consequently, the SSP585 scenario will shorten the length of the potential snowfall season by 33–61 d. Spatially, the western and southwestern parts of the CTMR will experience more rapid changes in the starting time, ending time, and length of the potential snowfall season compared with other parts.
4.1 Performance of PSP indicators
Much previous work has focused on variability, trends, spatial–temporal pattern, extremes, and events of snowfall over the snow-dominated regions worldwide (Baijnath-Rodino et al., 2018; Nazzareno et al., 2019; Bai et al., 2019; Takahashi, 2021; Lin and Chen, 2022). However, less attention has been paid to the change in the phenology of potential snowfall. To address this knowledge gap, we skillfully presented three indicators, namely, the SPSS, EPSS, and LPSS, based on the semi-sinusoidal curve of daily air temperature combined with various rain–snow thresholds. The SPSS and EPSS represent the start and end of the potential snowfall season within a given year, respectively, while the SPSS denotes the difference between the EPSS in the second year and the SPSS in that same year. Our work showed that the potential snowfall season mainly occurred from 30 October to 20 March during 1961–1979 across the CTMR. In comparison, the observed snowfall season was from 20 October to 17 March during the same period. The start and end dates of the potential snowfall season calculated were significantly correlated with the observed dates at the 0.01 significance level, with correlation coefficients of 0.56 and 0.88, respectively (figures omitted). Moreover, Tian et al. (2020) reported that the snowfall season in the CTMR was from November to March. Thus, the consistency between the observed and the potential snowfall season was high, and the potential snowfall season could match or cover the observed one. These findings indicate that the SPSS, EPSS, and LPSS accurately reproduce the phenology of potential snowfall across the CTMR and have the potential to be expanded to other snow-dominated regions worldwide.
4.2 Temporal heterogeneity
The PSP indicators showed a relative continuity in their trends from the past to future. Both the historical (1961–2020) and future (2021–2100) periods revealed a consistent upward or downward trend in the SPSS and LPSS time series, despite the observed SPSS and LPSS displaying greater fluctuations (see Fig. 12a and c, respectively). However, the EPSS showed an exception in its changing trend. The changing trends in the observed EPSS values were consistent with those of the projected EPSS values under the SSP245, SSP370, and SSP585 scenarios, but they were the opposite of the projected EPSS values under the SSP126 scenario (see Fig. 12b). Furthermore, unlike the historical period, the rate of postponing the SPSS was faster than that of advancing the EPSS under all four scenarios, which may be due to seasonal diversity in the warming rate of air temperature. The amplitude of air temperature variation under all four scenarios will be larger in autumn and winter compared with the other two seasons (see Fig. 13). The higher emission scenario will result in a higher rate of climate warming, leading to a postponed SPSS and advanced EPSS, ultimately accelerating the reduction in the LPSS from the historical period to the SSP585 scenarios in the future (see Table 3).
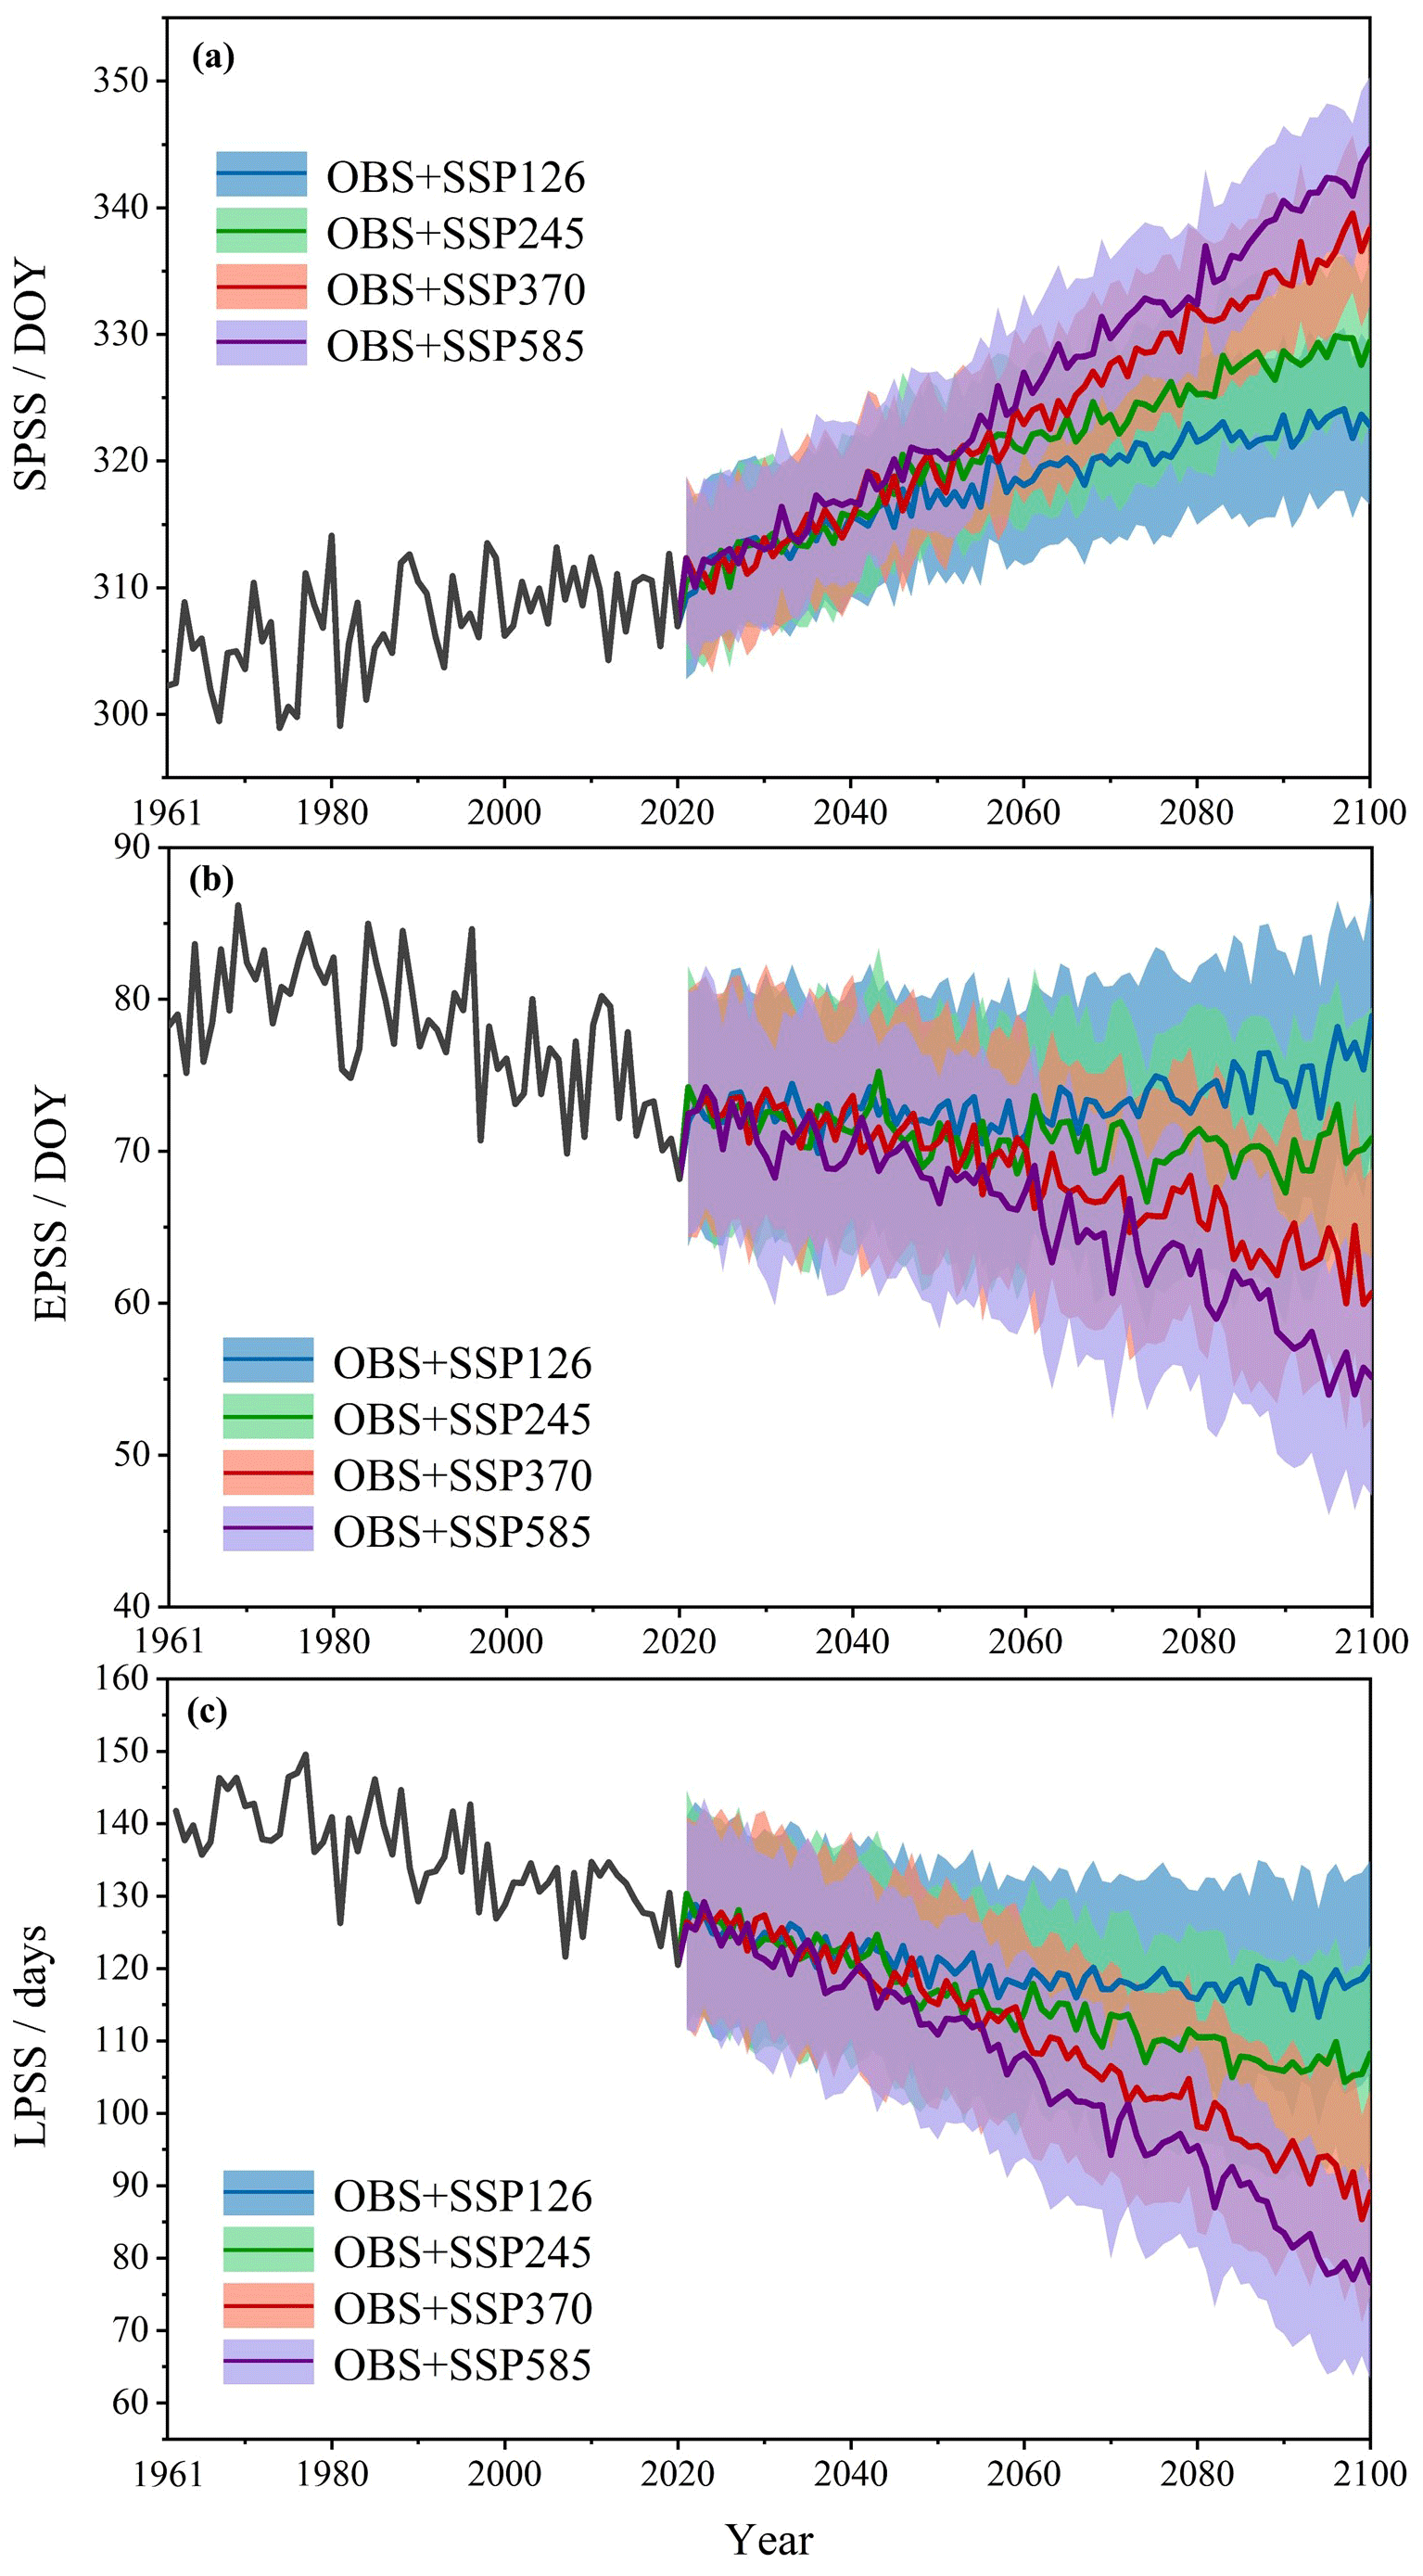
Figure 12Time series of the SPSS (a), EPSS (b), and LPSS (c) from 1961 to 2100 in the CTMR. OBS represents time series based on observation data during 1961–2020; SSP126, SSP245, SSP370, and SSP585 refer to time series based on CMIP6 data during 2021–2100.
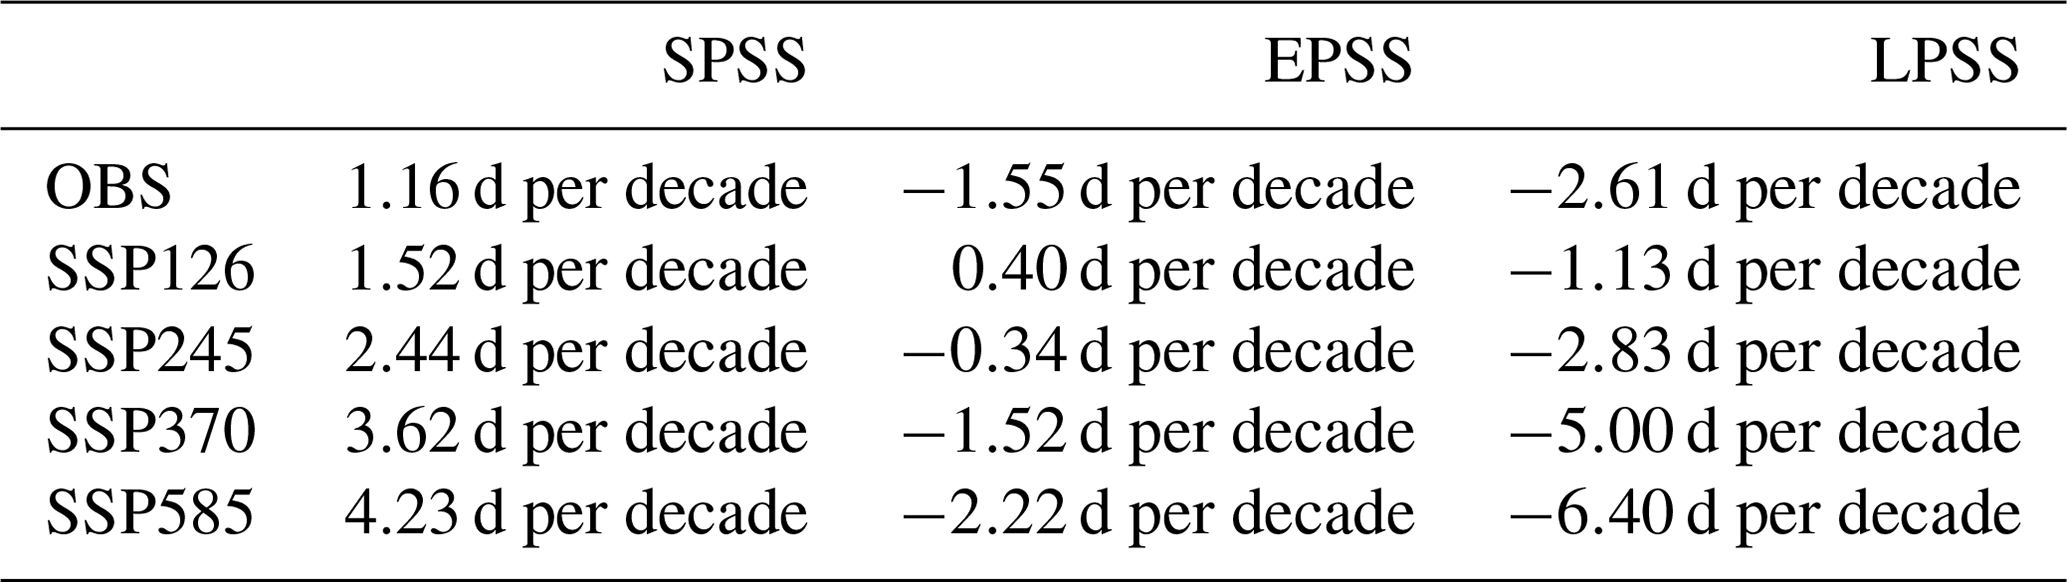
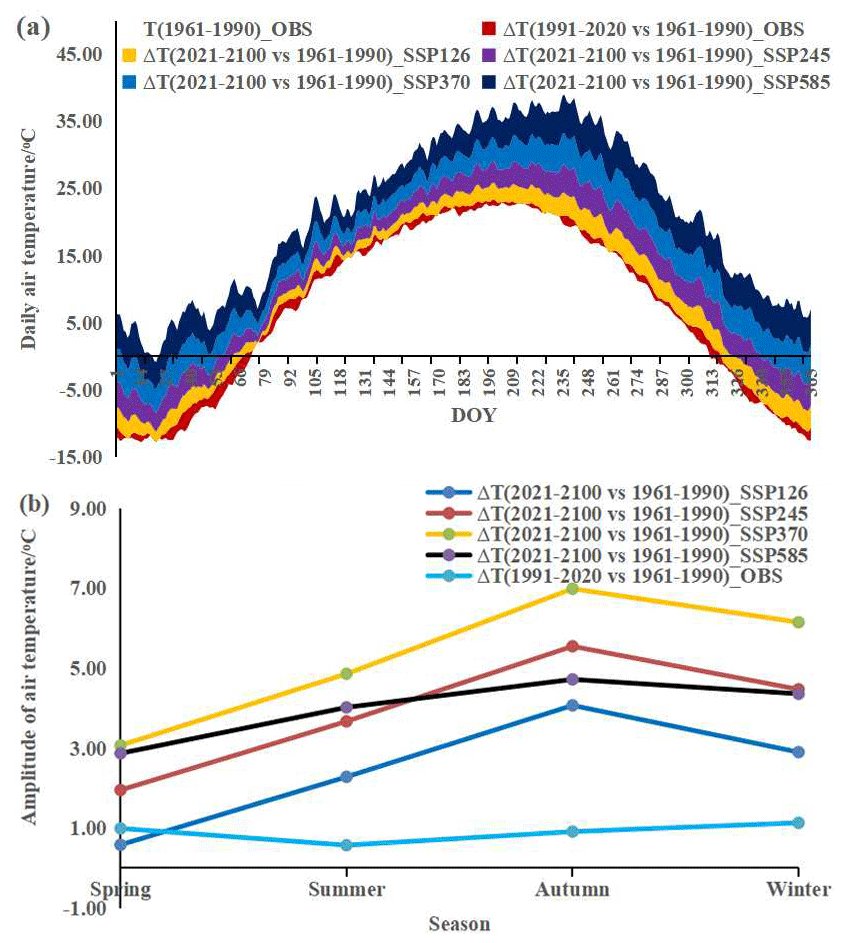
Figure 13The intra-annual amplitude of daily air temperature variation (a) and its seasonal diversity (b) in the CTMR. T(1961–1990)_OBS is the observed mean daily air temperature during 1961–1990; ΔT(1991–2020 vs. 1961–1990)_OBS is the amplitude of air temperature variation during 1991–2020 compared to that during 1961–1990; ΔT(2021–2100 vs. 1961–1990)_SSP126 represents the amplitude of air temperature variation during 2021–2100 under the SSP126 scenario compared to that during 1961–1990; ΔT(2021–2100 vs. 1961–1990)_SSP245 represents the amplitude of air temperature variation during 2021–2100 under the SSP245 scenario compared to that during 1961–1990; ΔT(2021–2100 vs. 1961–1990)_SSP370 represents the amplitude of air temperature variation during 2021–2100 under the SSP370 scenario compared to that during 1961–1990; and ΔT(2021–2100 vs. 1961–1990)_SSP585 represents the amplitude of air temperature variation during 2021–2100 under the SSP585 scenario compared to that during 1961–1990.
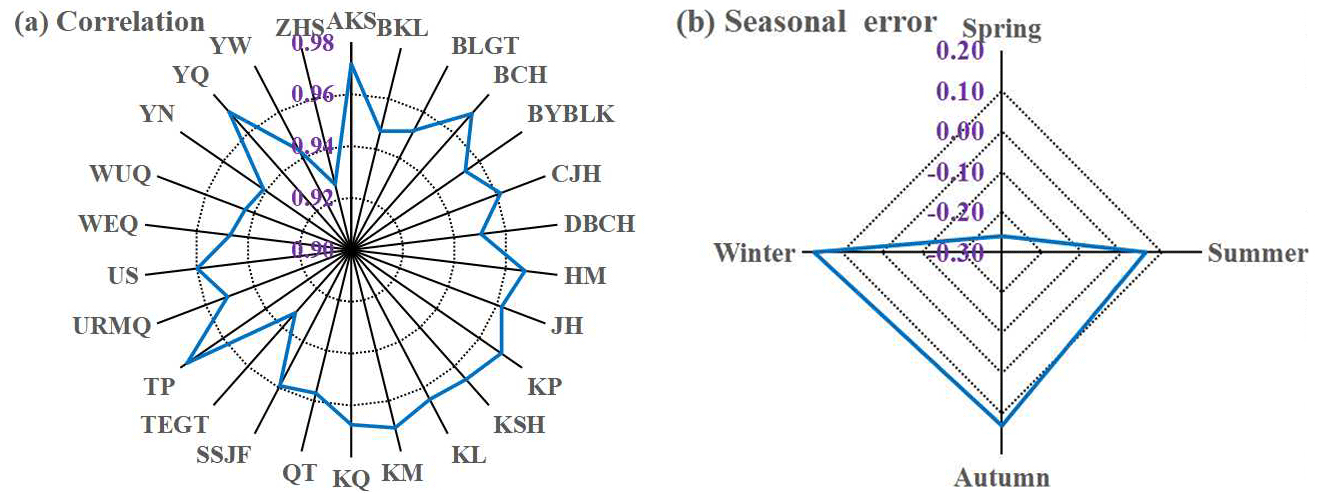
Figure 14Correlation between the observed and the simulated air temperature from CMIP6 at the meteorological station scale (a) and its seasonal mean error (b) across the CTMR.
4.3 Uncertainty
The distribution of meteorological stations in the CTMR is uneven, particularly in high-elevation areas, and available data are limited to observations from the 1950s to 1979, which may compromise the accuracy of the three PSP indicators. Although CMIP6 data could capture surface air temperature trends well (Fan et al., 2020), they can not replicate seasonal diversity with the same level of accuracy. The correlation between the observed and the simulated air temperature from CMIP6 during 1961–2020 ranged from 0.93 to 0.98 (see Fig. 14a). In spring, air temperature was underestimated by 0.26 ∘C, while it was slightly overestimated in the other three seasons (see Fig. 14b). This could lead to an overestimation of both the SPSS and EPSS under the four different scenarios. Additionally, the methodology used in this study, which is based on a semi-sinusoidal curve of daily air temperature combined with various rain–snow thresholds, is subject to certain limitations due to its failure to account for the impacts of wind, humidity, and other meteorological factors on precipitation phase, as well as the influence of factors such as elevation, latitude, and topography on the rain–snow threshold (Y. Li et al., 2020; Z. Li et al., 2020). Furthermore, uncertainty may arise from the selection of data, and the use of only 14 models may not completely eliminate modeling errors. Further research could benefit from incorporating data from CMIP6 models or others and improving the methodology.
In this study, we initially defined three indicators of the potential snowfall penology (the SPSS, EPSS, and LPSS) and analyzed their spatial–temporal variation in the past, present, and future over the CTMR. The aforementioned indicators were found to effectively reproduce the feature of potential snowfall phenology and could be recommended for use in other snow-dominated regions worldwide.
The penology indicators for potential snowfall showed a relative continuity from the past to the future. During 1961–2017/2020, the potential snowfall season started on approximately 2 November, ended on approximately 18 March, and lasted around 136 d across the CTMR on average. However, a significant delay in the starting time, advancement in the ending time, and reduction in the duration of the potential snowfall season were observed. The potential snowfall season started 1–13 d later at a rate of 1.2 d per decade while the ending time was brought forward by 2–13 d at a rate of 1.6 d per decade, leading to a shorter potential snowfall duration of 3–26 d at a rate of 2.8 d per decade across the whole region. The north and center experienced an earlier starting time, later ending time, and longer potential snowfall season compared with the south, particularly in BYBLK and TEGT, where the potential snowfall season lasted for over 7 months.
Over the next 80 years (2021–2100), the starting time, ending time, and duration of the potential snowfall season are expected to vary under the four scenarios. The higher emission scenario will lead to a much later starting time, earlier ending time, and a shorter potential snowfall season due to the higher rate of climate warming. The starting time will be postponed with increasingly upward slopes under the SSP126 to SSP585 scenarios. Under the SSP585 scenario, the potential snowfall season will be from about 4 October to 9 December. The ending time will change less during 2021–2070 and be postponed slightly during 2071–2100 under the SSP126 scenario, showing opposite changing trends from the SSP245 scenario to the SSP585 scenario. In contrast, the ending time under the SSP585 scenario will range from 9 February to 9 May across the CTMR. The length will gradually decrease from the SSP126 scenario to the SSP585 scenario in the coming 80 years. The duration of the potential snowfall season will be reduced by up to 61 d by the end of this century under the SSP585 scenario. In the west and east of the CTMR, the length of the potential snowfall season will be cut down by more days due to a more delayed starting time and advanced ending time under all four scenarios.
Spatial and temporal heterogeneity existed across the CTMR with respect to the seasonal diversity of warming in the past and present. Uncertainties regarding future projections remain due to the quality and quantity of data used. It is important to note that underestimating air temperature in spring may result in an overestimation of the EPSS, whereas overestimating air temperature in autumn and winter may lead to an overestimation of the SPSS when using CMIP6 data for the four future scenarios (2021–2100). Furthermore, the methodology employed in this study has limitations in terms of considering the effects of elevation, latitude, topography, and meteorological factors on precipitation phase and the rain–snow threshold. Further research could focus on enhancing the methodology, gathering multivariate data, and extending the application of these indicators to a broader region.
The data are available upon reasonable request from the corresponding author.
XuL wrote and organized the main text; XiL and XZ processed data about air temperature and precipitation phase; KZ provided figures; and LL offered further insight, comments, and editorial suggestions.
The contact author has declared that none of the authors has any competing interests.
Publisher's note: Copernicus Publications remains neutral with regard to jurisdictional claims in published maps and institutional affiliations.
The authors wish to kindly thank Lu Gao from the Institute of Geography, Fujian Normal University, and Guigang Wang from the Faculty of Geomatics, Lanzhou Jiaotong University, for their suggestion and encouragement during the revision process of this paper. We are also grateful to the Key Laboratory of Remote Sensing of Gansu Province, Northwest Institute of Eco-Environment and Resources, Chinese Academy of Sciences, for their support with respect to this work.
This research has been supported by the National Natural Science Foundation of China (grant nos. 42261026, 41971094, and 42161025), the Gansu Science and Technology Research Project (grant no. 22ZD6FA005), and the Higher Education Innovation Foundation of Education Department of Gansu Province (grant no. 2022A-041).
This paper was edited by Alexandre Langlois and reviewed by two anonymous referees.
Aizen, V. B., Aizen, E. M., Melack, J. M., and Dozier, J.: Climatic and hydrologic changes in the Tien Shan, central Asia, J. Climate, 10, 1393–1404, https://doi.org/10.1175/1520-0442(1997)010<1393:CAHCIT>2.0.CO;2, 1997.
Bai, L., Shi, C., Shi, Q., Li, L., Wu J., Yang, Y., Sun, S., and Zhang, F.: Change in the spatiotemporal pattern of snowfall during the cold season under climate change in a snow-dominated region of China, Int. J. Climatol., 39, 5702–5719, https://doi.org/10.1002/joc.6182, 2019.
Baijnath-Rodino, J. A., Duguay, C. R., and Ledrew, E.: Climatological trends of snowfall over the Laurentian Great Lakes Basin, Int. J. Climatol., 38, 3942–3962, https://doi.org/10.1002/joc.5546, 2018.
Barnett, T., Adam, J., and Lettenmaier, D.: Potential impacts of a warming climate on water availability in snow-dominated regions, Nature, 438, 303–309, https://doi.org/10.1038/nature04141, 2005.
Bintanja, R. and Andry, O.: Towards a rain-dominated Arctic., Nat. Clim. Change, 7, 263–267, https://doi.org/10.1038/nclimate3240, 2017.
Dai, A.: Temperature and pressure dependence of the rain-snow phase transition over land and ocean, Geophys. Res. Lett., 35, 62–77, https://doi.org/10.1029/2008GL033295, 2008.
Daloz, A. S., Mateling, M., L'Ecuyer, T., Kulie, M., Wood, N. B., Durand, M., Wrzesien, M., Stjern, C. W., and Dimri, A. P.: How much snow falls in the world's mountains? A first look at mountain snowfall estimates in A-train observations and reanalyses, The Cryosphere, 14, 3195–3207, https://doi.org/10.5194/tc-14-3195-2020, 2020.
Dedieu, J. P., Lessard-Fontaine, A., Ravazzani, G., Cremonese, E., Shalpykova, G., and Beniston, M.: Shifting mountain snow patterns in a changing climate from remote sensing retrieval, Sci. Total. Environ., 493, 1267–1279, https://doi.org/10.1016/j.scitotenv.2014.04.078, 2014.
Ding, B., Yang, K., Qin, J., Wang, L., Chen, Y., and He, X.: The dependence of precipitation types on surface elevation and meteorological conditions and its parameterization, J. Hydrol., 513, 154–163, https://doi.org/10.1016/j.jhydrol.2014.03.038, 2014.
Fan, X., Duan, Q., Shen, C., Wu, Y., and Xing, C.: Global surface air temperatures in CMIP6: historical performance and future changes, Environ. Res. Lett., 15, 104056, https://doi.org/10.1088/1748-9326/abb051, 2020.
Gao, L., Deng, H., Lei, X., Wei, J., Chen, Y., Li, Z., Ma, M., Chen, X., Chen, Y., Liu, M., and Gao, J.: Evidence of elevation-dependent warming from the Chinese Tian Shan, The Cryosphere, 15, 5765–5783, https://doi.org/10.5194/tc-15-5765-2021, 2021.
Guo, L. and Li, L.: Variation of the proportion of precipitation occurring as snow in the Tian Shan Mountains, China, Int. J. Climatol., 35, 1379–1393, https://doi.org/10.1002/joc.4063, 2015.
Han, W., Xiao, C., Dou, T., and Ding, M.: Changes in the proportion of precipitation occurring as rain in northern Canada during spring–summer from 1979–2015, Adv. Atmos. Sci., 35, 31–38, https://doi.org/10.1007/s00376-018-7226-3, 2018.
Harpold, A. A., Rajagopal, S., Crews, J. B., Winchell, T., and Schumer, R.: Relative humidity has uneven effects on shifts from snow to rain over the Western U.S., Geophys. Res. Lett., 44, 9742–9750, https://doi.org/10.1002/2017GL075046, 2017.
Hock, R., Roberts, C., and Masson-Delmotte, V.: “High mountain areas” in IPCC Special Report on the Ocean and Cryosphere in a Changing Climate, Cambridge Univ. Press, 131–202, 2022.
Hu, R.: Physical Geography of the Tianshan Mountains in China, China Environmental Science Press, Beijing, 139–142, 2004 (in Chinese).
Huss, M., Bookhagen, B., Huggel, C., Jacobsen, D., Bradley, R. S., Clague, J. J., Vuille, M., Buytaert, W., Cayan, D. R., Greenwood, G., Mark, B. G., Milner, A. M., Weingartner, R., and Winder, M.: Toward mountains without permanent snow and ice, Earths Future 5, 418–435, https://doi.org/10.1002/2016EF000514, 2017.
Immerzeel, W. W., Lutz, A. F., Andrade, M., Bahl, A., Biemans, H., Bolch, T., Hyde, S., Brumby, S., Davies, B. J., Elmore, A. C., Emmer, A., Feng, M., Fernández, A., Haritashya, U., Kargel, J. S., Koppes, M., Kraaijenbrink, P. D. A., Kulkarni, A. V., Mayewski, P. A., Nepal, S., Pacheco, P., Painter, T. H., Pellicciotti, F., Rajaram, H., Rupper, S., Sinisalo, A., Shrestha, A. B., Viviroli, D., Wada, Y., Xiao, C., Yao, T., and Baillie, J. E. M.: Importance and vulnerability of the world's water towers, Nature, 577, 364–369, https://doi.org/10.1038/s41586-019-1822-y, 2020.
Jennings, K. S. and Molotch, N. P.: The sensitivity of modeled snow accumulation and melt to precipitation phase methods across a climatic gradient, Hydrol. Earth Syst. Sci., 23, 3765–3786, https://doi.org/10.5194/hess-23-3765-2019, 2019.
Jennings, K. S., Winchell, T. S., Livneh, B., and Molotch, N. P.: Spatial variation of the rain–snow temperature threshold across the Northern Hemisphere, Nat. Commun., 9, 1–9, https://doi.org/10.1038/s41467-018-03629-7, 2018.
Jiang, F., Li, X., Wei, B., Hu, R., and Li, Z.: Observed trends of heating and cooling degree-days in Xinjiang province, China, Theor. Appl. Climatol., 97, 349–360, https://doi.org/10.1007/s00704-008-0078-5, 2009.
Jonas, T., Rixen, C., Sturm, M., and Stoeckli, V.: How alpine plant growth is linked to snow cover and climate variability, J. Geophys. Res., 113, G03013, https://doi.org/10.1029/2007JG000680, 2008.
Kapnick, S. B., Delworth, T. L., Ashfaq, M., Malyshev, S., and Milly, P. C. D.: Snowfall less sensitive to warming in Karakoram than in Himalayas due to a unique seasonal cycle, Nat. Geosci., 7, 834–840, https://doi.org/10.1038/ngeo2269, 2014.
Kendall, M. G.: Rank correlation methods, Brit. J. Psychol., 25, 86–91, 1990.
Knowles, N., Dettinger, M., and Cayan, D.: Trends in snowfall versus rainfall in the western United States, J. Climate, 19, 4545–4559, https://doi.org/10.1175/JCLI3850.1, 2006.
Krasting, J. P.: Variations in Northern Hemisphere snowfall: an analysis of historical trends and the projected response to anthropogenic forcing in the twenty-first century, Doctor of Philosophy, Rutgers, The State University of New Jersey, https://doi.org/10.7282/T3JH3MHJ, 2008.
Le Roux, E., Evin, G., Eckert, N., Blanchet, J., and Morin, S.: Elevation-dependent trends in extreme snowfall in the French Alps from 1959 to 2019, The Cryosphere, 15, 4335–4356, https://doi.org/10.5194/tc-15-4335-2021, 2021.
Li, X.: Climate change and its impact in the Chinese Tianshan mountainous region, Publishing House of Electronics Industry, ISBN 978-7-121-42141-9, 2021 (in Chinese).
Li, X., Jiang, F., Li, L., and Wang, G.: Spatial and temporal variability of precipitation concentration index, concentration degree and concentration period in Xinjiang province, China, Int. J. Climatol., 31, 1679–1693, https://doi.org/10.1002/joc.2181, 2011.
Li, X., Li, L., Yuan, S., Yan, H., and Wang, G.: Temporal and spatial variation of 10-day mean air temperature in Northwestern China, Theor. Appl. Climatol., 119, 285–298, https://doi.org/10.1007/s00704-014-1100-8, 2015.
Li, X., Gao, P., Li, Q., and Tang, H.: Muti-paths Impact from Climate Change on Snow Cover in Tianshan Mountainous Area of China, Adv. Clim. Chang. Res., 12, 303–312, https://doi.org/10.12006/j.issn.1673-1719.2015.184, 2016 (in Chinese with English abstract).
Li, X., Simonovic, S. P., Li, L., Zhang, X., and Qin, Q.: Performance and uncertainty analysis of a short-term climate reconstruction based on multi-source data in the Tianshan Mountains region, China, J. Arid Land, 12, 374–396, https://doi.org/10.1007/s40333-020-0065-y, 2020.
Li, X., Zhang, B., Ren, R., Li, L., and Simonovic, S. P.: Spatio-temporal Heterogeneity of Climate Warming in the Chinese Tianshan Mountainous Region, Water, 14, 199, https://doi.org/10.3390/w14020199, 2022.
Li, Y., Chen, Y., and Li, Z.: Climate and topographic controls on snow phenology dynamics in the Tienshan Mountains, Central Asia, Atmos. Res., 236, 104813, https://doi.org/10.1016/j.atmosres.2019.104813, 2020.
Li, Z., Gong, X., Chen, J., Mills, J., Li, S., Zhu, X., Peng, T., and Hao, W.: Functional Requirements of Systems for Visualization of Sustainable Development Goal (SDG) Indicators, J. Geovis. Spat. Anal., 4, 5, https://doi.org/10.1007/s41651-019-0046-x, 2020.
Lin, W. and Chen, H.: Changes in the spatial-temporal characteristics of daily snowfall events over the Eurasian continent from 1980 to 2019, Int. J. Climatol., 42, 1841–1853, https://doi.org/10.1002/joc.7339, 2022.
Loth, B., Graf, H. F., and Oberhuber, J. M.: Snow cover model for global climate simulations, J. Geophys. Res.-Atmos., 98, 10451–10464, https://doi.org/10.1029/93JD00324, 1993.
Mankin, J. S., Viviroli, D., Singh, D., Hoekstra, A. Y., and Diffenbaugh, N. S.: The potential for snow to supply human water demand in the present and future, Environ. Res. Lett., 10, 114016, https://doi.org/10.1088/1748-9326/10/11/114016, 2015.
Marshall, J., Plumb, R. A.: Atmosphere, ocean, and climate dynamics: an introductory text, Chap. 2: The global energy balance, ISBN13 978-0-12-558691-7, 9–22, 2008.
McAfee, S., Walsh, J., and Rupp, S.: Statistically downscaled projections of snow/rain partitioning for Alaska, Hydrol. Process., 28, 3930–3946, https://doi.org/10.1002/hyp.9934, 2014.
Nazzareno, D., Büntgen, U., and Gianni, B.: Mediterranean winter snowfall variability over the past millennium, Int. J. Climatol., 39, 384–394, https://doi.org/10.1002/joc.5814, 2019.
O'Neill, B. C., Tebaldi, C., van Vuuren, D. P., Eyring, V., Friedlingstein, P., Hurtt, G., Knutti, R., Kriegler, E., Lamarque, J.-F., Lowe, J., Meehl, G. A., Moss, R., Riahi, K., and Sanderson, B. M.: The Scenario Model Intercomparison Project (ScenarioMIP) for CMIP6, Geosci. Model Dev., 9, 3461–3482, https://doi.org/10.5194/gmd-9-3461-2016, 2016.
Piazza, M., Boé, J., Terray, L., Pagé, C., Sanchez-Gomez, E., and Déqué, M.: Projected 21st century snowfall changes over the French Alps and related uncertainties, Clim. Change, 122, 583–594, https://doi.org/10.1007/s10584-013-1017-8, 2014.
Räisänen, J.: Twenty-first century changes in snowfall climate in Northern Europe in ENSEMBLES regional climate models, Clim. Dynam., 46, 339–353, https://doi.org/10.1007/s00382-015-2587-0, 2016.
Ren, R., Li, X., Li, L., Qin, Q., and Huang, Y.: Discrimination of driving factors of precipitation forms in Tianshan Mountains area of China, J. Arid Land Res. Environ., 34, 112–117, 2020 (in Chinese with English abstract).
Ren, R., Li, X., Li, Z., Li, L., and Huang, Y.: Projected change in precipitation forms in the Chinese Tianshan Mountains based on the Back Propagation Neural Network Model, J. Mt. Sci., 19, 689–703, https://doi.org/10.1007/s11629-021-7076-9, 2022.
Sabine, B. R., Mathieu, G., Olivier, B., Miska, L., Carmen, C., Gregoire, M., and Antoine, G.: From white to green: Snow cover loss and increased vegetation productivity in the European Alps, Science, 376, 1119–1122, https://doi.org/10.1126/science.abn6697, 2022.
Siirila-Woodburn, E. R., Rhoades, A. M., Hatchett, B. J., Huning, L. S., Szinai, J., Tague, C., Nico, P. S., Feldman, D. R., Jones, A. D., Collins, W. D., and Kaatz, L.: A low-to-no snow future and its impacts on water resources in the western United States, Nat. Rev. Earth Env., 2, 800–819, https://doi.org/10.1038/s43017-021-00219-y, 2021.
Sorg, A., Bolch, T., Stoffel, M., Solomina, O. N., and Beniston, M.: Climate change impacts on glaciers and runoff in Tien Shan (Central Asia), Nat. Clim. Change, 2, 725–731, https://doi.org/10.1038/nclimate1592, 2012.
Sun, F., Hall, A., Schwartz, M., Walton, D. B., and Berg, N.: Twenty-First-Century Snowfall and Snowpack Changes over the Southern California Mountains, J. Climate, 29, 91–110, https://doi.org/10.1175/JCLI-D-15-0199.1, 2016.
Takahashi, H. G.: Long-term trends in snowfall characteristics and extremes in Japan from 1961 to 2012, Int. J. Climatol., 41, 2316–2329, https://doi.org/10.1002/joc.6960, 2021.
Tamang, S. K., Ebtehaj, A. M., Prein, A. F., and Heymsifield, A. J.: Linking global changes of snowfall and wet-bulb temperature, J. Climate, 33, 39–59, https://doi.org/10.1175/JCLI-D-19-0254.1, 2020.
Tian, Y., Li, X., Li, Z., and Qin, Q.: Spatial and temporal variations of different precipitation types in the Tianshan Mountains from 1850–2017, Arid Land Geogr., 43, 308–318, 2020 (in Chinese with English abstract).
Trenberth, K. E.: Changes in precipitation with climate change, Clim. Res., 47, 123–128, https://doi.org/10.3354/cr00953, 2011.
Yang, J., Fang, G., Chen, Y., and De-Maeyer, P.: Climate change in the Tianshan and northern Kunlun Mountains based on GCM simulation ensemble with Bayesian model averaging, J. Arid Land, 9, 622–634, https://doi.org/10.1007/s40333-017-0100-9, 2017.
Yang, T., Li, Q., Ahmad, S., Zhou, H., and Li, L.: Changes in Snow Phenology from 1979 to 2016 over the Tianshan Mountains, Central Asia, Remote Sens., 11, 499, https://doi.org/10.3390/rs11050499, 2019.
Yang, T., Li, Q., Hamdi, R., Zou, Q., Chen, X., Maeyer, P., Cui, F., and Li, L.: Snowfall climatology in the Tianshan Mountains based on 36 cold seasons of WRF dynamical downscaling simulation, Atmos. Res., 270, 106057, https://doi.org/10.1016/j.atmosres.2022.106057, 2022.
Zhang, L., Chen, X., and Xin, X.: Short commentary on CMIP6 Scenario Model Intercomparison Project (ScenarioMIP), Clim. Chang. Res., 15, 519–525, https://doi.org/10.12006/j.issn.1673-1719.2019.082, 2019.
Zhang, X., Li, X., Gao, P., Li, Q., and Tang, H.: Separation of precipitation forms based on different methods in Tianshan Mountainous Area, Northwest China, J. Glaciol. Geocryol., 39, 235–244, 2017 (in Chinese with English abstract).
Zhang, X., Li, X., Li, L., Zhang, S., and Qin, Q.: Environmental factors influencing snowfall and snowfall prediction in the Tianshan Mountains, Northwest China, J. Arid Land, 11, 15–28, https://doi.org/10.1007/s40333-018-0110-2, 2019.