the Creative Commons Attribution 4.0 License.
the Creative Commons Attribution 4.0 License.
 | 08 Jun 2023
Dynamics of the snow grain size in a windy coastal area of Antarctica from continuous in situ spectral-albedo measurements
Sara Arioli
Ghislain Picard
Laurent Arnaud
Vincent Favier
The grain size of the superficial snow layer is a key determinant of the surface albedo in Antarctica. Its evolution is the result of multiple interacting processes, such as dry and wet metamorphism, melt, snow drift, and precipitation. Among them, snow drift has the least known and least predictable impact. The goal of this study is to relate the variations in surface snow grain size to these processes in a windy location of the Antarctic coast. For this, we retrieved the daily grain size from 5-year-long in situ observations of the spectral albedo recorded by a new multi-band albedometer, unique in terms of autonomy and described here for the first time. An uncertainty assessment and a comparison with satellite-retrieved grain size were carried out to verify the reliability of the instrument, and an RMSE up to 0.16 mm in the observed grain size was found. By relating these in situ measurements to time series of snow drift, surface temperature, snow surface height and snowfall, we established that the evolution of the grain size in the presence of snow drift is complex and follows two possible pathways: (1) a decrease in the grain size (about half of our measurements) resulting from the deposition of small grains advected by the wind (surprisingly, this decrease is often – of the cases– associated with a decrease in the surface height, i.e., a net erosion over the drift episode), (2) an increase in the grain size (the other half) due to either the removal of the surface layer or metamorphism. However, we note that this increase is often limited with respect to the increase predicted by a theoretical metamorphism model, suggesting that a concomitant deposition of small grains is likely. At last, we found that wind also completely impedes the deposition of snowfall during half of the observed precipitation events. When this happens, the grain size evolves as if precipitation were not occurring. As a result of all these processes, we conclude that the grain size in a windy area remains more stable than it would be in the absence of snow drift, hence limiting the variations in the albedo and in the radiative energy budget.
- Article
(7164 KB) - Full-text XML
- BibTeX
- EndNote


Snow-covered areas have a cooling effect on the climate at both the local and global scale because of their high albedo, which is the ratio of the reflected irradiance to the total incident solar irradiance (Zhang et al., 2022). In Antarctica, as the sun is above the horizon for most of the day during summer, the surface receives substantial amounts of shortwave radiation (Van Den Broeke et al., 2004; Bai et al., 2022). Thus, even small fluctuations in the surface albedo cause important variations in the local surface energy budget. In areas of pristine snow, which is often the case in Antarctica (Warren et al., 2006), the main determinant of the snow albedo is the size of the snow grains that constitute the superficial layer (≈1 cm thick). It is a highly dynamical and complex variable, as its evolution is the result of many competing processes and of the recent history of the snowpack.
Firstly, metamorphism transforms the snow grains over time, driven by the snow temperature, temperature gradient and liquid water content. It generally increases the size of the snow grains following two possible pathways depending on whether the snow is dry or wet. Dry metamorphism occurs for temperatures below 0 ∘C and induces a moderate increase in the grain size, the rate of which increases with temperature and temperature gradient (Colbeck, 1982). In contrast, wet metamorphism leads to a fast growth of the snow grains that greatly depends on the liquid water content (Marsh, 1987; Brun et al., 1992). Further coarsening occurs when melting snow freezes during the night, forming “melt–freeze crusts” (Colbeck, 1973). In any case, the snow grains' growth induces an albedo decrease and an enhancement of the sunlight absorption. Metamorphism, whether dry or wet, is always active, and the induced grain size increase is irreversible.
Snowfall, on the other hand, is an intermittent process that replaces the superficial snow layer by depositing fresh snow. The grain size of the deposited snow depends on the atmospheric conditions during precipitation and is usually small (Domine et al., 2007; Walden et al., 2003) compared to the evolved snow on the ground. Thus, such deposition events over coarse-grained snow effectively increase the snow surface albedo. For instance, Picard et al. (2012) observed an albedo higher than average by 0.03 throughout the summer season for years with higher summer precipitation at Dome C, on the Antarctic Plateau. The whitening effect of snowfall on the surface also inhibits surface melt in areas with frequent precipitation with respect to areas that are subject to long dry periods (Jakobs et al., 2021).
The transport of snow by the wind, commonly referred to as snow drift, is another intermittent process that plays a more complex and less predictable role. Generally, wind lifts snow grains when its speed exceeds a threshold that depends on the cohesion of the surface snow (Kind, 1986). This process is more effective after snowfall, when the cohesion of the superficial layer is lowest, and weaker on dense, old surfaces such as melt–freeze crusts (Pomeroy and Gray, 1990; Lenaerts and Van den Broeke, 2012). Once advected from the surface, the snow grains either creep, fall following a ballistic trajectory (saltation), or are suspended and transported by the wind over long distances (turbulent diffusion; Déry and Yau, 1999; Barral et al., 2014). During their transport, the snow grains are fractured by the impact with the surface or other drifting grains and shrink, as they partially or totally sublimate in the unsaturated air (Amory and Kittel, 2019). In this context, snow drift modifies the properties of the snow surface in two possible ways that lead to opposite effects on the surface albedo. On the one hand, the erosion generally uncovers old snow layer and may result in an increase in the grain size at the surface, which lowers the albedo and may enhance surface melt (Bintanja, 1999; Lenaerts et al., 2016). On the other hand, the deposition of drifting snow grains, whose size is reduced by fragmentation and sublimation, has a similar effect to snowfall (Domine et al., 2009).
All these processes interplay according to their frequency and magnitude, driving the evolution of the snow grain size, and therefore of the surface albedo, at different timescales. As a result, the effect of these interactions between metamorphism and these meteorological phenomena on the resulting surface grain size is complex and location-specific. Yet, the impact of snow drift on the optical properties of the snow surface has been scarcely investigated. Few studies have addressed the extreme case of blue-ice areas (Winther et al., 2001; Lenaerts et al., 2016), but, to our knowledge, no previous study has focused on the impact of snow drift on the snow grain size over perennial snow covers, let alone its interaction with dry metamorphism, surface melt and snowfall.
The goal of this study is to relate the variations in the grain size deduced from the observed surface albedo to the processes of snowfall, melt and drift in a windy location of the Antarctic coast. More specifically, we aim at identifying the prevailing processes occurring (1) in the presence of snow drift, (2) in the presence of snowfall and (3) in the presence of surface melt.
To achieve this goal, we exploit multi-year time series of the snow grain size obtained from a new, automated albedometer with multiple spectral bands that was installed at two locations in Adélie Land, East Antarctica. This instrument is described here in detail for the first time. The study area, the instrumentation available and the processing of raw albedo measurements are described in Sect. 2. The results of the processing, the retrieved time series of the grain size and the comparison with local meteorological parameters are detailed in Sect. 3. The discussion and conclusion are in Sects. 4 and 5, respectively.
2.1 Study area and meteorological measurements
The study area is located in the coastal area of Adélie Land in East Antarctica, on the ice sheet, in front of the Dumont d'Urville station located on Petrel Island. Two specific locations are considered (Fig. 1a). The point D5 (66.70∘ S, 139.88∘ E) is located 1.5 km from the shoreline at 170 m a.s.l., and the point D17 (66.72∘ S, 139.72∘ E) is located 6 km inland at 415 m a.s.l. At D5, the air temperature frequently exceeds 0 ∘C during daytime in summer, while winter minima rarely reach less than −30 ∘C. At D17, summer maxima are slightly below 0 ∘C, and winter minima are around −30 ∘C. The area is characterized by strong episodic katabatic winds blowing from the Antarctic Plateau to the coast (Wendler et al., 1997) that affect the two locations. These winds are responsible for snow erosion and deposition, carving sastrugi at the surface (Fig. 1b). Blowing-snow events are common, as reported by expeditioners (Amory, 2020). D17 is equipped with an automatic weather station (AWS) that includes sensors for temperature, wind speed and relative humidity at 2 m height; a four-flux radiometer (Kipp & Zonen CNR4 sensor) for the measurement of the incoming and outgoing shortwave and longwave radiation; two ultrasonic distance sensors (Campbell Scientific SR50) for the measurement of the snow surface height; and a FlowCapt™ instrument (Chritin et al., 1999) that estimates the drifting-snow flow from the sound generated by the impacts of the snow grains on 1 m long vertical pipes.
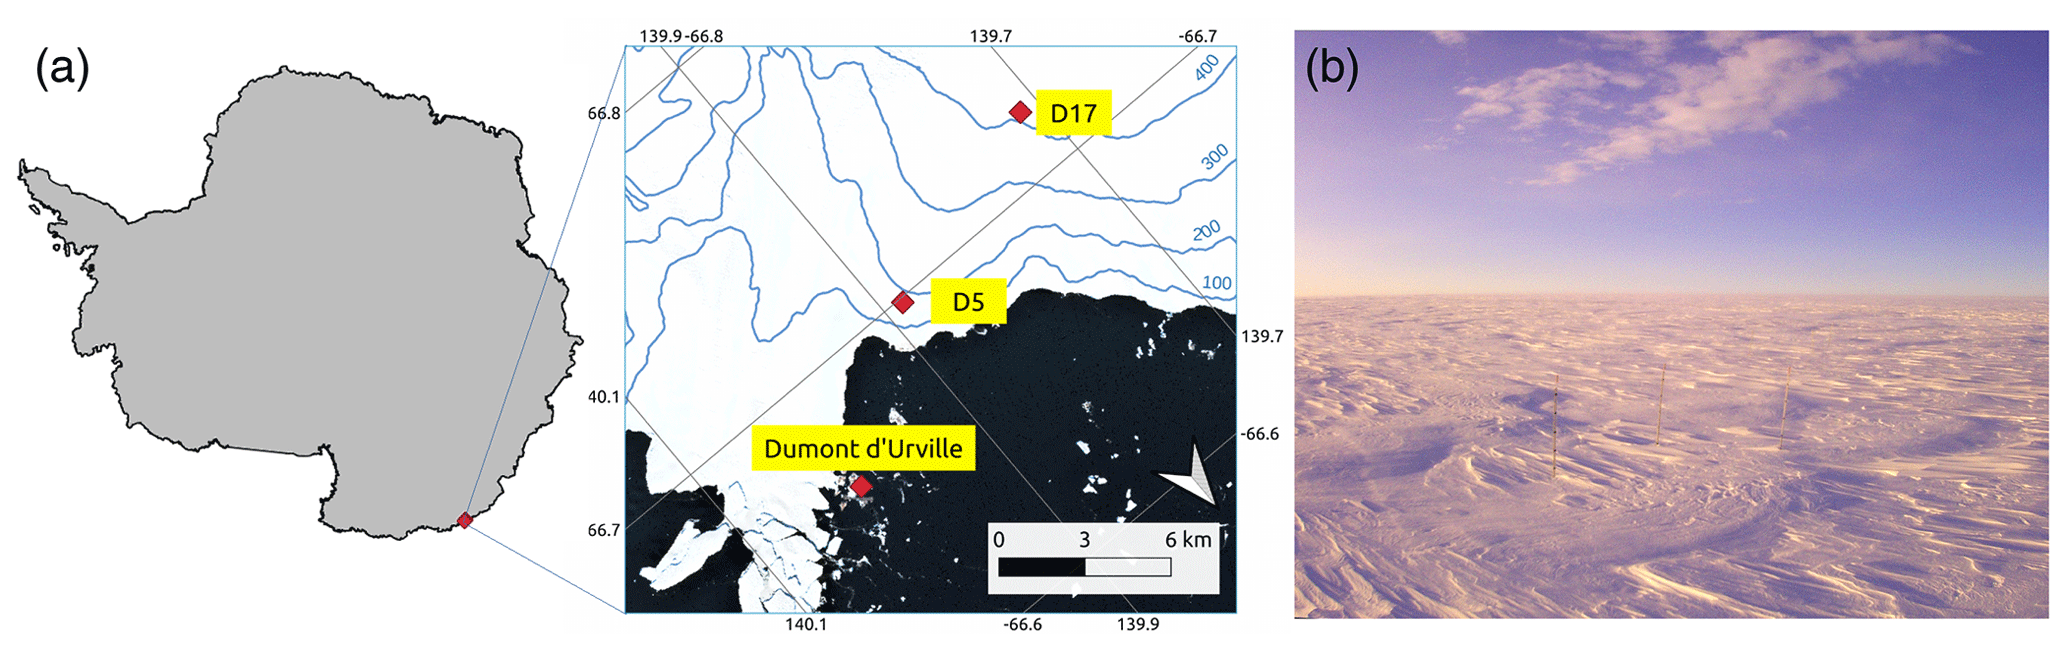
Figure 1Location of the study area with the sites D5 and D17, in the vicinity of the French station of Dumont d'Urville in Adélie Land, East Antarctica (a), and a picture of the snow surface of D17 covered by sastrugi, a common configuration in the area (b).
2.2 The Multiband instrument
In addition to common meteorological equipment, two homemade spectro-albedometers called Multiband were deployed in January 2017 at D5 and D17 to monitor the snow spectral albedo (Fig. 2).
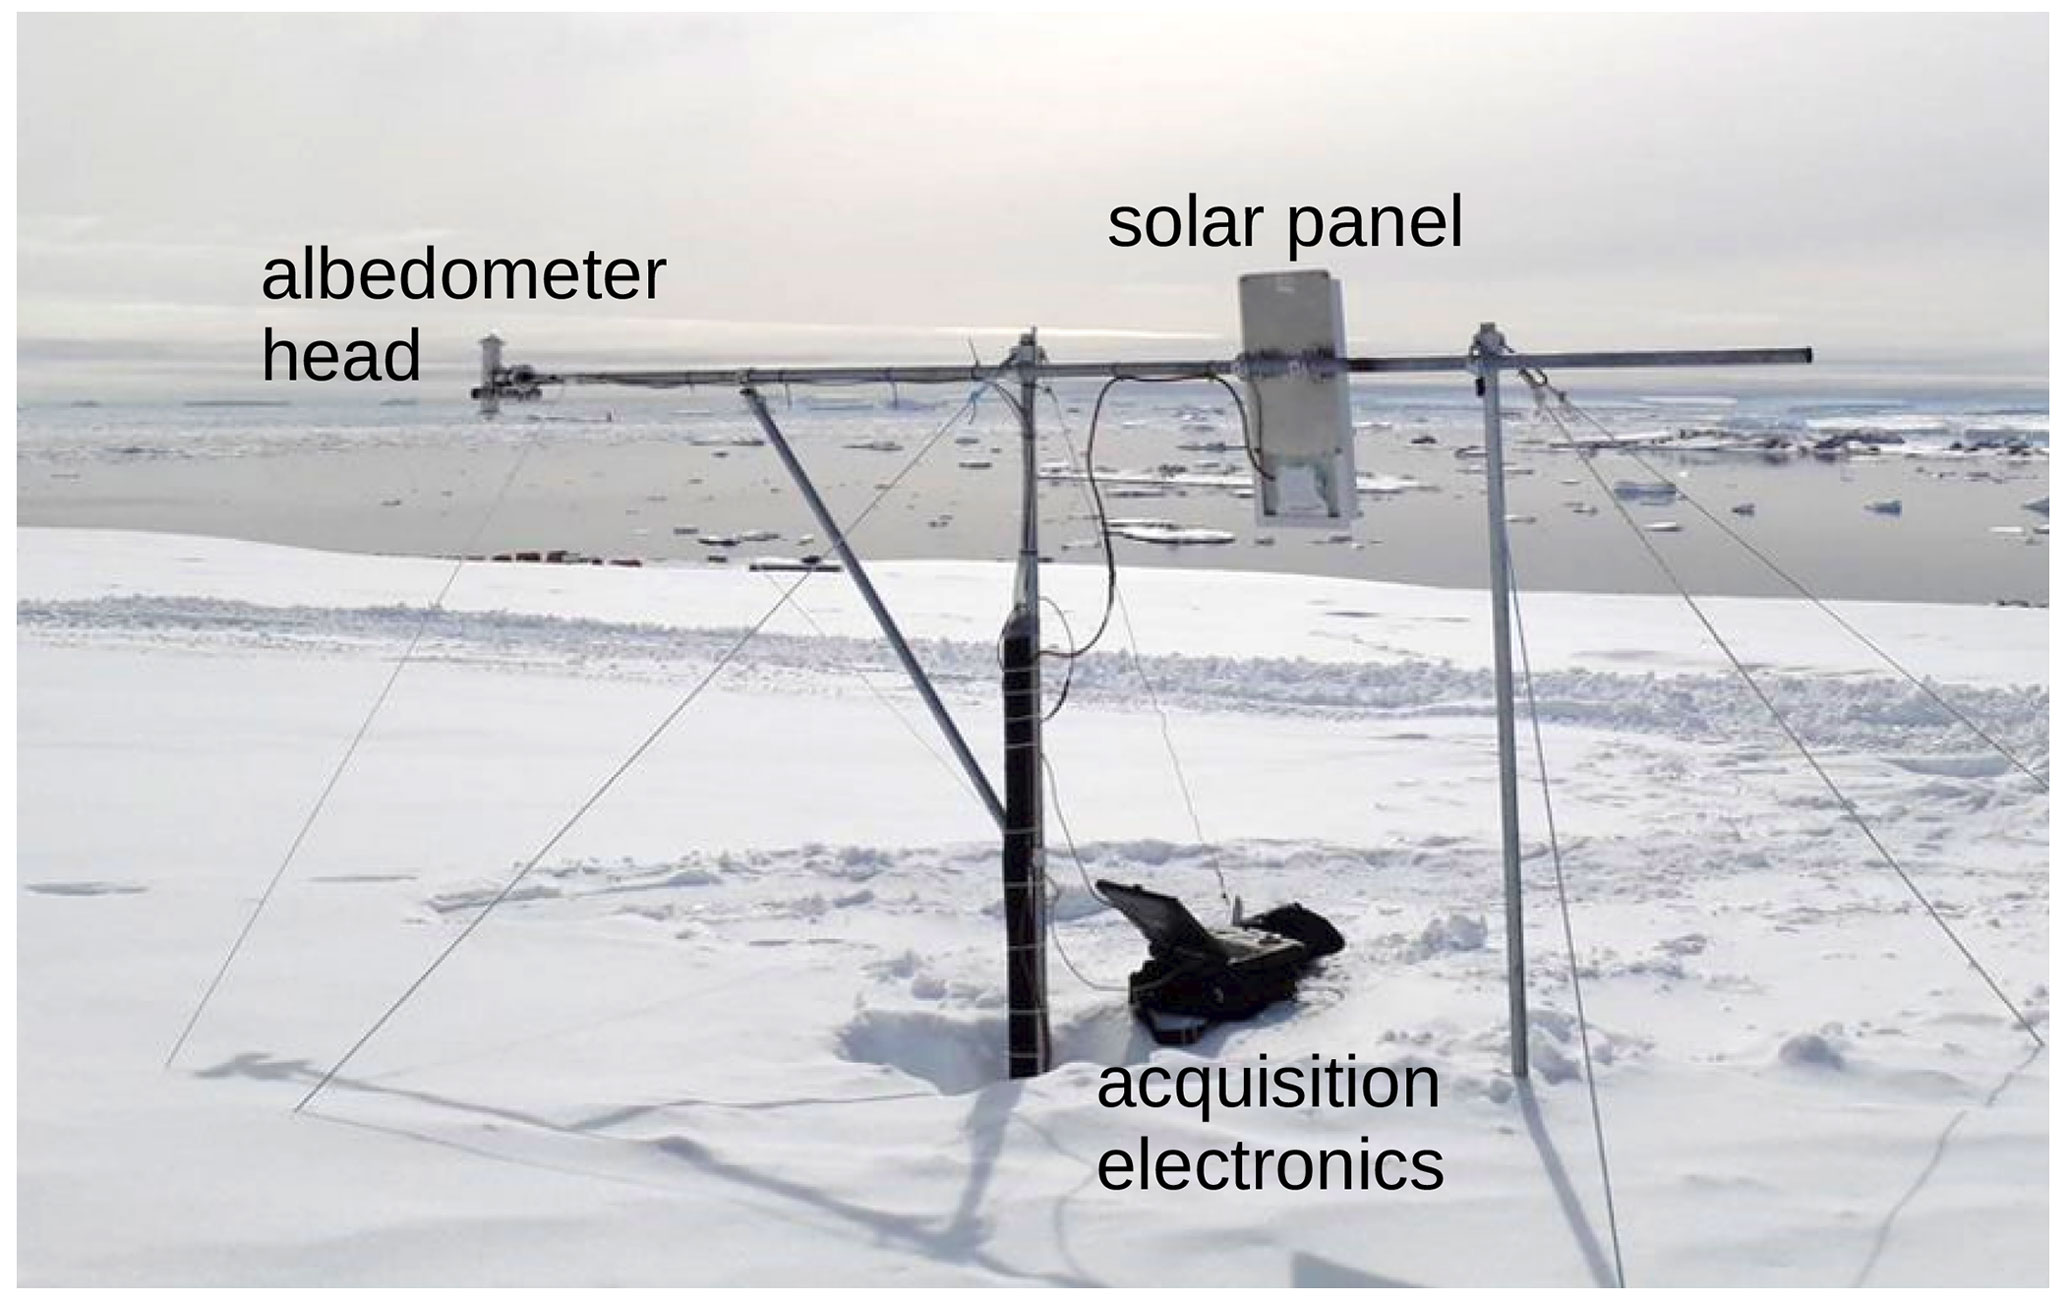
Figure 2Picture of the Multiband albedometer installed at D5, Adélie Land. The measurement head is on the left.
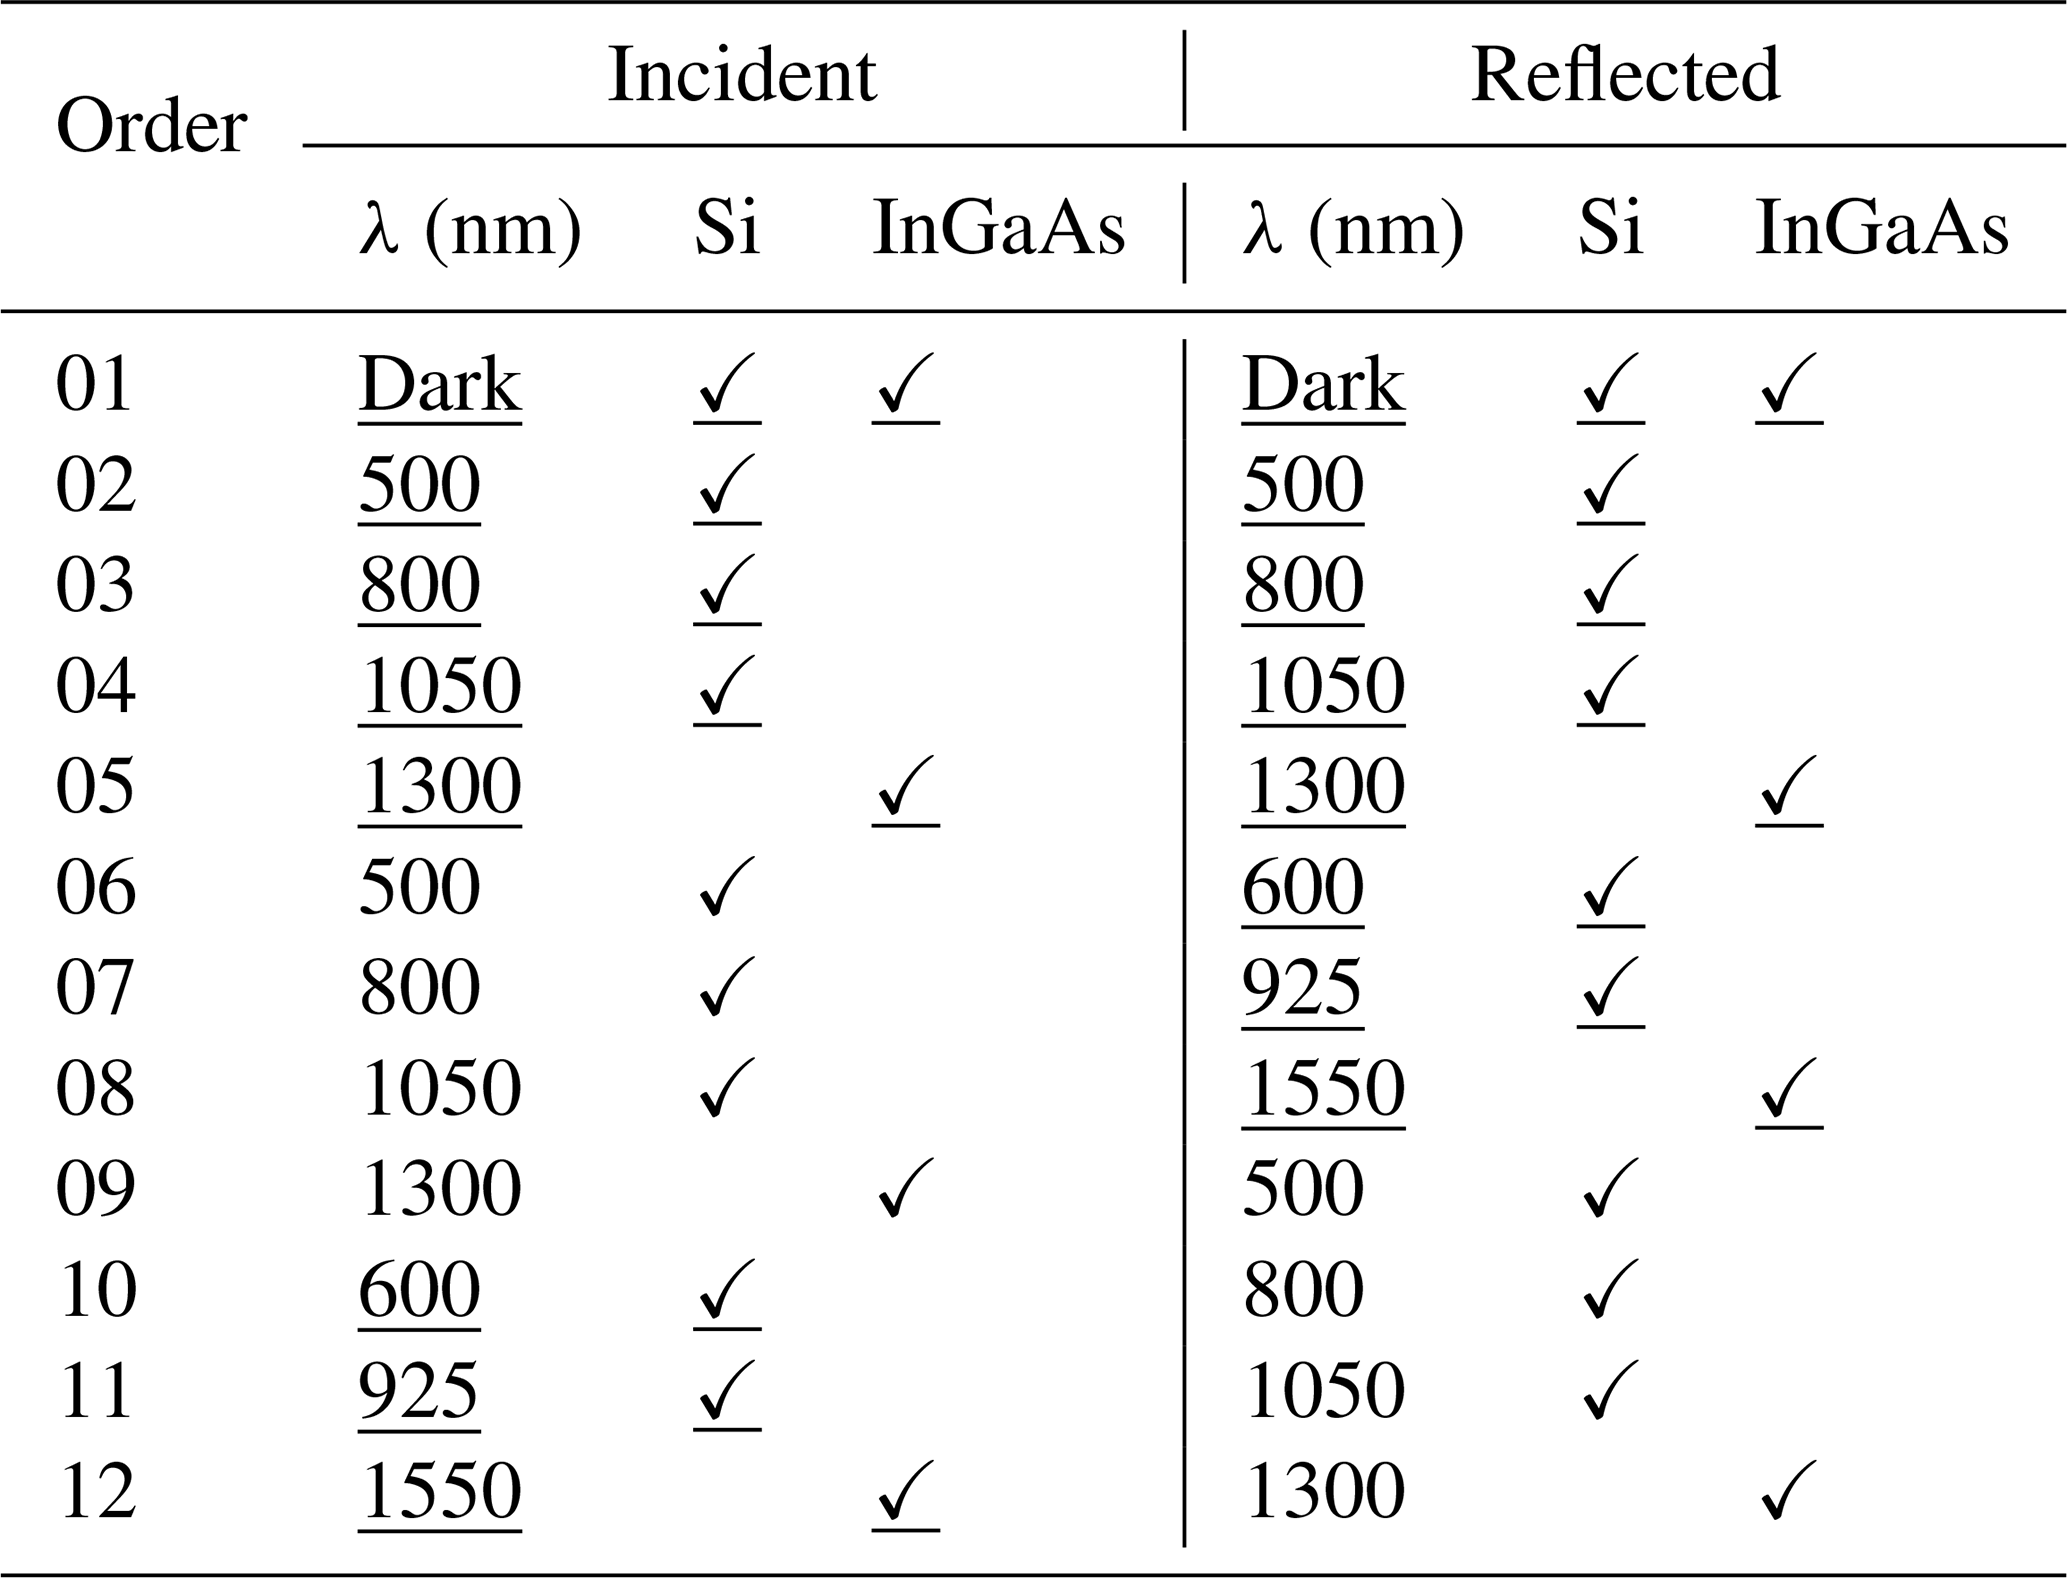
The Multiband instrument is a multi-spectral-band optical radiometer operating in the visible and near- and shortwave-infrared domains. It runs autonomously in the harsh conditions of the Antarctic environment thanks to the combination of a solar panel and a battery, with interventions needed just to recover measurements, once a year. It measures the incoming and reflected radiation in order to provide the spectral albedo of the snow surface. The structure of the Multiband instrument is depicted in Fig. 3. Incident and reflected solar radiation are collected by two homemade cosine-shaped light collectors located on the up- and down-facing sides of the instrument's head following Picard et al. (2016). Two 6 m long optical fibers (800 µm core diameter, QP800-VIS NIR, Ocean Optics) transmit the radiation inside the instrument to a rotating filter wheel containing 12 optical filters at user-selected wavelengths. The selection for this study was optimized for the albedo of snow and includes only seven different wavelengths. They are 500, 600, 800, 925, 1050, 1300 and 1550 nm (TECHSPEC® hard-coated optical density (OD) 4.0 25 nm bandpass filters, Edmund Optics). During a measurement cycle, the wheel rotates by successive steps, and the irradiance is measured for both the incident- and reflected-light channels by two dual-band Si–InGaAs photodiodes (DSD2, Thorlabs). The measurements of the irradiance are simultaneous for the two channels, but the photodiodes are located in front of different slots of the filter wheel, which means that the order of measurement with respect to the wavelength is shifted between the two channels. For this reason, the remaining slots of the filter wheel were filled with duplicates of the filters at 500, 800, 1050 and 1300 nm in order to make some of the measurements for the same wavelength simultaneous for the two channels. Table 1 shows the resulting list of wavelengths of the selected filters and the order of measurement during the rotation of the filter wheel. The measurements chosen for the albedo retrieval are underlined. The rotation cycle of the filter wheel lasts nearly 30 s. A high-gain, electronic board converts and amplifies the signal from the two dual photodiodes. Then, a data logger registers the measurements (CR1000, Campbell Scientific). Since the incident and reflected measurements for three wavelengths are not simultaneous, we record the changes in the incoming radiation during the 30 s of the measurement cycle in addition. To this end, another upward-facing optical fiber located near the albedometer head transmits the environmental incoming radiation to a Si photodiode (FDS100, Thorlabs) without any spectral filter. This photodiode acquires one wideband measurement (350–1100 nm) for each step of the wheel, which is converted, amplified and recorded as the narrow-band measurements. At last, once per cycle, the dark current is measured for each dual photodiode using an obstructed window in one of the filter wheel slots. After suited artifact corrections detailed in Sect. 2.3, the spectral albedo is computed as the ratio of the reflected- and incident-irradiance spectra. The albedometer head was installed at the edge of a north–south-oriented metal gantry (Fig. 2) in order to minimize gantry components or shades in its field of view. The head height at the moment of installation was of 1.6 m above the surface, which decreased on average by 18 cm yr−1. After installation, the head was leveled thoroughly. The active sensors, batteries and acquisition electronics are buried in the snow to ensure the stability of their temperature and thus of the measured signal accuracy. The Multibands at D5 and D17 ran during Antarctic summer from January to March 2017 and have been running uninterruptedly from December 2019 until today. Interventions were carried out once a year to download observations and to check the leveling of the albedometer head. The most recent one occurred in December 2021.
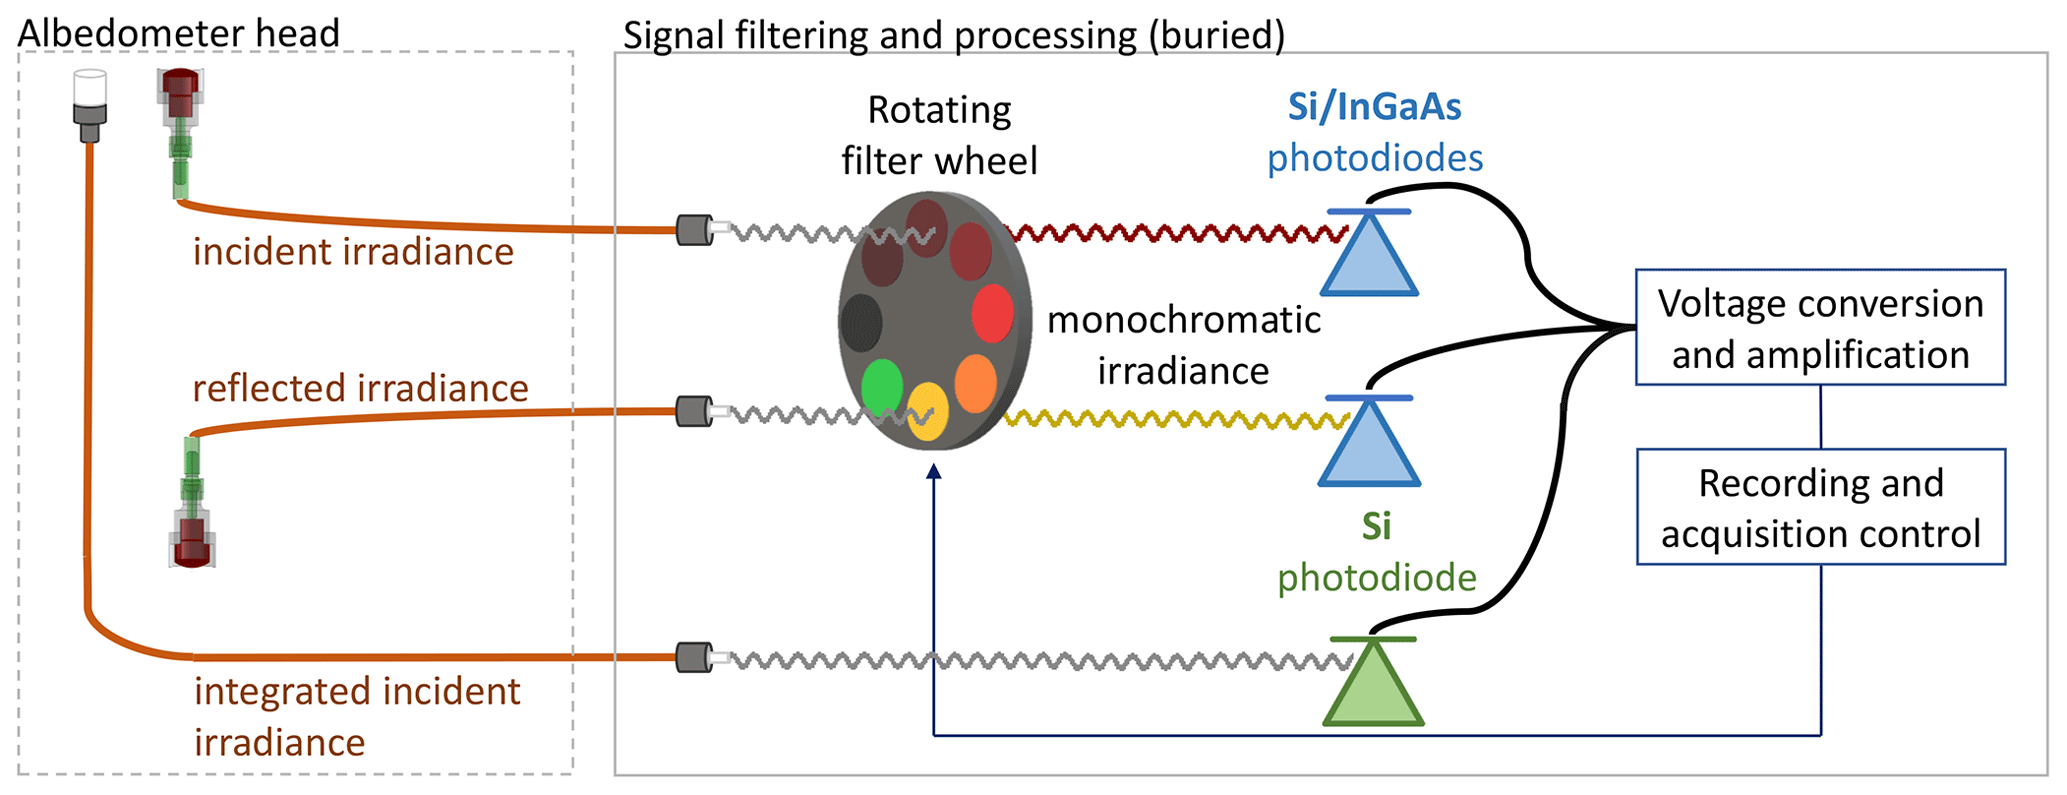
Figure 3Scheme of the Multiband albedometer displaying the albedometer head (dashed frame) connected through optical fibers (in orange) to the buried filtering and processing electronic systems (solid frame).
Table 1List and order of the irradiance measurements performed by the two dual-band Si–InGaAs photodiodes during the rotation of the filter wheel for the incident and reflected channels. The check mark identifies the band of the photodiode used for each wavelength λ. Measurements in the same row are simultaneous, and cycling over the 12 rows takes about 30 s. The chosen ones for the albedo retrieval are underlined.
2.3 From raw irradiance measurements to calibrated albedo
A Multiband measurement cycle consists of seven raw incident- and reflected-irradiance spectral measurements; 4 dark values, 1 for each band of the 2 dual-band photodiodes; and 12 wideband irradiances. Raw albedo measurements are subject to multiple artifacts and errors that need to be corrected. We developed a series of processing steps to derive accurate albedo spectra, as shown in Fig. 4. These steps are described here.
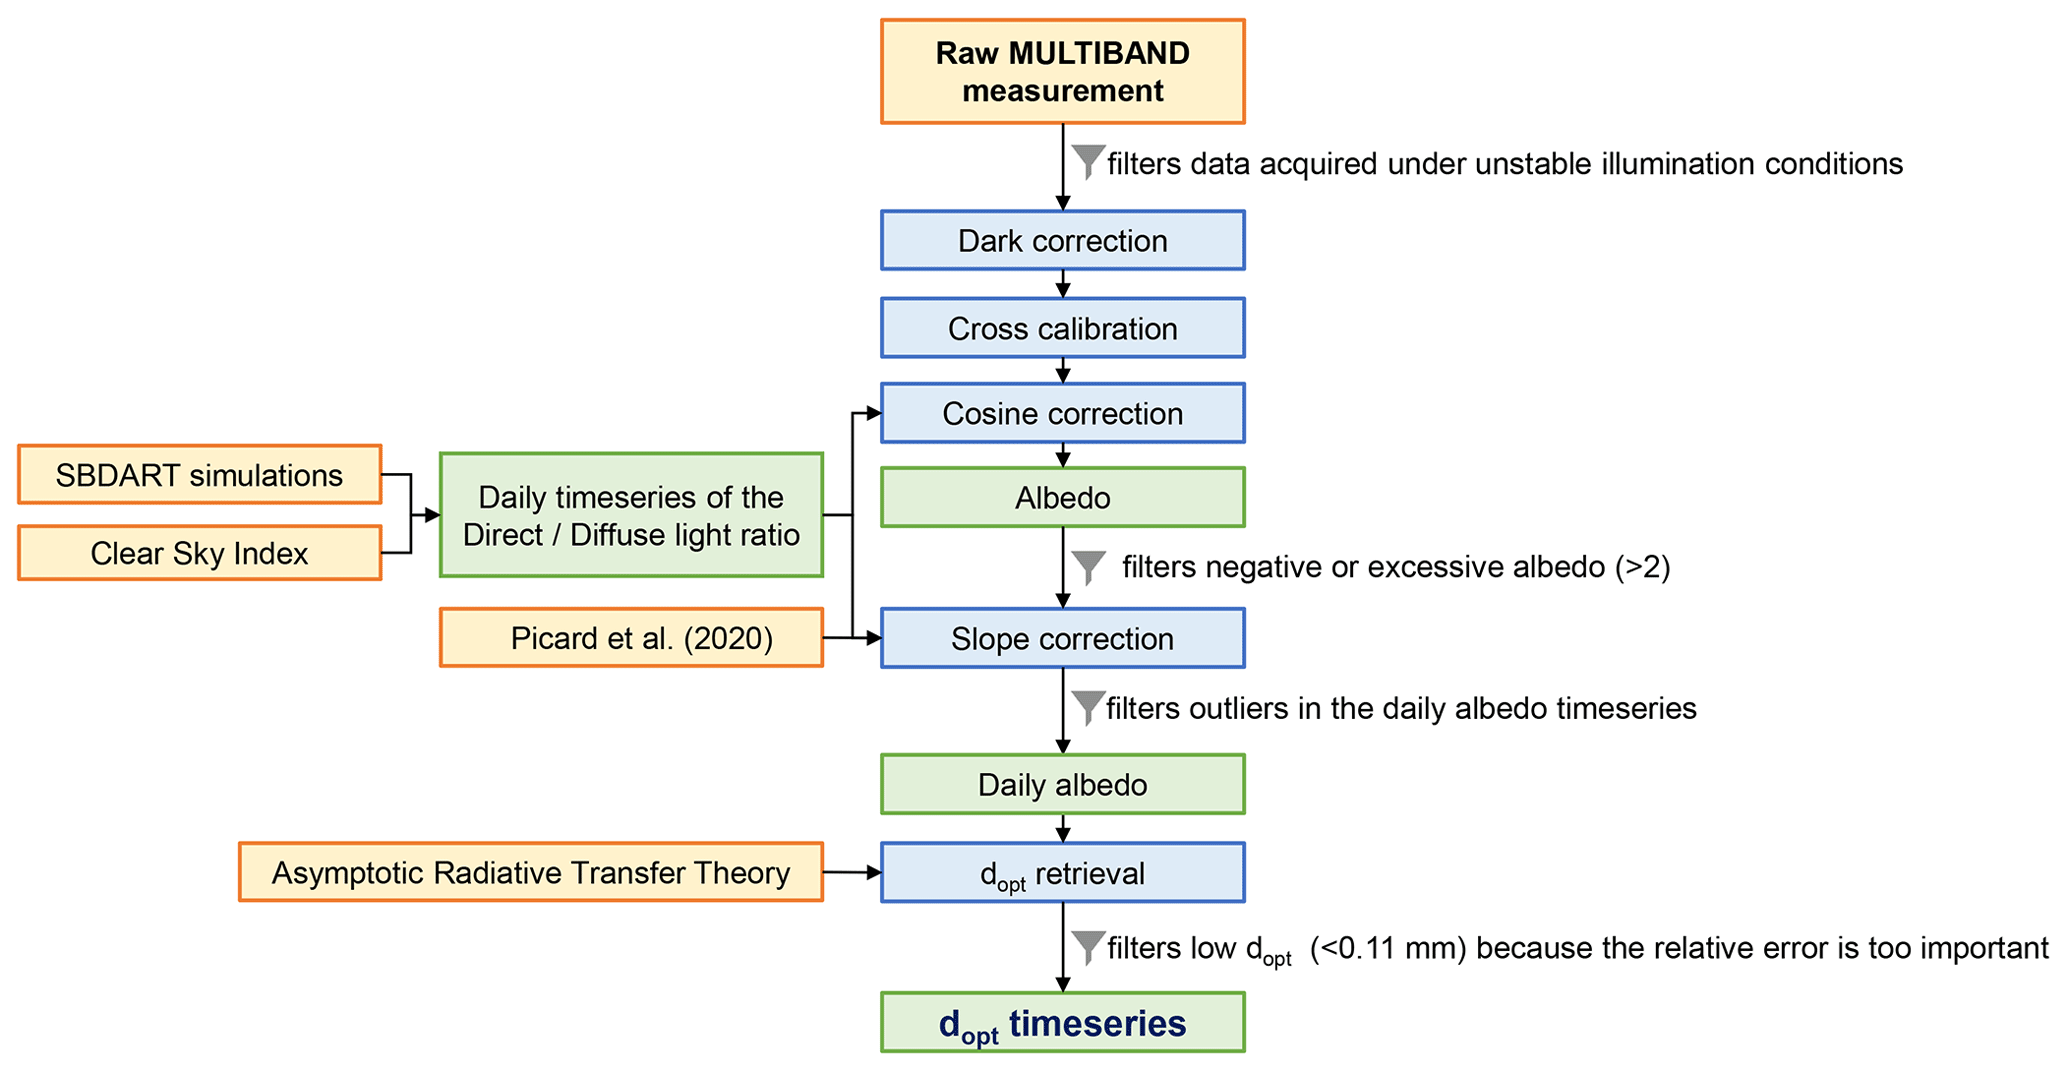
Figure 4Workflow of the processing showing input data (orange), processing steps (blue), and intermediate and final results (green). The funnel sign indicates filtering of data between two steps.
-
Raw measurement selection. Measurements acquired under unstable or low-sun illumination conditions are first discarded. These conditions are detected when the standard deviation of the 12 wideband measurements over the 30 s cycle exceeds 1 % of the mean wideband radiance. Measurements collected with solar zenith angle (SZA) larger than 70∘ are also discarded because of the reduced performance of the collectors at grazing angles (Picard et al., 2016) and the lower interest for the surface energy budget. Finally, we had to exclude the irradiance measurements at 1550 nm because of their poor signal-to-noise ratio.
-
Dark current. The raw radiance measurements are corrected to compensate for the dark current of the photodiodes. The dark-current measurements recorded once every measurement cycle are therefore subtracted from the spectral-irradiance values according to the corresponding channel and photodiode band.
-
Cross-calibration. The difference in transmissivity through the cosine collectors and the fibers, as well as the difference in sensitivity of the electronics between the incident and reflected channels, is compensated. For this, a specific experiment, called cross-calibration (CC), was carried out during the initial deployment of the instrument. During this experiment, the light collectors of the two channels (incident and reflected) were positioned side by side and leveled looking upward so that they both receive exactly the same irradiance. Spectral measurements were acquired during 2 d in this configuration for both channels, every hour during daytime and every 10 min in the hour following solar noon. These CC acquisitions were then processed as follows: the acquisitions during unstable illumination conditions were first discarded, and the remaining were corrected for dark and averaged for each wavelength and channel. The ratio, calculated for each wavelength, between the averaged CC reflected irradiance and the averaged CC incident irradiance, gives the relative difference in sensitivity between the two channels at this specific wavelength. Then, to compensate for the small differences between the two channels during normal operation, this ratio is multiplied by the incident channel spectra throughout the time series.
-
Cosine response correction. For an accurate measurement of the irradiance, the ideal light collector has a perfect cosine response. Our homemade collectors are identical to those designed by Picard et al. (2016), and their response is typically better than 6 % in the incidence angle range of 0–70∘, while it degrades for more grazing angles. Despite these excellent optical performances and in order to improve the albedo accuracy, the residual error is corrected by an ad hoc processing step following the procedure described in Picard et al. (2016). Shortly, the collector response was first measured in the lab by illuminating the collector with a collimated beam at different incident angles and wavelengths. This response is used to normalize the actual measurements during normal operations in the field. However, this normalization must be applied to the direct component of the incident radiation only; neither the diffuse incident component nor the reflected component (which is fully diffuse) is subject to this artifact. This implies that the direct and diffuse incident irradiance can be partitioned for each measurement at every wavelength. For this, we rely on numerical simulations instead of on additional measurements, as described in the next point.
-
Direct-to-diffuse-irradiance ratio. The direct–diffuse partition in the incident irradiance was computed from simulations with the Santa Barbara DISORT Atmospheric Radiative Transfer (SBDART) model (Ricchiazzi et al., 1998). The simulations considered a standard sub-arctic winter atmosphere (the closest to summer Antarctic coastal conditions), pristine atmosphere and no clouds. The coordinates and elevation of the simulated fluxes are 66.69∘ S, 139.90∘ E, and 90 m a.s.l.
-
Clear-sky index. The cloud cover is a major determinant of the direct–diffuse partition. For the sake of simplicity, we classify each Multiband measurement as realized under either clear- or overcast-sky conditions. For this purpose, the clear-sky index (CSI) proposed by Marty and Philipona (2000) was computed for all measurements, using the incident longwave irradiance, 2 m air temperature and relative humidity from the AWS measurements located at D17. Briefly, Marty and Philipona (2000) consider as clear sky the condition CSI <1. However, we choose to classify as clear sky all measurements acquired with CSI ≤ 1.25, as we consider a thin or partial cloud cover that still lets direct light penetrate to the ground (e.g., cirrus or haze) to be better represented by clear-sky conditions than overcast. Finally, days are classified as clear sky when at least 75 % of measurements acquired during that day are clear sky and overcast otherwise. Clear-sky days are assigned the direct–diffuse partition modeled with SBDART, while overcast days are considered to be fully diffuse for each wavelength. The CSI computed for D17 was also used for D5, as we lack in situ temperature and relative humidity measurements at the station. This was preferred to using reanalysis such as ERA5 or MERRA, with too coarse a resolution to capture the difference between the two sites.
-
Slope correction. Sensor tilt and surface slope alter the measured albedo by increasing or decreasing the amount of radiation that hits the collectors as the solar azimuth angle varies throughout the day (Grenfell et al., 1994). These impact the measurement of albedo by increasing or decreasing the amount of the measured reflected radiation according to the slope orientation with respect to the sun's position. For instance, Picard et al. (2020) show that an albedo error of 0.01 is detectable for slopes as small as 0.6∘ when the solar zenith angle is 45∘. Moreover, the magnitude of the error increases with the solar zenith angle and with the slope magnitude. However, it decreases with the cloud cover until being negligible during overcast days (Weiser et al., 2016; Bogren et al., 2016). For the Multiband instruments installed at D5 and D17, the sensor tilt was found to be negligible, <0.5∘, thanks to a thorough leveling of the albedometer head carried out during installation and monitored during the annual servicing of the instruments. We therefore exclude significant tilt. Additionally, with an installation height of 1.6 m, the collected light is coming from a circular area of a few meters in diameter on the surface so that local slopes and roughness are always present and significant at this scale. Furthermore these slopes are variable in time at D5 and D17 due to the presence of episodic sastrugi and other bedforms. To correct for the presence of a slope, we apply one of the methods described in Picard et al. (2020), “the constrained correction of the diurnal cycle of albedo with unknown slope parameters”. The method is considered “constrained” because it assumes that the corrected diffuse albedo has a fixed mean value between 500 and 600 nm (0.98 by default). Briefly, the correction is applied every day independently and assumes (1) that the true snow diffuse albedo is constant during the day (i.e., snow properties are not changing), (2) that the daily cycle of measured albedo is ascribable to the unknown surface slope artifacts and the known solar zenith angle variations only, and (3) the slope is planar at the scale of the sensor footprint. The output for every day consists of (a) a single spectrum of corrected diffuse albedo, (b) the values of the slope inclination and aspect, and (c) the full time series of modeled albedo spectra for each measurement day.
2.4 Retrieval of specific surface area
The specific surface area (SSA; m2 kg−1) and the effective optical grain diameter (dopt; mm) are retrieved from the diffuse albedo spectrum for each day. The first one is the surface area of the ice–air interface of snow per unit of mass of ice. The second is the diameter of a collection of spheres having the same SSA as the actual snow. These variables are interchangeable and linked by the following relationship:
where ρice=917 kg m−3 is the ice density. Both variables are retrieved with the two-parameter model described in Picard et al. (2016) and derived from the analytical asymptotic radiative transfer theory (ART; Kokhanovsky and Zege, 2004). Briefly, the direct and diffuse albedo are modeled as
where λ is the wavelength, A is an unknown scaling factor that accounts for wavelength-independent artifacts (residual calibration error or illumination fluctuations), and θ is the solar zenith angle (SZA). Here we take the absorption enhancement parameter B=1.6 and the asymmetry factor g=0.85 as suggested by Libois et al. (2014). γ(λ) is the ice absorption taken from Warren and Brandt (2008). This model is valid for albedo measured on a flat surface; vertically and horizontally homogeneous snowpack; and clean snow, which is the case in our area (after the slope correction). The two unknown parameters, A and SSA, are computed by fitting the albedo model (Eq. 3) to the daily diffuse albedo provided by the slope correction at 800, 925 and 1050 nm using a least-square minimization. The model is applied considering that the albedo is measured at 800, 925 and 1050 nm precisely, ignoring the spectral width of the filters (25 nm). Indeed, using Eq. (2) and (3) in numerical tests, we found maximum differences in albedo to be less than 0.004 when accounting or not for the spectral band width, which is a negligible error. Finally, the effective optical grain diameter is deduced from SSA using Eq. (1).
2.5 Additional filtering
Over 10 000 measurement cycles were acquired at each location (every hour during daytime and every 10 min in the hour following local noon, 03:00 to 04:00 UTC), from September to March between January 2017 and December 2021. For D5 and D17, respectively, 9.6 % and 20.1 % of measurement cycles were discarded because of unstable illumination conditions during the cycle. An additional 0.6 % and 0.5 % of the measurements were discarded after dark subtraction, inter-calibration and cosine correction because the albedo computed before slope correction contained values below 0 or above 2 for at least one wavelength. A negative albedo value suggests an incorrect dark correction (signal smaller than the dark), while values above 2 are possibly due to large slopes, considered too difficult to correct (Picard et al., 2020), or to snowfall obstructing the upward-looking collector. The slope correction was then applied to the remaining spectra for each day of the over 600 d at each station. To assess the quality of the fit, we computed the root mean square error (RMSE) between all the measured and modeled albedo spectra acquired during each day and filtered out the outlier acquisitions by using a z-score test with a 2σ threshold. The slope correction was then repeated without these outliers. After this step, if the RMSE >0.05, the output of the fit is definitively discarded (4.4 % and 6.2 % of the days at D5 and D17, respectively). This step helps identify and remove the measurements that may have been acquired under different sky conditions than those assigned to the whole day.
Over 600 slope-corrected, daily spectral diffuse albedo values were obtained for each station. The average RMSE is 0.021 and 0.020 for D5 and D17, respectively. To assess how such an error impacts the retrieved SSA and dopt, we computed the theoretical diffuse albedo of five SSA values between 10 and 60 using Eq. (3) (with A=1) and added a normally distributed random noise with a standard deviation of 0.021. SSA and dopt were then retrieved for each of the 1000 perturbed albedo spectra for each of the 5 SSA values. The resulting distributions are shown in Fig. 5a for the SSA and Fig. 5b for the optical diameter.
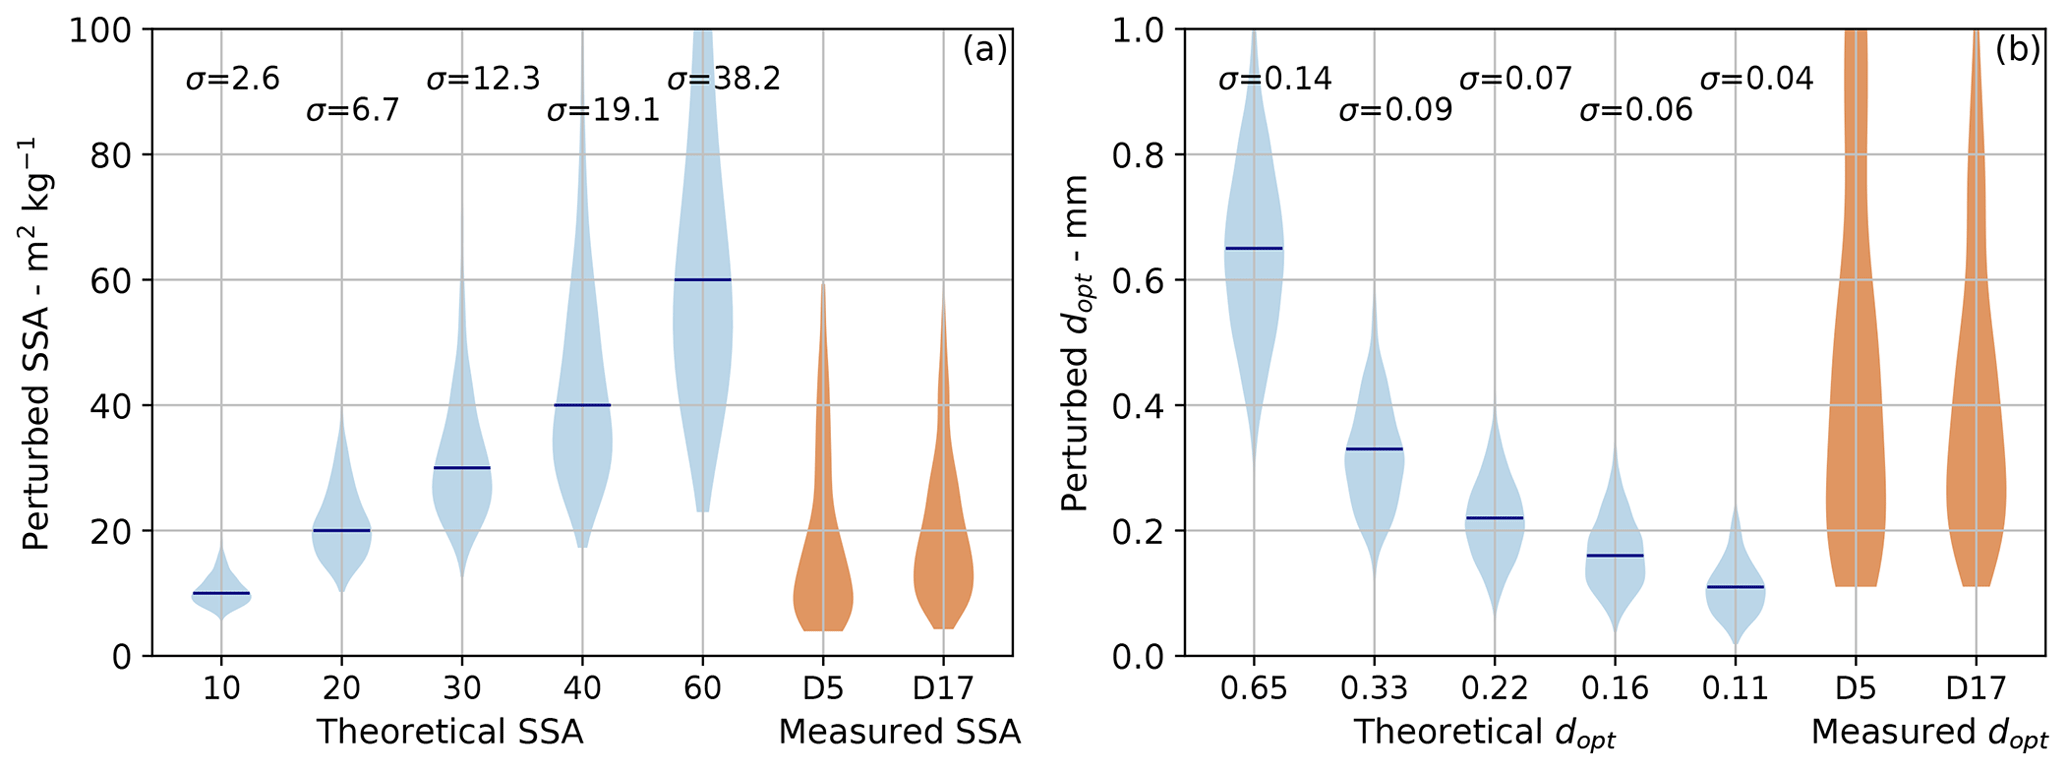
Figure 5Error induced in the SSA (a) and in the dopt (b) from an error of 0.021 in the measured albedo (in blue) and distributions of the observed values (in orange).
The standard deviations of the perturbed distributions increase with the SSA, from 26 % for a SSA of 10 m2 kg−1 to 64 % for a SSA of 60 m2 kg−1 with respect to the true value. The distributions of the perturbed dopt in Fig. 5b show a decreasing absolute standard deviation but an increasing relative standard deviation as dopt decreases. As a conclusion, we consider that the error for measured SSA above 60 m2 kg−1 and the corresponding dopt of less than 0.11 mm are too large for our application, and these measurements are discarded. The final results account for 541 and 601 d with valid SSA and dopt for D5 and D17, respectively. Their final distributions are shown in Fig. 5a and b (in orange).
2.6 Evaluation against satellite and in situ observations
As no reference to in situ measurements of grain size are available at our site, we first rely on satellite observations for an independent assessment of the quality of our retrieval and, second, on broadband albedo measurements recorded at D17 using a conventional shortwave radiometer (CNR4).
The measured dopt is compared to dopt retrieved from images from the OLCI (Ocean and Land Colour Instrument) on board the ESA's Copernicus Sentinel-3A/B (Nieke et al., 2012)). The retrieval is done using the algorithm SICE, the “Pre-Operational Sentinel-3 Snow and Ice Product” (Kokhanovsky et al., 2019). Shortly, the albedo is retrieved from the calibrated and geolocated top-of-atmosphere radiances measured by OLCI at 865 and 1020 nm, and the snow grain size is computed from the albedo using the ART (Kokhanovsky and Zege, 2004), as in our case, but with a largely different algorithm. Surface snow is assumed to be clean (which is often the case in Antarctica; Warren et al., 2006) and vertically and horizontally homogeneous over a flat, 300 m pixel.
The dopt measured by Multiband (MB) and retrieved with SICE for D5 and D17 (for 140 and 150 clear-sky dates according to the CSI) is shown in Fig. 6. At both locations, a group of SICE dopt has very low values independently of the value of the corresponding MB dopt, likely because of the presence of undetected clouds on the pixel during the satellite overpass. A statistical test is thus applied to identify outliers between low SICE dopt values. If the latter are <0.2 mm, and the difference to the MB dopt exceeds 3 times the average difference, the measurement is considered an outlier and rejected. A total of 29 and 28 outliers (in yellow) were identified for D5 and D17, respectively, with 27 common dates among them. The remaining pairs of dopt (in blue) have a Pearson’s correlation coefficient of 0.67 for D5 and 0.76 for D17. The RMSEs between the MB and OLCI dataset are 0.36 and 0.16 mm for D5 and D17, respectively. Still, we believe the RMSE estimate at D17 to be more realistic than the one at D5. Indeed, the 300 m pixel of OLCI including D5 may not be completely representative of the snow reflectance because of the recurrent presence of blue-ice areas and containers, as well as the strong average north–south slope of the area covered by the pixel (8.3 %), which is almost double the average pixel slope at D17 (4.3 %). Thus, we conclude that Multiband measurements correlate with the SICE product with an overall error of 0.16 mm RMSE that can be considered to be an upper bound, since both the satellite and in situ measurements are subject to independent errors.
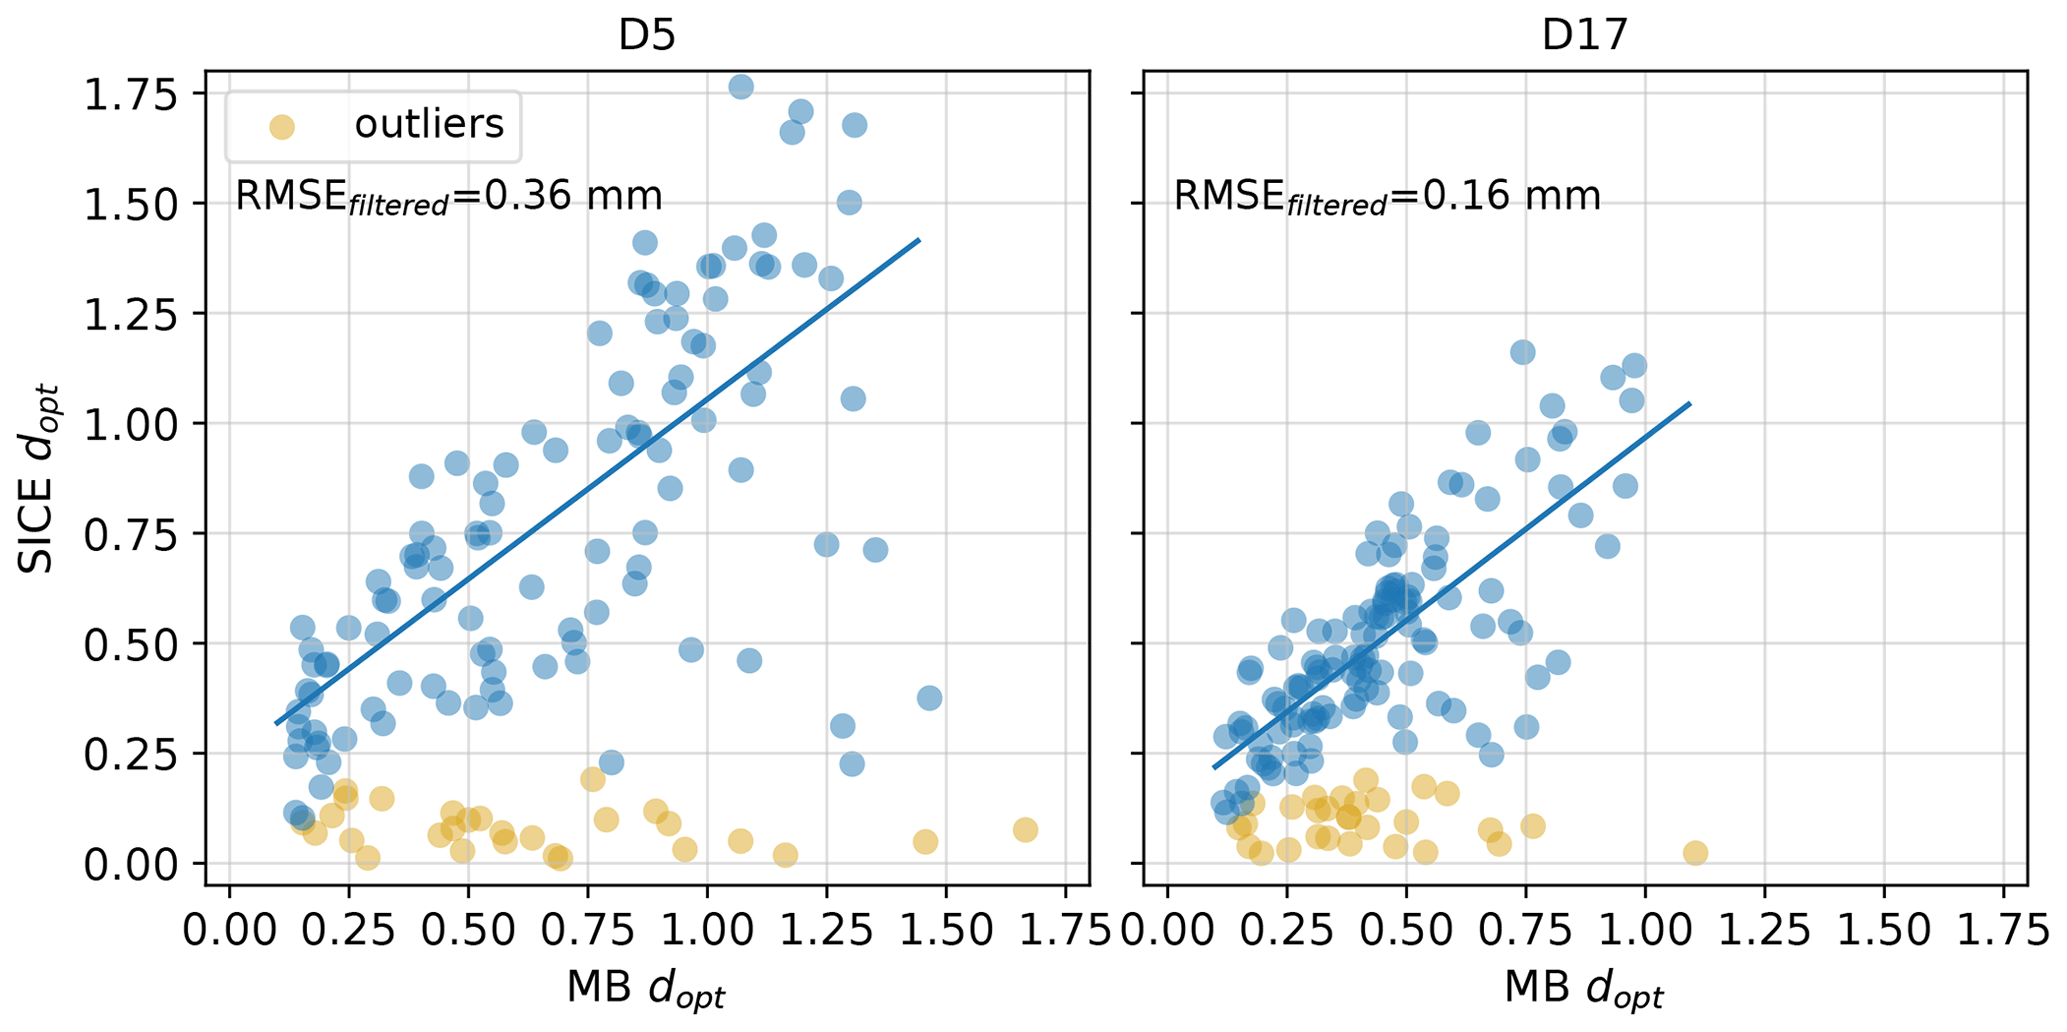
Figure 6Scatterplot of the dopt computed with SICE using OLCI images and measured by Multiband at D5 and D17.
A CNR4 radiometer providing shortwave broadband albedo is installed at D17. To test the quality of our measurements and the performance of our algorithm, we recalculate the broadband albedo from the retrieved dopt and compare to the one observed by the CNR4. To this end, we compute the diffuse and direct albedo between 0.28 and 2.5 µm with a step of 0.01 µm using Eqs. (2) and (3). One broadband albedo is computed every half hour, as CNR4 measurements are available every 30 min. The spectrum shape and the direct-to-diffuse ratio of the incoming shortwave radiation are computed with SBDART for a pristine, sub-arctic winter atmosphere. Simulations were made for solar zenith angles between 43 and 70∘ and cloud optical thickness of 0 and 30 for clear-sky and overcast conditions, respectively. The broadband albedo is computed as follows:
The resulting broadband albedo values measured at solar noon by Multiband and by the CNR4 are shown in Fig. 7 (solid line). The 10th–90th percentiles of the broadband albedo observed during the entire day is also shown (shaded area). The intraday variability in the albedo measured by the CNR4 is much wider, as its mean standard error is 0.061 for the CNR4 measurements and 0.008 for Multiband's. This difference, as well as the presence of non-physical albedo values above 1, is explained by sensor tilt and by the presence of a slope in the footprint of the CNR4 sensor due to the recurrent presence of sastrugi at D17 and to the relatively low installation of this sensor (<1 m). Sastrugi being transitory bedforms, this slope is dynamic, and it is not possible to correct the broadband albedo reliably from its effect, as opposed to spectral albedo (Picard et al., 2020). Still, it is possible to reduce the effect of the local slope by considering only the broadband albedo measured at noon (solid lines in Fig. 7), which is the least affected by tilt and slope as the sun is at its highest. At noon the two time series compare favorably, with a Pearson correlation coefficient r=0.51, a mean negative bias of 0.009 of the CNR4 and a standard error of 0.060. Significant differences above 0.1 of the two albedo values are 6 % of measurements and may be explained by the presence of persistent sastrugi structures or by a tilt of the sensor. Indeed, if we exclude days with CNR4 measurements of the broadband albedo >1 (75 % of all days), potentially due to the presence of strong slopes and clear-sky conditions, the correlation of the time series of broadband albedo measured at noon increases, with r=0.62, a mean negative bias of 0.013 of the CNR4 and a standard error of 0.051. Similarly, considering only measurements acquired during days with overcast sky – which are not affected by surface slope – the correlation coefficient increases up to r=0.55, with a mean negative bias of the CNR4 of 0.023 and a standard error of 0.047.
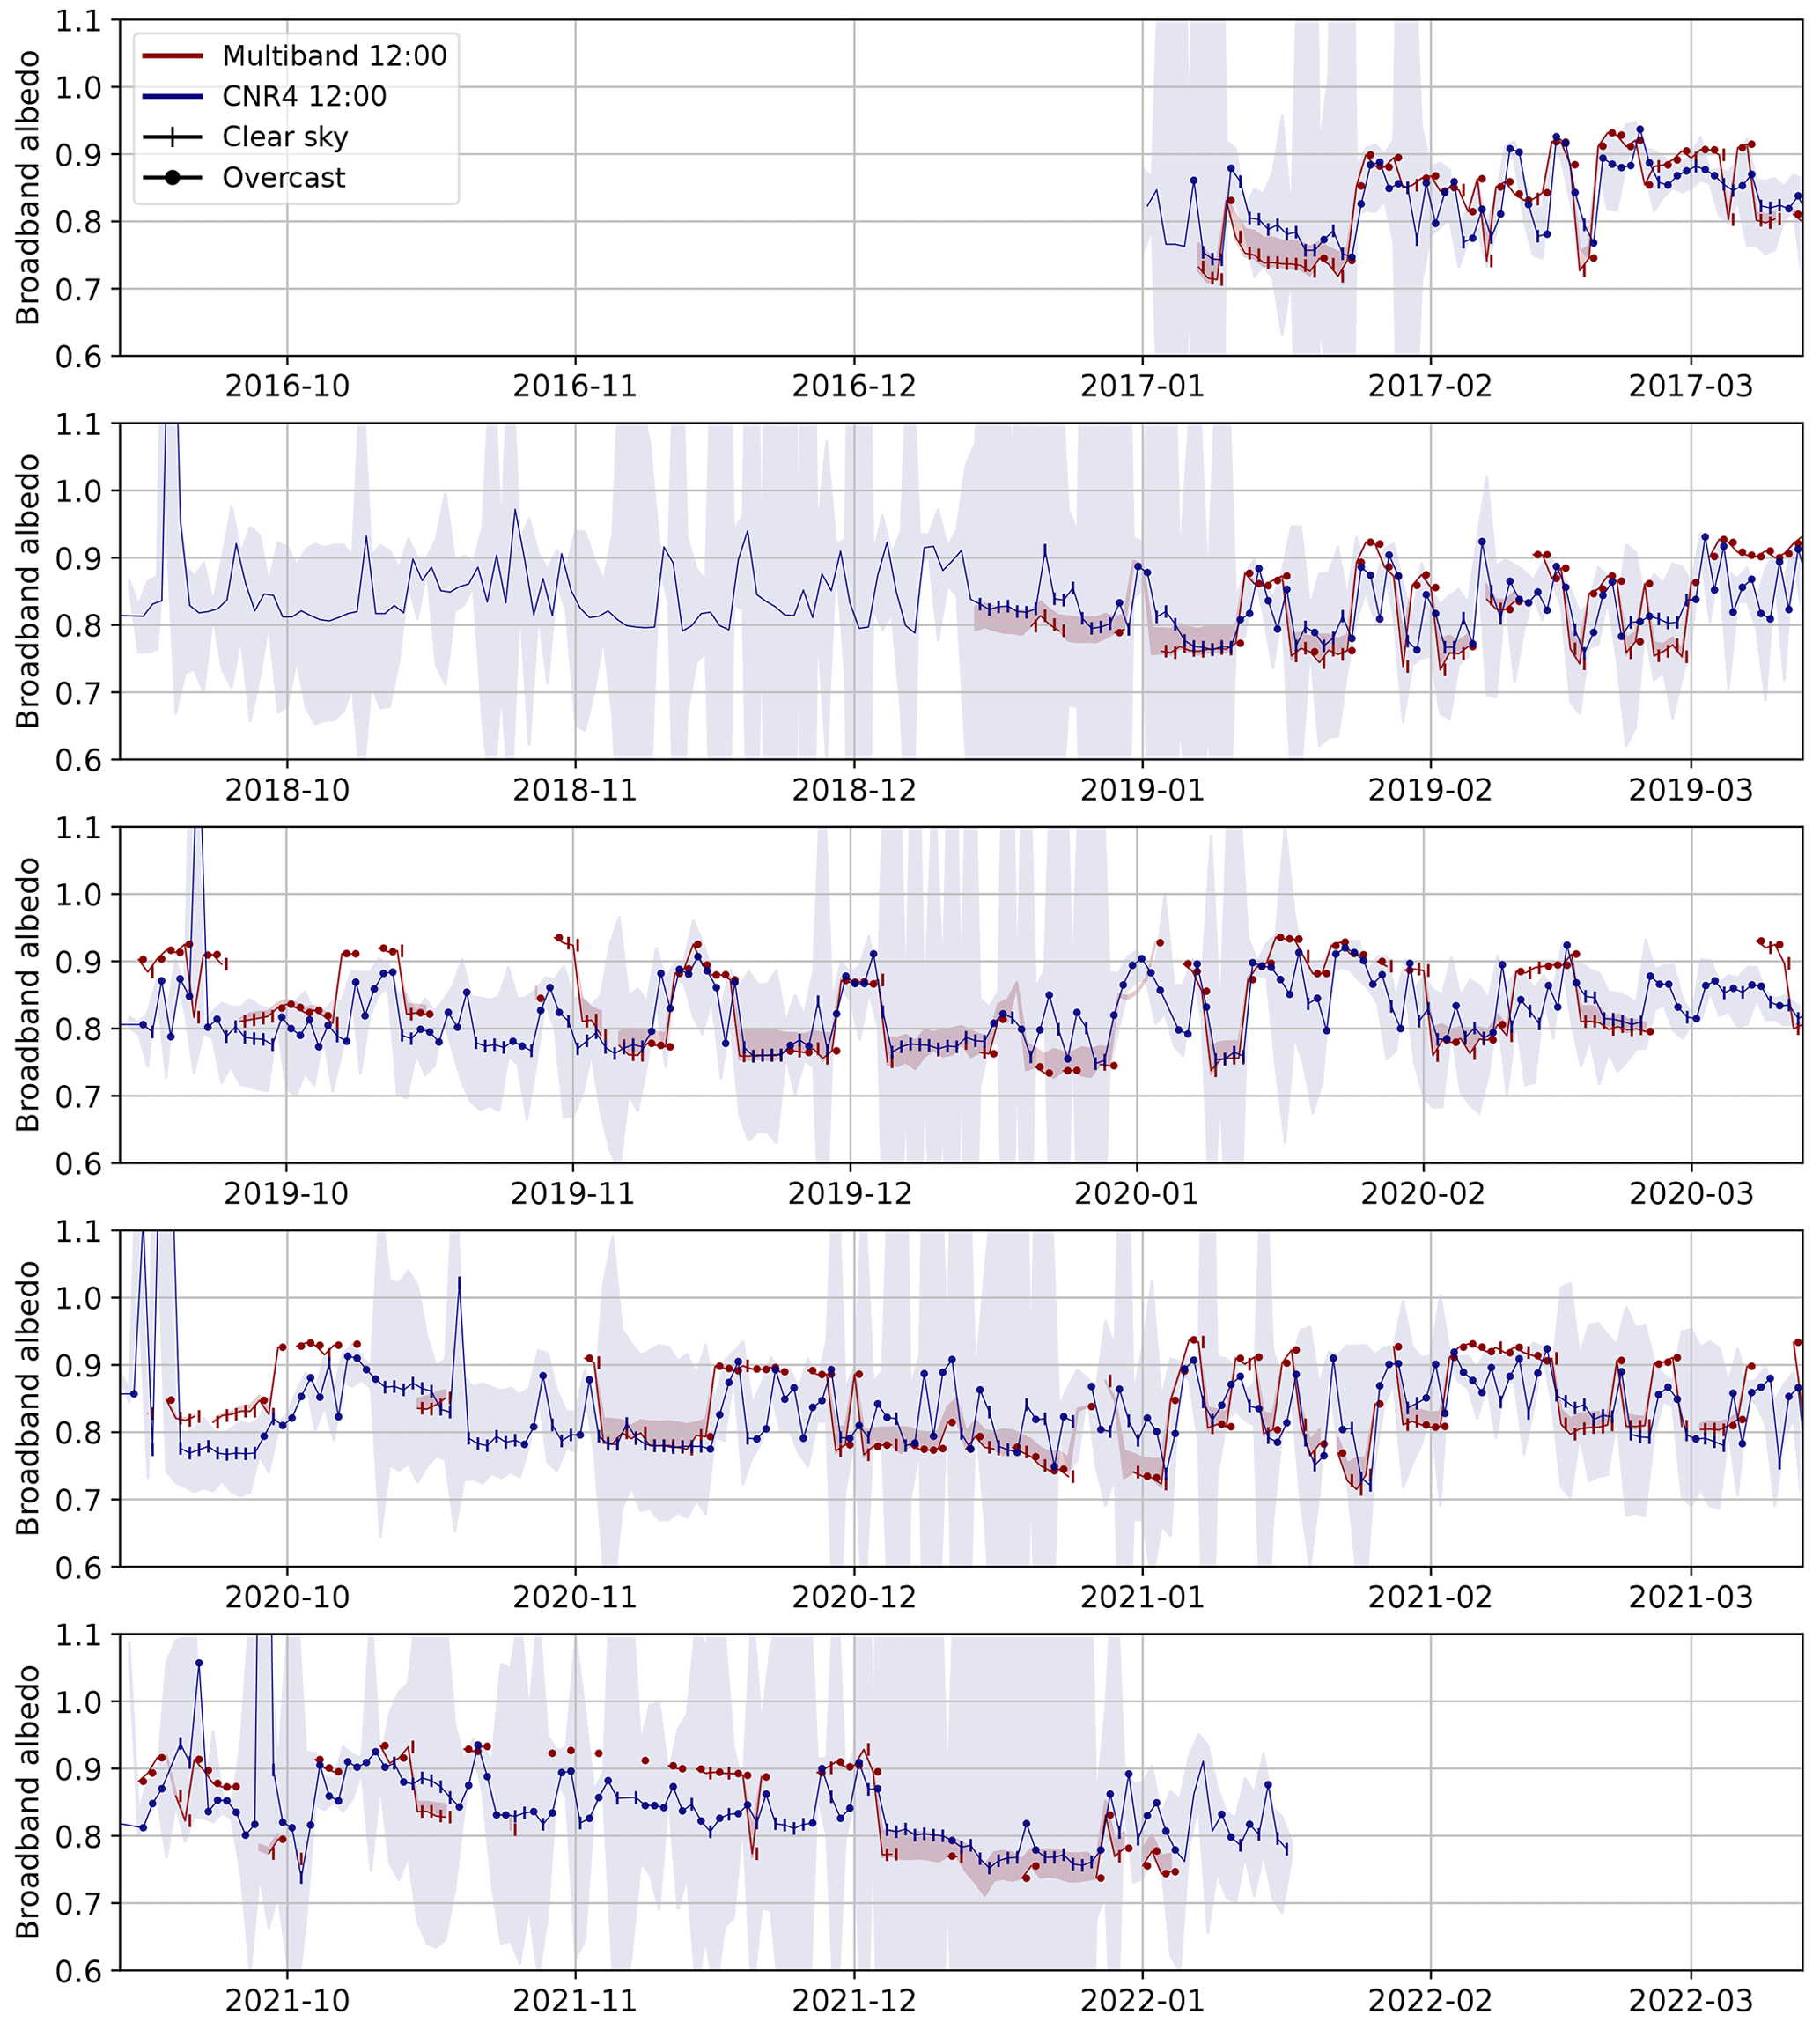
Figure 7Comparison of the broadband albedo computed from the retrieved dopt (red) and observed by the CNR4 sensor at D17 (blue) at solar noon (solid line). The 10th and 90th percentiles of the daily albedo measurements are also shown (shaded area).
3.1 SSA and dopt time series
The time series of retrieved SSA and dopt are shown in Fig. 8. Even though these two variables are strictly inversely related, the visual interpretation of dopt is more suitable for large grains, and conversely, the SSA is more suitable for small grains. This is the reason why both are shown. In the following, we mainly refer to dopt variations as the prevailing conditions in summer in our study area (melt and wet metamorphism) favor large grains.
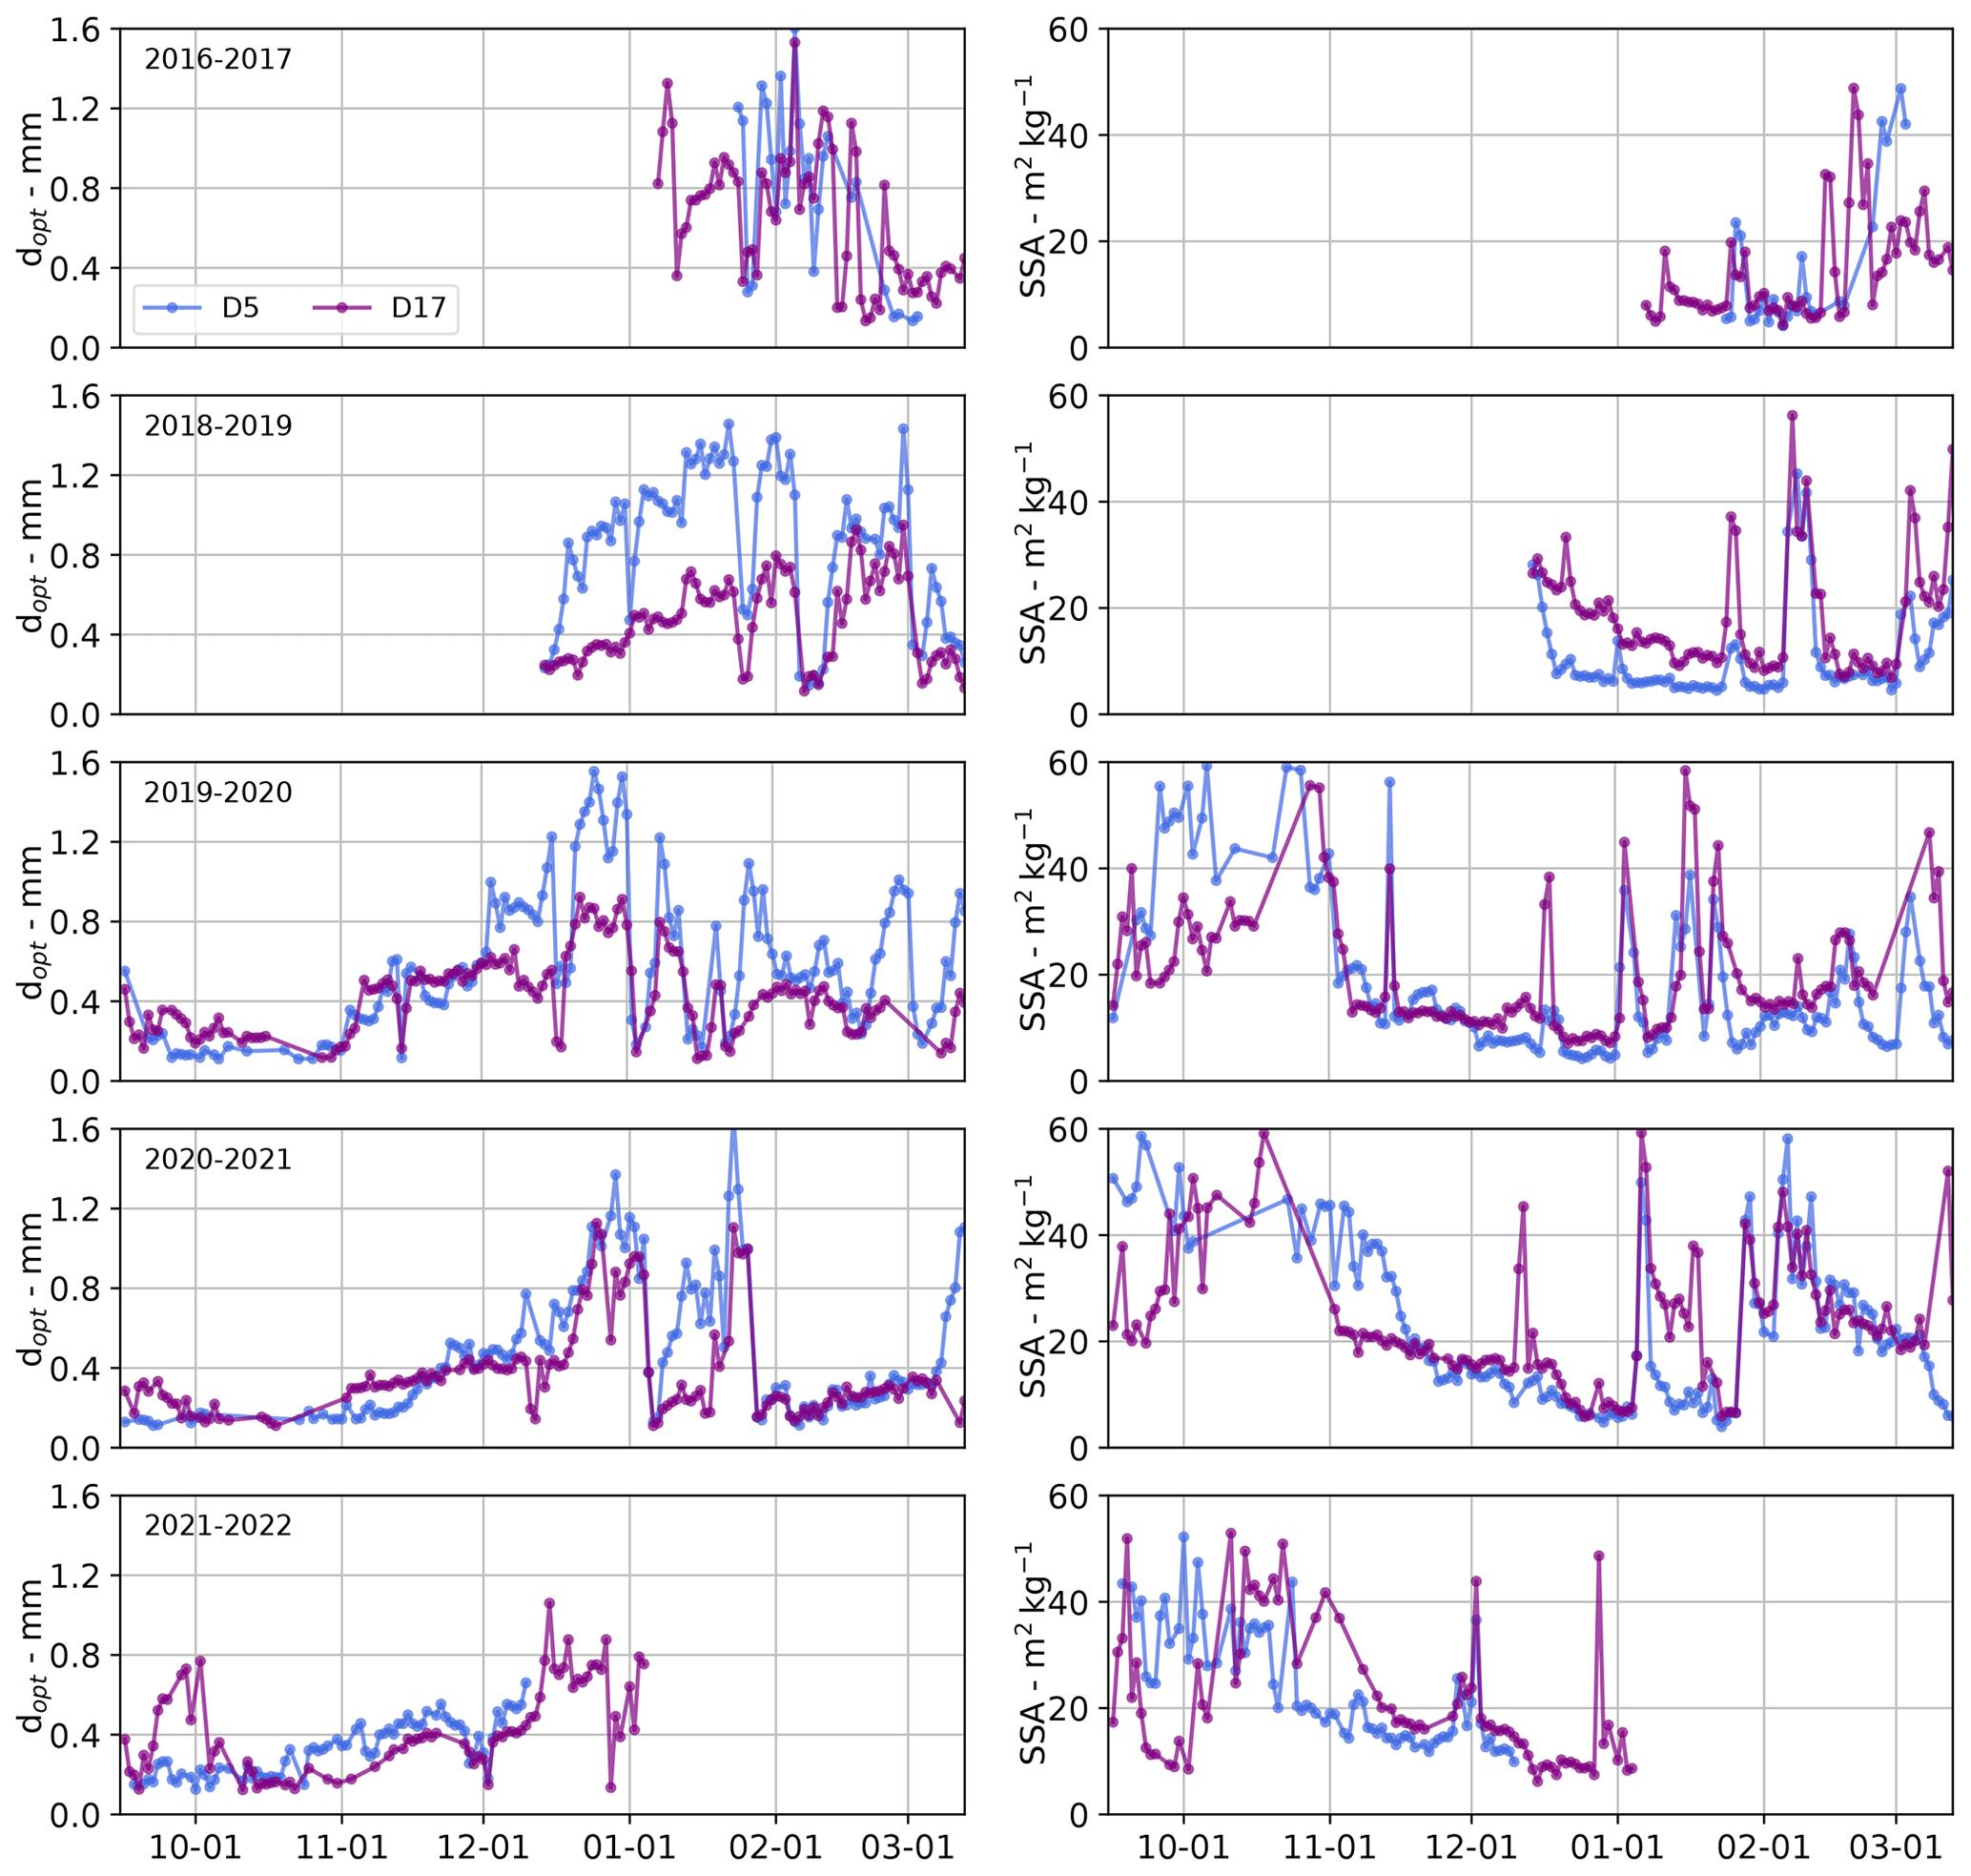
Figure 8Time series of dopt (left) and SSA (right) retrieved from Multiband acquisitions at D5 and D17.
The retrieved dopt varies between 0.11 and 1.7 mm at both stations, with mean values of 0.55 and 0.43 mm for D5 and D17, respectively. The variations at both locations are correlated, with a Pearson correlation coefficient between the two time series of r=0.72. Still, the dopt at D5 is larger than at D17 for 70 % of all days with valid measurements. The variations in dopt occur at the seasonal scale but also at more rapid scales. On the seasonal scale, the mean dopt is lowest in October (0.20 mm at both locations) and highest in January (0.82 mm at D5, 0.54 mm at D17). Superimposed on these seasonal variations, we observe occasional sharp decreases in dopt followed by a rapid increase with typical timescales of 1–10 d. These rapid variations usually co-occur at both locations, which confirms the geophysical nature of these changes, i.e., excluding measurement artifacts. Given this high correlation, we mostly interpret the time series at D17 in the following.
3.2 Meteorological conditions and variations in dopt
The time series of dopt measured at D17 are compared here in Fig. 9 with daily snowfall amount (SF), snow drift (SD), daily maximum surface temperature (Ts,max) and average surface height (SH). Snowfall is taken from the ERA5 reanalysis (Hersbach et al., 2018). The ERA5 grid point corresponding to D17 is situated at 66.75∘ S, 139.75∘ E, 3.5 km from D17, at an altitude of 430 m a.s.l. (versus 415 m a.s.l. for D17). Only snowfall values >0.5 are taken into account to avoid considering spatially confined precipitation that the reanalysis spreads over the whole pixel. The daily amount of drifting snow is measured in situ by the FlowCapt™ instrument (Chritin et al., 1999). Although it reproduces well the occurrence of drifting-snow events, this instrument underestimates the actual drifting-snow flow (Trouvilliez et al., 2014). Moreover, FlowCapt™ is mounted approximately 1 m above the ground and misses events of snow mobilization below a height of 1 m. The maximum daily surface temperature Ts,max is retrieved from the time series of the incoming and outgoing longwave irradiance measured and averaged every 30 min by the CNR4 at the AWS at D17 using the Stefan–Boltzmann law and a surface emissivity of 0.98. The daily average surface height is retrieved from SR50 distance measurements with respect to a surface located 2.25 m below the sensor for the first year of measurements (2016–2017) and 1.75 m below for the following. Days with rain events are distinguished by the presence of snowfall, daily maximum surface temperature Ts,max of 0 ∘C and daily maximum air temperature Tair,max above 0∘C.
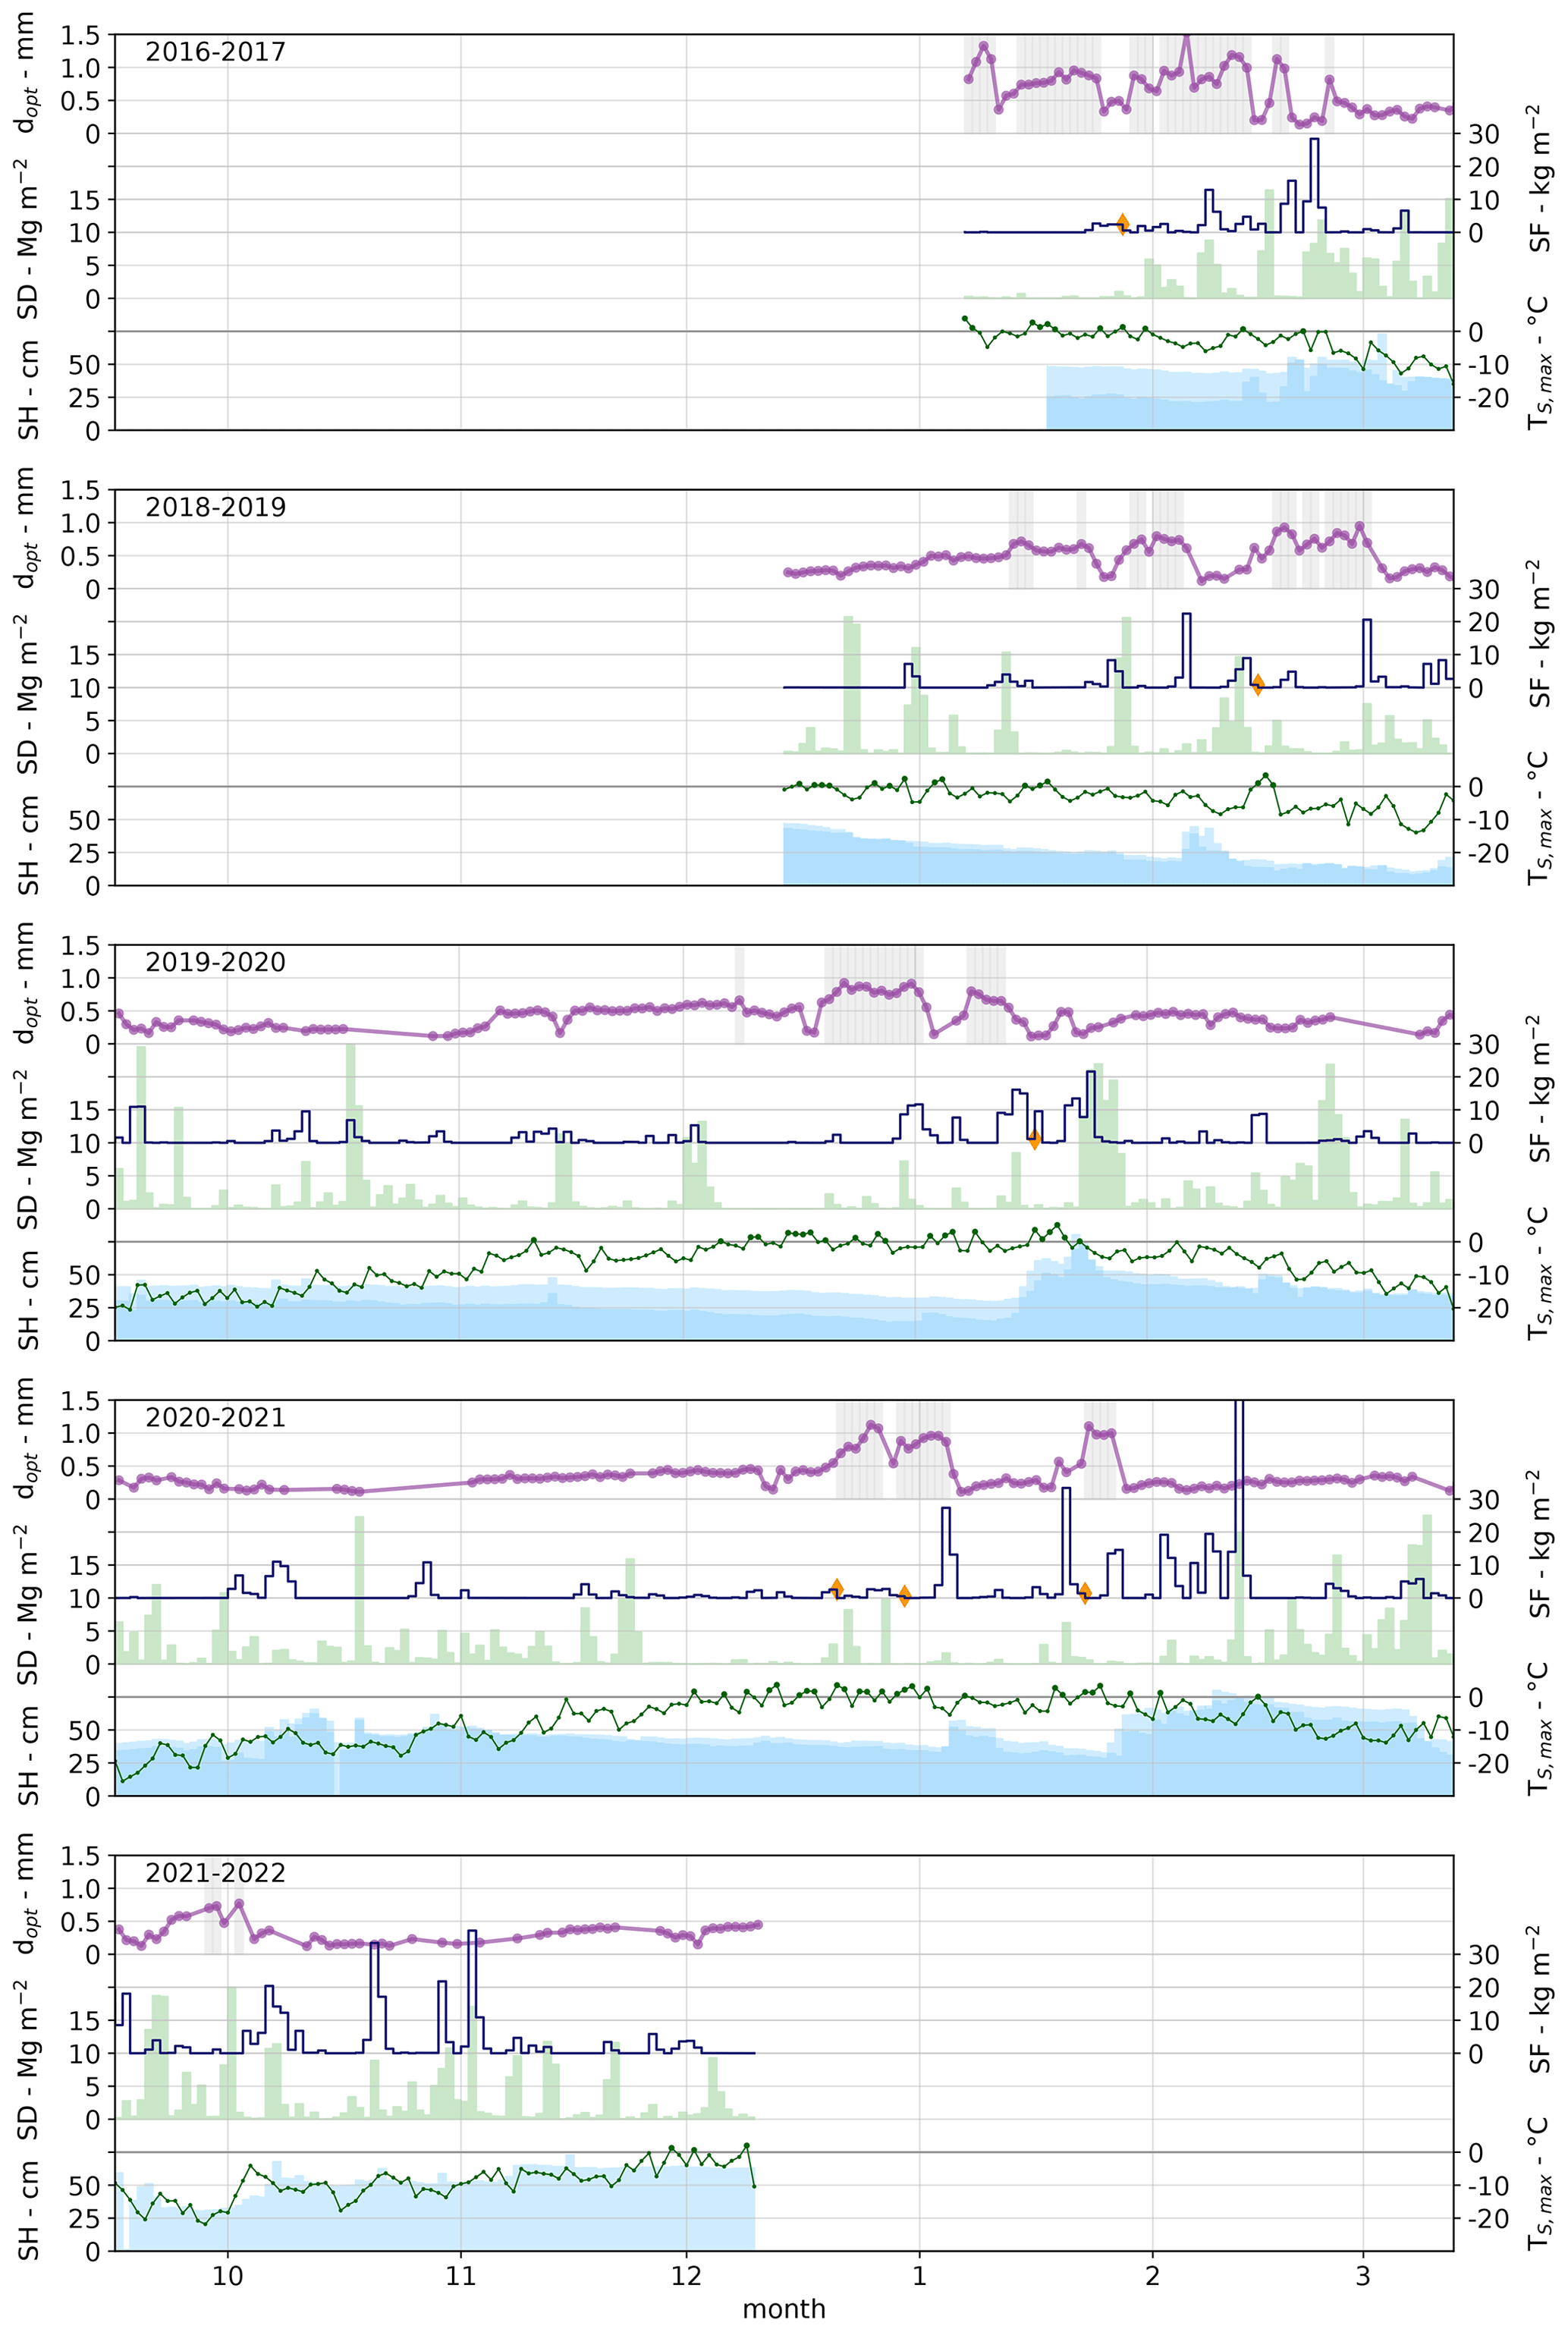
Figure 9Time series of dopt retrieved from Multiband acquisitions at D17 (purple), cumulative daily snowfall (SF, dark blue), cumulative daily snow transport (SD, green), maximum daily surface temperature (Ts,max, dark green), and daily average surface height (SH, light blue) measured by two SR50 sensors during the first four seasons and only one during the latter. Days on which rain occurred are marked by orange diamonds. Values of are outlined by bigger points. The shaded gray area marks dopt>0.64 mm, which is the threshold proposed by Vandecrux et al. (2022) to classify melt conditions.
Snowfall is reported for 34 % of the measurements. The percentage drops to 28 % if only days with SF >1.0 are considered. December and October have, on average, the minimum and maximum number of days of snowfall per month, 19 % and 47 %, respectively. In terms of intensity, the month with minimum snowfall is still December, with a daily average of 0.50 over the years of measurement and a limited inter-annual variability (0.32 in 2021 to 0.64 in 2020). February is the snowiest month, with a daily average of 3.12 but a larger year-to-year variability (0.93 in 2020 to 6.28 in 2021).
Snow drift is almost ever-present (90.6 % of measurement days) according to the FlowCapt™ measurements. The few periods without snow drift last between 1 and 3 d. The median daily amount of snow transported by the wind is 510 , while the maximum exceeds 24 000 . This range of values is similar to those observed by Amory et al. (2015) for the month of January 2011 at D17. Its intensity is strongly variable among seasons and years. The months with the weakest and strongest mean daily snow drift (154 and 5388 ) are January 2017 and September 2021. On average, December and January have the weakest mean daily snow drift (1748 ); October and November are intermediate (1930 ); and September, February and March are the strongest (3068 ). This is compatible with the findings from Amory (2020) that snow drift is weakest in summer and strongest in winter at D17. Still, the inter-annual variability for the same period is sometimes stronger than this inter-seasonal variability. For example, the daily mean for January 2021 is 323 and over 10 times more for January 2020, with 3389 . Amory (2020) found that major drift events (events whose duration exceeds the 75th percentile of all events) contribute over 70 % of the total transported snow mass at D17 on a yearly scale. Although most of these events occur during the winter season, this explains the strong variability in the mean daily snow flow for the same month among years.
The time series of the 2 complete years (2019/2020 and 2020/2021) show that the maximum daily surface temperature Ts,max is, on average, lowest in September (−17.2 ∘C) and highest in December (−0.2 ∘C). A daily maximum surface temperature ∘C is hereinafter used as a qualitative indicator of surface melt. Days satisfying this criterion are 3 % of the total measurements in November, 48 % in December, 27 % in January, 7 % in February and none during the other months.
The surface height is measured by two sensors from 2017 to March 2021 and only one during the season 2021/2022. The variations measured by the two sensors are similar and correlated (r=0.93). The surface height decreases on 59 % of days of measurements with respect to the previous day, with an average decrease of 14.5 mm. During the remaining 41 % of measurement days, the surface height increases by 19.5 mm on average. These time series are characterized by occasional, sharp increases followed by long, slow decreases throughout all seasons.
3.2.1 Grain size variations during snow drift
We investigate the dynamics of dopt for days with snow drift (SD >0) and neither significant snowfall nor surface melt occurring. This is as much as 48.5 % of measurement days. Figure 10a shows the distribution and recurrence of the dopt values measured during days when these conditions are met. The dopt values span between 0.11 and 1.53 mm, with an average of 0.43 mm. Figure 10b shows the distribution of the variations in the snow surface height between one day and the former. Most changes in the snow height are close to 0. Of the observed ΔSH values, 67 % are negative, with a median value of −3.3 mm. Therefore, on average, the snow drift at D17 causes the erosion of the snow surface. The remaining 33 % of positive ΔSH values range between +0.1 and +186 mm. Their 50th and 90th percentiles are +3.0 and +20.0 mm, respectively. Higher ΔSH values are observed occasionally (7 d). Days of accumulation (Δ SH >0) also have, on average, lower daily mean wind speed and lower daily drifting-snow amount than days with surface erosion (Δ SH<0, 7.9 m s−1, 1500 against 8.9 m s−1, 2500 ). Figure 10c shows the distribution of dopt variations between the day of measurement and the preceding day. The majority of the Δdopt values are close to 0, with a mean daily grain growth of 0.01 mm. The Δdopt is positive for 60 % of days and negative for 40 % of days. It ranges between −0.84 and +0.67 mm, although 83 % of measurements span a narrow range between −0.1 and +0.1 mm, which is approximately the measurement uncertainty.
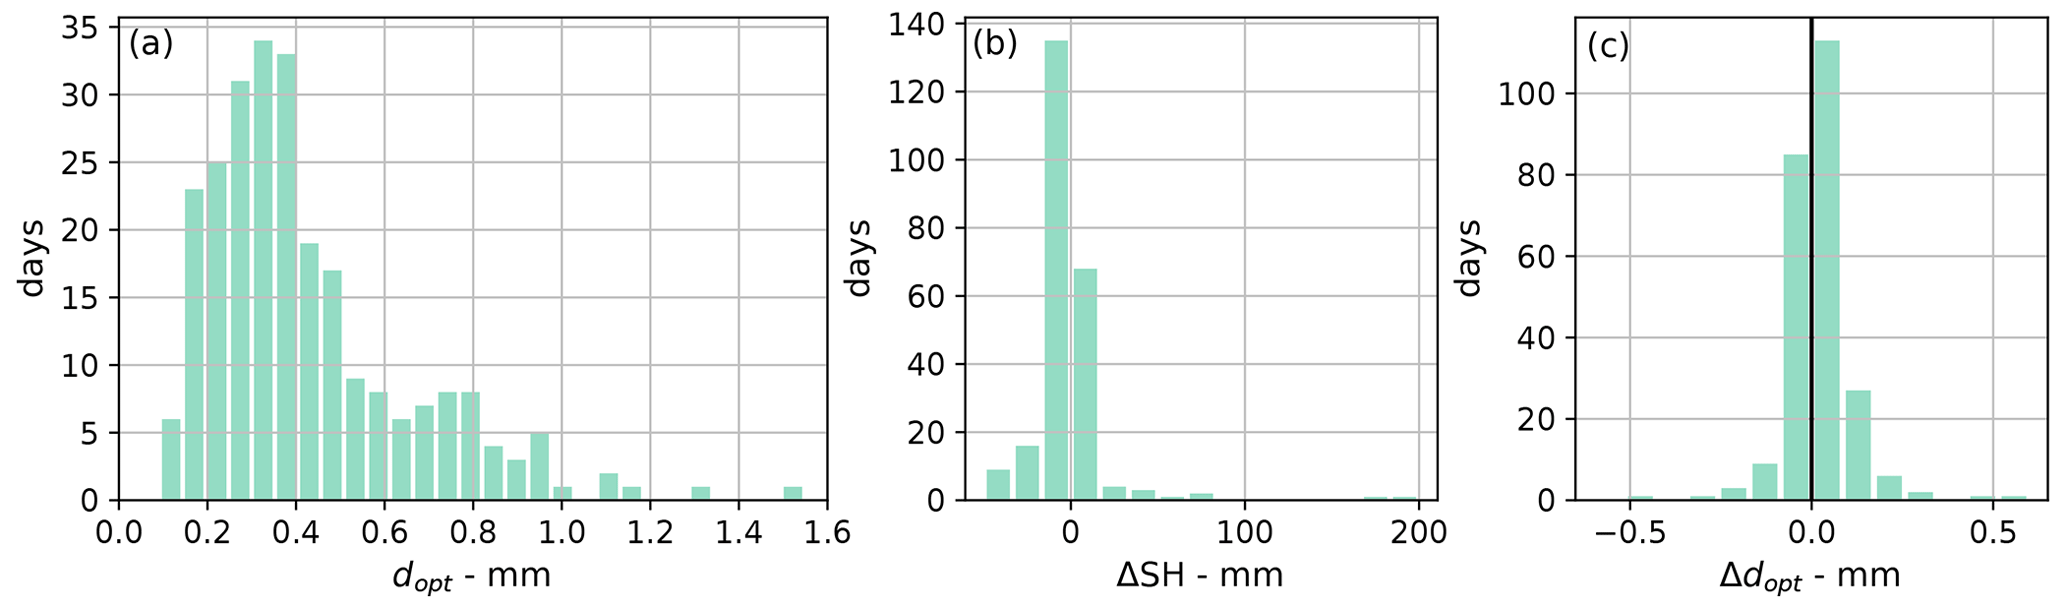
Figure 10Distribution and recurrence of the dopt values measured on days with snow drift but no significant snowfall or surface melt (a). Distribution of the snow height variations (b) and the dopt variations (c) before and after a day with snow drift.
Figure 11 highlights four short periods with active snow drift but limited or absent snowfall and surface melt. Most of the remaining days are isolated and therefore are not suitable to depict the evolution of the snow grain size in the sole presence of snow drift. In Fig. 11a, dopt slowly increases in the presence of wind drift and in the absence of snowfall. Figure 11b shows a similar evolution of dopt, but in the presence of weak snowfall that does not interfere with the grain size evolution. As the grain size during both these periods is surprisingly stable, we compare our observations with the estimate of the dopt growth due to metamorphism alone modeled following Carmagnola et al. (2013) (dotted blue line). For both, the grain growth predicted by the model is slightly faster than the measured one. Figure 11c and d show a decrease in the dopt during a 2–4 d period under the sole action of wind drift. Four similar episodes of decreasing dopt lasting 2–3 d were identified throughout the complete dataset. The snow height during these first three periods decreases at an average rate of −5.39 mm d−1, in line with the mean ΔSH of −5.22 mm d−1 observed for all the days with only snow drift. However, the snow height measured during this short time series occasionally increases, clearly showing the deposition of drifting snow.
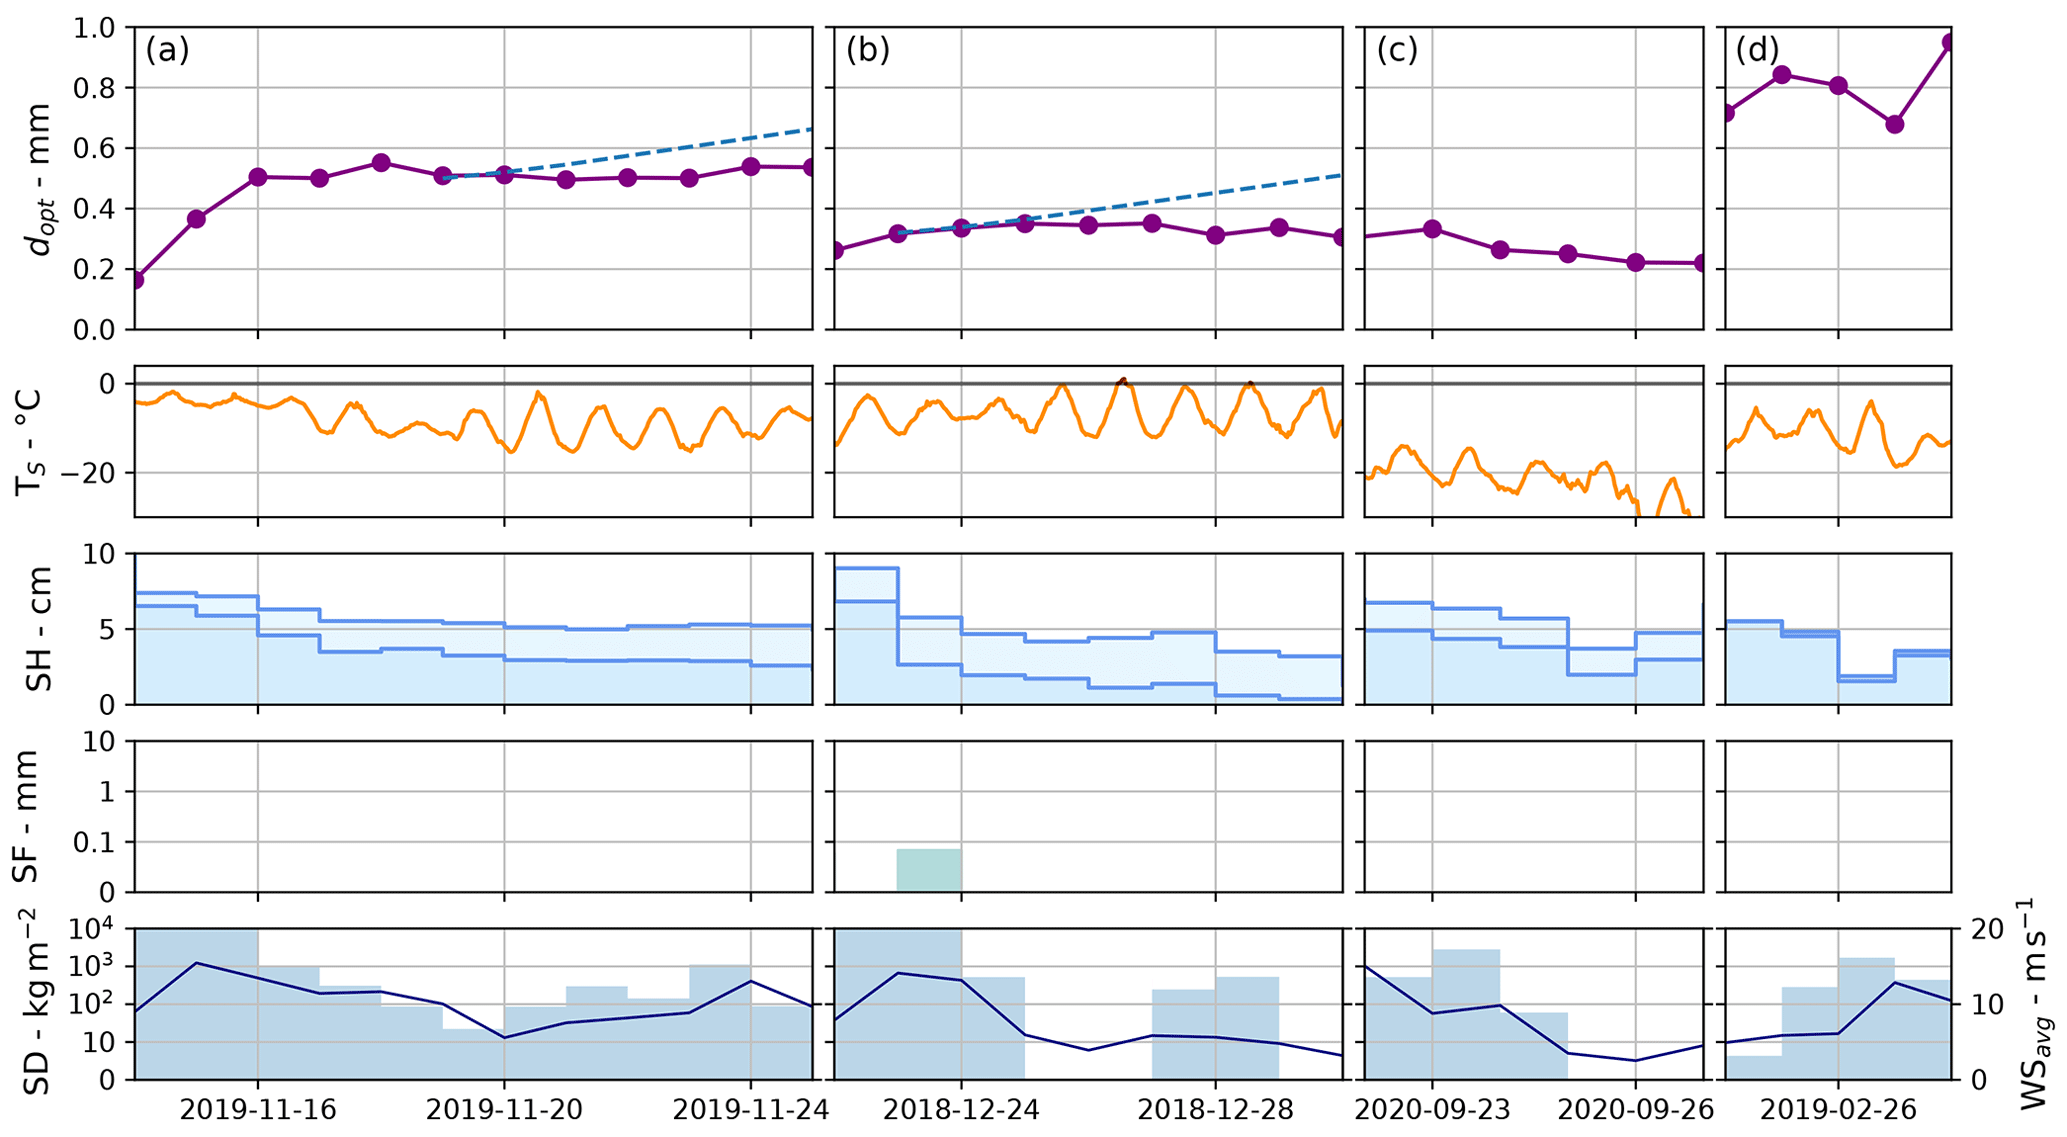
Figure 11Four examples of time series of dopt and meteorological variables observed during periods with snow drift and no or negligible snowfall and surface melt. Shown are the surface temperature (TS), snow height (SH), snowfall (SF), snow drift (SD) and wind speed (WSavg) intensities. Episodes of snow drift and dopt increase in the absence of melt and snowfall (a) and in presence of light snowfall (b). Two episodes of snow drift and dopt decrease in the absence of snowfall and melt (c, d).
3.2.2 Grain size variations during snowfall
The measurements of dopt acquired on days preceded by snowfall (at least 0.5 ) are considered here (34.0 % of all days). Surface melt and snow drift are detected on 9.0 % and 98.3 % of these days, respectively. Snowfall usually brings small grains onto the surface. Domine et al. (2007) measured the SSA of over 60 samples of freshly fallen snow. Within this dataset, the lowest SSA value measured is 33 m2 kg−1, which corresponds to a dopt of 0.2 mm. Thus, this value, hereinafter called dSF, is taken as a high threshold for the detection of snowfall here. The distribution of the measured dopt values is shown in Fig. 12a. Only 22.6 % of measurements satisfy dopt<dSF and only 2.8 % if we consider days with simultaneous melt. Figure 12b shows the distribution of the variations in the grain size Δdopt before and after snowfall. It is divided into measurements with positive changes in the snow height ΔSH (54.8 %, in green) and negative ones (45.2 %, in orange). Both positive Δdopt and negative Δdopt are present. After snowfall, dopt decreases in 53.1 % of cases, with a median decrease in dopt of −0.09 mm. In the remaining 46.9 % of events, the median increase is +0.05 mm. Considering only the most intense snowfalls (>10 kg m−2), on average, the surface height increase and dopt decrease account for 77.8 % and 70.4 % of measurements, respectively. Figure 12c shows the snow height variations as a function of the intensity of the daily average wind speed during snowfall, the mean of all events being 9.9 m s−1. The two variables have a weak, negative correlation ().
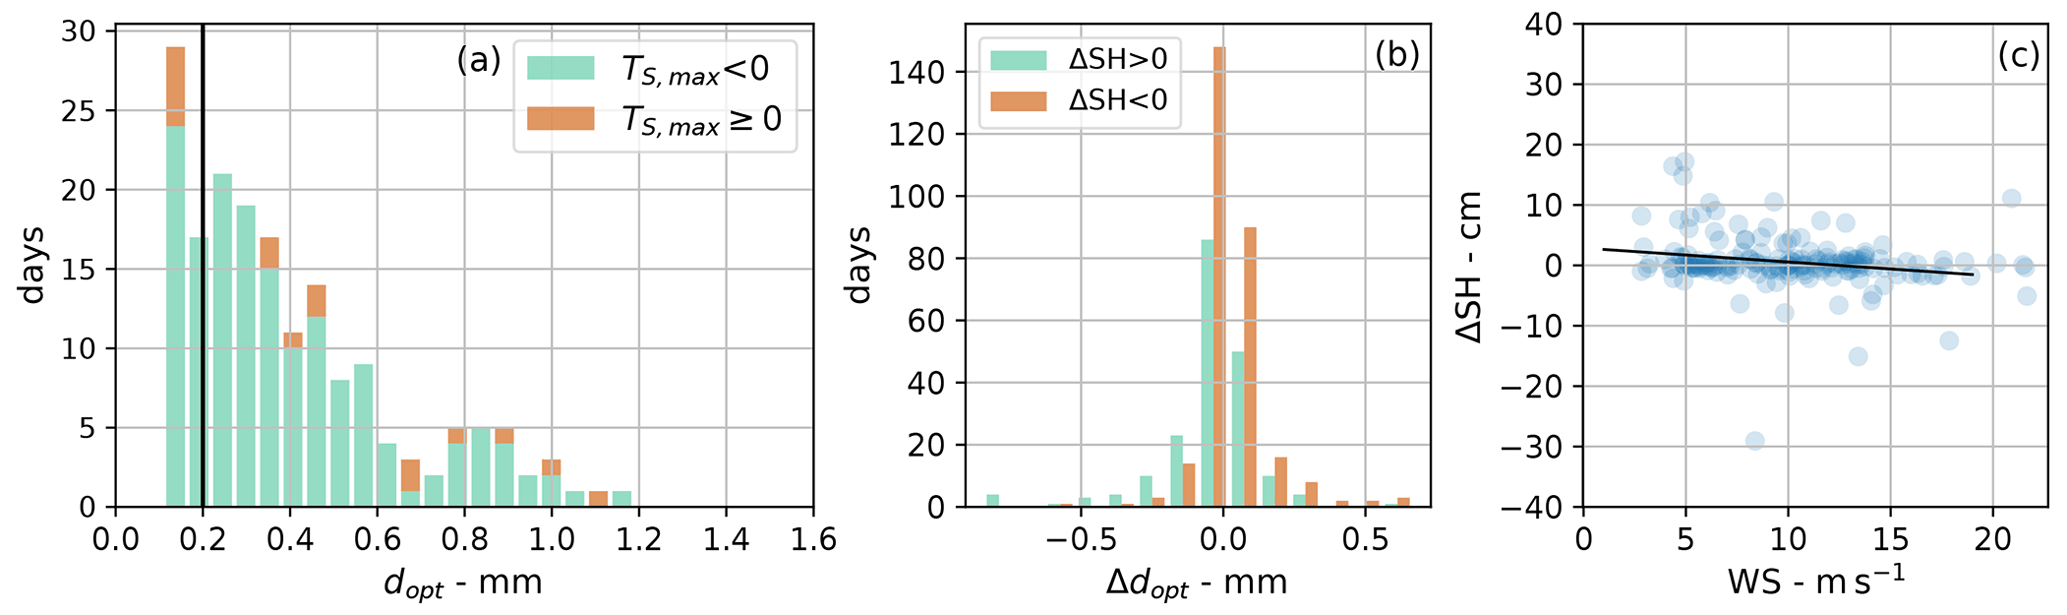
Figure 12Distribution of the dopt values measured on days following snowfall of at least 0.5 (a). Snow height variation (n=177 events of at least 0.5 ) as a function of the snowfall (SF) intensity (b) and as a function of the average daily wind speed (WS) during snowfall (c).
3.2.3 Grain size variations during melt
We analyze the dopt evolution with surface melt, determined as . Melt occurs during 17.7 % of measurement days, but with a large seasonal spread. The observations from Domine et al. (2007) and Gallet et al. (2014) show that wet snow and melt–freeze crusts span a large range of dopt values, from 0.3 to above 1 mm. For this reason at least, it is not possible to define a precise threshold for dopt to assess the presence of liquid water in surface snow. Nevertheless, Vandecrux et al. (2022) found that the value of 0.64 mm well represents the limit grain size between days of no or negligible snowmelt (≤1 ) and days of intense snowmelt (>1 ) over the Greenland ice sheet. This value, hereinafter called dmelt, is employed as a threshold to discuss the dopt evolution in the presence of surface melt according to the presence of snowfall and wind drift.
We compare the occurrence of melt during days with grains larger than dmelt. Overall, mm occurs on 21.0 % of the days, but only 35.8 % of them are concomitant with surface melt. These days are rarely isolated (5.6 %) but rather grouped into 13 short periods of high dopt lasting 3 to 15 d. These periods were classified according to one of three types of dopt evolution and interaction with snowfall and snow drift that are represented in Fig. 13. In Fig. 13a, dopt increases above dmelt during a day with and is stable during the 3 following days characterized by the absence of snowfall and wind drift. Then, dopt starts to decrease 4 d later after a consistent snowfall (5 cm increase in snow height) but still in the absence of snow drift. Figure 13b shows a similar evolution but with some snowfall and snow drift during the event. At the beginning, the dopt increases above dmelt and settles for around 10 d, with only a minor snowfall (21 December 2019) that does not affect dopt. On 30 December 2019, a consistent snowfall that brings over 30 over 4 d begins, concomitantly with strong snow drift. In this context, dopt decreases below dmelt only during the fourth day of snowfall, while precipitation is still intense (>5 ), but the intensity of snow drift is reduced by 2 orders of magnitude with respect to previous days (2 January 2020, <100 ). In Fig. 13c dopt is above dmelt and then decreases due to a snowfall and settles until the middle of the period. In the following days, the condition is never satisfied, meaning that surface melt does not occur. Nevertheless, starting on 27 January 2019, dopt increases again, over dmelt, during a few days of intense snow drift (>104 ), and the snow height decreases. The period ends with a snowfall in the presence of lighter snow drift (5 February 2019, 100 to 1000 ). Finally, during all the periods considered in Fig. 13, as well as the ones in Fig. 11, the threshold wind speed for the detection of snow drift at a height of 1 m is approximately 5 m s−1, independently of the grain size.
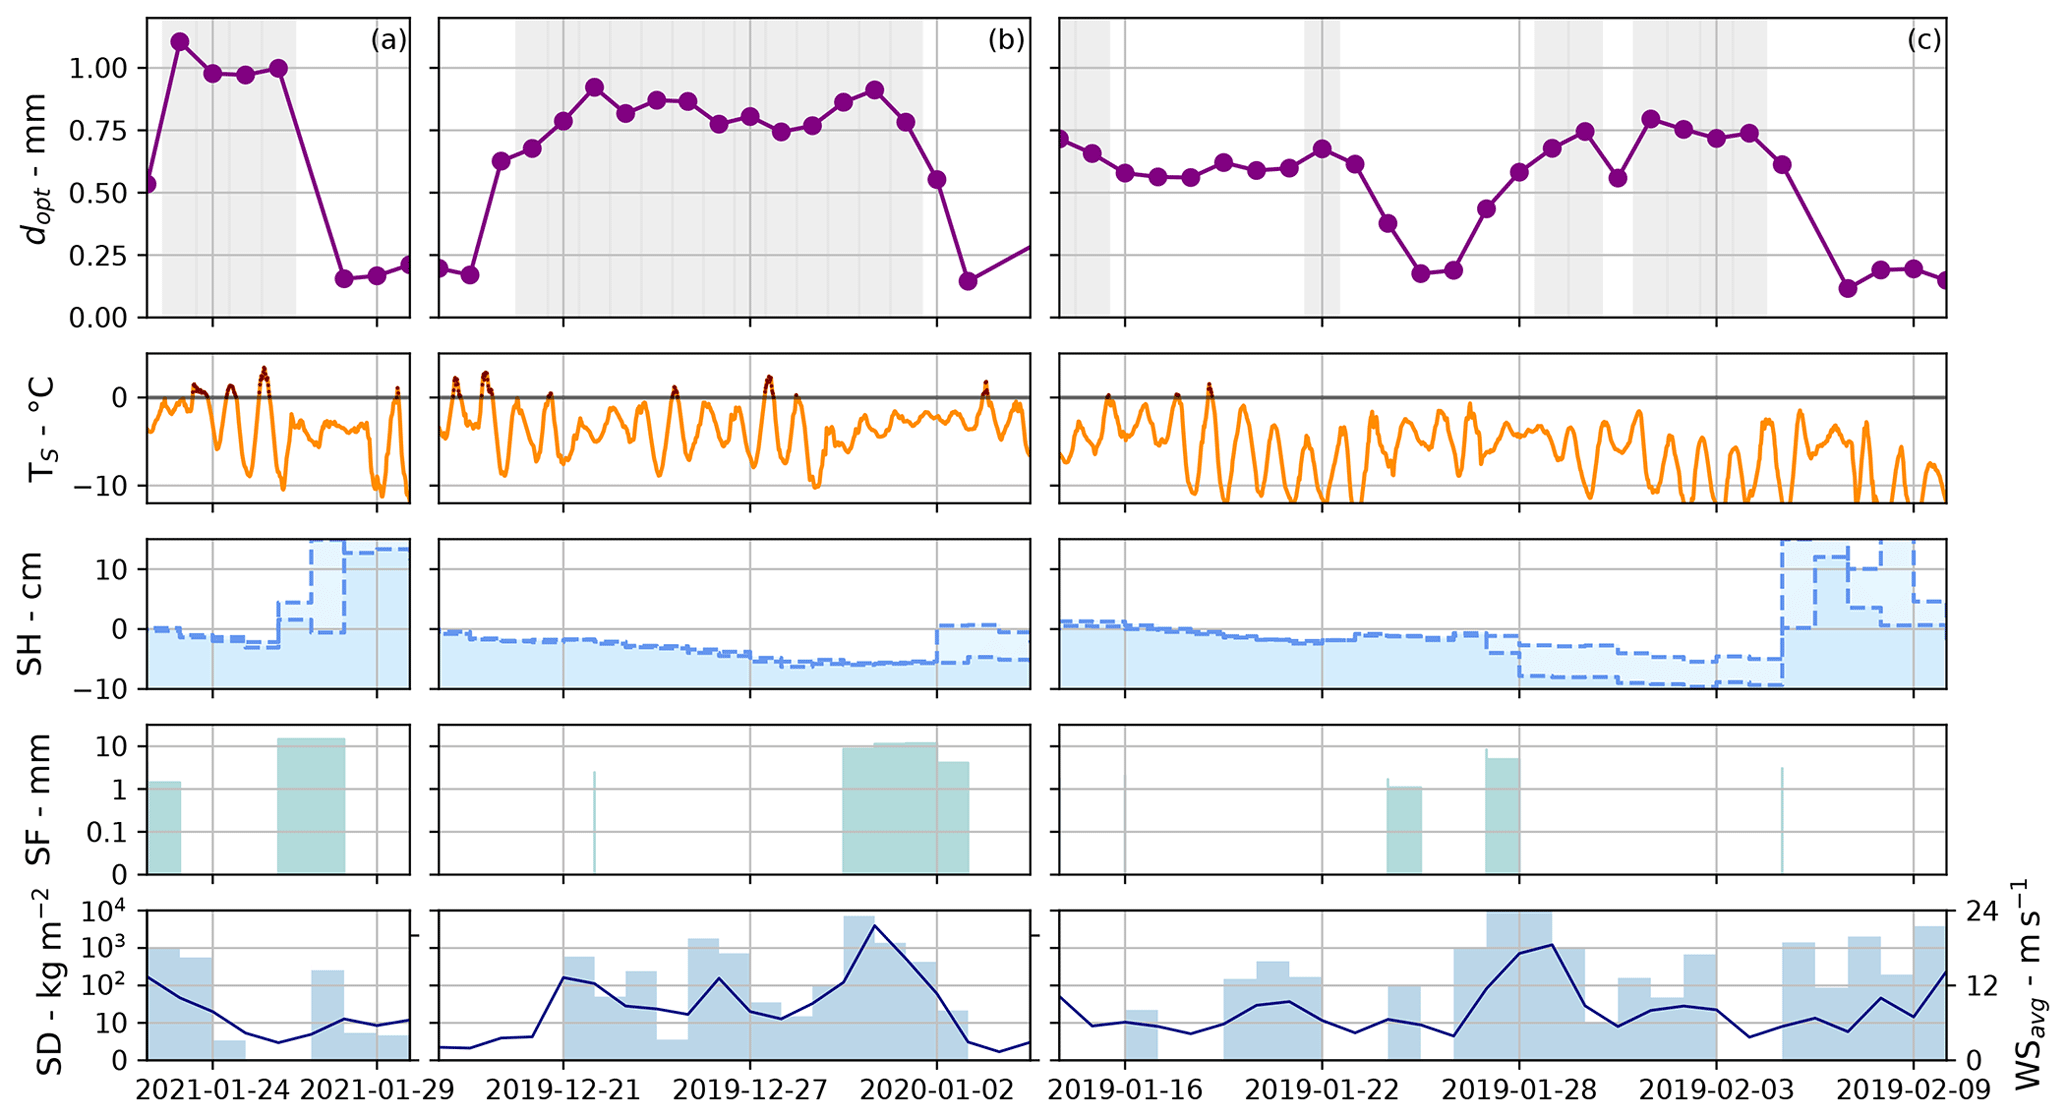
Figure 13Three examples of time series of dopt and meteorological parameters observed during periods with large grains (dopt≥0.64 mm). Shown are the surface temperature (TS), snow height (SH), snowfall (SF), snow drift (SD) and wind speed (WSavg) intensities. An episode of surface melt during a period of limited snowfall and snow drift (a). A melt event that concurred with snowfall and snow drift (b). An episode of erosion of the snow surface to a layer with dopt values of a previous melt event, without surface melt (c).
Figure 14a shows the distribution of the measured dopt during days with surface melt. Only 42.4 % of dopt values measured during these days exceed dmelt; however, the average dopt (0.56 mm) is 0.14 mm higher than the average dopt on days without melt, confirming its role in the grain growth. During melt events, dopt>dmelt is met equally for days with (66.3 %) and without (33.7 %) snow drift (34.4 % and 35.7 %, respectively). Figure 14b and c show the distribution of the surface height variations ΔSH and dopt variations Δdopt between days with actual melt and the preceding day. The distribution of ΔSH ranges between −21 and +164 mm, but despite the large positive upper bound, the median is negative, −2.9 mm. In the same line, 56.6 % of the events resulted in a decrease in the surface height, which is expected due to the compaction of the snowpack associated with melt. The few melt events that concurred with snowfall (16 events, 3 % of total measurements) are characterized by a similar range of ΔSH, but with a higher median (+0.1 mm) than those without snowfall (−3.5 mm). The median Δdopt is an increase of 0.01 mm. Additionally, the distributions of Δdopt for the days with and without concurring snowfall are slightly shifted; Δdopt is higher without snowfall (+0.018 mm) than with snowfall (−0.121 mm) and with snow drift (+0.013 mm) than without (+0.001 mm).
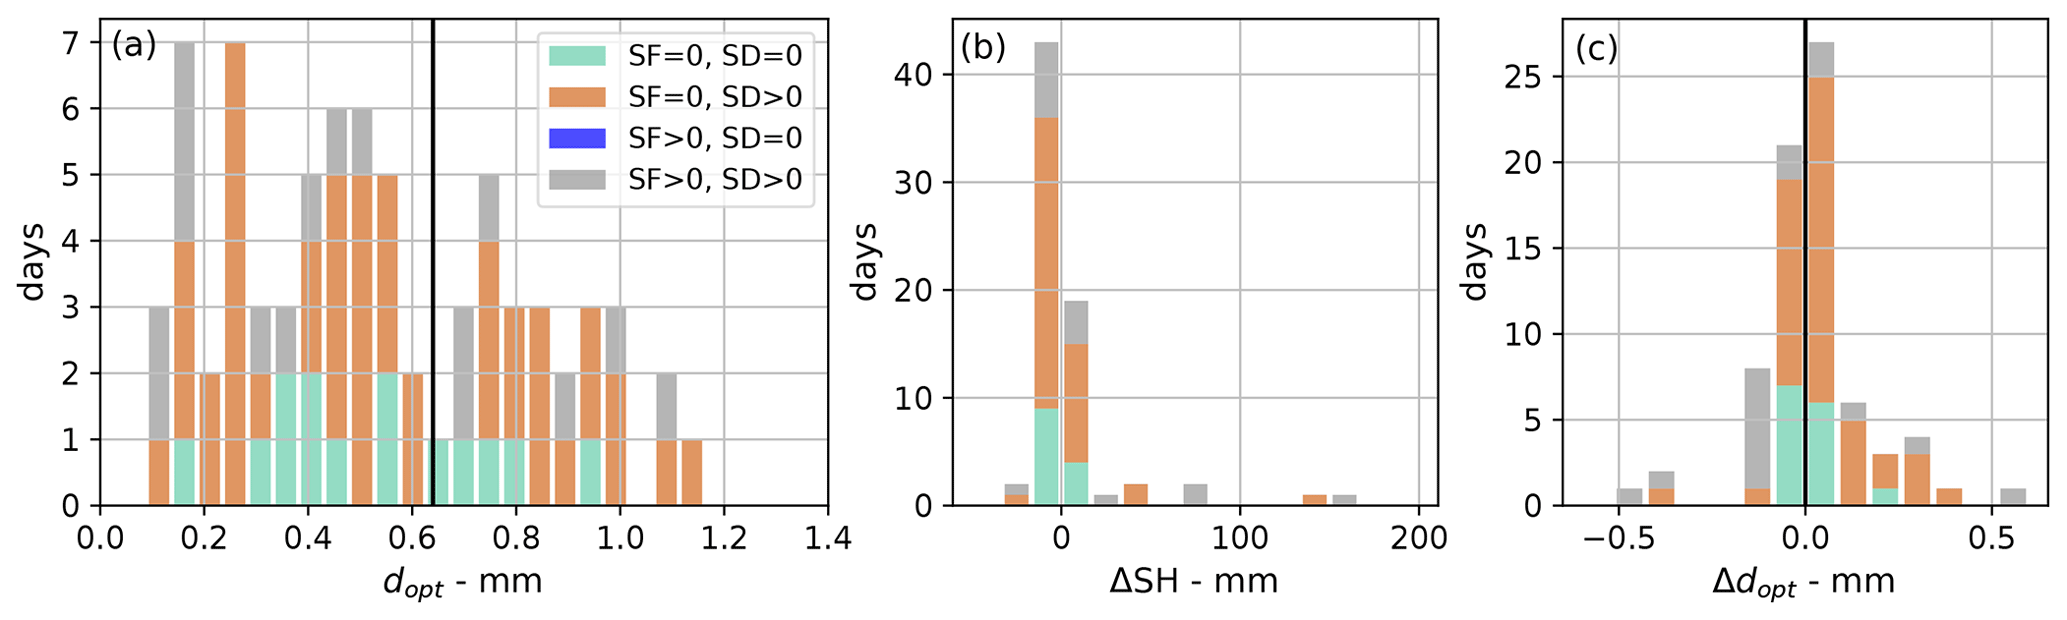
Figure 14Distribution and recurrence of the dopt values measured on days with energy available for surface melt with respect to the occurrence of snowfall and snow drift (a). Distribution of the snow height variation (b) and the dopt variation (c) before and after a day of melt with respect to the occurrence of snowfall or snow drift.
4.1 Multiband
In the conception of the Multiband albedometer, multi-band acquisitions were chosen over spectral ones in order to reduce its energy consumption. As a result, Multiband could be deployed in multiple remote locations of the Antarctic continent, where it has been acquiring reliable measurements in complete autonomy. Although only six bands are exploited for the processing, and only three are used for the grain size retrieval, Multiband observations have compared favorably with satellite-retrieved grain size and in situ measurements of the broadband albedo. Moreover, the coherence between the grain size time series measured at D5 and D17 is remarkable. The two locations, despite an altitude difference of approximately 300 m, have similar grain size values during fall and at the end of the summer season (0.33 mm at D5, 0.31 mm at D17) and clearly diverge only during the melting period in full summer (0.74 mm at D5, 0.52 mm at D17). In spite of the heterogeneity of the two locations as seen from the field, the similarity of the grain size time series provides confidence to the Multiband measurements. Moreover, it justifies the use of simulations and reanalysis at multi-kilometer resolution in this area (Hersbach et al., 2018; Amory et al., 2021).
4.2 Main processes driving the snow grain size
Our observations depict the evolution of the snow surface grain size in the windy coastal locations of D5 and D17 in Adélie Land, East Antarctica, over five summer seasons for a total of nearly 600 d with successful retrieval. Through the comparison with the time series of the meteorological variables and snow height observed at D17, we relate the complex evolution to the multiple competing environmental drivers of the grain size, namely dry metamorphism, snow drift, snowfall and melt. Overall, our results show a seasonal cycle characterized by small grains in spring and autumn and larger grains in summer. These variations directly impact the broadband albedo with typical values between 0.82 and 0.75 (Fig. 7), implying a large variation in the shortwave net radiation absorbed in the snowpack. However, our results also suggest that the evolution of the surface albedo in the presence of snow drift due to strong wind is less predictable than it would be in the absence of these drivers.
Snow drift at D17 has mainly an erosive character, as observed during 67 % of measurement days when snow drift occurred without snowfall or melt. Increases in the surface height are less frequent (33 %) but significant in terms of magnitude, with a median and maximum snow height change of +3 and +186 mm, respectively. However, these large variations in the snow height do not coincide with major changes in the grain size. Indeed, most grain size variations (83 %) range between −0.1 and +0.1 mm. Both episodes of snow accumulation and decrease in the grain size during 58 % of days with snow drift imply the deposition of small, drifting grains on the snow surface, as suggested by Domine et al. (2009) after the observation of similar dynamics in the Canadian Arctic. Still, even when the grain size increases from one day to another, growth happens at a very slow pace (median +0.03 mm). This noteworthy stability of the grain size challenges the expectation of growing snow grains under the action of dry metamorphism during the summer season. We think that this limited growth may also be related to the input of small grains deposited during snow drift, despite the overall erosion of the snow surface in this period. Indeed, Libois et al. (2015) observed similar dynamics of reduced metamorphism after the deposition of thin layers of high-SSA grains by snowfall at Dome C, which they attribute to the inhibition of the positive feedback described in Picard et al. (2012). For the 28 measurements with an increase in grain size over +0.1 mm, the average grain size was large (0.63 mm) even though the average surface temperature during those measurements remained below −10 ∘C. Such large grains without melt are explained by the erosion of the snow surface, which likely occurred until a layer of very cohesive, coarse-grained snow was uncovered, as in Fig. 13c.
The interaction of snowfall and wind drift also has an important impact on the observed snow grain size. Indeed, days with snowfall frequently featured surface erosion (45 %) and an average grain size increase of +0.02 mm, against the average grain size decrease of −0.03 mm of days with accumulation (55 %). The erosion of the snow surface reveals that precipitation is completely swept away by the wind for almost half of the snowfall events at this location, at least for the spots under the surface height sensors. Moreover, the evolution of the snow grain size after episodes of erosion during snowfall follows similar dynamics to those of erosion alone, with a grain size increase of 56 % and a decrease of 44 % (60 % and 40 % in the case of erosive snow drift alone). Jakobs et al. (2021) mention frequent snowfall as a determinant factor to limit the length of low-albedo periods leading to surface melt. In windy areas, however, the frequency of snowfall leading to actual accumulation should be considered, as almost a third of all snowfall events result in surface erosion followed by an increase in the snow grain size. The result of these complex interactions at D17 is that the commonly expected outcome of snowfall – an increase in the surface height and a decrease in the grain size – is only met on 33 % of days with snowfall, and the average grain size change during precipitation is in fact negligible (<0.01 mm). Finally, the weak, negative correlation between the daily snow accumulation and the wind speed () suggests that accumulation is more likely for more intense snowfall and lower wind speeds and lets us mark an average daily wind speed of 12 m s−1 as a rough boundary between accumulation and erosion at D17.
The evolution of the grain size in the presence of surface melt is also complex. The expected output for surface melt, which is an increase in the grain size and a moderate decrease in the surface height (due to the compaction of the snowpack), is only met on 27 % of days with melt. Indeed, 37 % of melt days saw an increment of the snow height and an average grain size decrease. However, even on days with surface erosion (63 %), the sharp increases in the grain size that would be expected because of surface melt are occasional, while the average increase is +0.05 mm only. We believe this to be due to the input small grains at the surface that contrast or limit the melt-driven grain growth. As a consequence of these interactions, the dopt is, on average, rather stable on days with surface melt, with a mean grain growth of 0.02 mm d−1 only.
The dynamics observed at D17 may compare to locations with similar characteristics in terms of snow type, temperatures, humidity and wind regimes only. However, they show a remarkable range of possible evolution paths of the snow optical properties involving snow metamorphism, snowfall and snowmelt in the presence of snow drift, some of which are regularly observed in the literature. Libois et al. (2015) and Carlsen et al. (2017), for example, described the evolution of the snow SSA over one summer season at two locations over the East Antarctic Plateau. In this flat area, strong winds are less common than on the coast, and SSA usually increases during snowfall and slowly decreases afterwards. However, they both observed punctual episodes of sharp SSA decreases after snowfall due to the removal of the fresh snow layer by snow drift. Also, Vandecrux et al. (2022) and Jakobs et al. (2021) observed punctual decreases in the grain size (or equivalent increases of albedo) during dry, warm summer periods at EastGRIP (central Greenland) and over the King Baudouin ice shelf (Dronning Maud Land, East Antarctica), respectively, likely due to the deposition of smaller snow grains after drift events. Inversely, our main conclusion is that the prevailing dynamics caused by snow drift at D17 are to prevent sharp changes in the snow grain size. Indeed, snow drift (1) delivers small grains onto the surface, which contrasts the action of metamorphism, either dry or wet, and (2) prevents the deposition of snowfall. The major drivers of the grain size increase – metamorphism – and decrease – precipitation – are thus inhibited, granting a relative stability of the grain size with respect to the ensemble of snowfall and surface melt events. Nonetheless, rare, sharp increases in the dopt caused by the wind were observed. They are mainly due to the erosion of the surface snow until a refrozen melt layer. It is possible that the deposition of small grains over these layers is prevented by the strong cohesion of the surface, as suggested by Comola et al. (2019).
4.3 Limitations
Some limitations of this study should be mentioned:
-
On the basis of the analysis carried out in Sect. 2.5 and 2.6, we established an upper-bound RMSE =0.16 mm for the dopt retrieved from Multiband measurements. Although this value is higher than most variations in the grain size measured from one day to another, statistical considerations remain valid. Moreover, most measurements are likely to have a lower RMSE as the satellite-retrieved dopt and in situ measurements have independent error sources.
-
During the slope correction, the evolution of the observed albedo during the day is considered due to the surface slope only. This hypothesis is sometimes incongruous in summer due to frequent high surface temperatures and occasional surface melt, which cause a rapid evolution of the surface properties of snow. Still, we consider that the effect of this assumption of the grain size time series is not crucial. Indeed, 53 % of the days of measurement were classified as overcast, which means that the effect of the slope is negligible during these days, and the slope correction in these cases returns an average of the measured albedo, thus a daily mean albedo. For the days classified as sunny, the average daily surface temperature is −10.2 ∘C, which implies a generally slow rate of metamorphism. Moreover, during clear-sky days with higher surface temperatures, eventual major variations in the surface albedo during the day would be perceived as a strong slope by the model or have a high RMSE and would therefore be rejected.
-
This study combines data with different spatial representativeness, either with a small, non-overlapping footprint (albedometer, surface height sensors, CNR4) or a large-scale footprint (OLCI, ERA5 reanalysis) relative to the local heterogeneity of the area. This necessarily leads to an increase in the observed “unexpected” situations.
-
The FlowCapt™ instrument cannot distinguish the flow of drifting snow advected from the surface and precipitating particles. Indeed, snow drift is detected during 87 % of days without snowfall and almost always during days with snowfall (98 %). However, the mean daily wind speed during days with snowfall is 9.9 ± 4.2 m s−1, which is enough to advect eventually settled freshly fallen snow (JDoorschot et al., 2004; Clifton et al., 2006).
-
The cross-calibration was performed with the collectors facing upward, meaning that the light source had a direct component during the experiment. Because this may interplay with the cosine correction, we average the calibration coefficients for a wide range of solar zenith angles (79∘ to 45∘ for D17, 67∘ to 44∘ for D5). Their relative standard deviation is well below 1 % for the wavelengths used for the retrieval of SSA and dopt for both stations, which is a low residual error. However, future calibrations should be performed under diffuse radiation, either during cloudy periods or with collectors looking downward.
-
The direct–diffuse light ratio used for cosine and slope correction corresponds to either clear- or overcast-sky conditions. Both these ratios are inaccurate for days with scattered clouds and strongly variable direct–diffuse light ratio, which are discarded after slope correction. In order to reduce uncertainties and the number of discarded measurements, a valuable future addition to Multiband is the direct measurement of the direct–diffuse light ratio.
The spectral albedo of surface snow at D5 and D17, two windy locations in Adélie Land, East Antarctica, was measured over a small area (a few square meters) during several years. To acquire this unique dataset, a specifically designed autonomous spectral radiometer (named Multiband) was developed and was presented here. Instrumental and environmental artifacts were corrected to retrieve time series of accurate effective optical diameter of snow for five summer seasons. The analysis of the uncertainties, the comparison with satellite-retrieved snow grain size and with in situ broadband albedo measurements, and the coherency between the grain size observed at D5 and D17 allow us to conclude that Multiband is a reliable instrument for the retrieval of the daily grain size and the snow albedo. The time series from D17 were then compared to snowfall, snowmelt, snow drift and other meteorological variables. The results show that the interaction of these processes causes a complex evolution of the snow grain size and thus of the surface albedo. Overall, our results show that the net effect of wind and snow drift is a relative stability of the grain size of the snow at D17. Indeed, snow drift often deposits small grains onto the surface, contrasting metamorphism, but it also prevents the renewal of the surface snow as it swipes away precipitation. Exceptionally, however, the wind causes sharp increases in the grain size due to the uncovering of cohesive, old snow layers over which the deposition of drifting snow is ineffective. The wind-driven evolution of the grain size of the superficial snow layer at D17 is therefore significantly different from what it would be in the presence of dry metamorphism, snowmelt and snowfall alone. Accurate modeling of this evolution is thus necessary in order to better constrain the present and future changes in the surface albedo and the strength of the albedo-related feedbacks in coastal Antarctica.
Spectral albedo, specific surface area and grain size time series and codes to generate the figures are available from https://doi.org/10.18709/perscido.2023.04.ds390 (Arioli, 2023).
SA, GP and LA designed the study. LA and GP designed, assembled and installed the Multiband instrument. GP, LA and VF collected data in the field. SA implemented the processing of the observations, performed the analysis and wrote the manuscript. GP, LA and VF discussed and revised the manuscript.
The contact author has declared that none of the authors has any competing interests.
Publisher’s note: Copernicus Publications remains neutral with regard to jurisdictional claims in published maps and institutional affiliations.
The authors acknowledge Eric Lefebvre for the development of the electronics for the Multiband instrument, Charles Amory for his contribution in the exploitation of the FlowCapt™ measurements, and Baptiste Vandecrux for his contribution in the comparison of in situ measurements with SICE and for his valuable feedback on the manuscript.
This research has been supported by the Agence Nationale de la Recherche (grant nos. 14-CE01-0001 – ASUMA and 1-JS56-005-01 – MONISNOW), the Centre National d'Etudes Spatiales (grant no. TRISHNA), the Institut Polaire Français Paul Emile Victor (grant no. 1100 – NIVO) and the European Space Agency (4D Antarctica), and the GLACIOCLIM project SAMBA.
This paper was edited by Alexandre Langlois and reviewed by two anonymous referees.
Amory, C.: Drifting-snow statistics from multiple-year autonomous measurements in Adélie Land, East Antarctica, The Cryosphere, 14, 1713–1725, https://doi.org/10.5194/tc-14-1713-2020, 2020. a, b, c
Amory, C. and Kittel, C.: Brief communication: Rare ambient saturation during drifting snow occurrences at a coastal location of East Antarctica, The Cryosphere, 13, 3405–3412, https://doi.org/10.5194/tc-13-3405-2019, 2019. a
Amory, C., Trouvilliez, A., Gallée, H., Favier, V., Naaim-Bouvet, F., Genthon, C., Agosta, C., Piard, L., and Bellot, H.: Comparison between observed and simulated aeolian snow mass fluxes in Adélie Land, East Antarctica, The Cryosphere, 9, 1373–1383, https://doi.org/10.5194/tc-9-1373-2015, 2015. a
Amory, C., Kittel, C., Le Toumelin, L., Agosta, C., Delhasse, A., Favier, V., and Fettweis, X.: Performance of MAR (v3.11) in simulating the drifting-snow climate and surface mass balance of Adélie Land, East Antarctica, Geosci. Model Dev., 14, 3487–3510, https://doi.org/10.5194/gmd-14-3487-2021, 2021. a
Arioli, S.: Snow spectral albedo, specific surface area and optical grain diameter timeseries from 5-year summer observations at two windy coastal locations of Antarctica, PerSCiDO [data set], https://doi.org/10.18709/perscido.2023.04.ds390, 2023. a
Bai, J., Zong, X., Lanconelli, C., Lupi, A., Driemel, A., Vitale, V., Li, K., and Song, T.: Long-Term Variations of Global Solar Radiation and Its Potential Effects at Dome C (Antarctica), Int. J. Env. Res. Pub. He., 19, 3084, https://doi.org/10.3390/ijerph19053084, 2022. a
Barral, H., Genthon, C., Trouvilliez, A., Brun, C., and Amory, C.: Blowing snow in coastal Adélie Land, Antarctica: three atmospheric-moisture issues, The Cryosphere, 8, 1905–1919, https://doi.org/10.5194/tc-8-1905-2014, 2014. a
Bintanja, R.: On the glaciological, meteorological, and climatological significance of Antarctic blue ice areas, Rev. Geophys., 37, 337–359, https://doi.org/10.1029/1999RG900007, 1999. a
Bogren, W. S., Burkhart, J. F., and Kylling, A.: Tilt error in cryospheric surface radiation measurements at high latitudes: a model study, The Cryosphere, 10, 613–622, https://doi.org/10.5194/tc-10-613-2016, 2016. a
Brun, E., David, P., Sudul, M., and Brunot, G.: A numerical model to simulate snow-cover stratigraphy for operational avalanche forecasting, J. Glaciol., 38, 13–22, https://doi.org/10.3189/S0022143000009552, 1992. a
Carlsen, T., Birnbaum, G., Ehrlich, A., Freitag, J., Heygster, G., Istomina, L., Kipfstuhl, S., Orsi, A., Schäfer, M., and Wendisch, M.: Comparison of different methods to retrieve optical-equivalent snow grain size in central Antarctica, The Cryosphere, 11, 2727–2741, https://doi.org/10.5194/tc-11-2727-2017, 2017. a
Carmagnola, C. M., Domine, F., Dumont, M., Wright, P., Strellis, B., Bergin, M., Dibb, J., Picard, G., Libois, Q., Arnaud, L., and Morin, S.: Snow spectral albedo at Summit, Greenland: measurements and numerical simulations based on physical and chemical properties of the snowpack, The Cryosphere, 7, 1139–1160, https://doi.org/10.5194/tc-7-1139-2013, 2013. a
Chritin, V., Bolognesi, R., and Gubler, H.: FlowCapt: a new acoustic sensor to measure snowdrift and wind velocity for avalanche forecasting, Cold Reg. Sci. Technol., 30, 125–133, https://doi.org/10.1016/S0165-232X(99)00012-9, 1999. a, b
Clifton, A., Rüedi, J.-D., and Lehning, M.: Snow saltation threshold measurements in a drifting-snow wind tunnel, J. Glaciol., 52, 585–596, https://doi.org/10.3189/172756506781828430, 2006. a
Colbeck, S. C.: Theory of metamorphism of wet snow: USACE Cold Regions Research & Engineering Laboratory, Tech. Rep., Research Report RR 313, http://hdl.handle.net/11681/5894 (last access: 1 October 2022), 1973. a
Colbeck, S. C.: An overview of seasonal snow metamorphism, Rev. Geophys., 20, 45–61, https://doi.org/10.1029/RG020i001p00045, 1982. a
Comola, F., Gaume, J., Kok, J., and Lehning, M.: Cohesion-induced enhancement of aeolian saltation, Geophys. Res. Lett., 46, 5566–5574, https://doi.org/10.1029/2019GL082195, 2019. a
Déry, S. J. and Yau, M. K.: A Bulk Blowing Snow Model, Bound.-Lay. Meteorol., 93, 237–251, https://doi.org/10.1023/A:1002065615856, 1999. a
Domine, F., Taillandier, A.-S., and Simpson, W. R.: A parameterization of the specific surface area of seasonal snow for field use and for models of snowpack evolution, J. Geophys. Res.-Earth, 112, F02031, https://doi.org/10.1029/2006JF000512, 2007. a, b, c
Domine, F., Taillandier, A.-S., Cabanes, A., Douglas, T. A., and Sturm, M.: Three examples where the specific surface area of snow increased over time, The Cryosphere, 3, 31–39, https://doi.org/10.5194/tc-3-31-2009, 2009. a, b
Gallet, J.-C., Domine, F., and Dumont, M.: Measuring the specific surface area of wet snow using 1310 nm reflectance, The Cryosphere, 8, 1139–1148, https://doi.org/10.5194/tc-8-1139-2014, 2014. a
Grenfell, T. C., Warren, S. G., and Mullen, P. C.: Reflection of solar radiation by the Antarctic snow surface at ultraviolet, visible, and near-infrared wavelengths, J. Geophys. Res., 99, 18669, https://doi.org/10.1029/94jd01484, 1994. a
Hersbach, H., Bell, B., Berrisford, P., Biavati, G., Horányi, A., Muñoz Sabater, J., Nicolas, J., Peubey, C., Radu, R., Rozum, I., Schepers, D., Simmons, A., Soci, C., Dee, D., and Thépaut, J.-N.: ERA5 hourly data on single levels from 1979 to present, Copernicus Climate Change Service (C3S) Climate Data Store (CDS) [data set], https://doi.org/10.24381/cds.adbb2d47, 2018. a, b
Jakobs, C. L., Reijmer, C. H., van den Broeke, M. R., van de Berg, W. J., and van Wessem, J. M.: Spatial Variability of the Snowmelt-Albedo Feedback in Antarctica, J. Geophys. Res.-Earth, 126, e2020JF005696, https://doi.org/10.1029/2020jf005696, 2021. a, b, c
JDoorschot, J. J., Lehning, M., and Vrouwe, A.: Field measurements of snow-drift threshold and mass fluxes, and related model simulations, Bound.-Lay. Meteorol., 113, 347–368, https://doi.org/10.1007/s10546-004-8659-z, 2004. a
Kind, R.: Snowdrifting: a review of modelling methods, Cold Reg. Sci. Technol., 12, 217–228, https://doi.org/10.1016/0165-232X(86)90036-4, 1986. a
Kokhanovsky, A., Lamare, M., Danne, O., Brockmann, C., Dumont, M., Picard, G., Arnaud, L., Favier, V., Jourdain, B., Le Meur, E., Di Mauro, B., Aoki, T., Niwano, M., Rozanov, V., Korkin, S., Kipfstuhl, S., Freitag, J., Hoerhold, M., Zuhr, A., Vladimirova, D., Faber, A.-K., Steen-Larsen, H. C., Wahl, S., Andersen, J. K., Vandecrux, B., van As, D., Mankoff, K. D., Kern, M., Zege, E., and Box, J. E.: Retrieval of snow properties from the Sentinel-3 Ocean and Land Colour Instrument, Remote Sensing, 11, 2280, https://doi.org/10.3390/rs11192280, 2019. a
Kokhanovsky, A. A. and Zege, E. P.: Scattering optics of snow, Appl. Optics, 43, 1589–1602, https://doi.org/10.1364/ao.43.001589, 2004. a, b
Lenaerts, J. and Van den Broeke, M.: Modeling drifting snow in Antarctica with a regional climate model: 2. Results, J. Geophys. Res.-Atmos., 117, D05109, https://doi.org/10.1029/2011JD016145, 2012. a
Lenaerts, J. T. M., Lhermitte, S., Drews, R., Ligtenberg, S. R. M., Berger, S., Helm, V., Smeets, C. J. P. P., van den Broeke, M. R., van de Berg, W. J., van Meijgaard, E., Eijkelboom, M., Eisen, O., and Pattyn, F.: Meltwater produced by wind–albedo interaction stored in an East Antarctic ice shelf, Nat. Clim. Change, 7, 58–62, https://doi.org/10.1038/nclimate3180, 2016. a, b
Libois, Q., Picard, G., Arnaud, L., Morin, S., and Brun, E.: Modeling the impact of snow drift on the decameter-scale variability of snow properties on the Antarctic Plateau, J. Geophys. Res.-Atmos., 119, 11662–11681, https://doi.org/10.1002/2014jd022361, 2014. a
Libois, Q., Picard, G., Arnaud, L., Dumont, M., Lafaysse, M., Morin, S., and Lefebvre, E.: Summertime evolution of snow specific surface area close to the surface on the Antarctic Plateau, The Cryosphere, 9, 2383–2398, https://doi.org/10.5194/tc-9-2383-2015, 2015. a, b
Marsh, P.: Grain growth in a wet arctic snow cover, Cold Reg. Sci. Technol., 14, 23–31, https://doi.org/10.1016/0165-232X(87)90041-3, 1987. a
Marty, C. and Philipona, R.: The clear-sky index to separate clear-sky from cloudy-sky situations in climate research, Geophys. Res. Lett., 27, 2649–2652, https://doi.org/10.1029/2000gl011743, 2000. a, b
Nieke, J., Borde, F., Mavrocordatos, C., Berruti, B., Delclaud, Y., Riti, J. B., and Garnier, T.: The Ocean and Land Colour Imager (OLCI) for the Sentinel 3 GMES Mission: status and first test results, Proc. SPIE 8528, Earth Observing Missions and Sensors: Development, Implementation, and Characterization II, 85280C, https://doi.org/10.1117/12.977247, 2012. a
Picard, G., Domine, F., Krinner, G., Arnaud, L., and Lefebvre, E.: Inhibition of the positive snow-albedo feedback by precipitation in interior Antarctica, Nat. Clim. Change, 2, 795–798, https://doi.org/10.1038/nclimate1590, 2012. a, b
Picard, G., Libois, Q., Arnaud, L., Verin, G., and Dumont, M.: Development and calibration of an automatic spectral albedometer to estimate near-surface snow SSA time series, The Cryosphere, 10, 1297–1316, https://doi.org/10.5194/tc-10-1297-2016, 2016. a, b, c, d, e
Picard, G., Dumont, M., Lamare, M., Tuzet, F., Larue, F., Pirazzini, R., and Arnaud, L.: Spectral albedo measurements over snow-covered slopes: theory and slope effect corrections, The Cryosphere, 14, 1497–1517, https://doi.org/10.5194/tc-14-1497-2020, 2020. a, b, c, d
Pomeroy, J. and Gray, D.: Saltation of snow, Water resources research, 26, 1583–1594, https://doi.org/10.1029/WR026i007p01583, 1990. a
Ricchiazzi, P., Yang, S., Gautier, C., and Sowle, D.: SBDART: A Research and Teaching Software Tool for Plane-Parallel Radiative Transfer in the Earth's Atmosphere, B. Am. Meteorol. Soc., 79, 2101–2114, https://doi.org/10.1175/1520-0477(1998)079<2101:sarats>2.0.co;2, 1998. a
Trouvilliez, A., Naaim-Bouvet, F., Genthon, C., Piard, L., Favier, V., Bellot, H., Agosta, C., Palerme, C., Amory, C., and Gallée, H.: A novel experimental study of aeolian snow transport in Adelie Land (Antarctica), Cold Reg. Sci. Technol., 108, 125–138, https://doi.org/10.1016/j.coldregions.2014.09.005, 2014. a
Vandecrux, B., Box, J. E., Wehrlé, A., Kokhanovsky, A. A., Picard, G., Niwano, M., Hörhold, M., Faber, A.-K., and Steen-Larsen, H. C.: The Determination of the Snow Optical Grain Diameter and Snowmelt Area on the Greenland Ice Sheet Using Spaceborne Optical Observations, Remote Sensing, 14, 932, https://doi.org/10.3390/rs14040932, 2022. a, b, c
Van Den Broeke, M., Reijmer, C., and Van De Wal, R.: Surface radiation balance in Antarctica as measured with automatic weather stations, J. Geophys. Res.-Atmos., 109, D09103, https://doi.org/10.1029/2003JD004394, 2004. a
Walden, V. P., Warren, S. G., and Tuttle, E.: Atmospheric ice crystals over the Antarctic Plateau in winter, J. Appl. Meteorol., 42, 1391–1405, https://doi.org/10.1175/1520-0450(2003)042<1391:AICOTA>2.0.CO;2, 2003. a
Warren, S. G. and Brandt, R. E.: Optical constants of ice from the ultraviolet to the microwave: A revised compilation, J. Geophys. Res., 113, D14220, https://doi.org/10.1029/2007jd009744, 2008. a
Warren, S. G., Brandt, R. E., and Grenfell, T. C.: Visible and near-ultraviolet absorption spectrum of ice from transmission of solar radiation into snow, Appl. Optics, 45, 5320–5334, https://doi.org/10.1364/ao.45.005320, 2006. a, b
Weiser, U., Olefs, M., Schöner, W., Weyss, G., and Hynek, B.: Correction of broadband snow albedo measurements affected by unknown slope and sensor tilts, The Cryosphere, 10, 775–790, https://doi.org/10.5194/tc-10-775-2016, 2016. a
Wendler, G., Stearns, C., Weidner, G., Dargaud, G., and Parish, T.: On the extraordinary katabatic winds of Adélie Land, J. Geophys. Res.-Atmos., 102, 4463–4474, https://doi.org/10.1029/96JD03438, 1997. a
Winther, J.-G., Jespersen, M. N., and Liston, G. E.: Blue-ice areas in Antarctica derived from NOAA AVHRR satellite data, J. Glaciol., 47, 325–334, https://doi.org/10.3189/172756501781832386, 2001. a
Zhang, X., Jiao, Z., Zhao, C., Qu, Y., Liu, Q., Zhang, H., Tong, Y., Wang, C., Li, S., Guo, J., Zhu, Z., Yin, S., and Cui, L.: Review of Land Surface Albedo: Variance Characteristics, Climate Effect and Management Strategy, Remote Sensing, 14, 1382, https://doi.org/10.3390/rs14061382, 2022. a