the Creative Commons Attribution 4.0 License.
the Creative Commons Attribution 4.0 License.
 | 26 Apr 2023
Can Saharan dust deposition impact snowpack stability in the French Alps?
Oscar Dick
Léo Viallon-Galinier
François Tuzet
Pascal Hagenmuller
Mathieu Fructus
Benjamin Reuter
Matthieu Lafaysse
Marie Dumont
Saharan dust deposits can turn snow-covered mountains into a spectacular orange landscape. When avalanches release, a formerly buried dust layer can become apparent, possibly marking the failure plane. This appearance may suggest a relation between avalanche release and the previously deposited dust, which found mention among recreationists and avalanche professionals alike. While dust deposition affects the absorption of solar energy altering snowpack temperatures and melt rates, to date, there is no clear scientific evidence that dust deposition can significantly modify snow stability. Here we investigate, using an ensemble snow cover model, the impact of dust deposition on snow properties and mechanical stability by comparing simulations with and without dust deposition for synthetic and observed dust deposition events. The study focuses on two typical avalanche situations: artificial triggering on persistent weak layers and natural release of wet-snow avalanches. We study several situations with and without dust deposition and demonstrate how sensitive the impact of dust deposition is to the deposited dust mass, the slope aspect, the elevation and the meteorological conditions following the dust deposition. The additional energy absorbed by the dust layer speeds up warming and may advance surface wetting to ease the formation of a melt-freeze crust. If the crust is buried, the phenomenon of a strong temperature gradient close to the crust may promote the formation of persistent weak layers inside the snowpack. On the other hand, the melt-freeze crust may also lead to an increase in snowpack stability by redistributing the stress applied to weak layers buried below. Regarding wet-snow instability, we show that dust deposition can advance the onset of wet-snow avalanche activity by up to 1 month in spring, as hypothesized in previous studies. Thus, the impact of Saharan dust deposition on snowpack stability can be either neutral, positive or negative, depending on the topographical, snow and meteorological conditions. Even though not all physical processes are implemented, state-of the art snow cover models are able to mimic the speed-up of crust formation, and snow instability models can point out relevant situations for avalanche forecasting.
- Article
(3658 KB) - Full-text XML
- BibTeX
- EndNote


Snow avalanches are a major natural hazard, threatening infrastructure and human life in mountain areas throughout the world (Schweizer et al., 2021). Despite major breakthroughs in the understanding of the release processes since the end of the 20th century (Schweizer et al., 2016), the impact of mineral dust deposition (hereafter referred to as dust) on snowpack stability is still poorly understood. The presence of a dust layer was often associated with a decrease in snowpack stability without a clear demonstration of the link between both. Dust can indeed be regularly observed at the bed surface of triggered avalanches in regions affected by dust outbreaks. In April 2016, for instance, a French skier died when caught in an avalanche showing a dust layer on the bed surface (Chomette et al., 2016). These accidents and the lack of understanding the role of dust in snow instability are the main motivation for the present study.
In Europe, according to lidar and satellite observations, dust clouds mainly come from the Saharan desert and can be carried up to Norway (Knippertz and Todd, 2012) and Greenland (Francis et al., 2018). The convection forces, due to the strong heating of the Sahara and the Sahel regions, cause an uplifting of huge quantities of dust. A significant part, estimated as 80–120 Gt yr−1, is transported northward across the Mediterranean Sea and then deposited on the European continent, including the Alps (Barkan et al., 2004, 2005). Saharan dust outbreaks are sporadic events generally occurring from April to August in the European Alps (Greilinger and Kasper-Giebl, 2021, and references therein). However major outbreaks can also occur during the winter as the one recently observed in the Western Alps on 6 February 2021 (Réveillet et al., 2021). In the Caucasus mountains, these strong wintertime Saharan dust outbreaks have even been reported to have become more and more frequent, hypothetically due to the polar amplification (Varga, 2020).
Mineral dust is one of the many light-absorbing particles that can be deposited on snow-covered surfaces (Skiles and Painter, 2018). These light-absorbing particles lower the albedo of snow surfaces where they are deposited and increase the amount of absorbed solar energy in the visible wavelengths (Wiscombe and Warren, 1980). Even a minor dust deposition can reduce albedo by a few percent and cause surface melting in daylight hours, despite relatively weak solar radiation (Landry, 2014). The additional energy absorption accelerates the snow metamorphism and leads to a coarsening of the snow microstructure. In response to this coarsening, the snow albedo decreases in the visible and near-infrared domains (300–2500 nm). This causes a positive feedback loop on the absorbed solar energy, further accelerating surface melting (Hansen and Nazarenko, 2003; Painter et al., 2007; Skiles and Painter, 2019, 2018). Moreover, the chemical composition of light-absorbing particles at the snow surface may also impact the snow mechanical properties provided a high dust concentration (Hammonds and Baker, 2016; Meinander et al., 2014). However, these mechanisms are still poorly understood, and we only focus, in the following, on the radiative impact of mineral dust. Various types of light-absorbing particles can be found in the alpine snowpack such as black and organic carbon (Hadley and Kirchstetter, 2012), volcanic ashes (Liu et al., 2014), and snow algae (Remias et al., 2010). In the European Alps, however, Saharan mineral dust has been hypothesized to be a driver of avalanche formation due to the sporadic but intense nature of the depositions (Chomette et al., 2016) such that we focus in the present study on the Saharan mineral dust impact on snowpack stability.
To date, few studies have investigated the impact of dust outbreaks on snowpack stability. The Center for Snow and Avalanche Studies in Silverton, Colorado, has documented and monitored 91 dust events between 2005 and 2014 at the Senator Beck Basin Study Area at Red Mountain Pass in the San Juan Mountains, and at 10 other locations in the Colorado mountains (Landry, 2014). This study presents a complete analysis of the potential links between dust in snow and snow instability, highlighting two situations: an impact on a dry midwinter snowpack and an impact on the onset of wet-snow avalanches in spring. On the one hand, a potential effect of dust deposition on dry-snow slab avalanches strongly depends on the timing of the dust deposition. For instance, if the dust layer is immediately buried by a thick layer of clean snow, its radiative impact will be minimal in the days following the deposition and its impact on avalanche danger as well. Conversely, if the dust layer remains at the surface under clear-sky conditions, the albedo decrease can induce surface melting which would not have happened without dust deposition. In the latter case, if the melted surface contaminated with mineral dust is buried under a thin layer of cold snow, a strong temperature gradient can form between the warm dust layer and the cold snow surface. This situation is similar to documented situations where persistent weak layers adjacent to crusts promote low stability (Jamieson, 2006; Colbeck and Jamieson, 2001; Birkeland et al., 1998). In the Pyrenees, for instance, a persistent weak layer located above a dust layer caused many avalanches in 2014, although in that particular case the dust layer and the instability may well be unrelated (Chomette et al., 2016). Both Landry (2014) and Chomette et al. (2016) reported that this short-term impact is not systematic and strongly depends on the timing of the deposition and on the subsequent weather conditions. On the other hand, a dust layer at the snow surface can increase the solar energy uptake by the snowpack (e.g., Painter et al., 2012) and induce stronger melting rates. As a consequence, wet-snow instabilities may form earlier in the season (Landry, 2014; Toepfer et al., 2006). Moreover, dust layers in the snowpack can re-appear at the surface when the overlaying snow layers melt (Doherty et al., 2013; Zhao et al., 2014). Mineral dust at the surface has an even stronger radiative impact in spring at the end of the snow season and speeds up ablation leading to a shorter snow season (Landry, 2014).
Despite these interesting processes observed in the field, it is not possible to isolate with certitude the impact of dust. It is challenging to demonstrate how snow instability is linked to the dust deposition only using field observations since it would require a “reference” snowpack without dust (Chomette et al., 2016). In order to investigate the significance of the physical processes described above, we use here a numerical modeling framework to assess whether an impact on snowpack stability can be attributed to strong dust deposition events. To this end, we use the recent developments in the ensemble version of the detailed multi-layer snow cover model Crocus-MEPRA (Brun et al., 1989; Vionnet et al., 2012) which allows us to represent the interactions between light-absorbing particles and snow metamorphism (Charrois et al., 2016; Tuzet et al., 2017) and enables us to calculate snow instability indicators (presented in Sect. 2). This modeling setup makes it possible to run the same simulation (topographic and meteorological conditions) with and without dust deposition in different topographic configurations to assess the impact of dust on snowpack stability. The results of the numerical experiments are then presented in Sect. 3 and discussed in Sect. 4. The aim of the numerical experiments is to study the influence of the dust deposition on snow instability rather than to study the associated meteorological conditions.
2.1 Ensemble snowpack modeling framework
The modeling chain SAFRAN-SURFEX/Crocus-MEPRA (Morin et al., 2020) provides the meteorological conditions for a given mountain region. The meteorological data are then used to simulate the snowpack in the mountain regions and to eventually assess the mechanical stability.
First, the meteorological forcing is produced by the SAFRAN meteorological analysis system. SAFRAN computes the weather conditions at hourly intervals across the French mountain ranges by analyzing meteorological surface observations from various networks (Vernay et al., 2022). The effects of local topography on meteorological parameters, e.g., local solar masks, are not accounted for in the simulation. In the presented simulations, two types of light-absorbing particles are considered: dust and black carbon. Black carbon deposition fluxes are forced by the regional climate model ALADIN-Climate which simulates the emission, the atmospheric transport and the surface deposition of black carbon (Nabat et al., 2014; Drugé, 2019). For both light-absorbing particles, the grid point of ALADIN-Climate closest to the location is selected (Réveillet et al., 2022). Dust deposition fluxes are adjusted as explained in Sect. 2.2.
Second, snow cover simulations are performed with the detailed snow cover model Crocus which simulates snow physical properties by computing the mass and energy exchange within the snowpack and between the snowpack, the soil and the atmosphere (Vionnet et al., 2012). Recent developments to represent light-absorbing particles in Crocus (Tuzet et al., 2017) facilitate computing their radiative impact with the TARTES (Two-stream Analytical Radiative Transfer in Snow; Libois et al., 2013) radiative transfer model. Note that the activation of this option is the main difference from the operational setup described in Morin et al. (2020). In this study, the spectral radiative transfer scheme TARTES is used with a 20 nm spectral resolution over the range 300–2500 nm to calculate the solar energy absorbed in each 20 nm band and each snow layer. The calculation accounts for the snow microstructure, as well as the quantity and type of light-absorbing particles, for every snow layer. It also accounts for the solar zenith angle and the spectral distribution of direct and diffuse solar radiation. More details are provided in Tuzet et al. (2017).
Uncertainties in snow cover models are related either to the atmospheric forcing or to the representation of snow physical processes (Krinner et al., 2018; Raleigh et al., 2015; Essery, 2013). In the present study, it is essential to account for the errors in the snow physical processes since the targeted processes are expected to be sensitive to other snow physical processes (Landry, 2014). In order to address this issue, a multi-physics ensemble modeling framework called ESCROC (Ensemble System CROCus) was developed for Crocus (Lafaysse et al., 2017). ESCROC is an ensemble of parameterizations of the snow cover model providing estimates of the uncertainty due to the representation of the main simulated physical processes. It includes uncertainties of the properties of the new snow, snow metamorphism and compaction, liquid water percolation, and energy balance computation. The uncertainty of energy balance computation is represented through different parameterizations of turbulent fluxes at the top of the snowpack, thermal conductivity of snow layers and soil–snow exchanges. Each set of parameterizations is called a member. The ensemble members thus represent the uncertainty of the snow cover model but do not account for errors in the meteorological input.
Finally, MEPRA, a simulation support tool for avalanche forecasting that is in operational use in France, is used to assess the mechanical stability of simulated snow profiles (Giraud, 1992).
2.2 Simulation setup
2.2.1 Synthetic dust event
Two ensemble snowpack simulations of ESCROC are performed with an output time step of 3 h. The set of parameterizations of both ensembles are identical, except for the forcing of mineral dust deposition. The first ensemble, called the no-dust simulation or no-dust ensemble, is run without dust deposition for the entire season. The second ensemble simulates a synthetic single dry dust deposition event on 5 March 2018. We chose this date as we expected the meteorological conditions to allow for a potential impact of the dust deposition on the snowpack properties. It also has the advantage that all the potential impacts of dust deposition on snowpack stability listed in previous studies (Landry, 2014) can be studied in a single case. Dust deposition was simulated with a constant deposition flux leaving 8.6 g m−2 of dust at the surface. The value was chosen for the synthetic event as it is representative of a strong but realistic Saharan dust outbreak in the region of interest (Réveillet et al., 2021). For both ensembles, the black carbon deposition fluxes were obtained from the ALADIN-Climate model. For the dust ensemble simulation, TARTES computes the spectral albedo considering both black carbon and dust, while in the no-dust ensemble the evolution of the albedo is calculated considering black carbon the only light-absorbing particle present in the snowpack. Black carbon is included in both ensembles as the radiative impact of dust is not the same for a clean snowpack or for a snowpack that already contains other light-absorbing particles such as black carbon. The comparison between the dust ensemble and the no-dust ensemble thus provides a numerical estimation of the impact of the dust deposition event on the evolution of snow properties, as well as the associated modeling uncertainties. The ESCROC ensemble used here, called “E2_Tartes”, has already been used in Tuzet et al. (2020) or Dumont et al. (2020) and is an adaptation of the ensemble “E2” which is fully described in Lafaysse et al. (2017). This ensemble is composed of 35 members, and the TARTES radiative transfer scheme is used for all the members of our study as it is the only one to explicitly account for the impact of light-absorbing particles. Therefore, the modeling uncertainties of the radiative transfer scheme are not accounted for in this study. We also neglect the uncertainty in black carbon deposition and the impact of dust deposition for the rest of the season.
Simulations are carried out in the Thabor mountain region at 2400 m elevation. This region in the French Alps is close to the Italian border (region number 13 in Fig. 2 in Vernay et al., 2022). All presented simulations were conducted on a slope inclined by 40∘. Eight different aspects are computed: north, northeast, east, southeast, south, southwest, west and northwest.
To investigate the sensitivity of the results to elevation and to the intensity of the dust deposition, additional ensemble simulations were performed at several elevations with varying masses of deposited dust. We use the following additional deposition masses: , and g m−2, which correspond to typical values of Saharan dust deposition in the French Alpine regions ranging from a low Saharan dust outbreak to an extreme case with a deposition mass 50 % higher than the maximum measured values from Réveillet et al. (2021). The snow-modeling uncertainty is still considered in this sensitivity experiment with the same ensemble framework as described in Sect. 2.1.
2.2.2 Observed dust event
The method presented above was also applied to an observed major dust outbreak event that occurred from 5 to 7 February 2021 (Réveillet et al., 2021). After that event in the Thabor massif, where our synthetic case is performed, loads of dust ranging from 6.16 to 29.7 g m−2 were measured on 12 snow samples with a median value of 14.9 g m−2 (values from data used in Réveillet et al., 2021).
The simulations were performed following the same methodology as for the synthetic case (see above) with a deposition of 15 g m−2 to be consistent with measured concentrations. The black carbon deposition flux was set to the median value of ALADIN-Climate in the years 2017–2018 because ALADIN-Climate output was not available for this period.
2.3 Impact evaluation
To assess the impact of the simulated dust outbreak on snowpack stability, different snow physical properties and stability indicators are compared between the no-dust and dust simulations. We study dry-snow instabilities in view of artificial triggering and wet-snow instabilities for natural release, as they are subject to dust deposition (Landry, 2014).
2.3.1 Artificial triggering of dry slab avalanches
The impact of the dust deposition on the probability of artificial triggering in the region is evaluated using the MEPRA stability indicator. The model MEPRA analyses at every time step the output of the snow cover model, calculates the snow mechanical properties of the snow layers (shear strength and rammsonde penetration resistance), performs a basic stability analysis (shear strength / stress ratio at each layer boundary, with and without skier; Föhn, 1987) and based on that data provides stability indicators for the probability of natural release and artificial triggering. Figure 11 of Morin et al. (2020) shows an example of a final product of the analysis with MEPRA as it is provided to French avalanche forecasters.
The so-called “accidental risk index” in MEPRA provides an estimate of the probability of artificial triggering due to an additional load at the snow surface (e.g., due to a recreationist) on a four-level scale. On this scale, level 0 indicates stable conditions on a slope that is insufficient for avalanche release. Level 1 indicates that the initial conditions for instability, i.e., a typical weak layer underneath a cohesive slab, are not fulfilled. Level 3, the highest level, on the other hand, corresponds to pronounced instability where the stress in this layer, due to the weight of overlying layers and additional load, is close to layer strength. We thus only use levels from 1 to 3 in this study.
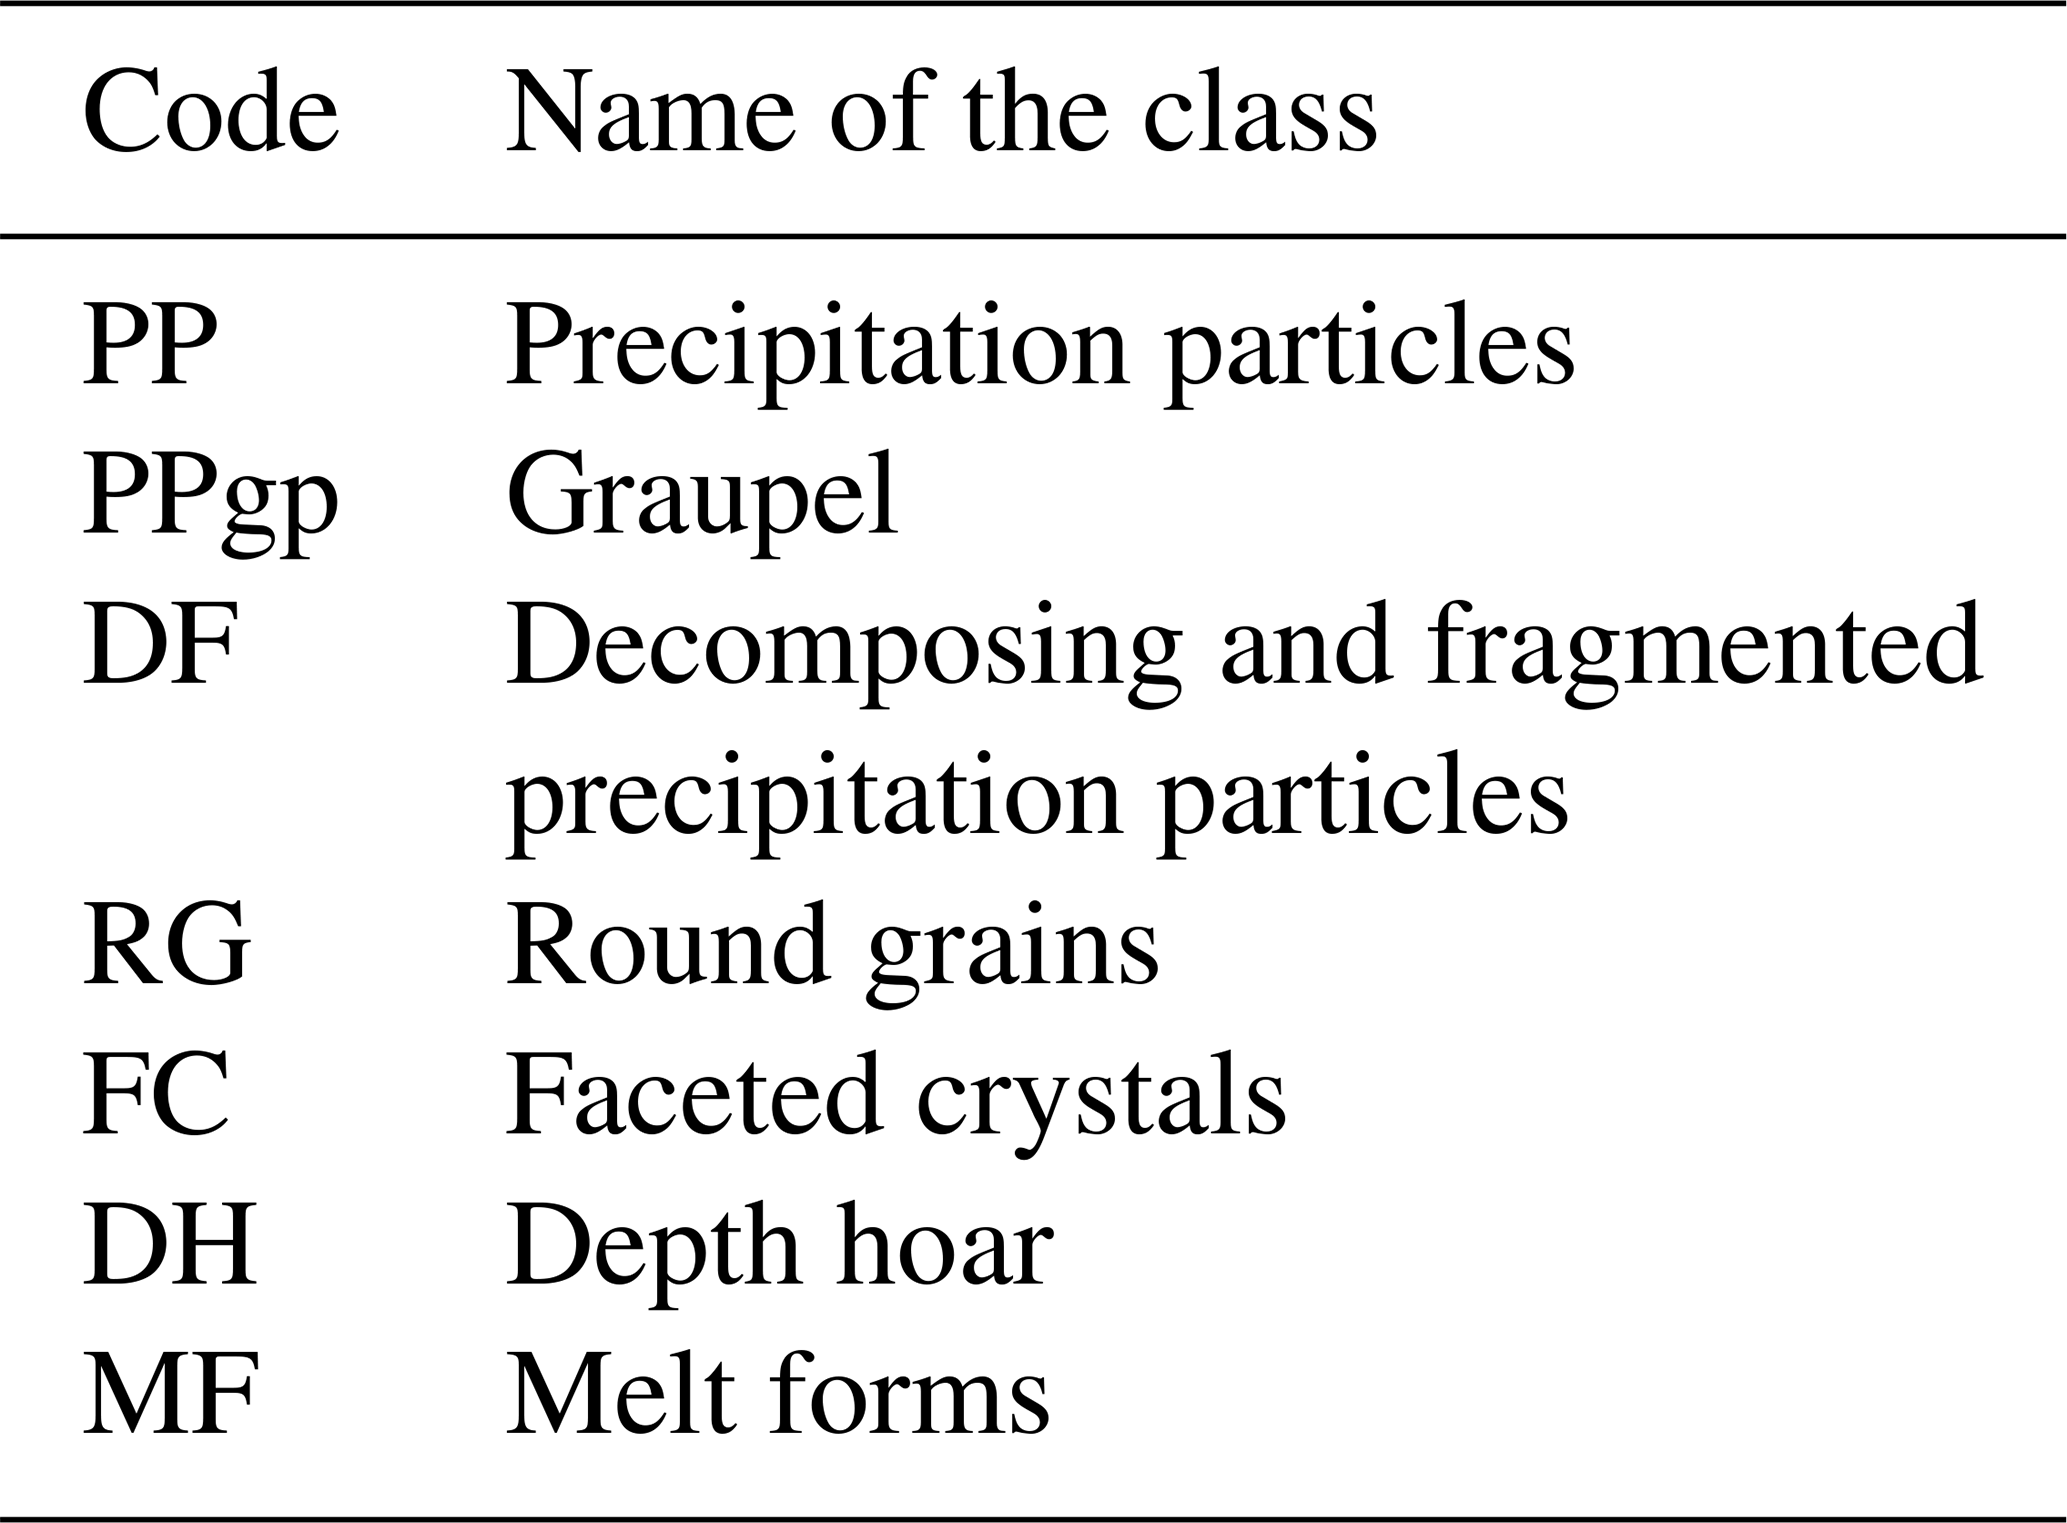
To calculate the “accidental risk index” the MEPRA model searches for a slab (a layer of decomposing and fragmented precipitation particles or rounded grains) sitting on top of a weak layer, i.e., a layer of faceted crystals (FC), depth hoar (DH), precipitation particles (PP) or decomposing and fragmented precipitation particles (DF). Then, MEPRA compares the shear strength to the shear stress in the weak layer (due to the weight of the overlying slab and skier-induced stress) (Giraud et al., 2002; Viallon-Galinier et al., 2022). The stress in the weak layer is adapted to include so-called bridging effects, for instance, the effect of a melt-freeze crust that redistributes the stresses due to additional load at the snow surface (Giraud et al., 2002; Thumlert and Jamieson, 2014). For operational forecasting the “accidental risk index” is combined with a “natural risk index”, and we removed this tie and only consider the part described above. Hence, in dry-snow situations the described MEPRA “accidental risk index” can be considered an indicator of the probability of artificial triggering. In the following we refer to it as the MEPRA index M.
The MEPRA stability indicator M is computed for each output time step of the simulation, t, i.e., 3 h, and for every member i of both the dust and no-dust ensemble. For both ensembles the total number of members is set to N=35 as in Lafaysse et al. (2017) so that the spread of the ensemble adequately represents the model uncertainties. In order to compare both ensembles, the stability indicator of the dust simulation, Mdust, is subtracted from the one of the no-dust simulation, Mno_dust, member by member. For each of the 35 members, i, and time step, t,
is positive if the stability is higher in the case of the dust simulation than in the case of the no-dust simulation. Values of ΔM,i(t) range from −2 to 2. ΔM,i(t) is computed from the first time step of the dust deposition until 10 April 2018 at 06:00 UTC. in order to ensure the presence of snow in both simulations for each index i and t considered here. This period corresponds to 312 simulation time steps, i.e., 312 values of t.
We define the probability P(V,Ωt) (expressed in %) as the probability that the stability indicator ΔM=V takes a certain value V in a given time domain Ωt among the ensemble members. For instance, for a given time step, t, if seven of the members present a ΔM(t) of 1, (7 values over a total number of 35).
In Sect. 3, we use daily and seasonal values of P(V,Ωt). The daily values are computed for each day from midnight to 21:00 UTC as a mean on temporal time steps and members. For the seasonal values, we only use the sign of ΔM and calculate for each member the number of days when ΔM was positive or negative. We report the distribution within the ensemble of more stable and less stable days with respect to the no-dust simulation.
Finally, in order to quantify the bridging effect, we also use the bridging index (Thumlert and Jamieson, 2014) for relevant weak layers: for all slab layers, the product of rammsonde penetration resistance (computed by Crocus; Giraud et al., 2002, Sect. III.1) and layer thickness is computed, and values are summed up to provide one value for the slab.
2.3.2 Onset of the first wet-snow avalanche cycle
The impact of dust deposition on wet-snow avalanche activity is evaluated using variables simulated with Crocus. In this study we use the liquid water content index (LWCindex) as introduced by Mitterer et al. (2013). The LWCindex is calculated in this study by dividing the mean volumetric liquid water content of the simulated snowpack by a typical value of 0.03 kg m−3. In order to identify the onset of wet-snow avalanche activity, this index is compared to 0.33 as suggested by Mitterer et al. (2016). The first wet-snow avalanches can be expected when the liquid water content index reaches this value.
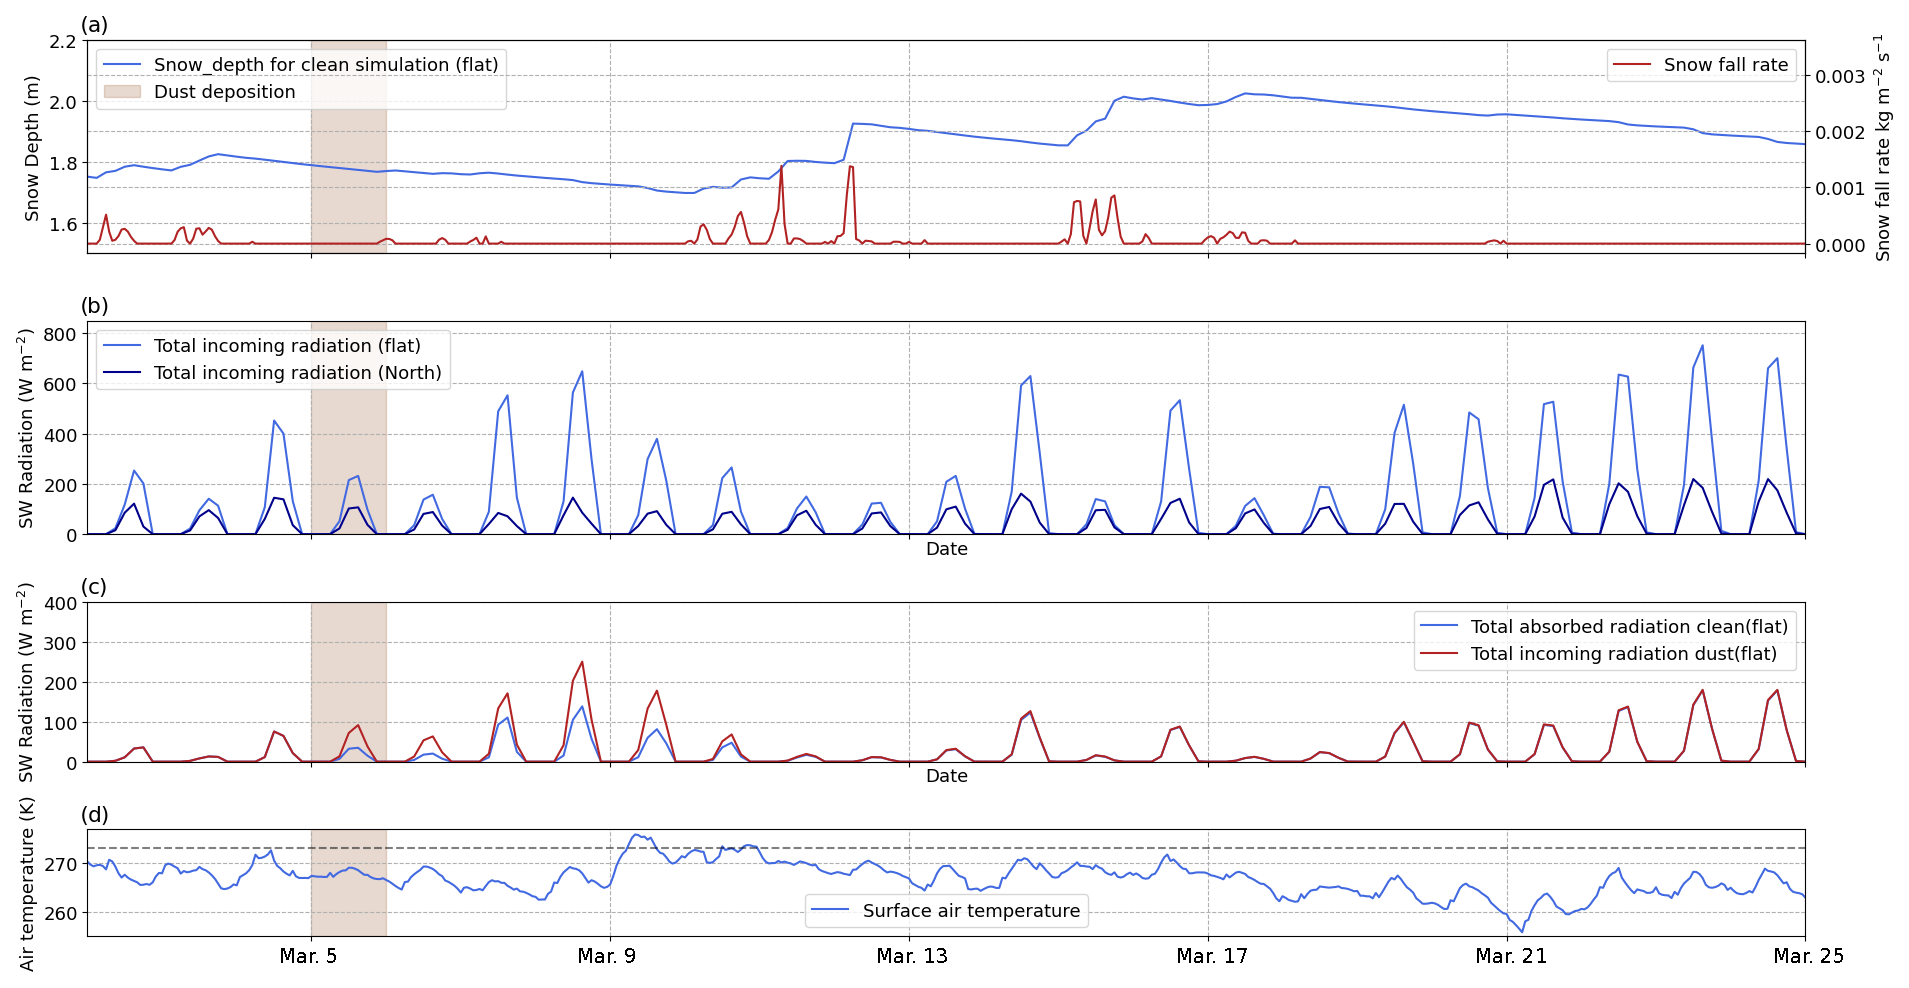
Figure 1Meteorological and snowpack conditions in the days following the dust deposition on 5 March 2018: (a) snow depth for the no-dust simulation (flat field) and snowfall rate; (b) total amount of incoming solar radiation for a flat field and a 40∘ steep north-facing slope; and (d) air temperature. Panel (c) presents the energy absorbed by the snowpack for dust and no-dust simulations (member 8) on a flat surface.
3.1 Meteorological conditions
On 5 March 2018 conditions were favorable for dust depositions to have an impact on snow instability according to Landry (2014); i.e., the dust deposition was followed by a dry period and enough incoming shortwave radiation. Figure 1 presents the meteorological conditions in the days following the dust deposition. In this case, dust was deposited at the snow surface and stayed at the surface for 5 d. During these 5 d the shortwave incoming radiation on a flat surface was moderate on 2 d (6 and 10 March) and high with mostly clear skies from 7 to 9 March (Fig. 1b). The dust radiative forcing (i.e., the additional energy absorption due to the surface darkening of dust) exceeded 100 W m−2 in peak hours (Fig. 1c). The dust layer was then buried by about 30 cm of new snow on 11 and 12 March 2018. The radiative impact of the dust layer became negligible during the following 2 weeks (Fig. 1c) when a cooler period followed, which is reflected in negative values of air temperature.
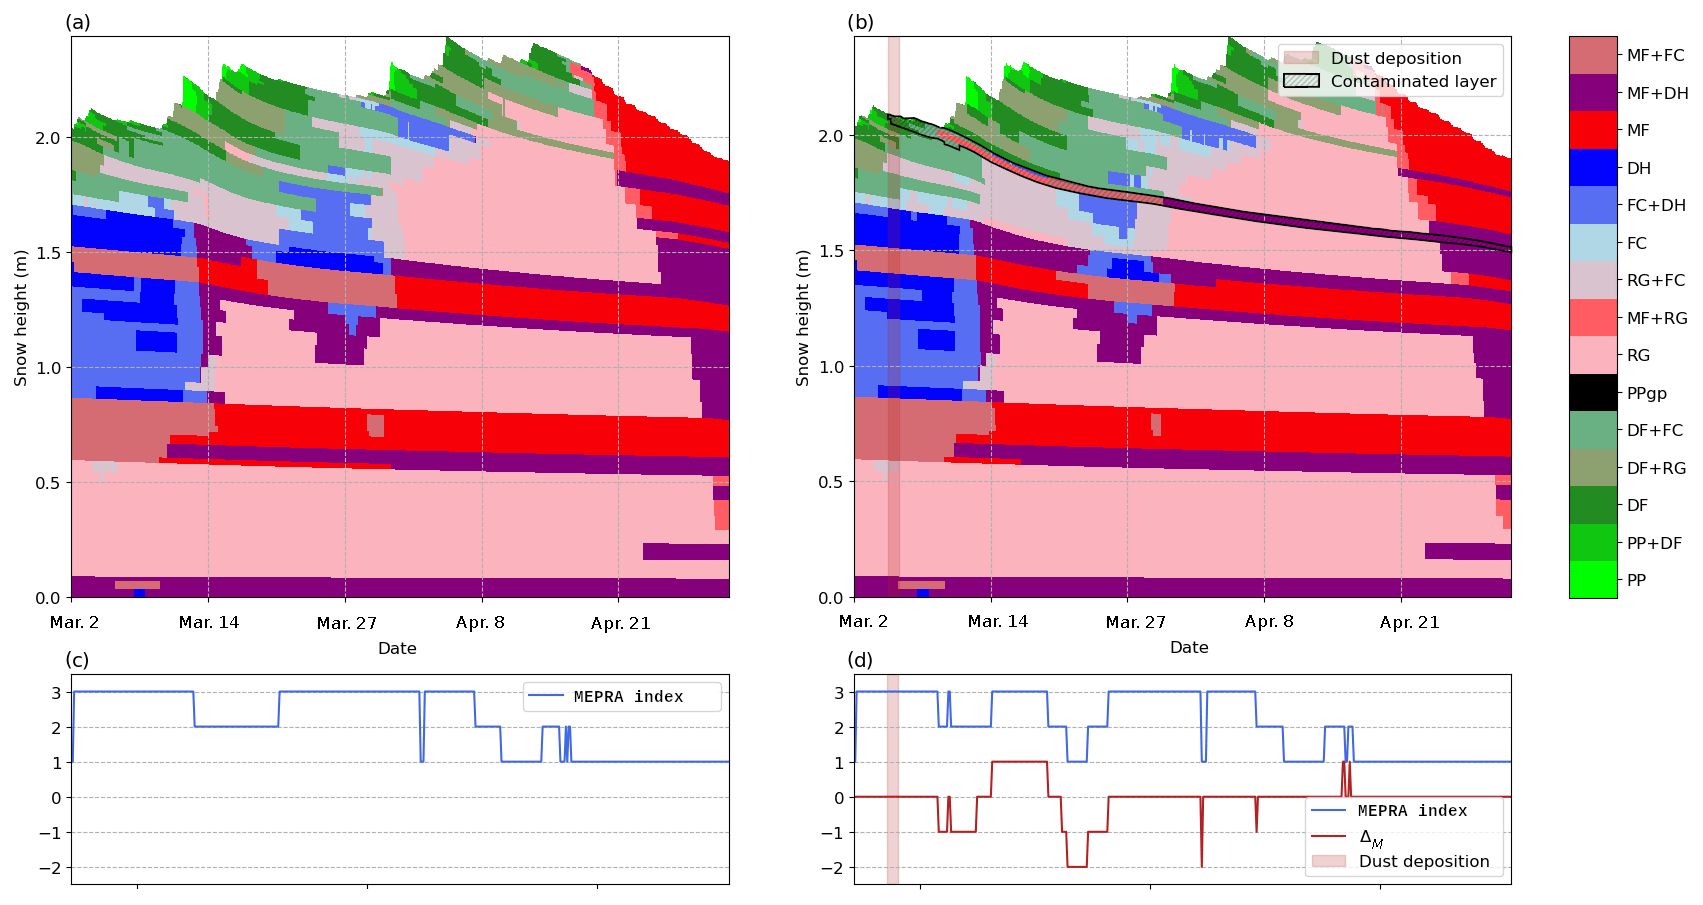
Figure 2The upper panels show snow profiles for the same member (member 8) of the ensemble simulations on a 40∘ steep north-facing slope. Panel (a) refers to the no-dust simulation and (b) to the dust simulation. Snow grain shape abbreviations follow the international snow grain shape classification (Fierz et al., 2009) (Table A1), and the shading (hatches) corresponds to the layer contaminated with more than 10−4 g g−1 of dust. The lower panels present the MEPRA stability indicator (in blue) for (c) no-dust and (d) dust simulations. Panel (d) also shows in red the ΔM index which represents the difference in stability between simulations.
3.2 Dry-snow instabilities
3.2.1 Impact on snow profiles
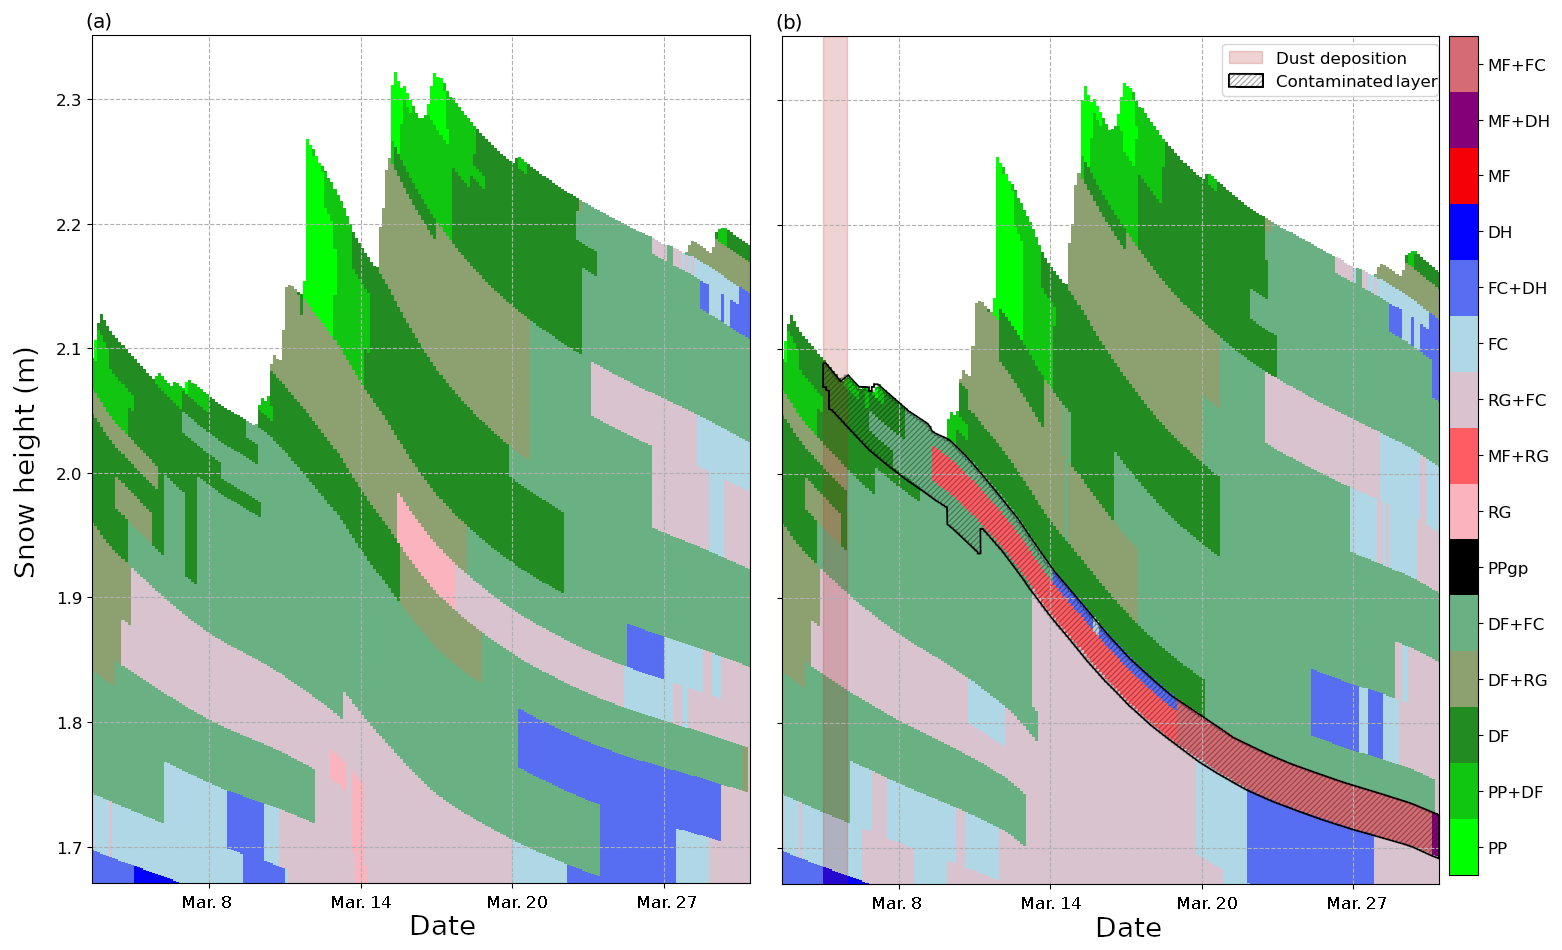
Figure 2a and b show the temporal evolution of grain shape profiles for member 8 of both ensemble simulations for a 40∘ steep north-facing slope, respectively with and without dust. The snow cover in the dust simulation (Fig. 2b) has a 25 mm thick melt-freeze crust which appears 4 d after the dust deposition just below the surface (see also Fig. 3 for a zoom of the interesting period). This melt-freeze crust does not exist in the snow cover simulation without dust deposition (Fig. 2a) and hence was caused by the additional surface melting induced by the dust layer which was at the snow surface between 5 and 9 March (Fig. 1). The cold weather conditions after the snowfall induced a temperature gradient in the upper part of the snowpack, and conditions were favorable for faceting adjacent to the crust. On 14 March, 4 d after the snowfall, a thin layer of faceted crystals and depth hoar had formed above the melt-freeze crust in the dust simulation. This can be explained by a strong temperature gradient (>20 K m−1) between the dust layer and the overlying recent snow (not shown), which was not present in the no-dust simulation.
Figure 2c and d present the evolution of the MEPRA stability indicator. Figure 2d also shows the evolution of ΔM and presents the difference in the stability indicators between the dust and no-dust simulations. In the 4 d following the snowfall, both scenarios show poor stability due to the presence of faceted crystal and depth hoar around 30 cm below the surface. Just before the snowfall, the formation of the melt-freeze layer reduced the stress due to a potential skier on the underlying weak layer via a bridging effect, also reducing the probability of artificial triggering in the dust simulation for 4 d. On 24 March, the bridging index for the weak layer which is just below the crust in the dust simulation is 114 daN cm for the simulation without dust and 162 daN cm with the melt-freeze crust created in the simulation with dust, which represents an increase of 42 % of the bridging effect, according to this index. Then, the appearance of a new weak layer of faceted crystals (FC+DH) decreased stability in the dust simulation. As this layer did not form in the no-dust simulation, the dust simulation was less stable than the no-dust simulation for 5 d, before it was merged with adjacent layers, as snow structural properties allowed the model to do so. In the days following 19 March the probability of artificial triggering decreased in the dust simulation and became lower than in the no-dust simulation. This may be due to the crust which redistributes stresses inside the snowpack so that the weak layer stress is lower. After 25 March the impact of dust deposition became negligible as snow instability was controlled by more recent temporal weak layers.
Figure 4 shows the snow profiles on 18 March for all 35 members in order to represent the sensitivity of the stratigraphy to snow-modeling uncertainties. Member 8 shown in Fig. 2 is highlighted by a black rectangle. Not all the members exhibit the same behavior as member 8. For some members, the net surface energy budget did not provide the energy to melt the dust layer located at around 1.8 m above the ground (hatched rectangle in Fig. 2b). Even in this case, the temperature increase caused by dust can be sufficient to cause the growing of a weak layer of faceted crystals (e.g., Fig. 3). For the dust simulation, the formation of a melt-freeze crust can be observed for 30 % of the members, while it never occurs in the no-dust simulation. More than 48 % of the members present a faceted layer (FC, FC+DH or DH) around 1.8 m above the ground in the dust simulation, compared to 23 % in the no-dust simulation.
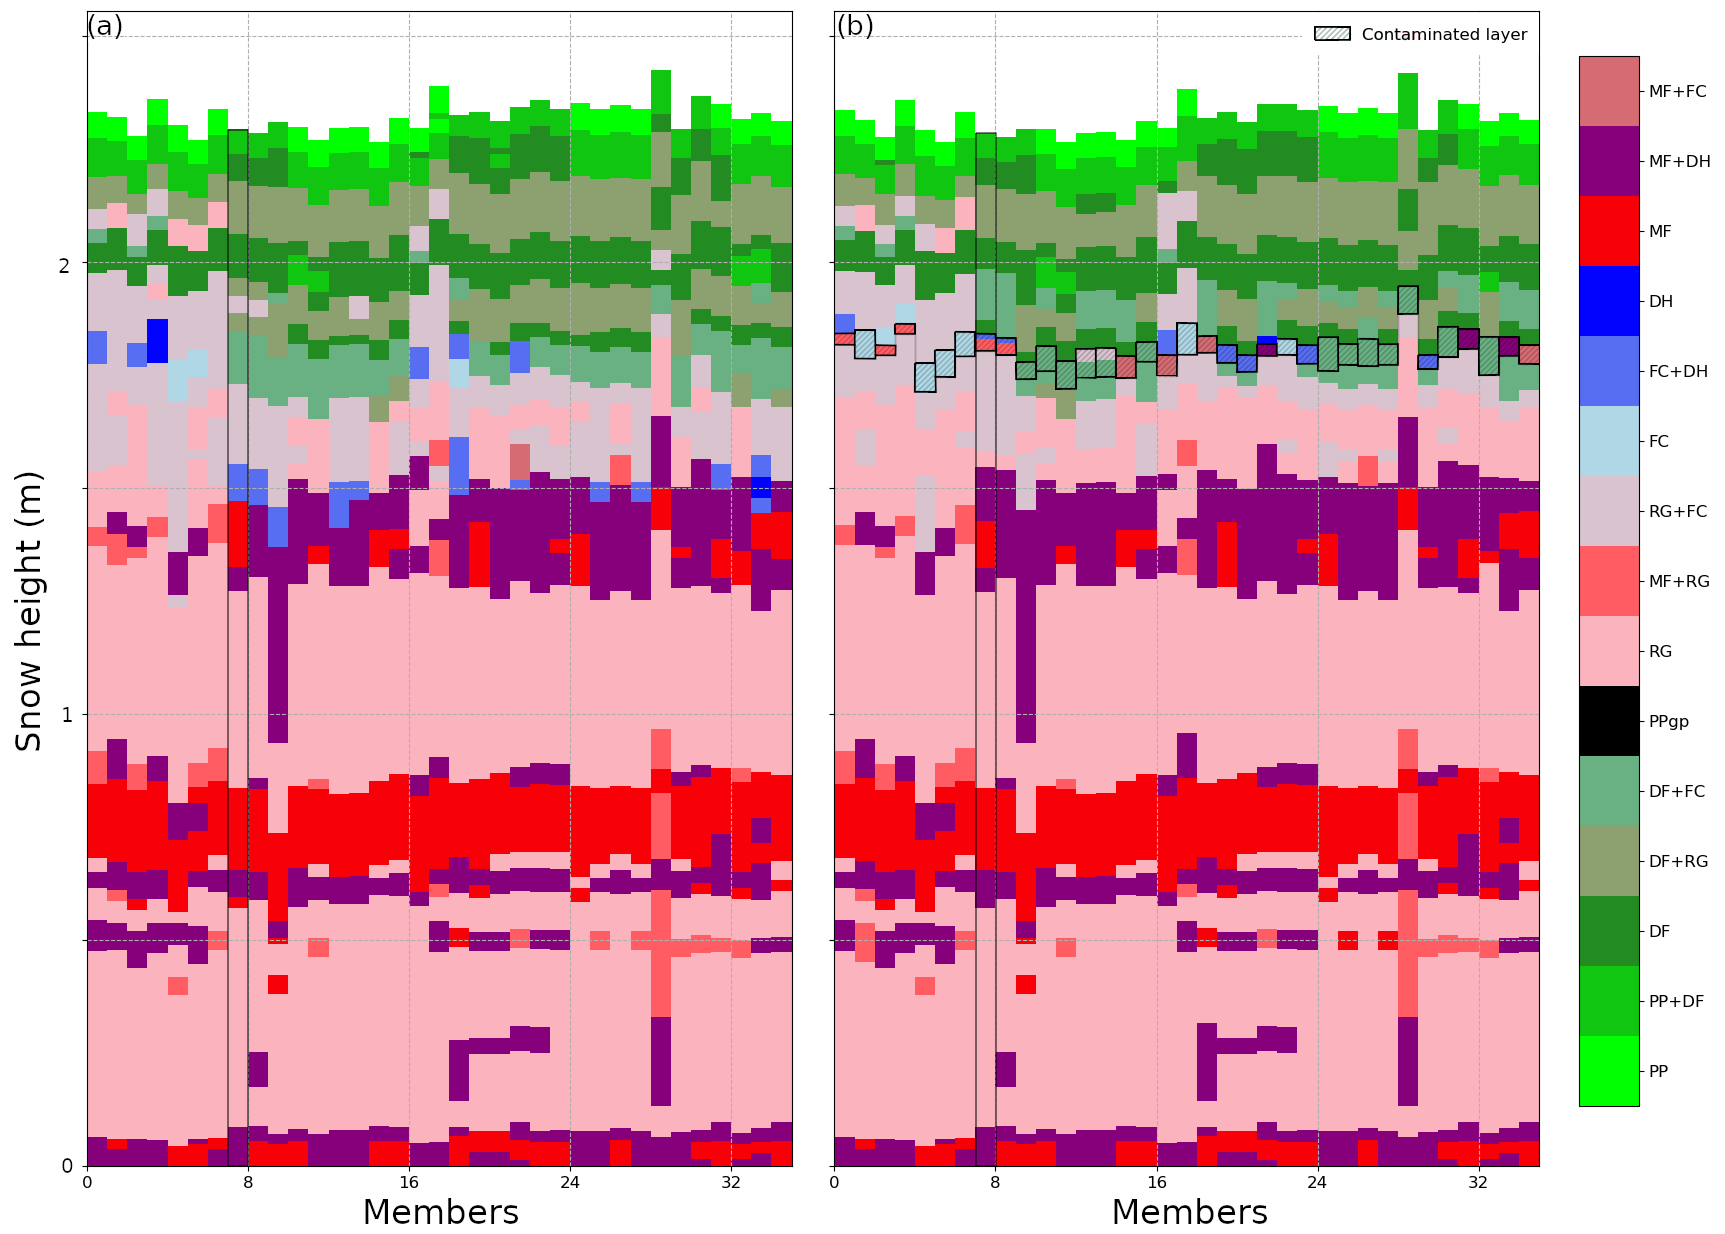
Figure 4Snow profiles of the 35 members of the no-dust simulation (a) and dust simulation (b) for the northern slope on 18 March 2018 at noon. The member represented in Fig. 2 is surrounded by a black rectangle, and the contaminated layers for each member are hatched in (b). Snow shape names follow the international snow grain shape classification (Fierz et al., 2009).
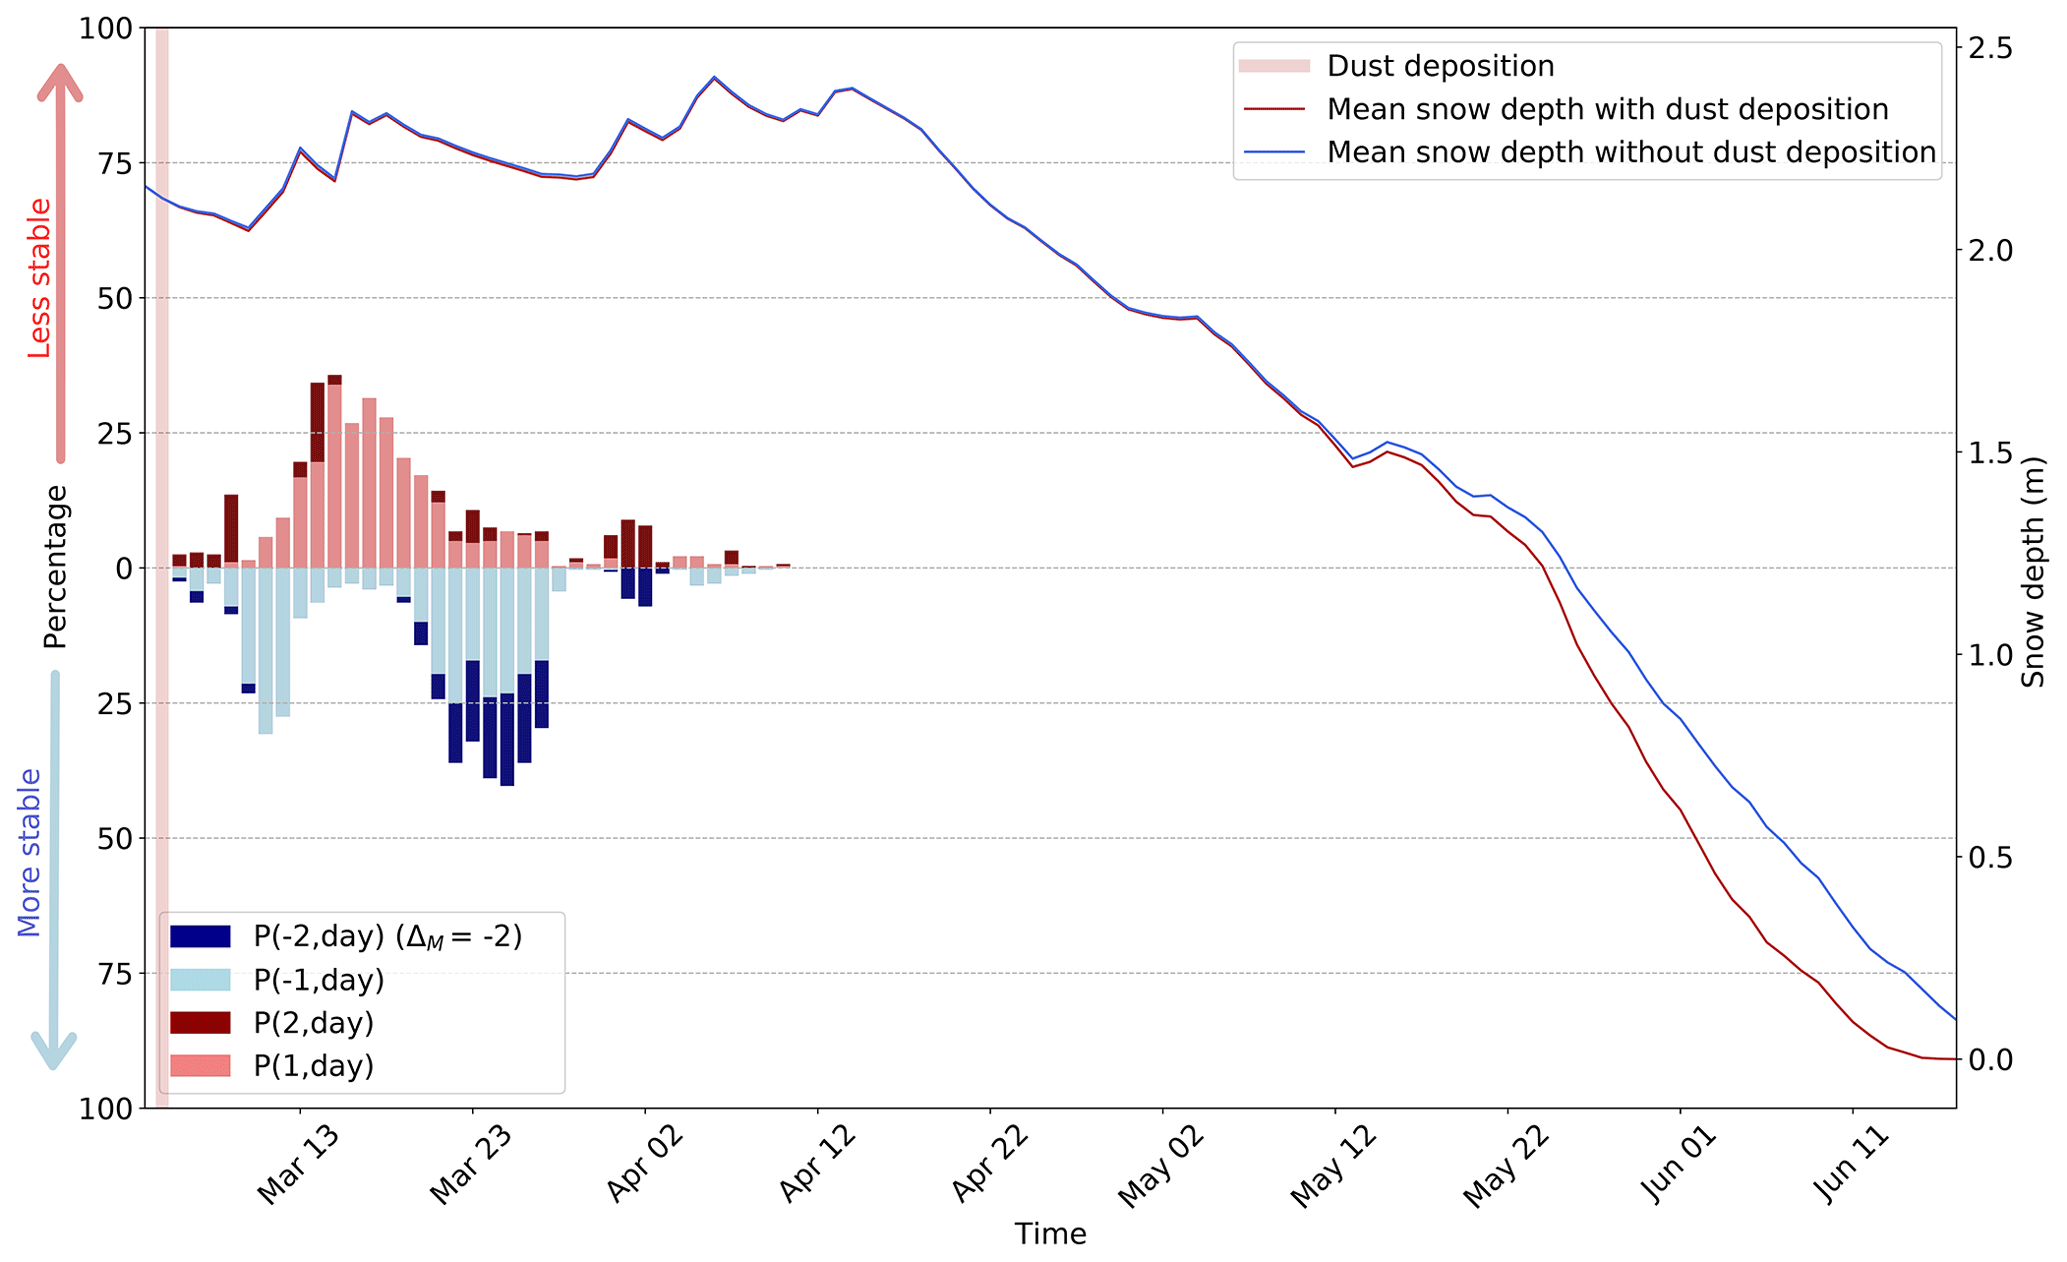
Figure 5Evolution of the daily difference in stability ΔM for the synthetic case of a north-facing slope at 2400 m. For each day the probability P(V,(day)) (in %) is graphed in blue for an increase in snowpack stability (V<0) and in red for a decrease (V>0). The blue and red lines represent the snow depth for the modeled snowpack without and with dust deposition, respectively, after the dust deposition event of 5 March 2018.
3.2.2 Ensemble stability analysis
Figure 5 presents the daily bar plot of P(V,day) (the probability that ΔM=V each day among the 35 members) for north-facing aspects. The probability of no impact (P(0,day)) is not represented but corresponds to the complement to 100 %. A positive value of ΔM means that the computed stability is lower for the dust simulation than for the no-dust simulation, and a negative value means that the stability is higher for the dust simulation.
From 9 to 11 March, more than 20 % of the snowpack simulations in the ensemble have a negative ΔM. This can be attributed to the presence of a melt-freeze crust in the dust simulation that decreases the stress on the underlying weak layers as explained in Sect. 3.2.1. Afterwards, on 12 March more than 20 % of the snowpack simulations have a positive ΔM for 7 consecutive days. This corresponds to the period of enhanced temperature gradient and grain faceting identified in Sect. 3.2.1. On 20 March a period of 8 d begins when more than 25 % of the snowpack simulations are more stable in the dust simulations. After 27 March, the dust and no-dust simulations show no major difference in stability. Snow height values of both simulations show small differences a few days after the dust deposition, and no systematic difference can be highlighted until 11 May. After 11 May, the snow cover with dust deposition melts faster. Figure 5 highlights that the impact of dust deposition alternates between an increase and a decrease in snow stability in the weeks that follow dust deposition. Although a consistent temporal signal can be identified among the ensemble members, the complex interactions between processes add a high level of uncertainty to the simulation of the impact of dust deposition, as at any time 60 % of the members exhibit no change in MEPRA indicators.
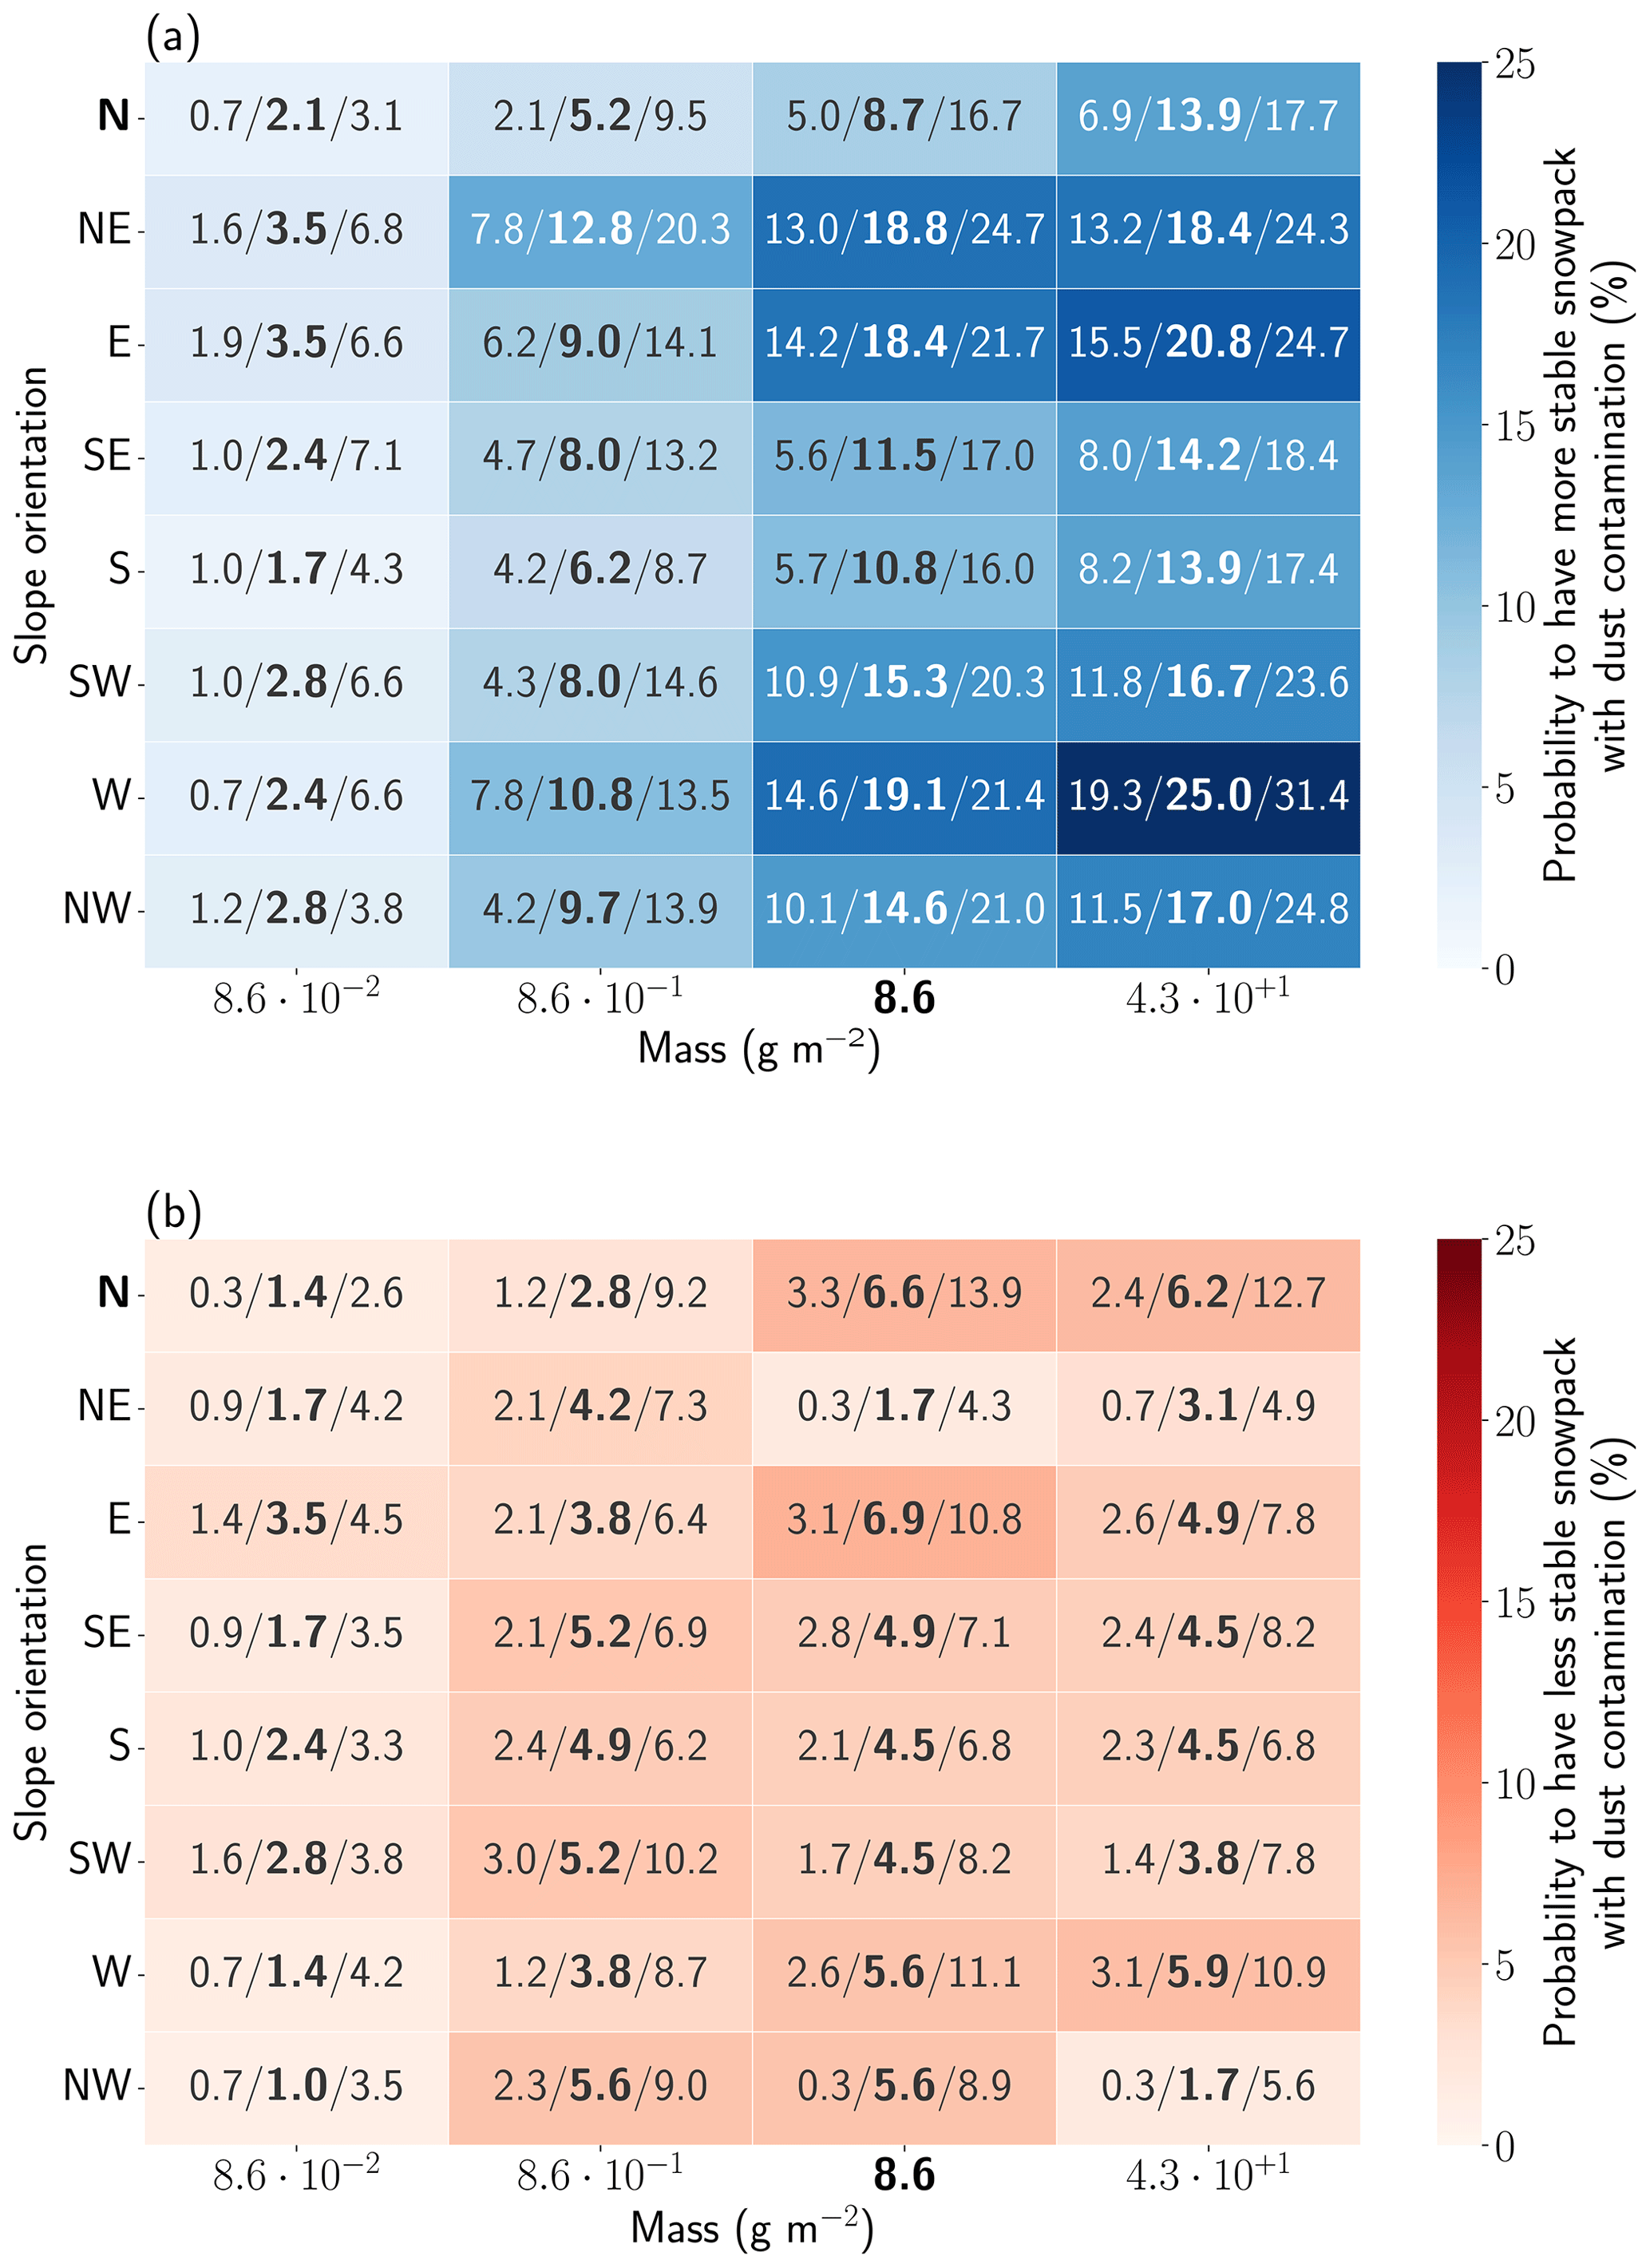
Figure 6Probability for (a) a more stable (negative ΔM) and (b) a less stable (positive ΔM) snowpack due to dust deposition on the eight slope aspects for four different dust deposition masses: , , 8.6 and g m−2. The ΔM index represents the difference in dry-snow stability between dust and no-dust simulations. The values are calculated from 5 March to 9 April (280 time steps) corresponding to P(<0,all) for (a) and P(>0,all) for (b). The deposition value of 8.6 g m−2 correspond to the previously studied configuration (Sect. 3.2.1 and 3.2.2). The values indicated in the cells are the median (in bold) and the first and third quartiles. All values are percentages referring to the probability for a negative or a positive value.
3.2.3 Impact of the deposited mass of dust
To investigate the sensitivity of the results of Sect. 3.2.1 and 3.2.2 to the deposited dust mass, several ensemble simulations were performed with different dust masses. Four different masses are tested: , , 8.6 (corresponding to the initial study case presented in previous results) and g m−2. The probability of having a more stable (negative ΔM; Fig. 6a) or a less stable (positive ΔM; Fig. 6b) snowpack in the dust simulation than in the no-dust simulation is computed using the method described in Sect. 2.3.1 from 5 March (date of dust deposition) to 9 April.
Figure 6a shows that for all aspects increasing the amount of the deposited dust tends to increase the probability for lower dry-snow stability in the dust simulation. This is explained by the higher dust radiative forcing leading to more melting and a more pronounced bridging effect of the melt-freeze layer (Fig. 2). Regarding the less stable days, Fig. 6b illustrates a complex link between the deposited dust mass and the topographic conditions with no evident relationship between these two factors and the number of less stable days. This is consistent with previous observations highlighting the strong variability in this impact (e.g., Landry, 2014). This shows that the impact of dust towards lower dry-snow stability is not negligible under certain conditions (e.g., deposition mass, topography, other terms of the surface energy budget). In other words, our data do not suggest a rule to explain how stability depends on conditions.

Figure 7Number of days with (a) a more stable and (b) a less stable snowpack when contaminated with dust for each of the eight slope aspects and for three different elevations: 2100, 2400 and 2700 m. The values are calculated from 5 March to 9 April 2018. The bold labels (2400 m north) correspond to the configuration of Sect. 3.2.1 and 3.2.2. The biggest pie plot corresponds to the median of ensemble members and the small pie plots to the first (Q25) and third (Q75) quartiles of ensemble members.
3.2.4 Impact of elevation and aspect
The influence of elevation and slope aspect on the results of Sect. 3.2.1 and 3.2.2 was estimated by calculating for each ensemble member the number of days when the snowpack is more stable (Fig. 6a) or less stable (Fig. 6b) in the dust simulation than in the no-dust simulation. Eight slope aspects at three different elevations – 2100, 2400 and 2700 m – were considered.
Figure 7a shows no marked trend even if the number of more stable days seems to be lower at 2100 m than at higher elevations. This can be attributed to the presence of a melt-freeze crust in all snowpack simulations (dust and no-dust) at this elevation. Figure 7b presents the variability in the impact of slope aspect and elevation. No clear trend was apparent, but the impact varied strongly between two neighboring configurations (e.g., north at 2400 m and northeast at 2400 m). The dispersion between the 25th and 75th percentiles (small plots in Fig. 7) also shows that the number of days when the stability was impacted by dust can vary significantly with the accuracy of the simulated energy balance, as estimated by the ensemble modeling framework, from a few days to more than 30 d at a given elevation and aspect.
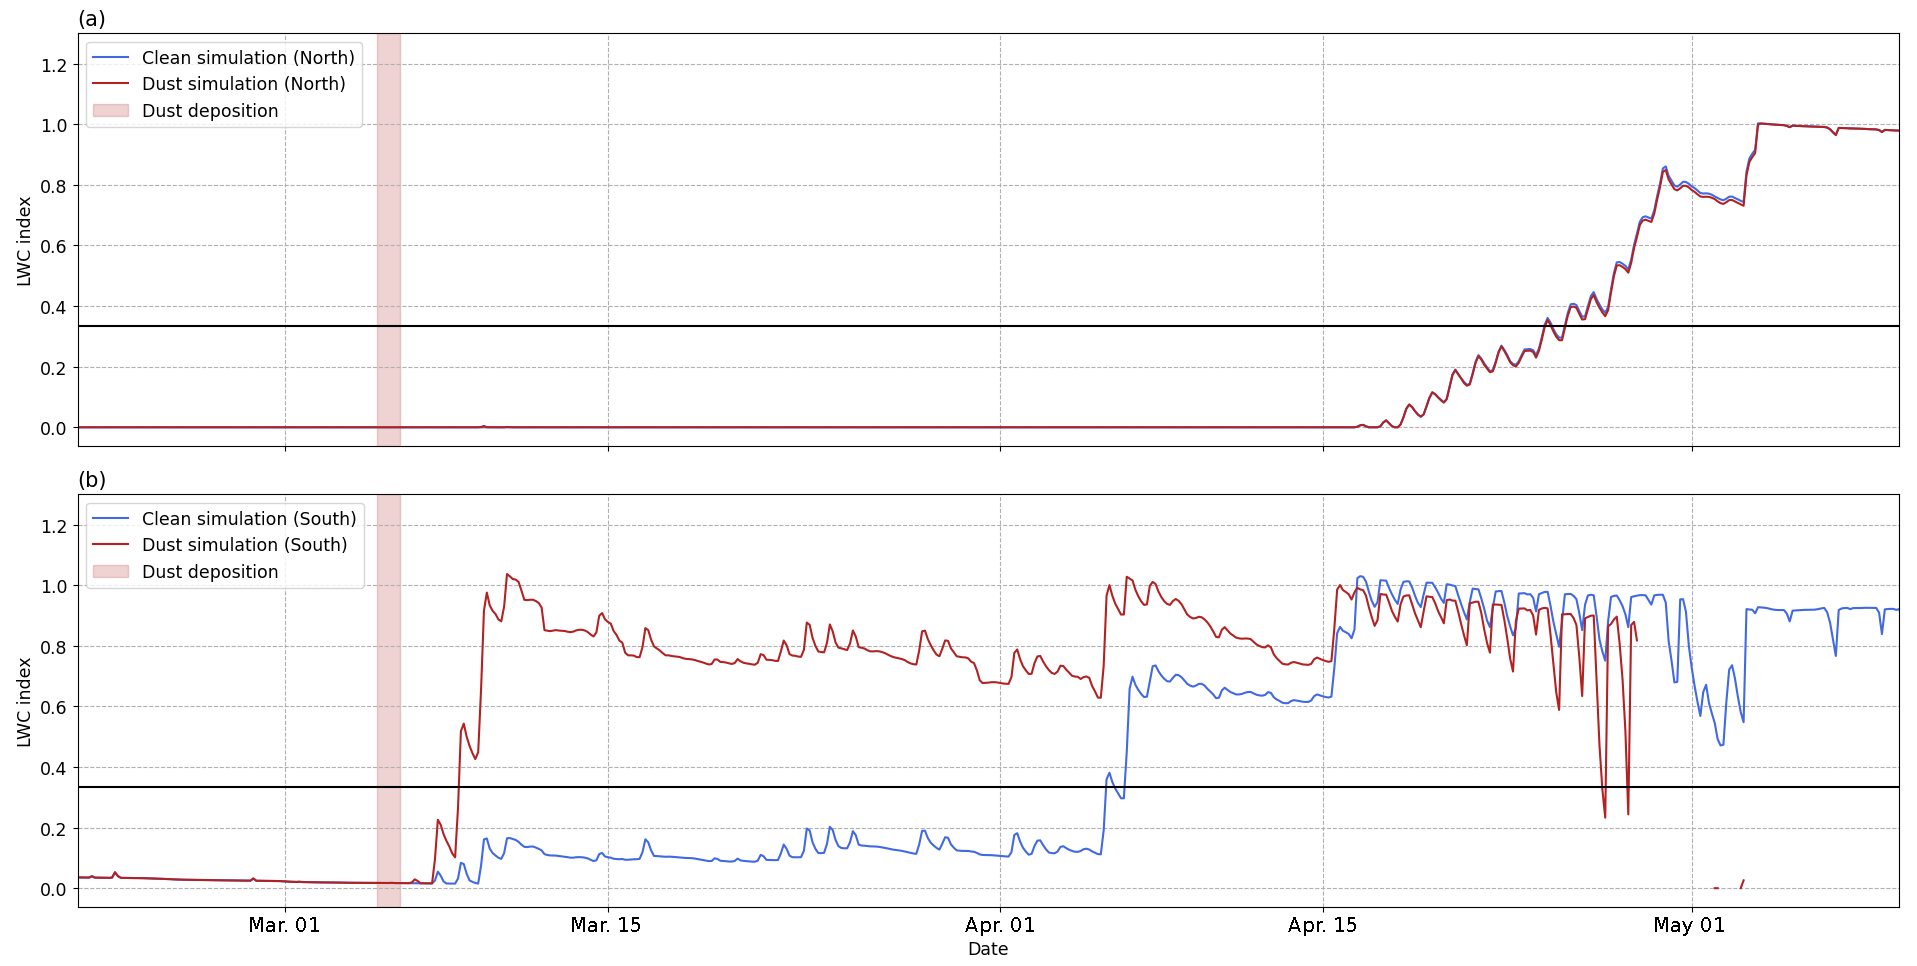
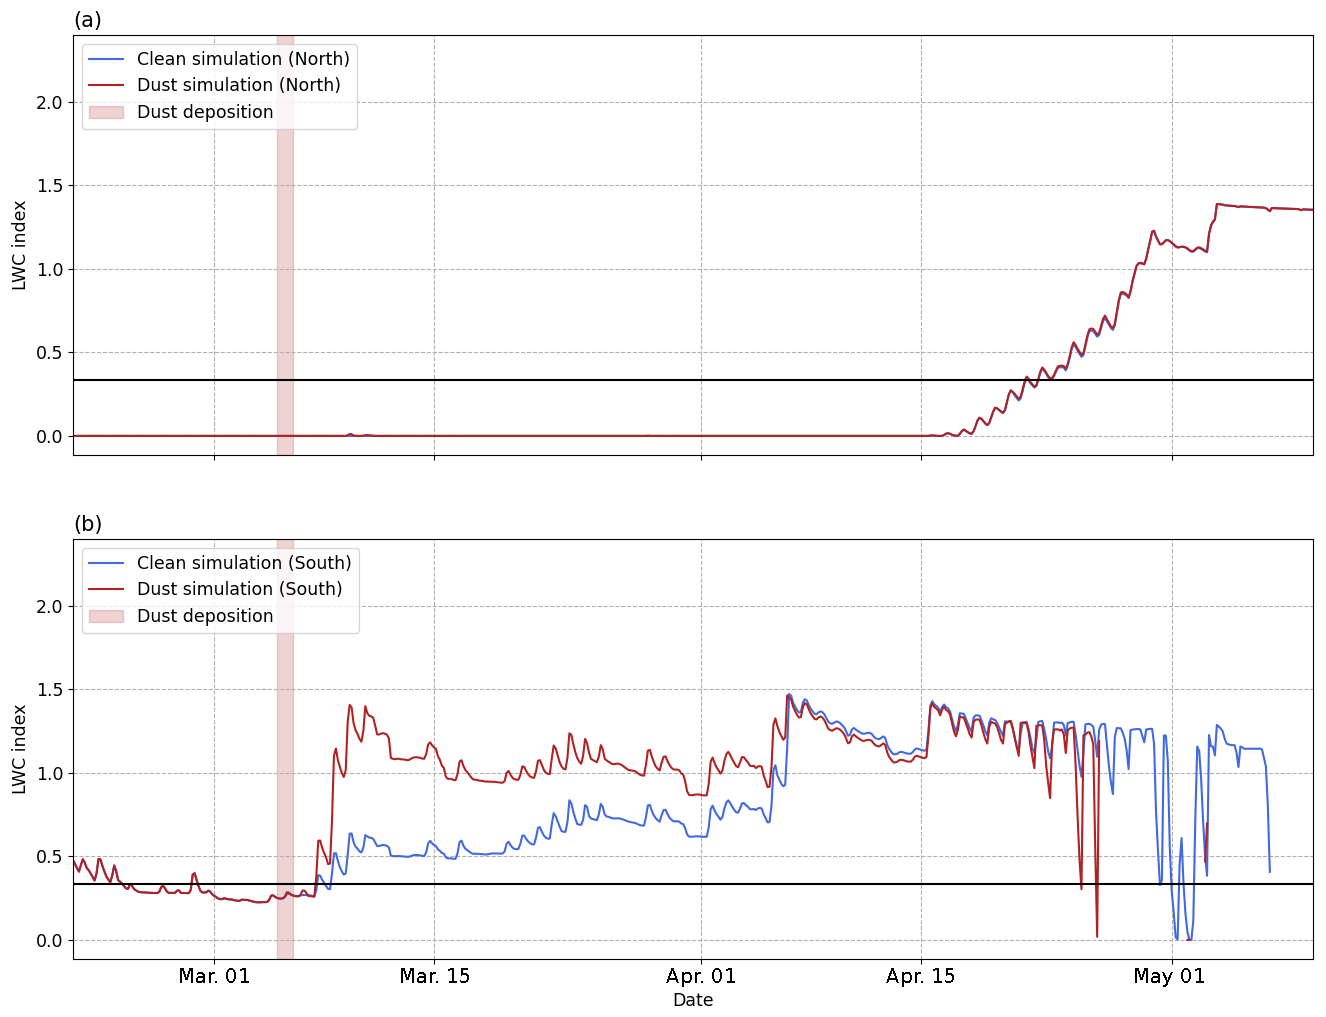
Figure 8LWC index for member 8 of both dust and no-dust simulations on a 40∘ steep (a) north-facing and (b) south-facing slope. The horizontal black line shows the threshold of 0.33.
3.3 Wet-snow instabilities
Figure 8 illustrates the evolution of the LWC index for the season 2017–2018, as described in Sect. 2.3, for member 8 of both dust and no-dust simulations. The horizontal black line at 0.33 represents the lower threshold used to assess the onset date of the first wet-snow avalanches (Mitterer et al., 2016).
On the north-facing aspect (Fig. 8a), the LWC index reached 0.33 on 24 April for both no-dust and dust simulations. Both simulations were close, meaning that the impact of the dust deposition on the wet-snow avalanche onset is negligible for this aspect. This can be attributed to the weak incident solar radiation on slopes with such an aspect, which seems insufficient to cause melting in the snowpack even in the presence of dust. Some small differences appear later in the season between both simulations (not shown), but there is still no impact on the data at which the threshold is exceeded. In contrast, for the south-facing aspect (Fig. 8b) the threshold value of LWC is reached on 8 March for the dust simulation and 27 d later, on 4 April, for the no-dust simulation. The trend of both members matches again on 16 April. This can be interpreted as the onset of wet-snow avalanches advanced by 27 d due to dust deposition for the considered member.
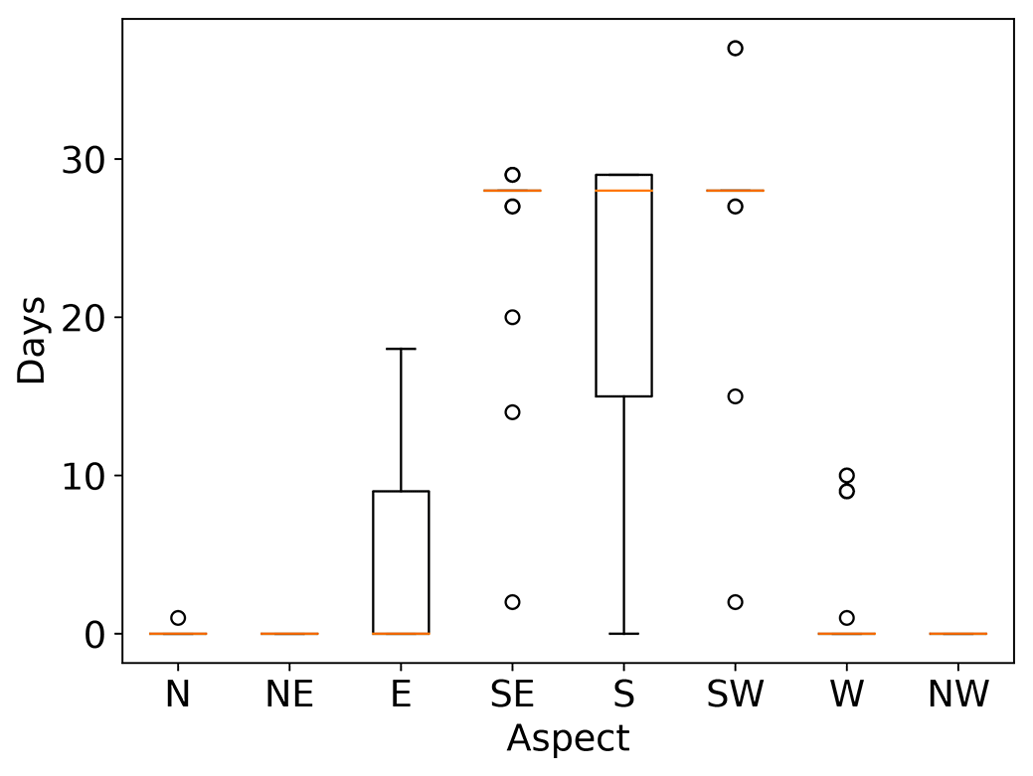
Figure 9Impact of the dust deposition on reaching the LWC threshold. For each aspect, the difference in date when the threshold was reached was calculated between the dust and the no-dust simulation. The main body of the boxplot spans the interquartile range from the first to the third quartile of the data, while the horizontal orange lines show the median. The whiskers show the range of observed values that fall within 1.5 times the interquartile range, and the black circles represent outliers.
When extending the analysis to the whole ensemble, we also observe the impact of dust on the onset date of wet-snow avalanches on south-facing slopes. Figure 9 features the difference in date between the time that the LWC exceeds the threshold in the no-dust and the dust simulations. For the south-facing slope, 25 % of the snowpack simulations have a difference of less than 15 d, while about 50 % have a difference of 28 d or more with a median value of 29 d. This means that the dust deposition leads to a shift of almost 1 month of the onset date of wet-snow avalanches for south-facing aspects. The members featuring a difference of less than 5 d correspond to members for which the threshold was already almost exceeded at the date of deposition (Fig. A1). This situation is less common on southwest- and southeast-facing slopes, as the incoming shortwave radiation is lower. For these aspects, the spread is extremely limited with more than 94 % of the members showing an advance of the onset of wet-snow avalanches of more than 27 d. On east-facing slopes, more than 50 % of the snowpack simulations show no difference, while 25 % have a difference of 9 d or more. For west-facing aspects, most of the members show no impact, while 20 % of the members have a difference of 9 d or more. Finally, north-, northeast- and northwest-facing slope simulations show no impact. For these aspects, results show that dust has no impact on when the threshold is reached. This is likely related to the lower relative impact of shortwave radiation on the total surface energy budget, meaning that snow melting on shady aspects is mainly induced by other terms of the surface energy budget.

3.4 Dust event of February 2021
Figure 10 presents the results on a west-facing slope at 3000 m highlighting the dust deposition event of February 2021. It shows that the dust deposition event mainly modified dry-snow stability for two periods: right after the deposition event and after the precipitation event in mid-March, slightly more than 1 month after the deposition.

Figure 11Proportion of days with (a) a more stable and (b) a less stable snowpack when contaminated with dust for each of the eight slope aspects and for three different elevations: 2400, 2700 and 3000 m. The analysis covers the period from the dust event to 6 April 2018. The ΔM index is introduced in Sect. 2.3.1 and represents the difference in dry-snow stability between dust and no-dust simulations. The biggest pie plot corresponds to the median of the ensemble members and the small pie plots to the first (Q25) and third (Q75) quartiles of ensemble members.
Figure 11 displays the number of days with more or less stable conditions for different aspects and elevations for this deposition event. The methodology is the same as for Fig. 7. It shows that the impact is close to zero for south-facing slopes but that it is more pronounced for northwest- to east-facing slopes at all elevations. However, the magnitude of the impact (either more stable or less stable) is lower than for the synthetic case (Fig. 7).
The present study focuses on the impact of dust outbreaks on snowpack stability, a subject that has been debated by practitioners for a long time with no clear scientific answer to date. The subject has already been treated qualitatively, and Landry (2014) highlighted two main typical situations: an impact on dry-snow instability and an impact on wet-snow instability. To our knowledge, no clear evidence of these processes has been demonstrated until now, partly due to the difficulty in setting up an experimental case (Chomette et al., 2016). To address this issue, we use a multi-physical snowpack modeling approach with the ESCROC snowpack model to separate the impact of dust from the impact of other meteorological factors by comparing simulations with and without dust deposition. A synthetic case with a dust deposition in the Thabor massif on 5 March 2018 (dust simulation) was compared to a similar ensemble simulation without any dust deposition (no-dust simulation), making it possible to separate the impact of dust from associated meteorological conditions. The two processes described by Landry (2014) were reproduced numerically. First, we show that the dust deposition induces an impact on dry-snow instability with alternating phases of increases and decreases in snowpack stability. This impact and its sign have a strong dependency on the deposited dust mass and the topographic conditions (Sect. 3.2.2 as hypothesized by Landry, 2014, and Chomette et al., 2016). Second, an advance of the onset date of the first wet-snow cycles in spring was observed. The shift is larger for higher incoming shortwave radiation (Sect. 3.3). The ensemble simulations were also performed for the major dust deposition event observed in February 2021 (Réveillet et al., 2021). The simulations show that, in some cases, the dust deposition can have an impact on the simulated stability indicators (either to more stable or to more unstable) even 1 month after the deposition event. However, the magnitude of the impact, in terms of number of days when stability was affected, is at least 3 times lower than for the synthetic case.
4.1 Dust impact on dry-snow avalanche formation
The modeling experiment presented in Sect. 3.2.1 and 3.2.2 shows that dust can significantly affect the surface energy budget to alter snow metamorphism. For some members, the increase in solar absorption induces the formation of a melt-freeze crust that would not have formed in the absence of dust (Fig. 2). In the studied case, we point out processes that can both increase or decrease snowpack stability. The increase in snowpack stability is relatively intuitive and may relate to the formation of a melt-freeze crust contaminated by dust in the snowpack that reduces the stress on an underlying weak layer by a bridging effect (Schweizer et al., 2003). The bridging effect was quantified with the help of the bridging index from Thumlert and Jamieson (2014). The decrease in snowpack stability comes from an enhanced temperature gradient adjacent to the crust, as our synthetic case showed. The observed impact appears to be particularly sensitive to factors such as slope aspect, elevation, meteorological conditions and deposited dust mass (Sect. 3.2.2) both for the synthetic and for the observed cases. Depending on the aforementioned parameters, a given dust deposition can lead to either an increase or a decrease in snowpack stability or have no impact on dry-snow avalanche conditions. The simulated impact of dust on stability is also highly dependent on the uncertainties in the simulated energy balance coming from the other processes represented in the model, as shown by the member-dependent impact in Sect. 3.2.2 and the large ensemble spread in Fig. 11. All these results are consistent with the observations of Landry (2014) and Chomette et al. (2016) that both underlined that the impact is not systematic. This suggests that the predictability of the sign, magnitude and localization of this impact is particularly challenging.
For several members of our ensemble simulation, the additional energy absorption caused by dust leads to the appearance of a melt-freeze crust at (or near) the surface of the snowpack (e.g., Fig. 2). The formation of sun crusts (refrozen wet layers initially formed by absorbed solar radiation) for clean snow is discussed in Sect. 2.3 of Jamieson (2006). The formation of sun crusts has been reported to be highly sensitive to topographic variables (slope, aspect and elevation) and to be difficult to predict by avalanche forecasters (Jamieson, 2006). We show here that the phenomenon can be amplified by the presence of dust due to the increase in solar radiation absorption. The dependency of the dust impact on topographic variables (results of Sect. 3.2.2) is expected to add complexity to avalanche forecasting (Landry, 2014). For instance, when solar energy input is too weak to induce the melt of a clean snowpack, conditions may still be favorable for melting if light-absorbing particles are present.
The presence of a weak layer of faceted crystals above a melt-freeze crust has already been documented and can be considered a typical situation favoring slab avalanche release (Jamieson et al., 2001; Jamieson, 2006). The formation of such a weak layer is due to the following physical processes: the strong temperature gradient between the crust and the overlaying snow favors the kinetic growth of faceted crystals which is further enhanced due to the low thermal conductivity of the faceted layer in relation to the melt-freeze layer (Colbeck and Jamieson, 2001; Hammonds et al., 2015). This last point can be simulated by the Crocus snow cover model, which can reproduce temperature gradients around crusts to form weak layers. However, the gradients at the millimeter scale that seem to play a role in the weakening of faceted layers adjacent to crusts (Hammonds et al., 2015; Hammonds and Baker, 2016) cannot be reproduced by the model's vertical resolution. Hence, the weak bonding between the melt-freeze crust and the faceted layer which can be conducive to slab avalanche release (Jamieson, 2006) may likely be underestimated. This means that the decrease in snowpack stability due to the dust could be more pronounced than our simulations predict when a melt-freeze crust is forming.
According to the simulations obtained in the synthetic and observed dust deposition events, the impact of dust on snow instability is not limited to the period following the deposition. When dust stays exposed at the surface and helps form a crust, as in the February 2021 case, the impact of the buried crust can be detected weeks later (Fig. 10).
4.2 Dust impact on wet-snow avalanches
Regarding the wet-snow avalanche activity our simulations show a systematic behavior. When the dust layer re-appears at the surface at the end of the season, the induced reduction in albedo causes earlier wet-snow avalanche activity in the season. As expected, this advance of the onset date of wet-snow avalanche activity increases with the incoming shortwave radiation, which explains the strong impact dust has on south-facing aspects. This advance of the onset date can be as pronounced as 30 d (Figs. 8, 9). These findings confirm that the dust has an impact on the surface albedo and solar radiation absorption inducing an earlier onset of the wet-snow avalanche season. These results agree with observations of Landry (2014) in the Rocky Mountains of Colorado. On the other hand, the north-facing slopes did not receive enough solar energy to impact the timing of wet-snow avalanches in our synthetic case. The impact on north-facing slopes is also expected to vary according to the timing of the usual wet-snow season in the absence of dust. Indeed, in our study case, the simulation for north-facing slopes exceeds the liquid water content threshold around 25 April, and at this point of the season, 40∘ steep north-facing slopes do not receive enough solar radiation to significantly impact the timing of melt. In these aspects, other terms of the surface energy balance such as latent heat release or the longwave radiation drive snow surface warming (e.g., Reuter and Schweizer, 2012).
4.3 Limitations
Our work provides numerical evidence that dust deposition can modify snowpack stability in the French Alps. However, some limitations related to our approach remain.
We used the MEPRA stability indicator for the estimation of the dry-snow stability and implemented the LWCindex for wet snow, while a large variety of other stability indicators exists (Viallon-Galinier et al., 2022). The MEPRA indicator used here is based on discrete values which can limit the accuracy of the comparison between two simulations. For instance, there are many days in our analysis for which the stability indicator is maximal for both the dust and the no-dust simulations due to the presence of deep weak layers in both cases (e.g., Fig. 2d). In such a case, the potential impact of dust on near-surface instability is missed, and the ΔM is null. For example, the approach of Reuter et al. (2022) could help to circumvent this limitation by tracking the weak layers over time and assessing the avalanche problem types based on their stability. Moreover, the wet-snow instability indicator used in our study is sensitive to the liquid water percolation scheme used in the model. The discrepancies between members are especially marked here for east- and south-facing aspects (Fig. 9) and can be partly explained by the three different options implemented in the ensemble to model the maximum liquid water retention capacity of snow (Lafaysse et al., 2017). Ensemble modeling makes it possible to assess the sensitivity of our results to the liquid water percolation scheme, highlighting a clear impact on south-facing slopes. However, an improvement in the representation of this complex three-dimensional process in snow cover models might reduce the associated uncertainty and improve the characterization of wet-snow stability (Wever et al., 2018).
Modeling errors might also affect the radiative transfer scheme. All the members of the ESCROC ensemble use the same setup of the TARTES scheme. This radiative transfer scheme uses simplifying assumptions for light-absorbing particles: the particles are considered Rayleigh scatterers, and the model does not account for the position of the particles with respect to the ice matrix (Hagenmuller et al., 2019). This might influence the estimated radiative impact. However, the radiative transfer scheme and the input data have been extensively evaluated close to the Thabor region using field measurements during two winters (Tuzet et al., 2020). Thus, we believe that the order of magnitude of the impact is realistic for dust deposition at this location.
The snow cover model Crocus comes with some limitations. Although the mass of deposition is computed by the Crocus snow cover model, it is aggregated to the snow surface layers without modification of microstructure properties so that surface hoar cannot be identified as a weak layer in the model. It is not yet clear how dust deposition might affect the surface hoar formation as different processes might be involved. The presence of dust near the surface of snowpack modifies the surface temperature of snow. The dust particles may modify the condensation of ice at the surface of snow, as this is the case for snow flakes in the atmosphere (Möhler et al., 2006). Moreover, Crocus represents the physical processes at the macroscopic scale and is therefore unable to represent millimeter-scale processes (e.g., Hammonds et al., 2015).
Another limitation lies in the fact that our study is restricted to two cases: the observed case of a major dust deposition event in February 2021 and a synthetic dust deposition case selected since it provides a good illustration of both negative and positive impacts on snowpack stability. Beyond both cases presented here, dust depositions have been tested for other years and for several dates (not shown), highlighting a high sensitivity of the impact to the date, aspect, dust load, elevation and snow cover model uncertainty. This high sensitivity confirms the results already described for the two cases investigated in detail in this study.
In addition, we only consider the impact of dust on the snow optical properties and its consequences for energy exchanges between the snowpack and the atmosphere, whereas dust could possibly have other impacts on the snow cover. For instance, Meinander et al. (2014), Skiles and Painter (2016), and Seidel et al. (2016) provided some observational evidence of the non-radiative impacts of light-absorbing particles in wet snow, namely changes in liquid water retention capacity and metamorphism, which also deserve to be further investigated as they could be important processes in this specific question.
Finally, the results obtained here translate to other types of light-absorbing particles, deposited in high enough concentrations to have similar radiative impacts. In French mountain ranges, dust exhibits the strongest sporadic deposition, but in other regions, the dust outbreaks presented here could be compared in a way to volcanic eruptions that deposit large amounts of ash at once over the snow surface.
This study is a first approach to investigate the impact of dust on snowpack stability by numerical modeling. The modeling approach makes it possible to separate the impact of dust from the impact of other meteorological variables, which would be challenging in a field experiment. We numerically investigated the impact of dust outbreaks on both dry-snow and wet-snow instabilities. The impact of dust was studied in a synthetic and an observed dust deposition case. Snow-modeling uncertainties were considered with an ensemble snow cover modeling framework.
Regarding wet-snow instability, using the liquid water content index proposed by Mitterer et al. (2016), we confirm that dust causes an earlier onset of the first wet-snow avalanche cycles in the snow season for slopes with sufficient dust-induced surface melting (e.g., south-facing slopes). In our study case, the predicted onset of the wet-snow avalanche season advanced by up to 1 month due to the presence of dust. These results agree with the observations of Landry (2014) in the Rocky Mountains.
Concerning the probability of artificial triggering in dry snow, we identify three possible scenarios due to dust layers: no impact; a decrease in snowpack stability, meaning that the dust renders the snowpack less stable compared to the no-dust simulation; and an increase in snowpack stability due to the deposited dust. In some meteorological conditions, for instance when the dust layer is not exposed to solar radiation and is directly buried by fresh snow, the presence of dust can have no impact on snowpack stability.
In our synthetic case, the dust layer stayed at the surface of the snowpack for 5 d before being buried by 30 cm of fresh snow. When dust is at the surface, it reduces snow albedo, which enhances surface warming, which can cause the formation of a melt-freeze crust, while in the absence of dust a crust had not formed. Once covered with new snow, a strong temperature gradient can form around the crust, resulting in the formation of faceted crystals or depth hoar. In our simulations some members exhibited this weak layer formation process that decreased snowpack stability. On the contrary, the crust that formed due to dust-enhanced surface warming can increase snowpack stability by reducing the stress in the weak layer as it helps redistributing forces laterally and making failure initiation less likely.
Whether the balance tips towards increasing or decreasing snowpack stability depends on the intensity of dust-induced surface melting and therefore strongly depends on the deposited dust mass, the slope aspect, the elevation and the weather conditions following the dust outbreak. To conclude, there is no simple answer to the question of whether this avalanche would have occurred without the dust outbreak. The main conclusion is that dust deposition can indeed impact snowpack stability, even though several meteorological and snow cover conditions need to line up to promote instability. Our simulation for the observed case suggests that only in a few cases will dust deposition decrease snowpack stability.
An analysis of dust events extended to a longer period, possibly in different snow climates, can shed light on the likelihood of such events. The available snow cover models can reproduce the influence of dust deposition on snow stratigraphy and snowpack stability. However in future snow cover models, the faceting process adjacent to crusts could be refined to pinpoint changes in snow stability.
Table A1Table of the standardized grain shape classes used in this study. See Fierz et al. (2009) for a detailed description of each class.
The Crocus model is open-source, and the code is available at https://opensource.umr-cnrm.fr/projects/snowtools_git/wiki/Procedure_for_new_users (Lafaysse et al., 2023). The version used is labeled as s2m_reanalysis_2020.2. The configuration of the ensemble of models used is described in detail in Lafaysse et al. (2017).
The meteorological data used to drive snow simulations are available at https://doi.org/10.25326/37 Vernay et al. (2020). Processed data are available upon request to the corresponding author.
OD, LVG, FT and MD designed and wrote the study. OD, LVG, FT and MF ran the simulations. ML and PH participated to the data analysis, and BR provided the data analysis with an alternative stability indicator. All authors contributed to writing and commenting on the manuscript.
At least one of the (co-)authors is a member of the editorial board of The Cryosphere. The peer-review process was guided by an independent editor, and the authors also have no other competing interests to declare.
Publisher’s note: Copernicus Publications remains neutral with regard to jurisdictional claims in published maps and institutional affiliations.
CNRM/CEN is part of Labex OSUG@2020. Marie Dumont and François Tuzet have received funding from the European Research Council (ERC) under the European Union's Horizon 2020 research and innovation program (IVORI; grant no. 949516). This work was partly funding by ANR JCJ EBONI (ANR-16-CE01-0006) and APR CNES MIOSOTIS.
This research has been supported by the Agence Nationale de la Recherche (grant no. ANR-16-CE01-0006), the Centre National d'Études Spatiales (grant no. APR MIOSOTIS), and the H2020 European Research Council (grant no. 949516).
This paper was edited by Jürg Schweizer and reviewed by Kevin Hammonds and Ingrid Reiweger.
Barkan, J., Kutiel, H., Alpert, P., and Kishcha, P.: Synoptics of dust intrusion days from the African continent into the Atlantic Ocean, J. Geophys. Res, 109, D8, https://doi.org/10.1029/2003JD004416, 2004. a
Barkan, J., Alpert, P., Kutiel, H., and Kishcha, P.: Synoptics of dust transportation days from Africa toward Italy and central Europe, J. Geophys. Res., 110, D7, https://doi.org/10.1029/2004JD005222, 2005. a
Birkeland, K. W., Johnson, R. F., and Schmidt, D. S.: Near-surface faceted crystals formed by diurnal recrystallization: A case study of weak layer formation in the mountain snowpack and its contribution to snow avalanches, Arctic Alpine Res., 30, 200–204, 1998. a
Brun, E., Martin, E., Simon, V., Gendre, C., and Coleou, C.: An energy and mass model of snow cover suitable for operational avalanche forecasting, J. Glaciol., 35, 333–342, 1989. a
Charrois, L., Cosme, E., Dumont, M., Lafaysse, M., Morin, S., Libois, Q., and Picard, G.: On the assimilation of optical reflectances and snow depth observations into a detailed snowpack model, The Cryosphere, 10, 1021–1038, https://doi.org/10.5194/tc-10-1021-2016, 2016. a
Chomette, L., Bacardit, M., Gavaldà, J., Dumont, M., Tuzet, F., and Moner, I.: Effects of Saharan dust outbreaks on the snow stability in the Pyrenees, in: Proceedings of the International Snow Science Workshop (ISSW), Breckenridge, Colorado, 3–7 October 2016. a, b, c, d, e, f, g, h
Colbeck, S. C. and Jamieson, J. B.: The formation of faceted layers above crusts, Cold Reg. Sci. Technol., 33, 247–252, 2001. a, b
Doherty, S. J., Grenfell, T. C., Forsström, S., Hegg, D. L., Brandt, R. E., and Warren, S. G.: Observed vertical redistribution of black carbon and other insoluble light-absorbing particles in melting snow, J. Geophys. Res.-Atmos., 118, 5553–5569, 2013. a
Drugé, T.: Contribution des aérosols aux scénarios climatiques en Méditerranée pour le XXIème siècle à l'échelle régionale, Theses, Université Toulouse 3 – Paul Sabatier, https://www.theses.fr/2019TOU30328, 2019. a
Dumont, M., Tuzet, F., Gascoin, S., Picard, G., Kutuzov, S., Lafaysse, M., Cluzet, B., Nheili, R., and Painter, T.: Accelerated Snow Melt in the Russian Caucasus Mountains After the Saharan Dust Outbreak in March 2018, J. Geophys. Res.-Earth, 125, e2020JF005641, https://doi.org/10.1029/2020JF005641, 2020. a
Essery, R.: Large-scale simulations of snow albedo masking by forests, Geophys. Res. Lett., 40, 5521–5525, https://doi.org/10.1002/grl.51008, 2013. a
Fierz, C., Armstrong, R. L., Durand, Y., Etchevers, P., Greene, E., McClung, D. M., and Sokratov, S. A.: The international classification of seasonal snow on the ground, Hydrology, 2009. a, b, c
Föhn, P. M.: The stability index and various triggering mechanisms, IAHS-AISH P., 162, 195–214, 1987. a
Francis, D., Eayrs, C., Chaboureau, J.-P., Mote, T., and Holland, D. M.: Polar jet associated circulation triggered a Saharan cyclone and derived the poleward transport of the African dust generated by the cyclone, J. Geophys. Res.-Atmos., 123, 11–899, 2018. a
Giraud, G.: MEPRA : an expert system for avalanche risk forecasting, in: Proceedings of the International snow science workshop, Breckenridge, Colorado, 4–8 October 1992, 97–106, 1992. a
Giraud, G., Navarre, J.-P., and Coléou, C.: Estimation du risque avalancheux dans le système expert MEPRA, Tech. rep., CNRM – Centre national de recherches météorologiques, unpublished work, 2002. a, b, c
Greilinger, M. and Kasper-Giebl, A.: Saharan Dust Records and Its Impact in the European Alps, in: Oxford Research Encyclopedia of Climate Science, Oxford University Press, https://doi.org/10.1093/acrefore/9780190228620.013.827, 2021. a
Hadley, O. L. and Kirchstetter, T. W.: Black-carbon reduction of snow albedo, Nat. Clim. Change, 2, 437–440, 2012. a
Hagenmuller, P., Flin, F., Dumont, M., Tuzet, F., Peinke, I., Lapalus, P., Dufour, A., Roulle, J., Pézard, L., Voisin, D., Ando, E., Rolland du Roscoat, S., and Charrier, P.: Motion of dust particles in dry snow under temperature gradient metamorphism, The Cryosphere, 13, 2345–2359, https://doi.org/10.5194/tc-13-2345-2019, 2019. a
Hammonds, K. and Baker, I.: The effects of Ca++ on the strength of polycrystalline ice, J. Glaciol., 62, 954–962, https://doi.org/10.1017/jog.2016.84, 2016. a, b
Hammonds, K., Lieb-Lappen, R., Baker, I., and Wang, X.: Investigating the thermophysical properties of the ice–snow interface under a controlled temperature gradient: Part I: Experiments & Observations, Cold Reg. Sci. Technol., 120, 157–167, https://doi.org/10.1016/j.coldregions.2015.09.006, 2015. a, b, c
Hansen, J. and Nazarenko, L.: Soot climate forcing via snow and ice albedos, P. Natl. Acad. Sci. USA, 101, 423–8, https://doi.org/10.1073/pnas.2237157100, 2003. a
Jamieson, B.: Formation of refrozen snowpack layers and their role in slab avalanche release, Rev. Geophys., 44, 2, https://doi.org/10.1029/2005RG000176, 2006. a, b, c, d, e
Jamieson, B., Geldsetzer, T., and Stethem, C.: Forecasting for deep slab avalanches, Cold Reg. Sci. Technol., 33, 275–290, 2001. a
Knippertz, P. and Todd, M. C.: Mineral dust aerosols over the Sahara: Meteorological controls on emission and transport and implications for modeling, Rev. Geophys., 50, 1, https://doi.org/10.1029/2011RG000362, 2012. a
Krinner, G., Derksen, C., Essery, R., Flanner, M., Hagemann, S., Clark, M., Hall, A., Rott, H., Brutel-Vuilmet, C., Kim, H., Ménard, C. B., Mudryk, L., Thackeray, C., Wang, L., Arduini, G., Balsamo, G., Bartlett, P., Boike, J., Boone, A., Chéruy, F., Colin, J., Cuntz, M., Dai, Y., Decharme, B., Derry, J., Ducharne, A., Dutra, E., Fang, X., Fierz, C., Ghattas, J., Gusev, Y., Haverd, V., Kontu, A., Lafaysse, M., Law, R., Lawrence, D., Li, W., Marke, T., Marks, D., Ménégoz, M., Nasonova, O., Nitta, T., Niwano, M., Pomeroy, J., Raleigh, M. S., Schaedler, G., Semenov, V., Smirnova, T. G., Stacke, T., Strasser, U., Svenson, S., Turkov, D., Wang, T., Wever, N., Yuan, H., Zhou, W., and Zhu, D.: ESM-SnowMIP: assessing snow models and quantifying snow-related climate feedbacks, Geosci. Model Dev., 11, 5027–5049, https://doi.org/10.5194/gmd-11-5027-2018, 2018. a
Lafaysse, M., Cluzet, B., Dumont, M., Lejeune, Y., Vionnet, V., and Morin, S.: A multiphysical ensemble system of numerical snow modelling, The Cryosphere, 11, 1173–1198, https://doi.org/10.5194/tc-11-1173-2017, 2017. a, b, c, d, e
Lafaysse, M., Fructus, M., Vernay, M., Radanovics, S., Dumont, M., and Viallon-Galinier, L.: Procedure for new users of Crocus model, [code], https://opensource.umr-cnrm.fr/projects/snowtools_git/wiki/Procedure_for_new_users, last access: 1 February 2023. a
Landry, C. C.: Desert dust and snow stability, in: Proceedings ISSW 2014, 556–563, International Snow Science Workshop, 28 September–3 October 2014, Banff, Alberta, Canada, 2014. a, b, c, d, e, f, g, h, i, j, k, l, m, n, o, p, q
Libois, Q., Picard, G., France, J. L., Arnaud, L., Dumont, M., Carmagnola, C. M., and King, M. D.: Influence of grain shape on light penetration in snow, The Cryosphere, 7, 1803–1818, https://doi.org/10.5194/tc-7-1803-2013, 2013. a
Liu, E., Cashman, K., Beckett, F., Witham, C., Leadbetter, S., Hort, M., and Guðmundsson, S.: Ash mists and brown snow: Remobilization of volcanic ash from recent Icelandic eruptions, J. Geophys. Res.-Atmos., 119, 9463–9480, 2014. a
Meinander, O., Kontu, A., Virkkula, A., Arola, A., Backman, L., Dagsson-Waldhauserová, P., Järvinen, O., Manninen, T., Svensson, J., de Leeuw, G., and Leppäranta, M.: Brief communication: Light-absorbing impurities can reduce the density of melting snow, The Cryosphere, 8, 991–995, https://doi.org/10.5194/tc-8-991-2014, 2014. a, b
Mitterer, C., Techel, F., Fierz, C., and Schweizer, J.: An operational supporting tool for assessing wet-snow avalanche danger, in: Proceedings ISSW 2013, 33, 334–338, International Snow Science Workshop, 7–11 October 2013, Grenoble, France, 2013. a
Mitterer, C., Heilig, A., Schmid, L., van Herwijnen, A., Eisen, O., and Schweizer, J.: Comparison of measured and modelled snow cover liquid water content to improve local wet-snow avalanche prediction, International Snow Science Workshop Proceedings, Squaw Valley, CA, 17–22 October 2016. a, b, c
Morin, S., Horton, S., Techel, F., Bavay, M., Coléou, C., Fierz, C., Gobiet, A., Hagenmuller, P., Lafaysse, M., Ližar, M., Mitterer, C., Monti, F., Müller, K., Olefs, M., Snook, J. S., van Herwijnen, A., and Vionnet, V.: Application of physical snowpack models in support of operational avalanche hazard forecasting: A status report on current implementations and prospects for the future, Cold Reg. Sci. Technol., 170, 102910, https://doi.org/10.1016/j.coldregions.2019.102910, 2020. a, b, c
Möhler, O., Field, P. R., Connolly, P., Benz, S., Saathoff, H., Schnaiter, M., Wagner, R., Cotton, R., Krämer, M., Mangold, A., and Heymsfield, A. J.: Efficiency of the deposition mode ice nucleation on mineral dust particles, Atmos. Chem. Phys., 6, 3007–3021, https://doi.org/10.5194/acp-6-3007-2006, 2006. a
Nabat, P., Somot, S., Mallet, M., Sanchez-Lorenzo, A., and Wild, M.: Contribution of anthropogenic sulfate aerosols to the changing Euro-Mediterranean climate since 1980, Geophys. Res. Lett., 41, 5605–5611, https://doi.org/10.1002/2014GL060798, 2014. a
Painter, T., Barrett, A., Landry, C., Neff, J., Cassidy, M., Lawrence, C., Mcbride, K., and Farmer, L.: Impact of disturbed desert soil on duration of mountain snow cover, Geophys. Res. Lett, 34, L12502, https://doi.org/10.1029/2007GL030284, 2007. a
Painter, T., Bryant, A., and Skiles, S. M.: Radiative forcing by light absorbing impurities in snow from MODIS surface reflectance data, Geophys. Res. Lett., 39, L17502, https://doi.org/10.1029/2012GL052457, 2012. a
Raleigh, M., Livneh, B., Lapo, K., and Lundquist, J.: How Does Availability of Meteorological Forcing Data Impact Physically Based Snowpack Simulations?, J. Hydrometeorol., 17, 150904104740009, https://doi.org/10.1175/JHM-D-14-0235.1, 2015. a
Remias, D., Albert, A., and Lütz, C.: Effects of realistically simulated, elevated UV irradiation on photosynthesis and pigment composition of the alpine snow alga Chlamydomonas nivalis and the arctic soil alga Tetracystis sp.(Chlorophyceae), Photosynthetica, 48, 269–277, 2010. a
Reuter, B. and Schweizer, J.: The effect of surface warming on slab stiffness and the fracture behavior of snow, Cold Reg. Sci. Technol., 83–84, 30–36, https://doi.org/10.1016/j.coldregions.2012.06.001, 2012. a
Reuter, B., Viallon-Galinier, L., Horton, S., van Herwijnen, A., Mayer, S., Hagenmuller, P., and Morin, S.: Characterizing snow instability with avalanche problem types derived from snow cover simulations, Cold Reg. Sci. Technol., 194, 103462, https://doi.org/10.1016/j.coldregions.2021.103462, 2022. a
Réveillet, M., Tuzet, F., Dumont, M., Gascoin, S., Arnaud, L., Bonnefoy, M., Carmagnola, C., Deguine, A., Evrard, O., Flin, F., Fontaine, F., Gandois, L., Hagenmuller, P., Herbin, H., Josse, B., Lafaysse, M., Le Roux, G., Morin, S., Nabat, P., Petitprez, D., Picard, G., Robledano, A., Schneebeli, M., Six, D., Thibert, E., Vernay, M., Viallon-Galinier, L., Voiron, C., and Voisin, D.: Dépôts massifs de poussières sahariennes sur le manteau neigeux dans les Alpes et les Pyrénées du 5 au 7 février 2021 : Contexte, enjeux et résultats préliminaires Version du 3 mai 2021, Technical report, CNRM, Université de Toulouse, Météo-France, CNRS, https://hal.science/hal-03216273, 2021. a, b, c, d, e, f
Réveillet, M., Dumont, M., Gascoin, S., Lafaysse, M., Nabat, P., Ribes, A., Nheili, R., Tuzet, F., Ménégoz, M., Morin, S., Picard, G., and Ginoux, P.: Black carbon and dust alter the response of mountain snow cover under climate change, Nat. Commun., 13, 5279, https://doi.org/10.1038/s41467-022-32501-y, 2022. a
Schweizer, J., Jamieson, J., and Schneebeli, M.: Snow avalanche formation, Rev. Geophys., 41, 4/1016, https://doi.org/10.1029/2002RG000123, 2003. a
Schweizer, J., Reuter, B., Van Herwijnen, A., and Gaume, J.: Avalanche release 101, in: Proceedings ISSW 2016, 1–11, International Snow Science Workshop, Breckenridge CO, USA, 3–7 October 2016. a
Schweizer, J., Bartelt, P., and van Herwijnen, A.: Snow avalanches, in: Snow and ice-related hazards, risks, and disasters, 377–416, Elsevier, https://doi.org/10.1016/B978-0-12-394849-6.00012-3, 2021. a
Seidel, F. C., Rittger, K., Skiles, S. M., Molotch, N. P., and Painter, T. H.: Case study of spatial and temporal variability of snow cover, grain size, albedo and radiative forcing in the Sierra Nevada and Rocky Mountain snowpack derived from imaging spectroscopy, The Cryosphere, 10, 1229–1244, https://doi.org/10.5194/tc-10-1229-2016, 2016. a
Skiles, M. and Painter, T.: Daily evolution in dust and black carbon content, snow grain size, and snow albedo during snowmelt, Rocky Mountains, Colorado, J. Glaciol., 63, 118–132, https://doi.org/10.1017/jog.2016.125, 2016. a
Skiles, M. and Painter, T.: Assessment of Radiative Forcing by Light-Absorbing Particles in Snow from In Situ Observations with Radiative Transfer Modeling, J. Hydrometeorol., 19, 1397–1409, https://doi.org/10.1175/JHM-D-18-0072.1, 2018. a, b
Skiles, M. and Painter, T.: Toward Understanding Direct Absorption and Grain Size Feedbacks by Dust Radiative Forcing in Snow With Coupled Snow Physical and Radiative Transfer Modeling, Water Resour. Res., 55, 7362–7378, https://doi.org/10.1029/2018WR024573, 2019. a
Thumlert, S. and Jamieson, B.: Stress measurements in the snow cover below localized dynamic loads, Cold Reg. Sci. Technol., 106–107, 28–35, https://doi.org/10.1016/j.coldregions.2014.06.002, 2014. a, b, c
Toepfer, S., Borgeson, L., Edgerly, B., Greene, E., Inglis, P., Morris, H., Sawtell, B., and Sterbenz, C.: The spatial distribution and impact on avalanche conditions of a dust-on-snow event in the Colorado Rocky Mountains, in: International Snow Science Workshop, Telluride, Colorado, 1-6 October 2006, 913–916, 2006. a
Tuzet, F., Dumont, M., Lafaysse, M., Picard, G., Arnaud, L., Voisin, D., Lejeune, Y., Charrois, L., Nabat, P., and Morin, S.: A multilayer physically based snowpack model simulating direct and indirect radiative impacts of light-absorbing impurities in snow, The Cryosphere, 11, 2633–2653, https://doi.org/10.5194/tc-11-2633-2017, 2017. a, b, c
Tuzet, F., Dumont, M., Picard, G., Lamare, M., Voisin, D., Nabat, P., Lafaysse, M., Larue, F., Revuelto, J., and Arnaud, L.: Quantification of the radiative impact of light-absorbing particles during two contrasted snow seasons at Col du Lautaret (2058 m a.s.l., French Alps), The Cryosphere, 14, 4553–4579, https://doi.org/10.5194/tc-14-4553-2020, 2020. a, b
Varga, G.: Changing nature of Saharan dust deposition in the Carpathian Basin (Central Europe): 40 years of identified North African dust events (1979–2018), Environ. Int., 139, 105712, https://doi.org/10.1016/j.envint.2020.105712, 2020. a
Vernay, M., Lafaysse, M., Hagenmuller, P., Nheili, R., Verfaillie, D., and Morin, S.: The S2M meteorological and snow cover reanalysis in the French mountainous areas (1958–present), version 2020.2, AERIS [data set], https://doi.org/10.25326/37, 2020. a
Vernay, M., Lafaysse, M., Monteiro, D., Hagenmuller, P., Nheili, R., Samacoïts, R., Verfaillie, D., and Morin, S.: The S2M meteorological and snow cover reanalysis over the French mountainous areas: description and evaluation (1958–2021), Earth Syst. Sci. Data, 14, 1707–1733, https://doi.org/10.5194/essd-14-1707-2022, 2022. a, b
Viallon-Galinier, L., Hagenmuller, P., Reuter, B., and Eckert, N.: Modelling snowpack stability from simulated snow stratigraphy: Summary and implementation examples, Cold Reg. Sci. Technol., 201, 103596, https://doi.org/10.1016/j.coldregions.2022.103596, 2022. a, b
Vionnet, V., Brun, E., Morin, S., Boone, A., Faroux, S., Le Moigne, P., Martin, E., and Willemet, J.-M.: The detailed snowpack scheme Crocus and its implementation in SURFEX v7.2, Geosci. Model Dev., 5, 773–791, https://doi.org/10.5194/gmd-5-773-2012, 2012. a, b
Wever, N., Vera Valero, C., and Techel, F.: Coupled Snow Cover and Avalanche Dynamics Simulations to Evaluate Wet Snow Avalanche Activity, J. Geophys. Res.-Earth, 123, 1772–1796, https://doi.org/10.1029/2017JF004515, 2018. a
Wiscombe, W. and Warren, S.: A Model for the Spectral Albedo of Snow. I: Pure Snow, J. Atmos. Sci., 37, 2712–2733, https://doi.org/10.1175/1520-0469(1980)037<2712:AMFTSA>2.0.CO;2, 1980. a
Zhao, C., Hu, Z., Qian, Y., Ruby Leung, L., Huang, J., Huang, M., Jin, J., Flanner, M. G., Zhang, R., Wang, H., Yan, H., Lu, Z., and Streets, D. G.: Simulating black carbon and dust and their radiative forcing in seasonal snow: a case study over North China with field campaign measurements, Atmos. Chem. Phys., 14, 11475–11491, https://doi.org/10.5194/acp-14-11475-2014, 2014. a