the Creative Commons Attribution 4.0 License.
the Creative Commons Attribution 4.0 License.
 | 31 Mar 2023
Recent changes in drainage route and outburst magnitude of the Russell Glacier ice-dammed lake, West Greenland
Kristian K. Kjeldsen
Flora Huiban
Jonathan L. Carrivick
Shfaqat A. Khan
Anders A. Bjørk
Glacial lake outburst floods (GLOFs) or jökulhlaups from ice-dammed lakes are frequent in Greenland and can influence local ice dynamics and bedrock motion, cause geomorphological changes, and pose flooding hazards. Multidecadal time series of lake drainage dates, volumes, and flood outlets are extremely rare. However, they are essential for determining the scale and frequency of future GLOFs, for identifying drainage mechanisms, and for mitigating downstream flood effects. In this study, we use high-resolution digital elevation models (DEMs) and orthophotos (0.1 × 0.1 m) generated from uncrewed-aerial-vehicle (UAV) field surveys, in combination with optical satellite imagery. This allows us to reconstruct robust lake volume changes associated with 14 GLOFs between 2007 and 2021 at Russell Glacier, West Greenland. As a result, this is one of the most comprehensive and longest records of ice-dammed lake drainages in Greenland to date. Importantly, we find a mean difference of ∼ 10 % between our lake drainage volumes when compared with estimates derived from a gauged hydrograph 27 km downstream. Due to thinning of the local ice dam, the potential maximum drainage volume in 2021 is ∼ 60 % smaller than that estimated to have drained in 2007. Our time series also reveals variations in the drainage dates ranging from late May to mid-September and drainage volumes ranging between 0.9 and 37.7 Mm3. We attribute these fluctuations between short periods of relatively high and low drainage volumes to a weakening of the ice dam and an incomplete sealing of the englacial tunnel following the large GLOFs. This syphoning drainage mechanism is triggered by a reduction in englacial meltwater, likely driven by late-season drainage and sudden air temperature reductions, as well as annual variations in the glacial drainage system. Furthermore, we provide geomorphological evidence of an additional drainage route first observed following the 2021 GLOF, with a subglacial or englacial flow pathway, as well as supraglacial water flow across the ice margin. It seems probable that the new drainage route will become dominant in the future. This will drive changes in the downstream geomorphology and raise the risk of flooding-related hazards as the existing buffering outlet lakes will be bypassed.
- Article
(9534 KB) - Full-text XML
- BibTeX
- EndNote


Ice-dammed lakes can form either in supraglacial, subglacial, or ice-marginal positions (Tweed and Russell, 1999). Globally, proglacial lakes (including ice-marginal lakes) contain up to 0.43 mm of sea level equivalent (Shugar et al., 2020), and recent studies show that ice-marginal lakes in Greenland have increased in both number and size (Carrivick and Quincey, 2014; Shugar et al., 2020). Currently, there are more than 3300 ice-marginal lakes in Greenland. These are predominately found around peripheral mountain glaciers and ice caps (PGICs) as well as along the southwest Greenland ice sheet (GrIS) margin (Carrivick et al., 2022; How et al., 2021). The outflow of ice-dammed lakes can vary substantially from a gradual near-steady discharge to sudden outburst floods called jökulhlaups or glacial lake outburst floods (GLOFs) (Tweed and Russell, 1999). Several mechanisms have been proposed for the rapid drainage of ice-dammed lakes, and due to changes in lake inputs and topographic settings, drainages at the same lake may occur in response to different trigger mechanisms (Tweed and Russell, 1999). Sudden drainage of water from ice-dammed lakes in Greenland can have implications for fjord circulation (Kjeldsen et al., 2014), affect local ice dynamics (e.g. Kjeldsen et al., 2017; Sugiyama et al., 2007), cause bedrock displacements (Furuya and Wahr, 2005; Kjeldsen et al., 2017), alter downstream geomorphology (Russell et al., 2011), and have severe societal impacts (Carrivick and Tweed, 2016).
Carrivick and Tweed (2019) review the status of knowledge on GLOFs and ice-dammed lake drainages in Greenland and show that continuous multidecadal observations of transient lake water levels (i.e. pre- and post-drainage), lake drainage dates, and released flood volumes are extremely rare. Nevertheless, such time series are important for revealing spatio-temporal patterns in lake drainage and the timing and magnitude of flood events. Furthermore, long-term data improve our understanding of drainage triggers and mechanisms, provide important context for the scale and frequency of current and future GLOFs, and aid in the mitigation of downstream effects. The primary aim of this paper is to (re)calculate and analyse the lake water level and drainage volume of 14 historical GLOFs observed from 2007 to 2021. Secondly, we investigate geomorphological changes supporting a shift in the proglacial GLOF drainage route observed following the recent GLOF on 22 August 2021.
One of the most intensively monitored and widely studied ice-dammed lakes in Greenland is located on the northern flank of Russell Glacier in West Greenland (Fig. 1) (Carrivick et al., 2017; Lamsters et al., 2020; Mikkelsen et al., 2013; Russell, 1989, 2007; Russell et al., 2011), and so it is a key site for understanding GLOF behaviour. The lake is ∼ 0.7 km2 and drains through a ∼ 600 to 1000 m glacial tunnel in the southwestern part of the lake transporting water and sediment into two outlet lakes and further afield into the Watson River (Carrivick et al., 2013, 2018; Mernild and Hasholt, 2009; Russell, 1989, 2007; Russell et al., 2011). Based on aerial photographs, sedimentary data, and refill rates, the lake drained every 2 to 3 years from the 1950s until 1987, where it entered a 20-year stagnant period of stable water levels (Carrivick et al., 2018; Russell et al., 2011). On 31 August 2007, a new GLOF occurred (Russell et al., 2011) and the lake entered a new cycle of almost annual drainage events, with the last documented event happening in 2015 (Carrivick et al., 2017). Previous lake drainage events have been estimated using a variety of methods such as downstream gauged hydrographs, pressure transducers within the lake, time-lapse cameras, and differential GPS (dGPS) techniques to monitor water surface elevation (Carrivick et al., 2017; Mernild and Hasholt, 2009; Mikkelsen et al., 2013; Russell et al., 2011).
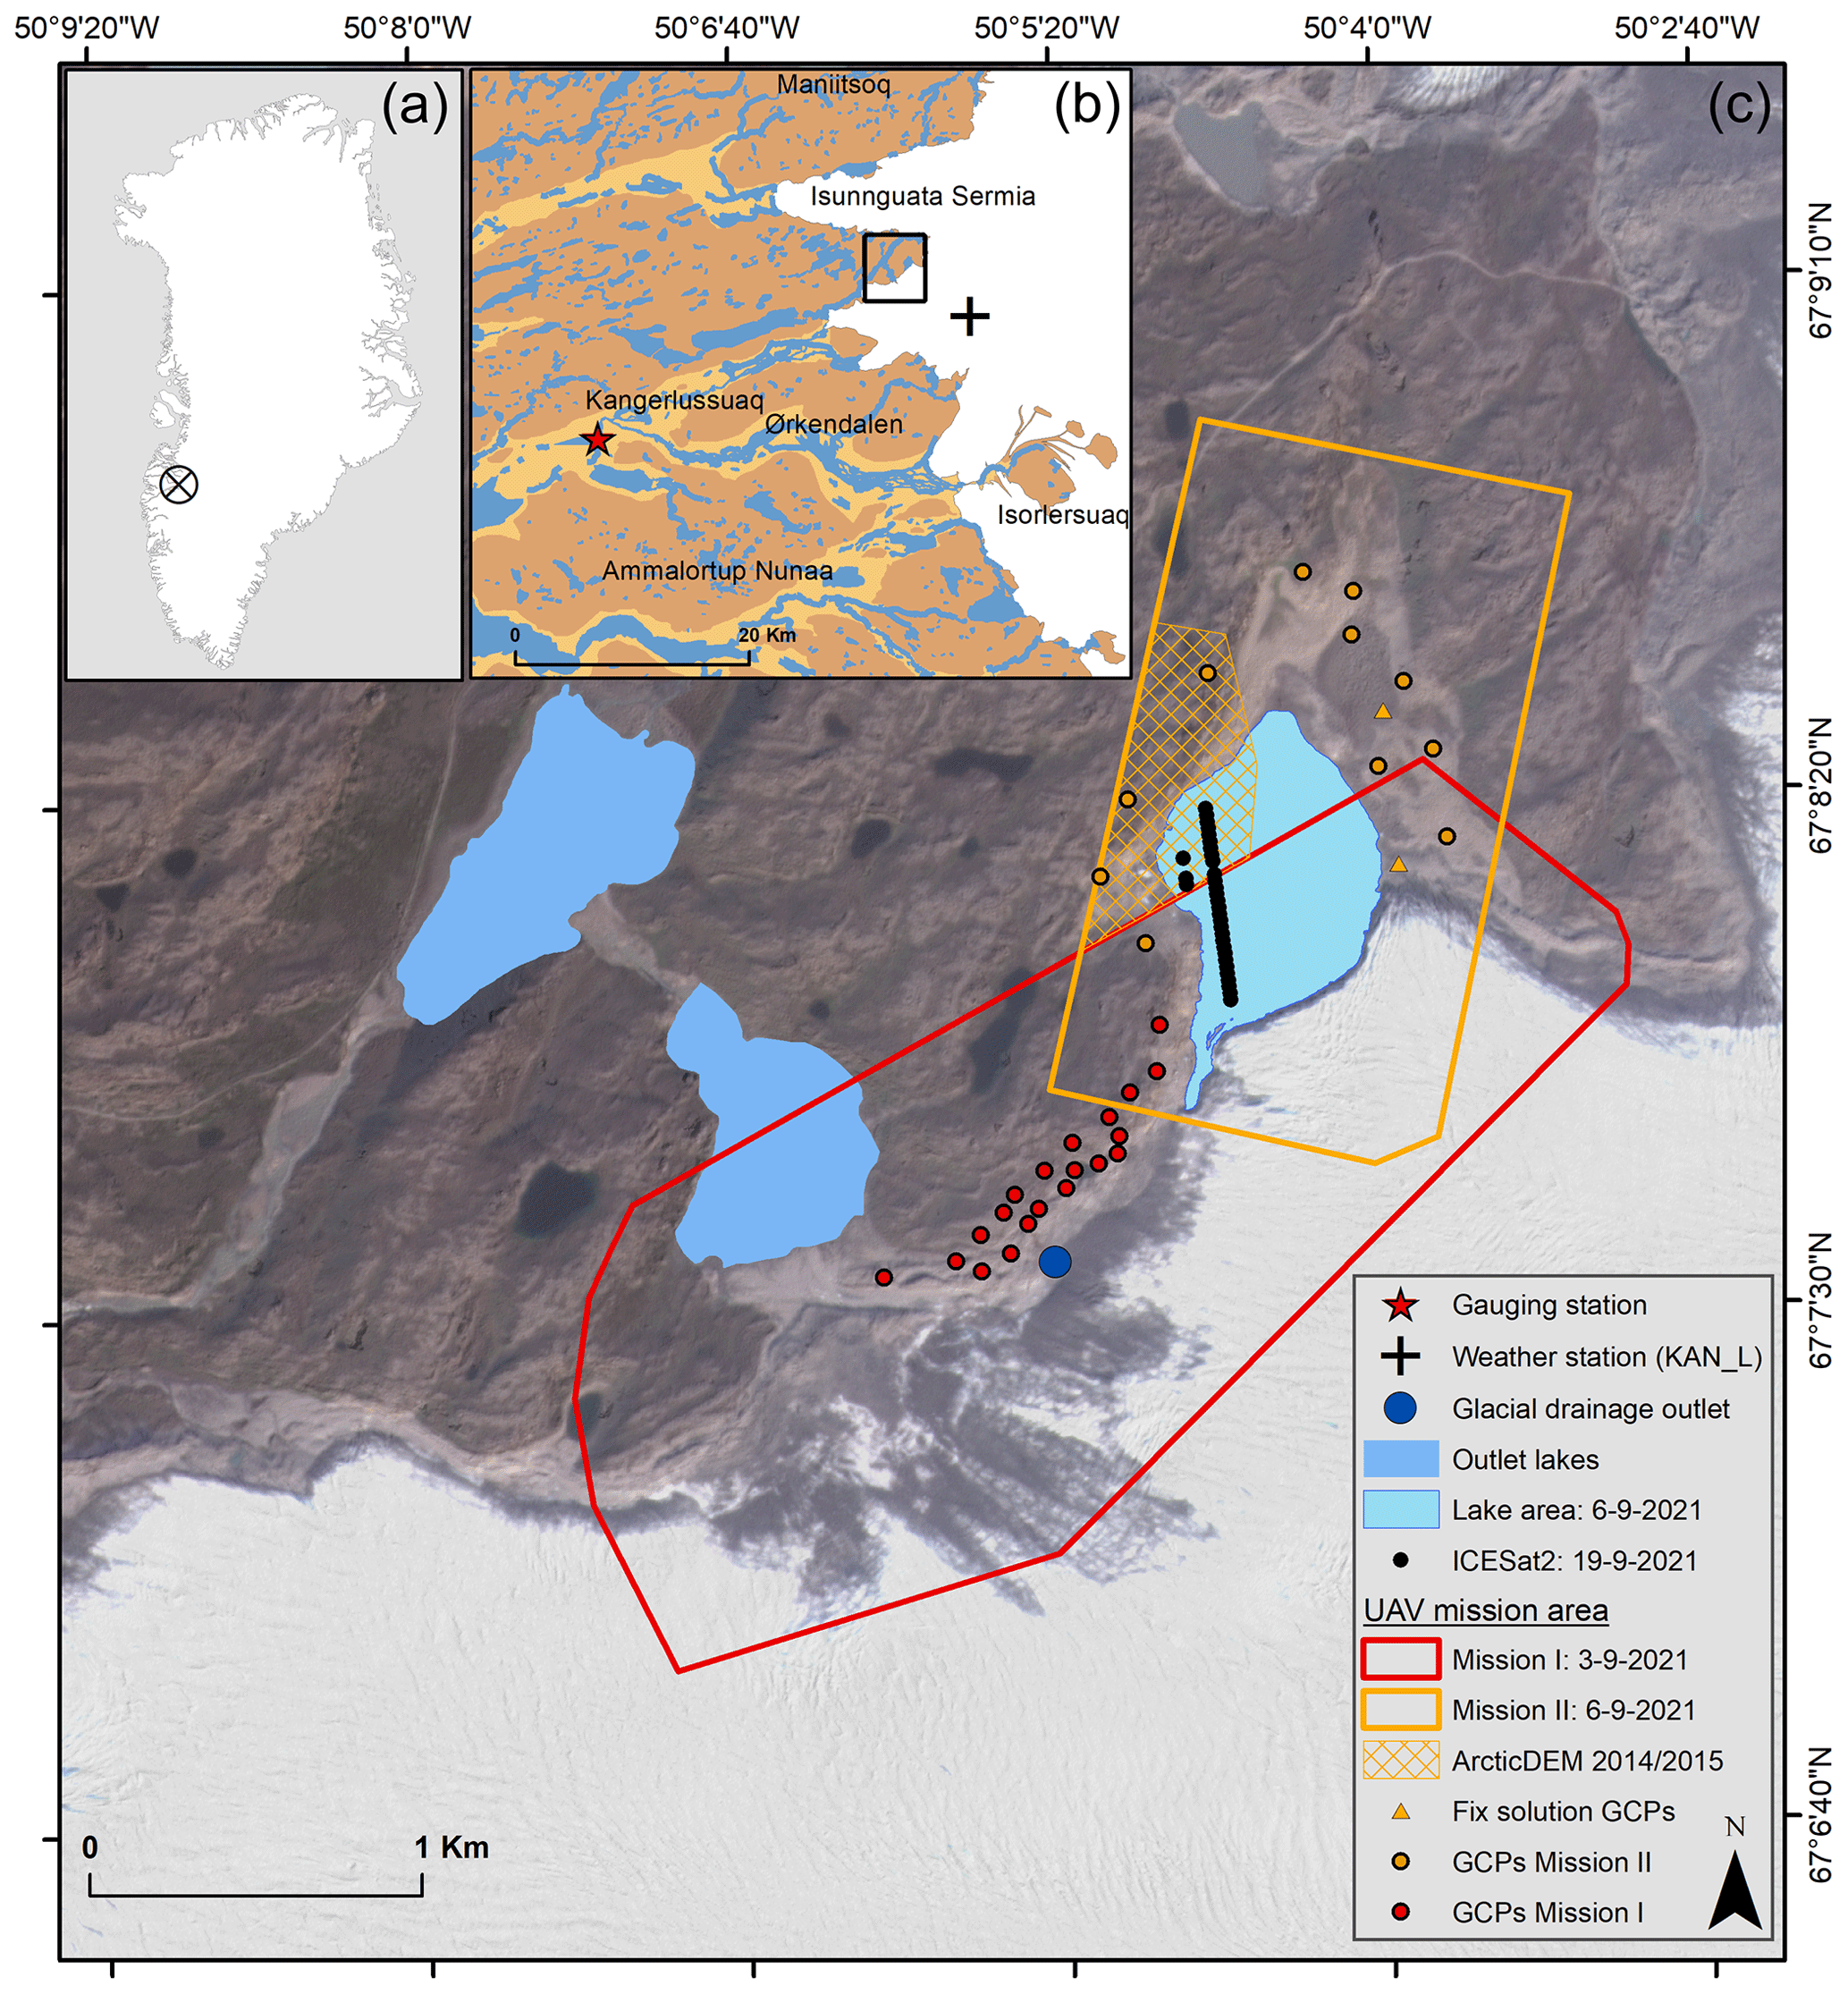
Figure 1(a) Study site location in Greenland. (b) Close-up of the study site with location of the gauging station and the PROMICE (Programme for Monitoring of the Greenland Ice Sheet) weather station. (c) UAV mission area I and II with location of GCPs overlaid on a four-band Planet Team (2017) acquisition from 23 August 2021. The yellow triangles illustrate the only two reliable fix solution GCPs. Due to image gaps at the western part of the lake, the produced UAV DEM is filled with elevation data from two ArcticDEMs acquired on 19 September 2014 and 2 August 2015.
Fieldwork at Russell Glacier was carried out between 3 and 6 September 2021, 2 weeks after a GLOF on 22 August 2021. Two uncrewed-aerial-vehicle (UAV) missions were undertaken to produce DEMs and orthophotos of the drained lake basin topography as well as the flood drainage route (Fig. 1). As the lake did not fully drain, we were unable to survey the entire lake topography; however, a standing water level of 408.8 m was surveyed in the lake, which is almost identical to the minimum lake levels observed after other previous GLOF events (Russell et al., 2011). Russell et al. (2011) produced a DEM of the lake basin bathymetry from interpolation of kinematic dGPS tracks surveyed in February 2008, finding a minimum elevation of 410 m. In this study, our UAV surveys enabled a highly accurate and high-resolution DEM without surface interpolation. From this DEM, we are able to precisely estimate the pre- and post-GLOF water level, the lake area, and the likely drainage volume of both historical and future events. All elevations are reported as height above the WGS84 ellipsoid, unless otherwise stated.
3.1 Aerial surveys
The UAV flights were conducted on two different dates using two different UAVs, due to the battery capacity and weather conditions (Table 1, Fig. 1):
Table 1Overview of the two UAV missions.
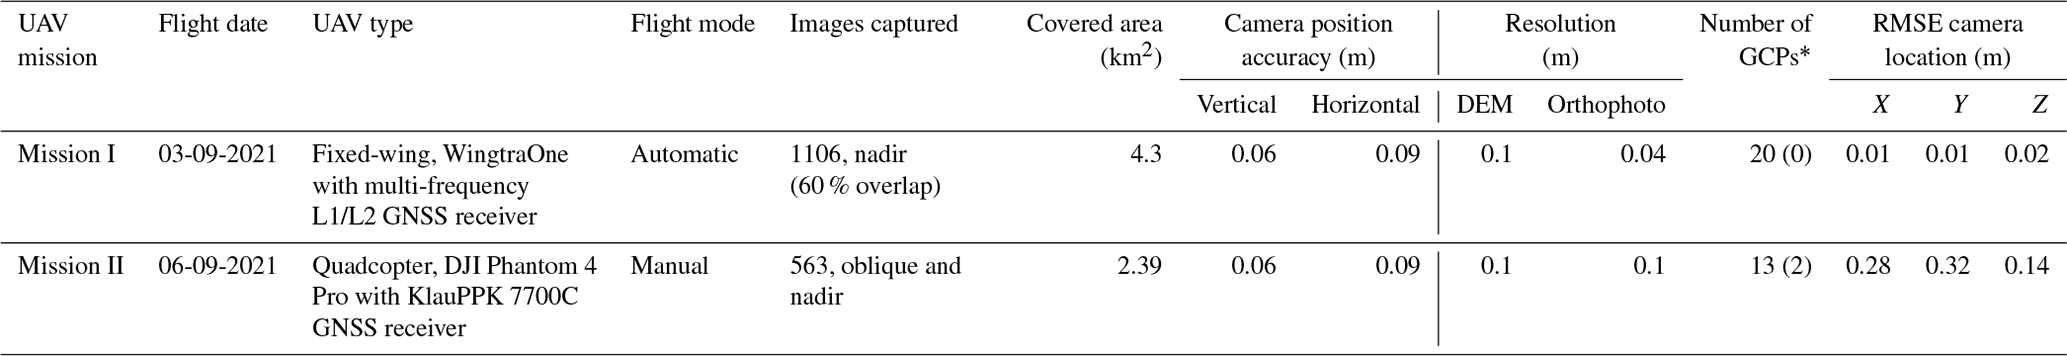
* Parentheses indicate the number of GCPs with a fix GNSS solution.
Both UAVs have direct georeferencing capabilities provided by an onboard GNSS receiver (Table 1), which records the positional data of each image as it is captured. To achieve centimetre-level accuracy in both the vertical and horizontal direction of the camera positions, we kinematically post-processed the positional data from the UAV GNSS receivers. Compared to real-time-kinematic (RTK) correction, post-processed-kinematic (PPK) positioning is considered more accurate and does not depend on a reliable real-time connection to a GNSS base station (Chudley et al., 2019). The UAV GNSS data were post-processed using WingtraHub (v. 2.2.0) and KlauPPK (v. 7.17) software relative to the fixed Greenland GPS Network (GNET) base station, located in Kangerlussuaq (KLSQ) approximately 30 km from the field site (Bevis et al., 2012). The processed camera position for both UAV surveys had a vertical and horizontal accuracy of ∼ 0.09 and 0.06 m, respectively (Table 1).
For the purpose of validating the accuracy of the produced DEMs, we placed a combined total of 33, 0.3 × 0.3 m black and white, ground control points (GCPs) and measured their position using an Emlid Reach RS2 GNSS receiver (Table 1). We post-processed the log files from the Emlid rover using Emlid Studio (v. 1.3) software and the KLSQ base station data. Due to poor satellite reception and cycle slips, we were only able to retrieve reliable fix solution position results for and GCPs in Mission I and Mission II, respectively (Table 1, Fig. 1).
3.2 Development and validation of DEMs and orthophotos
The UAV images were processed using a structure-from-motion (SfM) workflow in Agisoft Metashape Pro (v. 1.7.4). We follow the general processing workflow described in the official Agisoft guidelines (Agisoft LLC, 2020). The camera calibration was set as “precalibrated”, and the calibration parameters were set according to the calibration report of the camera used. Instead of GCPs, we used the post-processed, geolocated camera positions to georeference the point cloud. During the bundle adjustment, we performed a refined camera calibration, which is recommended when other variables are well constrained (Chudley et al., 2019). DEMs and orthomosaics for Mission I were then exported at resolutions of 0.1 and 0.04 m, respectively, while for Mission II both were exported at a resolution of 0.1 m (Table 1). The RMSE of the X, Y, and Z camera location, as reported in Agisoft Metashape after model generation, is 0.01, 0.01, and 0.02 m for Mission I and 0.28, 0.32, and 0.14 m for Mission II (Table 1). The large RMSE values of Mission II likely originate from strong wind conditions at the time of surveying, which may have caused the UAV to tilt or move slightly during image acquisition. In combination with the manual flight mode, this may have resulted in decreased image quality and a poor image overlap in specific regions, such as at the western part of the lake (Fig. 1). Furthermore, the majority of the acquired images were captured from an oblique viewing angle, which makes them computationally challenging to process compared to nadir images, due to geometric and photometric deformations caused by varying perspective and illumination conditions (Jiang et al., 2020).
Previous studies, using a similar setup and approach (Chudley et al., 2019; Jouvet et al., 2019) reported horizontal and vertical uncertainties in the range of 0.1–0.4 m, without the use of GCPs. By measuring the horizontal and vertical displacement between the two fix solution GCPs and their observed location in the Mission II orthomosaic and DEM, we estimated the accuracy to be 0.14 and 0.35 m, respectively. Due to a lack of reliable GCPs, we applied an additional method for determining the uncertainty. Inspired by similar studies (Chudley et al., 2019; Jouvet et al., 2019), we estimated the uncertainty by calculating the relative offset between the Mission I and Mission II DEM over stable bedrock, assuming no change in the topography. We applied the Python module PyBob (McNabb, 2019) based on the co-registration method developed by Nuth and Kääb (2011), which determines the X, Y, and Z offset from elevation difference residuals as well as the terrain's aspect and slope. The co-registration was based on >8 million pixels extracted from two areas of overlapping bedrock located on both the western and eastern part of lake. Using the Mission I DEM as the reference, we found a relative offset of m, Y=0.11 m, and Z=0.53 m and adopted this as our main measure of uncertainty. By applying this offset to the Mission II DEM, we were able to reduce the mean elevation difference and RMSE over stable bedrock from 0.39 to 0.00 m and 0.42 to 0.17 m, respectively. Following co-registration, we combined the Mission I and Mission II DEM into a mosaic.
Due to image gaps at the western part of the lake, we were not able to produce a complete UAV-derived DEM of the drained lake topography. Thus, the missing regions were filled with elevation data from two ArcticDEM strips acquired on 19 September 2014 and 2 August 2015, respectively (Fig. 1). The ArcticDEM strips have a resolution of 2 × 2 m and are based on photogrammetric processing of Worldview stereo-image pairs (Noh and Howat, 2015). At the time of acquisition, both ArcticDEMs had a standing water level of approximately 407 m. We predominately utilized the 2015 DEM as it was produced using images acquired only 5 d after the 2015 drainage event; however, it also contained several data gaps. Consequently, we filled these using the 2014 DEM, which was produced using images acquired 47 d after the 2014 drainage event. Prior to mosaicking, all DEMs were resampled to 0.1 m resolution and co-registered over solid bedrock using the Python module PyBob (McNabb, 2019).
Using the co-registered DEM mosaic, as well as the Mission II orthomosaic, we digitized lake area and extracted elevation points every 5 m along the digitized eastern lake margin to estimate a water level of 408.8 m ± 0.35 on 6 September 2021. Finally, all elevation data within the lake area were changed to 408.8 m to avoid erroneous elevation estimates on the water surface. From herein the final mosaicked and lake-burned DEM will be referred to as the 2021 post-drainage DEM. We validated the estimated water level by comparing it to 33 ICESat2 data points from 19 September 2021 measured at the ice-free lake interior (Fig. 1). The ICESat2 points have a mean water level of 408.70 m and a SD of 0.02 m.
3.3 Estimation of water level, lake area, and drainage volume
To estimate the lake water level at different temporal intervals we used satellite images from PlanetScope, Landsat 7 and 8, and Sentinel-2. The satellite images were manually georeferenced to the high-resolution UAV orthophotos to adjust for small offsets. Inspired by the approach of previous studies (e.g. Carrivick and Tweed, 2019) the pre- and post-drainage water level was determined by manually placing 30 points along the ∼ 600 m waterline on the eastern part of the lake as observed on the satellite images. The points were placed with an approximate spacing of 20 m; however, this varied depending on the visibility of the waterline as well as to avoid areas with apparent morphological changes. The eastern part was chosen as it only contains high-resolution (0.1 × 0.1 m) UAV-derived elevation pixels, as well as having a flat slope compared to the steep terrain in the west (Fig. A1). For each of the 30 points, we extracted the elevation from the 2021 post-drainage DEM and calculated the mean water level as well as the standard deviation indicating the uncertainty of the elevation estimate (Table 2). The mean water level was used to estimate the lake outline and area by masking out pixels above the mean water level as well as removing depressions not linked to the existing lake area. Using the estimated lake area and the 2021 post-drainage DEM, we calculated the pre- and post-drainage water volumes using Eq. (1):
where n denotes all pixels within the lake area, μwl denotes the mean water level, denotes the elevation of the pixel, and and denote the pixel resolution, which is 0.1 × 0.1 m. The total lake area change and water volume release of every GLOF was determined by extracting the pre- and post-drainage estimates (Table 2). As area and volume estimates were calculated relative to 6 September 2021 when images for the 2021 post-drainage DEM were acquired, they are sensitive to changes in the position of the ice margin. From 2007 to 2011 we observed a gradual advance of the margin, while from 2011 onwards it remained relatively stable, with only slight changes in frontal position observed (Fig. A2). To accommodate for the influence of the observed frontal advances from 2007 to 2011, we recalculated the lake area and volume changes of those years. For each year, we manually adjusted the lake area to match with the position of the ice margin, as observed in the respective satellite image. Finally, we recalculated the volume change of the adjusted lake area based on the estimated pre- and post-drainage level.
All drainage estimates from 2017–2021 are based on PlanetScope satellite images, whereas estimates of previous events are based on mainly panchromatic images from Landsat 7 and 8 with a resolution of 15 m as well as RGB images from Sentinel-2 with a resolution of 10 m (Table 2). In contrast to the relatively coarse (10 and 16 d) temporal coverage of the Landsat and Sentinel images, Planet images have a much finer spatial resolution of 3 m and a temporal resolution of approximately 1 d (Planet Team, 2017). This enables the detection of short-term changes in water level, albeit during clear-sky conditions.
3.4 Drainage routes
Based on the Mission I DEM we determined the main surface drainage routes for the 2021 GLOF event from the glacial drainage outlet (i) to the outlet lakes and (ii) across the ice margin. The drainages routes were calculated as the paths of least resistance from the source (drainage outlet) to the locations (i) and (ii), assuming that water is flowing to the neighbouring pixel with the lowest elevation. The calculations were based on a 2 × 2 m resampled version of the DEM to limit local elevation maxima from small surface features such as rocks and ice blocks that could potentially influence water flow. Finally, we generated points every 2 m along both of the estimated drainage routes and extracted the underlying elevations to determine the maximum elevation of each route.
3.5 Hydrograph volume estimation
We estimated the drainage volume from a gauging station deployed in Watson River at Kangerlussuaq, 27 km downstream of the lake (van As et al., 2017). Here, pressure transducers record changes in water pressure, which subsequently is corrected for atmospheric pressure before being converted into hourly averages in water level. Water discharge was then obtained using a rating curve, based on discharge measurements at various water levels (van As et al., 2017), and is associated with a conservative uncertainty value of 15 %. Due to diurnal fluctuation in discharge, we estimated the daily minima and maxima on the day of the drainage event by fitting a linear trend through the equivalent low and high stage values on the day before and after. This allowed estimates of the baseflow and thus estimates of the volume associated with lake drainage to be made.
3.6 Temperature data
Air temperature data were obtained from the KAN_L automatic weather station, part of the PROMICE automated weather station (AWS) network, which is located on the ice sheet at 670 m a.s.l., 18.5 km from the study site. We use hourly average data that are based on measurements recorded every 10 min (Fausto et al., 2021; GEUS Dataverse, 2022). For each of the analysed periods, the air temperature data contained no missing values.
4.1 Drainage volumes
Figure 2 illustrates how lake volume and area change with variations in water level, as calculated based on the 2021 post-drainage DEM. The lake has a theoretical maximum water level of 433 m, after which water overspills the ice dam, hereby indicating the elevation of the damming glacier. The 2021 theoretical water level maximum produces a lake surface area of 0.79 km2 and a maximum drainage volume of 14.3 Mm3, which is a 63 % decrease compared to the actual estimated drainage volume of the 2007 GLOF (Table 2). Moreover, we compared the theoretical maximum water level to the estimated 2007 pre-drainage water level of 453.1 m and found an ice dam lowering of at least 20.1 m. We were able to determine a theoretical maximum water level of 450 m from the 2015 ArcticDEM, which was 17 m higher than the 2021 level. Based on the present configuration of the lake and ice margin, the lake is not able to reach the 2007 maximum level as it would drain through the glacial conduit at a lower level.
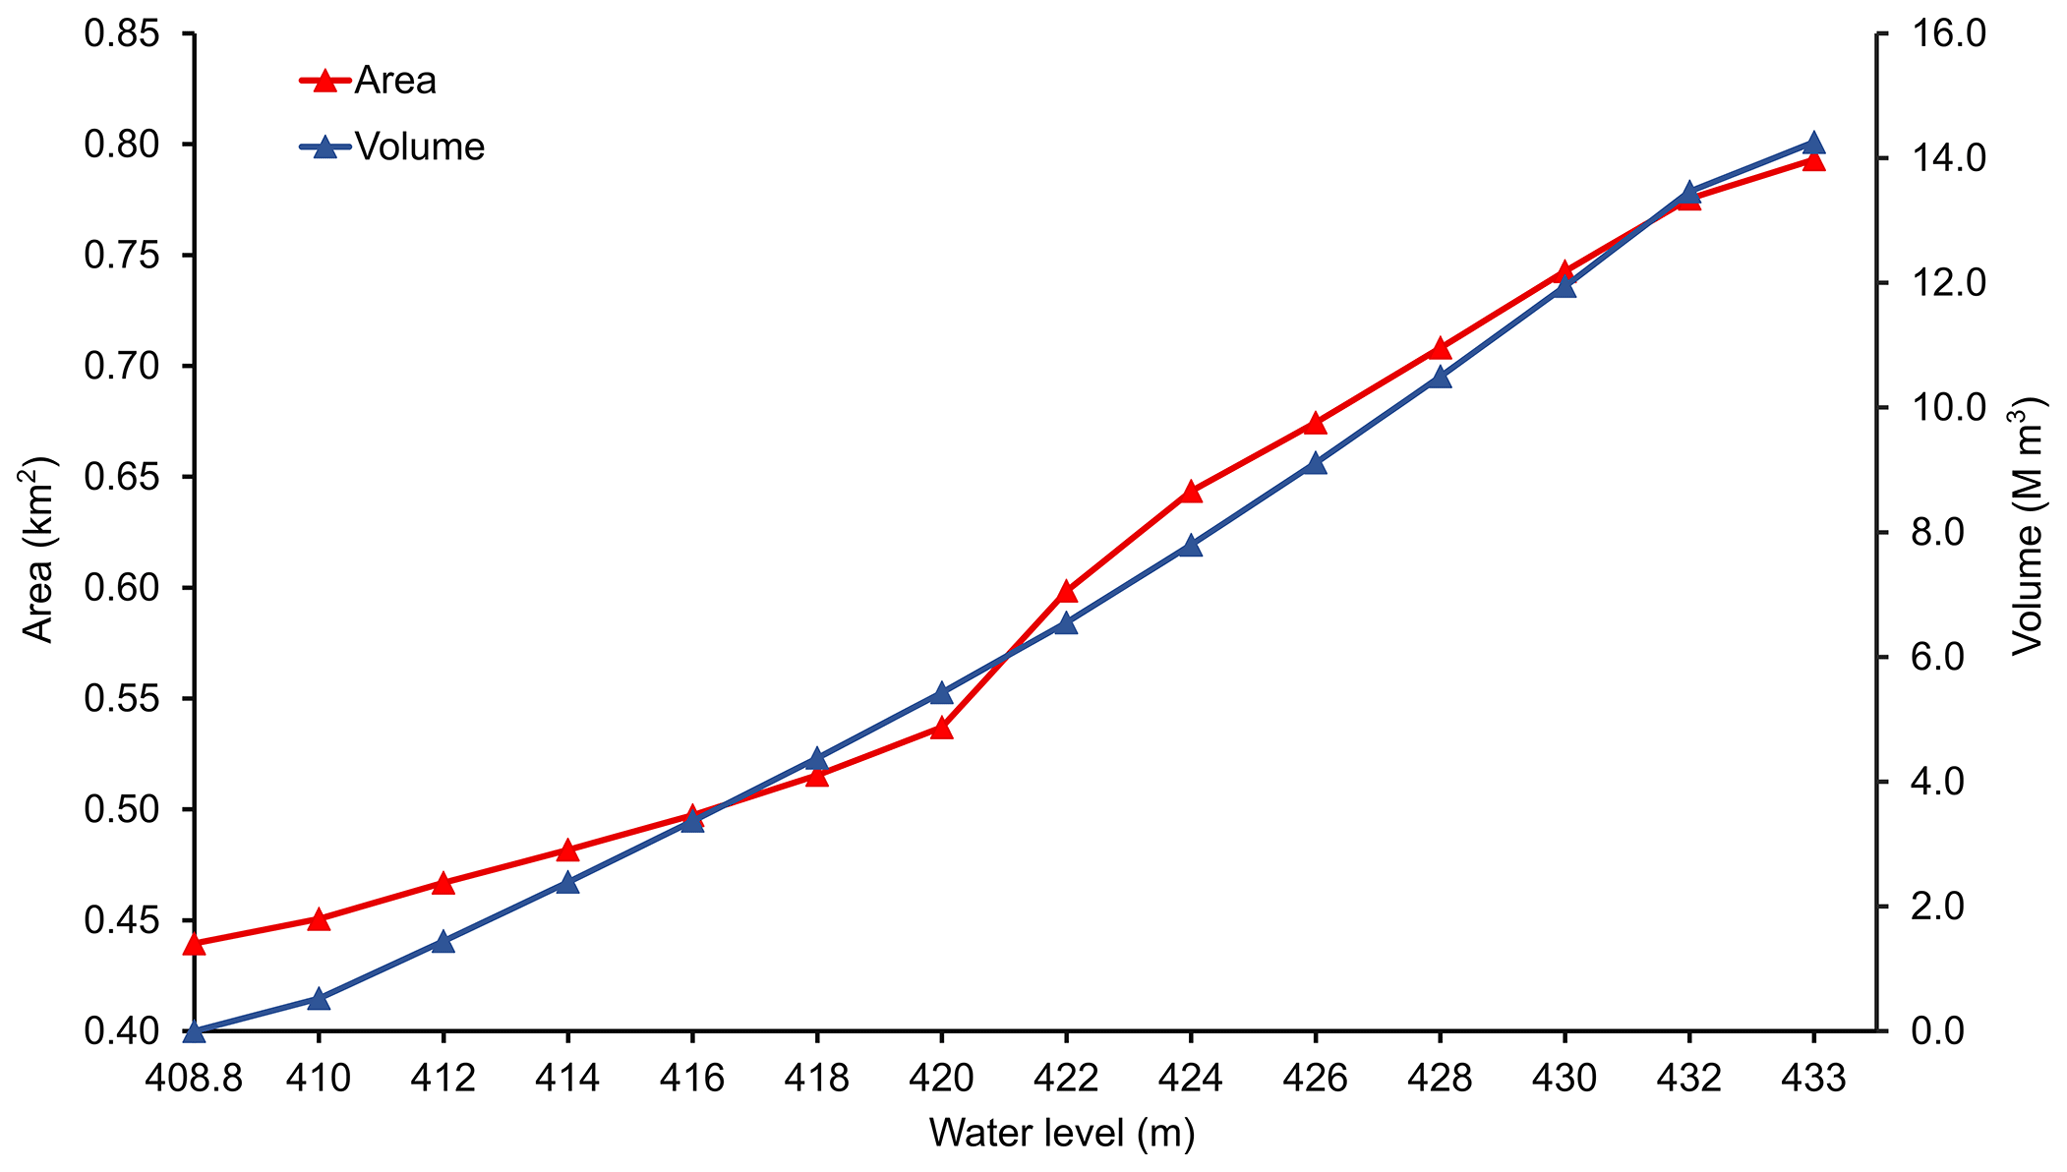
Figure 2Lake area (km2) and lake volume (Mm3) with changing water level (m), calculated for every second metre, based on the 2021 post-drainage DEM. The lake has a maximum water level of 433 m, after which it overspills the damming glacier. The sharp increase in lake area from ∼ 420 to 422 m is due to a plateau at the northeastern part of the lake (Fig. A1).
4.2 Drainage cycles
Since the lake entered its new drainage cycle in 2007, we have observed annually reoccurring events, with the exception of 2009. The 2007 GLOF had the largest observed drainage volume, with a value of 37.73 ± 1.08 Mm3 recorded (Table 2 and Fig. 3), yet a year later in 2008 the volume release was 4 times lower, at 9.4 ± 1.46 Mm3. In contrast, in 2010 the drainage volume once again returned to a higher level, with 26.08 ± 2.54 Mm3 recorded. Over the following 3 years (2011 to 2013) the drainage volume remained relatively stable at between 7 and 9 Mm3, before decreasing to ∼ 4 Mm3 in 2014 and 2015, after which a 3-fold increase to 12.5 Mm3 was observed in 2016. In both 2017 and 2020, we reconstructed small, partial drainage events of just 2.7 and 0.9 Mm3, respectively (Table 2 and Fig. 3). These two events occurred earlier in the melt season in comparison to previous drainage events, with the 2020 event occurring by 31 May. In the years following the occurrence of these partial drainage, i.e. in 2018 and 2021, the observed GLOFs occurred relatively late in the melt season, with volumes of 8.5 and 9 Mm3 recorded, respectively (Table 2 and Fig. 3). In general, the lake seems to fluctuate between short periods of relatively high and low drainage volumes, with the low-volume GLOFs occurring earlier in the melt season. However, the later occurrence of these drainage events is not always equivalent to a larger drainage volume, as evidenced in 2018 and 2019.
Table 2Drainage dates, pre- and post-drainage water levels, lake areas, and volumes for 15 GLOFs spanning 1987 to 2021. The 1987 estimates are adopted from Russell et al. (2011). The 2007-to-2021 estimates are reconstructed using the 2021 post-drainage DEM in combination with selected optical satellite images as well as from downstream hydrograph observations. The table includes references to previous studies of the lake, including estimated drainage volumes.
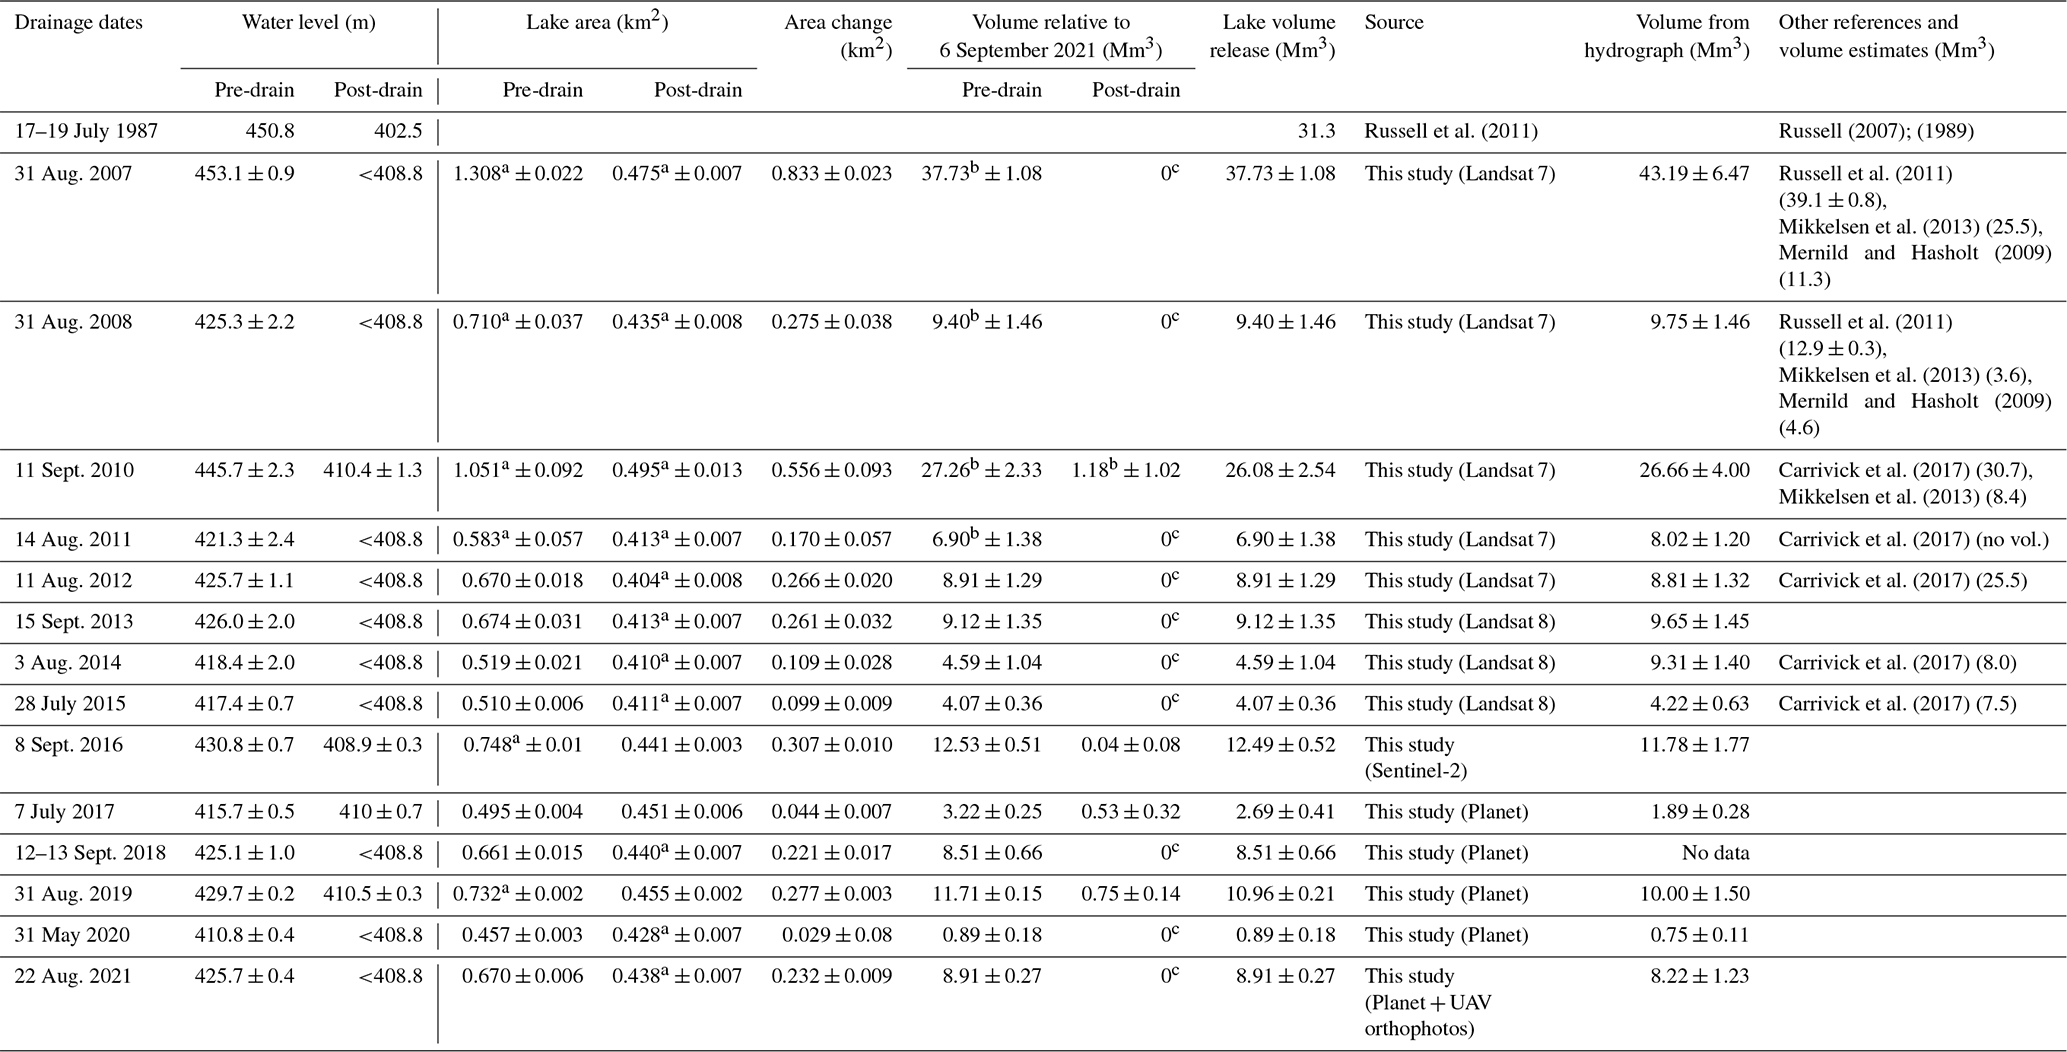
a Areas have been manually edited: from 2007 to 2011 to compensate for changes at the ice margin; pre-drain 2016 and 2019 to avoid water extending on the ice margin; post-drain 2012–2015, 2018, and 2020–2021 as the water level was observed to be lower than the reference DEM minimum of 408.8 m. b Volumes adjusted to compensate for changes observed at the ice margin. c Post-drain volume set to 0. As the post-drainage lake area in 2007, 2008, 2011–2015, 2018, 2020, and 2021 is almost identical to that of the reference area (0.439 km2), the volumes are assumed to be almost identical.
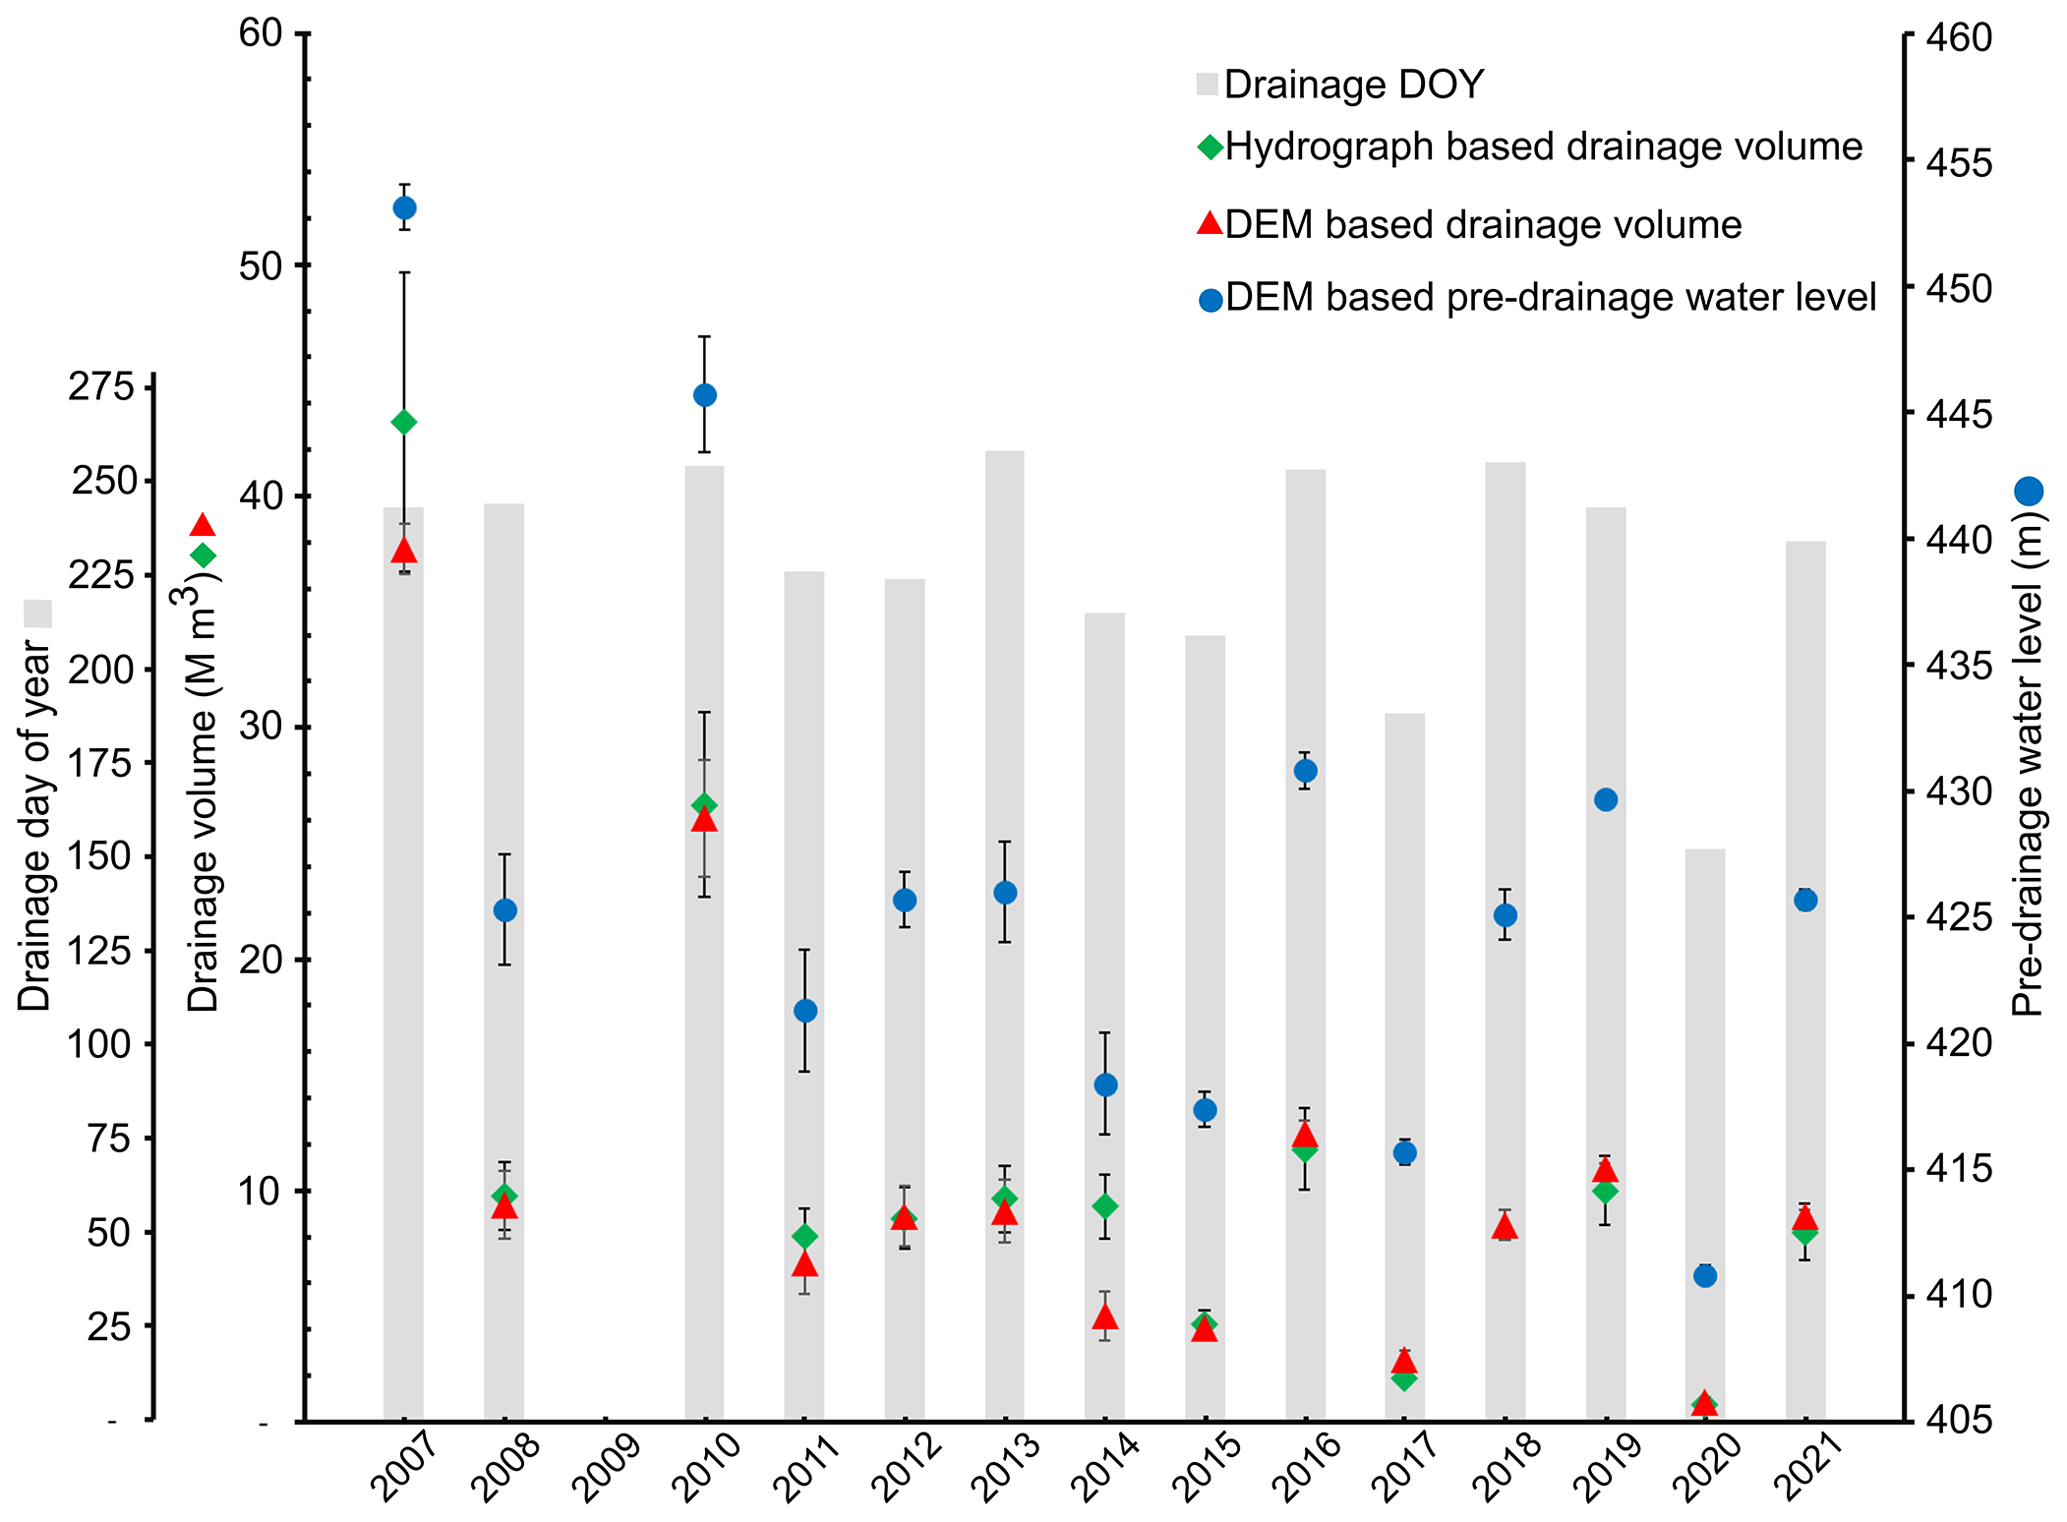
Figure 3Pre-drainage water level, drainage volume, and drainage day of year (DOY) for 14 GLOFs spanning 2007 to 2021. Pre-drainage water levels (blue circles) are estimated using the 2021 post-drainage DEM. Drainage volumes are estimated using both the 2021 post-drainage DEM (red triangles) and downstream hydrograph observations (green squares). The grey bars indicate the day of year (DOY) of the drainage and refer to the leftmost yaxis. No hydrograph data for the 2018 event.
4.3 Geomorphology of the drainage area
Figure 4a and b illustrate the two main routes of drainage for the GLOF event to exit the drainage outlet. Drainage route I channels the water into an ephemeral river channel and into two outlet lakes connected to the downstream river network. In contrast, in drainage route II the water flows across the ice margin and into an ice-marginal meltwater drainage system before reaching the river network, thus bypassing the two outlet lakes. There is a 0.4 m elevation difference between the drainage threshold of drainage route I (390.2 m) and drainage route II (390.6 m) (Fig. 4b).

Figure 4(a) Overview of drainage route I and II overlaid on a hillshade of the ArcticDEM from 2 August 2015. Box indicates the region illustrated in panel (b). (b) Hillshade of the post-drainage terrain, produced from the Mission I DEM, highlighting where the water exits the glacial drainage outlet. The drainage thresholds indicate the highest elevation points along the drainage routes. The 2015 and 2021 ice margins are digitized based on the ArcticDEM and Mission I DEM, respectively. (c, d) Ice blocks deposited along the two drainage routes, up to 5 m in length. (e) Roughly circular and nearly vertical holes, ∼ 10 m in diameter, with a total of five such features observed at the ice margin. (f) Fractured ice due to supraglacial water flow. (g, h) Parallel fractures, reaching several hundred metres in length.
The high resolution of the orthomosaic and DEM produced through UAV Mission I has enabled us to observe a number of important geomorphologic features across the drainage region which are not visible in the 3 m resolution Planet imagery. For example, large blocks of ice up to 5 m in length are observed scattered across both drainage route I and II (Fig. 4c and d). On the western part of the ice margin we observe a ∼ 100 m × 100 m area where the ice surface is fractured and broken (Fig. 4f). The ice margin also contains 0.5 to 3 m wide, parallel fractures (Fig. 4g and h) that run up to several hundred metres in an interrupted, circular pattern (Fig. 4b) as well as five roughly circular and nearly vertical holes with a diameter of ∼ 10 m (Fig. 4e). Finally, observations of the ice margin and drainage outlet position in both 2015 and 2021 indicate a retreat of 30 and 60 m in this period, respectively (Fig. 4b).
5.1 Drainage volume estimates
For all GLOFs except 2014, the DEM- and hydrograph-based methods produce volume estimates that are within each other's margins of error (Table 2, Fig. 3) with a total mean difference of 10 %. This indicates that the two methods used to obtain drainage volumes can serve as independent validation for one another. For the 2014 GLOF the hydrograph estimate is 2 times larger than the DEM-derived volume. This could partly be because the cloud-free Landsat 8 image captured closest to the drainage date on 3 August was acquired 13 d prior to the GLOF, on 21 July. Using the max 2010-inflow rate of 1.3 m3 s−1 (Russell et al., 2011), the lake volume would increase by approximately 1.5 Mm3, which is still 3.2 Mm3 lower than the hydrograph estimate. However, based on a comparison between the 2010 and 2014 July temperature at KAN_L, the actual inflow rate is likely smaller, leaving the discrepancy between the two estimates even larger. It has been suggested that GLOFs can trigger additional release of meltwater from englacial storages or due to frictional melting (Huss et al., 2007; Mernild and Hasholt, 2009). This would show as larger hydrograph estimates and could explain the 2014 volume difference. However, as all remaining GLOFs present no evidence of additional water release, it is considered unlikely. Moreover, we find no evidence that any of the other proglacial lakes in the system have undergone a change in their area, which would indicate changes in water storage, and therefore the 2014 event remains unquantified. We observe no notable presence of ice on the lake surface during any of the 14 GLOFs. This is important as ice may limit the lake's water storage capacity and influence the drainage timing and volume (Jenson et al., 2022). In years with an early drainage date and a low drainage volume (2014, 2015, 2017, 2020), we checked for additional late-season drainage events by manually going through satellite images starting from the observed drainage date to the end of the melt season.
When the lake drains below the 2021 post-drainage DEM reference elevation of 408.8 m (2007, 2008, 2011–2015, 2018, 2020, 2021), we underestimate the volume release, as we cannot measure the precise post-drainage water level. As annual differences in the post-drainage area are minimal (Table 2), the changes in volume are also expected to be limited. Additionally, the total lake area during these instances is at its minimum. Russell et al. (2011) reported the post-drainage water level of the 2007 event to be 404.5 m, which is 3.34 m lower than our 2021 reference minimum. Assuming that the entire 2007 post-drain area (Table 2) is lowered by an additional 3.34 m, it would give an extra volume release of 1.59 Mm3, corresponding to a 4 % increase from 37.73 to 39.32 Mm3. Russell et al. (2011) estimated the volume of the 2007 event to be 39.1 Mm3. Mernild and Hasholt (2009) and Mikkelsen et al. (2013) find much lower drainage volumes for the 2007 GLOF of 25.5 and 11.3 Mm3, respectively (Table 2). However, these estimates are based on obsolete stage-discharge relations (van As et al., 2017). A similar pattern of matching and conflicting volume estimates is identified for other previous GLOFs (i.e, 2008, 2010, 2012, 2014, and 2015 in Table 2), both in existing studies as well as when compared to the reconstructed volumes presented in this study. This highlights the challenges related to reconstructing drainage volumes and stresses the need for consistent methodological estimates to allow for better comparisons of annual variations to be made.
5.2 Drainage trigger mechanisms and controls
With the documentation of seven new GLOFs and the recalculation of seven known GLOFs, we are now able to re-evaluate the proposed drainage-triggering mechanisms. Previous studies have suggested several different mechanisms that control GLOFs at Russell Glacier, such as flotation of the ice dam (Carrivick et al., 2017), fluctuation in subglacial meltwater (Russell and de Jong, 1988; Russell, 1989), incomplete resealing of the subglacial conduit (Russell et al., 2011), and subglacial drainage through an incised bedrock-walled Nye channel (Russell et al., 2011). Recent data from ground-penetrating radar surveys, however, revealed no evidence of a Nye channel incised into the bedrock but instead found evidence of at least one englacial tunnel running parallel to the ice margin (Lamsters et al., 2020).
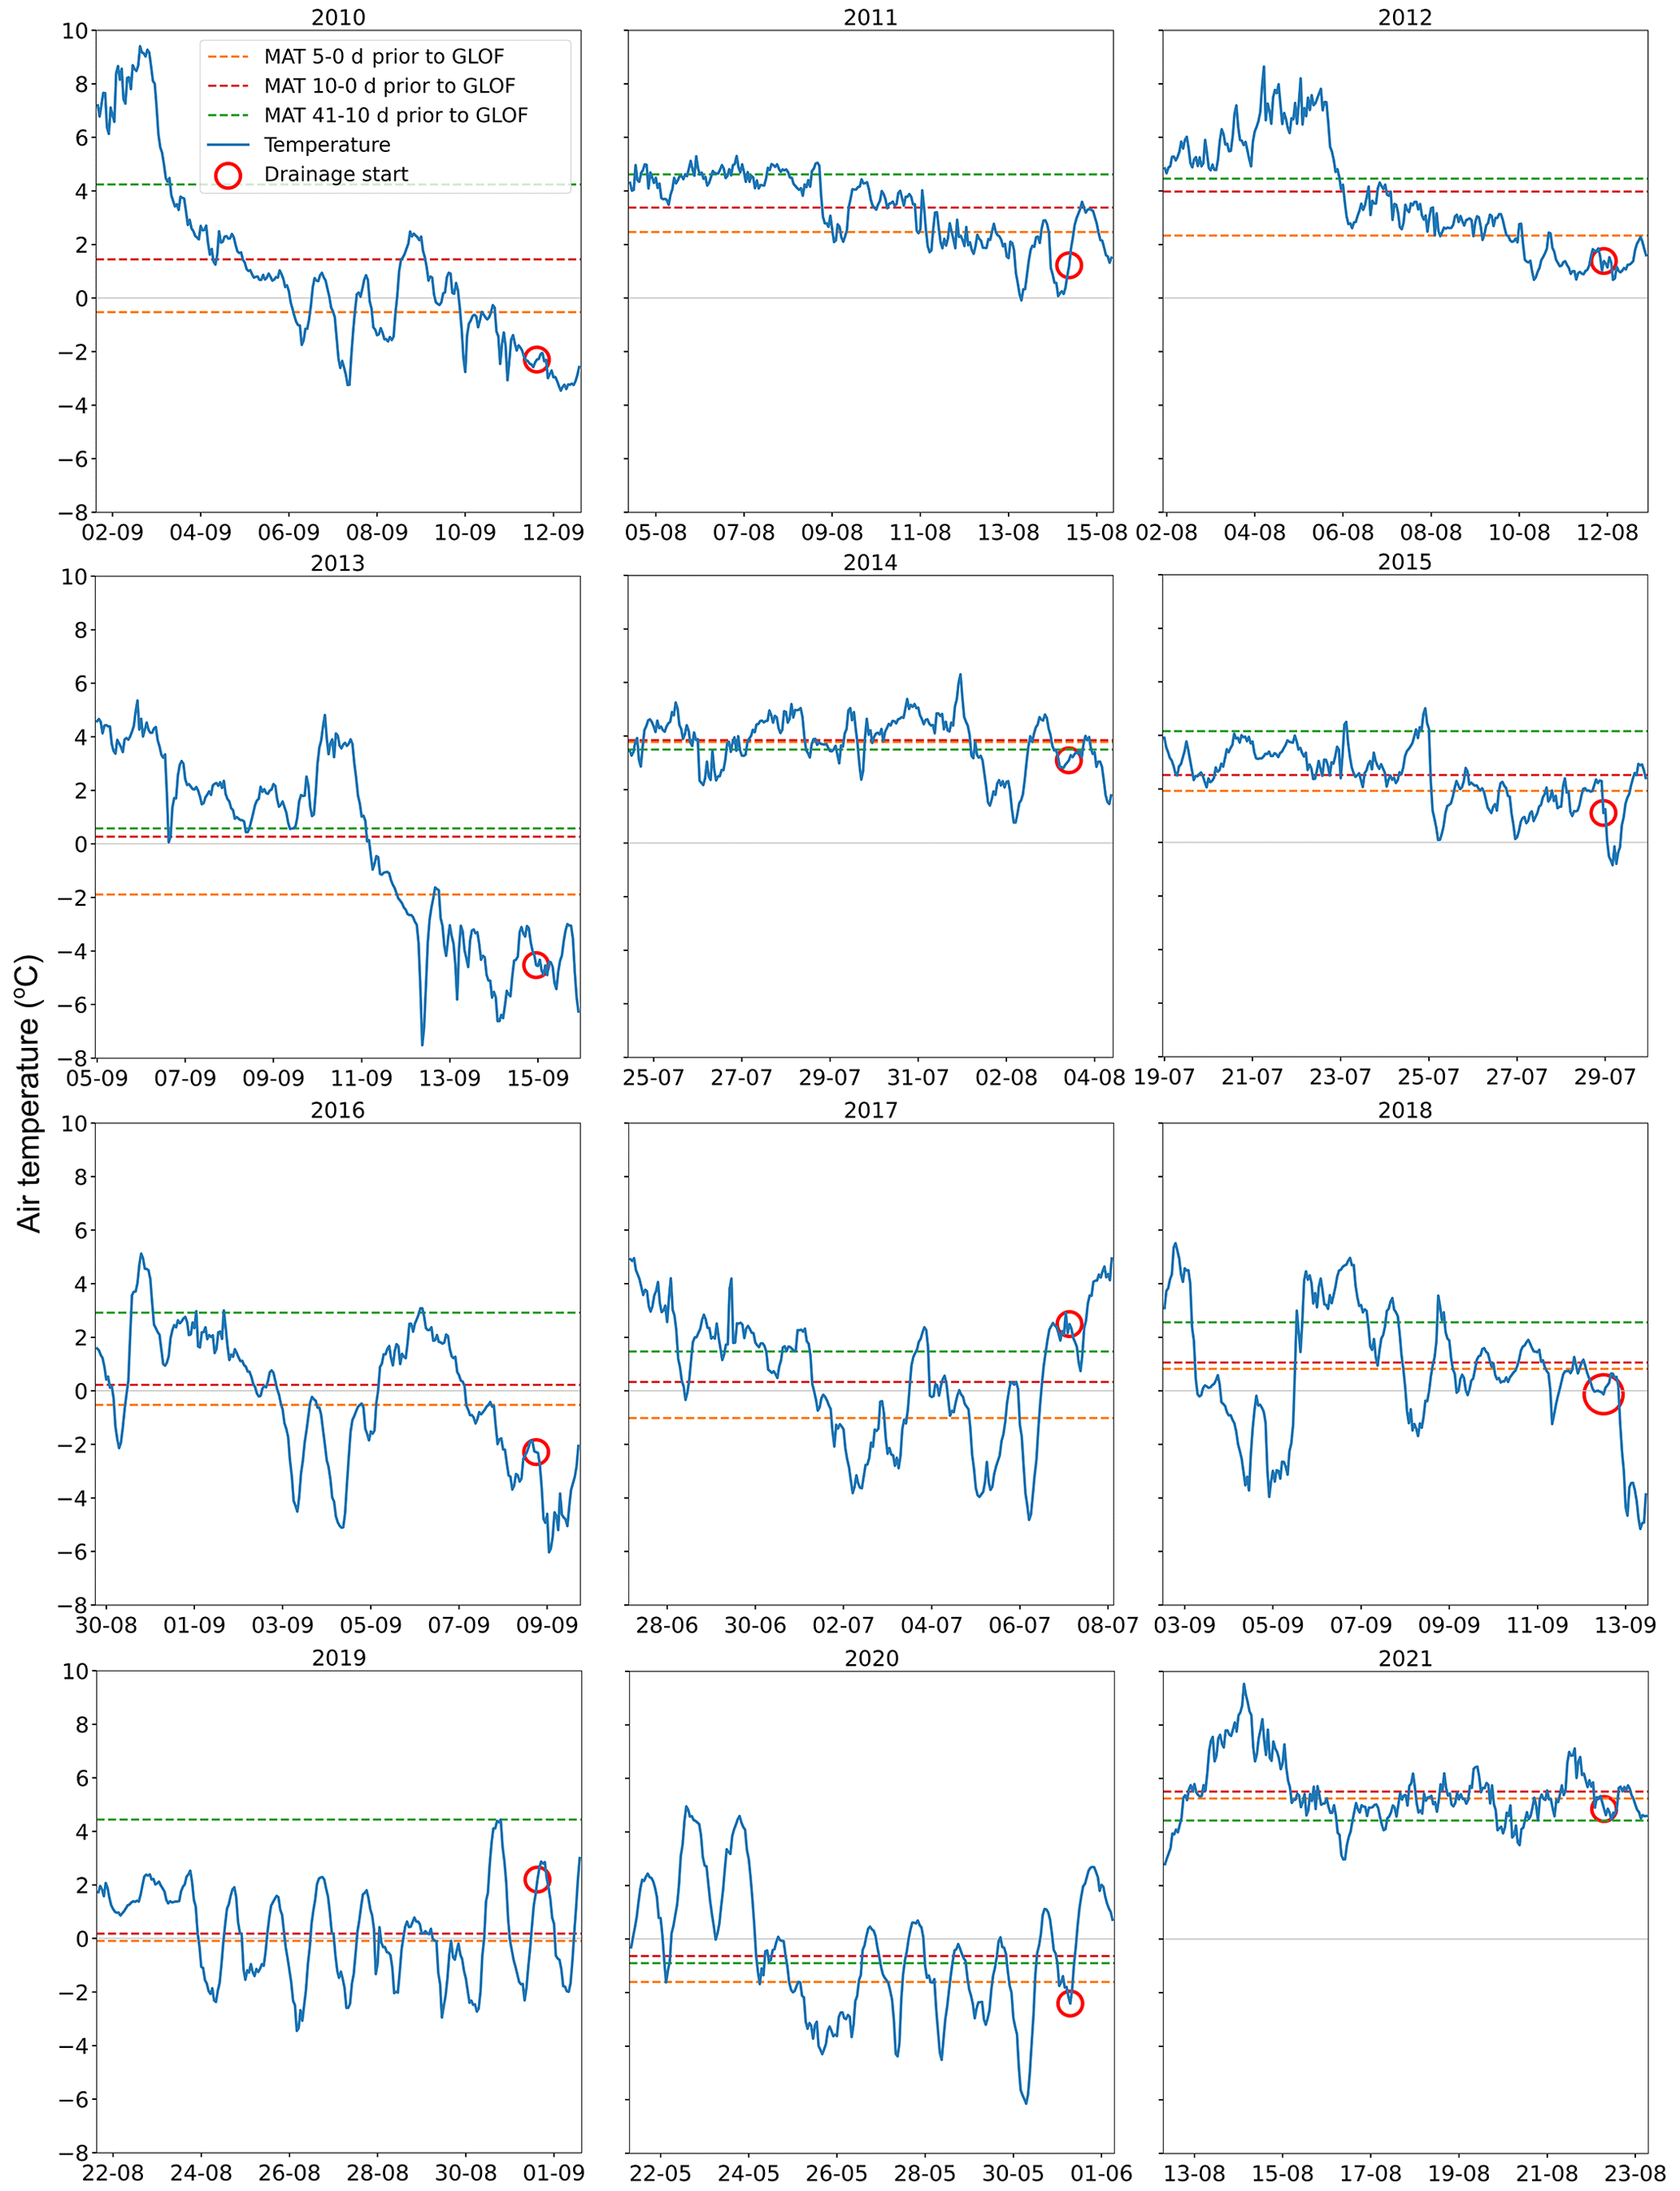
Figure 5Plot of hourly temperature measurements from 10 d prior to the drainage event from KAN_L. The green line shows the mean air temperature (MAT) 41–10 d prior to the drainage, the red line shows the MAT 10–0 d prior, and the orange line shows the MAT 5–0 d prior to drainage. The red circle denotes the start of the GLOF, and for the 2018 event the circle is larger due to uncertainty about the timing. All plots share the same y axis range.
Had the lake been draining due to floatation of the ice dam, we would expect to see a gradual decrease in the release volume and pre-drainage water level as less water is required to float the thinning ice dam. We do observe a lower drainage volume compared to the 2007 and 2010 maximum, but the lake is still able to drain at both similar and higher water levels than observed in 2008 (Fig. 3, Table 2). The two largest GLOFs (i.e. 2007 and 2010) both occurred following a year of no drainage, and they indicate that in order for the lake to reach such a high-water level an additional (or multiple) melt season is required. However, due to thinning of the damming glacier the lake is unable to reach its previous peak drainage water level and volume that was observed in 2007 and 2010. As a result, and based on its current configuration, the lake can only reach a maximum water level of 433 m, at which point it overspills the ice dam.
Russell (1989) suggested the internal drainage network of Russell Glacier and a possible reduction in (sub)glacial meltwater as the main trigger for the 1984 and 1987 GLOFs. This closely aligns with the majority of the observed GLOFs occurring late in the melt season when subglacial and englacial water pressure is lower. However, the partial drainage events of 2014, 2015, 2017, and 2020 occur earlier in the melt season, indicating a different drainage mechanism or an additional means by which to lower the water pressure. The water pressure can also be lowered as a consequence of a sudden reduction in meltwater production (Tweed and Russell, 1999; Russell et al., 2011). Russell et al. (2011) suggested a link to an observed drop in air temperature prior to the 2007 and 2008 GLOFs. For 7 of the 12 GLOFs that occurred between 2010–2021 (2010–2011 and 2015–2019), we observe a similar drop in mean air temperature (MAT) when comparing the MAT of the 10 d prior to the GLOF with the MAT of the month prior (Fig. 5). The difference ranges from −1.1 to −4.5 ∘C, with the largest drop observed in 2019. For the five remaining GLOFs, the mean temperature changes are either very moderate (−0.2 to −0.5 ∘C) or increasing (0.3 to 1.1 ∘C). However, when comparing the 10 d MAT to the 5 d MAT prior to the drainage in both 2012 and 2013, we observe a 1.7 and 3 ∘C drop, respectively (Fig. 5). A drop in temperature could influence the triggering of the GLOFs as the subglacial and englacial water pressure falls in response to the reduced ablation. This permits the lake water to escape via hydraulic connection to the englacial conduit. The syphoning mechanism may be triggered by a reduction in melt, but as the timing and triggering threshold of the GLOF is linked to the water pressure dynamics of the englacial hydrological system, it also reflects annual variations in the glacial drainage system (Tweed and Russell, 1999; Russell et al., 2011). As syphoning requires the draining lake to already be connected to the glacial drainage network (Tweed and Russell, 1999), a different mechanism must have triggered the 2007 GLOF and caused it to produce the englacial tunnel, which likely still acts as the main drainage passage for the following annually reoccurring events.
The fluctuation between short periods of relatively high and low drainage volumes (Fig. 3, Table 2) suggests other factors may influence the triggering threshold. The partial 0.9 Mm3 GLOF in 2020 drained just 0.3 m ± 0.5 m above the post-drainage water level of the 11 Mm3 2019 GLOF. This suggests that the ice dam did not seal during the 2019–2020 winter, allowing the lake to drain earlier at the beginning of the ablation season in late May. We hypothesize that the large GLOFs potentially weaken the ice dam, leading to an incomplete sealing of the englacial tunnel. This allows the following event(s) to occur at much lower water level. A similar theory is suggested by Russell et al. (2011) as an explanation for the differences between the 2007 and 2008 events. After a number of such small events, the drainage system likely undergoes a change in configuration, resulting in the closure of the drainage outlet and allowing for the reoccurrence of a larger GLOF the following year.
5.3 Evidence of changing drainage route
Previous observations of the lake drainage system (e.g. Carrivick et al., 2018; Mernild and Hasholt, 2009; Russell, 1989) coincide with the estimated location of drainage route I. In this study, the scattered ice blocks and fractured ice surface observed in Fig. 4c, d, and f indicate a considerable flow of surface water along drainage route I, as well as the new route II during the 2021 GLOF. The roughly circular and nearly vertical holes, exemplified in Fig. 4e, are likely created by the collapse of the ice surface above an empty englacial or subglacial cavity. They may also be a result of pressurized englacial or subglacial water flow being forced upwards and breaching the ice surface, causing a localized collapse. There are multiple potential explanations for the parallel fractures observed on the ice margin (Fig. 4g and h), such as a propagation of basal crevasses towards the surface, stretching of the ice surface from increased basal sliding, and a temporary uplift and/or (subsequent) falling of the ice surface. In combination with the additional observed surface features, we consider the latter hypothesis the most plausible; however, all explanations can be linked to a subglacial or englacial flow of drainage water.
From 3 m resolution Planet satellite images (Planet Team, 2017) captured immediately before and after the 2021 GLOF, we also observe geomorphological changes along the ice-marginal meltwater drainage system which channels the GLOF drainage water from drainage route II into the downstream river network. As a results of this observation, we reanalysed previous drainage events. The reanalysis showed no evidence of geomorphic change along the ice-marginal meltwater drainage system after the 2020 and 2019 events. However, we did observe standing water on the ice margin and changes in the ice colour (black to white) after the 2019 drainage, indicating water flow on the ice surface.
On the basis of these observations, we hypothesize that the new drainage pattern is predominantly caused by the thinning and retreat of the ice margin in the vicinity of the outlet, allowing floodwater to more easily run over and into the ice margin. The 0.4 m elevation difference between drainage route I and II (Fig. 4b) suggests that route I is still the primary path. However, as the ice margin gradually thins, drainage route II will likely become the dominant path taken. This shift is very profound, because it bypasses the two outlet lakes (Fig. 1) that currently act as a buffer and slow the downstream flow of water. Thus, this shift will affect downstream geomorphology and potentially cause hazards to local infrastructure. Therefore, we strongly suggest that a comprehensive investigation of the potential downstream consequences of GLOFs along the new route is undertaken.
This study presents one of the longest and continuous known records of GLOF drainage estimates in Greenland. We (re)analyse 14 GLOFs spanning 2007 to 2021 to provide a new evaluation and a greater understanding of the drainage patterns and trigger mechanisms. Our time series reveal annual GLOFs, with the exception of 2009, and considerable variations in both the date of drainage, ranging from 31 May to 15 September, and the overall volume, ranging from 0.9 to 37.7 Mm3. We compare our estimates of lake drained volume produced through DEM analyses with flood volumes calculated from a downstream hydrograph. We find that the two methods produce comparable results, with a mean volume difference of 10 %. That difference is excluding the 2014 GLOF where the hydrograph estimate is double the DEM-derived volume, which cannot be resolved with the available data. In general, we find that our reconstructed time series demonstrates the need for consistent methodological estimates when studying year-to-year variations. We illustrate that the 2021 theoretical maximum drainage volume is 14.3 Mm3, which is 63 % lower than the 37.7 Mm3 estimated for the 2007 GLOF. This decrease can likely be explained by the observed thinning of the ice dam.
We hypothesize that when the ice-dammed lake episodically drains, it does so through an englacial tunnel created by the 2007 GLOF. In contrast, the ensuing annual drainages are likely caused by a syphoning drainage mechanism within the pre-existing englacial conduit. This syphoning is likely triggered by a reduction in meltwater, driven by late-season drainage and sudden reductions in mean air temperature, as well as annual variations in the configuration of the drainage system of the damming glacier. The observed fluctuations between short periods of relatively high and low drainage volumes suggest that the large GLOFs potentially weaken the ice dam, causing it not to seal during winter and thus allowing the following event(s) to drain at a lower water level.
This study also reports geomorphological evidence from UAV and satellite data that reveals an altering of the proglacial drainage route with a new subglacial or englacial flow pathway, as well as the supraglacial flow of drainage water across the ice margin. We suggest that the new drainage route has developed as a result of thinning and retreat of the ice margin and that further thinning will cause the new drainage route to eventually become dominant. As the new route bypasses the two buffering outlet lakes, the delivery of drainage water to the downstream system will be faster and less attenuated, with significant consequences for the surrounding geomorphology and the potential risk of flooding hazards.
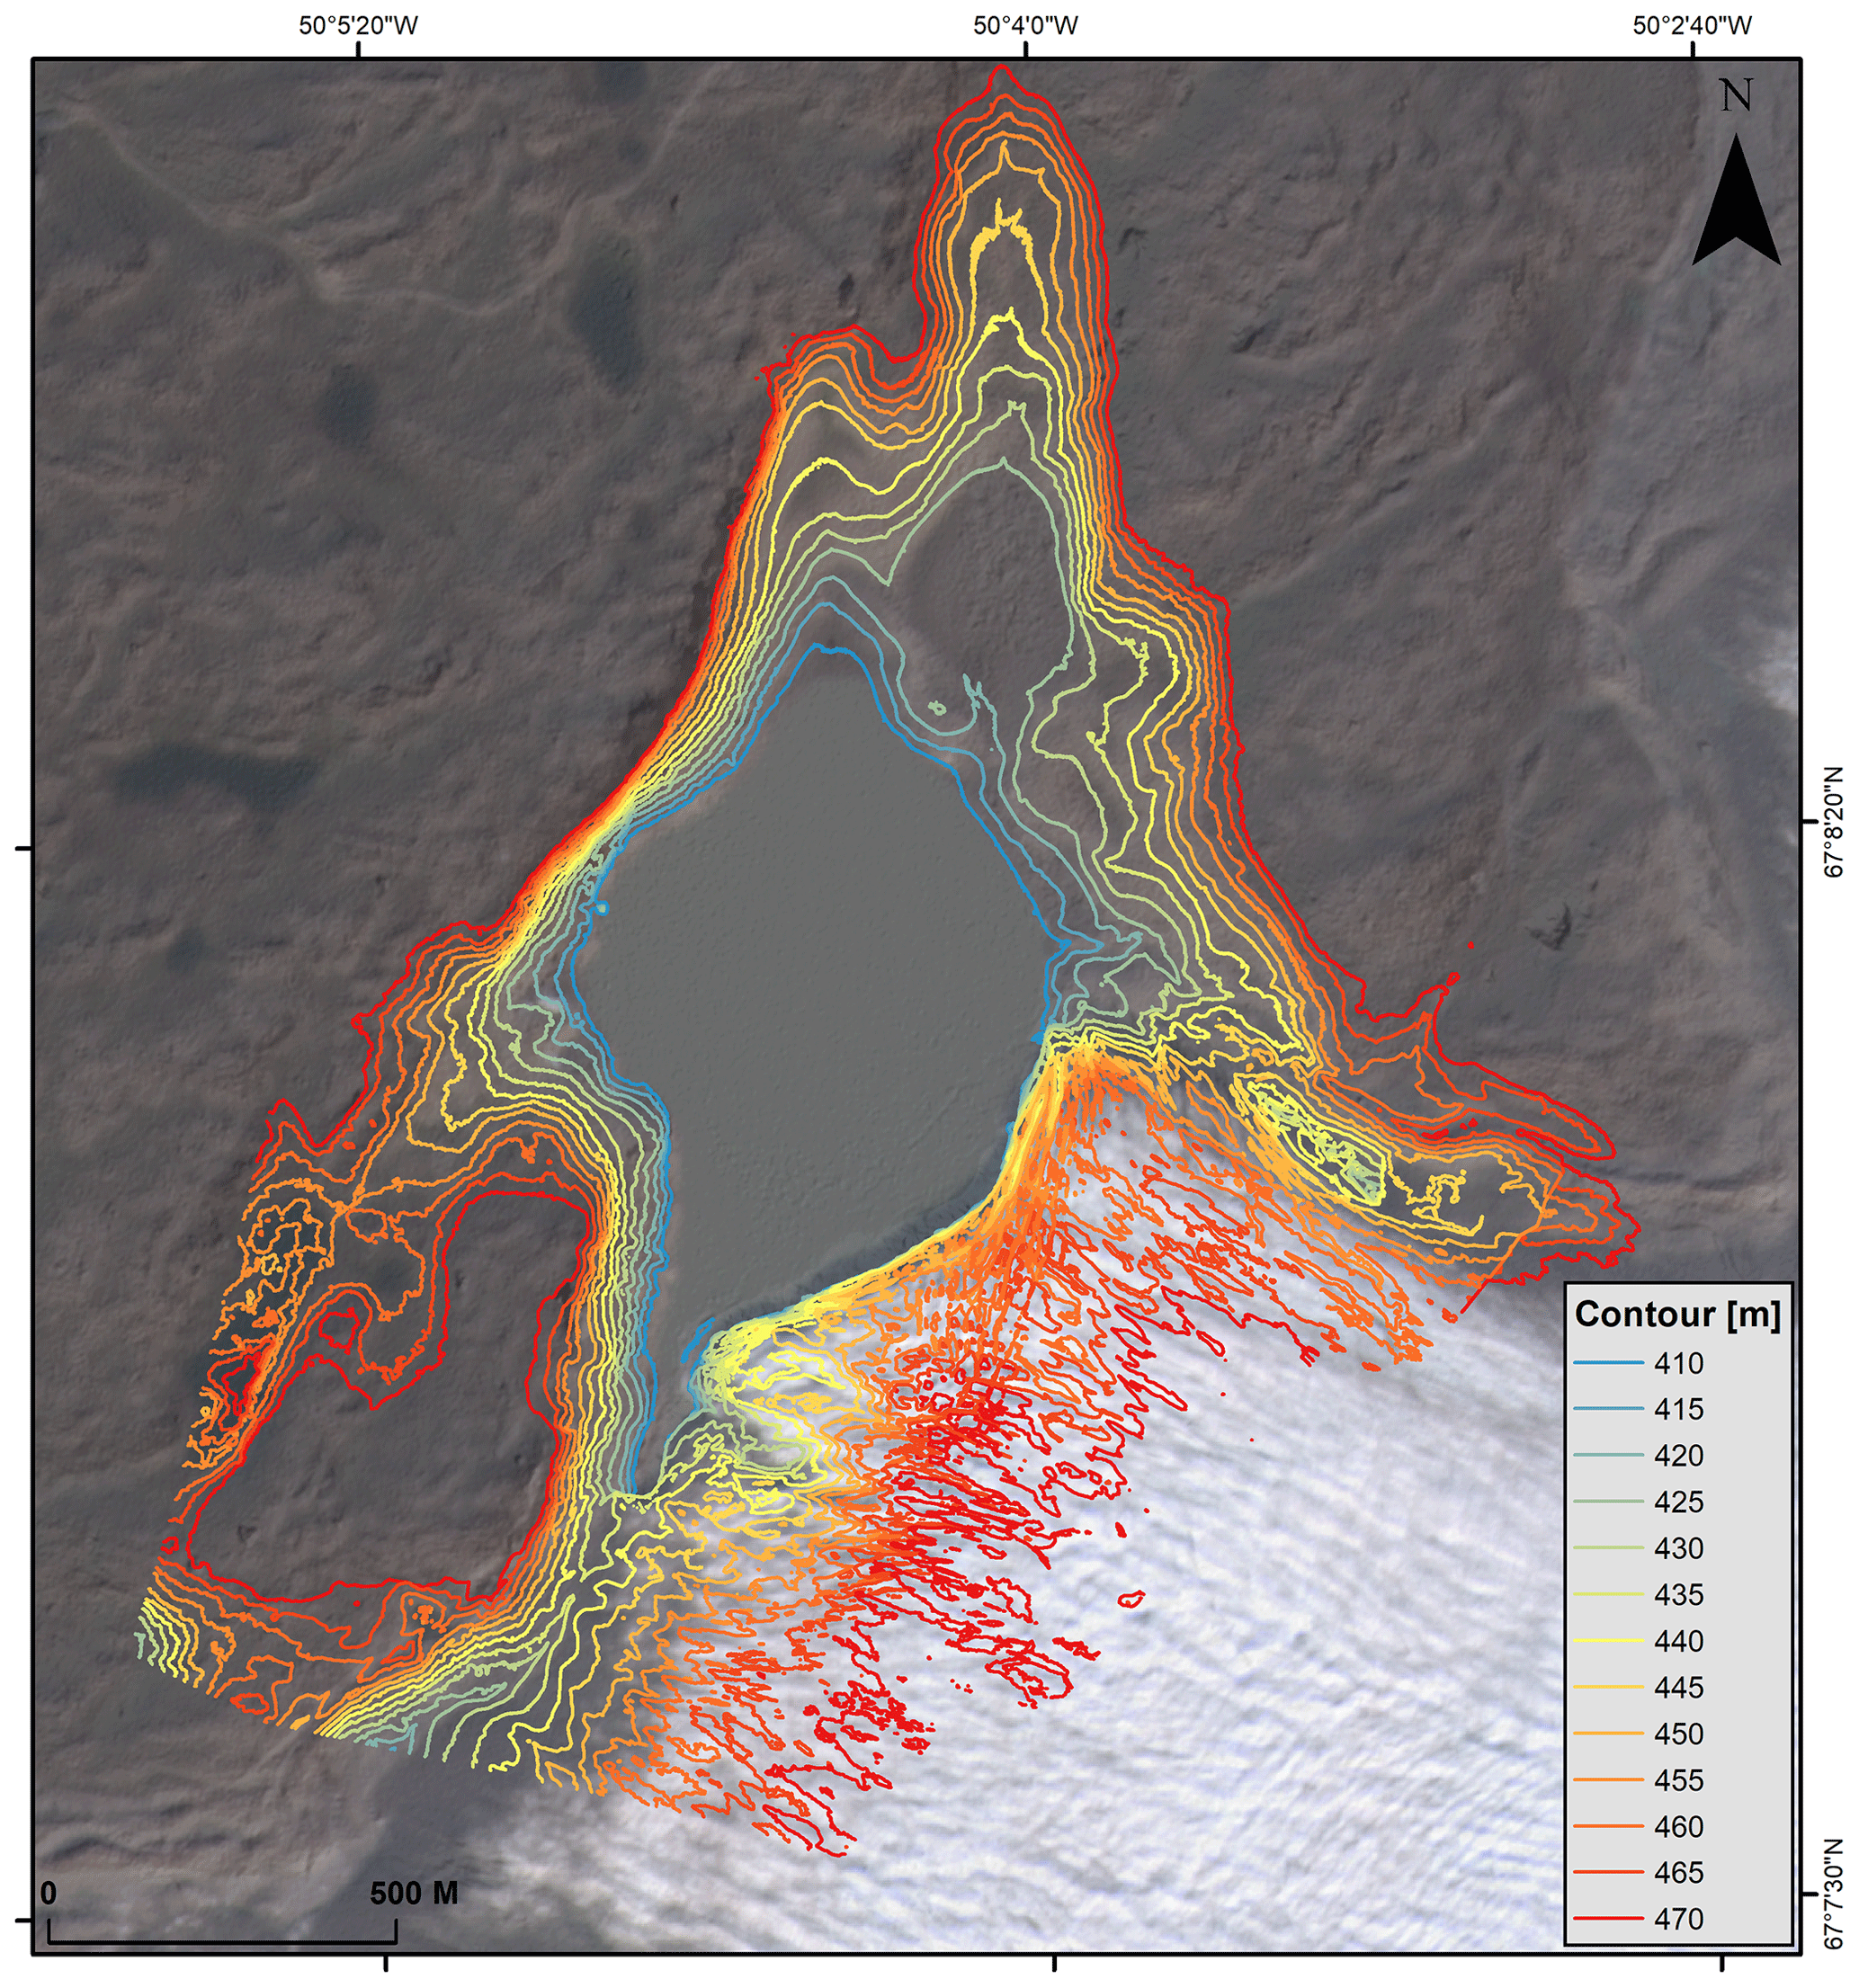
Figure A1Contour map with 5 m intervals based on the 2021 post-drainage DEM. Background is a four-band Planet Team (2017) acquisition from 23 August 2021.
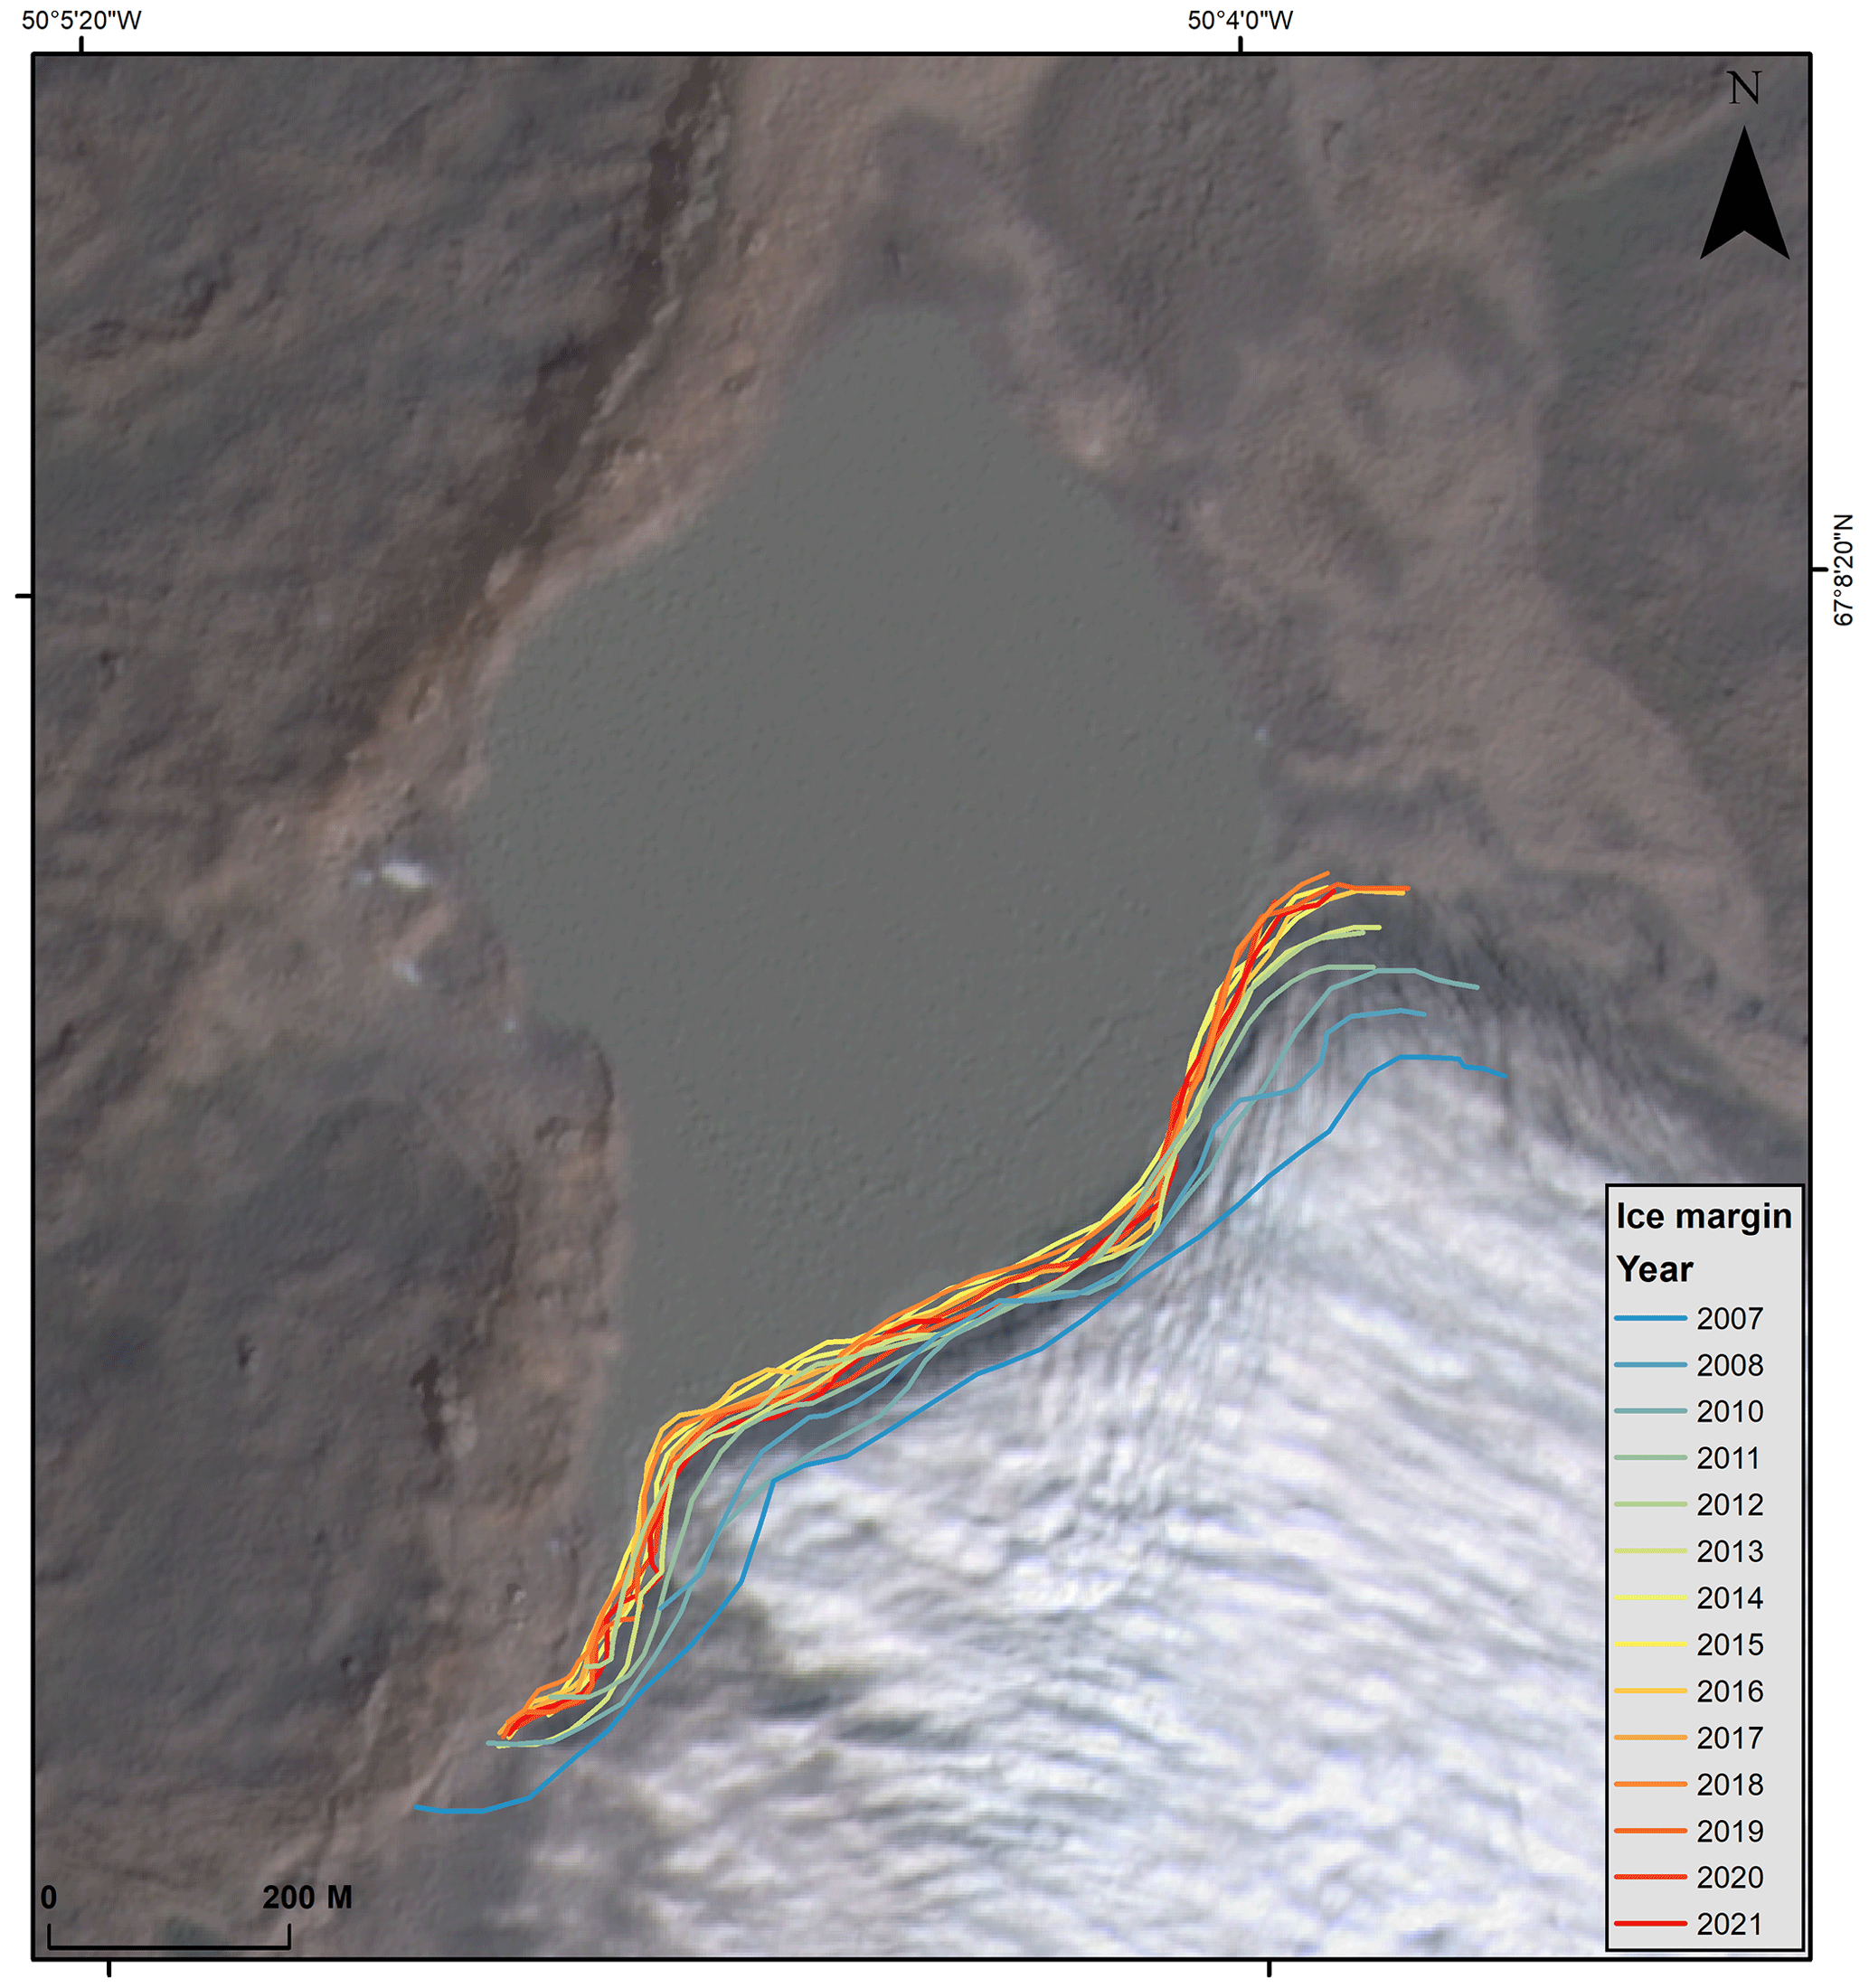
Figure A2Position of ice margin digitized from satellite images. Background is a four-band Planet Team (2017) acquisition from 23 August 2021.
DEMs and orthophotos of the drained lake topography and outlet drainage route are publicly available via figshare (https://doi.org/10.6084/m9.figshare.21981731.v1, Doemgaard, 2023). Data from the Programme for Monitoring of the Greenland Ice Sheet (PROMICE) and the Greenland Analogue Project (GAP) were provided by the Geological Survey of Denmark and Greenland (GEUS) at http://www.promice.dk (last access: 20 March 2023; DOI: https://doi.org/10.22008/promice/data/aws, GEUS Dataverse, 2022).
MD led the data analysis and wrote the main manuscript. MD, FH, and AAB planned the study and carried out the fieldwork. KKK collected the hydrograph data and performed the hydrograph volume estimates. SAK carried out GPS data processing. JLC provided guidance on the interpretations and assessment of the drainage triggers and water rerouting. All authors contributed to the data analysis and interpretation of results and provided inputs for the manuscript.
The contact author has declared that none of the authors has any competing interests.
Publisher’s note: Copernicus Publications remains neutral with regard to jurisdictional claims in published maps and institutional affiliations.
This work was funded by the Villum Foundation (Villum Young Investigator grant no. 29456).
This paper was edited by Kang Yang and reviewed by Nathaniel Baurley, Brianna Rick, and one anonymous referee.
Agisoft LLC: Agisoft Metashape User Manual: Professional Edition, Version 1.7, Agisoft Metashape, 160, 2021.
Bevis, M., Wahr, J., Khan, S. A., Madsen, F. B., Brown, A., Willis, M., Kendrick, E., Knudsen, P., Box, J. E., van Dam, T., Caccamise, D. J., Johns, B., Nylen, T., Abbott, R., White, S., Miner, J., Forsberg, R., Zhou, H., Wang, J., Wilson, T., Bromwich, D., and Francis, O.: Bedrock displacements in Greenland manifest ice mass variations, climate cycles and climate change, P. Natl. Acad. Sci. USA, 109, 11944–11948, https://doi.org/10.1073/pnas.1204664109, 2012.
Carrivick, J. L. and Quincey, D. J.: Progressive increase in number and volume of ice-marginal lakes on the western margin of the Greenland Ice Sheet, Global Planet. Change, 116, 156–163, https://doi.org/10.1016/j.gloplacha.2014.02.009, 2014.
Carrivick, J. L. and Tweed, F. S.: A global assessment of the societal impacts of glacier outburst floods, Global Planet. Change, 144, 1–16, https://doi.org/10.1016/j.gloplacha.2016.07.001, 2016.
Carrivick, J. L. and Tweed, F. S.: A review of glacier outburst floods in Iceland and Greenland with a megafloods perspective, Earth-Sci. Rev., 196, 102876, https://doi.org/10.1016/j.earscirev.2019.102876, 2019.
Carrivick, J. L., Turner, A. G. D., Russell, A. J., Ingeman-Nielsen, T., and Yde, J. C.: Outburst flood evolution at Russell Glacier, western Greenland: Effects of a bedrock channel cascade with intermediary lakes, Quaternary Sci. Rev., 67, 39–58, https://doi.org/10.1016/j.quascirev.2013.01.023, 2013.
Carrivick, J. L., Tweed, F. S., Ng, F., Quincey, D. J., Mallalieu, J., Ingeman-Nielsen, T., Mikkelsen, A. B., Palmer, S. J., Yde, J. C., Homer, R., Russell, A. J., and Hubbard, A.: Ice-dammed lake drainage evolution at russell glacier, west greenland, Front. Earth Sci., 5, 100, https://doi.org/10.3389/feart.2017.00100, 2017.
Carrivick, J. L., Yde, J. C., Knudsen, N. T., and Kronborg, C.: Ice-dammed lake and ice-margin evolution during the Holocene in the Kangerlussuaq area of west Greenland, Arct. Antarct. Alp. Res., 50, S100005, https://doi.org/10.1080/15230430.2017.1420854, 2018.
Carrivick, J. L., How, P., Lea, J. M., Sutherland, J. L., Grimes, M., Tweed, F. S., Cornford, S., Quincey, D. J., and Mallalieu, J.: Ice‐marginal proglacial lakes across Greenland: Present status and a possible future, Geophys. Res. Lett., 49, e2022GL099276, https://doi.org/10.1029/2022gl099276, 2022.
Chudley, T. R., Christoffersen, P., Doyle, S. H., Abellan, A., and Snooke, N.: High-accuracy UAV photogrammetry of ice sheet dynamics with no ground control, The Cryosphere, 13, 955–968, https://doi.org/10.5194/tc-13-955-2019, 2019.
Doemgaard, M.: UAV derived orthomosaics and digital elevation models of drained ice-dammed lake basin topography and ice margin, Russell Glacier, West Greenland, 3–6 Sept. 2021, Figshare [data set], https://doi.org/10.6084/m9.figshare.21981731.v1, 2023.
Fausto, R. S., van As, D., Mankoff, K. D., Vandecrux, B., Citterio, M., Ahlstrøm, A. P., Andersen, S. B., Colgan, W., Karlsson, N. B., Kjeldsen, K. K., Korsgaard, N. J., Larsen, S. H., Nielsen, S., Pedersen, A. Ø., Shields, C. L., Solgaard, A. M., and Box, J. E.: Programme for Monitoring of the Greenland Ice Sheet (PROMICE) automatic weather station data, Earth Syst. Sci. Data, 13, 3819–3845, https://doi.org/10.5194/essd-13-3819-2021, 2021.
Furuya, M. and Wahr, J. M.: Water level changes at an ice-dammed lake in west Greenland inferred from InSAR data, Geophys. Res. Lett., 32, L14501, https://doi.org/10.1029/2005GL023458, 2005.
GEUS Dataverse: AWS one boom tripod Edition 3, GEUS Dataverse [data set], https://doi.org/10.22008/promice/data/aws, last access: 16 June 2022.
How, P., Messerli, A., Mätzler, E., Santoro, M., Wiesmann, A., Caduff, R., Langley, K., Bojesen, M. H., Paul, F., Kääb, A., and Carrivick, J. L.: Greenland-wide inventory of ice marginal lakes using a multi-method approach, Sci. Rep., 11, 4481, https://doi.org/10.1038/s41598-021-83509-1, 2021.
Huss, M., Bauder, A., Werder, M., Funk, M., and Hock, R.: Glacier-dammed lake outburst events of Gornersee, Switzerland, J. Glaciol., 53, 189–200, https://doi.org/10.3189/172756507782202784, 2007.
Jenson, A., Amundson, J. M., Kingslake, J., and Hood, E.: Long-period variability in ice-dammed glacier outburst floods due to evolving catchment geometry, The Cryosphere, 16, 333–347, https://doi.org/10.5194/tc-16-333-2022, 2022.
Jiang, S., Jiang, C., and Jiang, W.: Efficient structure from motion for large-scale UAV images: A review and a comparison of SfM tools, ISPRS J. Photogramm., 167, 230–251, https://doi.org/10.1016/J.ISPRSJPRS.2020.04.016, 2020.
Jouvet, G., Weidmann, Y., van Dongen, E., Lüthi, M. P., Vieli, A., and Ryan, J. C.: High-Endurance UAV for Monitoring Calving Glaciers: Application to the Inglefield Bredning and Eqip Sermia, Greenland, Front. Earth Sci., 7, 206, https://doi.org/10.3389/FEART.2019.00206, 2019.
Kjeldsen, K. K., Mortensen, J., Bendtsen, J., Petersen, D., Lennert, K., and Rysgaard, S.: Ice-dammed lake drainage cools and raises surface salinities in a tidewater outlet glacier fjord, west Greenland, J. Geophys. Res.-Earth, 119, 1310–1321, https://doi.org/10.1002/2013JF003034, 2014.
Kjeldsen, K. K., Khan, S. A., Bjørk, A. A., Nielsen, K., and Mouginot, J.: Ice-dammed lake drainage in west Greenland: Drainage pattern and implications on ice flow and bedrock motion, Geophys. Res. Lett., 44, 7320–7327, https://doi.org/10.1002/2017GL074081, 2017.
Lamsters, K., Karušs, J., Krievāns, M., and Ješkins, J.: High-Resolution Surface and Bed Topography Mapping of Russell Glacier (SW Greenland) Using UAV and GPR, ISPRS Ann. Photogramm. Remote Sens. Spatial Inf. Sci., V-2-2020, 757–763, https://doi.org/10.5194/isprs-annals-V-2-2020-757-2020, 2020.
McNabb, R.: Pybob: A Python Package of Geospatial Tools, Github [code], https://github.com/iamdonovan/pybob (last access: 28 January 2021), 2019.
Mernild, S. H. and Hasholt, B.: Observed runoff, jökulhlaups and suspended sediment load from the Greenland ice sheet at kangerlussuaq, west Greenland, 2007 and 2008, J. Glaciol., 55, 855–858, https://doi.org/10.3189/002214309790152465, 2009.
Mikkelsen, A. B., Hasholt, B., Knudsen, N. T., and Nielsen, M. H.: Jökulhlaups and sediment transport in watson river, kangerlussuaq, west greenland, Hydrol. Res., 44, 58–67, https://doi.org/10.2166/nh.2012.165, 2013.
Noh, M. J. and Howat, I. M.: Automated stereo-photogrammetric DEM generation at high latitudes: Surface Extraction with TIN-based Search-space Minimization (SETSM) validation and demonstration over glaciated regions, GIScience & Remote Sensing, 52, 198–217, https://doi.org/10.1080/15481603.2015.1008621, 2015.
Nuth, C. and Kääb, A.: Co-registration and bias corrections of satellite elevation data sets for quantifying glacier thickness change, The Cryosphere, 5, 271–290, https://doi.org/10.5194/tc-5-271-2011, 2011.
Planet Team: Planet Application Program Interface, in: Space for Life on Earth, San Francisco, CA, https://api.planet.com (last access: 1 May 2022), 2017.
Russell, A. J.: A comparison of two recent jokulhlaups from an ice-dammed lake, Sondre Stromfjord, West Greenland, J. Glaciol., 35, 157–162, https://doi.org/10.3189/s0022143000004433, 1989.
Russell, A. J.: Controls on the sedimentology of an ice-contact jökulhlaup-dominated delta, Kangerlussuaq, west Greenland, Sediment Geol., 193, 131–148, https://doi.org/10.1016/j.sedgeo.2006.01.007, 2007.
Russell, A. J. and de Jong, C.: Lake drainage mechanisms for the ice-dammed oberer russellsee, Søndre Strømfjord, West Greenland, Zeitsch, Gletscherk. Glazialg., 24, 143–147, 1988.
Russell, A. J., Carrivick, J. L., Ingeman-Nielsen, T., Yde, J. C., and Williams, M.: A New Cycle of Jökulhlaups at Russell Glacier, Kangerlussuaq, West Greenland, J. Glaciol., 57, 238–246, https://doi.org/10.3189/002214311796405997, 2011.
Shugar, D. H., Burr, A., Haritashya, U. K., Kargel, J. S., Watson, C. S., Kennedy, M. C., Bevington, A. R., Betts, R. A., Harrison, S., and Strattman, K.: Rapid worldwide growth of glacial lakes since 1990, Nat. Clim. Change, 10, 939–945, https://doi.org/10.1038/s41558-020-0855-4, 2020.
Sugiyama, S., Bauder, A., Weiss, P., and Funk, M.: Reversal of ice motion during the outburst of a glacier-dammed lake on Gornergletscher, Switzerland, J. Glaciol., 53, 172–180, https://doi.org/10.3189/172756507782202847, 2007.
Tweed, F. S. and Russell, A. J.: Controls on the formation and sudden drainage of glacier-impounded lakes: implications for jökulhlaup characteristics, Prog. Phys. Geog., 23, 79–110, 1999.
van As, D., Bech Mikkelsen, A., Holtegaard Nielsen, M., Box, J. E., Claesson Liljedahl, L., Lindbäck, K., Pitcher, L., and Hasholt, B.: Hypsometric amplification and routing moderation of Greenland ice sheet meltwater release, The Cryosphere, 11, 1371–1386, https://doi.org/10.5194/tc-11-1371-2017, 2017.