the Creative Commons Attribution 4.0 License.
the Creative Commons Attribution 4.0 License.
 | 06 Mar 2023
Improved estimation of the bulk ice crystal fabric asymmetry from polarimetric phase co-registration
Tamara Annina Gerber
Olaf Eisen
M. Reza Ershadi
Nicolas Stoll
Ilka Weikusat
Angelika Humbert
The bulk crystal orientation in ice influences the flow of glaciers and ice streams. The ice c-axes fabric is most reliably derived from ice cores. Because these are sparse, the spatial and vertical distribution of the fabric in the Greenland and Antarctic ice sheets is largely unknown. In recent years, methods have been developed to determine fabric characteristics from polarimetric radar measurements. The aim of this paper is to present an improved method to infer the horizontal fabric asymmetry by precisely determining the travel-time difference using co-polarised phase-sensitive radar data. We applied this method to six radar measurements from the East Greenland Ice-core Project (EastGRIP) drill site on Greenland's largest ice stream to give a proof of concept by comparing the results with the horizontal asymmetry of the bulk crystal anisotropy derived from the ice core. This comparison shows an excellent agreement, which is a large improvement compared to previously used methods. Our approach is particularly useful for determining the vertical profile of the fabric asymmetry in higher resolution and over larger depths than was achievable with previous methods, especially in regions with strong asymmetry.
- Article
(2354 KB) - Full-text XML
- BibTeX
- EndNote


The distribution of the crystallographic-axis (c-axis) orientation fabric (henceforth fabric) in glaciers and ice sheets is a result of ice deformation history that can influence present-day ice flow dynamics (Alley, 1988; Faria et al., 2014). Due to the mechanical anisotropy of ice crystals, the bulk viscosity is a directional quantity, spanning several orders of magnitude depending on the orientation of stresses with respect to the fabric type and orientation (Cuffey and Paterson, 2010). While some ice flow models already account for fabric evolution and/or its effect on ice flow (e.g. Thorsteinsson, 2002; Gillet-Chaulet et al., 2006; Seddik et al., 2008; Martín et al., 2009), the validation of these models is challenged by the lack of in situ data.
Most reliably, the crystal fabric of ice can be determined from the analysis of ice core thin sections (e.g. Thorsteinsson et al., 1997; Azuma et al., 1999; Wang et al., 2002; Montagnat et al., 2014; Weikusat et al., 2017). Since deep ice cores are sparse in Greenland and Antarctica and often restricted to domes with rather undisturbed stratigraphy, little is known about the spatial distribution of crystal fabric anisotropy of ice sheets. It is therefore of great importance to use other methods in order to infer the spatial and vertical distribution of the fabric asymmetry, e.g. for improving ice flow models and determining past flow and deformation.
Ice crystals are uniaxially birefringent (Hargreaves, 1978). This means that ice crystals are dielectrically anisotropic due to crystal anisotropy and thus allow the horizontal fabric asymmetry to be determined from polarimetric radar surveys (e.g. Fujita et al., 2006; Drews et al., 2012; Leinss et al., 2016; Brisbourne et al., 2019; Jordan et al., 2019, 2020; Young et al., 2021a, b; Ershadi et al., 2022; Jordan et al., 2022; Gerber et al., 2022), with certain limitations (Rathmann et al., 2022). Since polarimetric radar measurements are easier to conduct than ice core analyses, they enable a greater spatial coverage and thus offer the opportunity to examine the distribution of fabric asymmetry. For vertically propagating radio waves, the relevant dielectric anisotropy is the difference between the bulk horizontal permittivities (Fujita et al., 2000). One way of inferring the horizontal fabric asymmetry is based on a polarimetric coherence method (Dall, 2010), which refers to the strength of the phase correlation between orthogonal polarisations. This method has recently been applied to polarimetric radar data and compared with the fabric asymmetry from the NEEM ice core in Greenland (Jordan et al., 2019), WAIS Divide ice core in West Antarctica (Young et al., 2021a), or the EDML and EDC ice cores in East Antarctica (Ershadi et al., 2022). However, this method has some limitations (Leinss et al., 2016). Most importantly, either the method can only be used where the asymmetry of the fabric is weak or otherwise its application is limited to shallow depth (Jordan et al., 2022), which we discuss later in detail.
In this study, we infer the horizontal asymmetry of the bulk crystal fabric at the East Greenland Ice-core Project (EastGRIP) drill site from co-polarised phase-sensitive radar measurements by using a new, improved coherence method. This method differs from previously used analysis schemes and has the advantage that the asymmetry can be determined with much higher vertical resolution and, regardless of its strength, up to the onset of the noise level. We present a proof of concept by comparing the derived horizontal fabric asymmetry with fabric data from the ice core analysis. A glaciological interpretation of the detected fabric asymmetry regarding the flow dynamics in the region of the EastGRIP drill site is part of a larger study by Gerber et al. (2022), and we refer to their study for ice-dynamical interpretations.
In order to investigate ice flow dynamics of Greenland's largest ice stream, the Northeast Greenland Ice Stream (NEGIS), an ice core is being drilled through the ∼2668 m thick ice (Zeising and Humbert, 2021) as part of EastGRIP. In the vicinity of the EastGRIP drill site (75.63∘ N, 35.99∘ W in 2019), we performed polarimetric measurements with a phase-sensitive radio echo sounder (pRES; Brennan et al., 2014; Nicholls et al., 2015) in 2019 within the drill trench next to the core location (CL; ∼10 m apart) and at five sites (called GRID) within 20×20 m2 approximately 360 m from the drill site (Fig. 1). These five sites are labelled depending on their cardinal direction (N, E, S and W) compared to the centre point (C). The pRES is a ground-based nadir-looking frequency-modulated continuous-wave (FMCW) radar, which allows us to determine vertical displacements of reflections within firn and ice from repeated measurements with a high precision of ∼1 mm. While the pRES is mainly operated to derive basal melt rates (e.g. Marsh et al., 2016; Stewart et al., 2019; Zeising et al., 2022), it can also be used to estimate the ice fabric from polarimetric measurements (Brisbourne et al., 2019; Jordan et al., 2020; Young et al., 2021a; Ershadi et al., 2022; Jordan et al., 2022).
A polarimetric pRES measurement consists of several measurements with different antenna orientations. The pRES transmits linearly polarised electromagnetic waves via the transmitting skeleton slot antenna and records the reflected signals in one direction with another antenna. This allows co-polarised measurements to be made in which the two antennas are oriented in the same direction. While in an hh measurement each dipole of the antennas points towards the other, in a vv measurement they are perpendicular to the hh measurement (Fig. 1c). Recent studies used quad-polarised acquisitions which additionally include hv and vh measurements, where the polarisation direction of the transmitting and receiving antenna is rotated by 90∘ (e.g. Brisbourne et al., 2019; Young et al., 2021a; Ershadi et al., 2022; Jordan et al., 2022). However, this study focuses on co-polarised measurements.
We aligned the antennas at an arbitrary azimuthal angle of roughly 258∘ (at CL) and 168∘ (at GRID) clockwise to the magnetic north (283∘ and 193∘ true north). The ice flow direction at EastGRIP is roughly 58∘ magnetic north. We performed multi-polarised measurements by rotating each antenna separately horizontally clockwise in 22.5∘ steps up to 157.5∘. Here, we only considered the co-polarised measurements taken roughly in the ice flow direction (hh; 55∘ to the magnetic north) and perpendicularly to ice flow (vv; 145∘ to the magnetic north). During each measurement, the pRES transmitted a sequence of chirps by linearly increasing the transmitted frequency from 200 to 400 MHz within 1 s for each chirp. In order to achieve a higher signal-to-noise ratio, the measurements at CL contained 250 chirps and those of the GRID contained 100 chirps per measurement.
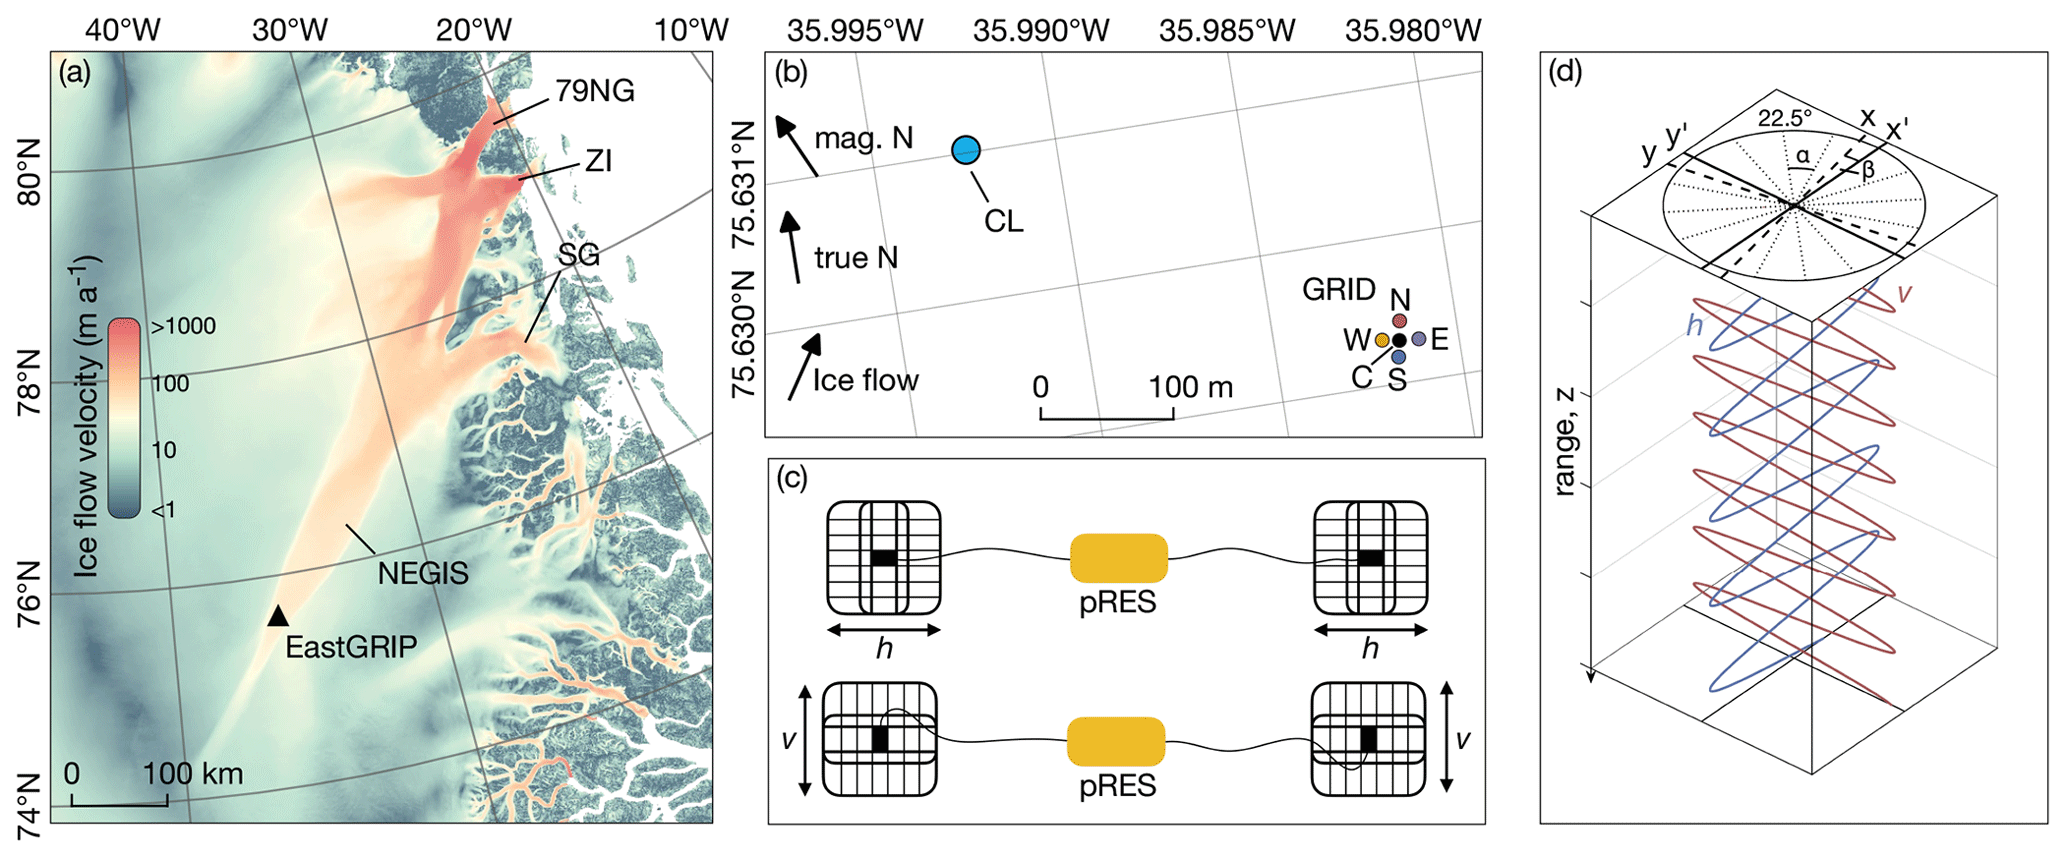
Figure 1Location and orientation of polarimetric pRES measurements. (a) Surface ice flow velocity of the Greenland Ice Sheet (Joughin et al., 2016, 2018), showing the three major outlet glaciers of the Northeast Greenland Ice Stream (NEGIS): Nioghalvfjerdsbrae (79 N Glacier, 79NG), Zachariae Isstrøm (ZI) and Storstrømmen Glacier (SG). The location of the EastGRIP drill site is denoted by the black triangle. (b) Location of polarimetric pRES measurements at CL and at GRID. Arrows show the direction of the magnetic north, true north and ice flow. (c) Sketch of a polarimetric pRES measurement with hh and a vv antenna orientation. (d) Sketch of propagating waves with polarisations in the x′ (h) and y′ (v) directions (solid line) in the x–y coordinate system (dashed line). Dotted lines show the (unused) multi-polarised measurements, separated by . Ice flow is in the x direction with an angular offset of β to the hh measurement in the x′ direction.
3.1 Fabric anisotropy from ice core analysis
Every 5–15 m of depth of the ice core, a 55 cm long section was analysed for fabric data. Details of the sample preparation, data acquisition and processing are given in Stoll et al. (2021). The grain-size-weighted orientation of the measured c axes can be represented by the second-order orientation tensor. Its normalised eigenvalues,
quantify the strength of the three principal fabric (c-axis) directions. In order to determine the fabric asymmetry, we averaged those eigenvalues from all samples of each section and calculated the difference between the eigenvalues (λ2−λ1 and λ3−λ1).
3.2 Horizontal fabric asymmetry from radar measurements
If two electromagnetic waves, whose polarisation in x′ and polarisation in y′ are perpendicular to each other, propagate through an anisotropic medium, their depth-averaged propagation velocities and differ due to the horizontal dielectric anisotropy (Hargreaves, 1978):
where c0 is the speed of light in vacuum, and are the two-way travel times to a reflector at depth z, and and are the permittivities averaged over the whole depth in the corresponding polarisation directions x′ and y′. The resulting difference in two-way travel-time of backscatter from a reflector at depth z is
and thus the vertical profiles of the depth-averaged permittivities are
These dielectric permittivities are the average values over the entire depth from the surface to the depth z. In order to calculate the vertical profile of the horizontal dielectric anisotropy , the local change in two-way travel time , for a given infinitesimal depth window δz, needs to be taken into account:
If it is assumed that the ice crystals are an effective medium at ice-penetrating frequencies, the bulk horizontal dielectric anisotropy for the two polarisations in the x′ and y′ directions, , is a function of the horizontal fabric asymmetry and of the dielectric anisotropy of an ice crystal Δε′:
(Fujita et al., 2006; Jordan et al., 2019). This assumes that the wavelength is much longer than the average grain size, which is the case for the frequency range from 200 to 400 MHz and the corresponding wavelengths from 0.42 to 0.84 m. Matsuoka et al. (1997) found for ice-penetrating radar frequencies. Finally, the horizontal fabric asymmetry at depth z is given by
Thus, the bulk dielectric anisotropy and, based on this, the horizontal fabric asymmetry can be determined from the difference in the two-way travel time . The vertical resolution of depends on the precise determination of , which used to be a problem for previous radar systems that did not have the required resolution in the time domain. This is the main advantage of the in-depth analysis of the phase, which is why polarimetric pRES measurements offer the chance to investigate the horizontal fabric asymmetry in the ice.
3.3 Phase-sensitive radar data analysis
For data processing, we followed Brennan et al. (2014) and Stewart et al. (2019) in order to obtain the complex valued signals shh and svv (subscripts indicate the transmitted and received polarisation) as a function of the two-way travel time with the amplitude and its phase. We convert s from a time t to depth z domain by using dielectric permittivities derived from dielectric profiling (DEP) of the EastGRIP ice core by Mojtabavi et al. (2020).
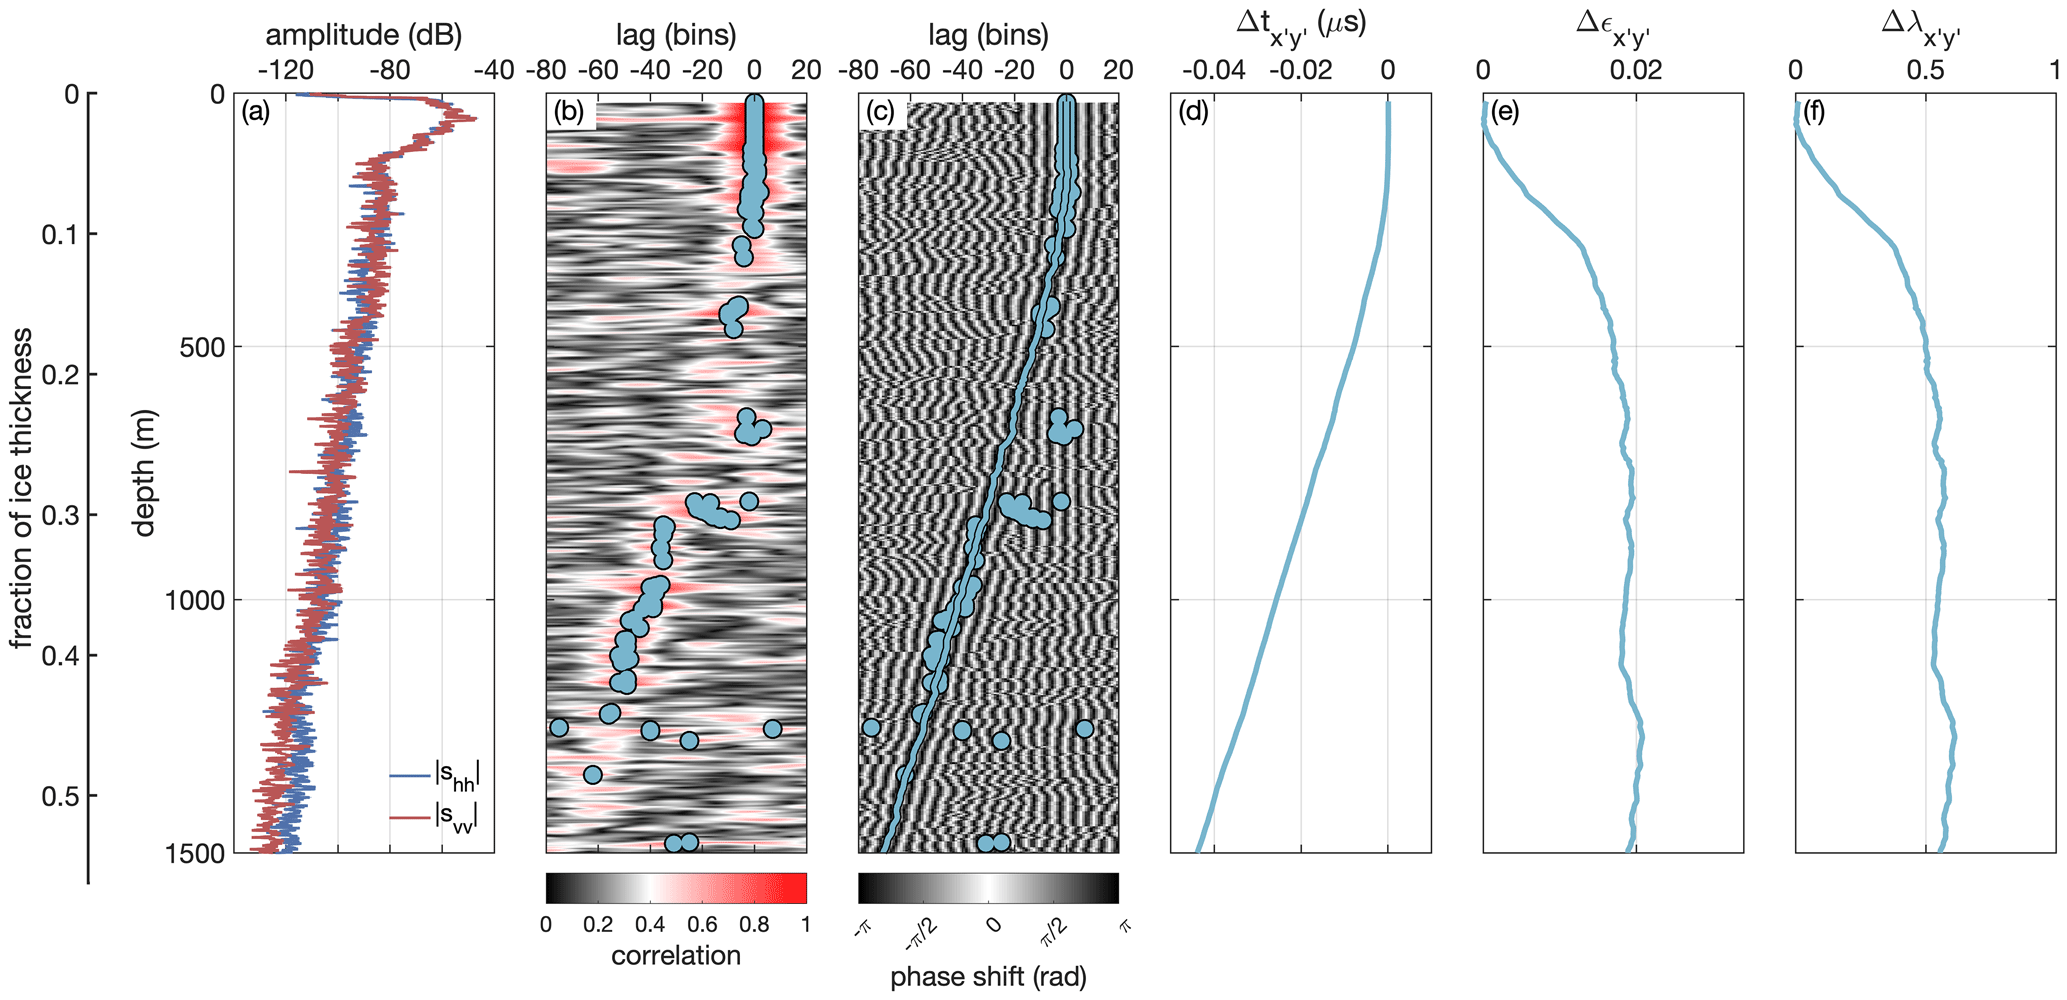
Figure 2Analysis of the horizontal fabric asymmetry from polarimetric pRES measurements at the location CL (Fig. 1) next to the EastGRIP ice core. (a) Magnitude profiles of shh (blue line) and svv (red line) as a function of depth. (b) Cross-correlation |chhvv| of shh and svv as a function of lag and depth. Blue dots mark the lag of best correlation for each segment exceeding a correlation of 0.65. (c) Coherence phase shift ϕhhvv as a function of lag and depth. The blue dots are the same as in (b). The blue line marks the tracked minimum phase shift. (d) Difference in two-way travel time between both measurements at the same depth after smoothing with a 100 m moving-average filter. (e) Difference in horizontal dielectric anisotropy . (f) Difference in horizontal eigenvalues .
The method we apply to compute the travel-time difference is based on a cross-correlation of the co-polarised measurements. The same method is widely used to estimate vertical displacements for strain analysis from repeated pRES measurements as shown by, for example, Jenkins et al. (2006), Gillet-Chaulet et al. (2011), Stewart et al. (2019), and Zeising and Humbert (2021). We divided shh into segments of 12 m depth overlapping by 9 m and calculated for each the complex coherence:
where in is the lower time-bin index of the segment, N the number of bins in the segment, l the range-bin offset (lag) and * the complex conjugate (Stewart et al., 2019). While the magnitude of the complex coherence |chhvv| is the correlation between shh and svv, the argument is the coherence phase ϕhhvv=arg(chhvv) (Jordan et al., 2019).
Our polarimetric cross-correlation approach differs from the coherence method from Dall (2010) that was used by Jordan et al. (2019, 2020, 2022), Young et al. (2021a) and Ershadi et al. (2022). In their applications, the range-bin offset was set to zero (l=0). Thus, these studies interpreted the hhvv coherence phase gradient of the same two-way travel time. In this study, we are analysing the travel-time difference of the same reflector that we determine from a cross-correlation approach. We co-register the phase of shh and svv for every segment by shifting svv by a number of integer bin offsets l (see Eq. 11). We identified the correct l of each segment by following the minimum phase difference from the surface downwards, indicated by high correlation values (Fig. 2b, c).
Next, we compute the travel-time difference (Fig. 2d) for each segment based on the selected lag l and the corresponding coherent phase ϕhhvv (see Brennan et al., 2014):
The first term on the right side is the coarse time-bin offset with being the time-bin spacing (B=200 MHz is the bandwidth, and p=8 is a “padding factor” that reduces the range-bin spacing). The second term is the fine offset derived from the coherent phase of the centre frequency of fc=300 MHz.
Since the travel-time difference is cumulative, we calculated the mean vertical change in the two-way travel times, and , from a 200 m moving window after smoothing with a 100 m moving-average filter. Between the surface and 100 m depth, we changed the method to use a smaller, adaptive moving window that increases with depth. Finally, we compute the dielectric anisotropy from Eqs. (8) and (9) (Fig. 2e) and the horizontal fabric asymmetry from Eq. (10) (Fig. 2f).
The horizontal fabric asymmetries from the polarimetric cross-correlation analysis at all measurement locations show the same vertical distribution with only minor differences (Fig. 3a). These profiles indicate a rapid increase in from 0.06 to 0.4 within the first 12 % of the ice thickness between 125 and 320 m depth. This is followed by a minor increase to 0.55, reached at a depth of 550 m (20 % of the ice thickness). Between this depth and 1400 m, the horizontal anisotropy remains at a high level and varies between 0.52 and 0.62. Below the depth of 1400 m, a low signal-to-noise ratio prevented the analysis of the horizontal fabric asymmetry. This depth corresponds to 52 % of the ice thickness.
In order to demonstrate the improvement over the previous coherence method, we also applied the method from Young et al. (2021a), which is based on the work of Jordan et al. (2019, 2020). The results show the same vertical profile only between 100 and 260 m. Below, the horizontal asymmetry drops to near zero and differs strongly from the result of the new cross-correlation method.
The pRES-derived vertical distribution matches the distribution of the difference in the weighted horizontal eigenvalues from the EastGRIP ice core analysis nearly perfectly (Fig. 3b).
While the differences in the first two eigenvalues (λ2−λ1) show the same rapid increase between 125 and 250 m depth, below, it is λ3−λ1 that is of the same size as the pRES-derived values. This indicates that one of the horizontal eigenvalues becomes the largest value (λ3 by definition) at a depth of 250 m, and thus λ3 switches from the vertical to one horizontal axis. However, since exceeds 0.5, it is obvious that a horizontal eigenvalue is the largest, since λ2−λ1 is always ≤0.5.
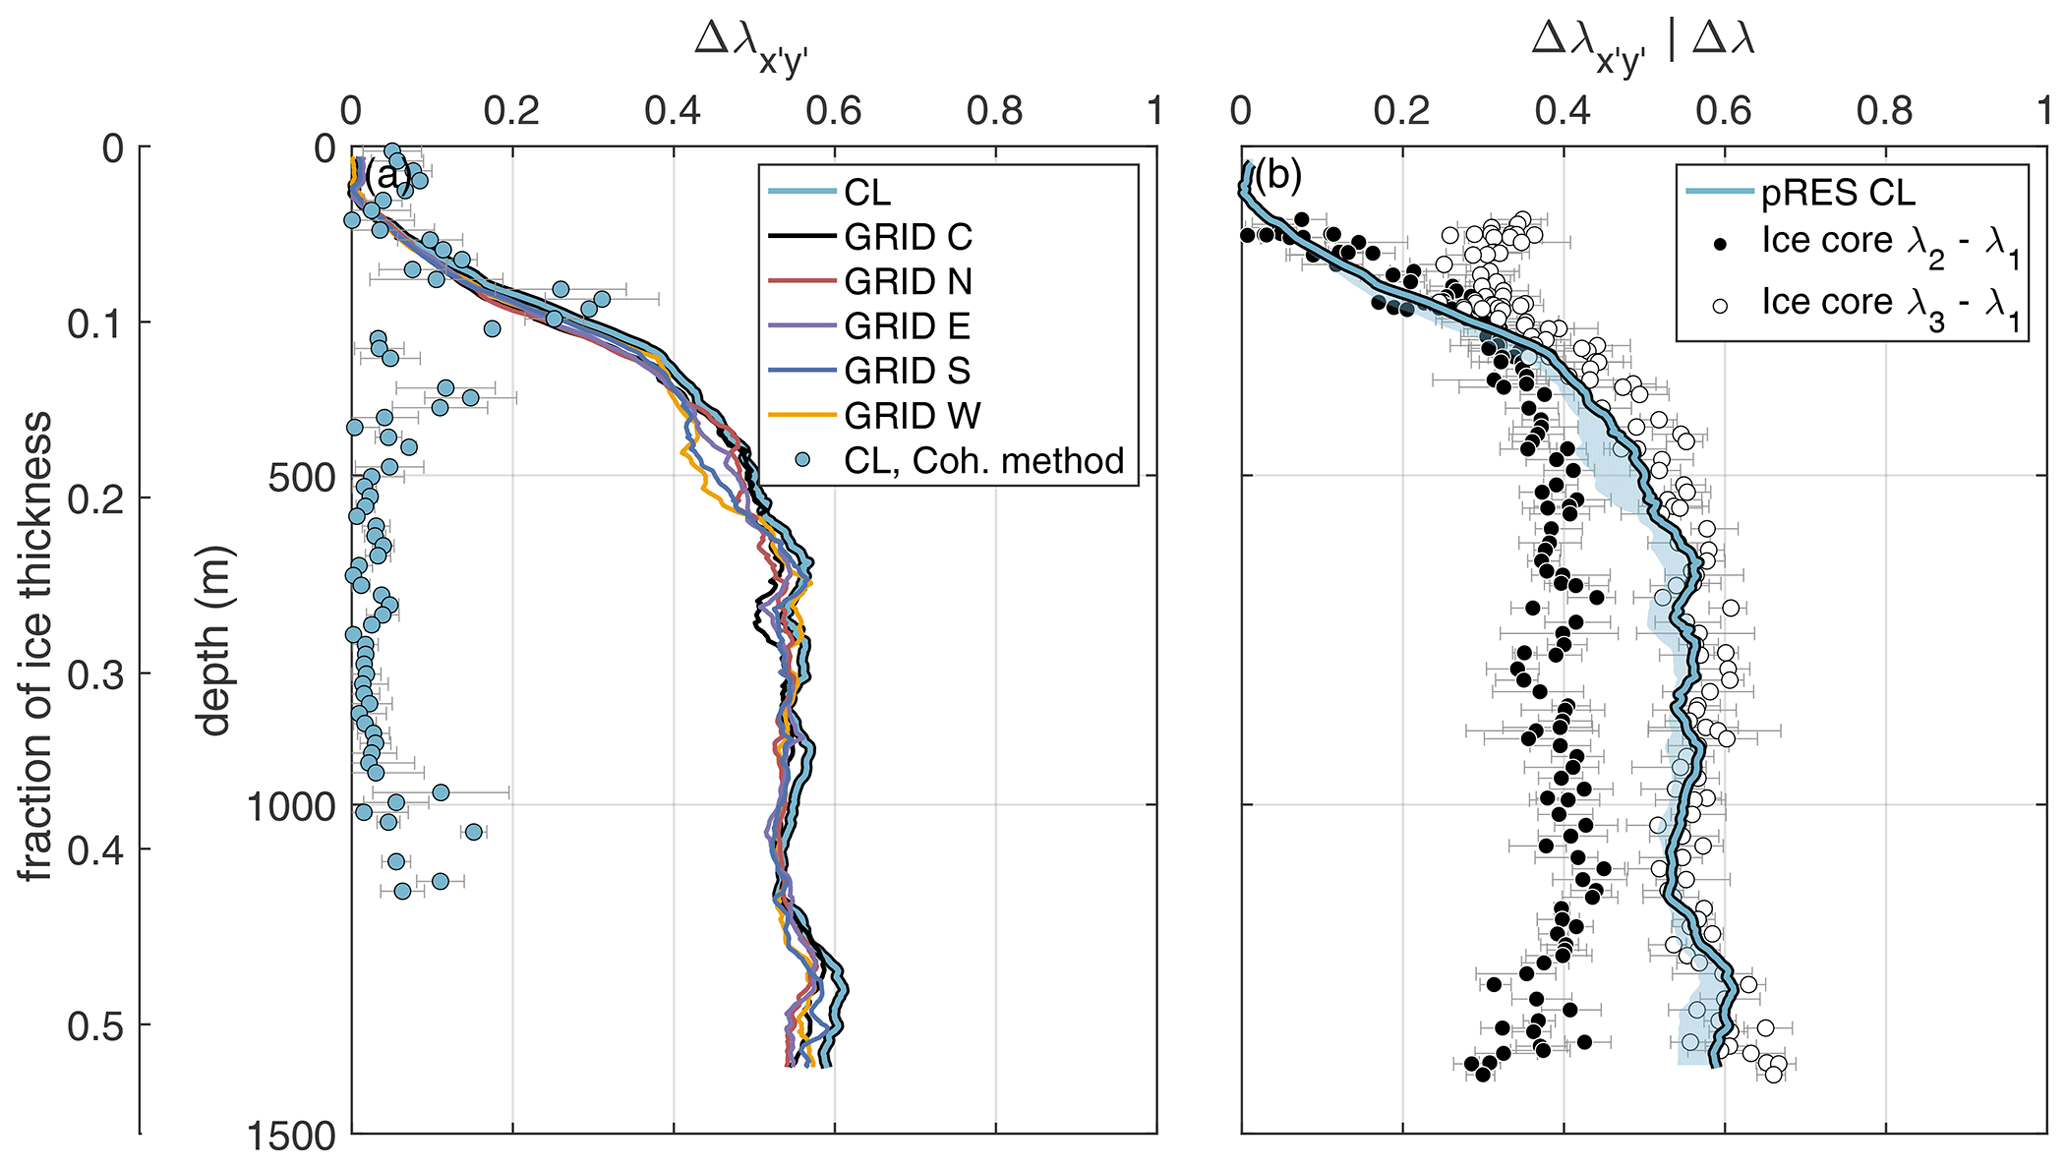
Figure 3Comparison of horizontal fabric asymmetry Δλ determined from different measurements and analysing methods. (a) Fabric asymmetry determined from cross-correlation analysis (lines) of pRES measurements at CL (light blue line) and at the 20×20 m GRID outside drill site as well as from the previous coherence method (Young et al., 2021a) at CL (light blue dots). (b) Fabric asymmetry determined from cross-correlation analysis (lines) of pRES measurements at CL (light blue line) and from weighted horizontal eigenvalues from EastGRIP ice core (black and white dots). The blue-shaded area in (b) marks the range of the polarimetric pRES-derived asymmetry from the measurements in the GRID and at CL.
Our polarimetric cross-correlation method allows us to resolve the travel-time difference in the co-polarised waves with sub-nanosecond resolution. On this basis, the vertical profile of the horizontal dielectric anisotropy as well as the bulk crystal fabric asymmetry can be determined. Despite the high range resolution, the scatter of caused by the uncertainty prevented a determination of the small-scale gradient of the travel-time difference. Thus, the derived horizontal anisotropy only represents a coarse distribution. The horizontal fabric asymmetry derived from the polarimetric cross-correlation of the pRES measurements and the difference in the weighted horizontal eigenvalues from the ice core analysis (λ2−λ1 between 120 and 250 m and λ3−λ1 between 250 and 1400 m) show excellent agreement with a root-mean-square difference in the result of both methods of only 0.03, which corresponds to the uncertainty in the ice core analysis. However, the root-mean-square value of the difference in the unweighted horizontal eigenvalue is 0.06 and thus higher, which is a result compatible with analyses of seismic waves by Kerch et al. (2018).
The determination of the horizontal asymmetry is not possible for every azimuthal angle. The azimuth angle of the antenna has to match the alignment of the orientation of the ice fabric principal axes sufficiently. If the direction of polarisation is rotated to the alignment of the principal axes, no anisotropy can be determined, as the propagation velocity is the same in the x′ and y′ directions. The polarimetric pRES measurements at EastGRIP show that with an azimuthal rotation of the antennas with 22.5∘ increments up to 67.5∘, a determination is possible in two of the four orientations and that the derived horizontal anisotropy is identical in both cases. However, a clear advantage of quad-polarised measurements is that they allow us to reconstruct co-polarised data at a high angular resolution and additionally the determination of the fabric orientation (e.g. Brisbourne et al., 2019; Young et al., 2021a; Ershadi et al., 2022; Jordan et al., 2022). The presented cross-correlation method can also be applied to these reconstructed co-polarised data. Since only four measurements (hh, vv, hv and vh) at one azimuthal angle are necessary to perform a quad-polarised acquisition but eight are necessary for co-polarised measurement (hh and vv) at four different azimuthal angles (0, 22.5, 45 and 67.5∘), quad-polarised measurements should be preferred in the future.
The previously used coherence method estimates the fabric asymmetry by determining the phase gradient of the polarimetric phase difference. This is also possible for high coherence persisting over a few phase cycles (e.g. Young et al., 2021a). However, in the case of a strongly developed fabric asymmetry and thus a rapid phase cycling, the coherence is reduced over depth because the segments that are correlated do not completely overlap and therefore contain different scatterers (Leinss et al., 2016). At ice divides or domes with very little asymmetry, such as at NEEM (Jordan et al., 2019), WAIS Divide (Young et al., 2021a) or EDC (Ershadi et al., 2022), the fabric asymmetry could successfully be determined using previous coherence methods up to the onset of noise. However, in fast-moving areas like the Rutford Ice Stream, Antarctica (Jordan et al., 2022), or NEGIS, Greenland (this study), rapid phase cycling limits the application of the previous coherence method to a few hundred metres below the surface. With the improved polarimetric cross-correlation method, we overcome this limitation through co-registration, which allows us to determine even strong horizontal fabric asymmetries to a much greater depth. Noise limits the evaluation of fabric asymmetry for deeper layers. At the EastGRIP drill site, this limit is about half the ice thickness of the ice with current systems. Determining the fabric for deeper layers from radar measurements, eventually over the whole ice sheet thickness, requires further reduction of the signal-to-noise ratio in a more powerful phase-sensitive radar system that can perform co- or quad-polarised measurements. The applicability of the polarimetric cross-correlation method first needs to be demonstrated for such radar systems.
Ershadi et al. (2022) presented a method to estimate horizontal ice fabric anisotropy based on a non-linear inverse approach by using the coherence phase gradient and power anomaly. Here we tried to use this method on our data to compare the two methods directly. However, the ice fabric orientation in this area rotates several times at different depths of the ice column, which prevents the application of the previous method using the inverse approach. Therefore, the attempt for direct comparison was unsuccessful and is another reason why we regard our method as an improvement which goes beyond previous limits.
We presented a new method to infer the vertical profile of the horizontal fabric asymmetry from polarimetric phase-sensitive radar measurements. Our approach is based on a cross-correlation of co-polarised measurements to derive precisely travel-time differences caused by dielectric anisotropy. In contrast to previous methods, this polarimetric cross-correlation approach allows us to analyse even strong horizontal fabric asymmetries at a much greater depth.
The remarkable agreement between the vertical profile of the horizontal fabric asymmetry obtained by our analyses of multiple polarimetric pRES measurements and the fabric measured in the EastGRIP ice core demonstrates the robustness and precision of our method.
In the future, the applicability of our polarimetric cross-correlation method to other radar systems, in particular to polarimetric airborne radar measurements, should be tested. If successful, this would increase the spatial coverage of mapped crystal fabric and its variability more than would be possible with pointwise polarimetric pRES measurements. Furthermore, it might allow the estimation of the fabric to greater depth. Such an application, which would yield the variation in the horizontal anisotropy along flow lines or across regions of fast flow, like ice streams, would significantly improve the understanding of the link between the stress state and crystal fabric evolution. This would allow us to decrease uncertainties in rheology and thus improve estimates for response times of dynamically active glacial systems to external perturbations, for example, from changing ocean conditions of tidewater glaciers.
Raw data of the multi-polarised pRES measurements (https://doi.org/10.1594/PANGAEA.951267, Zeising and Humbert, 2022) and crystal c axes of ice core samples are published at the World Data Center PANGAEA (https://doi.org/10.1594/PANGAEA.949248, Weikusat et al., 2022). The MATLAB code of the polarimetric cross-correlation method is published at Zenodo (https://doi.org/10.5281/zenodo.7577772, Zeising, 2023). The MATLAB code of the coherence method from Young et al. (2021a) is available at the NERC EDS UK Polar Data Centre (https://doi.org/10.5285/BA1CAF7A-D4E0-4671-972A-E567A25CCD2C, Young and Dawson, 2021).
OZ and AH designed the study and performed the polarimetric radar measurements. OZ processed the data together with MRE and prepared the manuscript with contributions from all co-authors. OZ and TAG developed the method with support from OE. NS and IW prepared the ice core samples used for fabric analyses, performed the measurements, and processed and analysed the fabric data. All authors contributed to writing and editing the manuscript.
At least one of the (co-)authors is a member of the editorial board of The Cryosphere. The peer-review process was guided by an independent editor, and the authors also have no other competing interests to declare.
Publisher’s note: Copernicus Publications remains neutral with regard to jurisdictional claims in published maps and institutional affiliations.
Data were acquired at the EastGRIP camp that kindly hosted this activity as an associate project. EastGRIP is directed and organised by the Centre for Ice and Climate at the Niels Bohr Institute, University of Copenhagen. It is supported by funding agencies and institutions in Denmark (A. P. Møller Foundation, University of Copenhagen), the USA (US National Science Foundation, Office of Polar Programs), Germany (Alfred Wegener Institute, Helmholtz Centre for Polar and Marine Research), Japan (National Institute of Polar Research and Arctic Challenge for Sustainability), Norway (University of Bergen, Trond Mohn Foundation), Switzerland (Swiss National Science Foundation), France (French Polar Institute Paul-Émile Victor, Institute for Geosciences and Environmental Research), Canada (University of Manitoba) and China (Chinese Academy of Sciences, Beijing Normal University).
Nicolas Stoll gratefully acknowledges funding from the Helmholtz Young Investigator Group “The effect of deformation mechanisms on ice sheet dynamics” (VH-NG-802).
The article processing charges for this open-access publication were covered by the Alfred Wegener Institute, Helmholtz Centre for Polar and Marine Research (AWI).
This paper was edited by Joseph MacGregor and reviewed by Thomas Jordan and Nicholas Rathmann.
Alley, R. B.: Fabrics in Polar Ice Sheets: Development and Prediction, Science, 240, 493–495, https://doi.org/10.1126/science.240.4851.493, 1988. a
Azuma, N., Wang, Y., Mori, K., Narita, H., Hondoh, T., Shoji, H., and Watanabe, O.: Textures and fabrics in the Dome F (Antarctica) ice core, Ann. Glaciol., 29, 163–168, https://doi.org/10.3189/172756499781821148, 1999. a
Brennan, P. V., Lok, L. B., Nicholls, K., and Corr, H.: Phase-sensitive FMCW radar system for high-precision Antarctic ice shelf profile monitoring, IET Radar Sonar Nav., 8, 776–786, https://doi.org/10.1049/iet-rsn.2013.0053, 2014. a, b, c
Brisbourne, A. M., Martín, C., Smith, A. M., Baird, A. F., Kendall, J. M., and Kingslake, J.: Constraining Recent Ice Flow History at Korff Ice Rise, West Antarctica, Using Radar and Seismic Measurements of Ice Fabric, J. Geophys. Res.-Earth, 124, 175–194, https://doi.org/10.1029/2018JF004776, 2019. a, b, c, d
Cuffey, K. M. and Paterson, W. S. B.: The Physics of Glaciers, 4th edn., Academic Press, ISBN 978-0-12-369461-4, 2010. a
Dall, J.: Ice sheet anisotropy measured with polarimetric ice sounding radar, in: 2010 IEEE International Geoscience and Remote Sensing Symposium, 2507–2510, 25–30 July 2010, Honolulu, HI, USA, https://doi.org/10.1109/IGARSS.2010.5653528, 2010. a, b
Drews, R., Eisen, O., Steinhage, D., Weikusat, I., Kipfstuhl, S., and Wilhelms, F.: Potential mechanisms for anisotropy in ice-penetrating radar data, J. Glaciol., 58, 613–624, https://doi.org/10.3189/2012JoG11J114, 2012. a
Ershadi, M. R., Drews, R., Martín, C., Eisen, O., Ritz, C., Corr, H., Christmann, J., Zeising, O., Humbert, A., and Mulvaney, R.: Polarimetric radar reveals the spatial distribution of ice fabric at domes and divides in East Antarctica, The Cryosphere, 16, 1719–1739, https://doi.org/10.5194/tc-16-1719-2022, 2022. a, b, c, d, e, f, g, h
Faria, S. H., Weikusat, I., and Azuma, N.: The microstructure of polar ice. Part II: State of the art, J. Struct. Geol., 61, 21–49, https://doi.org/10.1016/j.jsg.2013.11.003, 2014. a
Fujita, S., Matsuoka, T., Ishida, T., Matsuoka, K., and Mae, S.: A summary of the complex dielectric permittivity of ice in the megahertz range and its applications for radar sounding of polar ice sheets, in: Physics of ice core records, 185–212, Hokkaido University Press, http://hdl.handle.net/2115/32469 (last access: 28 January 2023), 2000. a
Fujita, S., Maeno, H., and Matsuoka, K.: Radio-wave depolarization and scattering within ice sheets: a matrix-based model to link radar and ice-core measurements and its application, J. Glaciol., 52, 407–424, https://doi.org/10.3189/172756506781828548, 2006. a, b
Gerber, T., Lilien, D., Rathmann, N., Franke, S., Young, T. J., Valero-Delgado, F., Ershadi, R., Drews, R., Zeising, O., Humbert, A., Stoll, N., Weikusat, I., Grinsted, A., Hvidberg, C., Jansen, D., Miller, H., Helm, V., Steinhage, D., O'Neill, C., Gogineni, P., Paden, J., Dahl-Jensen, D., and Eisen, O.: Crystal fabric anisotropy causes directional hardening of the Northeast Greenland Ice Stream, Preprint (Version 1), Research Square, https://doi.org/10.21203/rs.3.rs-1812870/v1, 2022. a, b
Gillet-Chaulet, F., Gagliardini, O., Meyssonnier, J., Zwinger, T., and Ruokolainen, J.: Flow-induced anisotropy in polar ice and related ice-sheet flow modelling, J. Non-Newton. Fluid, 134, 33–43, https://doi.org/10.1016/j.jnnfm.2005.11.005, 2006. a
Gillet-Chaulet, F., Hindmarsh, R. C. A., Corr, H. F. J., King, E. C., and Jenkins, A.: In-situ quantification of ice rheology and direct measurement of the Raymond Effect at Summit, Greenland using a phase-sensitive radar, Geophys. Res. Lett., 38, L24503, https://doi.org/10.1029/2011GL049843, 2011. a
Hargreaves, N. D.: The Radio-Frequency Birefringence of Polar Ice, J. Glaciol., 21, 301–313, https://doi.org/10.3189/S0022143000033499, 1978. a, b
Jenkins, A., Corr, H. F., Nicholls, K. W., Stewart, C. L., and Doake, C. S.: Interactions between ice and ocean observed with phase-sensitive radar near an Antarctic ice-shelf grounding line, J. Glaciol., 52, 325–346, https://doi.org/10.3189/172756506781828502, 2006. a
Jordan, T. M., Schroeder, D. M., Castelletti, D., Li, J., and Dall, J.: A Polarimetric Coherence Method to Determine Ice Crystal Orientation Fabric From Radar Sounding: Application to the NEEM Ice Core Region, IEEE T. Geosci. Remote Sens., 57, 8641–8657, https://doi.org/10.1109/TGRS.2019.2921980, 2019. a, b, c, d, e, f, g
Jordan, T. M., Schroeder, D. M., Elsworth, C. W., and Siegfried, M. R.: Estimation of ice fabric within Whillans Ice Stream using polarimetric phase-sensitive radar sounding, Ann. Glaciol., 61, 74–83, https://doi.org/10.1017/aog.2020.6, 2020. a, b, c, d
Jordan, T. M., Martín, C., Brisbourne, A. M., Schroeder, D. M., and Smith, A. M.: Radar Characterization of Ice Crystal Orientation Fabric and Anisotropic Viscosity Within an Antarctic Ice Stream, J. Geophys. Res.-Earth, 127, e2022JF006673, https://doi.org/10.1029/2022JF006673, 2022. a, b, c, d, e, f, g
Joughin, I., Smith, B., Howat, I., and Scambos, T.: MEaSUREs Multi-year Greenland Ice Sheet Velocity Mosaic, Version 1, NASA National Snow and Ice Data Center Distributed Active Archive Center [data set], Boulder, Colorado USA, https://doi.org/10.5067/QUA5Q9SVMSJG., 2016. a
Joughin, I., Smith, B. E., and Howat, I. M.: A complete map of Greenland ice velocity derived from satellite data collected over 20 years, J. Glaciol., 64, 1–11, https://doi.org/10.1017/jog.2017.73, 2018. a
Kerch, J., Diez, A., Weikusat, I., and Eisen, O.: Deriving micro- to macro-scale seismic velocities from ice-core c axis orientations, The Cryosphere, 12, 1715–1734, https://doi.org/10.5194/tc-12-1715-2018, 2018. a
Leinss, S., Löwe, H., Proksch, M., Lemmetyinen, J., Wiesmann, A., and Hajnsek, I.: Anisotropy of seasonal snow measured by polarimetric phase differences in radar time series, The Cryosphere, 10, 1771–1797, https://doi.org/10.5194/tc-10-1771-2016, 2016. a, b, c
Marsh, O. J., Fricker, H. A., Siegfried, M. R., Christianson, K., Nicholls, K. W., Corr, H. F., and Catania, G.: High basal melting forming a channel at the grounding line of Ross Ice Shelf, Antarctica, Geophys. Res. Lett., 43, 250–255, https://doi.org/10.1002/2015GL066612, 2016. a
Martín, C., Gudmundsson, G. H., Pritchard, H. D., and Gagliardini, O.: On the effects of anisotropic rheology on ice flow, internal structure, and the age-depth relationship at ice divides, J. Geophys. Res.-Earth, 114, F04001, https://doi.org/10.1029/2008JF001204, 2009. a
Matsuoka, T., Fujita, S., Morishima, S., and Mae, S.: Precise measurement of dielectric anisotropy in ice Ih at 39 GHz, J. Appl. Phys., 81, 2344–2348, https://doi.org/10.1063/1.364238, 1997. a
Mojtabavi, S., Wilhelms, F., Cook, E., Davies, S. M., Sinnl, G., Skov Jensen, M., Dahl-Jensen, D., Svensson, A., Vinther, B. M., Kipfstuhl, S., Jones, G., Karlsson, N. B., Faria, S. H., Gkinis, V., Kjær, H. A., Erhardt, T., Berben, S. M. P., Nisancioglu, K. H., Koldtoft, I., and Rasmussen, S. O.: A first chronology for the East Greenland Ice-core Project (EGRIP) over the Holocene and last glacial termination, Clim. Past, 16, 2359–2380, https://doi.org/10.5194/cp-16-2359-2020, 2020. a
Montagnat, M., Azuma, N., Dahl-Jensen, D., Eichler, J., Fujita, S., Gillet-Chaulet, F., Kipfstuhl, S., Samyn, D., Svensson, A., and Weikusat, I.: Fabric along the NEEM ice core, Greenland, and its comparison with GRIP and NGRIP ice cores, The Cryosphere, 8, 1129–1138, https://doi.org/10.5194/tc-8-1129-2014, 2014. a
Nicholls, K. W., Corr, H. F., Stewart, C. L., Lok, L. B., Brennan, P. V., and Vaughan, D. G.: A ground-based radar for measuring vertical strain rates and time-varying basal melt rates in ice sheets and shelves, J. Glaciol., 61, 1079–1087, https://doi.org/10.3189/2015JoG15J073, 2015. a
Rathmann, N. M., Lilien, D. A., Grinsted, A., Gerber, T. A., Young, T. J., and Dahl-Jensen, D.: On the Limitations of Using Polarimetric Radar Sounding to Infer the Crystal Orientation Fabric of Ice Masses, Geophys. Res. Lett., 49, e2021GL096244, https://doi.org/10.1029/2021GL096244, 2022. a
Seddik, H., Greve, R., Placidi, L., Hamann, I., and Gagliardini, O.: Application of a continuum-mechanical model for the flow of anisotropic polar ice to the EDML core, Antarctica, J. Glaciol., 54, 631–642, https://doi.org/10.3189/002214308786570755, 2008. a
Stewart, C. L., Christoffersen, P., Nicholls, K. W., Williams, M. J., and Dowdeswell, J. A.: Basal melting of Ross Ice Shelf from solar heat absorption in an ice-front polynya, Nat. Geosci., 12, 435–440, https://doi.org/10.1038/s41561-019-0356-0, 2019. a, b, c, d
Stoll, N., Eichler, J., Hörhold, M., Erhardt, T., Jensen, C., and Weikusat, I.: Microstructure, micro-inclusions, and mineralogy along the EGRIP ice core – Part 1: Localisation of inclusions and deformation patterns, The Cryosphere, 15, 5717–5737, https://doi.org/10.5194/tc-15-5717-2021, 2021. a
Thorsteinsson, T.: Fabric development with nearest-neighbor interaction and dynamic recrystallization, J. Geophys. Res.-Sol. Ea., 107, ECV 3-1–ECV 3-13, https://doi.org/10.1029/2001JB000244, 2002. a
Thorsteinsson, T., Kipfstuhl, J., and Miller, H.: Textures and fabrics in the GRIP ice core, J. Geophys. Res.-Oceans, 102, 26583–26599, https://doi.org/10.1029/97JC00161, 1997. a
Wang, Y., Thorsteinsson, T., Kipfstuhl, J., Miller, H., Dahl-Jensen, D., and Shoji, H.: A vertical girdle fabric in the NorthGRIP deep ice core, North Greenland, Ann. Glaciol., 35, 515–520, https://doi.org/10.3189/172756402781817301, 2002. a
Weikusat, I., Jansen, D., Binder, T., Eichler, J., Faria, S. H., Wilhelms, F., Kipfstuhl, S., Sheldon, S., Miller, H., Dahl-Jensen, D., and Kleiner, T.: Physical analysis of an Antarctic ice core – towards an integration of micro-and macrodynamics of polar ice, Philos. T. R. Soc. A, 375, 20150347, https://doi.org/10.1098/rsta.2015.0347, 2017. a
Weikusat, I., Stoll, N., Kerch, J., Eichler, J., Jansen, D., and Kipfstuhl, S.: Crystal c-axes (fabric analyser G50) of ice core samples (vertical thin sections) collected from the polar ice core EGRIP, 111–1714 m depth, PANGAEA [data set], https://doi.org/10.1594/PANGAEA.949248, 2022. a
Young, T. J. and Dawson, E. J.: Quad-polarimetric ApRES measurements along a 6 km-long transect at the WAIS Divide, December 2019 (Version 1.0), NERC EDS UK Polar Data Centre [data set], https://doi.org/10.5285/BA1CAF7A-D4E0-4671-972A-E567A25CCD2C, 2021. a
Young, T. J., Martín, C., Christoffersen, P., Schroeder, D. M., Tulaczyk, S. M., and Dawson, E. J.: Rapid and accurate polarimetric radar measurements of ice crystal fabric orientation at the Western Antarctic Ice Sheet (WAIS) Divide ice core site, The Cryosphere, 15, 4117–4133, https://doi.org/10.5194/tc-15-4117-2021, 2021a. a, b, c, d, e, f, g, h, i, j, k
Young, T. J., Schroeder, D. M., Jordan, T. M., Christoffersen, P., Tulaczyk, S. M., Culberg, R., and Bienert, N. L.: Inferring Ice Fabric From Birefringence Loss in Airborne Radargrams: Application to the Eastern Shear Margin of Thwaites Glacier, West Antarctica, J. Geophys. Res.-Earth, 126, e2020JF006023, https://doi.org/10.1029/2020JF006023, 2021b. a
Zeising, O.: Polarimetric Cross-Correlation Method, Zenodo [code], https://doi.org/10.5281/zenodo.7577773, 2023. a
Zeising, O. and Humbert, A.: Indication of high basal melting at the EastGRIP drill site on the Northeast Greenland Ice Stream, The Cryosphere, 15, 3119–3128, https://doi.org/10.5194/tc-15-3119-2021, 2021. a, b
Zeising, O. and Humbert, A.: Polarimetric phase-sensitive radar measurements at EastGRIP drill site, 2019, Alfred Wegener Institute, Helmholtz Centre for Polar and Marine Research, Bremerhaven, PANGAEA [data set], https://doi.org/10.1594/PANGAEA.951267, 2022. a
Zeising, O., Steinhage, D., Nicholls, K. W., Corr, H. F. J., Stewart, C. L., and Humbert, A.: Basal melt of the southern Filchner Ice Shelf, Antarctica, The Cryosphere, 16, 1469–1482, https://doi.org/10.5194/tc-16-1469-2022, 2022. a