the Creative Commons Attribution 4.0 License.
the Creative Commons Attribution 4.0 License.
 | 14 Mar 2022
Effective coefficient of diffusion and permeability of firn at Dome C and Lock In, Antarctica, and of various snow types – estimates over the 100–850 kg m−3 density range
Alexis Burr
Armelle Philip
Frédéric Flin
Christian Geindreau
Modeling air transport through the entire firn column of polar ice sheets is needed to interpret climate archives. To this end, different regressions have been proposed in the past to estimate the effective coefficient of diffusion and permeability of firn. These regressions are often valid for specific depth or porosity ranges only. Also, they constitute a source of uncertainty as evaluations have been limited by the lack of reliable data of firn transport properties. To contribute with a new dataset, this study presents the effective coefficient of diffusion and the permeability at Dome C and Lock In, Antarctica, from the near-surface to the close-off (23 to 133 m depth). Also, microstructure is characterized based on density, specific surface area, closed porosity ratio, connectivity index, and structural anisotropy through the correlation lengths. All properties were estimated based on pore-scale computations from 3D tomographic images of firn samples. The normalized diffusion coefficient ranges from 1.9 × 10⁻¹ to 8.3 × 10⁻⁵, and permeability ranges from 1.2 × 10⁻⁹ to 1.1 × 10⁻¹² m2, for densities between 565 and 888 kg m−3. No or little anisotropy is reported. Next, we investigate the relationship of the transport properties with density over the firn density range (550–850 kg m−3), as well as over the entire density range encountered in the ice sheets (100–850 kg m−3), by extending the datasets with transport properties of alpine and artificial snow from previous studies. Classical analytical models and regressions from literature are evaluated against the estimates from pore-scale simulations. For firn, good agreements are found for permeability and the diffusion coefficient with two existing regressions of the literature based on open porosity despite the rather different site conditions (Greenland). Over the entire 100–850 kg m−3 density range, permeability is accurately reproduced by the Carman–Kozeny and self-consistent (spherical bi-composite) models when expressed in terms of a rescaled porosity, , to account for pore closure, where ϕoff is the close-off porosity. For the normalized diffusion coefficient, none of the evaluated formulas were satisfactory, so we propose a new regression based on the rescaled porosity that reads .
- Article
(3175 KB) - Full-text XML
-
Supplement
(75 KB) - BibTeX
- EndNote


Atmospheric air circulates through the interconnected pores of snow and firn down to the firn–ice transition where pores close. Air entrapped in the closed pores of ice preserves past atmospheric air, thousands to millions of years old, providing invaluable data on past Earth environments (e.g., Petit et al., 1999; Lüthi et al., 2008; Loulergue et al., 2008; Yan et al., 2019). As gas transport from the surface is slow, air in the open pores of firn can be as old as several decades up to hundreds of years (Schwander et al., 1988; Battle et al., 1996; Kaspers et al., 2004). Among other challenges, interpreting firn and ice data with respect to past Earth conditions and events requires modeling of the air transport processes through the entire snow–firn–ice column (e.g., Trudinger et al., 1997; Rommelaere et al., 1997; Goujon et al., 2003; Severinghaus and Battle, 2006; Hörhold, 2006; Courville et al., 2007; Witrant et al., 2012; Buizert et al., 2012; Stevens et al., 2020). Two of the important properties for gas transport in snow and firn are the effective coefficient of diffusion and the intrinsic permeability.
The effective diffusion coefficient tensor D (m2 s−1) describes the molecular diffusion of a given gas through a layer of snow or firn, which is a dominant transport process taking place throughout the snow–firn column until the close-off (Schwander and Stauffer, 1984; Sowers et al., 1992). Defined in a tensorial way, the diffusion coefficient links the gas density gradient ∇ρg (kg m−3 m−1) and the diffusion flux per unit area J (kg m−2 s−1) through Fick's law: . The intrinsic permeability tensor K (m2) controls air advection through snow or firn forced by air pressure differences, typically caused by wind at the surface (windpumping) (Colbeck, 1989; Waddington et al., 1996; Kawamura et al., 2006). Permeability links the air pressure gradient ∇p (Pa m−1) and the discharge per unit area q (m s−1) through Darcy's law: , where μ is the dynamic viscosity of the fluid (kg m−1 s−1). In contrast to molecular diffusion, air advection is not always present in snow and firn and, if so, affects mostly their uppermost meters (Albert, 1996; Albert and Shultz, 2002; Albert et al., 2004). The effective diffusion coefficient and permeability depend on density and open porosity at first order but also on other microstructural parameters of snow and firn such as pore morphology.
The effective coefficient of diffusion and the permeability of snow and firn were investigated at numerous sites of ice sheets and glaciers (e.g., Schwander, 1989; Fabre et al., 2000; Albert et al., 2000; Albert and Shultz, 2002; Freitag et al., 2002; Goujon et al., 2003; Rick and Albert, 2004; Hörhold et al., 2009; Courville et al., 2010; Adolph and Albert, 2014; Sommers et al., 2017). Some come along with a characterization of the microstructure based on 3D images from serial sections (e.g., Rick and Albert, 2004; Freitag et al., 2002) or micro-tomography (e.g., Hörhold et al., 2009; Courville et al., 2010; Adolph and Albert, 2014). Different parameterizations of the properties were suggested (e.g., Schwander et al., 1988; Fabre et al., 2000; Witrant et al., 2012; Adolph and Albert, 2014), including the ones shown in Table 1. Adolph and Albert (2014) compared different parameterizations of the diffusion coefficient and permeability against their measurements at Summit, Greenland. Stevens (2018) compared profiles of effective coefficient of diffusion and δ15N predicted by six different parameterizations at NEEM, Greenland, and the South Pole, Antarctica. Few parameterizations are based on measurements or modeling over the entire firn column (Adolph and Albert, 2014), limiting their range of validity (Table 1). It is especially crucial to describe air transport properties well in the lock-in zone from the beginning of the pore closure to the close-off. These parameterizations require the knowledge of the relationships of the closed porosity with depth (and/or density). Such a prediction is still poorly restricted, and only limited parameterizations are available (Schwander, 1989; Goujon et al., 2003; Severinghaus and Battle, 2006; Mitchell et al., 2015; Schaller et al., 2017), which adds uncertainties to the estimation of properties, as shown by a comparison of parameterizations of closed porosity at Lock In and Vostok, Antarctica, by Fourteau et al. (2019). Finally, some conclusions from the above-mentioned studies are that parameterizations of transport properties are strongly site-dependent, which might indicate that regression based on open porosity or porosity alone is not sufficient and that there is a more complex relationship with microstructure or other environmental parameters (Courville et al., 2007; Adolph and Albert, 2014; Keegan et al., 2019).
In the present study, we provide new datasets of the effective coefficient of diffusion and permeability from the near-surface to the close-off for two sites in Antarctica: Dome C and Lock In. Properties of a firn sample from 80 m depth at Vostok, Antarctica, are also presented for additional comparisons. Estimates are based on computations from 3D high-resolution tomographic images of microstructure, as used in many snow studies (e.g., Zermatten et al., 2011; Calonne et al., 2012, 2014b) and in a few firn studies (Freitag et al., 2002; Courville et al., 2010; Fourteau et al., 2019). The 3D tensor of the properties is obtained and allows us to assess the anisotropy of properties and compare lateral to vertical gas transport. In addition to transport properties, a variety of parameters to characterize the firn microstructure are computed from the images (density, specific surface area, closed porosity ratio, connectivity index, and structural anisotropy through the correlation lengths). Further, we investigate the relationship of the effective coefficient of diffusion and permeability with density in the firn density range (550–850 kg m−3), as well as in the entire density range encountered in the ice sheet (100–850 kg m−3), by including data of transport properties of alpine and artificial snow from previous studies. Classical analytical models based on simplified microstructures, as well as regressions from previous firn studies, are evaluated against our results. A new regression is proposed to estimate the diffusion coefficient in the whole density range.
2.1 3D images
This study is based on a set of 62 3D images of snow, firn, and bubbly ice that were previously analyzed in Calonne et al. (2019). A total of 27 images are samples of firn or bubbly ice from three locations in Antarctica: Dome C, near Concordia Station (75∘6′ S, 123∘21′ E), Lock In, located at 136 km away from Concordia Station (74∘8.310′ S, 126∘9.510′ E), and Vostok. These samples were extracted from ice cores collected during previous expeditions (Coléou and Barnola, 2001; Gautier et al., 2016; Burr et al., 2018) at depths ranging from 23 to 133 m and show different levels of densification until the close-off. Mean annual temperature and mean annual accumulation rate are of −55 ∘C and 2.5 cm yr−1 at Dome C, of −53.15 ∘C and 4.5 cm yr−1 at Lock In, and of −57 ∘C and 2.2 cm yr−1 at Vostok (from Burr et al., 2018, and references within). A total of 35 images are samples of snow, covering the main snow types, either collected in the field or obtained from experiments under controlled conditions in a cold laboratory (Coléou et al., 2001; Flin et al., 2004, 2011; Calonne et al., 2014a). The 3D images are binary images (air or ice) with resolutions between 5 and 15 µm and with dimensions between 2.53 mm3 and 6.72 × 25 mm3. Computations of properties were performed with cubic images between 2.53 and 103 mm3 in size for snow and 6.73 mm3 in size for firn. These images correspond to volumes equal to or greater than the representative elementary volumes estimated for permeability, which is the property that requires the largest volume among the other properties computed in this paper (Kanit et al., 2003; Calonne et al., 2012, 2014a). Estimations of the representative elementary volumes for permeability were performed on selected images following Calonne et al. (2011) by computing the property over subvolumes of increasing sizes. More information on the samples and 3D images can be found in Calonne et al. (2019).
2.2 Effective coefficient of diffusion and intrinsic permeability
The 3D tensor of the effective coefficient of diffusion D (m2 s−1) and of the intrinsic permeability K (m2) were computed from the set of 3D images of firn. Computed properties from the images of snow are from the previous studies of Calonne et al. (2012) and Calonne et al. (2014b). A comprehensive description of the computation method can be found in Calonne et al. (2012) for the permeability and in Calonne et al. (2014a) for the diffusion coefficient. Briefly, a specific boundary value problem, describing vapor diffusion or air flow through the porous medium and arising from a homogenization technique (Auriault et al., 2009; Calonne et al., 2015), is solved on representative elementary volumes of the images using the software GeoDict (GeoDict from Math2Market GmbH, Germany, https://www.geodict.com, 10 March 2022) based on the finite difference method, applying periodic boundary conditions on the external boundaries. The effective diffusion coefficient was computed with an artificial diffusion coefficient of gas in free air set to Dair=1 m2 s−1. In this study, we present the normalized values of the effective diffusion (dimensionless). These normalized values can be multiplied by the diffusion coefficient of the gas of interest in free air to get the physical, non-normalized values of effective diffusion coefficient of this gas in snow or firn (for example, the diffusion coefficient of vapor in free air, that is m2 s−1 at −10 ∘C (Massman, 1998), could be used to get the effective diffusion coefficient of vapor). As the non-diagonal terms of the tensor D and K are negligible, we consider only the diagonal terms, i.e., seen as the eigenvalues of the tensors (the image axes x, y, and z are the principal directions of the microstructure, z being along the direction of gravity). Besides, the tensors are transversely isotropic as the components in x are very similar to the ones in y. In the following, D and K refer to the averages of the diagonal terms of D and K, respectively. Dz and Kz refer to the vertical components, and Dxy and Kxy refer to the mean horizontal components, where and . Finally, the anisotropy of the properties is characterized based on the anisotropy ratio and (e.g., Calonne et al., 2014a).
2.3 Microstructural parameters
The density ρ (kg m−3) was computed from 3D images by a standard voxel counting algorithm using an ice density of ρi=917 kg m−3 (ice density variations with temperature were neglected in this study). Porosity corresponds to and is the sum of the open porosity ϕop and of the closed porosity. In the following, density and porosity at the close-off depth are referred to as ρoff and ϕoff, respectively. The close-off depth is the depth at which pores are fully isolated from the surface.
The connectivity of the pore space is characterized through the classical closed-to-total porosity ratio (CP), as well as the connectivity index (CI), recently introduced by Burr et al. (2018) as an alternative parameter to predict the close-off depth and density. The closed-to-total porosity ratio is obtained by dividing the total volume of closed pores by the total volume of pores, both determined by counting voxels in the 3D images. Its estimation is challenged by the cut-pore effect, which is the uncertainty related to the closed or open status of cut pores at the volume boundaries. Cut pores were not considered here when counting closed pores. The closed-to-total porosity ratio is sensitive to the sample size such that it is underestimated when evaluated on samples that are too small (Burr et al., 2018). The connectivity index is defined as the ratio between the volume of the largest pore and the total volume of pores. The connectivity index is 100 % when the porosity is fully open and decreases as pores shrink and close. For bubbly ice in which all pores are closed and of approximately equal volume, this index would tend to 1 over the bubble number. Unlike the closed-to-total porosity ratio, the connectivity index estimation does not rely on the assumption of the pore status (open or closed) and is practically independent of sample size (Burr et al., 2018). A comprehensive analysis and comparison of both CI and CP parameters at Lock In and Dome C can be found in Burr et al. (2018).
The correlation lengths , , and (mm) were used as a characteristic length of the microstructure in the x, y, and z direction, respectively. The two-point correlation (a.k.a. covariance) functions for the air phase S2(rβ) were computed from the 3D images, with rβ a vector oriented along the coordinate axes β = (x, y, z) of length that ranges from 0 to the image size in the β direction with increments of 1 pixel size (Torquato, 2002). The correlation lengths were then determined by fitting the two-point correlations with an exponential equation of form , where ϕ is the porosity (Löwe et al., 2013; Calonne et al., 2014a). The anisotropy ratio , where , was used to describe the geometrical anisotropy of the microstructure.
The specific surface area of snow (SSA) describes the total surface area of the air–ice interface per unit mass (m2 kg−1) and was computed from 3D images using a stereological method (Flin et al., 2011). Providing a characteristic length of the ice grains, the equivalent sphere radius r (mm) is related to SSA by (e.g., Grenfell and Warren, 1999; Painter et al., 2006).
3.1 Properties at Dome C and Lock In
We present the transport properties and microstructure of firn at Dome C and Lock In (Fig. 1). Firn microstructure gradually gets denser and coarser with depth: density and SSA evolve from 565 to 888 kg m−3 and from 2.89 to 0.43 m2 kg−1, respectively, between 23 and 133 m depth. Whereas the evolution rate is similar at both sites, Lock In shows systematically lower values of density and higher values of SSA compared to Dome C at a given depth. For comparison, the microstructure of the sample from Vostok at 80 m depth is also shown and has a density of 774 kg m−3 and an SSA of 1.5 m2 kg−1, matching the property profile of Lock In. Air pores start to close from a depth of around 80 m, where the closed porosity ratio (CP) and the connectivity index (CI) start deviating from the values of 0 % and 100 %, respectively. Again, differences in the pore closure are found between both sites, Dome C showing an earlier onset of pore closure than Lock In. The close-off is thus reached at a depth of 99.3 m at Dome C and, deeper, at 108.3 m at Lock In (Burr et al., 2018). The connectivity index reaches values close to 0 % at these close-off depths and below. The closed-to-total porosity ratio keeps on decreasing below the close-off depth, reaching 74 % at 133 m at Dome C and 60 % at 120 m at Lock In. A more detailed description of the firn microstructure and pore closure at those sites is provided in Burr et al. (2018).
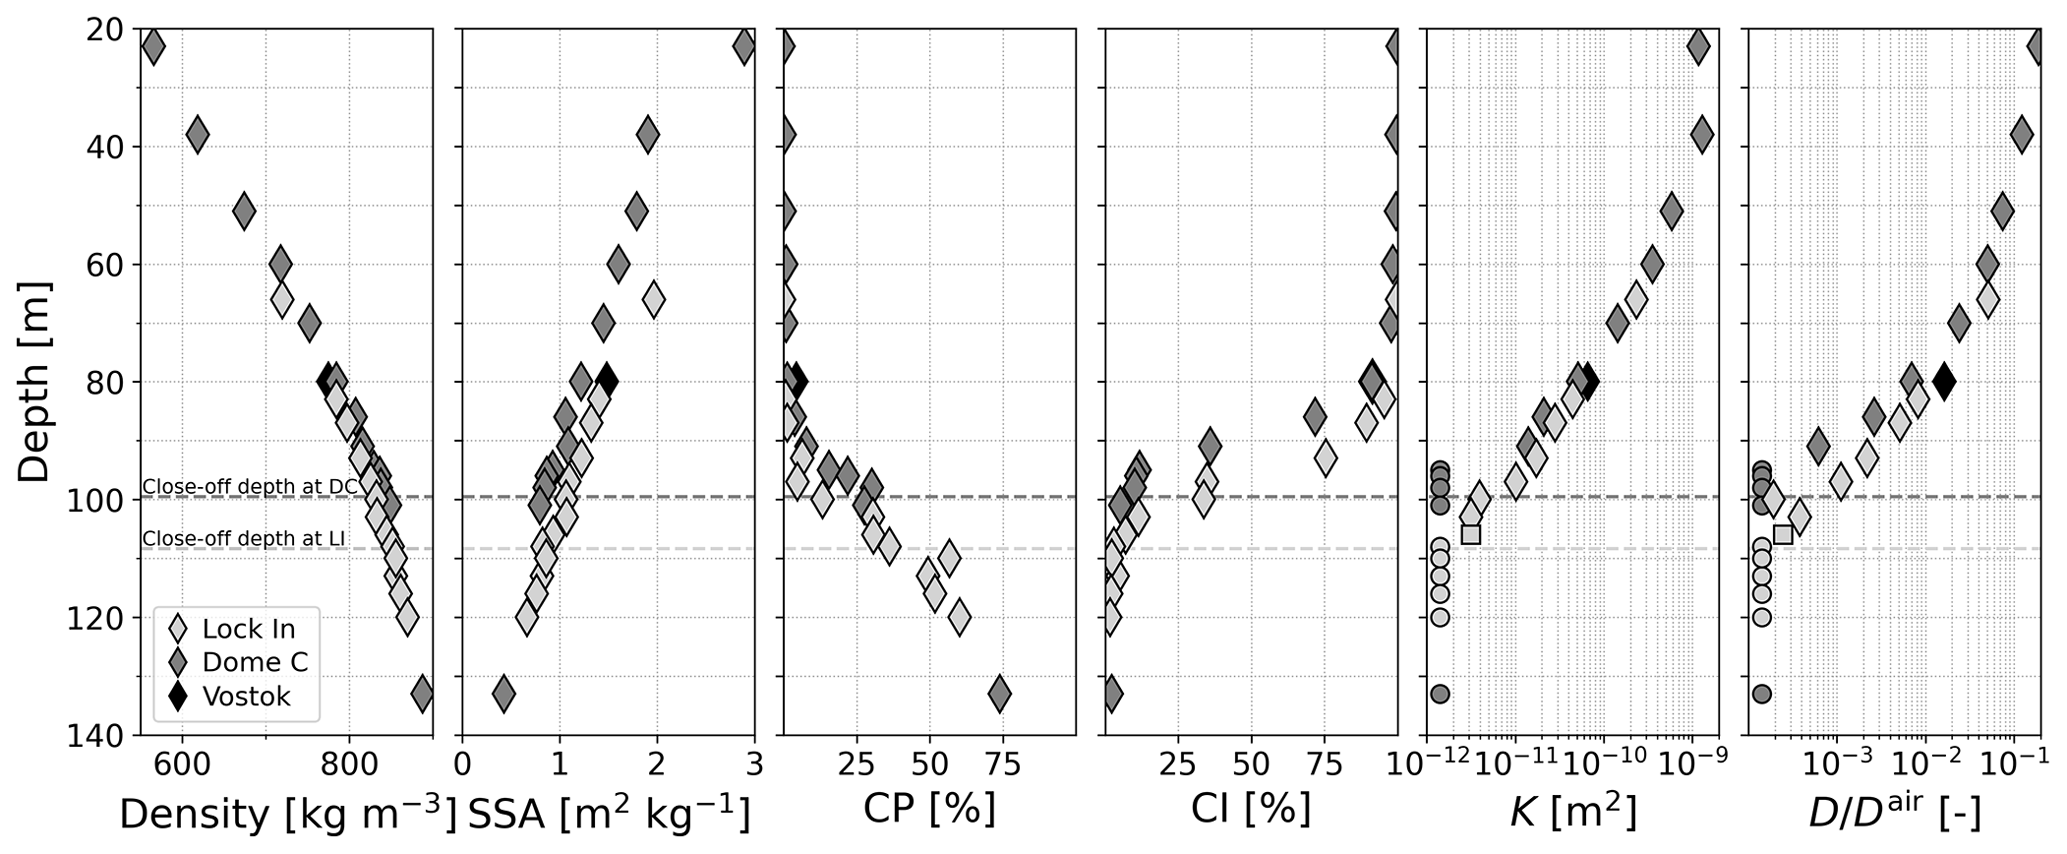
Figure 1Evolution of firn properties with depth: density, specific surface area, closed-to-total porosity ratio, connectivity index, averaged permeability, and averaged effective coefficient of diffusion (from left to right). Dashed lines show the close-off depth at Dome C (dark grey) and Lock In (light grey) from Burr et al. (2018). Circle symbols indicate values of permeability and effective diffusion equal to zero. Square symbols show a Lock In sample (106 m depth) with horizontal components of the transport properties equal to zero and correspond thus to the values of the vertical component only.
As the pore space shrinks, transport properties decrease with depth, reaching zero values near the close-off depth. At Dome C, the averaged values of normalized diffusion coefficient range from at 23 m depth to at 91 m depth and are equal to zero at 95 m depth and below (five samples; circle symbols). At Lock In, values range from at 66 m depth to at 106 m depth and are equal to zero at 108 m and below (five samples; circle symbols). A coefficient of is found at Vostok at 80 m depth. Regarding permeability, averaged values at Dome C range from m2 at 23 m depth to m2 at 91 m depth and are equal to zero below. At Lock In, values range from m2 at 66 m depth to m2 at 106 m depth and are equal to zero below. The Vostok sample shows a value of m2 at 80 m depth. The small systematic shift in values between Lock In and Dome is also found in the transport properties: Lock In shows overall higher values of the diffusion coefficient and permeability than Dome C for the given depths. Finally, relating the transport properties to the parameters of pore closure in the lock-in zone, we can see that the transport properties reach zero at or just before the close-off depths (dashed lines in Fig. 1). The zone of zero transport is characterized by connectivity indexes between 11 % and 1 %, reflecting little to no connected pore space. In contrast, the closed-to-total porosity ratio still increases largely from 15 % to 73 % and does not reach 100 %, indicating erroneously the presence of open pores after the close-off and even down to 133 m depth. This underestimation of the closed-to-total porosity ratio certainly comes from the cut-pore effect which is related to the surface to volume ratio and also to the sample size whose effect was reported by Burr et al. (2018). It might indicate that the volumes used for computations are too small to allow a correct estimate of the closed-to-total porosity ratio and would require a correction (e.g., Schaller et al., 2017).
3.2 Relationship with density
Next, we study the relationships of the two transport properties with density. Figure 2 includes the simulations on snow samples to study the relationship over the entire snow–firn density range (102–888 kg m−3). Figure 3 focuses on firn samples only (565–888 kg m−3). Both figures show dimensionless permeability values, i.e., permeability value K divided by the squared equivalent sphere radius: . This allows us to account for the dependency of permeability with a characteristic length of the microstructure (e.g., Boutin and Geindreau, 2010). The T-shaped symbols in both figures are our computed property values, and the tips and horizontal bars indicate the vertical and horizontal components of the property, respectively.
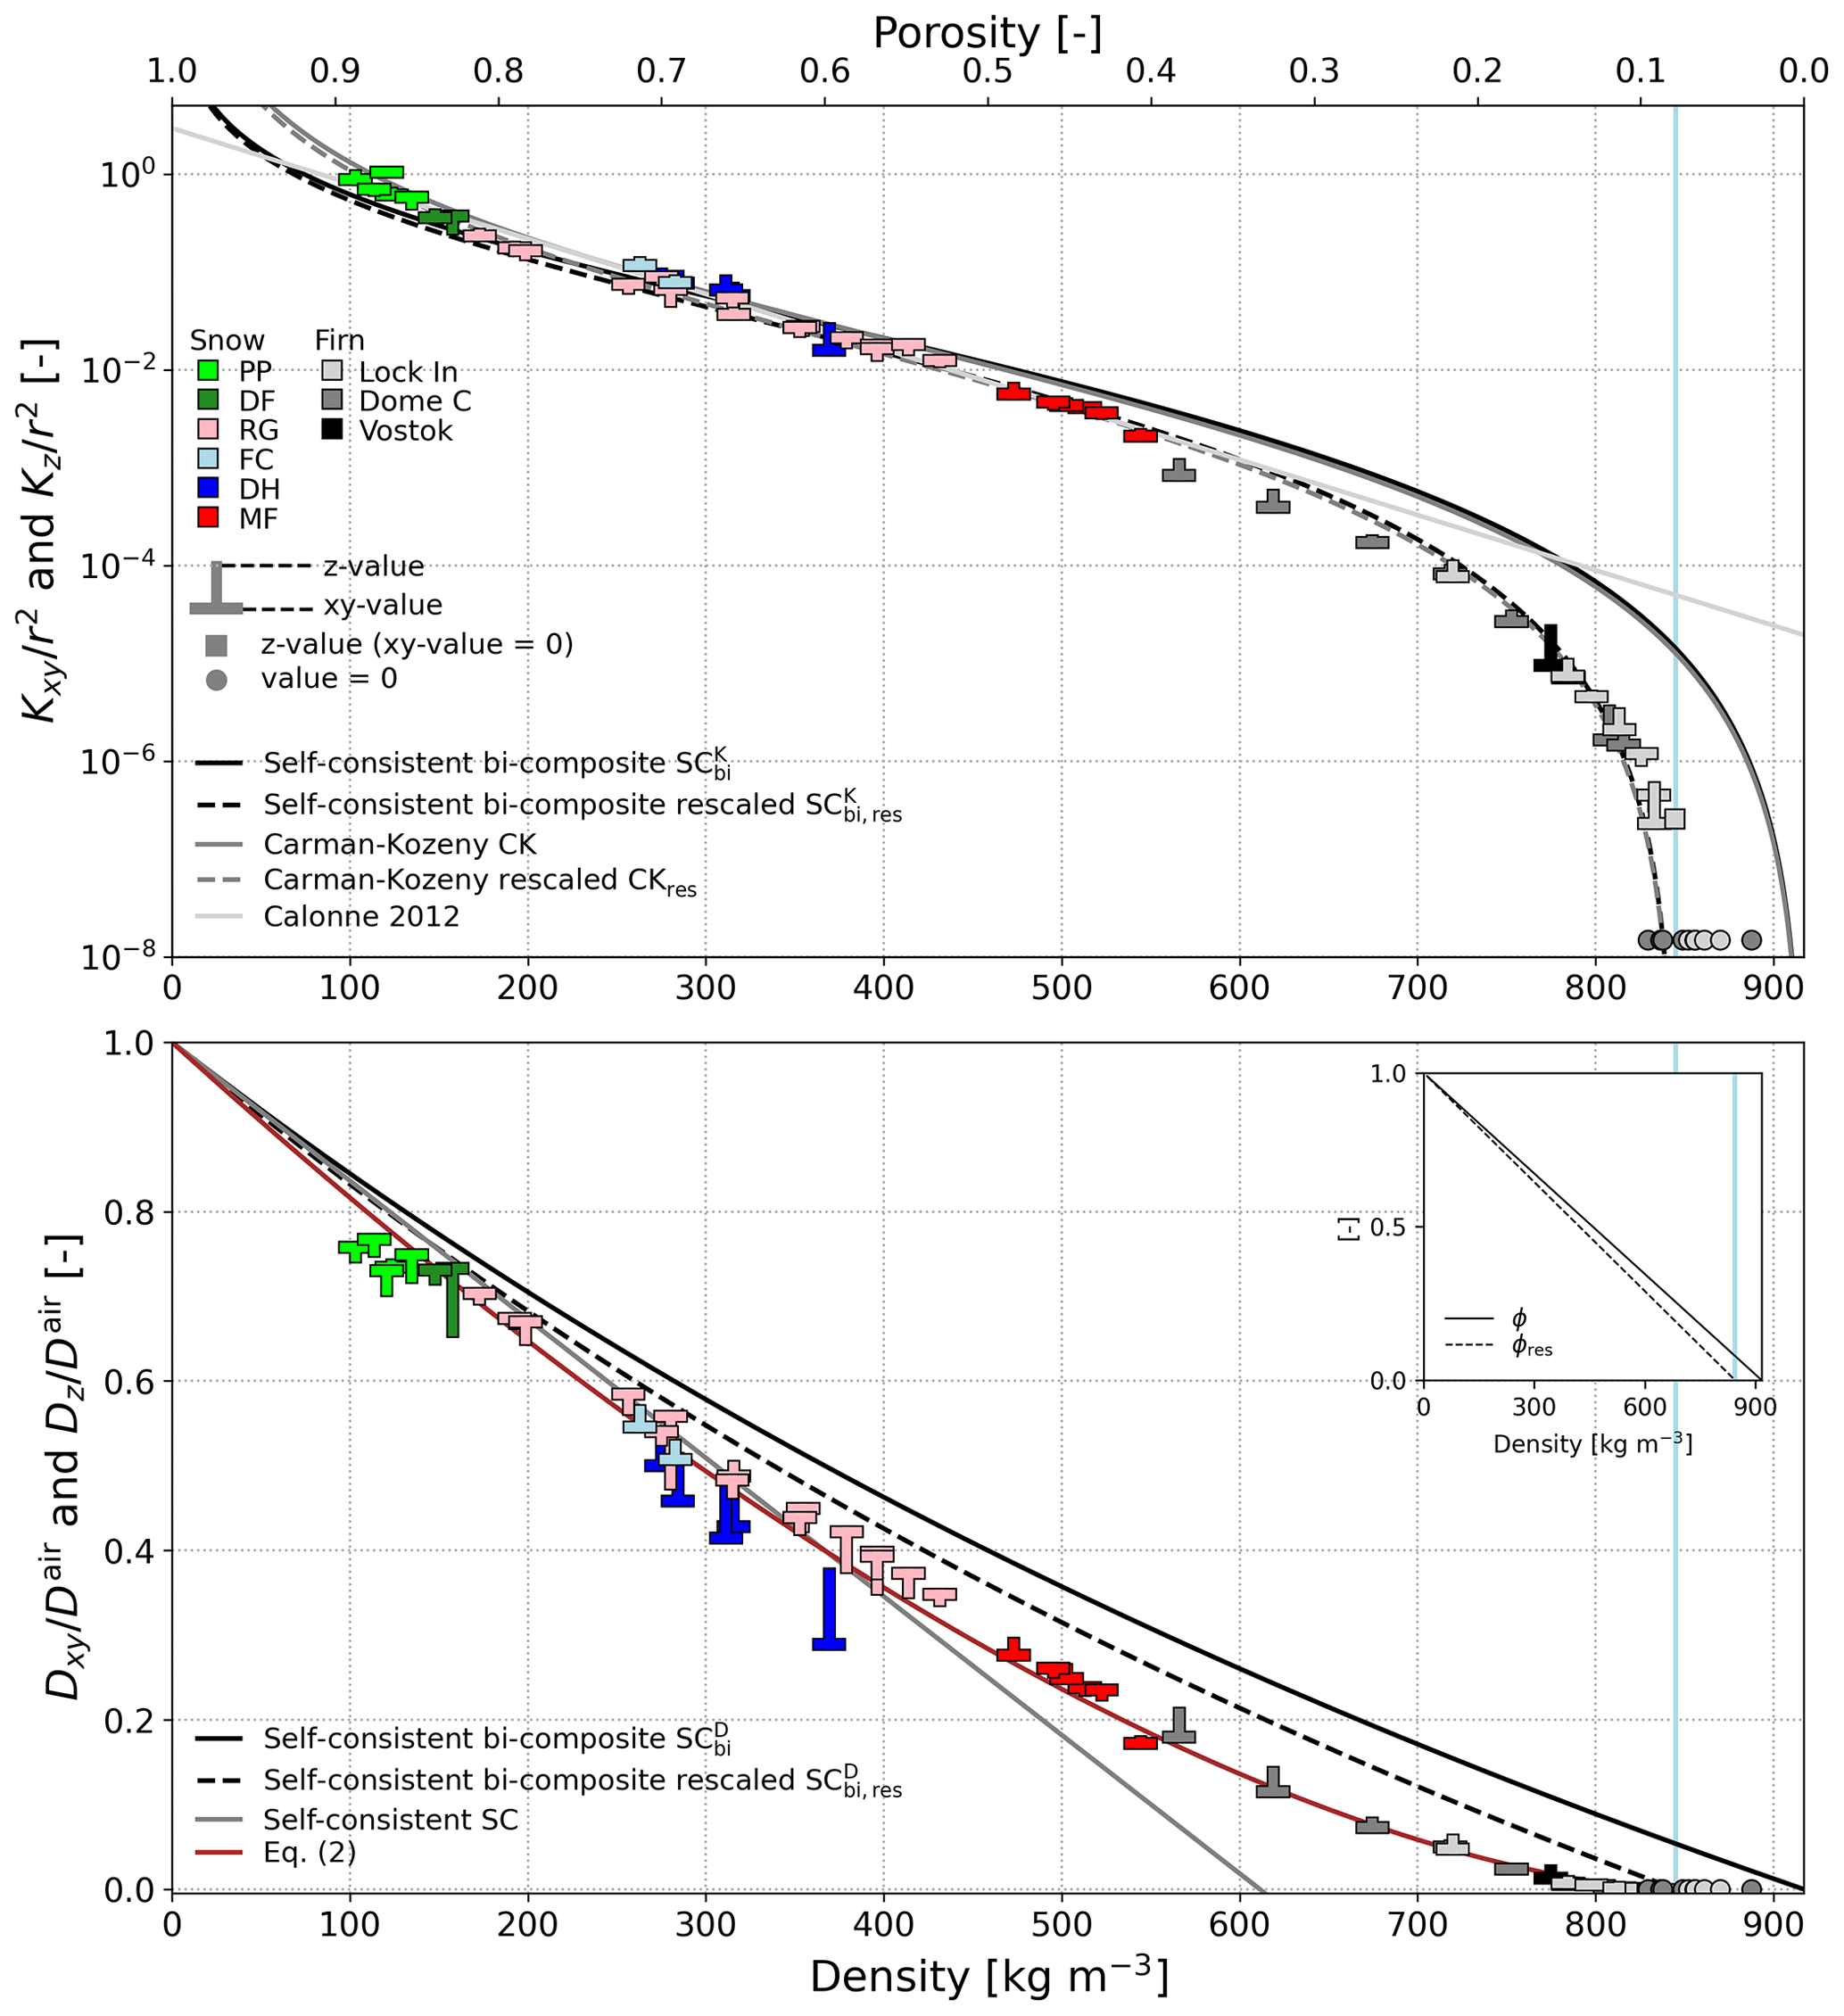
Figure 2Dimensionless permeability and normalized diffusion coefficient of snow and firn versus density: computations from the 3D images (“T” symbols) and analytical models (lines). The proposed regression Eq. (2) is also shown. Snow types correspond to the ICSSG (Fierz et al., 2009): precipitation particles (PPs), decomposed and fragmented particles (DFs), rounded grains (RGs), faceted crystals (FCs), depth hoar (DH), and melt forms (MFs). The vertical blue lines at 845 kg m−3 indicate the close-off density. The sub-caption shows the relationships of the rescaled porosity ϕres (Eq. 1) compared to the total porosity ϕ with density.

Figure 3Dimensionless permeability and normalized diffusion coefficient of firn versus density: computations from the 3D images (“T” symbols) and analytical models (lines). The proposed regression Eq. (2) is also shown. The vertical blue lines at 845 kg m−3 indicate the close-off density.
Values of the transport properties evolve within several orders of magnitude over the entire density range (Fig. 2). Averaged values of dimensionless permeability range from 0.9 for the lightest snow sample (PP) to 2 × 10⁻³ for the densest one (MF), cover the range 10−4 to 10−7 for the firn samples, and equal zero for the densest firn samples below the close-off. Zero values are shown for samples with densities above 830 kg m−3 at Dome C and densities above 850 kg m−3 at Lock In. For the diffusion coefficients, averaged values range from 0.75 to 0.17 for snow, from 10−2 to 10−5 for firn above the close-off, and zero values below. Overall, the figures highlight the strong dependency of diffusion and permeability to density (and to SSA for permeability) with rather well-aligned, little scattered relationships. In contrast to the linear trend observed for snow (Calonne et al., 2012), the effective diffusion coefficient of firn shows rather an exponential relationship with density. Both properties see their values drop when getting near to the close-off density. For example, between 813 and 844 kg m−3, the averaged values of the diffusion coefficient drop from to and the normalized permeability from to . No significant differences are found between sites: they show similar property–density relationships, in contrast to the shift observed in the property–depth relationship as described above (Fig. 1).
3.3 Anisotropy
The anisotropy ratios of both transport properties, 𝒜(D) and 𝒜(K), and their link with the microstructure are presented in Fig. 4. Overall, anisotropy ratios in firn range between 0.8 and 2.3 for the permeability and between 0.04 and 8.2 for the diffusion coefficient, which correspond to wide ranges compared to the range 0.8–1.6 observed for snow. However, looking at the relationships of the anisotropy ratio with density (Fig. 4a and c), we see that the extreme values are found in the narrow density range 800–840 kg m−3, i.e., near the close-off. Those extreme values are reached by dividing very small values of vertical components by horizontal components of the property tensors (e.g., for Lock In at 103 m depth, and , leading to 𝒜(D)=8.23). As these anisotropy ratios concern very small values of properties, they do not lead to a significant impact in terms of gas transport. Most interestingly, in the range 550–750 kg m−3, anisotropy ratios 𝒜(D) and 𝒜(K) of firn are between 1 and 1.33 (six samples). These values are consistent with data of Freitag et al. (2002), who observed a slight anisotropy of both properties at Summit, Greenland, between 16 and 57 m depth. Finally, concerning Dome C especially, it seems that anisotropy ratio tends to decrease with depth, in the range 550–750 kg m−3, although more data would be needed for this observation to be significant.
Regarding the geometric anisotropy of the firn samples, the ratios 𝒜(lc) are rather moderate and do not exceed 0.91 and 1.19, in agreement with anisotropies reported by Burr et al. (2018), and do not show a significant trend with depth or density. Considering all firn samples, no clear relationship is found for firn between the physical anisotropy 𝒜(D) and 𝒜(K) and the structural anisotropy 𝒜(lc). Looking at the six firn samples with a density below 750 kg m−3, a positive correlation can however be found following roughly the trend observed in snow but being less significant given the small number of samples. Additional firn samples in the range 550–750 kg m−3 would be needed to fully investigate the change in anisotropy ratios with depth and their relationships.
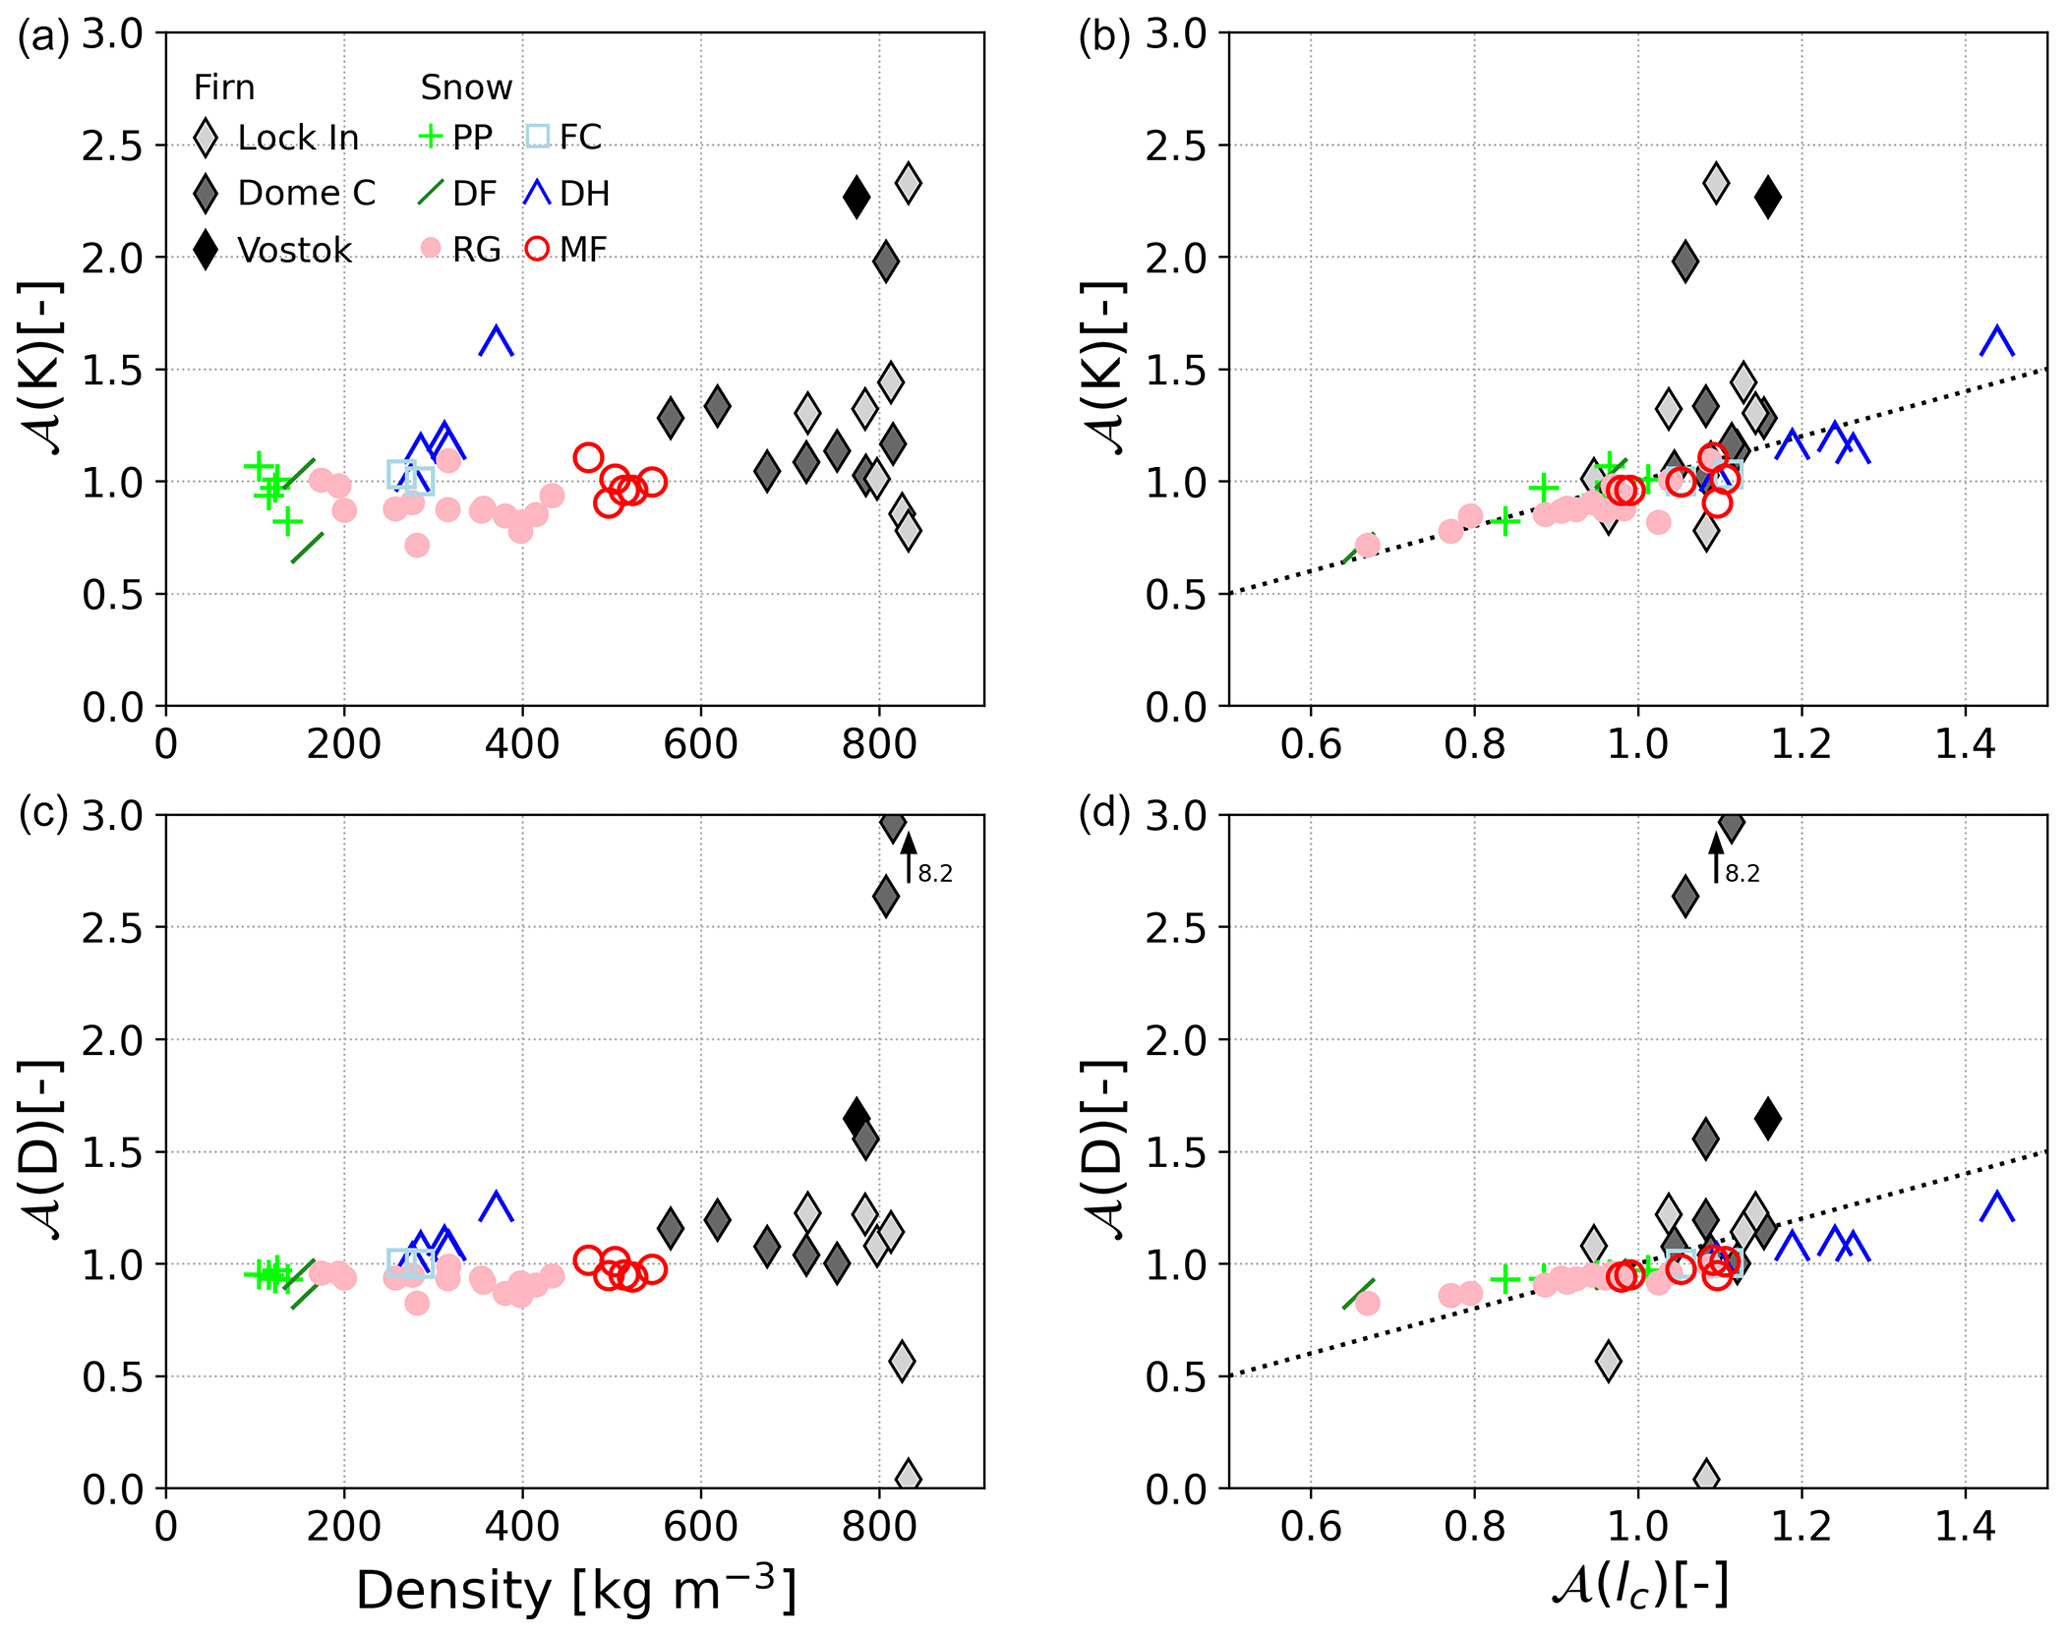
Figure 4Relationships of the anisotropy ratio of the permeability tensor 𝒜(K) (a, b) and of the diffusion coefficient tensor 𝒜(D) (c, d) with density and structural anisotropy 𝒜(lc). The arrows indicate a value of 𝒜(D) of 8.2 at a density of 832 kg m−3 for a firn sample from Lock In. Dotted lines indicate 1:1 lines.
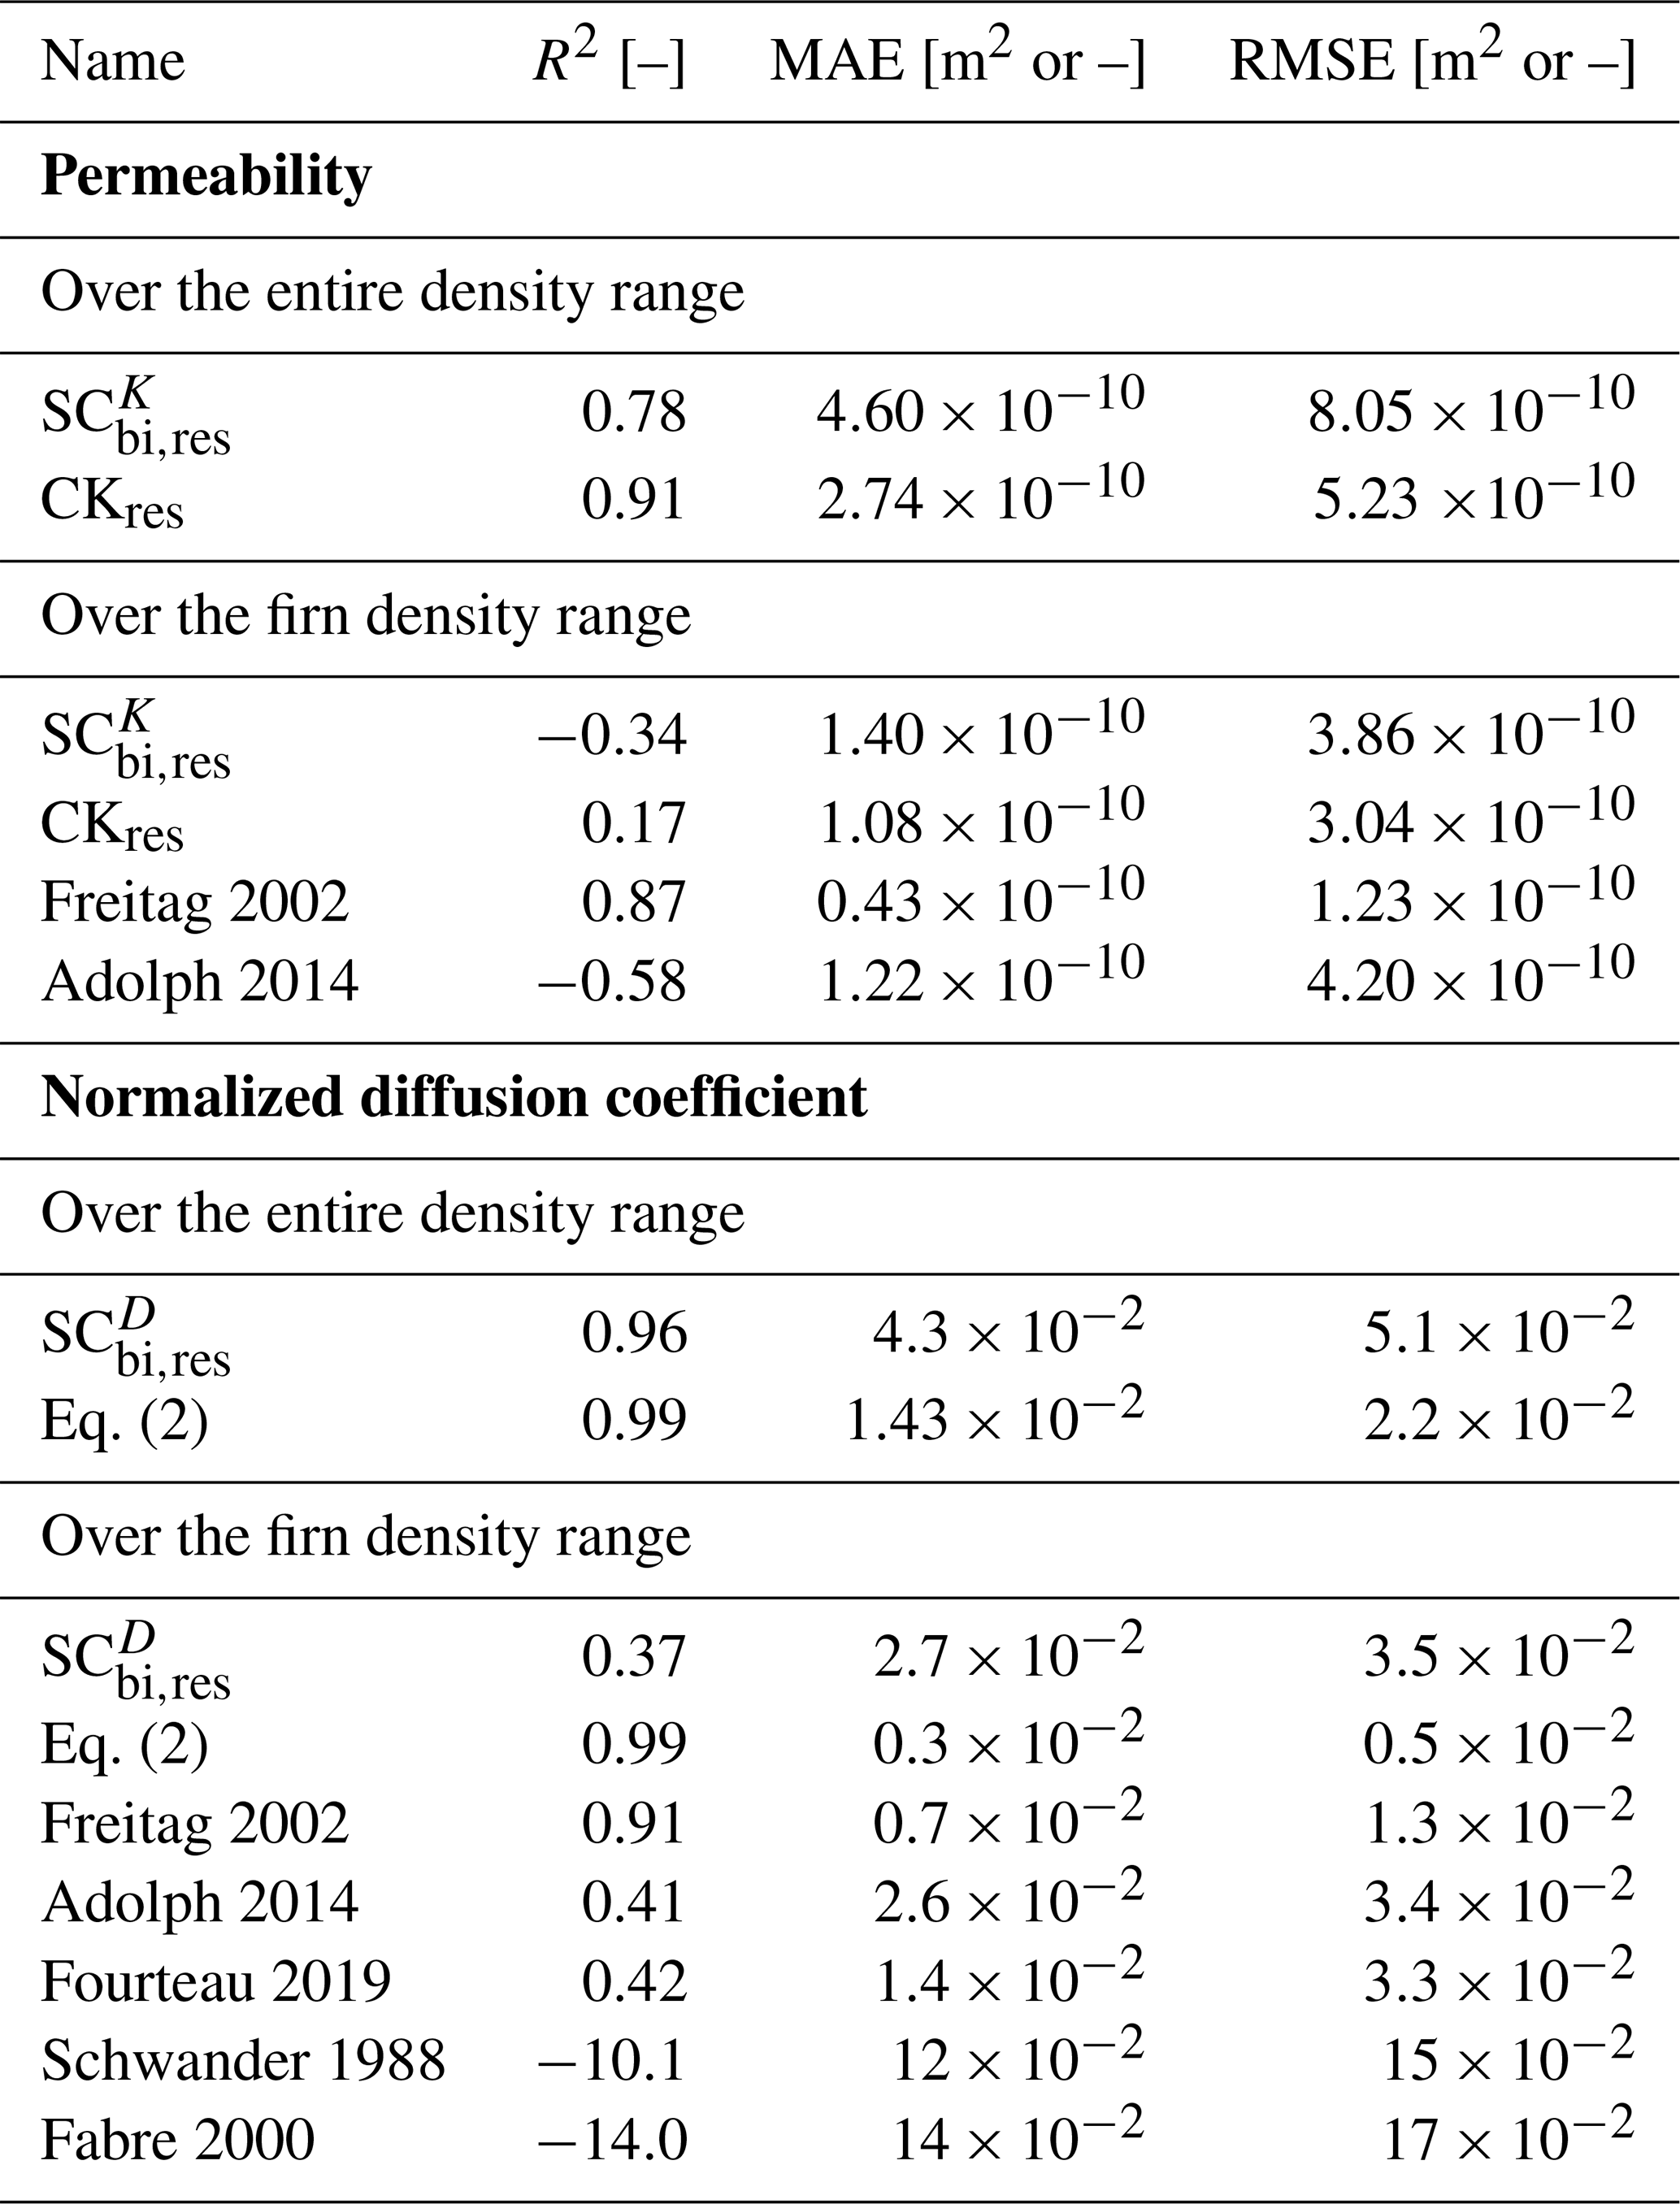
Table 1Description of the analytical models and regressions of permeability and normalized diffusion coefficient for comparison with our datasets.
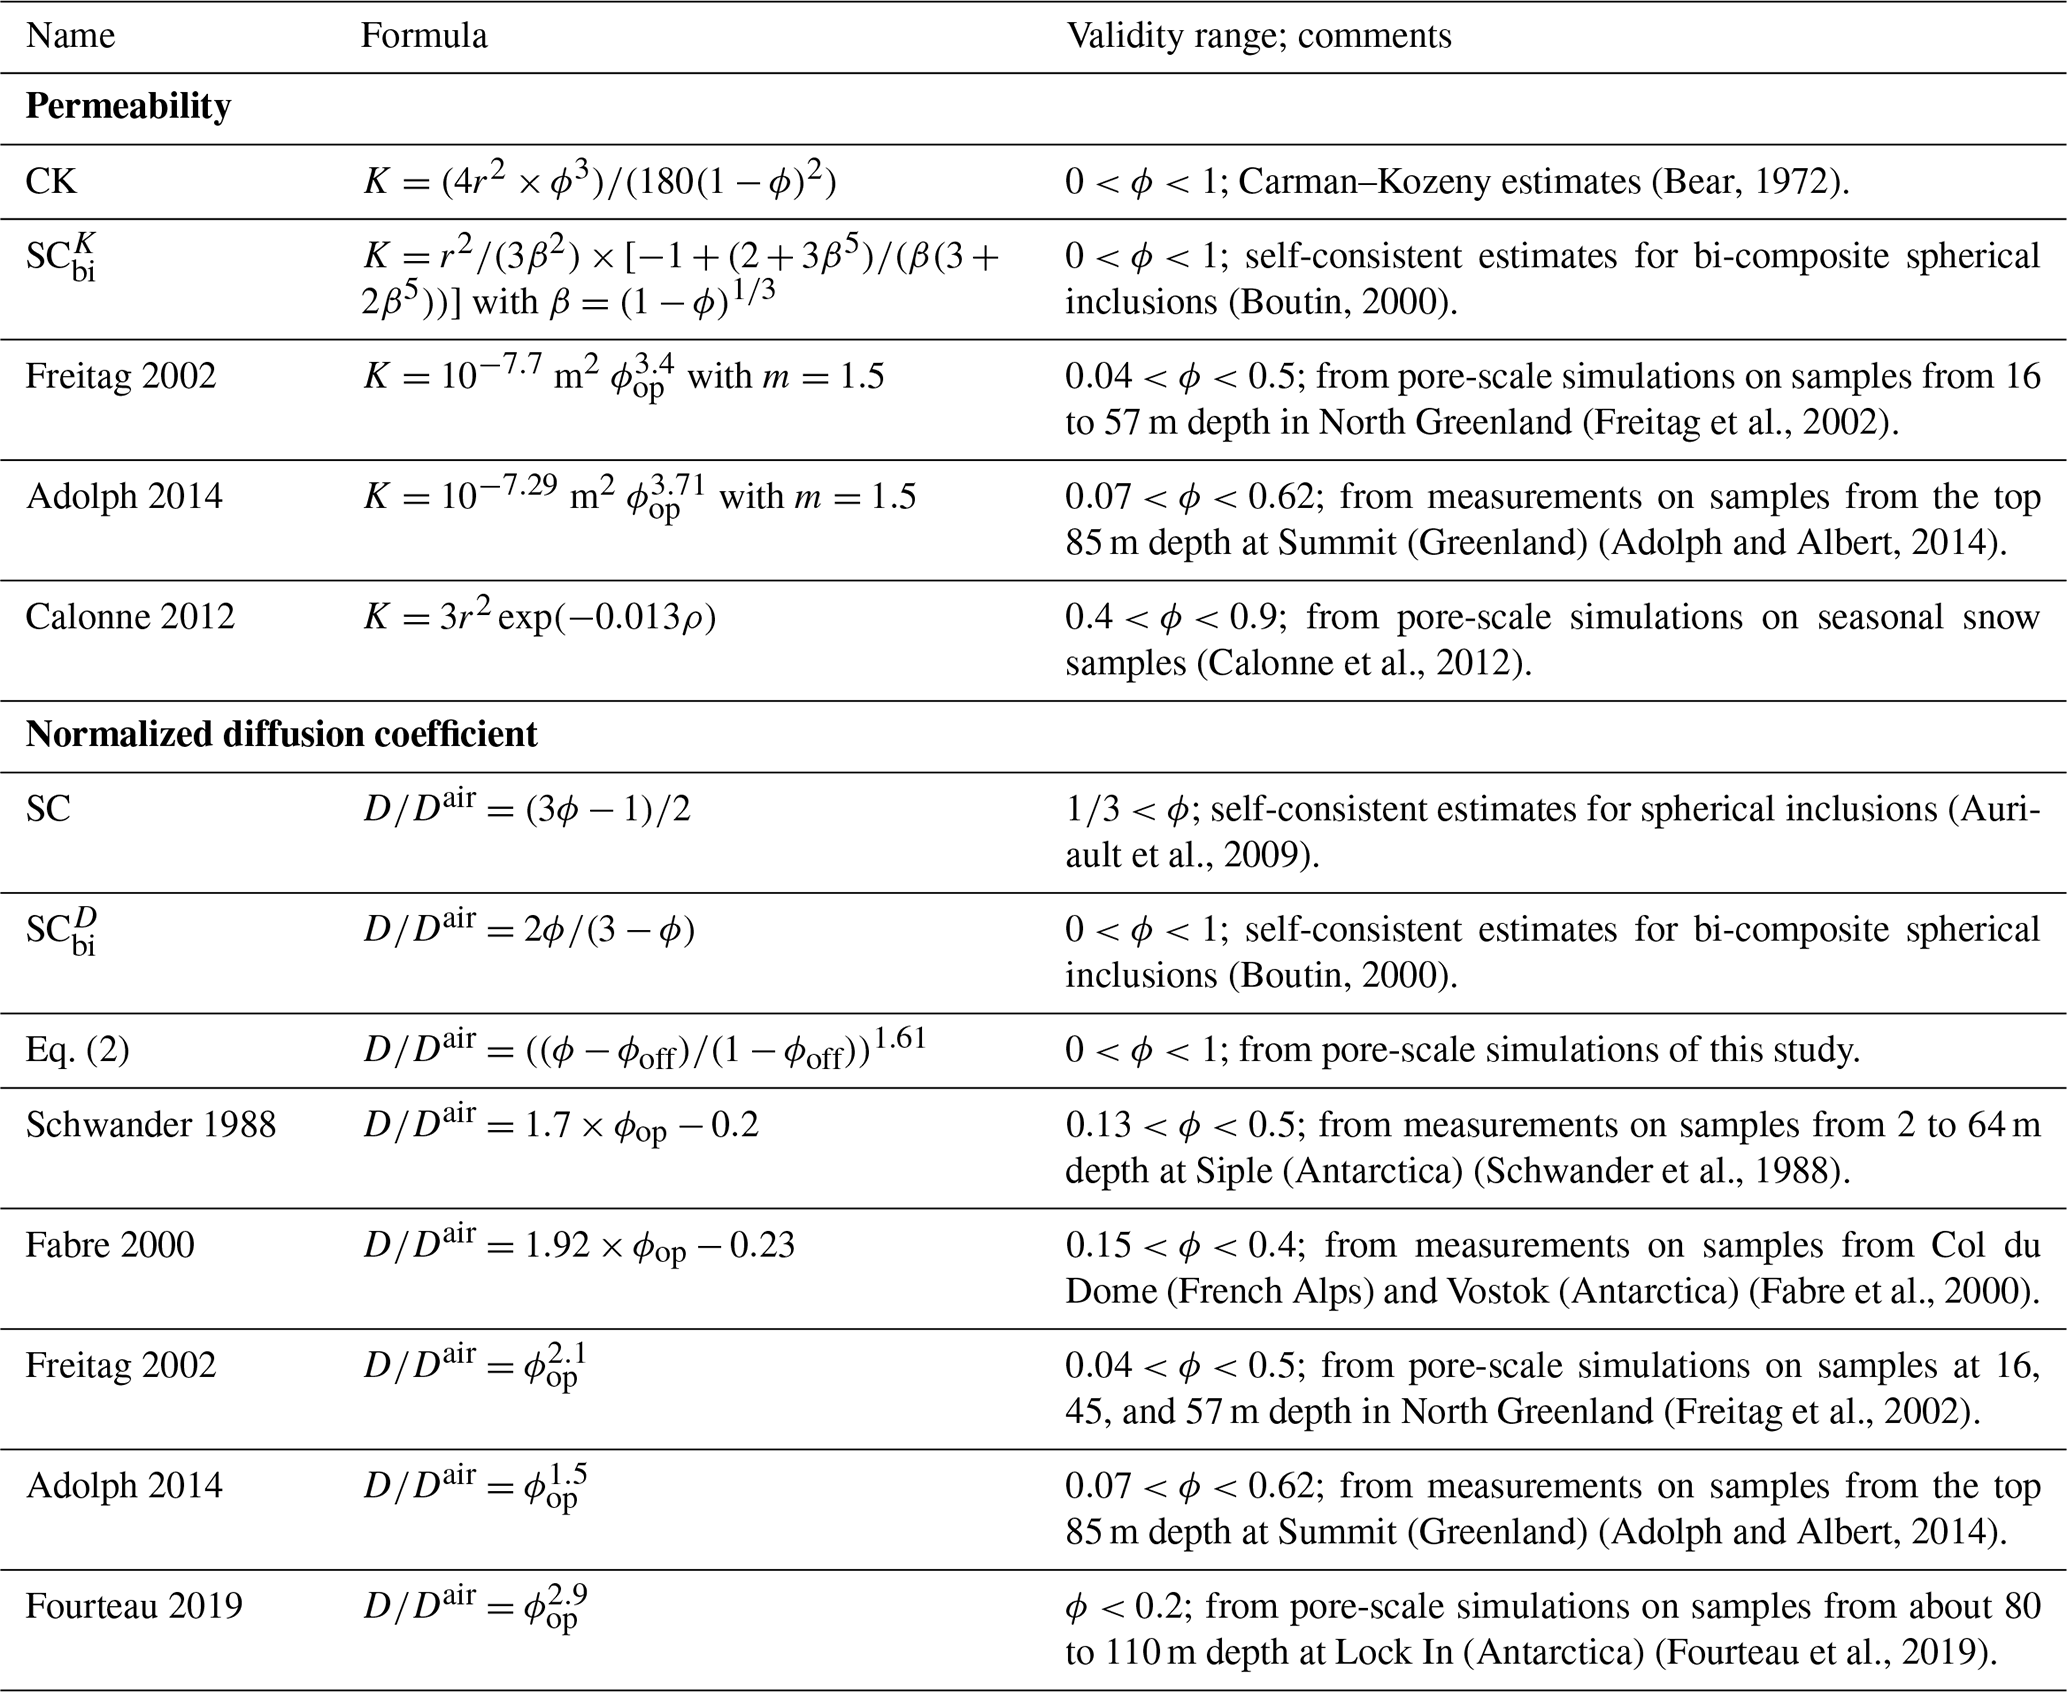
Table 2Correlation of determination R2, mean absolute error MAE, and root mean squared error RMSE values obtained between predicted values from models or regressions and true values, the data being computed from 3D images, for permeability and effective coefficient of diffusion, obtained when considering all samples and firn samples only. MAE and RMSE are indicators of the average difference of the modeled values with respect to the true data. RMSE has a higher weight for outliers than MAE, which treats all differences equally. In addition to the average difference between modeled and true data, R2 also indicates how well the model describes the trend seen in the true data (R2 values close to 1 indicate that average differences between model and truth are small and that the true data are equally scattered around the model across the full range).
3.4 Comparison to models
Here we evaluate two common models based on simplified microstructures against our data: the self-consistent model for bi-composite spherical inclusions (SCbi) and the Carman–Kozeny model (CK), as described in Table 1. In the SCbi scheme, the medium consists of a bi-composite spherical pattern made of an internal spherical grain and an external fluid shell that ensures fluid connectivity whatever the porosity value (Boutin, 2000). The SCbi scheme can be used to provide estimates of effective diffusion coefficient () and estimates of permeability (). The Carman–Kozeny model provides permeability estimates by describing the medium as a bundle of capillarity tubes of equal length (Bear, 1972). Also, for comparison, we show the formulas that provided the best agreements with the snow data (Calonne et al., 2012, 2014b): the self-consistent model of the diffusion coefficient (SC), which is based on an assemblage of spherical particles of air embedded in a homogeneous equivalent medium whose effective diffusion is the unknown to be calculated (Auriault et al., 2009), and the parameterization of snow permeability (Calonne 2012). These two formulas are however not suited for firn. All the above-mentioned models require the knowledge of density and, for permeability, of a characteristic length of the microstructure, taken here as the equivalent sphere radius r of ice grains.
Model estimates as a function of density are shown in Figs. 2 and 3. Taking the models in their original forms (solid lines), none of them succeed in reproducing permeability and the effective diffusion coefficient throughout the density range as they perform badly for firn. This is due to the fact that the models assume that the entire pore space corresponds to open porosity. Zero values of both properties are consequently reached when the porosity is null. To account for pore closure and the fact that a portion of pores is actually not accessible to gas transport, we introduce a parameter ϕres that corresponds to a rescaled porosity, defined such that ϕres=0 at the close-off porosity ϕ=ϕoff and ϕres=1 at ϕ=1, and reads
A close-off density value of ρoff=845 kg m−3 (close-off porosity ϕoff of 0.078) was taken for all sites, based on our connectivity parameters (Fig. 5). Relationships of ϕres with density are shown in the sub-panel of Fig. 2. ϕres equals 0.89 at a porosity of 0.9 (90 kg m−3), 0.24 at a porosity of 0.3 (640 kg m−3), and 0.02 at a porosity of 0.1 (825 kg m−3). Accounting for pore closure through ϕres instead of the open porosity, as classically done for firn property predictive formulas, it is not necessary to introduce an additional relationship to estimate the open porosity from the total porosity, like the one by Schwander (1989) (Eq. 3) for example. Classical models developed for porous media, which do not include open porosity, can then be used for firn by simply replacing the total porosity by the proposed rescaled one.
The CK and SCbi models were modified such that the rescaled porosity ϕres replaces the porosity term ϕ in the formulas. These models are referred to as CKres and SCbi,res in the following. Results are shown by dashed lines in Figs. 2 and 3. This modification significantly improves the modeling of the effective diffusion coefficient and permeability, especially in the pore closure zone. To quantify the model performance, Table 2 presents the coefficient of determination R2, the mean absolute error MAE, and the root mean squared error RMSE. Permeability is overall well described by the CKres and model throughout the density range (over 9 decades), with MAE and RMSE between 2 and m2. Looking more closely, the CKres model performs slightly better, being slightly closer to our data especially for light snow below 200 kg m−3 (R2 of 0.9 for the CKres estimates against 0.78 for the estimates). For the diffusion coefficient, even with the proposed adjustment, the model overestimates values throughout the density range and especially for the higher densities (R2=0.96 for all samples and 0.38 for firn samples).
To provide satisfactory estimates of the diffusion coefficient, we applied a regression with the form to our entire dataset of snow and firn. Here again, we used the proposed rescaled porosity to account for pore closure and not the open porosity like many previous regressions (see Sect. 3.5). We obtained the following regression:
This regression, shown in red lines in Figs. 2 and 3, provides estimates with a MAE of 0.014 for the entire density and of 0.0027 for firn (R2=0.99 for all samples and for firn samples).
3.5 Comparison to regressions from previous firn studies
Figure 5 compares the computed data at Dome C and Lock In with regressions from the studies of Fabre et al. (2000), Freitag et al. (2002), Adolph and Albert (2014), and Fourteau et al. (2019), as described in Table 1. These regressions were derived from measurements or pore-scale simulations on firn samples from Antarctica and Greenland, as well as on a few Alpine specimens. They are all based on the open porosity, which we estimated here with the commonly used regression of Schwander (1989):
using ρoff=845 kg m−3. The open porosity fractions derived from the open porosity ϕop from the regression of Schwander 1989 () and from the closed-to-total-porosity ratio (100 – CP) are compared in Fig. 5, together with the connectivity index CI. In the following comparisons, the performance of the evaluated regressions depends also on the quality of the Schwander regression (Schwander, 1989) as it was used to estimate the required open porosity. Note that, when taking the open porosity values provided by the computed CP ratio, the regression performances are worse than when taking the regression of Schwander 1989 as the CP ratio seems to overestimate the fraction of open pore space (Burr et al., 2018), which leads to poorer performances.
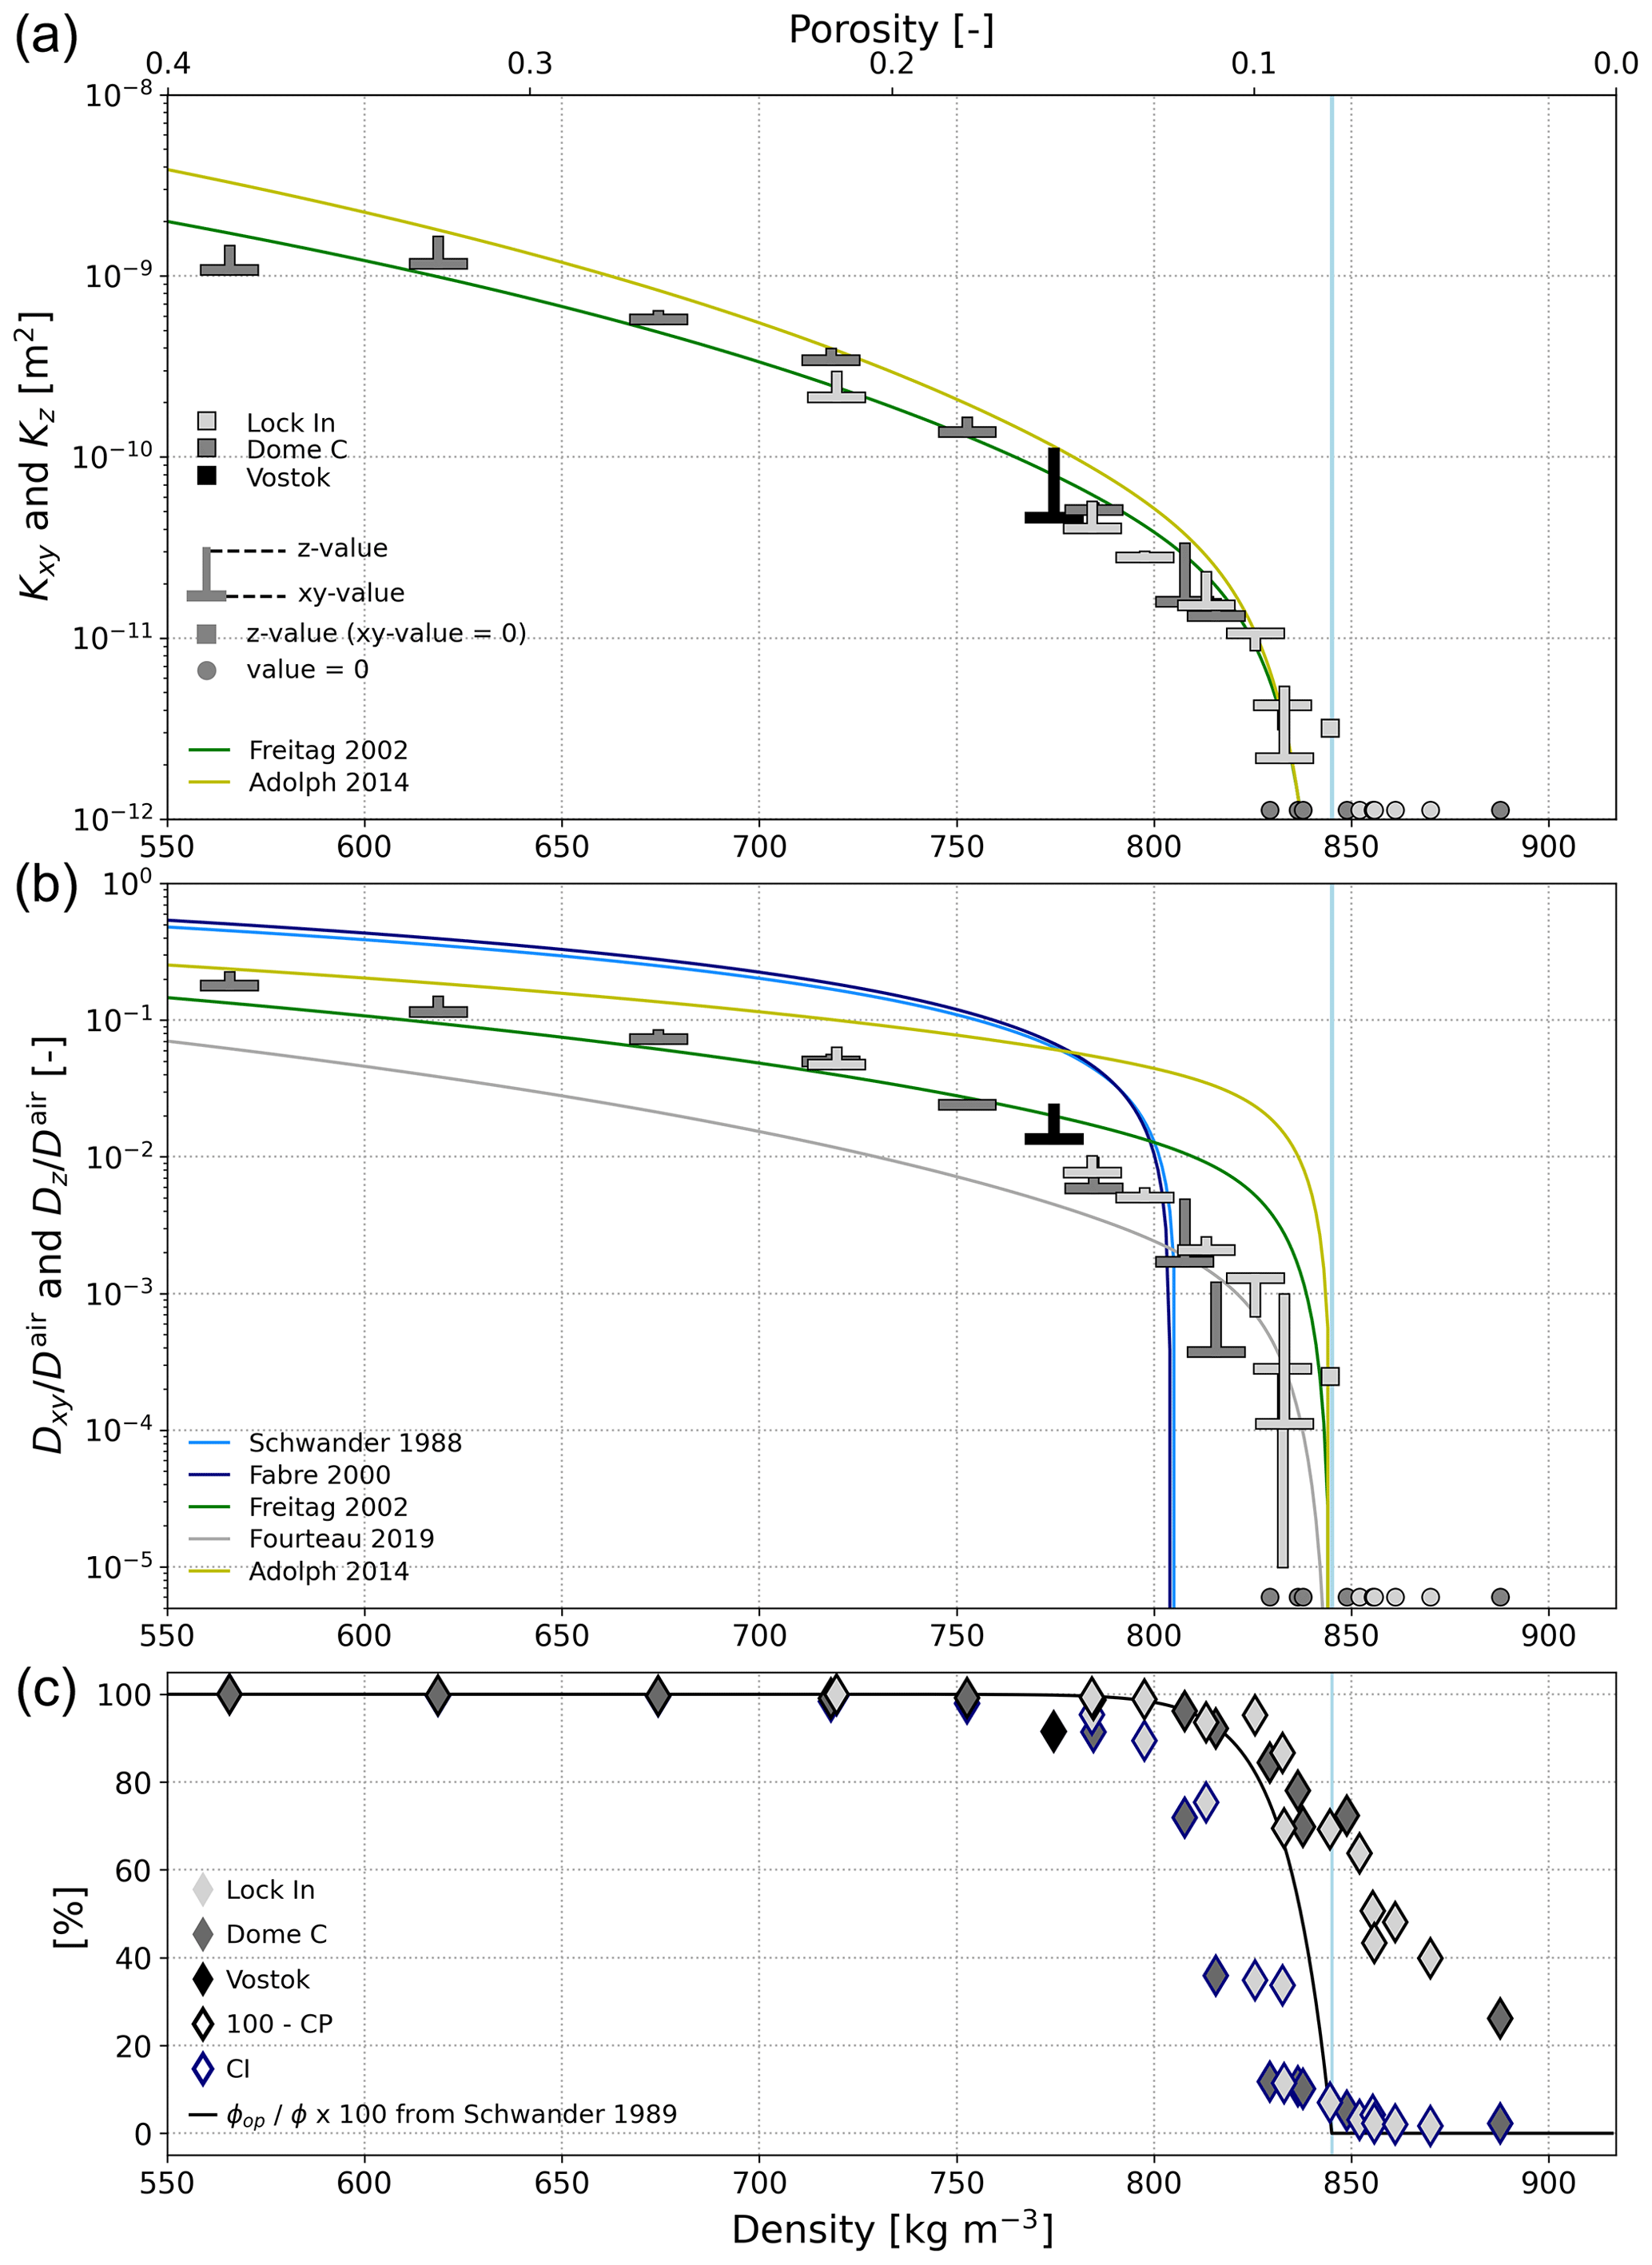
Figure 5(a, b) Permeability and normalized diffusion coefficient of firn versus density: computations (“T” symbols) and regressions from the literature (lines). (c) Evolution with density of the open porosity fraction based on the closed-to-total porosity fraction CP and based on the open porosity from Schwander 1989, as well as the connectivity index CI. The vertical blue lines at 845 kg m−3 indicate the close-off density.
Overall, permeability predicted by the regressions of Freitag 2002 and Adolph 2014 match our data well. Errors from those regressions are comparable to the ones obtained with the tuned CKres and models (Table 2). The regression of Freitag 2002 performs the best, with MAE and RSME values being about half of the ones shown by the models and the other regressions for firn. Concerning effective coefficient of diffusion, regressions of form reproduce more closely the relationships with density compared to regressions of form aϕop+b, like the one proposed by Schwander 1988 and Fabre 2000. These latter regressions overestimate largely the data within 550 and 750 kg m−3 (MAE and RSME between 12 and ); above, they fail to reproduce the diffusion coefficient drop at the correct density. Here again, the formula of Freitag 2002 performs best with MAE and RMSE of and , respectively, performing closely to our proposed regression (R2=0.91 versus R2=0.99) and better than the (R2=0.91 versus R2=0.37) in the firn density range. The regression of Adolph 2014 and Fourteau 2019 reproduce well the general trend of the diffusivity–density relationship but overestimate and underestimate the data overall, respectively. A very good match is however found with the regression of Fourteau 2019 in the 800–850 kg m−3 density range, in which the property drop near the close-off is well reproduced. The good agreement in this density range is consistent with the fact that the regression of Fourteau 2019 was derived from data from Lock In, as in this study, for firn with a density above 740 kg m−3.
In this study, we present the effective coefficient of diffusion and permeability at Dome C and Lock In, Antarctica, from near-surface to close-off (23 to 133 m depth). Properties were computed from high-resolution 3D tomographic images of firn samples collected in the field. Microstructural parameters, including density, specific surface area SSA, correlation length, structural anisotropy, closed-to-total porosity ratio, and connectivity index, were also estimated. The normalized diffusion coefficient ranges from to and permeability from to m2, decreasing with depth. Density varies between 565 and 888 kg m−3 and SSA from 2.9 to 0.4 m2 kg−1, from top to bottom of the firn columns. Between both sites, the relationships of transport properties with depth follows a similar trend but is shifted in depth. The effective coefficient of diffusion and permeability are systematically slightly higher at Lock In than Dome C for the given depths. They reach zero value below 95 m at Dome C but below 108 m at Lock In. This can be related to differences in firn microstructure between both sites (Burr et al., 2018): denser and coarser firn is found at Dome C for the given depths, the onset of pore closure appears earlier at Dome C, and the close-off is reached at 99 m at Dome C and 108 m at Lock In.
The relationship of the transport properties with density was further investigated within the firn density range, as well as in the entire 100–900 kg m−3 range, by including simulations on seasonal snow samples. The relationship of permeability with SSA was also considered by analyzing the dimensionless permeability, i.e., the permeability divided by the equivalent sphere radius squared. Over the full density range, transport properties evolve within several orders of magnitude, covering 10−1 to 10−7 m2 for dimensionless permeability and 10−1 to 10−5 for the normalized diffusion coefficient. Little scatter, without variability linked to sites, is reported over the entire density range, highlighting the strong dependency of transport properties on density (and SSA for permeability).
For firn (550–850 kg m−3), we report very good agreement with the regression of Freitag et al. (2002) and, in a lesser way, with Adolph and Albert (2014) for both diffusion coefficient and permeability, although their datasets originate from different environments (Greenland versus Antarctica here). In the narrow range of 800 to 850 kg m−3, near the close-off, the drop of diffusivity with density observed in our data is closely reproduced by the regression from Fourteau 2019 that is based on data from Lock In.
Looking at the entire range of density (100–917 kg m−3), permeability is overall well predicted by the Carman–Kozeny and the self-consistent (spherical bi-composite) models when modified to account for the pore closure. To do so, the total porosity ϕ was simply replaced by a rescaled porosity ϕres defined as , with ϕoff the close-off porosity. We specifically choose to account for pore closure through such a rescaled porosity instead of the commonly used open porosity. The advantages are that (1) there is no need of an additional predictive formula, as required to estimate the open porosity, which limits uncertainties, and (2) any models developed for porous media which do not include open porosity can be used by doing this simple replacement. For the diffusion coefficient, none of the evaluated models or regressions provide satisfactory estimates over the entire density range. We thus propose a new regression based on the rescaled porosity that reads .
Finally, as polar snow in the range 100–550 kg m−3 can differ significantly from seasonal snow in the same density range, it would be interesting to analyze polar snow and firn between 0 and 25 m depth, thus complementing the present dataset. Further studies should also be undertaken to derive transport properties at other sites and evaluate the proposed regression and models in different environments.
The computed values of effective diffusion coefficient and permeability are available in the Supplement of the article, together with the computed microstructural parameters.
The supplement related to this article is available online at: https://doi.org/10.5194/tc-16-967-2022-supplement.
NC wrote the paper with input from AB, CG, AP, and FF. Data analysis was performed by NC, AB, CG, and AP. The 3D image simulations were performed by CG. Sample acquisitions were performed by AP, AB, FF, and NC. CG, AP, and NC directed the project.
The contact author has declared that neither they nor their co-authors have any competing interests.
Publisher’s note: Copernicus Publications remains neutral with regard to jurisdictional claims in published maps and institutional affiliations.
The 3SR lab is part of the Labex Tec 21 (Investissements d'Avenir, grant agreement ANR-11-LABX-0030). CNRM/CEN and IGE are part of Labex OSUG@2020 (Investissements d'Avenir, grant ANR-10-LABX-0056). Authors acknowledge the Labex CEMAM (Center of Excellence of Multifunctional Architectured Materials, “Investments for the Future” program, grant ANR-10-LABX-44-01) for its contribution to the funding of the X-ray tomography equipment. We also thank the ID19 beamline of the ESRF for the acquisition of several tomographic images used in this study.
This paper was edited by Jürg Schweizer and reviewed by Johannes Freitag and Zoe Courville.
Adolph, A. C. and Albert, M. R.: Gas diffusivity and permeability through the firn column at Summit, Greenland: measurements and comparison to microstructural properties, The Cryosphere, 8, 319–328, https://doi.org/10.5194/tc-8-319-2014, 2014.
Albert, M., Shuman, C., Courville, Z., Bauer, R., Fahnestock, M., and Scambos, T.: Extreme firn metamorphism: impact of decades of vapor transport on near-surface firn at a low-accumulation glazed site on the East Antarctic plateau, Ann. Glaciol., 39, 73–78, https://doi.org/10.3189/172756404781814041, 2004.
Albert, M. R.: Modeling heat, mass, and species transport in polar firn, Ann. Glaciol., 23, 138–143, 1996.
Albert, M. R. and Shultz, E. F.: Snow and firn properties and air-snow transport processes at Summit, Greenland, Atmos. Environ., 36, 2789–2797, 2002.
Albert, M. R., Shultz, E. F., and Perron, F. E.: Snow and firn permeability at Siple Dome, Antarctica, Ann. Glaciol., 31, 353–356, https://doi.org/10.3189/172756400781820273, 2000.
Auriault, J.-L., Boutin, C., and Geindreau, C.: Homogenization of coupled phenomena in heterogenous media, Wiley-ISTE, London, ISBN 978-1-848-21161-2, 2009.
Battle, M., Bender, M. L., Sowers, T., Tans, P. P., Butler, J., Elkins, J., Ellis, J., Conway, T. J., Zhang, N., Lang, P., and Clarke, A.: Atmospheric gas concentrations over the past century measured in air from firn at the South Pole, Nature, 383, 231–235, 1996.
Bear, J.: Dynamics of Fluids in Porous Media, Dover Publications, Dover, ISBN 0-486-65675-6, 1972.
Boutin, C.: Study of permeability by periodic and self consistent homogenisation, Eur. J. Mech. A/Solids, 19, 603–632, 2000.
Boutin, C. and Geindreau, C.: Periodic homogenization and consistent estimates of transport parameters through sphere and polyhedron packings in the whole porosity range, Phys. Rev. E, 82, 036313-1–036313-18, 2010.
Buizert, C., Martinerie, P., Petrenko, V. V., Severinghaus, J. P., Trudinger, C. M., Witrant, E., Rosen, J. L., Orsi, A. J., Rubino, M., Etheridge, D. M., Steele, L. P., Hogan, C., Laube, J. C., Sturges, W. T., Levchenko, V. A., Smith, A. M., Levin, I., Conway, T. J., Dlugokencky, E. J., Lang, P. M., Kawamura, K., Jenk, T. M., White, J. W. C., Sowers, T., Schwander, J., and Blunier, T.: Gas transport in firn: multiple-tracer characterisation and model intercomparison for NEEM, Northern Greenland, Atmos. Chem. Phys., 12, 4259–4277, https://doi.org/10.5194/acp-12-4259-2012, 2012.
Burr, A., Ballot, C., Lhuissier, P., Martinerie, P., Martin, C. L., and Philip, A.: Pore morphology of polar firn around closure revealed by X-ray tomography, The Cryosphere, 12, 2481–2500, https://doi.org/10.5194/tc-12-2481-2018, 2018.
Calonne, N., Flin, F., Morin, S., Lesaffre, B., du Roscoat, S. R., and Geindreau, C.: Numerical and experimental investigations of the effective thermal conductivity of snow, Geophys. Res. Lett., 38, L23501, https://doi.org/10.1029/2011GL049234, 2011.
Calonne, N., Geindreau, C., Flin, F., Morin, S., Lesaffre, B., Rolland du Roscoat, S., and Charrier, P.: 3-D image-based numerical computations of snow permeability: links to specific surface area, density, and microstructural anisotropy, The Cryosphere, 6, 939–951, https://doi.org/10.5194/tc-6-939-2012, 2012.
Calonne, N., Flin, F., Geindreau, C., Lesaffre, B., and Rolland du Roscoat, S.: Study of a temperature gradient metamorphism of snow from 3-D images: time evolution of microstructures, physical properties and their associated anisotropy, The Cryosphere, 8, 2255–2274, https://doi.org/10.5194/tc-8-2255-2014, 2014a.
Calonne, N., Geindreau, C., and Flin, F.: Macroscopic Modeling for Heat and Water Vapor Transfer in Dry Snow by Homogenization, J. Phys. Chem. B, 118, 13393–13403, https://doi.org/10.1021/jp5052535, 2014b.
Calonne, N., Flin, F., Lesaffre, B., Dufour, A., Roulle, J., Puglièse, P., Philip, A., Lahoucine, F., Geindreau, C., Panel, J.-M., and du Roscoat, S.: CellDyM: A room temperature operating cryogenic cell for the dynamic monitoring of snow metamorphism by time-lapse X-ray microtomography, Geophys. Res. Lett., 42, 3911–3918, https://doi.org/10.1002/2015gl063541, 2015.
Calonne, N., Milliancourt, L., Burr, A., Philip, A., Martin, C. L., Flin, F., and Geindreau, C.: Thermal Conductivity of Snow, Firn, and Porous Ice From 3-D Image-Based Computations, Geophys. Res. Lett., 46, 13079–13089, 2019.
Colbeck, S. C.: Air movement in snow due to windpumping, J. Glaciol., 35, 209–213, 1989.
Coléou, C. and Barnola, J.-M.: 3-D snow and ice images by X-ray microtomography, ESRF Newsletter, 35, 24–26, 2001.
Coléou, C., Lesaffre, B., Brzoska, J.-B., Ludwig, W., and Boller, E.: Three-dimensional snow images by X-ray microtomography, Ann. Glaciol., 32, 75–81, https://doi.org/10.3189/172756401781819418, 2001.
Courville, Z., Albert, M., Fahnestock, M., Cathles, L., and Shuman, C.: Impacts of an accumulation hiatus on the physical properties of firn at a low-accumulation polar site, J. Geophys. Res.-Ea. Surf., 112, F02030, https://doi.org/10.1029/2005JF000429, 2007.
Courville, Z., Hörhold, M., Hopkins, M., and Albert, M.: Lattice-Boltzmann modeling of the air permeability of polar firn, J. Geophys. Res.-Ea. Surf., 115, 1–11, https://doi.org/10.1029/2009JF001549, 2010.
Fabre, A., Barnola, J. M., Arnaud, L., and Chappellaz, J.: Determination of gas diffusivity in polar firn: Comparison between experimental measurements and inverse modeling, Geophys. Res. Lett., 27, 557–560, https://doi.org/10.1029/1999GL010780, 2000.
Fierz, C., Armstrong, R. L., Durand, Y., Etchevers, P., Greene, E., McClung, D. M., Nishimura, K., Satyawali, P. K., and Sokratov, S. A.: The international classification for seasonal snow on the ground, IHP-VII Technical Documents in Hydrology n 83, IACS Contribution n 1, 2009.
Flin, F., Brzoska, J. B., Lesaffre, B., Coleou, C., and Pieritz, R. A.: Three-dimensional geometric measurements of snow microstructural evolution under isothermal conditions, Ann. Glaciol., 38, 39–44, 2004.
Flin, F., Lesaffre, B., Dufour, A., Gillibert, L., Hasan, A., Rolland du Roscoat, S., Cabanes, S., and Pugliese, P.: On the computations of specific surface area and specific grain contact area from snow 3-D images, in: P.C.I., edited by: Furukawa, Y., pp. 321–328, Hokkaido University Press, Sapporo, JP, proceedings of the 12th International Conference on the Physics and Chemistry of Ice held at Sapporo, Japan on 5–10 September 2010, 2011.
Fourteau, K., Martinerie, P., Faïn, X., Schaller, C. F., Tuckwell, R. J., Löwe, H., Arnaud, L., Magand, O., Thomas, E. R., Freitag, J., Mulvaney, R., Schneebeli, M., and Lipenkov, V. Ya.: Multi-tracer study of gas trapping in an East Antarctic ice core, The Cryosphere, 13, 3383–3403, https://doi.org/10.5194/tc-13-3383-2019, 2019.
Freitag, J., Dobrindt, U., and Kipfstuhl, J.: A new method for predicting transport properties of polar firn with respect to gases on the pore-space scale, Ann. Glaciol., 35, 538–544, https://doi.org/10.3189/172756402781816582, 2002.
Gautier, E., Savarino, J., Erbland, J., Lanciki, A., and Possenti, P.: Variability of sulfate signal in ice core records based on five replicate cores, Clim. Past, 12, 103–113, https://doi.org/10.5194/cp-12-103-2016, 2016.
Goujon, C., Barnola, J.-M., and Ritz, C.: Modeling the densification of polar firn including heat diffusion: Application to close-off characteristics and gas isotopic fractionation for Antarctica and Greenland sites, J. Geophys. Res.-Atmos., 108, 4792, https://doi.org/10.1029/2002JD003319, 2003.
Grenfell, T. and Warren, S.: Representation of a nonspherical ice particle by a collection of independent spheres for scattering and absorption of radiation, J. Geophys. Res., 104, 31697–31709, https://doi.org/10.1029/2000JC000414, 1999.
Hörhold, M.: Microstructure and air transport properties of polar firn, Ph.D. thesis, MS thesis, University of Bremen, 2006.
Hörhold, M. W., Albert, M. R., and Freitag, J.: The impact of accumulation rate on anisotropy and air permeability of polar firn at a high-accumulation site, J. Glaciol., 55, 625–630, https://doi.org/10.3189/002214309789471021, 2009.
Kanit, T., Forest, S., Galliet, I., Mounoury, V., and Jeulin, D.: Determination of the size of the representative elementary volume element for random composites: statistical and numerical approach, Int. J. Sol. Struct., 40, 3647–3679, https://doi.org/10.1016/S0020-7683(03)00143-4, 2003.
Kaspers, K. A., van de Wal, R. S. W., van den Broeke, M. R., Schwander, J., van Lipzig, N. P. M., and Brenninkmeijer, C. A. M.: Model calculations of the age of firn air across the Antarctic continent, Atmos. Chem. Phys., 4, 1365–1380, https://doi.org/10.5194/acp-4-1365-2004, 2004.
Kawamura, K., Severinghaus, J. P., Ishidoya, S., Sugawara, S., Hashida, G., Motoyama, H., Fujii, Y., Aoki, S., and Nakazawa, T.: Convective mixing of air in firn at four polar sites, Earth Planet. Sc. Lett., 244, 672–682, https://doi.org/10.1016/j.epsl.2006.02.017, 2006.
Keegan, K., Albert, M., McConnell, J., and Baker, I.: Climate Effects on Firn Permeability Are Preserved Within a Firn Column, J. Geophys. Res.-Ea. Surf., 124, 830–837, 2019.
Loulergue, L., Schilt, A., Spahni, R., Masson-Delmotte, V., Blunier, T., Lemieux, B., Barnola, J.-M., Raynaud, D., Stocker, T. F., and Chappellaz, J.: Orbital and millennial-scale features of atmospheric CH4 over the past 800,000 years, Nature Lett., 453, 383–386, https://doi.org/10.1038/nature06950, 2008.
Löwe, H., Riche, F., and Schneebeli, M.: A general treatment of snow microstructure exemplified by an improved relation for thermal conductivity, The Cryosphere, 7, 1473–1480, https://doi.org/10.5194/tc-7-1473-2013, 2013.
Lüthi, D., Le Floch, M., Bereiter, B., Blunier, T., Barnola, J.-m., Siegenthaler, U., Raynaud, D., Jouzel, J., Fischer, H., Kawamura, K., and Stocker, T. F.: High-resolution carbon dioxide concentration record, Nature Lett., 453, 379–382, https://doi.org/10.1038/nature06949, 2008.
Massman, W.: A review of the molecular diffusivities of H2O, CO2, CH4, CO, O3, SO2, NH3, N2O, NO, and NO2 in air, O2 and N2 near STP, Atmos. Environ., 32, 1111–1127, https://doi.org/10.1016/S1352-2310(97)00391-9, 1998.
Mitchell, L. E., Buizert, C., Brook, E. J., Breton, D. J., Fegyveresi, J., Baggenstos, D., Orsi, A., Severinghaus, J., Alley, R. B., Albert, M., Rhodes, R. H., McConnell, J. R., Sigl, M., Maselli, O., Gregory, S., and Ahn, J.: Observing and modeling the influence of layering on bubble trapping in polar firn, J. Geophys. Res.-Atmos., 120, 2558–2574, 2015.
Painter, T. H., Molotch, N. P., Cassidy, M., Flanner, M., and Steffen, K.: Contact spectroscopy for determination of stratigraphy of optical grain size, J. Glaciol, 53, 121–127, 2006.
Petit, J.-R., Jouzel, J., Raynaud, D., Barkov, N. I., Barnola, J.-M., Basile, I., Bender, M., Chappellaz, J., Davis, M., Delaygue, G., Delmotte, M., Kotlyakov, V. M., Legrand, M., Lipenkov, V. Y., Lorius, C., Pépin, L., Ritz, C., Saltzman, E., and Stievenard, M.: Climate and atmospheric history of the past 420,000 years from the Vostok ice core, Antarctica, Nature, 399, 429–436, 1999.
Rick, U. K. and Albert, M. R.: Microstructure and permeability in the near-surface firn near a potential US deep-drilling site in West Antarctica, Ann. Glaciol., 39, 62–66, 2004.
Rommelaere, V., Arnaud, L., and Barnola, J.-M.: Reconstructing recent atmospheric trace gas concentrations from polar firn and bubbly ice data by inverse methods, J. Geophys. Res., 102, 30069–30083, 1997.
Schaller, C. F., Freitag, J., and Eisen, O.: Critical porosity of gas enclosure in polar firn independent of climate, Clim. Past, 13, 1685–1693, https://doi.org/10.5194/cp-13-1685-2017, 2017.
Schwander, J.: The transformation of snow to ice and the occlusion of gases, in: The environmental record in glaciers and ice sheets, edited by: Oeschger, H. and Langway, C. C., pp. 53–67, https://doi.org/10.1126/science.247.4949.1486, John Wiley, New York, 1989.
Schwander, J. and Stauffer, B.: Age difference between polar ice and the air trapped in its bubbles, Nature, 311, 45–47, https://doi.org/10.1038/311045a0, 1984.
Schwander, J., Stauffer, B., and Sigg, A.: Air mixing in firn and the age of the air at pore close-off, Ann. Glaciol., 10, 141–145, 1988.
Severinghaus, J. P. and Battle, M. O.: Fractionation of gases in polar ice during bubble close-off: New constraints from firn air Ne, Kr and Xe observations, Earth Planet. Sc. Lett., 244, 474–500, https://doi.org/10.1016/j.epsl.2006.01.032, 2006.
Sommers, A. N., Rajaram, H., Weber, E. P., MacFerrin, M. J., Colgan, W. T., and Stevens, C. M.: Inferring firn permeability from pneumatic testing: a case study on the Greenland ice sheet, Front. Earth Sci., 5, 20, https://doi.org/10.3389/feart.2017.00020, 2017.
Sowers, T., Bender, M., Raynaud, D., and Korotkevich, Y.: δ15N of N2 in air trapped in polar ice: A tracer of gas transport in the firn and a possible constraint on ice age-gas age differences, J. Geophys. Res.-Atmos., 97, 15683–15697, 1992.
Stevens, C. D.: Investigations of physical processes in polar firn through modeling and field measurements, Ph.D. thesis, Earth and Space Sciences, University of Washington, 2018.
Stevens, C. M., Verjans, V., Lundin, J. M. D., Kahle, E. C., Horlings, A. N., Horlings, B. I., and Waddington, E. D.: The Community Firn Model (CFM) v1.0, Geosci. Model Dev., 13, 4355–4377, https://doi.org/10.5194/gmd-13-4355-2020, 2020.
Torquato, S.: Random Heterogeneous Materials: Microstructure and Macroscopic Properties, Springer-Verlag, New York, https://doi.org/10.1115/1.1483342, 2002.
Trudinger, C. M., Enting, I. G., Etheridge, D. M., Francey, R., Levchenko, V. A., and Steele, L. P.: Modeling air movement and bubble trapping in firn, J. Geophys. Res., 102, 6747–6763, 1997.
Waddington, E., Cunningham, J., and Harder, S.: The effects of snow ventilation on chemical concentrations, in: Chemical Exchange between the atmosphere and polar snow, 403–451 pp., Springer, https://doi.org/10.1007/978-3-642-61171-1_18, 1996.
Witrant, E., Martinerie, P., Hogan, C., Laube, J. C., Kawamura, K., Capron, E., Montzka, S. A., Dlugokencky, E. J., Etheridge, D., Blunier, T., and Sturges, W. T.: A new multi-gas constrained model of trace gas non-homogeneous transport in firn: evaluation and behaviour at eleven polar sites, Atmos. Chem. Phys., 12, 11465–11483, https://doi.org/10.5194/acp-12-11465-2012, 2012.
Yan, Y., Bender, M. L., Brook, E. J., Clifford, H. M., Kemeny, P. C., Kurbatov, A. V., Mackay, S., Mayewski, P. A., Ng, J., Severinghaus, J. P., and Higgins, J. A.: Two-million-year-old snapshots of atmospheric gases from Antarctic ice, Nature, 574, 663–666, 2019.
Zermatten, E., Haussener, S., Schneebeli, M., and Steinfeld, A.: Tomography-based determination of permeability and Dupuit-Forchheimer coefficient of characteristic snow samples, J. Glaciol., 57, 811–816, https://doi.org/10.3189/002214311798043799, 2011.