the Creative Commons Attribution 4.0 License.
the Creative Commons Attribution 4.0 License.
 | 21 Feb 2022
Glacier and rock glacier changes since the 1950s in the La Laguna catchment, Chile
Benjamin Aubrey Robson
Shelley MacDonell
Álvaro Ayala
Tobias Bolch
Pål Ringkjøb Nielsen
Sebastián Vivero
Glaciers and rock glaciers play an important role in the hydrology of the semi-arid northern Chile. Several studies show that glaciers have rapidly lost mass in response to climate change during the last decades. The response of rock glaciers to climate change in this region is, however, less known. In this study we use a combination of historical aerial photography, stereo satellite imagery, airborne lidar, and the Shuttle Radar Topography Mission (SRTM) DEM to report glacier changes for the Tapado Glacier–rock glacier complex from the 1950s to 2020 and to report mass balances for the glacier component of the complex, Tapado Glacier. Furthermore, we examine high-resolution elevation changes and surface velocities between 2012 and 2020 for 35 rock glaciers in the La Laguna catchment. Our results show how Tapado Glacier has shrunk by % between 1956 and 2020, while the mass balance of Tapado Glacier has become steadily more negative, from being approximately in balance between 1956 and 1978 ( m w.e. a−1) to showing increased losses between 2015 and 2020 ( m w.e. a−1). Climatological (re-)analyses reveal a general increase in air temperature, decrease in humidity, and variable precipitation since the 1980s in the region. In particular, the severe droughts starting in 2010 resulted in a negative mass balance of m w.e. a−1 between 2012 and 2015. The rock glaciers within the La Laguna catchment show heterogenous changes, with some sections of landforms exhibiting pronounced elevation changes and surface velocities exceeding that of Tapado Glacier. This could be indicative of high ice contents within the landforms and also highlights the importance of considering how landforms can transition from more glacial landforms to more periglacial features under permafrost conditions. As such, we believe high-resolution (sub-metre) elevation changes and surface velocities are a useful first step for identifying ice-rich landforms.
- Article
(26313 KB) - Full-text XML
-
Supplement
(138 KB) - BibTeX
- EndNote


The cryosphere is in a state of rapid change, with glaciers thinning and losing mass on a global scale (Zemp et al., 2019). The Andes have some of the highest rates of glacier mass loss on the planet (Masiokas et al., 2020), with a total loss of m w.e. yr−1 between 2000 and 2018 (Dussaillant et al., 2019; Ferri et al., 2020). Retreating glaciers are predicted to alter the hydrological cycle, particularly in regions where cryospheric contributions to streamflow are significant. It has been estimated that during drought conditions in the Tropical Andes, 2096 km2 of irrigated land and up to 3.92 million domestic users are reliant on streamflow where glacial contribution is >25 % (Buytaert et al., 2017).
The semi-arid Andes of Chile (26–32∘ S) contain an assortment of glaciers and rock glaciers, and although the amount of ice is considerably less than in other South American regions, given the relative scarcity of fresh water, meltwater plays a potentially significant role in the local hydrology in the region (Pourrier et al., 2014; Schaffer et al., 2019).
Rock glaciers are lobate, tongue-shaped assemblages of ice-rich debris which slowly creep downhill due to gravity and are a physical manifestation of permafrost conditions (Barsch, 1996; Haeberli et al., 2006). There has been discussion about how rock glaciers form and what constitutes a rock glacier, with two schools of thought: that rock glaciers can either be permafrost creep features derived from a talus (cryogenic) or that rock glaciers are derived from glacial (glacigenic) features. Readers are directed to Berthling (2011) for an overview of the debate surrounding terminology of rock glaciers related to their origin. Some studies have recently highlighted that given permafrost conditions are present, as well as a sufficient supply of material from the surrounding slopes, a debris-covered glacier can transition to a rock glacier (e.g. Jones et al., 2019a; Knight et al., 2019; Monnier and Kinnard, 2017). Such a transition to a more periglacial setting can have hydrological consequences as rock glaciers are more resilient to changes in climate than glaciers, and as such the frozen stores of water could be better conserved (Rangecroft et al., 2013; Jones et al., 2019b). Brenning et al. (2012) and Bolch et al. (2019) introduced the terms ice-debris landforms or ice-debris complex that include debris-covered glaciers, rock glaciers, and other landforms such as ice-cored moraines (Bolch et al., 2019; Brenning et al., 2012).
The focus of this study is a catchment containing 40 rock glaciers as well as the Tapado Glacier–rock glacier complex which includes a debris-covered portion of the glacier, a clean ice section, and two rock glaciers. The study region also contains the transitioning landform of Las Tetas.
Remote sensing has been used to study glacier and rock glacier changes in many parts of the world where in situ data are limited or non-existent (Bolch et al., 2019; Falaschi et al., 2019b; Rignot, 2002; Robson et al., 2018). Changes over extensive temporal scales can be studied by combining remote sensing datasets such as historical aerial imagery (Eriksen et al., 2018; Falaschi et al., 2019b; Kinnard et al., 2020); declassified spy datasets, namely Corona and Hexagon imagery (Bolch et al., 2011; Fariás-Barahona et al., 2020b; Hanshaw and Bookhagen, 2014; Robson et al., 2018); or topographic maps (Ayala et al., 2020; Tielidze, 2016).
Recent studies have quantified glacier losses over the entire Andes (Braun et al., 2019; Dussaillant et al., 2019). Such studies provide invaluable regional-scale information on glacier mass changes but at a limited spatial resolution and temporal scale. In particular, such analyses are incapable of studying the smaller magnitude changes in rock glaciers, which in some semi-arid catchments are more prevalent than glaciers (Azócar and Brenning, 2010; Zalazar et al., 2020).
This study focuses in detail on Tapado Glacier–rock glacier complex (or the Tapado complex for short), an assemblage landform consisting of a clean ice glacier (0.93 km2), a debris-covered glacier (0.32 km2), and a rock glacier (0.85 km2). The term Tapado Glacier is used to refer to the clean ice and debris-covered ice components but not the rock glacier. Glaciers are sparsely distributed in the semi-arid Andes, and as such studying decadal changes in surface lowering and mass balance can provide insights into the regional climate. Such analyses are hampered by a lack of in situ glaciological data in the region. According to the World Glacier Monitoring Service, the semi-arid Andes has just nine glaciers that have been actively studied with in situ mass balance measurements, of which only three (Guanaco Glacier in Chile and Los Amarillos and Amarillo glaciers in Argentina) have records longer than 10 years (WGMS, 2020). As such, historical and recent remote sensing can be used to study glacier changes in space and time.
In this study, we present glaciers and rock glacier changes for the La Laguna catchment in northern Chile. Specifically, we focus on surface elevation changes and geodetic mass balances of Tapado Glacier between 1956 and 2020. Furthermore, we compute elevation changes between 2012–2020, as well as surface velocities for the rock glaciers in the La Laguna catchment, allowing us to speculate on the ice content of individual landforms. Lastly, we compare our results with temperature, precipitation, and shortwave radiation data to assess the driving forces of the observed change.

Figure 1Location of the La Laguna catchment and of landforms studied in this paper. Three landforms that will be discussed in the text are highlighted in panel (a). The Tapado complex is shown in panel (b), which contains a clean ice section, debris-covered glacier section, and rock glacier section. In situ field measurement locations are shown in panels (b) and (c). The automatic weather station (AWS) is shown in panel (a). Background imagery: (a) Pléiades imagery (2020) overlaying Sentinel 2 imagery (2018); (b) Pléiades (2020) imagery; (c) cross-blended hypsometric tints obtained from https://www.naturalearthdata.com/ (last access: 10 September 2020). © CNES (2018) and Airbus DS (2018), all rights reserved.
The La Laguna catchment (∼30∘11′53′′ S, 69∘56′15′′ W; Fig. 1) is situated at the headwaters of the Elqui River catchment, with glaciers and rock glaciers contributing between 4 %–13 % of the annual streamflow (Favier et al., 2009; Pourrier et al., 2014; Schaffer et al., 2019). The Elqui River catchment has a total population of over 230 000 people, an agricultural production worth USD 40 million a year, and water-dependent industry such as mining (Cortés et al., 2012). La Laguna catchment lies within the Desert Andes glaciological zone of Chile, which is characterised by a cold and semi-arid climate; the zone contains 188.9 km2 of glaciers and rock glaciers, totalling 0.8 % of the total Chilean cryosphere, of which 55 % is made up of rock glaciers (Barcaza et al., 2017). The catchment is situated between ∼3500 and 6216 m a.s.l. (summit of Nevado Olivares), is ∼140 km2 in size, and contains 40 rock glaciers totalling ∼9 km2 in addition to a single glacier (Barcaza et al., 2017). Tapado Glacier (1.25 km2) is the principal glacier in the catchment and contains a clean ice section and a debris-covered glacier section. The wider Tapado complex also includes two rock glacier tongues (0.85 km2). There is evidence that the rock glaciers may pre-date the present debris-covered glacier, which together have developed a complex landform assemblage (Monnier et al., 2014). The glacier exists owing to favourable local wind and precipitation conditions due to the topography (Ginot et al., 2006; Kull et al., 2002). The ablation zone of the clean ice section of Tapado Glacier is covered by penitentes, formed by differential ablation (Sinclair and MacDonell, 2016). Borehole temperatures at the accumulation zone revealed cold basal ice conditions, with temperatures reaching ca. −11 ∘C at a depth of 35 m (Ginot et al., 2006).
Precipitation falls mainly as snow and is concentrated within the austral winter (June–September). The catchment is semi-arid and cold with a mean elevation of approximately 3100 m a.s.l. The mean annual precipitation rate of 167 mm per year measured between 1970 and 2009 (Monnier et al., 2014). The 0 ∘C MAAT isotherm is estimated to be ∼4000 m a.s.l. and has been reported to be rising by 0.17 ∘C per decade between 1974 and 2011 (Monnier et al., 2014). Ground measurements from the surface of Tapado complex showed temperatures constantly below negative at depths greater than 2 m (Monnier et al., 2014). Areas of the catchment above 4500 m a.s.l. are likely to display continuous permafrost conditions, whereas areas between 3900 and 4500 m a.s.l. permafrost is probably more scattered (Azócar et al., 2017).
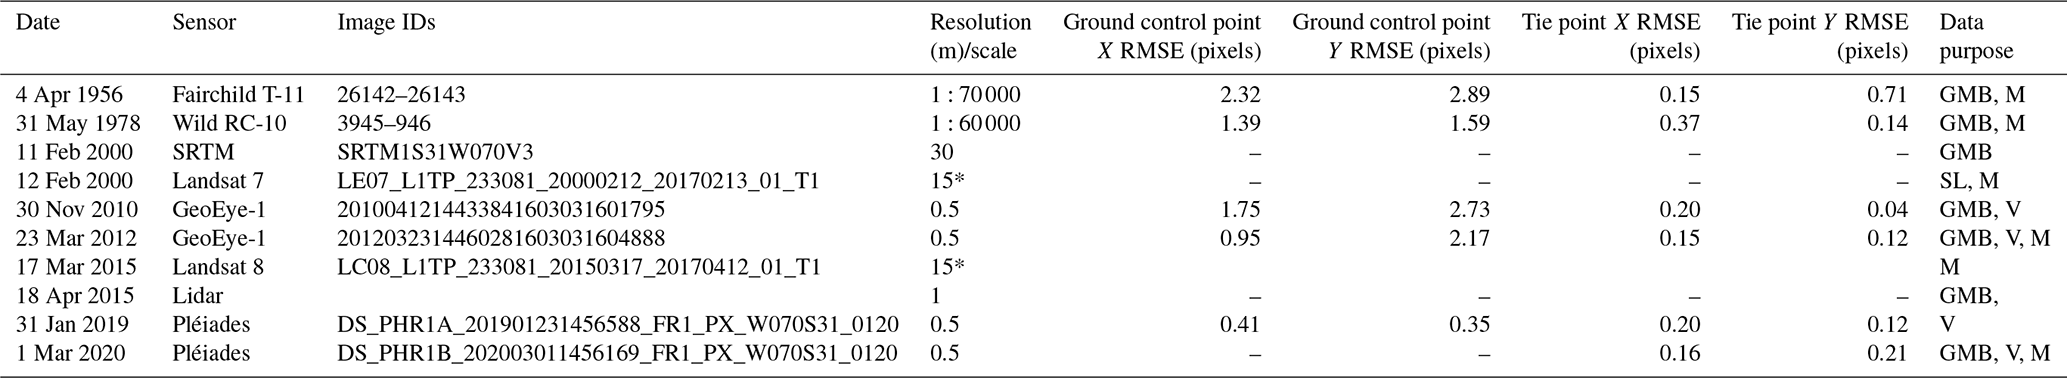
Table 1Datasets used in this study. For the imagery used to produce DEMs, the RMSE values for the ground control points and tie points are shown. * The Landsat imagery was panchromatically sharpened from its original 30 m spatial resolution to 15 m.
3.1 Remote sensing data
A variety of remote sensing datasets were utilised in this study (Table 1) including historical aerial photographs, airborne light detection and ranging (lidar), and stereo satellite imagery. The lidar data were acquired by Digimapas Chile in 2015 at an original point density of 13.67 points per square metre and a vertical RMSE of 0.25 m. The data were part of a study conducted by the Chilean National Water Directorate (Dirección General de Aguas (DGA), 2015) and cover the Tapado complex and the immediate surrounding terrain. The lidar data were provided as a 1 m gridded DEM. Two sets of aerial photography from 1956 and 1978 were acquired by the Geographical Military Institute (IGM) of Chile. These images were provided without any calibration report, and the images themselves contain scratches and other artefacts. Additional photographs from the series which covered the entire catchment were available; however, the images were of insufficient quality to process. Aerial photographs from 2000 acquired by Servicio Aerofotogramétrico Chile (SAF) were available, but a lack of image contrast on the accumulation area of Tapado Glacier prevented the extraction of reliable elevation values. We therefore opted to use the 30 m Shuttle Radar Topography Mission (SRTM) DEM for studying Tapado Glacier. Two Landsat images, a Landsat 7 image from 2000 and a Landsat 8 image from 2015, were used to delineate the outlines of both Tapado Glacier and the wider Tapado complex. The two scenes were panchromatically sharpened prior to analysis.
Tri-stereo satellite imagery covering the entire catchment was also used, namely two GeoEye-1 datasets (2010 and 2012) and two Pléiades datasets (2019 and 2020), both at 50 cm resolution.
3.2 Field data
Differential GNSS (DGNSS) data were collected as part of the ongoing monitoring programme maintained by the DGA and Centre for Advanced Research in Arid Zones (CEAZA) over a period of 9 years (2010–2019). In total there were 36 kinematic point measurements over the Llano de Las Liebres rock glacier measured between 2010 and 2019, while the Tapado complex had 54 kinematic points between 2010 and 2014, four kinematic points between 2010 and 2013, and 10 kinematic points between 2018 and 2019. Additionally, in situ mass balance data have been collected over Tapado Glacier. Five ablation frames were monitored between 2011–2012, and eight ablation stakes were measured between 2013 and 2015.
3.3 Climate data
To understand the main climatological factors that have driven the cryospheric changes observed in the La Laguna catchment, we examine meteorological records from a local automatic weather station (AWS) and results from the ERA5 climate reanalysis (Muñoz-Sabater et al., 2019) in the period 1979–2020.
AWS data consist of daily average air temperature (T) and daily precipitation (P) data recorded at La Laguna AWS (Fig. 1). The AWS is maintained by the DGA, and its records date back to 1978 and 1965 for T and P, respectively. We use monthly averaged results from the ERA5 climate reanalysis extracted for the nearest point to Tapado Glacier to (i) compare with the AWS data and (ii) identify changes in the main drivers of surface energy balance of glaciers in this region. In particular, we examine ERA5 data of precipitation, temperature, incoming shortwave radiation (Sin) and vapour pressure deficit (VPD). Sin and VPD are chosen due to their close relation with cloudiness and humidity, as it has been shown that these variables are linked with glacier mass balance in the Dry Andes (Kinnard et al., 2020; MacDonell et al., 2013).
4.1 Generation of photogrammetric DEMs
The same workflow was broadly applied to photogrammetrically generate DEMs for 1956, 1978, 2012, and 2020. All DEMs were generated using PCI Geomatica Banff (Catalyst.Earth, 2021). The 2020 DEM was generated first, using the rational polynomial coefficients (RPCs) provided with the imagery. No external ground control points (GCPs) were used; however, 1311 automatically generated tie points were used to solve the relative orientation and perform a bundle adjustment. Epipolar images were then generated before the DEM was extracted at a 2 m posting using a semi-global matching algorithm, which has been shown to outperform normalised cross correlation and thereby produce cleaner DEMs (Hirschmüller, 2008). The DEM was then used to orthorectify the imagery, and an orthomosaic was produced. The same steps were then performed for the remaining datasets, with the 2020 orthomosaic and DEM being used as sources for GCPs in order to align the remaining datasets as closely as possible. The residuals for the exterior (GCPs) and interior (tie points) orientations (shown in Table 1) were <3 pixels for the GCPs and <0.75 for the tie points.
4.2 DEM cleaning, co-registration, and void filling
The DEM analysis was conducted using ArcGIS Pro v2.9 and its accompanying Python package, ArcPy (Esri Inc., 2021). The DEMs were first cleaned using the image matching correlation scores. Additionally, following the work of Gardelle et al. (2013), outliers were identified and removed using a value of 3 standard deviations of the elevation change over stable terrain per 50 m altitudinal band.
The cleaned DEMs were co-registered together using a two-step process that was implemented using the ArcPy and NumPy Python packages. Linear co-registration biases were removed following the methods presented by Nuth and Kääb (2011) which minimise the root mean square slope normalised elevation biases over stable terrain. The process was iterated until the standard deviation over stable terrain changed by less than 2 %.
Non-linear biases were evident in the 1956 and 1978 DEMs. Sixth-order polynomials were fitted to elevation biases on stable ground to remove along track biases, while third-order polynomials were used to remove elevation-dependent and across track following Pieczonka et al. (2013). As with the linear co-registration biases, the non-linear corrections were iteratively applied until the improvement was less than 2 %. The linear co-registration shifts are summarised in Table 2, and the non-linear co-registration shifts are shown in Fig. 2.
Table 2Linear co-registration shifts calculated over stable terrain between the respective DEM pairs.
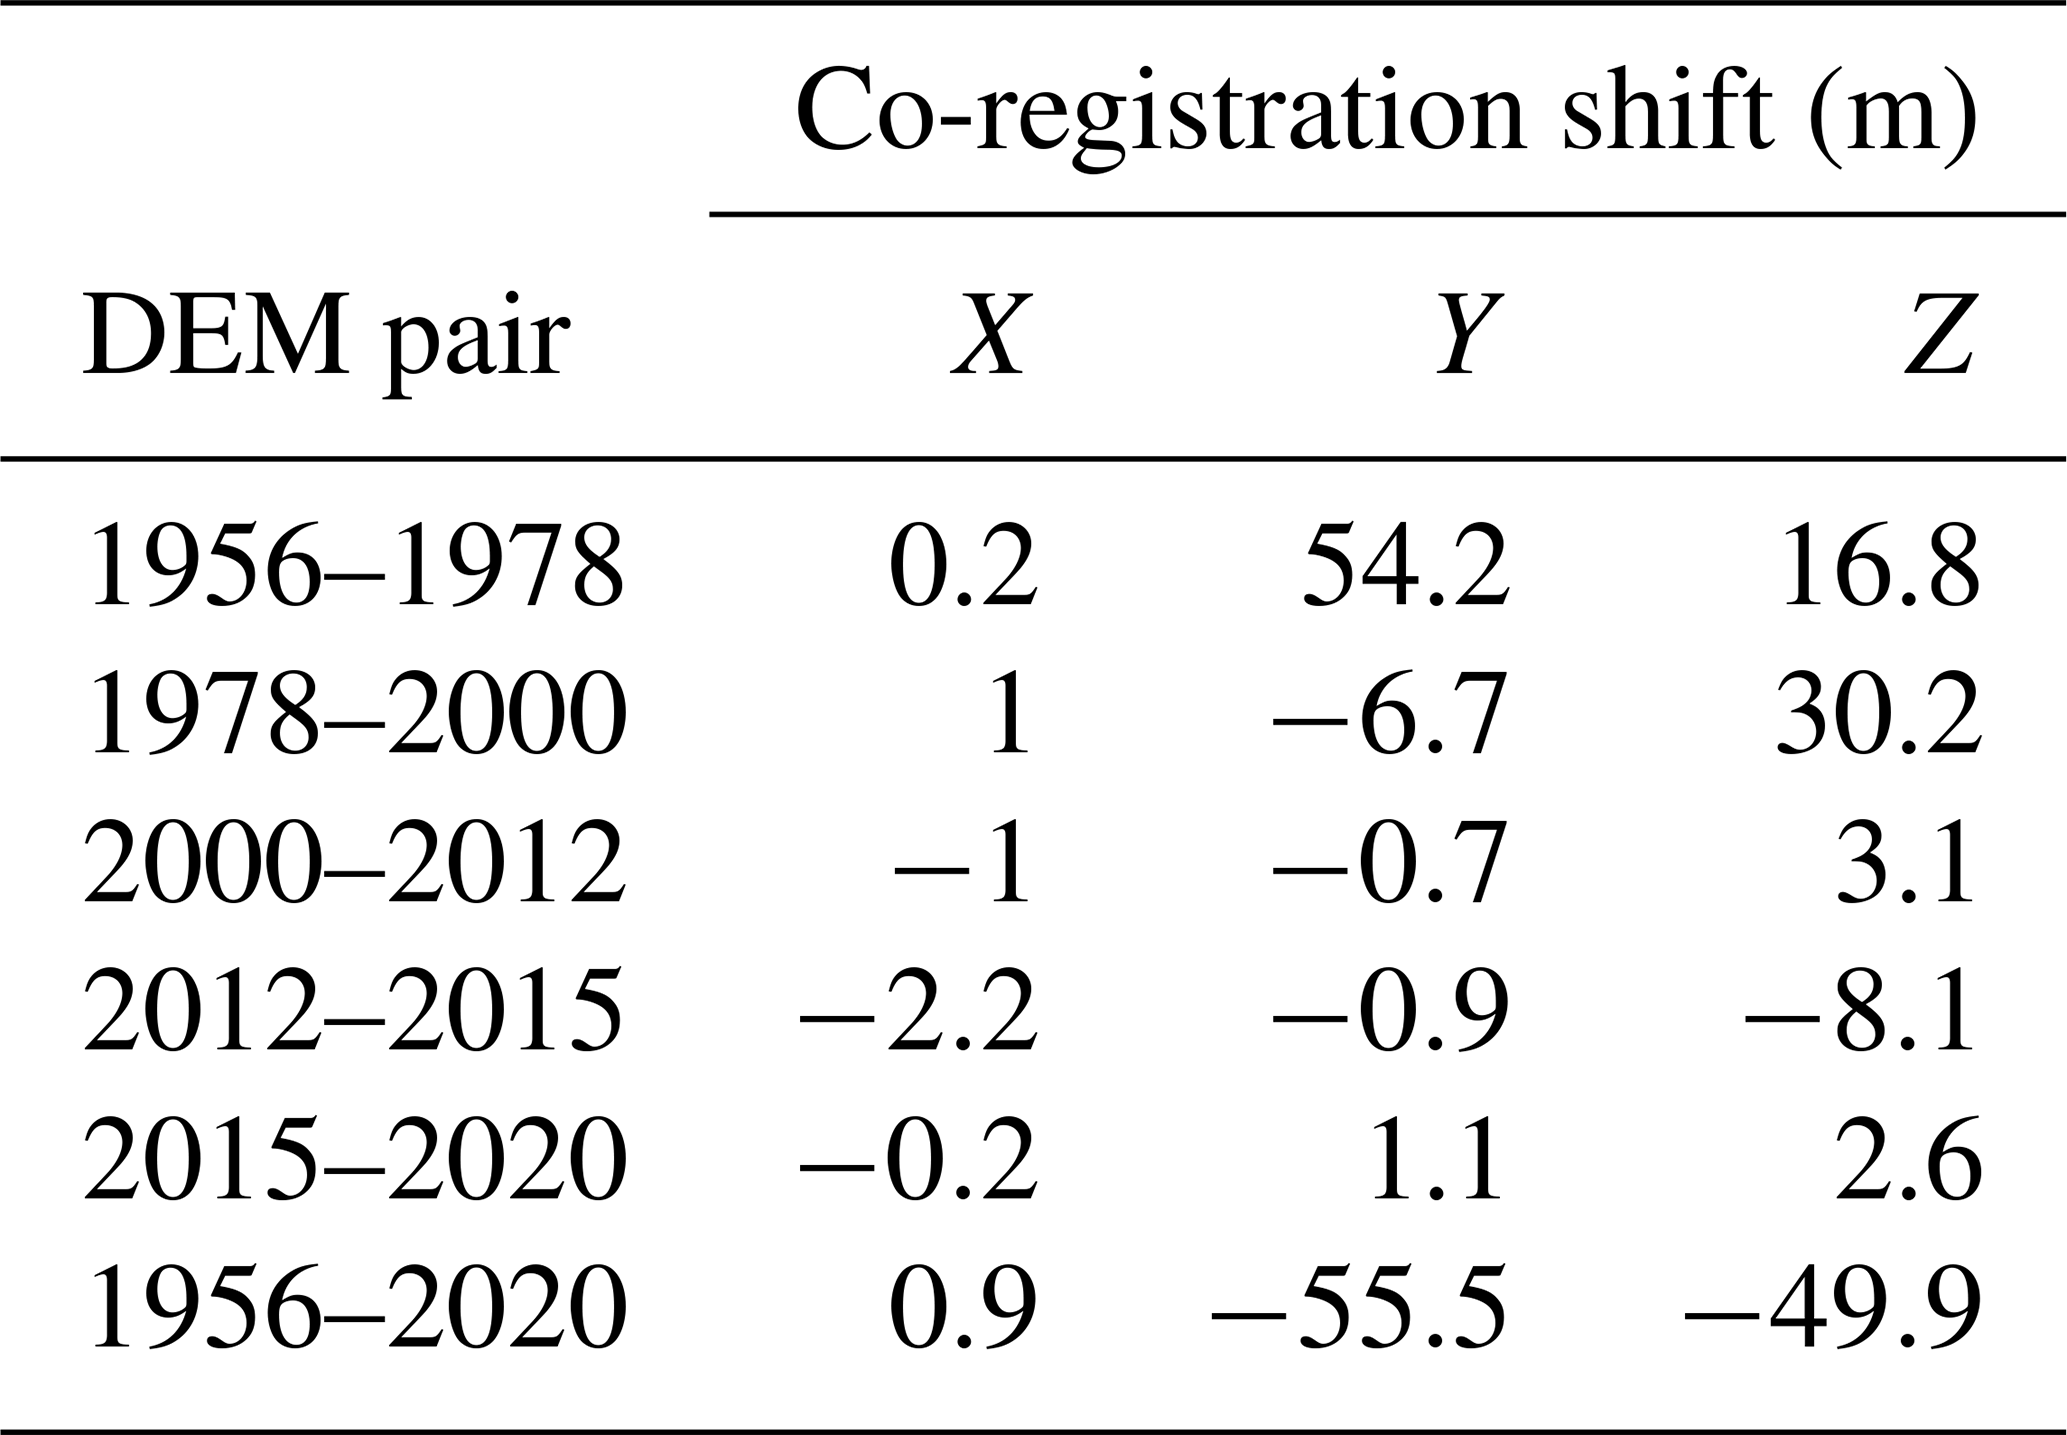
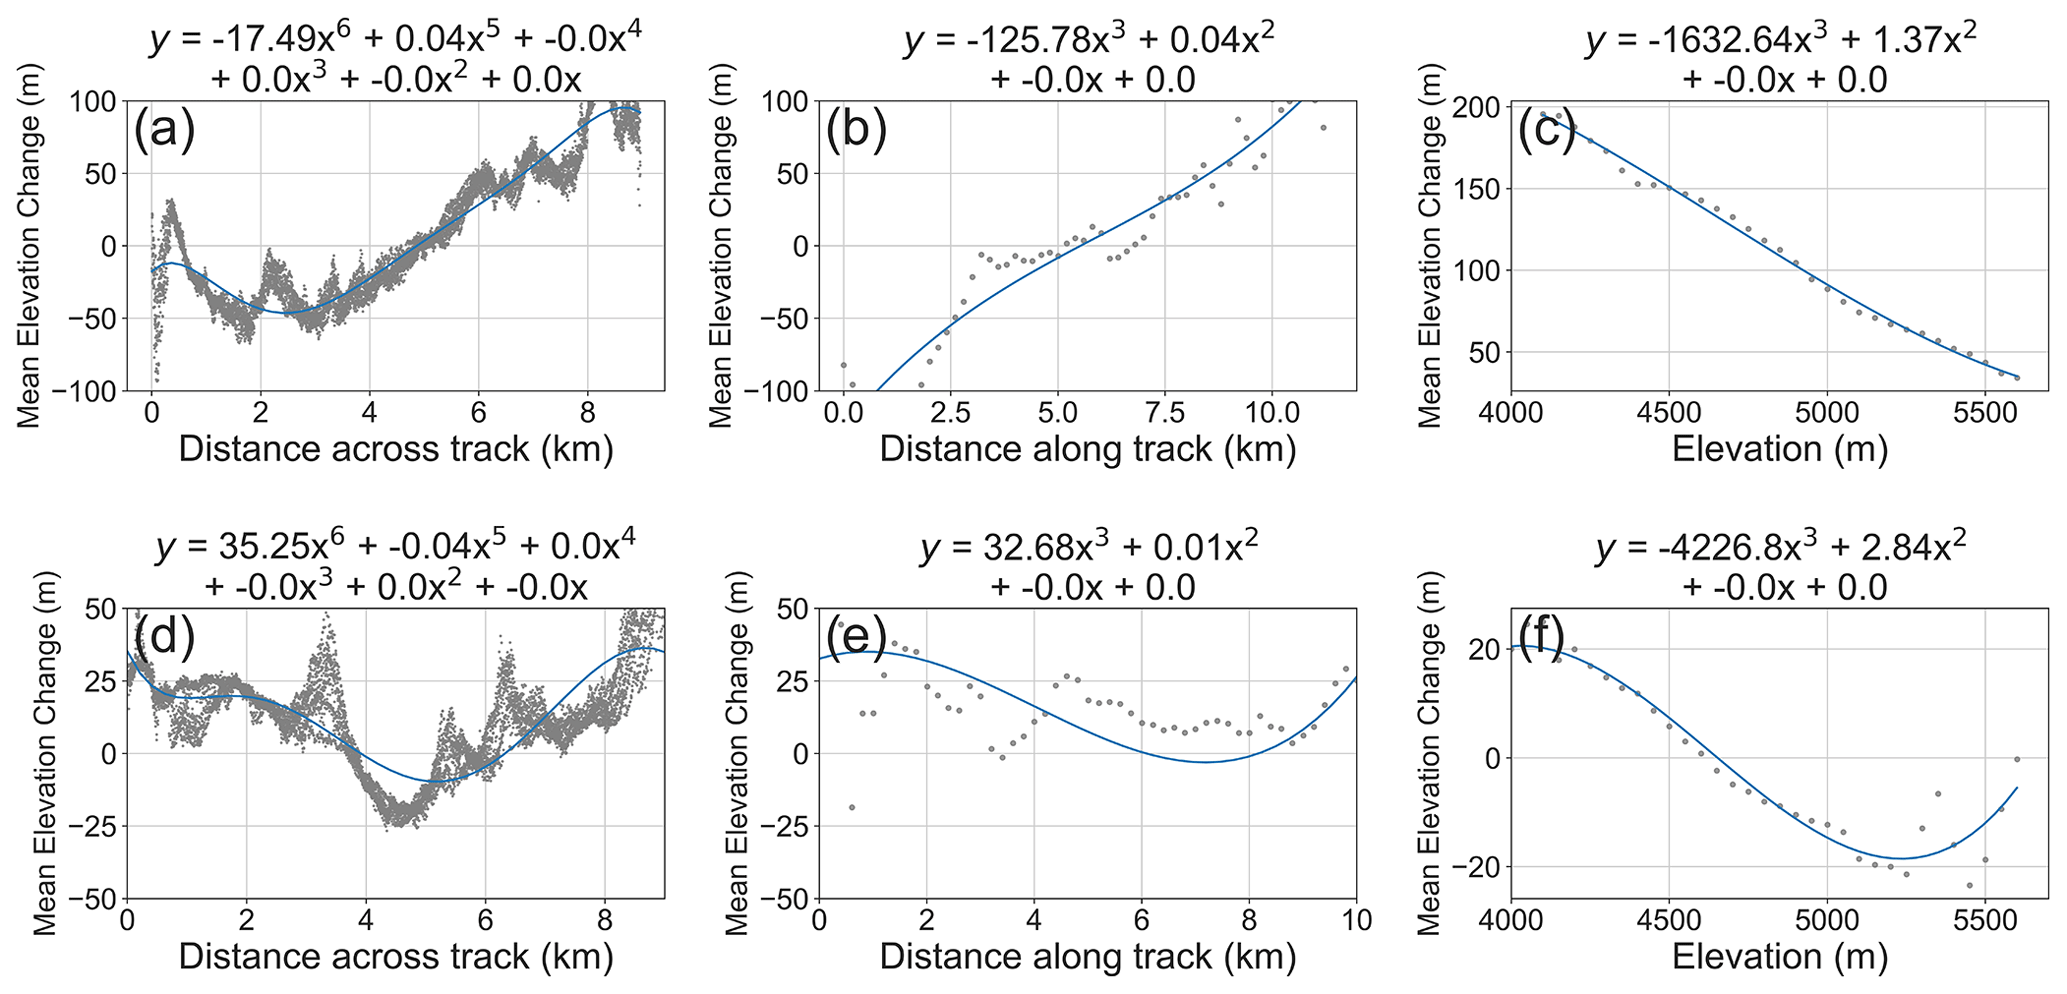
Figure 2Non-linear biases for the 1956 (a–c) and 1978 (d–f) DEMs when elevations are compared against the 2020 DEM over the stable (non-glacial, non-fluvial) terrain.
After cleaning, the elevation change rasters contained small voids, predominantly on the accumulation zone of Tapado Glacier. Voids were filled by fitting a third-degree polynomial between the mean elevation and the mean elevation change per 50 m altitudinal band, a method which has been shown to outperform other void filling techniques and can yield results suitable for studying individual glaciers (McNabb et al., 2019). To calculate the geodetic mass balance we assumed a density of glacier ice of 860±60 kg m−3 (Huss, 2013).
Radar penetration correction
The SRTM is based on C-band radar interferometry and as such has well-documented problems associated with radar penetration into the snowpack (Gardelle et al., 2012; Kääb et al., 2012). This problem is less important in the Southern Hemisphere, where the SRTM was acquired during the ablation season. A study of 20 glaciers in the Central Andes found no significant radar penetration between 3500 and ∼5000 m (Farías-Barahona et al., 2019), and some studies have therefore assumed no radar penetration when using the SRTM to look at glacier changes in the Andes (Falaschi et al., 2019a; Ruiz et al., 2012). An inter-comparison between SPOT and SRTM data found however that radar penetration was occurring over the uppermost areas of the Northern Patagonian Ice Field where wet snow and firn are present (Dussaillant et al., 2018). As such, some studies have applied linear scaled penetration corrections above the equilibrium-line altitude (ELA), typically ranging between 0 and 5 m of penetration (Braun et al., 2019; Farías-Barahona et al., 2019; Malz et al., 2018).
Although we have aerial photographs taken within 2 weeks of the SRTM acquisition that could have been used as an alternative and higher-resolution elevation product, the lack of contrast on the upper reaches of the glacier prevented the extraction of reliable elevations. We therefore examined a Landsat 7 ETM+ image from 12 February 2000 (i.e. 1 d after the SRTM acquisition) and found the firn line to have a mean elevation of 5233 m a.s.l. In line with other studies, we therefore applied a linear scaled radar penetration where we assumed 0 m radar penetration at the firn line, increasing to 5 m penetration at the highest point of Tapado Glacier (5585 m a.s.l.). Given the uncertainty in radar penetration we included our corrections within the uncertainty assessment.
4.3 Elevation change uncertainty estimation
Various methods exist for ascertaining the uncertainty of volume change estimations from DEM differencing (Magnússon et al., 2016; Nuth et al., 2012; Paul et al., 2015, 2017; Rolstad et al., 2009). We opted to follow the same methods as Falaschi et al. (2019b), who utilised similar datasets and worked in a similar setting to our study.
The uncertainty of the volume change (EΔvi) (in m3) was calculated by summing up the standard error (EΔhi) (in m) per 50 m altitudinal band, multiplied by the area of each altitudinal band (Ai) in order to account for the hypsometry:
where the standard error (EΔhi) is derived from the standard deviation over stable ground (σstable), divided by the effective number of observations (N),
N is calculated using the number of pixels (Ntot) in the DEM differencing, the pixel size (PS), and the distance of spatial autocorrelation, which following Bolch et al. (2011) we took to be 20 pixels:
For determining the total uncertainty in the geodetic mass balance of Tapado Glacier (EΔvtot), we combined EΔvi in a square root of the sum of the squares with the uncertainties relating to the volume to mass conversion (Eρ), which following Huss (2013) was taken to be ±60 kg m−3, the error in delineating the glacier outline (Ea), which was derived using the buffer method (Sect. 4.6), and the error related to radar penetration into snow and ice () when applicable:
4.4 Velocity estimation
Surface velocities were extracted by cross-correlating features between the 2012 imagery and the 2020 Pléiades imagery. The 2012 GeoEye image covered the majority of the catchment with the exception of a small area north of the Tapado complex. As such, the velocities for this area were based on the 2010 GeoEye image. As the debris-covered portion of the Tapado complex was flowing both faster and less coherently than the rock glaciers of the catchment, the surface decorrelated over an 8-year period; therefore, features were tracked between the 2019 and 2020 Pléiades imagery. It was not possible to track features on the clean ice section of Tapado Glacier due to deformation of the features between the images. This section was accordingly set to “NoData”.
Prior to performing cross correlation it was necessary to co-register the slave images to the master images at pixel-level precision. To do this we utilised the super-registration routine within PCI Geomatica Banff. This routine performs a normalised cross correlation (NCC) at a given grid spacing (in our case every 5 m) to quantify and then correct any offset between orthorectified imagery. Once the imagery was co-registered, we performed the cross correlation using IMCORR (Scambos et al., 1992), implemented through QGIS using a 64-pixel reference window and a 128-pixel search window at a spacing of 5 m. A finer reference window could have helped define smaller-scale displacements; however, as the area is seismically active and generally consists of loose, unstable rock on steep slopes, using a larger reference window reduced the amount of noise. The resulting displacement vector files were filtered to exclude extreme displacement values as well as erroneous flow directions and converted to annual displacements. The displacement vectors were merged into one file before an invert distance weighting (IDW) interpolation was used to create a 15 m resolution displacement raster.
4.5 Surface velocity accuracy assessment
We ascertained the accuracy of our surface velocities in two ways. Firstly, we compute the standard deviation of the surface displacements on stable ground (i.e. excluding glaciers, rock glaciers, shadows, etc.) where the displacement would be expected to be zero. We excluded very steep terrain (> 40∘) to make our accuracy assessment comparable to the terrain on the rock glaciers. It should be pointed out however that the study area mainly comprises of loose rocks and debris and is seismically active; as such, by taking the standard deviation of the stable ground as our error bars, we are most likely being too conservative. This resulted in a mean uncertainty of ±0.03 m a−1.
We also compare our remote-sensing-based velocities to the DGNSS velocities collected from the surfaces of the Tapado complex and Llano de las Liebres rock glacier over broadly the same period.
4.6 Glacier and rock glacier delineation
We used the glacier and rock glacier produced by Schaffer and MacDonell (2020) as a baseline product. This inventory was based on manual interpretation of Pléiades imagery from 2019. We manually adapted the shapefiles based on the remote sensing data from 1956, 1978, 2000, 2012, 2015, and 2020. The Tapado Glacier–rock glacier complex consists of a clean ice glacier component, a debris-covered glacier component, and a rock glacier. As a prerequisite for deriving geodetic mass balances, we had to separate the glacier from the rock glacier. We used a combination of the surface morphology as well as the elevation change rasters for each time period as a guide for delineating glacier extent assuming that a change in surface elevation was indicative of glacier ablation or glacier dynamic processes (Kääb et al., 2014).
We used the buffer method to ascertain uncertainties for landform delineation (Bolch et al., 2010; Paul et al., 2017). Buffer distances were set to half a pixel for the clean ice section and 1 pixel for the debris-covered ice and rock glaciers.
5.1 Tapado Glacier area change
Between 1956 and 2020, Tapado Glacier shrank by a total of % ( km2) at a mean rate of −0.40 % a−1 and as of 2020 had an area of 1.25±0.01 km2 (Fig. 3, Table 3). Between 1956 and 1978 the glacier area reduced by m2 a−1 ( % a−1), which increased to m2 a−1 ( % a−1) between 2000 and 2012. Rates of glacier change have continued to increase, with losses of % a−1 between 2012 and 2015, although losses decreased to % a−1 between 2015 and 2020. The clean ice section of Tapado Glacier has seen greater changes, shrinking from 1.30±0.01 km2 in 1956 to 0.93±0.01 km2 in 2020, a change of %. The clean ice section was largely stable between 1956 and 1978 ( % a−1) with ice area changes peaking between 2012 and 2015 ( % a−1). Between 2015 and 2020, the clean ice section lost km2 of ice at a rate of % a−1.
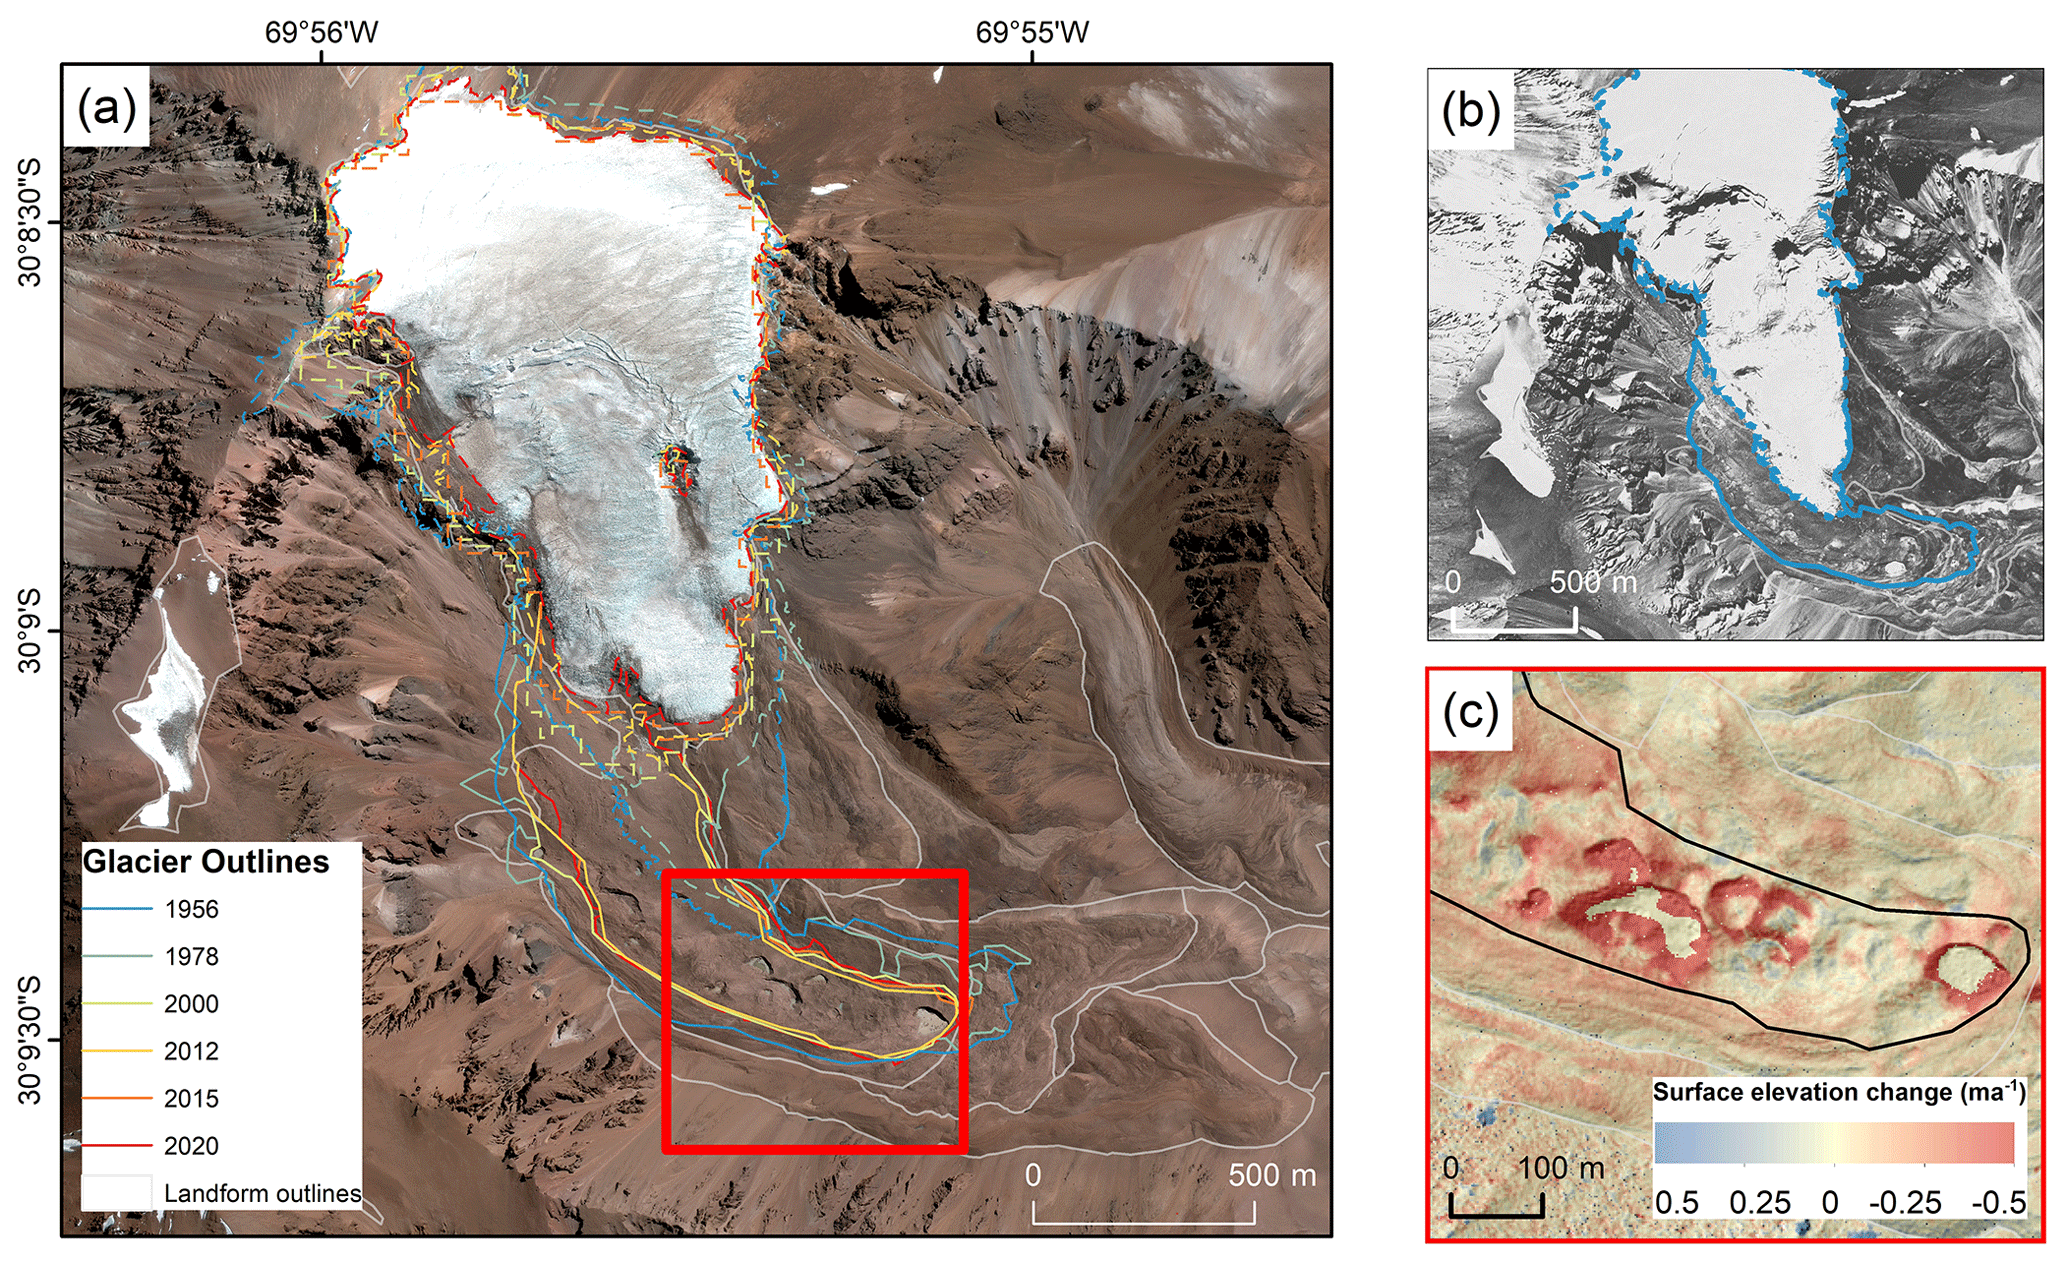
Figure 3(a) Change in area for Tapado Glacier, both for clean ice (dashed lines) and total glacier area (solid lines), between 1956 and 2020. Background imagery is a Pléiades scene from 2020, © CNES (2018) and Airbus DS (2018), all rights reserved. (b) Orthoimage and glacier outline from 1956. (c) Subset of the debris-covered tongue of Tapado Glacier (outline between debris-covered ice and rock glacier shown in black) with surface elevation changes between 2012 and 2020 shown.
Table 3Areas for the clean ice, debris-covered, and rock glacier components of Tapado Glacier between 1956 and 2020. Note that “total glacier” refers to the combined area of the clean ice and debris-covered ice sections.

5.2 Tapado Glacier volume changes and geodetic mass balance
Surface lowering occurred over the entire glacier (Figs. 4 and 5), although the greatest rates of thinning (>40 m in total) were found at the lower section of the clean ice at elevations of 4800–5000 m a.s.l. Elevation profiles show increasing thinning rates in more recent time periods (Fig. 5). Even if thinning rates in the ablation area between 2012–2015 were ∼0.1–0.3 m a−1 more negative than previous years, thinning rates were up to −0.8 m a−1 more negative in the accumulation area. In total Tapado Glacier has lowered by an average of −7.44 m between 1956 and 2020. The clean ice section of Tapado has been thinning at the greatest rates, with a mean annual loss of m a−1 between 2012 and 2020 compared to m a−1 for the debris-covered section of the glacier and m a−1 for the rock glacier section. A clear gradient in ice losses is visible from the clean ice tongue of the glacier to the uppermost section of the debris-covered glacier, down towards the boundary with the rock glacier. The uppermost portion of the debris-covered glacier thinned by ∼0.7–0.8 m a−1. Generally, the debris-covered glacier lost 0.3–0.5 m a−1, although thinning rates are greatly enhanced within the vicinity of supraglacial lakes and ice cliffs, with rates of up to 2 m a−1.
Our results show that Tapado Glacier has consistently had a negative geodetic mass balance between 1956 and 2020 (Fig. 5) with a mean mass balance of m w.e. a−1. The mass balance has also become steadily more negative over time, from an approximately in balance mass balance of m w.e. a−1 between 1956 and 1978 and m w.e. a−1 between 1978 and 2000. The glacier mass balance was most negative from 2012 to 2015 ( m w.e. a−1). Between 2015 and 2020 the mass balance was less negative in the most recent years, with a value of m w.e. a−1.
Table 4Summary of total glacier (clean ice and debris-covered ice) area changes, mean surface change, and geodetic mass balance for Tapado Glacier between 1956 and 2020.
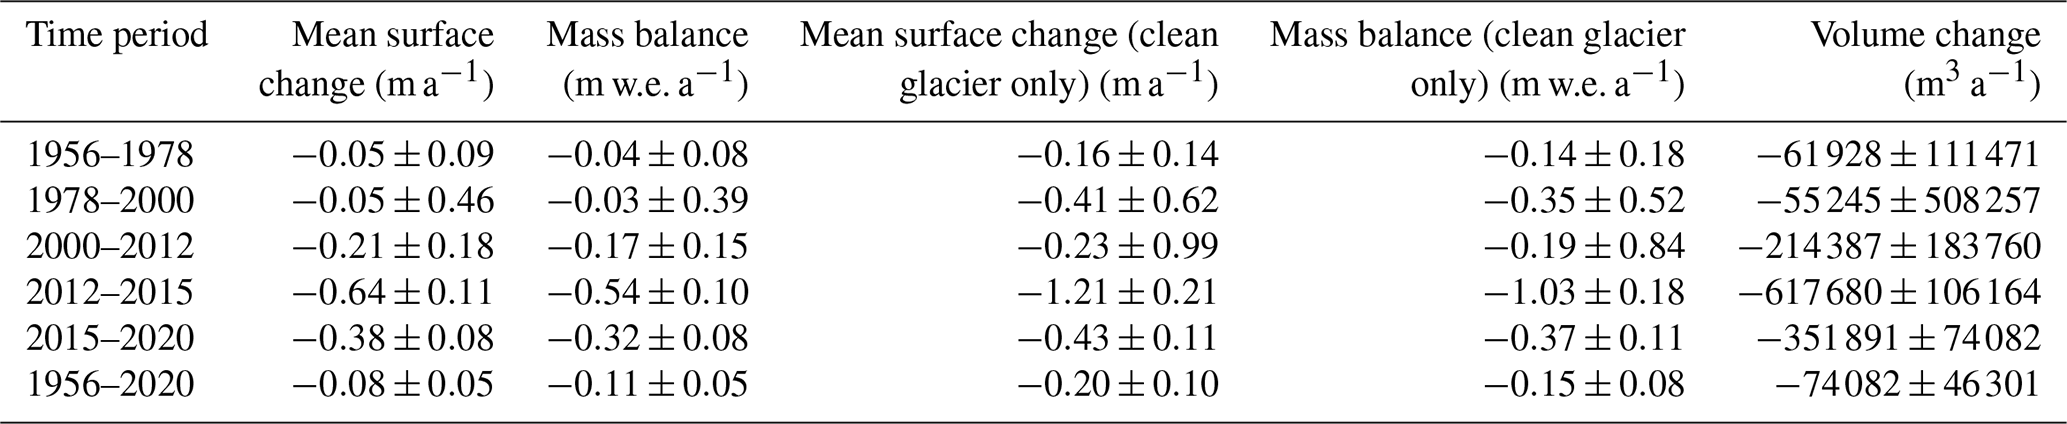

Figure 4Mean annual surface elevation changes for Tapado Glacier between 1956 and 2020. The outline for the Tapado Glacier–rock glacier complex are shown, along with subdivisions for the clean ice section, debris-covered ice section, and rock glacier section.

Figure 5Change in mean surface elevation per year per altitudinal band for the different time periods for Tapado Glacier. Shaded error bars represent the standard deviation at each elevation band.
5.3 La Laguna catchment rock glacier changes
Of the 40 rock glaciers within the La Laguna catchment, we had data to study changes of 35 features (Table S1). Surface elevation changes between 2012 and 2020 reveal heterogenous changes (Table 4, Fig. 6). Most of the rock glaciers show clear patterns of alternating traverse bands of elevation gains and elevation losses related to rock glacier flow (Fig. 5). The global fronts of the landforms generally show increases in elevation associated with the gradual advance and the accumulation of rocky debris. Additionally, some of the rock glaciers exhibit longitudinal bands of elevation gain and loss.
Fourteen of the 35 rock glaciers did not show any significant change (i.e. greater than the uncertainty) over the 8-year period. Additionally, 23 of the landforms underwent surface lowerings less than 0.03 m a−1. Three rock glaciers showed modest gains in elevation which we interpret to be a result of the accumulation of debris. These rock glaciers are all found in narrow valleys where material from the surrounding slopes could avalanche onto the surface of the landforms. Several of the rock glaciers exhibit modest surface lowerings rates as high as >0.1 m a−1 between 2012 and 2020. One of these (Llano de Las Liebres; ID CL104300007; Fig. 6h) has an extensive area of surface lowering near the midpoint of the rock glacier where the surface dropped by ∼2–3 m in total. The lowermost section of the landform showed drops in elevation of up to 1 m in total between 2012 and 2020, while the uppermost stretches showed little to no change. Another feature (ID CL104300032, Las Tetas) had a mean lowering of m a−1. Upon closer inspection this landform seems to be a debris-covered glacier transitioning into a rock glacier, with both glacial and periglacial characteristics visible on the surface (Fig. 11).
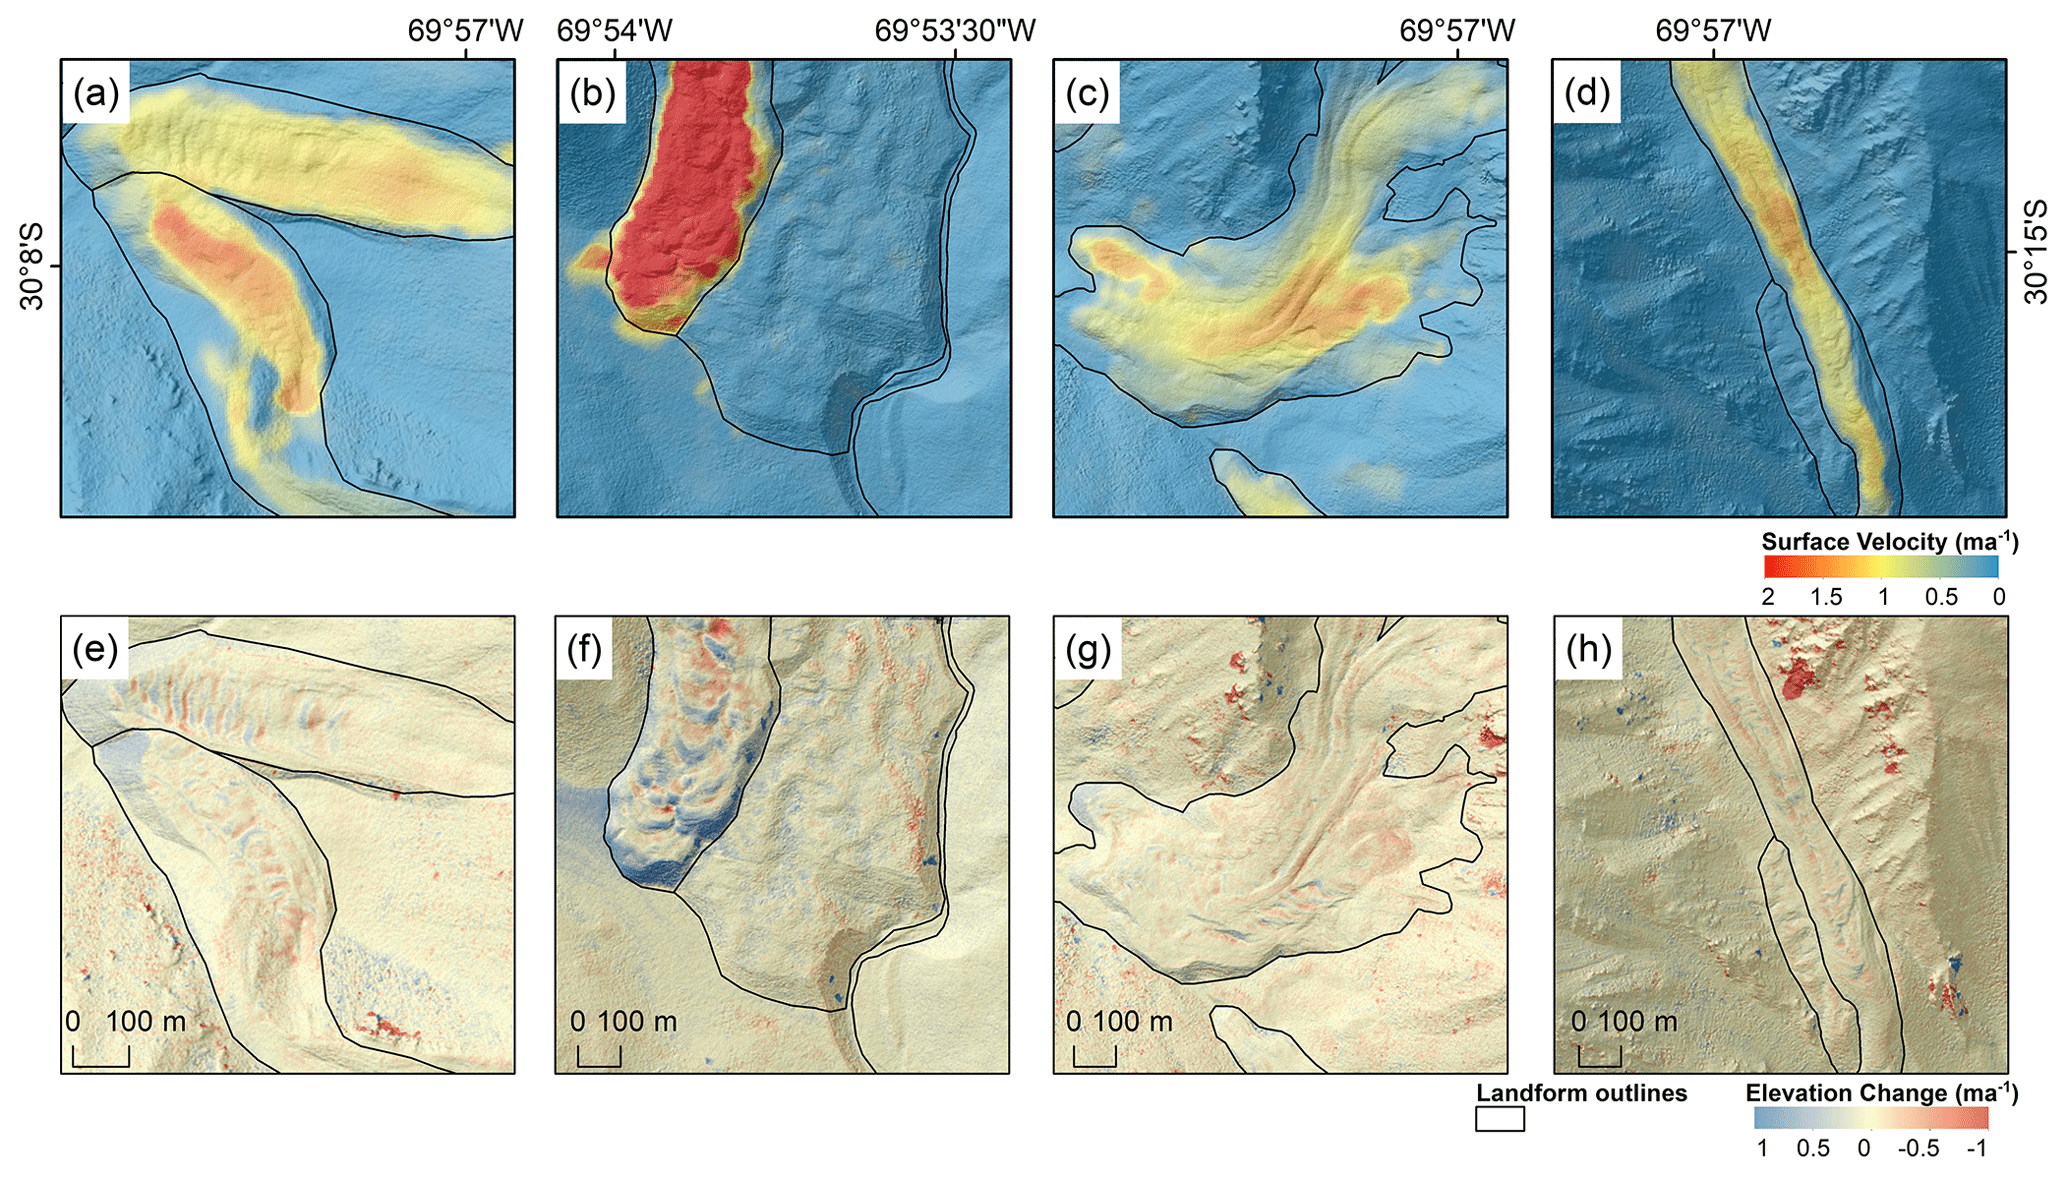
Figure 6Mean annual surface velocities and surface elevation changes between 2012 and 2020 for four select ice-debris landforms. The landforms shown are CL104301020A and CL104301020B (in panels a and e), CL104300054 (shown in panels b and f), CL104301021 (shown in panels c and g), and Llano de Las Liebres (CL104300007) (shown in panels d and h).
5.4 La Laguna catchment rock glacier surface velocities
On average, the rock glaciers within the catchment have been flowing at a rate of 0.54±0.03 m a−1 between 2012 and 2020. The surface velocities of landforms varied greatly within the catchment, from landforms that were inactive (moving at rates below the uncertainty, m a−1) to those flowing at mean velocities m a−1. Although landform in the catchment with the highest mean displacement was the debris-covered portion of the Tapado complex (1.1±0.03 m a−1) several rock glaciers are flowing at comparable rates such as CL104301020 (0.96±0.05 m a−1) and CL104300054 (0.89±0.05 m a−1). Additionally, in some areas of individual rock glaciers (such as CL104300054), velocities of up to 4 m a−1 were observed. Five of the 40 rock glaciers had either no observed velocity or an observed velocity less than the detection level of 0.03 m a−1.
Several rock glaciers have distinct active and inactive areas. For example, CL104300054 (shown in Fig. 6b) has a ∼250 m wide section with surface velocities flowing up to 4 m a−1 on the western side of the landform, while the eastern section is largely inactive with no discernible velocity. Similar heterogenous velocities are also seen in CL104300038 and CL104301022. On the Tapado complex and, to an extent, Las Tetas, surface velocities are noticeably higher downstream of ponds on the surface.
5.5 Comparison with field data
When the velocities computed from optical feature tracking were compared with the DGNSS-derived displacements (Fig. 7), there was a strong positive relationship (R2=0.81), although there is noticeable bias, with the feature tracking underestimating the velocity according to the DGNSS data by an average of 0.16 m a−1. There are several points, however, where the DGNSS data show velocities an order of magnitude faster than measured with the feature tracking. These points seemed to occur in two settings: either on the margins of the rock glaciers or within the vicinity of supraglacial lakes and ice cliffs on the Tapado complex. In both cases, we speculate that the spatial resolution of the feature tracking dataset cannot resolve such contrasts in velocity over a small area, resulting in an underestimation of surface velocity when compared to the individual boulders tracked with the DGNSS.
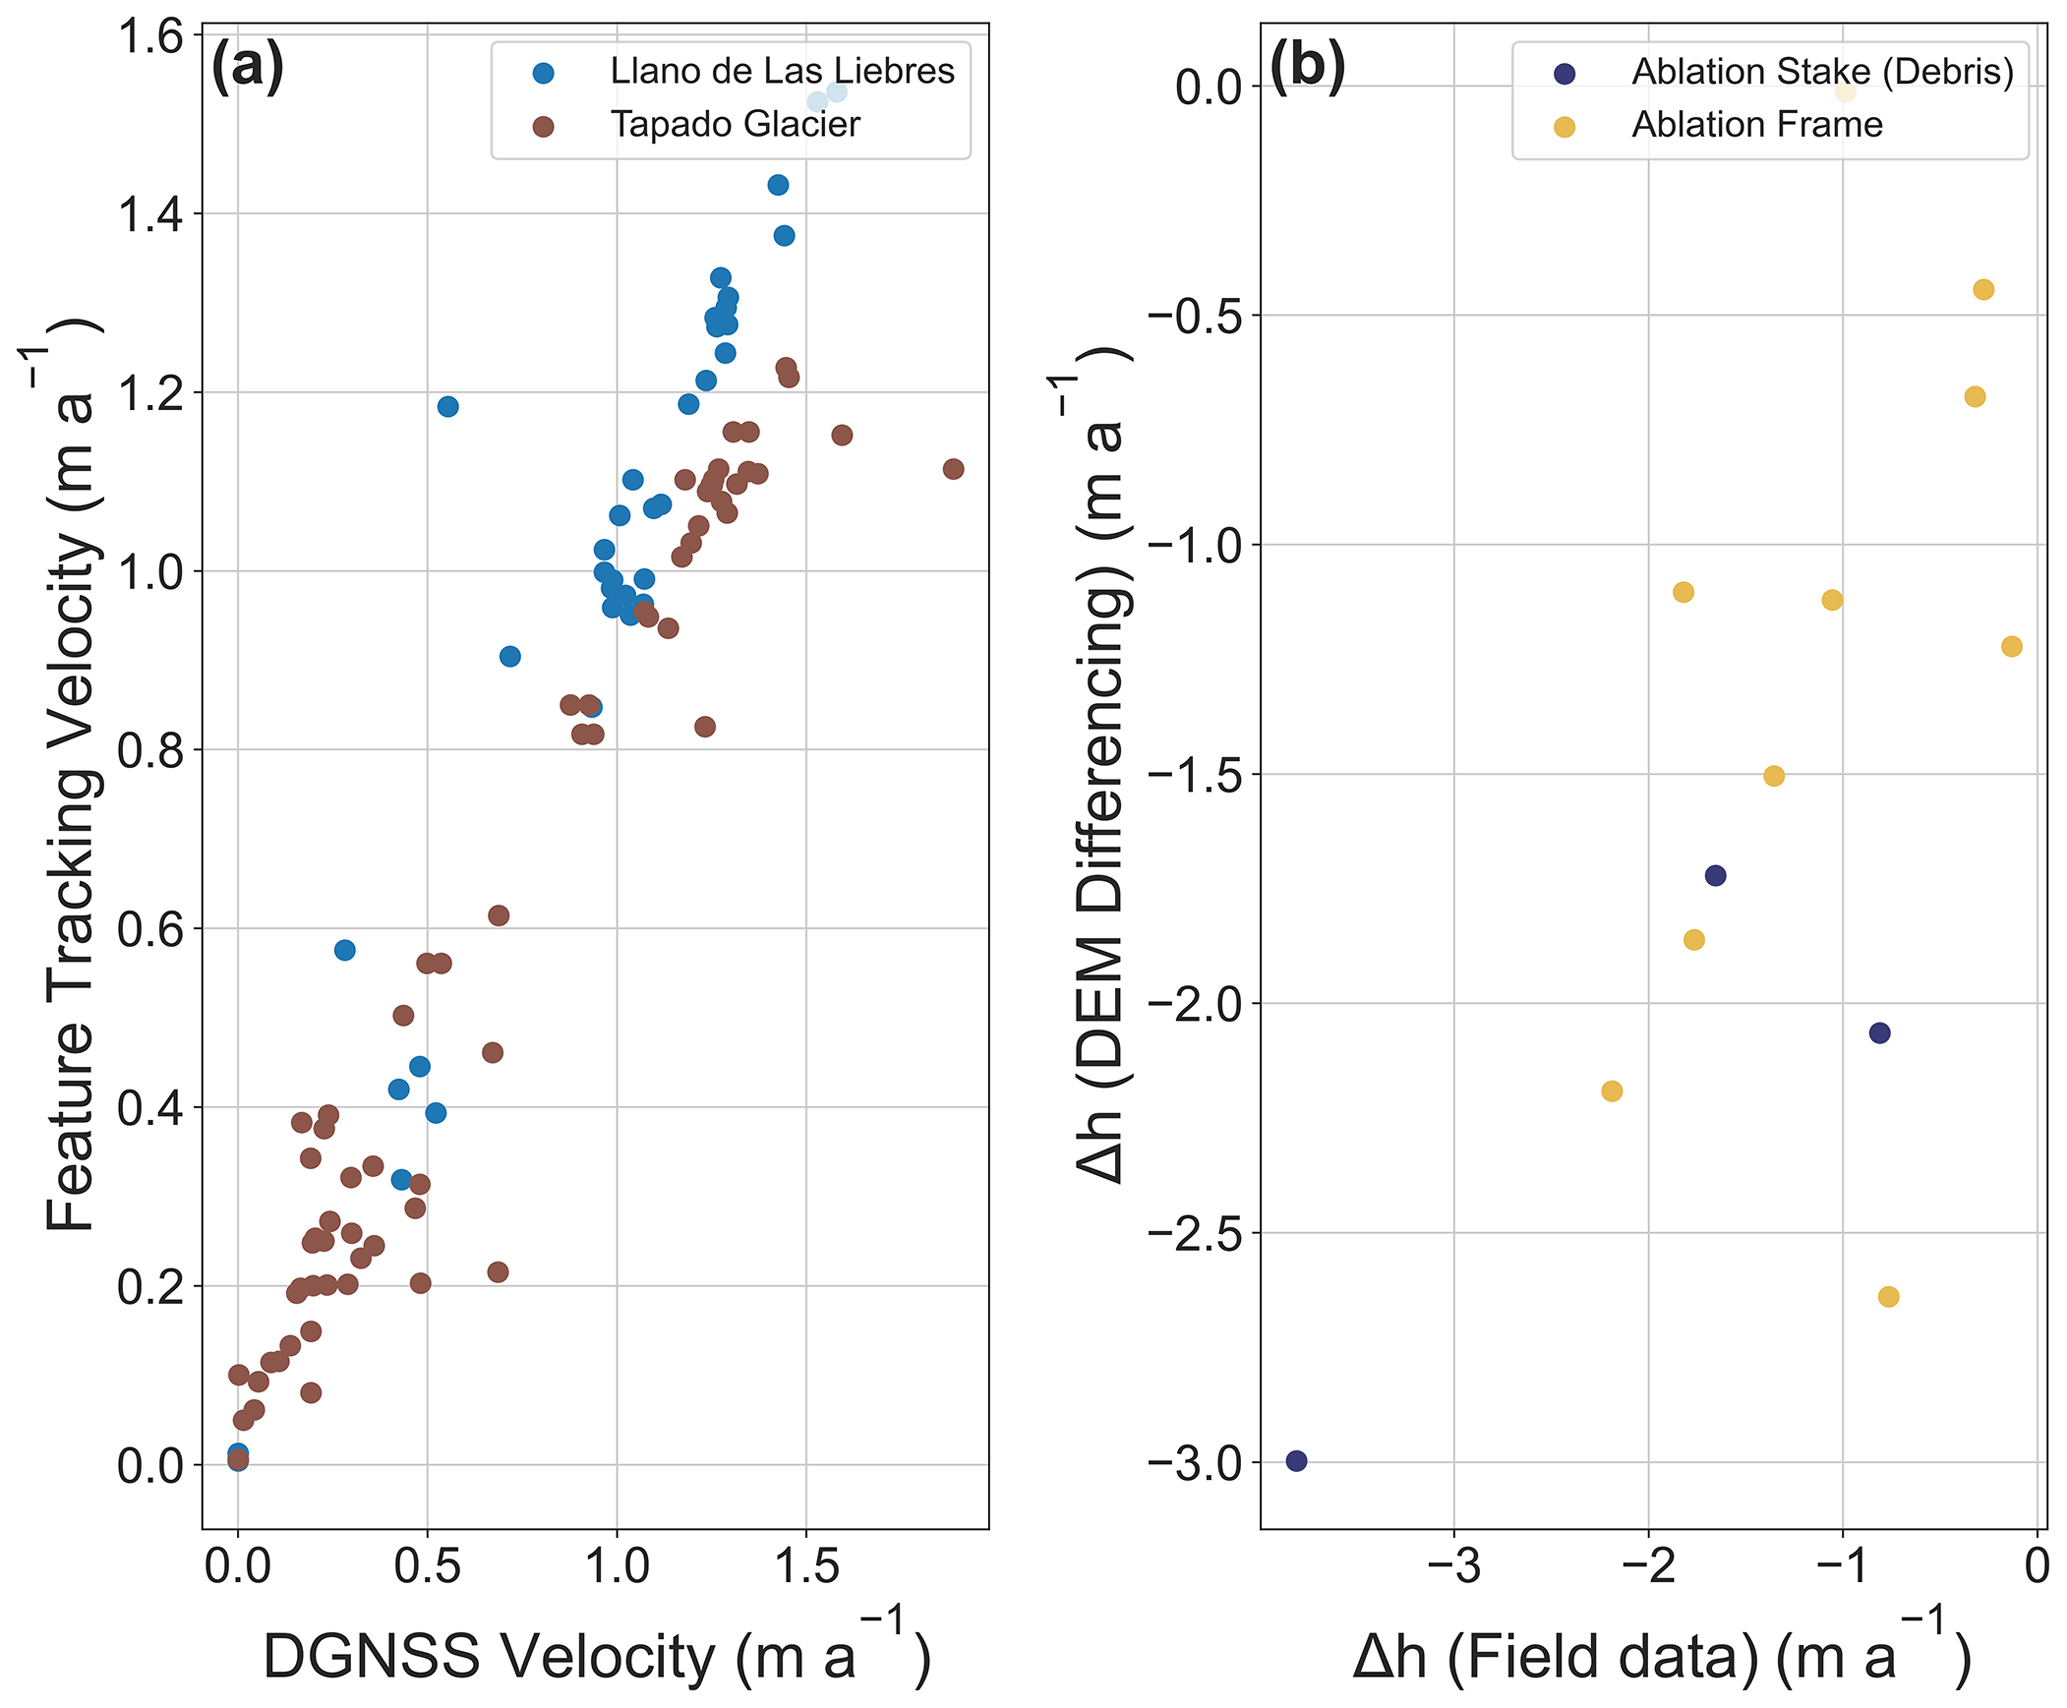
Figure 7(a) Comparison of surface velocities derived from optical feature tracking with displacements measured with a DGNSS. (b) Comparison between surface elevation changes between 2012 and 2015 derived from remote sensing and surface elevation change measured at ablation stakes between 2011 and 2012 and between 2014 and 2015.
We also compared the optical feature tracking data to the DGNSS data along a longitudinal and traverse profile on the Tapado complex, as well as one longitudinal profile on Llano de Las Liebres rock glacier (Fig. 8). Similar patterns between both database sets were observed, with mean deviations for Tapado profile 1, Tapado profile 2, and Llano de las Liebres of 0.9, 0.07, and 0.02 m a−1 respectively. It should be noted that while the Llano de Las Liebres DGNSS data span approximately the same time period as the remote sensing data (2010–2019 vs. 2012–2020), the DGNSS data collected on the Tapado complex are from a range of dates within that time interval. Given that several of the measurements were taken on unstable areas close to supraglacial ponds and undercutting ice cliffs, the timing of the measurements may be important, perhaps partially explaining the larger variations between the methods.
We also compared the 13 mass balance stakes against surface elevation data between 2012–2015 (Fig. 7b). There was a substantial median difference of 0.36 m a−1 between the in situ data and the remote-sensing-derived data although the correlation between the two datasets is weak. Note that 10 of the 13 measurements were taken on the part of the clean glacier where penitentes are found, which are likely to induce further errors into the approach. Three of the four largest outliers on Fig. 8b were from the penitentes, while one point was from the debris-covered glacier.
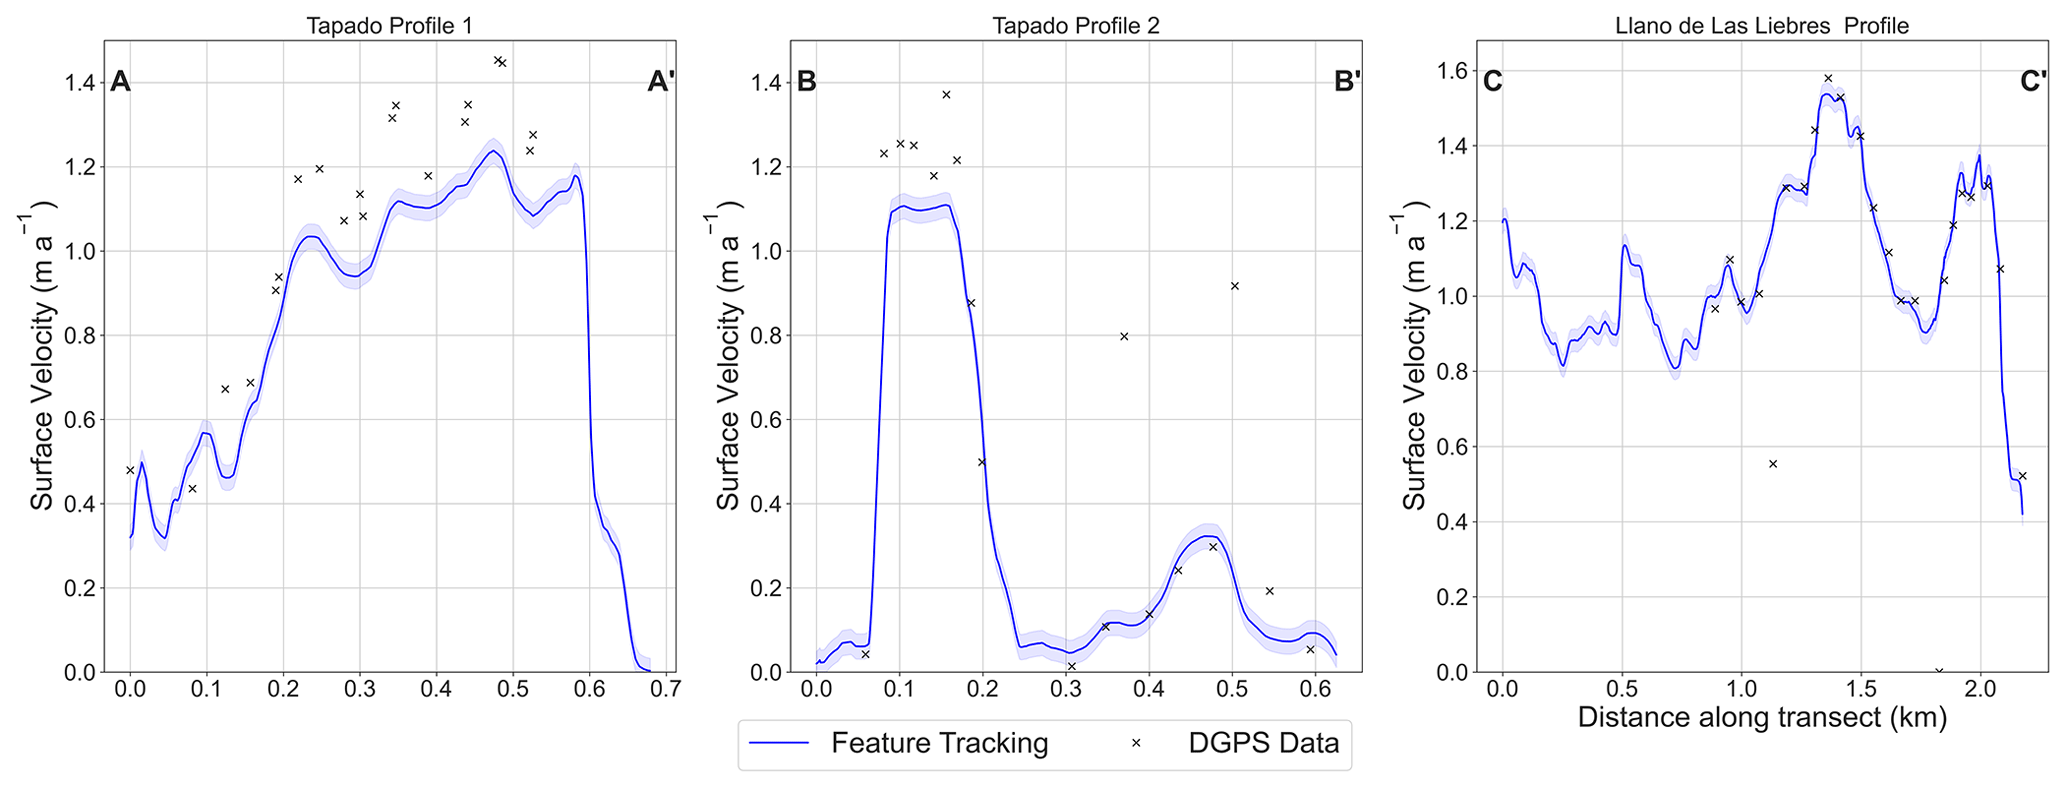
Figure 8Comparison of optical-feature-tracking-based velocities and DGNSS-derived velocities along three profiles on the Tapado complex and Llano de Las Liebres. The locations of these transects are shown on Fig. 1. The blue shading represents the uncertainty of the feature tracking calculated based on the stable terrain.
5.6 Climatological context
We analysed air temperature (T) and precipitation (P) data recorded at La Laguna AWS (shown in Fig. 1). T shows an increasing trend in the period 1980 to 2000 (blue line, Fig. 9a), but there has not been any notable increase subsequently. Precipitation shows a more complicated temporal variability with various humid and dry periods (blue line, Fig. 9b). The period 2009–2014 was one of the driest periods on record and corresponds to a severe drought in central Chile that was unprecedented in extent and duration (Garreaud et al., 2017). Decadal averages of mean annual T and total annual P during the 2010s (2010–2019) were 0.65 ∘C higher and 90 mm yr−1 lower than in the 1980s (1980–1989), respectively. These local data compare very well in terms of temporal variability with monthly averaged results from the ERA5 climate reanalysis (orange lines, Fig. 9a and b). However, exact values present some differences (not shown) that are likely related with elevation differences between the AWS and the grid point.
An increase in Sin and VPD, derived from ERA5, suggests that cloudiness and humidity have decreased since the 1980s. Figure 9c shows that decadal averages of mean annual Sin over the 2010s increased by 2.7 W m−2 relative to the 1980s (∼1 % increase) (Fig. 9c). Mean annual values of Sin as low as 280 W m−2 are estimated for the 1980s but are not repeated after the 1990s. Decadal averages of mean annual VPD over the 2010s increased by 48 Pa relative to the 1980s (∼20 % increase) (Fig. 9d).
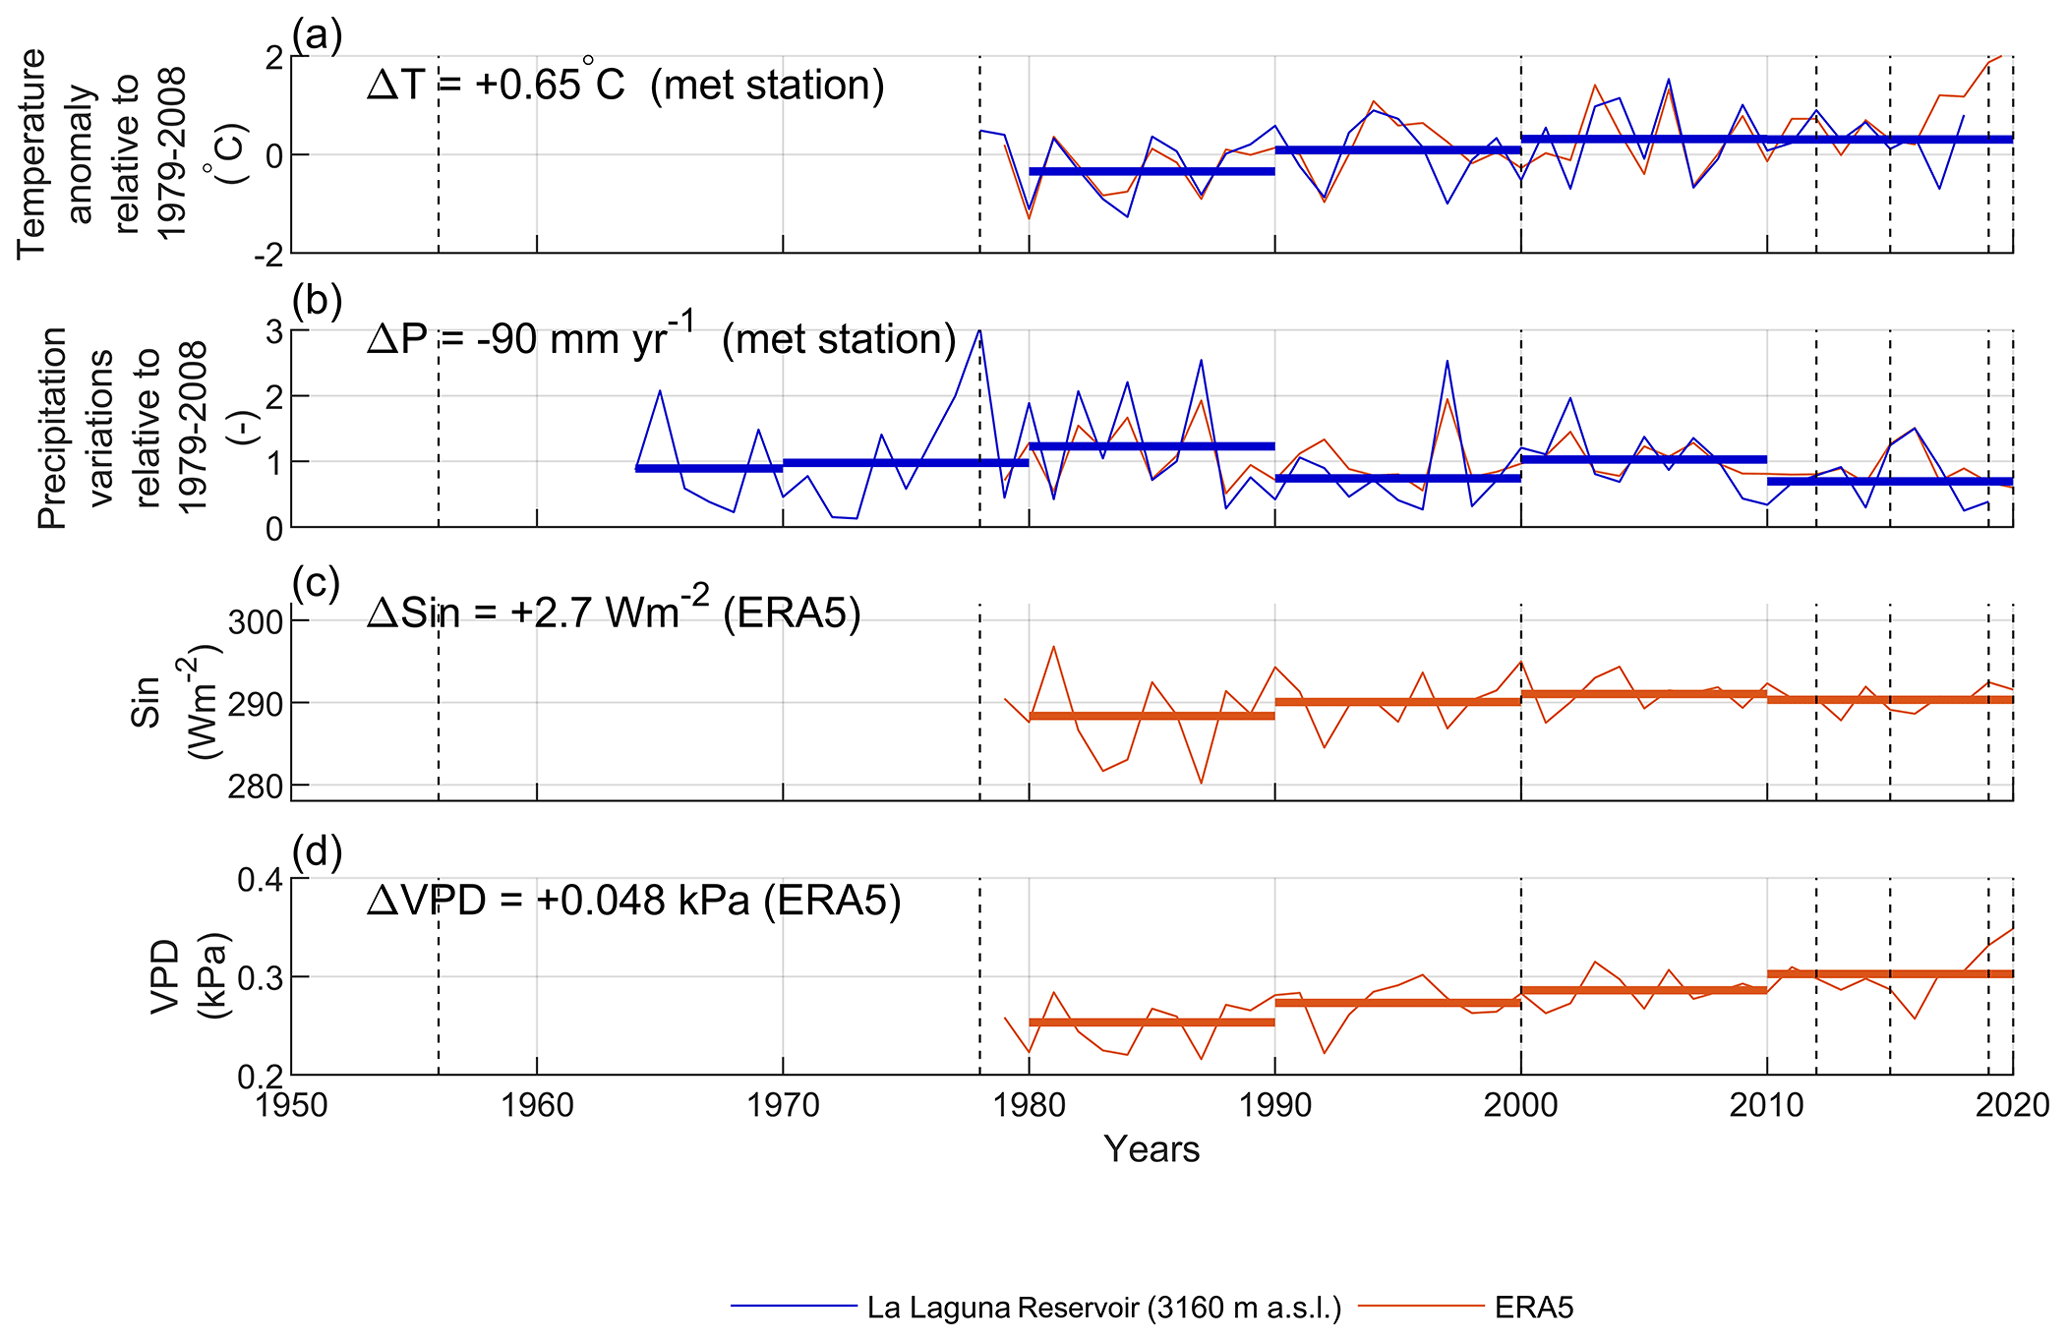
Figure 9Annual time series of (a) mean annual air temperature, (b) total annual precipitation, (c) mean annual incoming shortwave radiation (Sin), and (d) vapour pressure deficit (VPD) are shown in thin continuous lines. Decadal averages are shown in thick continuous horizontal lines. While panels (a) and (b) are variables recorded at La Laguna station, panels (c) and (d) are variables extracted from the ERA5-Land climate reanalysis. Vertical dashed black lines correspond to the years in which Tapado Glacier DEMs are available. Δ values correspond to differences between decadal averages over the 2010s and the 1980s. The location of the automatic weather station (AWS) is shown in Fig. 1.
6.1 Comparison with regional glaciological studies
Tapado Glacier has been shown to have undergone no noticeable change in area between 2000 and 2015 by Barcaza et al. (2017), although unlike this study, the glacier and rock glacier components were not considered separately. Hess et al. (2020) studied the glaciers within the Huasco Valley, in the region to the north of La Laguna, and found the glaciers were shrinking at an average rate of 2.2 % a−1 between 2000 and 2015, which although exceeding even the highest retreat rate measured at Tapado Glacier of 1.03±2.19 % a−1 between 2012 and 2015, is within the error margin.
We compared our results with those of Braun et al. (2019) and Dussaillant et al. (2019), who studied glacier changes over the entire Andes between 2000–2015 and 2000–2018, respectively, and Hugonnet et al. (2021), who studied global-scale glacier changes between 2000 and 2019. As the former of these studies included only the clean ice part of Tapado Glacier, we also exclude the debris-covered ice from our comparison (Fig. 10). The former used repeat bi-static synthetic aperture radar interferometry, while Dussaillant et al. (2019) and Hugonnet et al. (2021) both used ASTER optical stereo imagery. Our results agree well with Dussaillant et al. (2019) and Hugonnet et al. (2021), although the datasets diverge slightly at elevations greater than 5400 m a.s.l. In addition to the differing spatial resolutions of the results, an additional reason for this disparity could be the greater radiometric resolution of the Pléiades sensor (12 bit) vs. ASTER (8 bit) allowing improved image contrast within the accumulation area.
The elevation changes over Tapado Glacier according to Braun et al. (2019) are noticeably more positive than either our results or the results from Dussaillant et al. (2019). Although a similar elevation profile pattern can be observed between all three datasets, Braun et al. (2019) shows glacier thickening in elevations above 4910 m a.s.l., and at most elevations it is ∼1 m a−1 more positive than the results from either this study or from Dussaillant et al. (2019). Additionally, the spread of data is wider, and the mean standard deviation of elevation change over the entire glacier is 0.26 m for Dussaillant et al. (2019), 0.41 m for this study, and 1.58 m for Braun et al. (2019). Hugonnet et al. (2021) show more negative elevation changes (−0.53 m a−1) than Dussaillant et al. (2019) (−0.44 m a−1), this study (−0.35 m a−1), and Braun et al. (2019) (0.22 m a−1). From this we can state that our results conform to the regional analysis performed by Dussaillant et al. (2019) and Hugonnet et al. (2021), while the InSAR-based approach of Braun et al. (2019) underestimates glacier mass losses and erroneously shows that Tapado Glacier has been thickening in the 21st century.
Our geodetic mass balance for Tapado Glacier of m w.e. a−1 between 2000 and 2020 compared very well with the regional average for the Dry Andes of m w.e. a−1 between 2000 and 2018 according to Dussaillant et al. (2019), and it is more negative than the value of 0.03±0.17 m w.e. a−1 given by Braun et al. (2019).
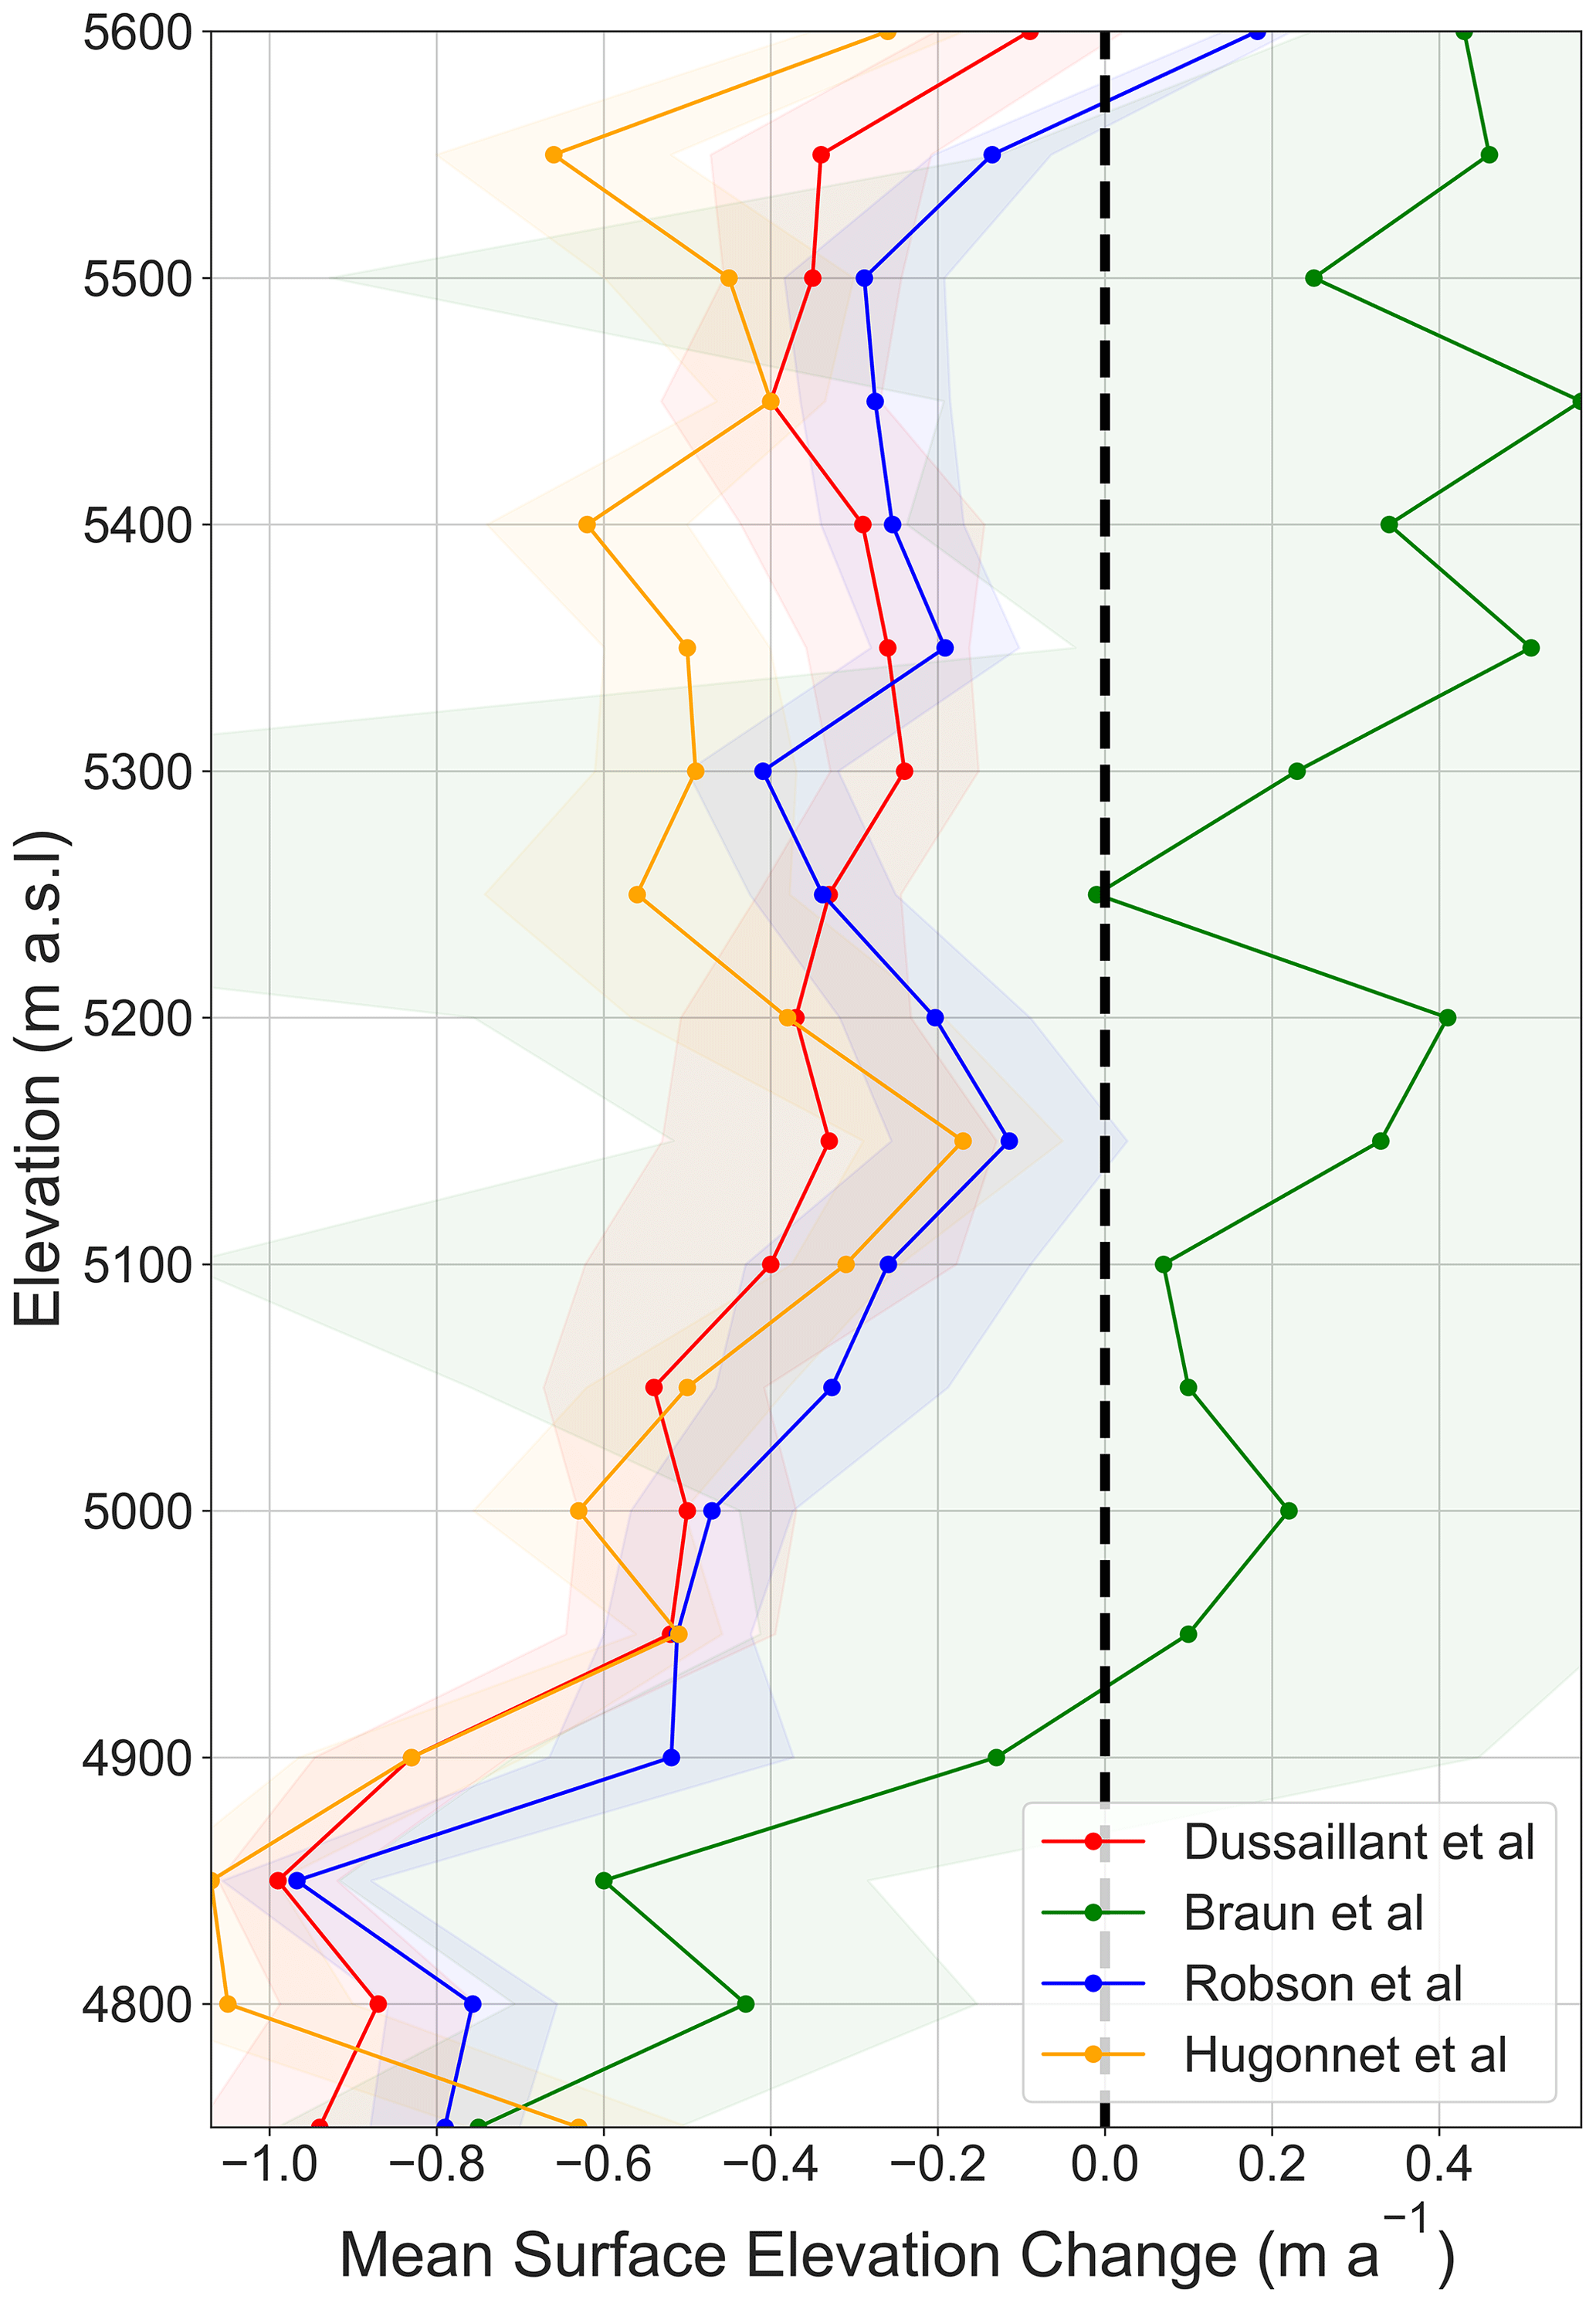
Figure 10Comparison of mean surface elevation change per elevation bin for the clean ice of Tapado Glacier between this study and the results (blue) compared against Braun et al. (2019) (green) and Dussaillant et al. (2019) (red), as well as Hugonnet et al. (2021). Shaded error bars represent 1 standard deviation of elevation changes per elevation bin.
6.2 Comparison with other mass balance studies
Other studies have utilised remote sensing archived to study glacier changes over longer time spans, although comparisons with our study are not always straightforward due to differing climatic settings. The only other glacier within the Dry Andes that has been investigated over such temporal scales is Guanaco Glacier, approximately 90 km to the north of Tapado Glacier (Kinnard et al., 2020). Guanaco Glacier had a negative balance of m w.e. a−1 between 1955 and 1978, which is slightly more negative than Tapado Glacier's value over the same period of m w.e. a−1. Although the other time intervals for the same glacier do not match those from this study, both Guanaco and Tapado glaciers are shown to have a progressively more negative mass balance in recent years, with Guanaco having a mass balance of m w.e. a−1 between 2005–2011 compared to Tapado Glacier's mass balance of between 2000 and 2012. Similarly, Guanaco had a mass balance of m w.e. a−1 between 2011 and 2015 (measured using the glaciological method) compared with Tapado Glacier's value of m w.e. a−1 between 2012 and 2015.
Our results show that since the 1950s, Tapado Glacier has had a geodetic mass balance approximately in line with the glaciers within the Maipo basin of central Chile (∼400 km to the south), which had a regional average m w.e. a−1 with individual glacier mass balances ranging from to 0.18±0.07 m w.e. a−1 (Farías-Barahona et al., 2020a), but is less negative than El Morado Glacier, also within the Maipo basin ( m w.e. a−1 between 1955 and 2015), although this glacier is situated at a lower elevation than Tapado Glacier and has a calving front (Fariás-Barahona et al., 2020b). Tapado Glacier also has a less negative mass than the Patagonian glaciers of Río Oro (), Río Lácteo (), and San Lorenzo Sur () measured between 1958–2018 (Falaschi et al., 2019b).
6.3 Comparison of rock glacier results
Comparatively few studies have investigated rock glacier changes in the region. The Dos Lenguas rock glacier in the Argentinian semi-arid Andes was investigated using both repeat Sentinel-1 interferometry (Strozzi et al., 2020) and unpiloted aerial vehicle (UAV)-based feature tracking (Halla et al., 2021). Rates of surface velocities were found to range from 1.5–2 m a−1, which are on the higher end of the rates we observed in the La Laguna catchment. Similarly, rock glaciers and ice-debris complexes in the Cordón del Plata region of Argentina were found, for a similar period, to have higher rates of deformation with average surface velocities of up to 2 m a−1 and maximum velocities of up to 6 m a−1 (Blöthe et al., 2018, 2020). Monnier and Kinnard (2017) found surface elevations ranging between 0.50 and 1.10 m yr−1 over three rock glaciers in the Central Andes. One of these landforms, Las Tetas, situated 1.5 km to the south of the Tapado complex, was measured to have a mean velocity of 0.86 m a−1 between 2000 and 2012, a little higher than the value of 0.69 m a−1 that we measured for the same landform. Blöthe et al. (2020) also reported that rock glacier velocities varied within individual landforms, with high velocities often focused in narrow belts.
6.4 Implications for hydrological resources
Our study has revealed heterogeneous patterns of cryospheric activity across the La Laguna catchment which can have implications for understanding the hydrological significance of the catchment's landforms. In particular, we found that certain rock glaciers had sections that were flowing at rates in excess of 4 m a−1, which is considerably faster than the catchment average of 0.54±0.03 m a−1, as well as the surface velocities observed on the Tapado complex and Las Tetas rock glacier which are at least partly glacial in origin. Additionally, some rock glaciers had areas that had undergone elevation changes of several metres between 2012 and 2020. Rock glacier elevation changes are difficult to interpret as they could be indicative of two distinct climate responses. A rock glacier surface that has not thickened or thinned could mean that the active layer is insulating the ice within from thawing. Conversely it could mean that a given rock glacier has a low ice content and as such no noticeable surface elevations have occurred. Both high surface velocities and decreases in elevation can be indicative of active ice within landforms with Halla et al. (2021), suggesting that active flow was indicative of ice-rich permafrost situated above the bedrock. Although seasonal and multi-annual rock glacier velocities can be attributed to variations in water input from precipitation and snow melt (Cicoira et al., 2019), such variations are not statistically significant over the 8-year temporal baselines used in this study to derive velocities. Monnier et al. (2014) performed ground penetrating radar (GPR) surveys across the Tapado complex and found evidence for massive ice not only within the debris-covered section of the complex, but also within the rock glacier components, which likely explains the pockets of surface elevation change we observe across several rock glaciers in the catchment. We find that for transitional landforms, although surface elevation changes can be an order of magnitude larger on debris-covered glacier components, the highest surface velocities of a landform are generally found at the lowermost portions of rock glaciers. We interpret this to suggest that ice lenses are found throughout the landforms. We believe a combination of surface elevation changes and surface velocity data can be used to identify the rock glaciers in the region with the largest ice volumes that could be validated with geophysical techniques such as GPR or electrical resistivity tomography (ERT).
6.5 Transitional landforms
Our study site contains one landform that is transitioning from a debris-covered glacier to a rock glacier (Las Tetas) and one where glacial and periglacial components are interacting (Tapado Glacier–rock glacier complex). A transformation in geomorphology is visible on the surfaces of both Las Tetas and, to a lesser extent, the Tapado complex (Fig. 11). Many of the surface ponds and pronounced chaotic glacial geomorphology due to unstable surfaces and spatially incoherent surface change visible on the 1978 image have been replaced by geomorphology indicative of coherent, periglacial creep. Other studies have highlighted contrasting patterns between rock glacier components and debris-covered glacier components of (Blöthe et al., 2018; Monnier and Kinnard, 2017). A distinction can be seen on the surface of the Tapado complex in both surface elevation changes and velocity datasets that correspond approximately to the geomorphological units depicted by Monnier et al. (2014). A similar, if smaller, magnitude distinction in landform components is visible on Las Tetas. In both cases, higher velocities and larger surface elevation changes are observed within the vicinity of surface ponds, and both landforms have faster-flowing rock glacier tongues. In particular, the northern tongue of the Tapado complex is flowing at rates of >1.1 m a−1. The border between rock glacier and debris-covered glacier geomorphology is observed to have moved approximately 150 m up glacier between 1956–1978 and 2015–2020 on the Tapado complex. Monnier and Kinnard (2017) reported similar changes for Las Tetas, with a decrease in the amount of surface ponds, and more coherent velocities. Both a supply of sediment from the surrounding terrain such as rock falls and negative glacier mass balances have been linked to debris-covered glaciers transitioning into rock glaciers (Anderson et al., 2018; Jones et al., 2019a). The rock glacier part of the Tapado complex has a source of sediment from the moraine deposits, the debris-covered glacier, and rock falls.
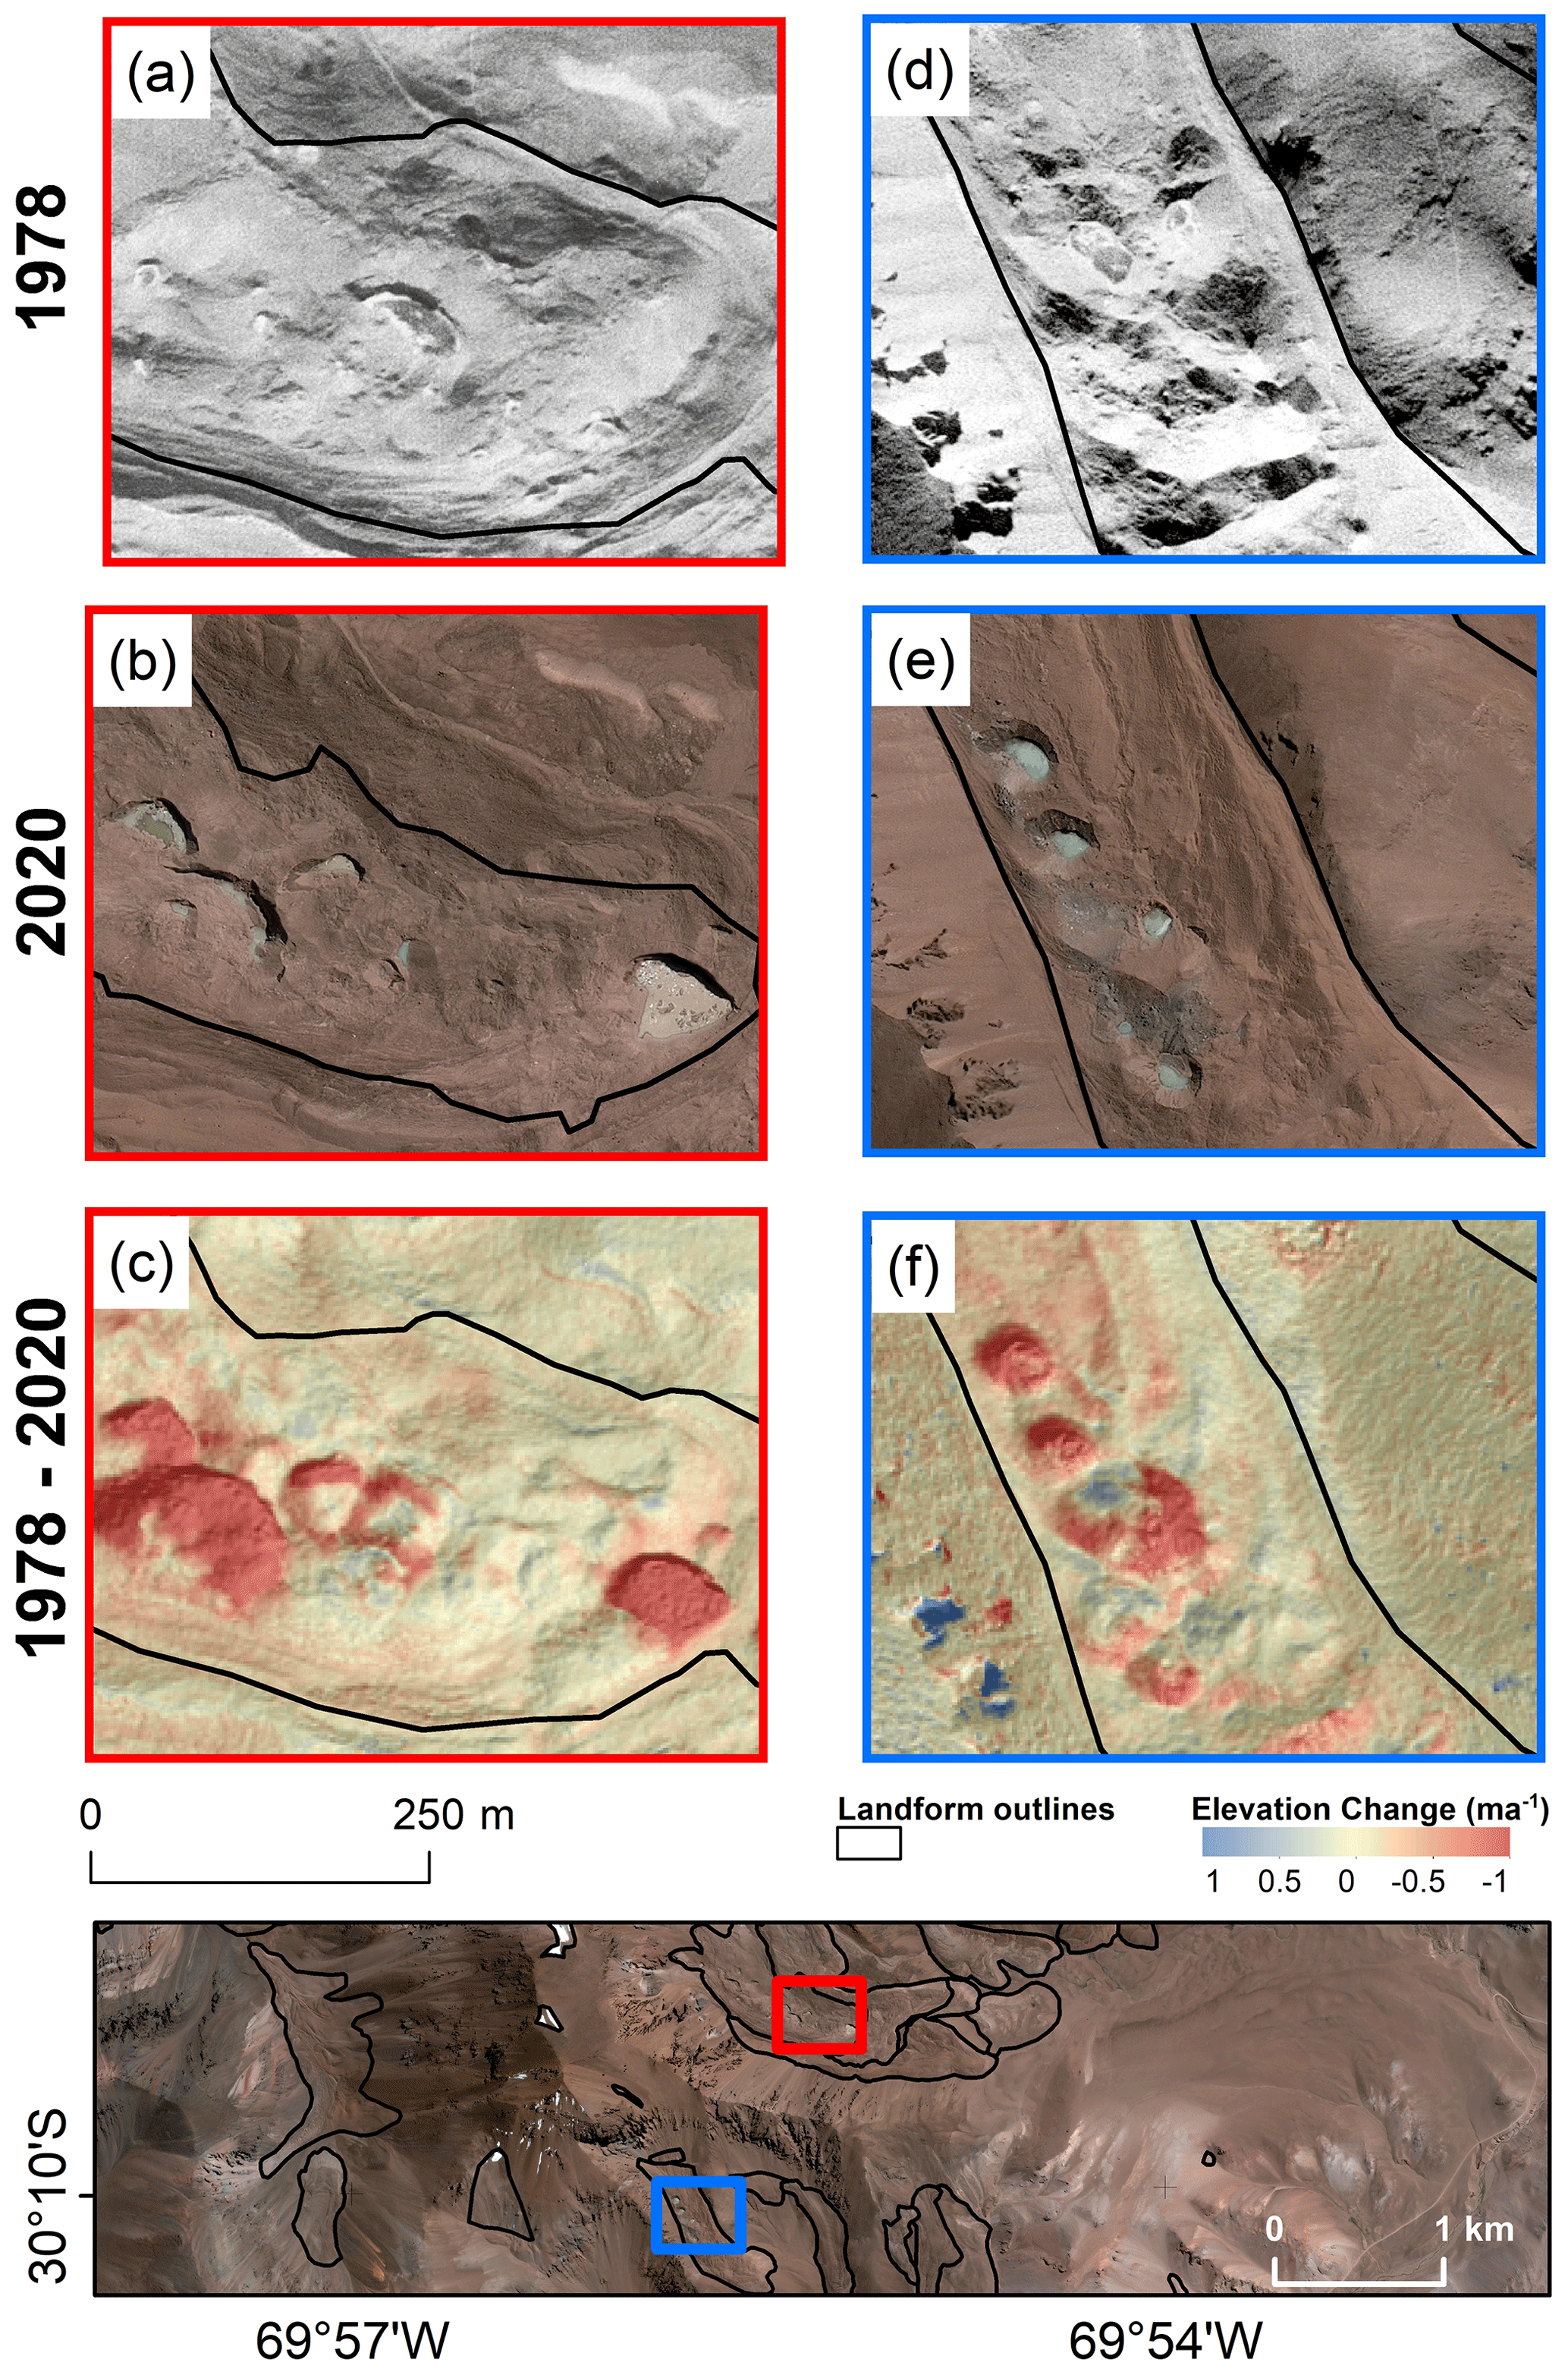
Figure 11Comparison of orthoimagery from 1978 (aerial photography) and 2020 (Pléiades imagery) of the surfaces of the Tapado complex (red frame; a–c) and Las Tetas (blue frame; d–f) as well as changes in the surface elevation between 1978 and 2020. The respective outlines from 1978 and 2020 are shown. © CNES (2018) and Airbus DS (2018), all rights reserved.
6.6 Climatological context
While the increase in air temperature can be understood within global warming trends, the decrease in precipitation, cloudiness, and humidity since the 1980s is likely associated with the southern migration of the South Pacific Subtropical High (Flores-Aqueveque et al., 2020). A link between this migration and negative glacier mass balance due to scarce precipitation in this region was identified by Kinnard et al. (2020). In the case of Tapado Glacier, the warmer and drier conditions have likely favoured melt on the penitentes and debris-covered areas (below 5000 m a.s.l.) and sublimation on the high-elevation, penitente-free areas (above 5000 m a.s.l.) (Ayala et al., 2017; MacDonell et al., 2013). Although some relatively humid periods and years might have produced occasional mass gains, the overall warming and drying trends are consistent with the negative geodetic mass balance obtained in this study. Unfortunately, due to the lack of data it is not possible to analyse the period before 1979 (except for precipitation at La Laguna station that dates back to 1965). Although we evaluated other climate reanalyses for that period (including ERA5 back extension), we discarded them because their associated uncertainty is larger than that from the reanalyses focusing on the period after 1979 (beginning of the satellite era).
Central and northern Chile saw a series of severe droughts between 2010 and 2015 with annual mean reductions in precipitations as much as 45 % (Garreaud et al., 2017). This drought corresponds with the most negative period of glacier mass balance we observed at Tapado Glacier between 2012 and 2015 ( m w.e. a−1). Similar glacier responses to the drought have been reported on other glaciers in central and northern Chile (Farías-Barahona et al., 2019, 2020; Masiokas et al., 2020). This connection suggests that high-altitude, cold glaciers may be more responsive than traditionally assumed (Cuffey and Paterson, 2010).
6.7 Uncertainties
The data used in this study presented challenges and uncertainties. The largest error term in the analysis is the uncertainty regarding radar penetration into the snowpack for the SRTM DEM. The correction we applied – a linearly scaled penetration between 0 and 5 m above the snowline – has been widely used in the Andes (Malz et al., 2018; Braun et al., 2019; Farías-Barahona et al., 2019). Questions remain, however, about the appropriateness of this approach in the semi-arid Andes where snowfall during the winter is less than in other regions. Accumulation measurements in the winters of 2010 and 2013 showed a maximum snow depth of 1.5 and 2.0 m, respectively (Dirección General de Aguas (DGA), El Centro de Estudios Avanzados en Zonas Áridas (CEAZA), 2015; Kinnard et al., 2010), and some studies working in central Chile have assumed no radar penetration at all (Falaschi et al., 2019a; Ruiz et al., 2012). The level of radar penetration across the Andes has not been studied in detail yet and will likely result in over- or underestimations of geodetic mass balances in regions with little precipitation.
The aerial photography from 1956 and 1978 was provided without the accompanying calibration reports, while the 1956 images in particular were scanned poorly. This resulted in considerable noise in the resulting DEMs, which could be reduced enough to quantify glacier changes and was insufficient to detect changes over the surfaces of the rock glaciers.
The lidar survey from 2015 was conducted just after snowfall. As such, the high rates of glacier thinning detected between 2012 and 2015 are probably under-exaggerated, especially at high elevations.
The La Laguna catchment contains a diverse assortment of ice-debris landforms. Tapado Glacier, which had an approximately net-zero geodetic balance between 1956 and 1978 ( m w.e. a−1), has lost mass continuously between 1978 and 2020, likely explained by an increase in air temperature and a decrease in precipitation and humidity since the 1980s. The droughts that occurred within the region between 2010 and 2015 are reflected by a particularly negative geodetic balance between 2012 and 2015 ( m w.e. a−1), while the snow heavy winters of 2017 and 2018 resulted in a less negative mass balance between 2015 and 2020 ( m w.e. a−1) compared to the previous years. The ice losses observed at Tapado Glacier conform with the regional average for the semi-arid Andes between 2000 and 2018 as well as other glaciers in the region that have been studied since the 1950s. Additionally, our study found heterogenous rock glacier behaviours and changes within the La Laguna catchment, with some rock glaciers essentially inactive whilst others are deforming at rates in excess of 4 m a−1. There are also heterogenous patterns of surface elevation change both within between landforms and within individual landforms, which may be indicative of melting of ice lenses and the melting of internal ice. Such analyses provide useful information on which landforms are likely of most hydrological importance and should be studied in detail using geophysical techniques.
The processing was conducted using PCI Geomatica Banff (now known as Catalyst Professional) and ArcGIS Pro v2.9 (https://catalyst.earth/products/catalyst-pro/, Catalyst.Earth, 2021; https://www.esri.com/en-us/arcgis/products/arcgis-pro/overview, Esri Inc., 2021).
Surface elevation change rasters and surface velocity rasters are available from https://doi.org/10.5281/zenodo.6106860 (Robson, 2022). For inquiries about the in situ data, climatic data, or original DEMs, please contact the author.
The supplement related to this article is available online at: https://doi.org/10.5194/tc-16-647-2022-supplement.
BAR and SM derived the study. BAR completed the analysis with assistance from TB and SM. ÁA performed the climatological analysis. All authors contributed to editing the manuscript.
At least one of the (co-)authors is a member of the editorial board of The Cryosphere. The peer-review process was guided by an independent editor, and the authors also have no other competing interests to declare.
Publisher's note: Copernicus Publications remains neutral with regard to jurisdictional claims in published maps and institutional affiliations.
We acknowledge the Water Directorate of Chile (DGA) for facilitating the lidar data from the Tapado area. The DGA is also thanked for the in situ data collected with CEAZA. The authors wish to thank the European Space Agency for the free provision of the SPOT and Pléiades imagery through the restrained dataset project 41743 and NASA for the SRTM elevation model. We also thank many members of the CEAZA glaciology group that have collected the DGNSS datasets. We thank the two anonymous reviewers for constructive feedback.
Benjamin Aubrey Robson was supported by a University of Bergen mobility grant for this work. This work was also supported by ANID and Concurso de Fortalecimiento al Desarrollo Científico de Centros Regionales (grant no. 2020-R20F0008-CEAZA), and Álvaro Ayala was supported by ANID and FONDECYT (grant no. 3190732).
This paper was edited by Kang Yang and reviewed by two anonymous referees.
Anderson, R. S., Anderson, L. S., Armstrong, W. H., Rossi, M. W., and Crump, S. E.: Glaciation of alpine valleys: The glacier – debris-covered glacier – rock glacier continuum, Geomorphology, 311, 127–142, https://doi.org/10.1016/j.geomorph.2018.03.015, 2018.
Ayala, A., Pellicciotti, F., MacDonell, S., McPhee, J., and Burlando, P.: Patterns of glacier ablation across North-Central Chile: Identifying the limits of empirical melt models under sublimation-favorable conditions, Water Resour. Res., 53, 5601–5625, https://doi.org/10.1002/2016WR020126, 2017.
Ayala, Á., Farías-Barahona, D., Huss, M., Pellicciotti, F., McPhee, J., and Farinotti, D.: Glacier runoff variations since 1955 in the Maipo River basin, in the semiarid Andes of central Chile, The Cryosphere, 14, 2005–2027, https://doi.org/10.5194/tc-14-2005-2020, 2020.
Azócar, G. F. and Brenning, A.: Hydrological and geomorphological significance of rock glaciers in the dry Andes, Chile (27∘–33∘ S), Permafr. Periglac. Process., 21, 42–53, https://doi.org/10.1002/ppp.669, 2010.
Azócar, G. F., Brenning, A., and Bodin, X.: Permafrost distribution modelling in the semi-arid Chilean Andes, The Cryosphere, 11, 877–890, https://doi.org/10.5194/tc-11-877-2017, 2017.
Barcaza, G., Nussbaumer, S. U., Tapia, G., Valdés, J., García, J. L., Videla, Y., Albornoz, A., and Arias, V.: Glacier inventory and recent glacier variations in the Andes of Chile, South America, Ann. Glaciol., 58, 166–180, https://doi.org/10.1017/aog.2017.28, 2017.
Barsch, D.: Rockglaciers: indicators for the present and former geoecology in high mountain environments, Springer Science & Business Media, https://doi.org/10.1007/978-3-642-80093-1, 1996.
Berthling, I.: Beyond confusion: Rock glaciers as cryo-conditioned landforms, Geomorphology, 131, 98–106, https://doi.org/10.1016/j.geomorph.2011.05.002, 2011.
Blöthe, J. H., Halla, C., Schwalbe, E., Trombotto, D., and Schrott, L.: Assessing rock glacier horizontal movement in the Cordón del Plata range, Central Andes of Argentina, EUCOP5, June 2015, 11–13 https://www.researchgate.net/publication/327154982 (last access: 15 October 2020), 2018.
Blöthe, J. H., Halla, C., Schwalbe, E., Bottegal, E., Trombotto Liaudat, D., and Schrott, L.: Surface velocity fields of active rock glaciers and ice-debris complexes in the Central Andes of Argentina, Earth Surf. Process. Landf., 46, 504–522, https://doi.org/10.1002/esp.5042, 2020.
Bolch, T., Menounos, B., and Wheate, R.: Landsat-based inventory of glaciers in western Canada, 1985-2005, Remote Sens. Environ., 114, 127–137, https://doi.org/10.1016/j.rse.2009.08.015, 2010.
Bolch, T., Pieczonka, T., and Benn, D. I.: Multi-decadal mass loss of glaciers in the Everest area (Nepal Himalaya) derived from stereo imagery, The Cryosphere, 5, 349–358, https://doi.org/10.5194/tc-5-349-2011, 2011.
Bolch, T., Rohrbach, N., Kutuzov, S., Robson, B. A., and Osmonov, A.: Occurrence, evolution and ice content of ice-debris complexes in the Ak-Shiirak, Central Tien Shan revealed by geophysical and remotely-sensed investigations, Earth Surf. Process. Landf., 44, 129–143, https://doi.org/10.1002/esp.4487, 2019.
Braun, M. H., Malz, P., Sommer, C., Farías-Barahona, D., Sauter, T., Casassa, G., Soruco, A., Skvarca, P.m and Seehaus, T. C.: Constraining glacier elevation and mass changes in South America, Nat. Clim. Chang., 9, 130–136, https://doi.org/10.1038/s41558-018-0375-7, 2019.
Brenning, A., Peña, M. A., Long, S., and Soliman, A.: Thermal remote sensing of ice-debris landforms using ASTER: an example from the Chilean Andes, The Cryosphere, 6, 367–382, https://doi.org/10.5194/tc-6-367-2012, 2012.
Buytaert, W., Moulds, S., Acosta, L., De Bièvre, B., Olmos, C., Villacis, M., Tovar, C., and Verbist, K. M. J.: Glacial melt content of water use in the tropical Andes, Environ. Res. Lett., 12, 114014, https://doi.org/10.1088/1748-9326/aa926c, 2017.
Catalyst.Earth: Catalyst Professional, Catalyst.Earth [code], https://catalyst.earth/products/catalyst-pro/ (last access: 12 November 2020), 2021.
Cicoira, A., Beutel, J., Faillettaz, J., and Vieli, A.: Water controls the seasonal rhythm of rock glacier flow, Earth Planet. Sci. Lett., 528, 115844, https://doi.org/10.1016/j.epsl.2019.115844, 2019.
Cortés, A. E., Oyarzún, R., Kretschmer, N., Chaves, H., Soto, G., Soto, M., Amézaga, J., Oyarzún, J., Rötting, T., Señoret, M., and Maturana, H.: Application of the Watershed Sustainability Index to the Elqui river basin, North-Central Chile, Obras y Proy., 12, 57–69, https://doi.org/10.4067/s0718-28132012000200005, 2012.
Cuffey, K. M. and Paterson, W. S. B.: Physics of Glaciers, 4th edn., BH, ISBN-13 978-0123694614, ISBN-10, 0123694612, 2010.
Dirección General de Aguas (DGA), El Centro de Estudios Avanzados en Zonas Áridas (CEAZA): Modelación del balance de masa y descarga de agua en glaciares del Norte Chico y Chile Central, DGA, Unidad de Glaciología y Nieves, Santiago, Chile, 2015.
Dirección General de Aguas (DGA): Modelo Digital de Elevación de Centro Montañosos y Glaciares de las zonas Glaciológicas Norte y Centro, Mediante Lidar Aerotransportado, https://snia.mop.gob.cl/sad/GLA5577_informe_final.pdf (last access: 10 November 2020), 2015.
Dussaillant, I., Berthier, E., and Brun, F.: Geodetic Mass Balance of the Northern Patagonian Icefield from 2000 to 2012 Using Two Independent Methods, Front. Earth Sci., 6, 8, https://doi.org/10.3389/feart.2018.00008, 2018.
Dussaillant, I., Berthier, E., Brun, F., Masiokas, M., Hugonnet, R., Favier, V., Rabatel, A., Pitte, P., and Ruiz, L.: Two decades of glacier mass loss along the Andes, Nat. Geosci., 12, 802–808, https://doi.org/10.1038/s41561-019-0432-5, 2019.
Eriksen, H. Ø., Rouyet, L., Lauknes, T. R., Berthling, I., Isaksen, K., Hindberg, H., Larsen, Y., and Corner, G. D.: Recent Acceleration of a Rock Glacier Complex, Ádjet, Norway, Documented by 62 Years of Remote Sensing Observations, Geophys. Res. Lett., 45, 8314–8323, https://doi.org/10.1029/2018GL077605, 2018.
Esri Inc.: ArcGIS Pro (Version 2.9), Esri Inc. [code], https://www.esri.com/en-us/arcgis/products/arcgis-pro/overview (last access: 23 November 2021), 2021.
Falaschi, D., Kääb, A., Paul, F., Tadono, T., Rivera, J. A., and Lenzano, L. E.: Brief communication: Collapse of 4 Mm3 of ice from a cirque glacier in the Central Andes of Argentina, The Cryosphere, 13, 997–1004, https://doi.org/10.5194/tc-13-997-2019, 2019a.
Falaschi, D., Lenzano, M. G., Villalba, R., Bolch, T., Rivera, A., and Lo Vecchio, A.: Six Decades (1958–2018) of Geodetic Glacier Mass Balance in Monte San Lorenzo, Patagonian Andes, Front. Earth Sci., 7, 326, https://doi.org/10.3389/feart.2019.00326, 2019b.
Farías-Barahona, D., Vivero, S., Casassa, G., Schaefer, M., Burger, F., Seehaus, T., Iribarren-Anacona, P., Escobar, F., and Braun, M. H.: Geodetic mass balances and area changes of Echaurren Norte Glacier (Central Andes, Chile) between 1955 and 2015, Remote Sens., 11, 260, https://doi.org/10.3390/rs11030260, 2019.
Farías-Barahona, D., Ayala, Á., Bravo, C., Vivero, S., Seehaus, T., Vijay, S., Schaefer, M., Buglio, F., Casassa, G., and Braun, M. H.: 60 Years of Glacier Elevation and Mass Changes in the Maipo River Basin, Central Andes of Chile, Remote Sens., 12, 1658, https://doi.org/10.3390/rs12101658, 2020a.
Fariás-Barahona, D., Wilson, R., Bravo, C., Vivero, S., Caro, A., Shaw, T. E., Casassa, G., Ayala, Á., Mejiás, A., Harrison, S., Glasser, N. F., McPhee, J., Wündrich, O., and Braun, M. H.: A near 90-year record of the evolution of El Morado Glacier and its proglacial lake, Central Chilean Andes, J. Glaciol., 66, 846–860, https://doi.org/10.1017/jog.2020.52, 2020b.
Favier, V., Falvey, M., Rabatel, A., Praderio, E., and López, D.: Interpreting discrepancies between discharge and precipitation in high-altitude area of chile's norte chico region (26–32∘ S), Water Resour. Res., 45, https://doi.org/10.1029/2008WR006802, 2009.
Ferri, L., Dussaillant, I., Zalazar, L., Masiokas, M. H., Ruiz, L., Pitte, P., Gargantini, H., Castro, M., Berthier, E., and Villalba, R.: Ice Mass Loss in the Central Andes of Argentina Between 2000 and 2018 Derived From a New Glacier Inventory and Satellite Stereo-Imagery, Front. Earth Sci., 8, 596, https://doi.org/10.3389/feart.2020.530997, 2020.
Flores-Aqueveque, V., Rojas, M., Aguirre, C., Arias, P. A., and González, C.: South Pacific Subtropical High from the late Holocene to the end of the 21st century: insights from climate proxies and general circulation models, Clim. Past, 16, 79–99, https://doi.org/10.5194/cp-16-79-2020, 2020.
Gardelle, J., Berthier, E., and Arnaud, Y.: Impact of resolution and radar penetration on glacier elevation changes computed from DEM differencing, J. Glaciol., 58, 419–422, https://doi.org/10.3189/2012JoG11J175, 2012.
Gardelle, J., Berthier, E., Arnaud, Y., and Kääb, A.: Region-wide glacier mass balances over the Pamir-Karakoram-Himalaya during 1999–2011, The Cryosphere, 7, 1263–1286, https://doi.org/10.5194/tc-7-1263-2013, 2013.
Garreaud, R. D., Alvarez-Garreton, C., Barichivich, J., Boisier, J. P., Christie, D., Galleguillos, M., LeQuesne, C., McPhee, J., and Zambrano-Bigiarini, M.: The 2010–2015 megadrought in central Chile: impacts on regional hydroclimate and vegetation, Hydrol. Earth Syst. Sci., 21, 6307–6327, https://doi.org/10.5194/hess-21-6307-2017, 2017.
Ginot, P., Kull, C., Schotterer, U., Schwikowski, M., and Gäggeler, H. W.: Glacier mass balance reconstruction by sublimation induced enrichment of chemical species on Cerro Tapado (Chilean Andes), Clim. Past, 2, 21–30, https://doi.org/10.5194/cp-2-21-2006, 2006.
Haeberli, W., Hallet, B., Arenson, L., Elconin, R., Humlum, O., Kääb, A., Kaufmann, V., Ladanyi, B., Matsuoka, N., Springman, S. and Mühll, D. V.: Permafrost creep and rock glacier dynamics, Permafr. Periglac. Process., 17, 189–214, https://doi.org/10.1002/ppp.561, 2006.
Halla, C., Blöthe, J. H., Tapia Baldis, C., Trombotto Liaudat, D., Hilbich, C., Hauck, C., and Schrott, L.: Ice content and interannual water storage changes of an active rock glacier in the dry Andes of Argentina, The Cryosphere, 15, 1187–1213, https://doi.org/10.5194/tc-15-1187-2021, 2021.
Hanshaw, M. N. and Bookhagen, B.: Glacial areas, lake areas, and snow lines from 1975 to 2012: status of the Cordillera Vilcanota, including the Quelccaya Ice Cap, northern central Andes, Peru, The Cryosphere, 8, 359–376, https://doi.org/10.5194/tc-8-359-2014, 2014.
Hess, K., Schmidt, S., Nüsser, M., Zang, C., and Dame, J.: Glacier Changes in the Semi-Arid Huasco Valley, Chile, between 1986 and 2016, Geosciences, 10, 429, https://doi.org/10.3390/geosciences10110429, 2020.
Hirschmüller, H.: Stereo processing by semiglobal matching and mutual information, IEEE Trans. Pattern Anal. Mach. Intell., 30, 328–341, https://doi.org/10.1109/TPAMI.2007.1166, 2008.
Hugonnet, R., McNabb, R., Berthier, E., Menounos, B., Nuth, C., Girod, L., Farinotti, D., Huss, M., Dussaillant, I., Brun, F., and Kääb, A.: Accelerated global glacier mass loss in the early twenty-first century, Nature, 592, 726–731, https://doi.org/10.1038/s41586-021-03436-z, 2021.
Huss, M.: Density assumptions for converting geodetic glacier volume change to mass change, The Cryosphere, 7, 877–887, https://doi.org/10.5194/tc-7-877-2013, 2013.
Jones, D. B., Harrison, S., and Anderson, K.: Mountain glacier-to-rock glacier transition, Glob. Planet. Change, 181, 102999, https://doi.org/10.1016/j.gloplacha.2019.102999, 2019a.
Jones, D. B., Harrison, S., Anderson, K., and Whalley, W. B.: Rock glaciers and mountain hydrology: A review, Earth-Sci. Rev., 193, 66–90, https://doi.org/10.1016/j.earscirev.2019.04.001, 2019b.
Kääb, A., Berthier, E., Nuth, C., Gardelle, J., and Arnaud, Y.: Contrasting patterns of early twenty-first-century glacier mass change in the Himalayas, Nature, 488, 495–498, https://doi.org/10.1038/nature11324, 2012.
Kääb, A., Bolch, T., Casey, K., Heid, T., Kargel, J. S., Leonard, G. J., Paul, F., and Raup, B. H. (Eds.): Global Land Ice Measurements from Space, Springer Praxis Books, Springer, Berlin, Heidelberg, 75–112, https://doi.org/10.1007/978-3-540-79818-7_4, 2014.
Kinnard, C., Gascoin, S., and MacDonell, S.: Balance de masa glaciológico y condiciones regionales de nieve en el norte chico: interacción con el clima y su influencia en el deshielo, DGA Report, Informe No. CEAZA.CZL.2010.02., 2010.
Kinnard, C., Ginot, P., Surazakov, A., MacDonell, S., Nicholson, L., Patris, N., Rabatel, A., Rivera, A., and Squeo, F. A.: Mass Balance and Climate History of a High-Altitude Glacier, Desert Andes of Chile, Front. Earth Sci., 8, 40, https://doi.org/10.3389/feart.2020.00040, 2020.
Knight, J., Harrison, S., and Jones, D. B.: Rock glaciers and the geomorphological evolution of deglacierizing mountains, Geomorphology, 324, 14–24, https://doi.org/10.1016/j.geomorph.2018.09.020, 2019.
Kull, C., Grosjean, M., and Veit, H.: Modeling modern and Late Pleistocene Glacio-Climatological conditions in the North Chilean Andes (29–30∘ S), Clim. Change, 52, 359–381, https://doi.org/10.1023/A:1013746917257, 2002.
MacDonell, S., Kinnard, C., Mölg, T., Nicholson, L., and Abermann, J.: Meteorological drivers of ablation processes on a cold glacier in the semi-arid Andes of Chile, The Cryosphere, 7, 1513–1526, https://doi.org/10.5194/tc-7-1513-2013, 2013.
Magnússon, E., Muñoz-Cobo Belart, J., Pálsson, F., Ágústsson, H., and Crochet, P.: Geodetic mass balance record with rigorous uncertainty estimates deduced from aerial photographs and lidar data – Case study from Drangajökull ice cap, NW Iceland, The Cryosphere, 10, 159–177, https://doi.org/10.5194/tc-10-159-2016, 2016.
Malz, P., Meier, W., Casassa, G., Jaña, R., Skvarca, P., and Braun, M.: Elevation and Mass Changes of the Southern Patagonia Icefield Derived from TanDEM-X and SRTM Data, Remote Sens., 10, 188, https://doi.org/10.3390/rs10020188, 2018.
Masiokas, M. H., Rabatel, A., Rivera, A., Ruiz, L., Pitte, P., Ceballos, J. L., Barcaza, G., Soruco, A., Bown, F., Berthier, E., Dussaillant, I., and MacDonell, S.: A Review of the Current State and Recent Changes of the Andean Cryosphere, Front. Earth Sci., 8, 99, https://doi.org/10.3389/feart.2020.00099, 2020.
McNabb, R., Nuth, C., Kääb, A., and Girod, L.: Sensitivity of glacier volume change estimation to DEM void interpolation, The Cryosphere, 13, 895–910, https://doi.org/10.5194/tc-13-895-2019, 2019.
Monnier, S. and Kinnard, C.: Pluri-decadal (1955–2014) evolution of glacier–rock glacier transitional landforms in the central Andes of Chile (30–33∘ S), Earth Surf. Dynam., 5, 493–509, https://doi.org/10.5194/esurf-5-493-2017, 2017.
Monnier, S., Kinnard, C., Surazakov, A., and Bossy, W.: Geomorphology, internal structure, and successive development of a glacier foreland in the semiarid Chilean Andes (Cerro Tapado, upper Elqui Valley, 30∘08′S, 69∘55′ W), Geomorphology, 207, 126–140, https://doi.org/10.1016/j.geomorph.2013.10.031, 2014.
Muñoz-Sabater, J., Lawrence, H., Albergel, C., Rosnay, P., Isaksen, L., Mecklenburg, S., Kerr, Y., and Drusch, M.: Assimilation of SMOS brightness temperatures in the ECMWF Integrated Forecasting System, Q. J. Roy. Meteor. Soc., 145, 2524–2548, https://doi.org/10.1002/qj.3577, 2019.
Nuth, C. and Kääb, A.: Co-registration and bias corrections of satellite elevation data sets for quantifying glacier thickness change, The Cryosphere, 5, 271–290, https://doi.org/10.5194/tc-5-271-2011, 2011.
Nuth, C., Schuler, T. V., Kohler, J., Altena, B., and Hagen, J. O.: Estimating the long-term calving flux of Kronebreen, Svalbard from geodetic elevation changes and mass-balance modelling, J. Glaciol., 58, 119–133, https://doi.org/10.3189/2012JoG11J036, 2012.
Paul, F., Bolch, T., Kääb, A., Nagler, T., Nuth, C., Scharrer, K., Shepherd, A., Strozzi, T., Ticconi, F., Bhambri, R., Berthier, E., Bevan, S., Gourmelen, N., Heid, T., Jeong, S., Kunz, M., Lauknes, T. R., Luckman, A., Merryman Boncori, J. P., Moholdt, G., Muir, A., Neelmeijer, J., Rankl, M., VanLooy, J., and Van Niel, T.: The glaciers climate change initiative: Methods for creating glacier area, elevation change and velocity products, Remote Sens. Environ., 162, 408–426, https://doi.org/10.1016/j.rse.2013.07.043, 2015.
Paul, F., Bolch, T., Briggs, K., Kääb, A., McMillan, M., McNabb, R., Nagler, T., Nuth, C., Rastner, P., Strozzi, T., and Wuite, J.: Error sources and guidelines for quality assessment of glacier area, elevation change, and velocity products derived from satellite data in the Glaciers_cci project, Remote Sens. Environ., 203, 256–275, https://doi.org/10.1016/j.rse.2017.08.038, 2017.
Pieczonka, T., Bolch, T., Junfeng, W., and Shiyin, L.: Heterogeneous mass loss of glaciers in the Aksu-Tarim Catchment (Central Tien Shan) revealed by 1976 KH-9 Hexagon and 2009 SPOT-5 stereo imagery, Remote Sens. Environ., 130, 233–244, https://doi.org/10.1016/j.rse.2012.11.020, 2013.
Pourrier, J., Jourde, H., Kinnard, C., Gascoin, S., and Monnier, S.: Glacier meltwater flow paths and storage in a geomorphologically complex glacial foreland: The case of the Tapado glacier, dry Andes of Chile (30∘ S), J. Hydrol., 519, 1068–1083, https://doi.org/10.1016/j.jhydrol.2014.08.023, 2014.
Rangecroft, S., Harrison, S., Anderson, K., Magrath, J., Castel, A. P., and Pacheco, P.: Climate change and water resources in arid mountains: An example from the bolivian andes, Ambio, 42, 852–863, https://doi.org/10.1007/s13280-013-0430-6, 2013.
Rignot, E.: Rock glacier surface motion in Beacon Valley, Antarctica, from synthetic-aperture radar interferometry, Geophys. Res. Lett., 29, 1607, https://doi.org/10.1029/2001GL013494, 2002.
Robson, B. A.: La Laguna Catchment, Chile – Surface Elevation Change and Velocity Rasters, Zenodo [data set], https://doi.org/10.5281/zenodo.6106860, 2022.
Robson, B. A., Nuth, C., Nielsen, P. R., Girod, L., Hendrickx, M., and Dahl, S. O.: Spatial variability in patterns of glacier change across the manaslu range, central himalaya, Front. Earth Sci., 6, 12, https://doi.org/10.3389/feart.2018.00012, 2018.
Rolstad, C., Haug, T., and Denby, B.: Spatially integrated geodetic glacier mass balance and its uncertainty based on geostatistical analysis: Application to the western Svartisen ice cap, Norway, J. Glaciol., 55, 666–680, https://doi.org/10.3189/002214309789470950, 2009.
Ruiz, L., Berthier, E., Viale, M., Pitte, P., and Masiokas, M. H.: Recent geodetic mass balance of Monte Tronador glaciers, northern Patagonian Andes, The Cryosphere, 11, 619–634, https://doi.org/10.5194/tc-11-619-2017, 2017.
Scambos, T. A., Dutkiewicz, M. J., Wilson, J. C., and Bindschadler, R. A.: Application of image cross-correlation to the measurement of glacier velocity using satellite image data, Remote Sens. Environ., 42, 177–186, https://doi.org/10.1016/0034-4257(92)90101-O, 1992.
Schaffer, N. and MacDonell, S.: Rock Glacier Inventory for the La Laguna Catchment (unpublished dataset), CEAZA, La Serena, Chile, 2020.
Schaffer, N., MacDonell, S., Réveillet, M., Yáñez, E., and Valois, R.: Rock glaciers as a water resource in a changing climate in the semiarid Chilean Andes, Reg. Environ. Chang., 19, 1263–1279, https://doi.org/10.1007/s10113-018-01459-3, 2019.
Sinclair, K. E. and MacDonell, S.: Seasonal evolution of penitente glaciochemistry at Tapado Glacier, Northern Chile, Hydrol. Process., 30, 176–186, https://doi.org/10.1002/hyp.10531, 2016.
Strozzi, T., Caduff, R., Jones, N., Barboux, C., Delaloye, R., Bodin, X., Kääb, A., Mätzler, E., and Schrott, L.: Monitoring Rock Glacier Kinematics with Satellite Synthetic Aperture Radar, Remote Sens., 12, 559, https://doi.org/10.3390/rs12030559, 2020.
Tielidze, L. G.: Glacier change over the last century, Caucasus Mountains, Georgia, observed from old topographical maps, Landsat and ASTER satellite imagery, The Cryosphere, 10, 713–725, https://doi.org/10.5194/tc-10-713-2016, 2016.
WGMS: Fluctuations of Glaciers Database. World Glacier Monitoring Service, Zurich, Switzerland, https://doi.org/10.5904/wgms-fog-2021-05, 2020.
Zalazar, L., Ferri, L., Castro, M., Gargantini, H., Gimenez, M., Pitte, P., Ruiz, L., Masiokas, M., Costa, G., and Villalba, R.: Spatial distribution and characteristics of Andean ice masses in Argentina: Results from the first National Glacier Inventory, J. Glaciol., 66, 938–949, https://doi.org/10.1017/jog.2020.55, 2020.
Zemp, M., Huss, M., Thibert, E., Eckert, N., McNabb, R., Huber, J., Barandun, M., Machguth, H., Nussbaumer, S. U., Gärtner-Roer, I., Thomson, L., Paul, F., Maussion, F., Kutuzov, S., and Cogley, J. G.: Global glacier mass changes and their contributions to sea-level rise from 1961 to 2016, Nature, 568, 382–386, https://doi.org/10.1038/s41586-019-1071-0, 2019.