the Creative Commons Attribution 4.0 License.
the Creative Commons Attribution 4.0 License.
 | 20 Dec 2022
The surface energy balance during foehn events at Joyce Glacier, McMurdo Dry Valleys, Antarctica
Marte G. Hofsteenge
Nicolas J. Cullen
Carleen H. Reijmer
Michiel van den Broeke
Marwan Katurji
John F. Orwin
The McMurdo Dry Valleys (MDV) are a polar desert, where glacial melt is the main source of water to streams and the ecosystem. Summer air temperatures are typically close to zero, and therefore foehn events can have a large impact on the meltwater production. A 14-month record of automatic weather station (AWS) data on Joyce Glacier is used to force a 1D surface energy balance model to study the impact of foehn events on the energy balance. AWS data and output of the Antarctic Mesoscale Prediction System (AMPS) on a 1.7 km grid are used to detect foehn events at the AWS site. Foehn events at Joyce Glacier occur under the presence of cyclones over the Ross Sea. The location of Joyce Glacier on the leeward side of the Royal Society Range during these synoptic events causes foehn warming through isentropic drawdown. This mechanism differs from the foehn warming through gap flow that was earlier found for other regions in the MDV and highlights the complex interaction of synoptic flow with local topography of the MDV. Shortwave radiation is the primary control on melt at Joyce Glacier, and melt often occurs with subzero air temperatures. During foehn events, melt rates are enhanced, contributing to 23 % of the total annual melt. Foehn winds cause a switch from a diurnal stability regime in the atmospheric surface layer to a continuous energy input from sensible heat flux throughout the day. The sensible heating during foehn, through an increase in turbulent mixing resulting from gustier and warmer wind conditions, is largely compensated for by extra heat losses through sublimation. Melt rates are enhanced through an additional energy surplus from a reduced albedo during foehn.
- Article
(5042 KB) - Full-text XML
- BibTeX
- EndNote


Changes in glacier volume of large polar ice caps impact the global surface energy balance (SEB) and contribute to global sea level rise. On the regional and local scale, changes in glaciers can have a large impact on ecosystems. A clear example of a region where glacial meltwater is vital for the ecosystem is the McMurdo Dry Valleys (MDV), Antarctica. The MDV are a polar desert, where the annual precipitation is less than 50 mm yr−1 (Fountain et al., 2010). The microbial ecosystem that is hosted in this extreme climate is one of earth's rarest ecosystems. In the dry and windy climate, most of the snowfall does not accumulate in the valleys but sublimates, and glacial meltwater is therefore the main source of water to streams and the ecosystem (Fountain et al., 2010; Eveland et al., 2012). Glacial runoff also plays an important role in nutrient delivery (Dubnick et al., 2017) and biogeochemistry of the MDV lakes (Foreman et al., 2004). Extreme melt events can severely alter the light and nutrient availability in the lakes (Fountain et al., 2016). Episodic warming events are therefore expected to have long-term effects on the valley and lake ecosystems (Foreman et al., 2004; Fountain et al., 2016). Improving our understanding of the glacial response to warming events is therefore essential in order to understand how glacier and ecosystem response might change in a warming world.
The strongest episodic warming events in the MDV are observed in the winter months, which are characterized by long periods of stable stratification where cold-air pools form at the surface. The pools in the Wright Valley can last up to 2 weeks, until they are eroded by strong wind intrusions into the valleys, resulting in a rise in near-surface temperatures by up to 25–50 ∘C (Speirs et al., 2010; Zawar-Reza et al., 2013). The strong down-valley winds in the MDV have previously been explained as strong adiabatically warmed katabatic winds (Bull, 1966; Doran et al., 2002; Nylen et al., 2004). However, more recent research shows that these winds have a foehn warming signature (Speirs et al., 2010, 2013; Steinhoff et al., 2013, 2014). Foehn winds typically occur through topographic modification of flow in the lee of mountain barriers, resulting in strong and warm winds. Speirs et al. (2010) relate the valley wind events to synoptic cyclones over the Ross Sea. Steinhoff et al. (2014) used the polar version of the Weather Research and Forecasting (WRF) model on a 0.5 km nested domain to study physical processes responsible for foehn events in the Taylor, Wright and Victoria valleys. The southerly flow branch from the Ross Sea cyclones is initially channelled along the Trans-Antarctic Mountains and then forced through high-elevation mountain gaps towards the MDV, accelerated by mountain wave activity and brought into the MDV through pressure-driven topographic channelling (Steinhoff et al., 2013, 2014).
While foehn events occur more frequently in winter, they can have a larger impact on glacial melt and streamflow in summer when air temperatures are typically close to 0 ∘C (Steinhoff et al., 2013). Doran et al. (2008) compared a normal streamflow intensity season with the 2001/02 flood year and linked the increased glacier mass loss and streamflow to an enhanced frequency of down-valley winds. This relation between the frequency of down-valley wind events and streamflow also possibly explains the seemingly contradictory presence of large glacial lakes in the MDV during the colder climate of the Last Glacial Maximum (Doran et al., 2008; Obryk et al., 2017).
Foehn events in the MDV have been associated with enhanced meltwater generation, but no studies have shown how the energy balance components of MDV glaciers are altered during foehn events and what their role is in melt generation. Other Antarctic regions, like the Antarctic Peninsula region, that experience more melt compared to the MDV have received more attention on the link between foehn and surface melt. Here, foehn events cause the highest melt rates, and the increased melt associated with foehn plays a preconditioning role in ice shelf melt and instability (Kuipers Munneke et al., 2014). The westerly airflow that causes foehn winds crossing the Antarctic Peninsula mountain range reduces cloud cover and increases incoming solar radiation and sensible heating over the Larsen B and Larsen C ice shelves (Kuipers Munneke et al., 2018; Elvidge et al., 2020; Turton et al., 2018, 2020; Laffin et al., 2021). This increase in energy at the surface is largely compensated for by a corresponding decrease in incoming longwave radiation and increased latent heat losses (King et al., 2017; Turton et al., 2020). While these studies have demonstrated that shortwave radiation through cloud clearance has the largest impact on foehn-induced melt, Elvidge et al. (2020) found that most foehn-driven melt occurs under conditions where sensible heating dominates the SEB. Closer to the MDV, 40 % of melt of the Ross Ice Shelf occurs during foehn events (Zou et al., 2021b). The foehn effect increases sensible heating, and its associated mesoscale dynamics reduces cloud cover, resulting in extensive downwelling solar radiation over the Ross Ice Shelf, where net solar radiation is the leading component in the SEB during melt (Zou et al., 2021a, b).
The role of foehn winds in melt generation is expected to be different in the colder and drier environment of the MDV compared to the Antarctic Peninsula and Ross Ice Shelf, where melt is more common and abundant. In the MDV, the summertime near-surface air temperatures usually hover around 0 ∘C (Katurji et al., 2013) and foehn winds can significantly increase air temperatures, bringing the glacier surface temperatures more often to the melting point through sensible heating. At the same time, the dry and windy foehn conditions are expected to also increase turbulent latent heat losses, cooling the surface and therefore prohibiting melt during these events but enhancing sublimation.
The research aim of this paper is to describe the dominant energy fluxes during foehn and non-foehn conditions in order to resolve the role of foehn occurrence in meltwater generation for a MDV glacier. We use a 14-month record of automatic weather station (AWS) observations on Joyce Glacier to drive a 1D SEB model. This is the first SEB study in the MDV to use a glacier-based four-component radiometer, which allowed for calibration of the simulated surface temperatures and increases accuracy of the simulated energy fluxes. Joyce Glacier is located south-east of other MDV glaciers separated by the Royal Society Range and has not been previously studied in foehn and energy balance studies. The AWS observations in combination with high-resolution atmospheric model output of the Antarctic Mesoscale Prediction System (AMPS) are used to detect foehn events at Joyce Glacier.
In this study, we use a 14-month record of observations from an automatic weather station (AWS) located at Joyce Glacier to force a SEB model (Fig. 1). This continuous data set covers two melt seasons and one winter season, from November 2008 to January 2010. Foehn events are detected from local AWS observations and upper-air AMPS forecast. The AMPS forecast is also used to describe the spatial signature of foehn events at Joyce Glacier.
2.1 AWS data
The AWS was installed on Joyce Glacier at 78∘01.245′ S, 163∘47.608′ E, roughly 400 m above sea level on 26 November 2008 and removed on 31 January 2010. The glacier tongue is located at the western end of the Garwood Valley, a coastal valley east of the Royal Society Range (about 25 km from McMurdo Sound). The station was set up in the ablation zone of Joyce Glacier, about 150 m from the north-east cliff. The glacier tongue is approximately 2 km wide, and the equilibrium line is roughly 3.5 km up from the glacier terminus at an elevation of 600 m.

Figure 1(a) Map of the McMurdo Dry Valleys where the black box shows the region with the Garwood Valley and Joyce Glacier shown in (c). (b) AWS set-up on Joyce Glacier. Map was made using the Quantarctica QGIS package collated by the Norwegian Polar Institute (https://www.npolar.no/quantarctica/, last access: 12 December 2022).
Continuous measurements of air temperature, relative humidity, incoming and outgoing longwave and shortwave radiation, wind speed and direction, and air pressure were obtained. Surface temperature is calculated from observed outgoing longwave radiation using the Stefan–Boltzmann law and an emissivity of 1. Additionally, the distance to the ice surface was measured using a sonic ranger on the mast for instrument height, ablation and snowfall estimation. The instruments that were used are listed in Appendix A, Table A1, and were the same as those described in Gillett and Cullen (2011). The measurements were taken every 300 s and stored as 15 min averages on a data logger.
Data processing was similar to that described in Gillett and Cullen (2011) and includes recalculation of relative humidity measurements to correct for saturation with respect to ice instead of liquid water (Steffen and Box, 2001). Accumulated albedo was calculated from accumulated incoming and outgoing shortwave radiation over 24 h as in van den Broeke et al. (2004) and filtered for outliers by removing data outside the 2nd and 98th percentiles. The surface height change record was cleaned by manually removing spikes from the data and applying a 2 h running mean through the data. A snow accumulation record was calculated from daily differences in surface height, using a lower threshold of 1 cm for precipitation to occur.
2.2 Energy and mass balance model
We used the energy balance model presented by Reijmer and Oerlemans (2002) and further developed as described in Jakobs et al. (2019), which assumes the energy balance for a surface skin layer by solving the following equation for skin temperature:
where QM is the energy used for melt, which is 0 when the surface temperature Ts<273.15 K; Sin the incoming shortwave radiation; α the surface albedo; QP the amount of penetrated shortwave radiation; Lin and Lout the incoming and outgoing longwave radiation; SH the turbulent sensible heat flux; LH the turbulent latent heat flux; and QG the subsurface conductive energy flux. All fluxes directed towards the surface are defined as positive, and the fluxes are given in W m−2. Energy supplied by rainfall is not relevant for the MDV glaciers and therefore is neglected.
Snet (Sin(1−α)) is calculated from observed Sout and accumulated albedo as suggested by van den Broeke et al. (2004). Lin is based on AWS observations, and Lout is calculated using the Stefan–Boltzmann law from the model-calculated skin layer temperature. The turbulent heat fluxes SH and LH are calculated with the bulk aerodynamic method, considering atmospheric stability based on the Monin–Obukhov similarity theory. Measurements of temperature, wind speed and humidity at the AWS measuring level are used together with the calculated skin surface temperature, zero wind speed and saturated humidity at the surface to calculate the mean gradients that are related to the turbulent heat fluxes.
Solar radiation is able to penetrate the snowpack, and attenuation of the shortwave radiation is calculated separately for 118 different wavelength bands using the model of Brandt and Warren (1993), also used by van den Broeke et al. (2008) and Kuipers Munneke et al. (2009). The solar radiation that is able to penetrate the snowpack QP is removed from the surface layer energy balance and added to the appropriate subsurface model layers. The parameter dzrad, the surface layer thickness used in solar radiation penetration calculation, determines the partitioning of the penetrated radiation between the surface layer and subsurface energy budgets. Solar radiation can penetrate to considerable depths when the surface is ice and is reduced when it is snow-covered. A snow grain radius of 0.2 mm and an ice grain radius of 2.8 mm as measured by Hoffman et al. (2008) at Taylor Glacier are used for the solar radiation penetration routine.
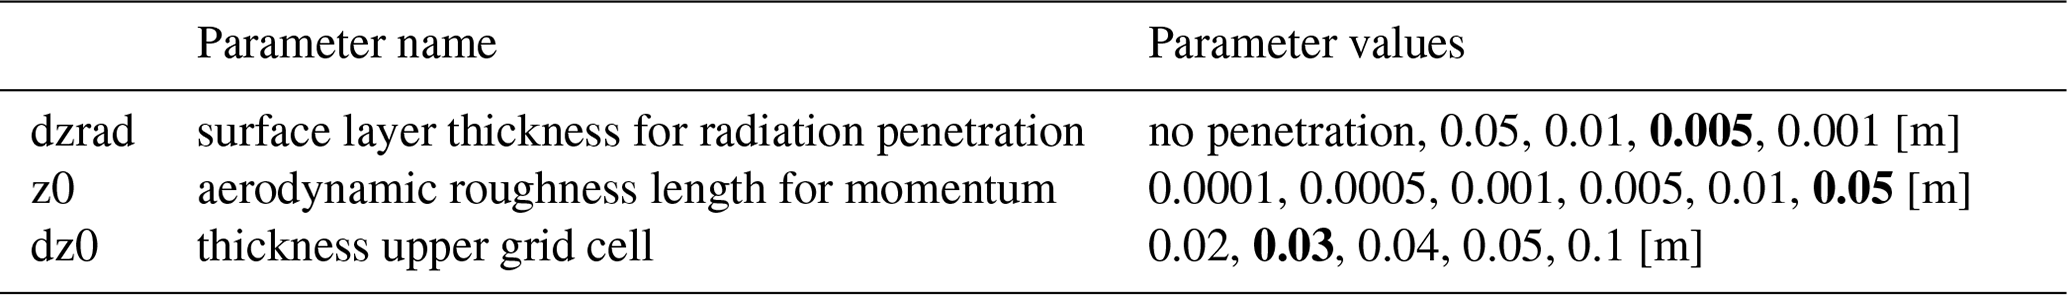
The subsurface model is based on the SOMARS snow model (Reijmer and Hock, 2008). The vertical subsurface grid is composed of layers with increasing layer thickness with depth. The parameter dz0 sets the thickness of the upper grid cell. Subsurface melt in the snow or ice pack (hereafter called internal melt) occurs when the subsurface temperatures of a layer reach 0 ∘C and the excess energy is used for melt. Internal meltwater is added to the water content of that layer and can drain to deeper layers and refreezes if temperatures are below 0 ∘C. Refreezing in turn increases the subsurface temperature and density. Subsurface meltwater that percolates down to the firn–ice interface or subsurface melt that occurs in the ice runs off. To give an estimation of the uncertainty involved in parameter choices, we ran the model as an ensemble using different parameter combinations. Table 1 shows the three parameters that are considered and the set of values that is used in the ensemble.
Table 1Overview of parameter settings used in ensemble simulations with the surface energy and mass balance model. Parameter settings of the reference run are indicated in bold.
2.3 Antarctic Mesoscale Prediction System
The numerical weather prediction system AMPS is used as a real-time operational forecasting tool for Antarctica by the National Center for Atmospheric Research (NCAR), USA. AMPS is based on the polar version of the Weather Research and Forecasting (WRF) model. The boundary and initial conditions of the AMPS forecasts are taken from output of the Global Forecast System (GFS), and AMPS is initialized twice daily. The 12–24 forecast hours is used for analysis as in Seefeldt and Cassano (2012) to discard the spin-up period in which the model is adjusting to higher-resolution topography while also avoiding model drift at later forecast hours.
AMPS is run on five or six domains over Antarctica and its subregions and archived for different domains and resolutions. In this study we use output of AMPS WRF 45 version for the year 2009 for the d05 domain. This domain is centred over Ross Island and covers the McMurdo Dry Valleys with a horizontal grid spacing of 1.67 km. AMPS is run on 44 model levels, and this study uses AMPS products that were reduced to the first 15 model levels (covering approximately the first 1.5 km above the surface) and 6 fixed pressure levels. In addition, the d02 domain is used for synoptic-scale analysis, covering the Antarctic continent with a 15 km horizontal resolution.
The AMPS forecast has been used previously in Antarctic foehn and other Antarctic meteorological studies (Speirs et al., 2010, 2013; King et al., 2017; Katurji et al., 2019; Turton et al., 2018, 2020). Speirs et al. (2010) evaluated high-resolution AMPS forecasts with AWS observations in the MDV and concluded that the model output is suitable to study regional airflow and synoptic conditions during foehn in the MDVs. While AMPS can have difficulties representing the near-surface conditions on the valley floors, it performed well in simulating the foehn onset and cessation (Speirs et al., 2010).
2.4 Foehn detection
In this study, we use three different classification criteria to detect foehn events based on AWS observations of atmospheric near-surface conditions and AMPS upper-air forecasts. The three methods are combined for a final foehn detection algorithm used in this study. To test the suitability of the AMPS-forecasted near-surface conditions for these classification schemes, we evaluate the methods as well using the AMPS forecast of near-surface conditions in Sect. 3.1. For consistency all methods are tested using hourly averaged AWS observations and hourly AMPS forecast data. In the remainder of the analysis presented in this study, only the combination of classification schemes based on AWS-observed near-surface conditions is used.
2.4.1 Speirs
The first detection method was designed for foehn events in the MDV by Speirs et al. (2010) and adapted by Steinhoff et al. (2014). It is based on thresholds in relative humidity, temperature, and wind speed and direction. The wind direction thresholds are adapted for Joyce Glacier based on the expected southerly foehn wind direction originating from the Royal Society Range. A different wind direction criterion is used on AWS data compared to AMPS forecast, since the weather station was located close to the valley side and AMPS does not capture the topographic modification of the winds very well (Sect. 3.1). The range in wind direction is chosen so that it excludes wind directions that are expected during sea breezes and down-glacial winds.
Using the definition of Steinhoff et al. (2014), all the following conditions must be met over any 6-hourly period to be classified as a foehn event:
-
Temperature. There is an increase of 1 ∘C over a 1 h period or any measurement above 0 ∘C.
-
Relative humidity. There is a decrease of 5 % over a 1 h period or any measurement below 30 %,
-
Wind speed. Wind speed is higher than 3.5 m s−1 for at least 80 % of the observations (in this study 5 out of 6 h). A threshold of 3.5 m s−1 instead of 5 m s−1 was used to account for detection on average wind speed instead of maximum wind speed as suggested by Steinhoff et al. (2013).
-
Wind direction. The wind direction is between 67.5 and 180∘ for at least 80 % of the time when using AWS data and between 112.5 and 225∘ when using near-surface data from AMPS.
2.4.2 Wiesenekker
Wiesenekker et al. (2018) proposed a method for foehn detection at Larsen C ice shelf in the Antarctic Peninsula based on the fact that foehn comprises strong wind events from a known wind direction. The following conditions must be met over a 6 h period to be classified as foehn:
-
Wind speed. Wind speed is at least 4 m s−1.
-
Wind direction. The wind direction is between 67.5 and 180∘ when using AWS data and between 112.5 and 225∘ when using near-surface data from AMPS.
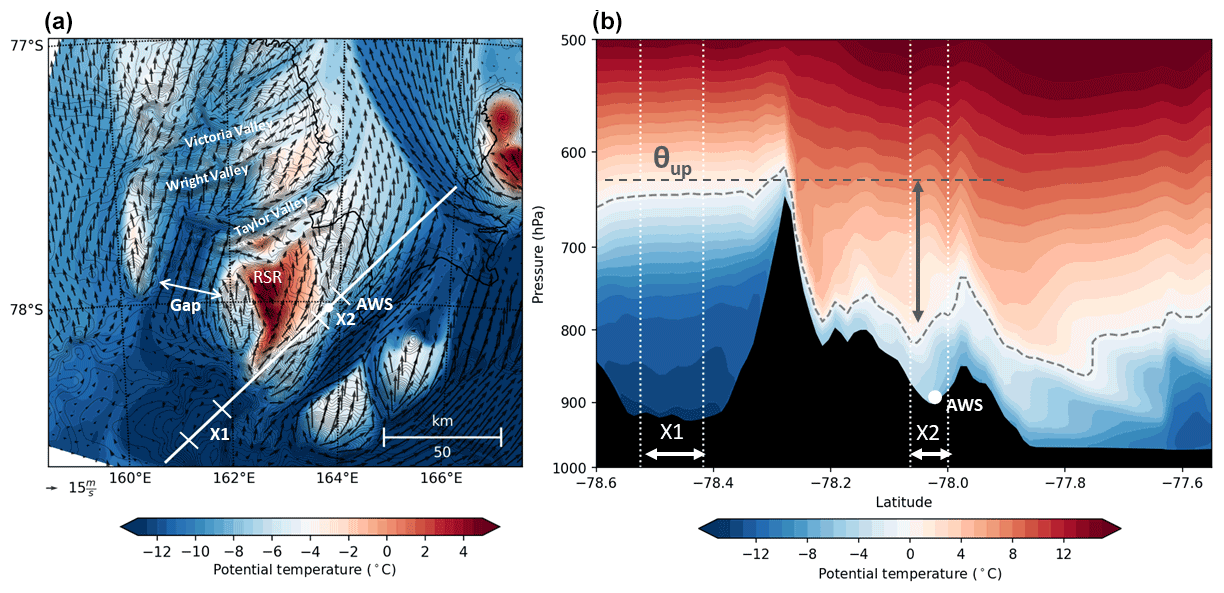
Figure 2Foehn event on 12 April 2009 within (a) AMPS forecast of potential temperature at lowest model level (arrows show the 10 m winds, and RSR indicates the Royal Society Range) and (b) AMPS forecast of vertical potential temperature profile across the transect shown in (a). X1 indicates the upwind region of undisturbed flow; X2 is the region over Joyce Glacier; θup the potential temperature at mountain height level over X1 that is used to measure the isentropic drawdown.
2.4.3 Turton
Turton et al. (2018) developed a more complex classification scheme in which a combination of criteria to detect observed near-surface foehn conditions and AMPS-forecasted foehn characteristics in the upper air is used for foehn detection over the Antarctic Peninsula. The surface criteria are focused on the drying characteristic of the foehn winds and therefore use mainly relative humidity thresholds. The conditions are flagged as foehn when both the specific surface conditions in the observations are met, as well as when “isentropic drawdown” is detected in the AMPS forecast. Isentropic drawdown is the drawdown of the potentially warmer and drier air from higher elevations when airflow is forced over a mountain range and down the leeward side. This mechanism was earlier used to explain foehn winds at the Antarctic Peninsula (Elvidge and Renfrew, 2016). For evaluation purposes, this method is also tested using AMPS-forecasted near-surface conditions in Sect. 3.1.
A combination of the following two criteria must hold over a 6 h period for it to be flagged as a foehn event.
-
Near-surface characteristics. One of the following criteria must hold throughout the 6 h period:
-
falling within a 12 h period with a decrease of 15 % in relative humidity,
-
average relative humidity record below the 10th-percentile value,
-
falling within a 12 h period with a temperature increase of at least 3 ∘C in combination with an average relative humidity record below the 15th percentile.
-
-
Sufficient isentropic drawdown. This is determined as follows from AMPS forecast (Fig. 2):
-
determining θup, the average potential temperature and atmospheric pressure over X1 at mountain top height;
-
determining the minimum pressure height of θup over X2;
-
establishing a pressure height difference between the mountain top height and the θup isentrope height at X2 of at least 50 hPa.
-
2.4.4 Foehn detection method used in this study
In this study, we combine the above methods using near-surface conditions from AWS observations and identify a period as a foehn event when at least two out of the three methods detect foehn conditions within a 6 h period. Using the agreement of two out of three method limits the false detection of foehn events by any single method. This combined method also reduces sensitivity to the chosen threshold values of the detection criteria of the individual methods.
3.1 Evaluation of foehn detection methods
We applied the three methods described in Sect. 2.4 to identify foehn conditions at Joyce Glacier using both near-surface conditions based on AWS observations and AMPS output for the 14-month study period. Figure 3 shows an example of foehn conditions at Joyce Glacier in April 2009 based on AWS observations and AMPS output. The chosen forecast grid point was the closest ice point in terms of location relative to the Joyce AWS. The temperature based on the AMPS forecast was corrected for the 150 m elevation difference between grid cell and AWS elevation by using a monthly average temperature lapse rate calculated from the surrounding AMPS grid points. The AMPS 2 m temperature shows a strong correlation with observed 2 m temperature (0.97 using hourly data and 0.86 for hourly anomalies from the monthly mean to remove the impact of the annual cycle). The 2 m temperature has a mean bias of −1 ∘C, with a larger negative bias in summer months (down to −3 ∘C) and a smaller bias in winter. A lower correlation is found for AMPS relative humidity (0.45), with a mean bias of −5.7 %. AMPS 10 m wind speed has a correlation coefficient of 0.5 with observations and mean bias of −1.2 m s−1. The performance is much poorer when looking at u and v components, which is reflected in the clear difference between the observed and AMPS-forecasted wind direction (Fig. 3a). The AWS was positioned relatively close to the valley sides, and the deviation in the wind direction through topographic effects is likely not captured in AMPS. The general wind regime agrees well between forecast and observation: both show a dominant wind direction with low wind speeds that changes abruptly to a different direction with stronger winds. On average, the strong wind events tend to have higher wind speeds in the AMPS forecast compared to observations. In contrast, the wind speeds during calm conditions are underestimated in the AMPS forecast, suggesting a poor simulation of down-glacier winds. While differences are visible in the surface conditions between AMPS and observations, the AMPS forecast performs well in representing foehn onset and cessation (Fig. 3).
The Speirs method uses criteria on sudden changes in relative humidity and temperature and therefore detects mainly the onset of the foehn period (Fig. 3). Foehn periods detected by the Speirs method are on average shorter compared to the other methods and do not cover the full period where the typical windy, dry and warm conditions last. There is little agreement in the Speirs detection method between using AWS-observed or AMPS-forecasted near-surface conditions. In the AWS data, 687 h was flagged with foehn conditions, and 294 h was flagged in the AMPS data, of which 122 h agreed with the AWS foehn hours (Appendix B, Fig. B1). The difference between the AMPS and AWS data can firstly be related to the fact that changes in the temperature and humidity forecast are typically slower than observed, indicating that other thresholds might be needed to use the Speirs method on forecast data. Adjusting the threshold to changes over a 2 h instead of a 1 h period results in almost 250 more hours being detected as foehn in the AMPS forecast and more than doubles the hours that agree between AMPS and AWS data. Secondly, an accurate representation of the near-surface conditions might be limited by the vertical resolution of the AMPS forecast.
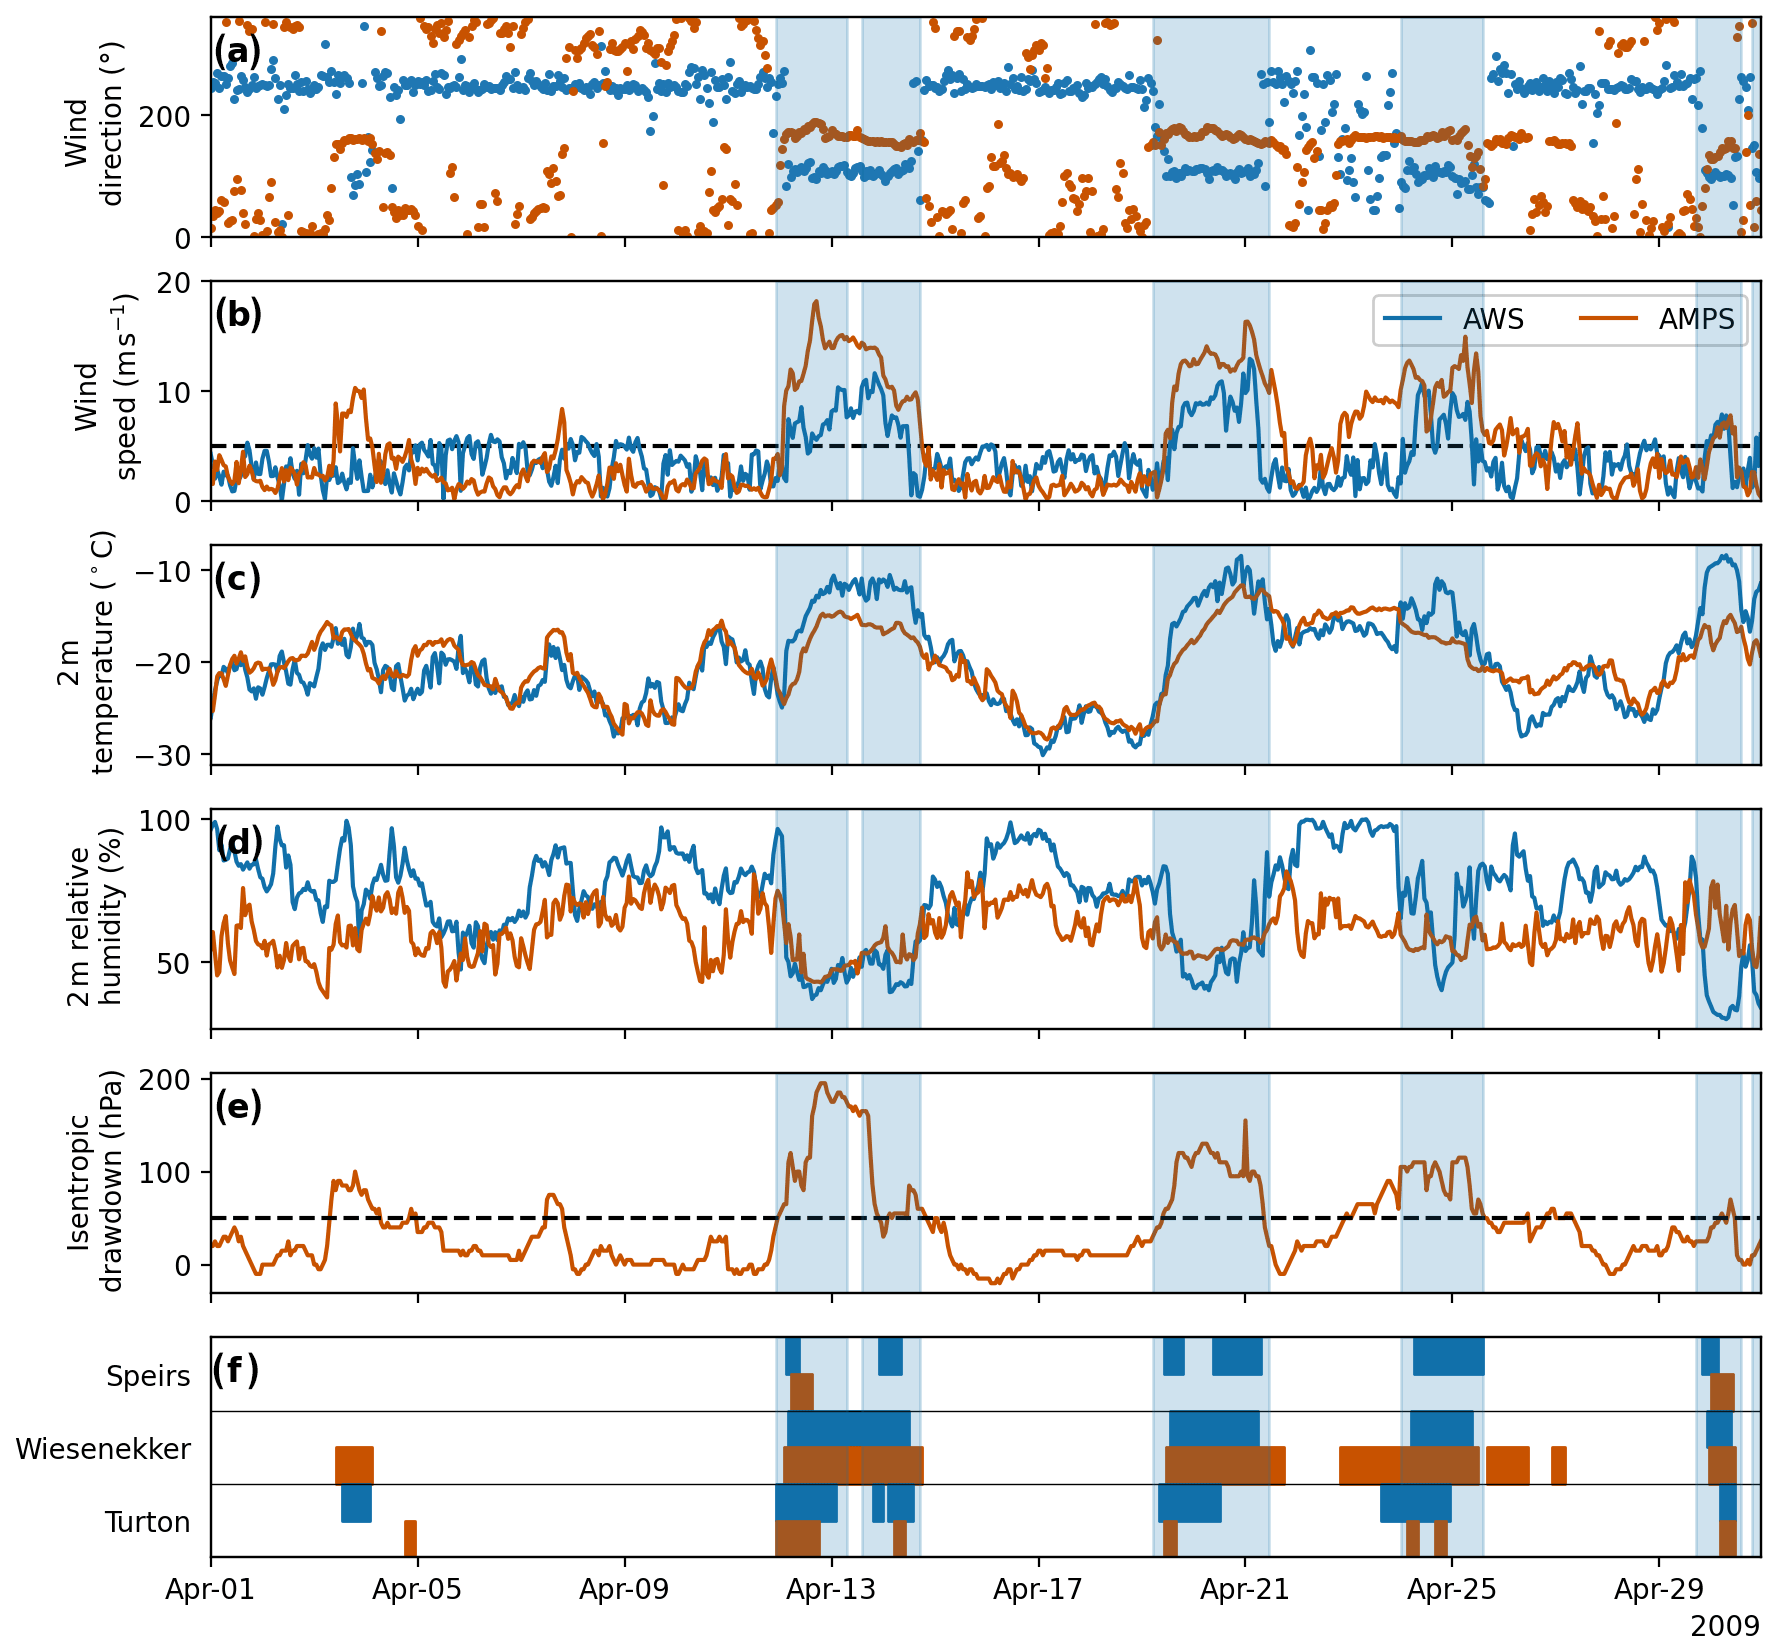
Figure 3(a–d) Wind direction, wind speed, temperature and relative humidity based on AWS observations and AMPS forecast output at Joyce Glacier for April 2009. (e) Isentropic drawdown calculated from AMPS and (f) the periods where foehn was detected in each of the methods using near-surface conditions from AWS (blue) and AMPS (red). Blue shading indicates when foehn was flagged combining at least two different detection methods in AWS data. Note that wind speed is given at 10 m for AMPS and at sensor height for AWS data.
The Wiesenekker method gives the longest foehn periods, as this method only uses periods of strong winds from one direction and is not limited by temperature and humidity criteria. In the AMPS data, 13 additional foehn events are detected by the Wiesenekker method. These are short events with stronger winds that were not observed at Joyce Glacier, such as for 4 April in Fig. 3. Finally, out of the methods using near-surface observations, the Turton method gives the largest number of foehn hours (Appendix B, Fig. B1). The method gives 934 foehn hours using AWS near-surface conditions, compared to 445 for AMPS near-surface conditions. These differences likely follow from the slower and weaker simulated humidity drops in AMPS. This confirms the findings of Kirchgaessner et al. (2019) at the Antarctic Peninsula that AMPS underestimates the temperature increase and relative humidity decrease during foehn.
Throughout the rest of this paper a combination of the detection methods using near-surface conditions from AWS observations is used to classify foehn. The detection methods using near-surface conditions from AMPS forecast are only represented in this section for evaluation purposes. The periods that are flagged as foehn in the combined method are generally longer than indicated by the individual methods using AWS near-surface conditions, but we are confident they cover the period between foehn onset and cessation (blue shading in Fig. 3). The wind speed and wind direction criteria of the Wiesenekker method play a dominant role in the detection, and either the Speirs or the Turton method confirms the drying and warming characteristic of the foehn event. In total 27 foehn periods occurred during the observation period, counting for 10 % of the study period and occurring on 15 % of the days. April and November were the months with the most foehn hours, accounting together for 50 % of the total (Appendix B, Fig. B1). During the melt season (December and January) six foehn events occurred, which covered 6 % of the period. This lower foehn frequency in summer compared to winter has been found in other MDV studies as well (Nylen et al., 2004; Speirs et al., 2010) and is related to weaker cyclone activity over the Ross Sea region. The mean foehn duration is 37 h, with a minimum duration of 6 h and a maximum duration of 90 h. The highest temperature of 5.8 ∘C was measured during a foehn event on 26 December 2008.
3.2 Evaluation of the energy balance model
The energy and mass balance model is evaluated against observed surface height change and surface temperature. The optimal simulation was chosen based on the smallest root-mean-square error (RMSE) and bias between observed and simulated surface temperatures (Fig. 4a). The ensemble spread, based on ensemble standard deviation with respect to ensemble mean, is provided to indicate uncertainty in the simulated surface height change introduced by parameter settings. The optimal surface temperature of the simulation ensemble agrees well with the observed surface temperature (RMSE 1.44 ∘C, Fig. 4a). The model only slightly overestimates the observed surface temperature (bias 0.02 ∘C). In summer, the simulated surface temperature reaches melt (0 ∘C) more frequently than observed (Fig. 4a).
The simulated and observed surface height changes agree reasonably well in December and January months when melt occurs (Fig. 4b). During the first melt season (melt1, Fig. 4b) 12 cm of ice was lost in the observations, compared to 9 cm in the simulation. In the second melt season (melt2), ablation was around 8 cm in both the observations and the simulation. The two snow accumulation events during the melt periods correspond with observations, since the surface height record was used to determine the accumulation rate.
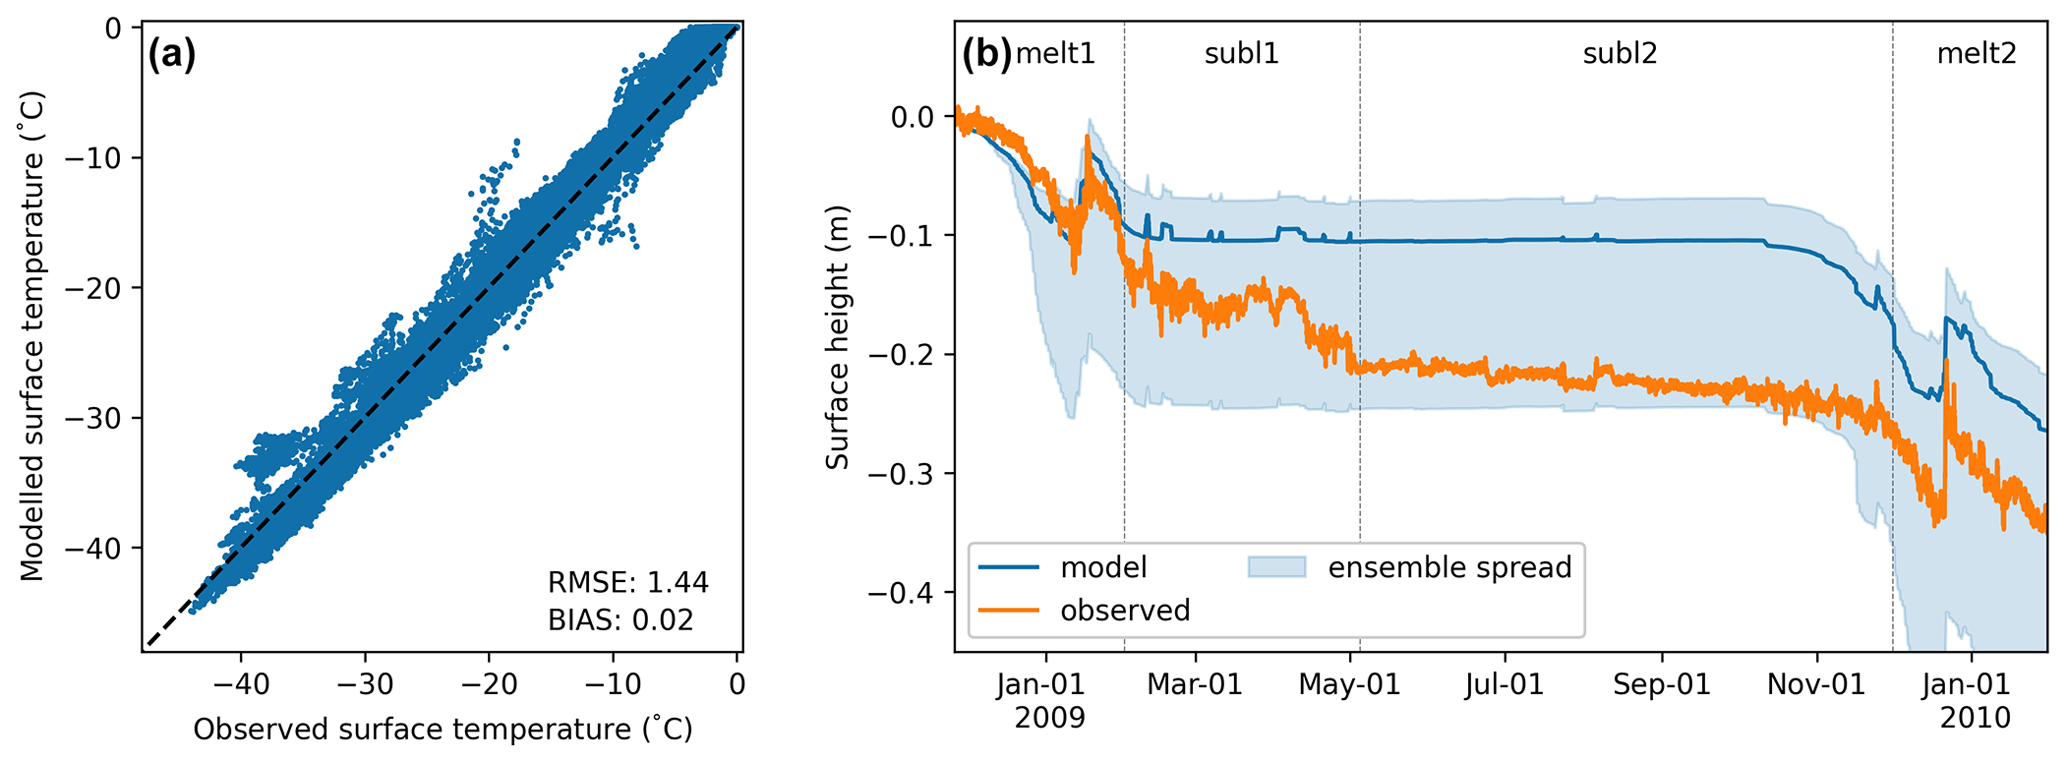
Figure 4(a) Observed versus modelled surface temperature and (b) surface height change, where model represents the optimal ensemble simulation. In (b), blue shading indicates the ensemble spread represented by the standard deviation with respect to the ensemble mean.
The largest deviations between simulated and observed ablation are for the period from February until May (subl1, Fig. 4b). Simulated ablation is 1 cm, compared to 9 cm in the observations. The largest ablation is observed during the second half of April, during which several foehn events occurred (Appendix B, Fig. B1). Sublimation rates calculated by the bulk method might be underestimated during these foehn events in the simulation. Still, the SR50 surface record should be interpreted with care since the observed surface height changes can be caused by snow redistribution, which is not captured in the simulations. There is better agreement during the May–December period, where the surface height change through sublimation is 5 cm for both model and observations, although the distribution in time differs.
The ensemble spread in Fig. 4b indicates the uncertainty introduced by the parameter settings listed in Table 1. During the melt seasons the standard deviation in the simulation ensemble increases, showing the uncertainty in the simulated surface height as controlled by uncertainty in simulated melt and sublimation. Over the winter period the standard deviation stays rather constant, indicating that most of the uncertainty in surface ablation is related to the simulation of melt.
The largest uncertainty in the simulated surface height change is due to the dzrad parameter (not shown), which determines the partitioning of solar radiation to the subsurface. The grid resolution of the upper snow layers also largely impacts the simulated surface melt. The importance of solar radiation penetration and the uncertainty that is associated with the partitioning of solar radiation for MDV glaciers are also noted by Hoffman et al. (2014). In this paper we do not focus on the amount of melt that occurs as surface or internal melt but rather on the occurrence of melt in relation to foehn events. The good agreement between the observed and simulated surface temperature gives us confidence in using the model to study the dominant energy fluxes and melt occurrence under foehn and non-foehn conditions.
4.1 Foehn occurrence at Joyce Glacier
A mean sea level pressure anomaly plot during all foehn hours reveals the presence of low-pressure systems over the Ross Sea during these events (Fig. 5a). The dark blue shading in Fig. 5a shows the average location of cyclones during foehn events at Joyce Glacier, rather than individual events. These results are consistent with earlier studies that link foehn events observed in the Taylor, Wright and Victoria valleys with cyclones over the Ross Sea (Speirs et al., 2010; Steinhoff et al., 2013, 2014).
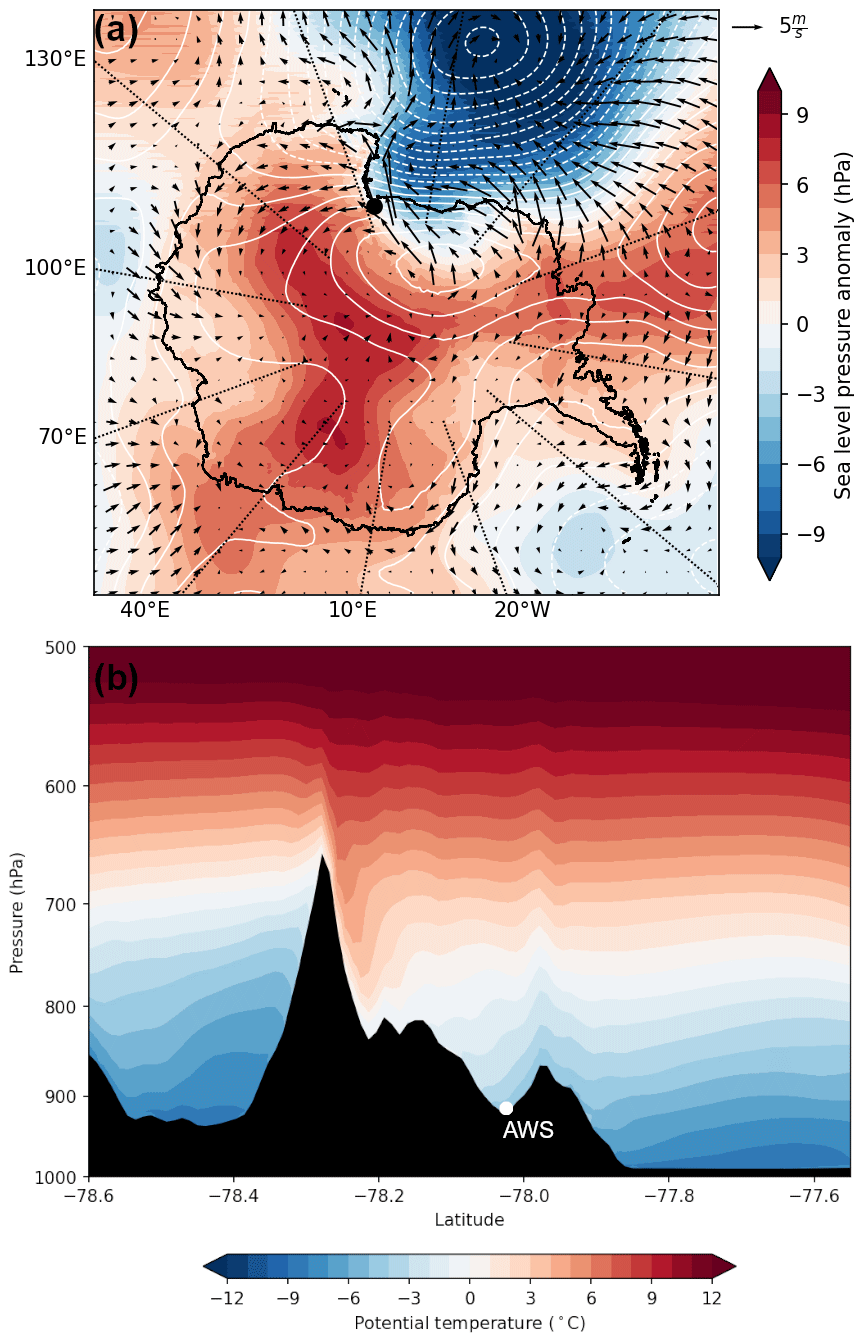
Figure 5(a) Foehn anomaly of AMPS sea level pressure (shading), 500 hPa geopotential height (contour) and 10 m wind arrows for the 15 km grid d02 domain. The foehn anomaly is calculated as the mean of the AMPS fields during foehn hours at Joyce Glacier minus the mean during hours without foehn. (b) Composite of AMPS potential temperature profile during foehn events at Joyce Glacier over the transect shown in Fig. 2.
The presence of the cyclone results in a southerly flow from the Ross Ice Shelf northward towards the MDV (Fig. 5a). Part of the observed southerly flow is blocked at low levels by the Royal Society Range and is split into a component flowing into the gap on the western side of the mountain range and another component on the eastern side (see foehn case in April 2009, Fig. 2a). To confirm the blocking flow regime, the Froude number is calculated as , with h being the height of the Royal Society Range (∼ 2.5 km), U the average wind speed of the upwind flow until mountain height and N the Brunt–Väisälä frequency. We find an average Froude number of 0.2 during foehn, and it never exceeds 0.7, indicating that the low-level flow is blocked and the flow cannot ascend over the Royal Society Range but rather is diverted around it. This blocking and split of the low-level flow are also found for a clustered synoptic circulation pattern of anomalous low sea level pressure over the Ross Sea, resulting in strong synoptic southerly flow (Katurji et al., 2019).
The low-level blocking is responsible for the along-gap pressure difference driving the gap flow and foehn signature in the northern MDV (Steinhoff et al., 2013). The flow through the gap (indicated in Fig. 2) is accelerated by mountain waves, leading to a foehn effect in the Taylor, Wright and Victoria valleys. The low-level blocking also results in the drawdown of warmer air from aloft on the leeward side towards Joyce Glacier (Fig. 5b). The strongest warming due to the isentropic drawdown is visible at the base of the north-east slope (Fig. 5b). This foehn warming, defined as the increase in near-surface air temperature on the leeward site compared to the temperature at the same altitude on the windward side, is on average still about 5 ∘C over Joyce Glacier. The April 2009 case in Fig. 2b agrees with the average potential temperature field during foehn (Fig. 5b) and confirms the isentropic drawdown mechanisms causing the foehn signature at Joyce Glacier.
4.2 The energy balance of Joyce Glacier
The absence of sunlight in austral winter (April–September) ensures that the energy balance is often dominated by longwave radiative cooling (Fig. 6). The average net energy loss by longwave radiation in these months is 47 W m−2, compared to a gain of energy of 40 W m−2 by sensible heating. An average QG of 6 W m−2 provides energy to the surface and cools the subsurface. The LH plays only a minor role in the winter energy balance and switches between slightly positive and negative.
March and October can be considered transition months with a decreasing or increasing contribution of solar radiation (Obryk et al., 2020). In these months the longwave radiation remains the dominant cooling component, and ablation is limited through the small contribution of the latent heat loss and solar radiation in those months (Fig. 6).
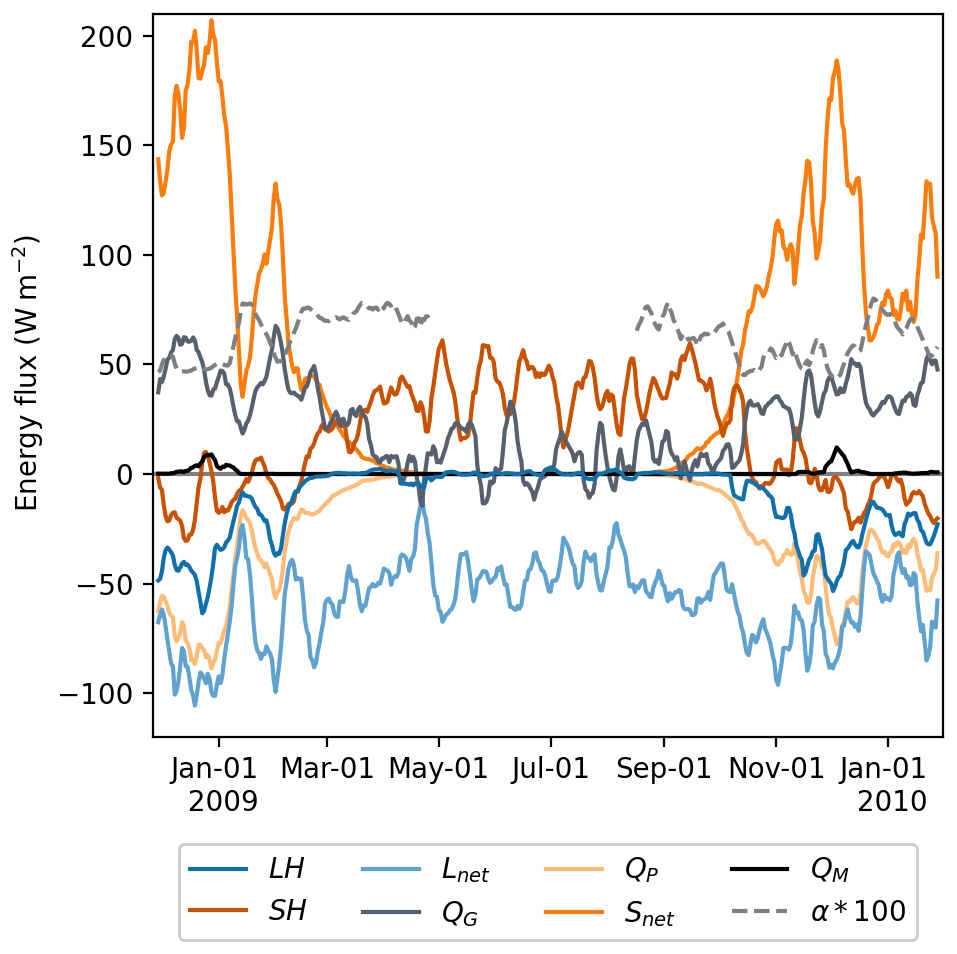
Figure 6Daily averaged energy balance components during the observational record at Joyce Glacier. A 7 d moving average is applied to improve visibility.
Between November and February, the largest source of energy is solar radiation. Net solar radiation (Sin(1−α)) is about 111 W m−2, of which 43 % penetrates into the subsurface (QP, Fig. 6). The warmed subsurface returns energy to the surface balance through a QG of 42 W m−2. Longwave radiative cooling remains the dominant energy loss, but LH plays a larger role in summer, with 28 W m−2 on average used for sublimation. During most of summer the sign of SH is negative, indicating a relatively warm surface close to the melting point and unstable conditions. The albedo of ≈0.6 and large Snet heat the subsurface and surface and give rise to the instability in the surface layer. Although simulated surface temperatures have a positive bias in summer (Sect. 3.2), both simulated and observed surface temperatures are often warmer than the summer air temperature, confirming the often negative sign of SH. The unstable conditions are uncommon for ablation zones of most glaciers in summer where the atmosphere is often warmer compared to the surface at the melting point. However, such unstable conditions have previously been found for blue-ice areas in Antarctica (Bintanja and van den Broeke, 1994) and dry-snow zones in Greenland and elsewhere (Cullen and Steffen, 2001). The surplus of energy available for melting is small and mostly limited to the December and January months.
4.3 Foehn impact on winter energy balance
The energy balance shifts from longwave radiation being dominant to sensible heat playing a large role during the 13 foehn periods in winter. The warm and windy foehn conditions almost double the contribution of sensible heating to an average flux of 70 W m−2. Longwave-equivalent cloudiness (Nϵ) is estimated from air temperature and Lin using the method of van den Broeke et al. (2004) and is on average 0.38 during foehn compared to 0.15 during non-foehn conditions in winter. The cloudier conditions during winter foehn lead to longwave radiative cooling being reduced to 28 W m−2. Figure 7 shows this shift in the energy balance during a number of foehn events in April 2009. During the non-foehn period, radiative cooling is strong under clear-sky conditions and the subsurface cools. Down-glacier winds still retain SH values of up to 70 W m−2 during non-foehn conditions. When the foehn conditions are established, SH increases to values around 100 W m−2 (Fig. 7a).
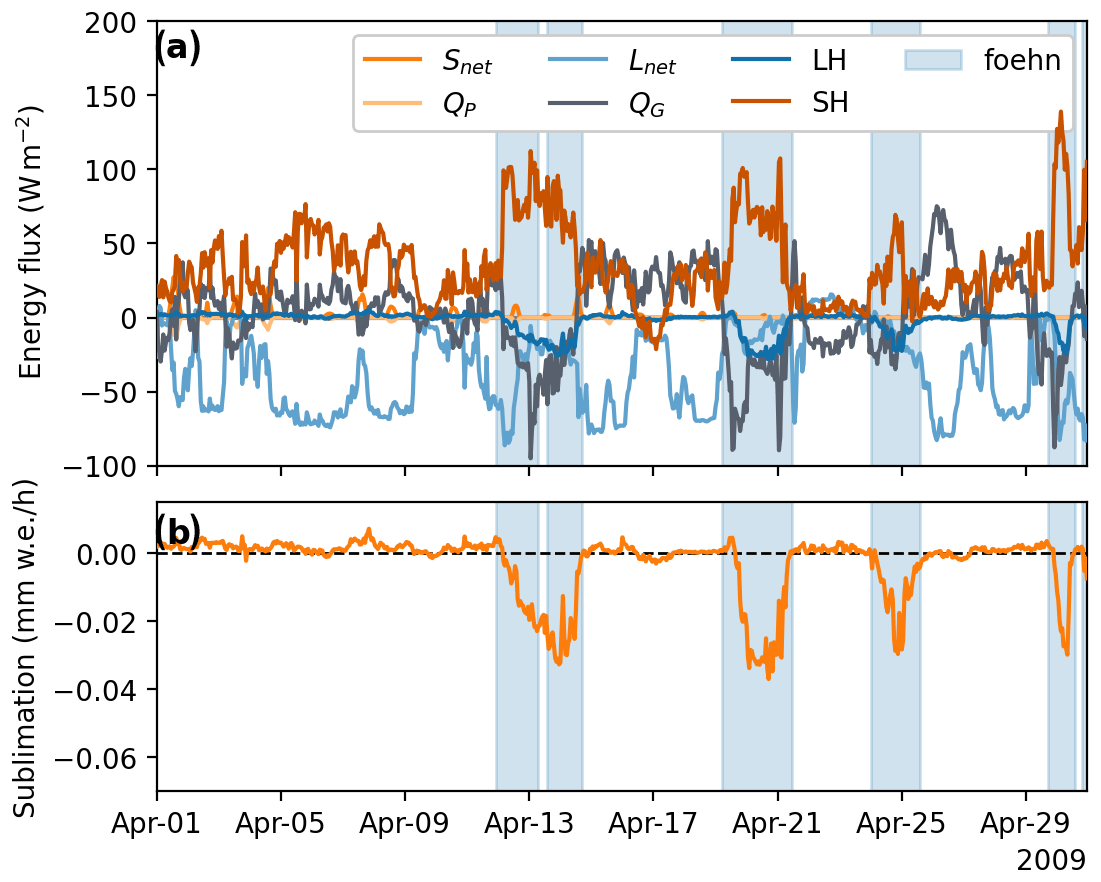
Figure 7(a) Energy balance components and (b) simulated sublimation during April 2009. Background shading indicates periods that are flagged as foehn.
During most of the winter LH is slightly positive, resulting in a small amount of deposition. The sign switches when foehn warming is initiated. On average, 8 W m−2 is used for sublimation at the surface during these windy and dry conditions. While this pattern is clearly visible in Fig. 7 for foehn in April 2009, the magnitude of the sublimation might be underestimated as is described in Sect. 3.2. The energy losses through sublimation and longwave radiation during winter foehn only partly compensate for the strong sensible heating, and therefore the subsurface is also warming through an average flux of −34 W m−2.

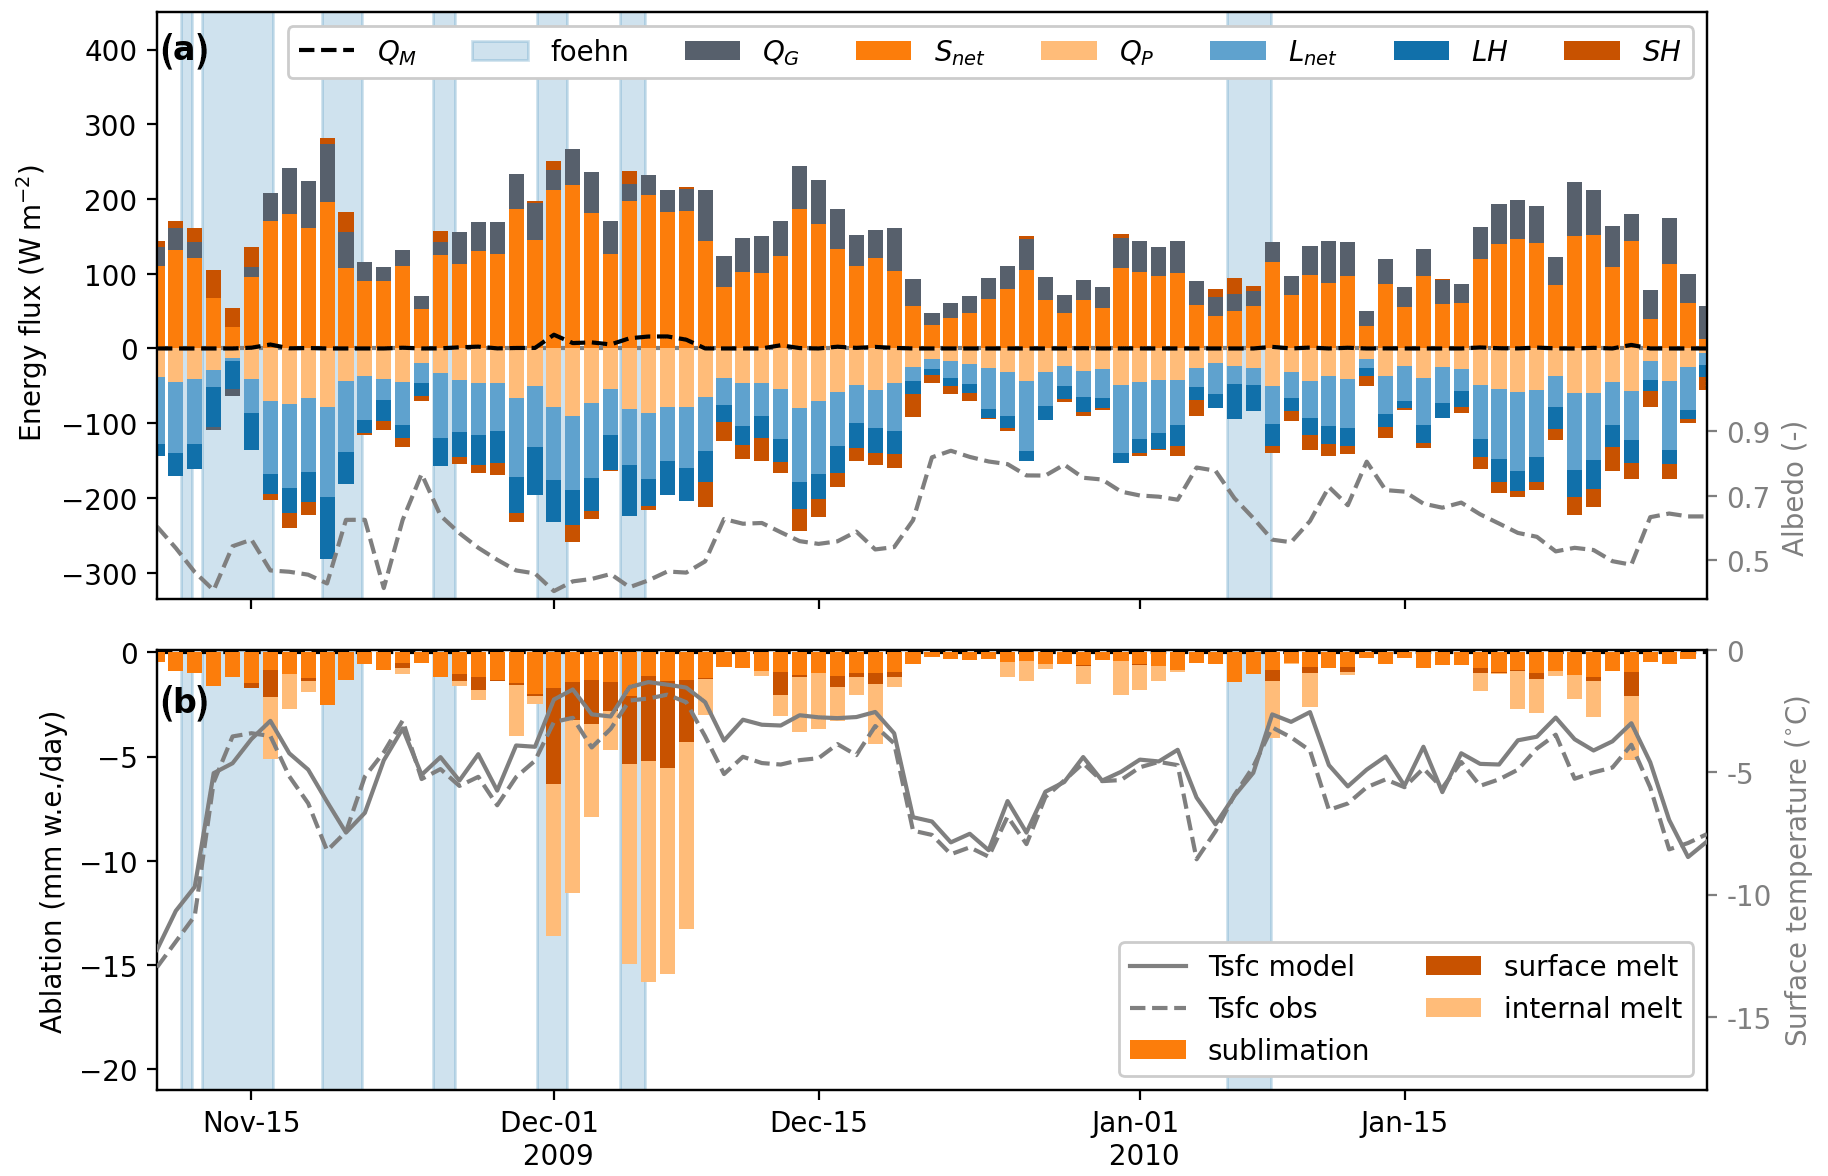
Figure 8(a) Daily average energy balance components and (b) ablation components at Joyce Glacier during the 2008/09 melt season. The dashed grey line in (a) gives albedo, and the solid and dashed grey lines in (b) represent the simulated and observed mean surface temperature. Blue shading indicates foehn events.
4.4 Foehn impact on melt
Melt at Joyce Glacier occurs almost solely in December and January, when Snet is at its peak. Melt at MDV glaciers is driven by solar radiation (Hoffman et al., 2008), and melt rarely occurs during days with clouds in the 14-month record at Joyce (Appendix C, Fig. C1). Of the surface melt at Joyce Glacier, 83 % occurred during clear-sky conditions (Nϵ<0.2) and only 0.5 % during overcast conditions (Nϵ>0.8). On clear-sky days Snet brings the surface temperatures to zero, allowing melt to occur. During the 2008/09 melt season, December and January had an average Snet of 137 W m−2, compared to 104 W m−2 over the 2009/10 melt season. This difference was also found for the Commonwealth, Beacon and Taylor glaciers and several valley and lake stations in the MDV (Obryk et al., 2020). The long period of clear-sky conditions in 2008/09 and a continuous low albedo of around 0.5 resulted in a large Snet and a long period of melt occurring each day (Fig. 8). During the entire 2008/09 melt season, only two foehn events close to each other are detected, showing that foehn events are not needed to generate sufficient energy for melt at Joyce Glacier. However, the foehn event appears to enhance melt rates. On 25 December 2008, energy losses from sublimation are large and ablation through sublimation during this foehn event is the highest for the entire study period. Most of December is characterized by unstable conditions, with a surface that cools through loss of SH. This changes when the foehn event sets in and the warmer, windier conditions cause a switch in the direction of SH, increasing the energy available for melt. The peak in melt energy during this season occurs just after the foehn event on 29 December 2008. At this point the surface has warmed, Snet is still large and cooling through sublimation has decreased. Importantly, the foehn event supplies additional energy to the surface and results in hourly surface temperatures being equal to zero (melting, Fig. 8), leading to enhanced melt after the foehn event. Melting continues for another 2 weeks until cloudier conditions and new snowfall reduce the Snet and prohibit melt for most of the remaining season.
During the second melt season atmospheric conditions are more variable, with more clouds, and the glacier's albedo increases more frequently through snowfall events or snow redistribution (Fig. 9). Net solar radiation is therefore smaller, and fewer days result in energy being available for melt (Fig. 8). While most melt occurs during December and January at Joyce Glacier, a short melt event is simulated in November after a foehn event (Fig. 9). The foehn warming causes a rise in the subsurface and surface temperatures. The higher surface temperatures in combination with sunny conditions following the foehn event result in the simulated melt event.
Compared to 2008/09, the 2009/10 melt season has fewer periods of large Snet, reducing the solar heating of the surface and melt occurrence. Foehn events may play a key role in the melt occurrence during such conditions. The largest melt rates in this season occur during or just after foehn events (Fig. 9). Foehn conditions occur, averaged over December and January, for 6 % of the time, but surface melt during foehn conditions contributes to 23 % of the total melt. Melt occurs more frequently under foehn conditions as the foehn events provide additional energy to the surface. This is visible from the rapidly increasing surface temperatures during foehn events, bringing the surface to the melting point (Fig. 9b). The warming of the ice is also caused by the albedo that decreases, for example, during the foehn event on 6 January 2010 as the surface transitions from snow-covered to snow-free (grey line in Fig. 9a). The pattern of cloudier conditions during foehn events in winter is not evident for foehn events in December and January, where the longwave-equivalent cloudiness (Nϵ) is varying and on average ∼ 0.3 for both non-foehn and foehn conditions. Atmospheric transmission () can be used as another indicator for cloudiness and does not reveal any clear pattern in cloudiness during foehn conditions either (daily weighted average of ∼ 0.6 during both foehn and non-foehn conditions).
Not only does melt occur more frequently under foehn conditions, but the energy available for melt when the surface is at melting point is larger during time steps with foehn compared to without foehn conditions in December and January (43 W m−2 compared to 32 W m−2, respectively). The warmer foehn air results in a strong increase in the contribution of SH under melt (+31 W m−2) compared to non-foehn conditions, which is largely compensated for by an increased energy loss to sublimation (−27 W m−2). The main surplus of energy is provided by an increase in Snet ( W m−2) as the albedo is on average lower during foehn events.
4.5 Foehn effects on surface layer stability and wind regime
Foehn events change the unique melt conditions of the MDV, where surface melt often occurs with air temperatures below zero. Figure 10 shows the average meteorological conditions during and outside foehn days in December and January. On days without foehn conditions, for 90 % of the hours in which the surface melts, the air temperature is below zero. Melt occurs through strong solar heating that brings the surface to melting. The net solar flux peaks just after midday, leading to diurnal variability in the stability of the surface layer over the glacier surface (Fig. 10). The relatively warm surface with a colder atmosphere above leads to unstable conditions, reflected in a negative SH in Fig. 10c. The conditions switch to neutral during the night, when solar heating of the surface is reduced. Similarly, a diurnal cycle in atmospheric stability over soil has been found in the nearby Miers Valley, induced by topographic shading at night (Katurji et al., 2013). During melt under foehn conditions, air temperatures are more frequently above zero (73 % of the time) and SH forms a source of energy to the surface. The distinct diurnal pattern in stability shifts to mostly stable conditions and near-neutral stability at midday during foehn days (Fig. 10b, d).
.
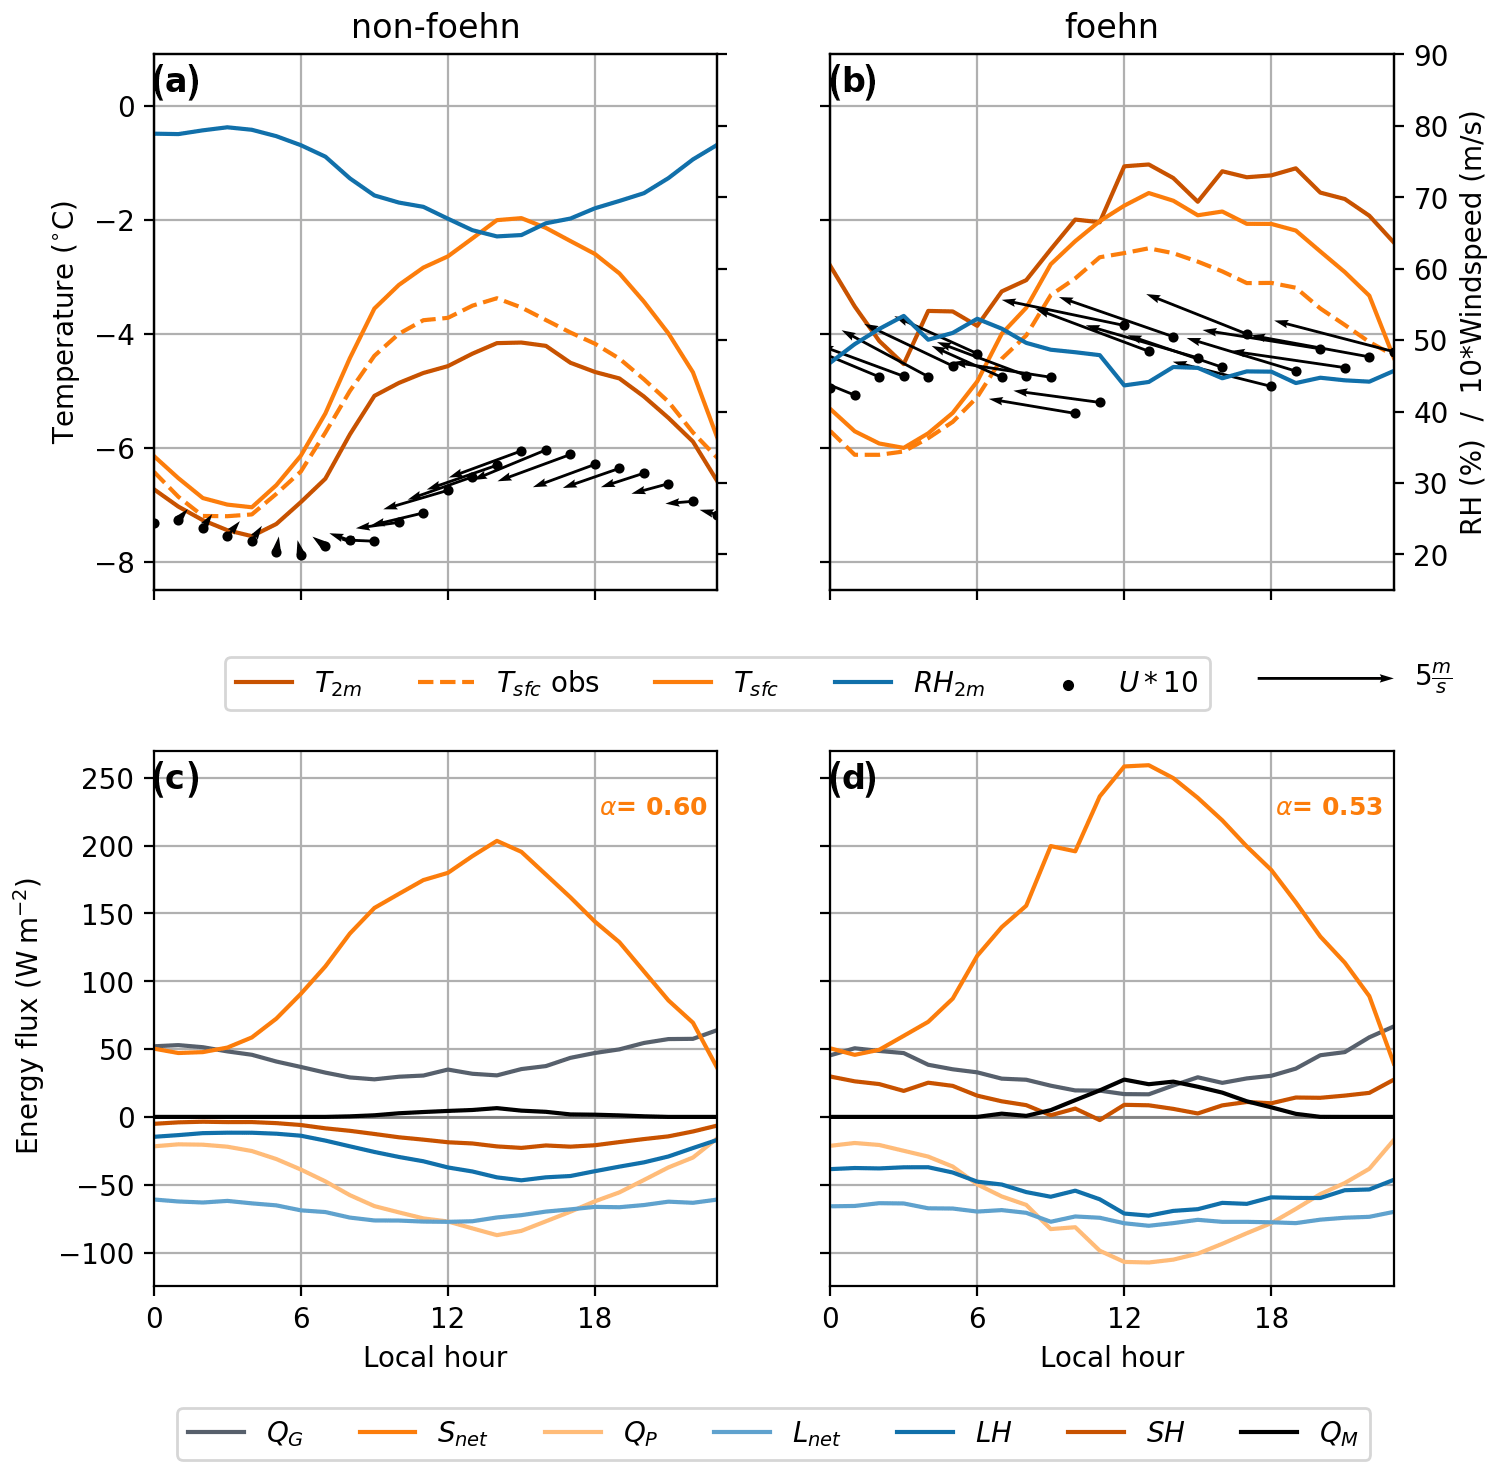
Figure 10Average diurnal cycle in observed meteorological variables and simulated energy fluxes on days with and without foehn conditions in December and January. The average albedo during the non-foehn and foehn days is given in (c) and (d). Arrows indicate wind direction, with typically a north-easterly sea breeze, south-westerly down-glacier wind and south-easterly foehn wind.
Foehn events also disturb the diurnal cycle in the summer sea-breeze circulation in the MDV. Under cloudless conditions, Rnet becomes negative at night and the cooled surface layer gives rise to down-glacier winds (Appendix C, Fig. C1). During the daytime the down-glacier south-westerly flow is replaced by stronger north-easterly onshore winds (Fig. 10a). A similar diurnal wind regime in the Miers Valley induced by nighttime cooling through shading of the valley floor has been observed with eddy covariance and vertical wind profiles (Katurji et al., 2013). The diurnal wind regime is replaced by a steady south-easterly wind during foehn events (Fig. 10b).
5.1 Spatial differences in foehn mechanism in the complex terrain of the MDV
The strong warm and dry wind events that characterize the MDV were previously described as katabatic winds (Bull, 1966; Doran et al., 2002; Nylen et al., 2004) but were later explained as foehn winds by Speirs et al. (2010), Steinhoff et al. (2013) and Speirs et al. (2013). Similarly to Speirs et al. (2010), we found that the air mass origin of these wind events is not from the Antarctic Plateau as expected during katabatic surges but rather that the events are associated with synoptic pressure gradients due to Ross Sea cyclones. While foehn events at Joyce Glacier and the previously studied northern MDV both share this synoptic driver, we show that the forcing mechanism of the foehn events varies spatially in the complex terrain of the MDV. The different mechanism leading to the observed foehn signature in different valleys of the MDV is illustrated in Fig. 11. The blocking of the synoptic flow by the Royal Society Range diverts the flow at low levels (Fig. 2a), forcing the flow into a gap and causing foehn warming in the northern MDV, with the mechanism described by Steinhoff et al. (2013). At the same time, this low-level blocking deflects the upper cross-barrier flow and causes drawdown of potentially warmer air on the leeward side and over Joyce Glacier (Figs. 2b and 5b). Both the meteorological observations and AMPS data are used for detection of foehn events at Joyce Glacier. Foehn occurred at Joyce Glacier for 15 % of the days, which is lower than the average foehn occurrence in the Taylor, Wright and Victoria valleys. The average foehn occurrence found for the 14-month study period at Joyce Glacier might not reflect the climatological mean, but it lies within the large inter-annual variability in the northern MDV (Speirs et al., 2013). As foehn events over the different regions of the MDV are all related to low-pressure systems, it is likely the location of these systems and the direction of the associated flow determine where foehn conditions occur within the MDV. The different driving mechanisms that occur at relatively short distances from each other in the MDV show the complex interactions of the synoptic flow with topography in the MDV.
The relative humidity dropped on average by 43 % during foehn events at Joyce Glacier, with the lowest humidity reaching 23 %. Even lower relative humidity values close to 12 % were observed by Speirs et al. (2010) during foehn events in 2007 at Commonwealth, Canada and Howard glaciers, and values between 7 % and 17 % were observed at non-glacial MDV sites. These differences suggest that foehn drying might be weaker at Joyce Glacier. As shown for the MDV, foehn can bring air temperatures above zero, leading to temperatures of up to 5.8 ∘C at Joyce Glacier. The largest increase in air temperature during foehn at Joyce Glacier is 20.6 ∘C compared to increases of 25 ∘C found for a 2007 foehn event at Howard, Commonwealth and Canada glaciers (Speirs et al., 2010). AWS sites in valley floors even showed temperature increases of up to 50 ∘C in the MDV during foehn events (Speirs et al., 2010). In the Taylor, Wright and Victoria valleys, winters are characterized by cold-air pooling under stable conditions. When this cold air is eroded by foehn air, it leads to large temperature changes. Cold-pool formation is likely weaker at Joyce Glacier due to its higher location in the valley it is situated in, where down-glacier winds occur more frequently and prevent cold-air pooling. In addition, the strength of the foehn warming and drying at the surface relates to the ability of the foehn air to reach the ice surface, which is likely associated with lee-side wave activity and occurrence of hydraulic jumps. The spatial variability in foehn strength caused by different underlying foehn mechanisms should be explored in future studies.
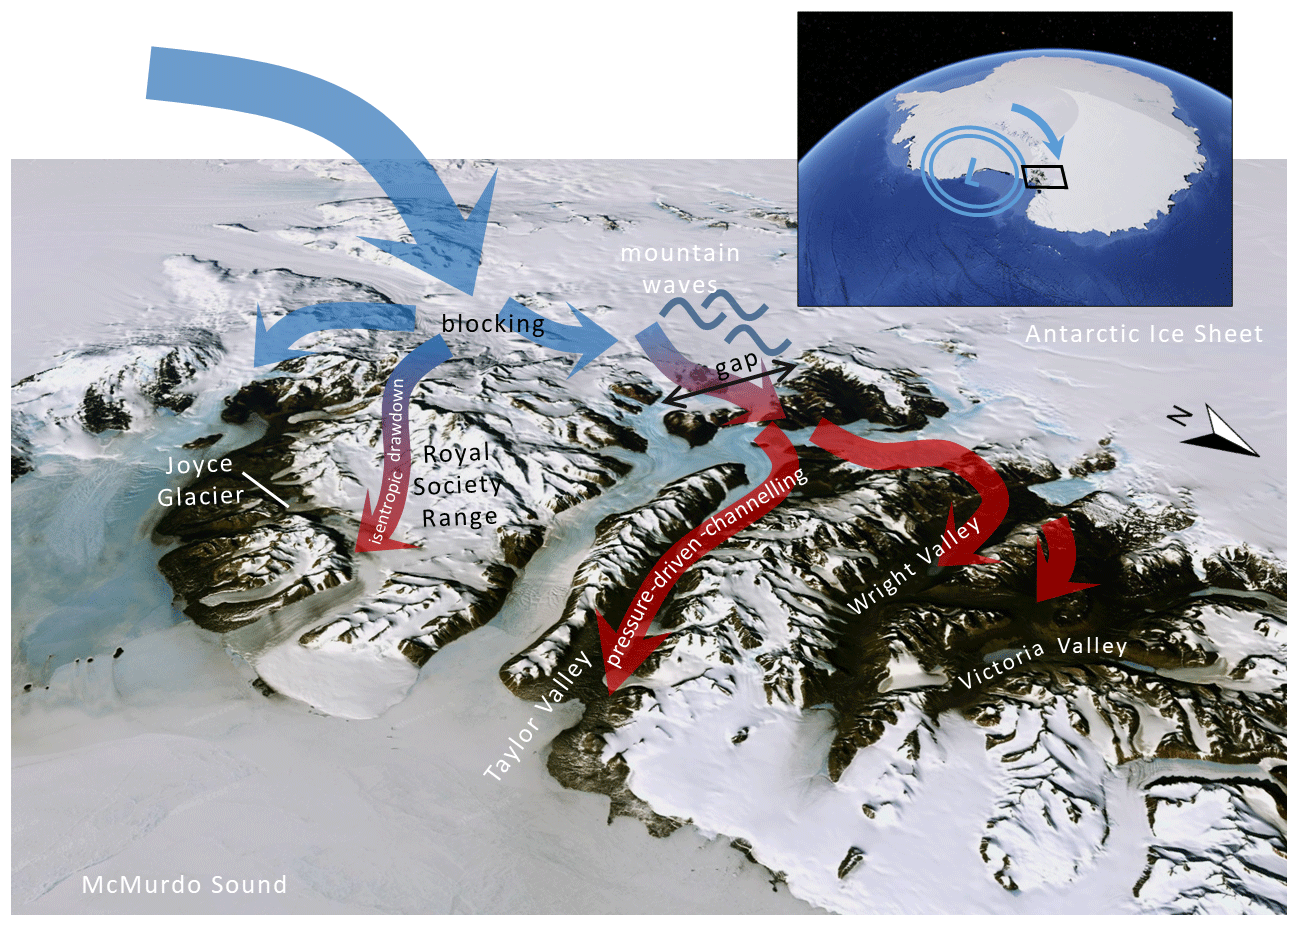
Figure 11Overview of local processes that lead to foehn conditions in the MDV. “L” represents the synoptic low-pressure system. The thick blue arrow represents the synoptic flow as visualized in the subplot. The smaller arrows show the local airflow, with the colour transition from blue to red indicating the warming and drying of the flow (© Google Earth).
5.2 Energy balance modelling of MDV glaciers
We have presented an energy and mass balance time series from the ablation zone of a previously unstudied MDV glacier. Glaciers in the MDV have been described as challenging for SEB modelling compared to higher-melt environments. Daily variation in the energy fluxes is large, but daily mean values and melt residuals are typically small (Lewis et al., 1998). Therefore, errors in the measured radiation components can introduce large errors into the simulated melt energy. This study is the first SEB study in the MDV to use a four-component radiometer located on a glacier. Previous energy balance modelling of MDV glaciers by Lewis et al. (1998) and Hoffman et al. (2008, 2014, 2016) has been limited to ablation measurements and thermistor ice temperature measurements for model calibration and evaluation. The observations of Lout at Joyce Glacier allowed for model evaluation against observed surface temperatures. The good agreement between simulated and observed surface temperatures with a RMSE of 1.44 ∘C and a bias of 0.02 ∘C gives us confidence in the calculated energy fluxes.
Solar radiation plays a dominant role in the energy balance of MDV glaciers. The measured Sin and Snet at Joyce Glacier are similar to values for Taylor Glacier (Table 2). While solar radiation penetration might play a small role in high-melt environments of temperate glaciers, Hoffman et al. (2008) showed the importance of including solar radiation penetration to accurately model the change in surface height of MDV glaciers. Similarly, in this study we found that solar radiation penetration needed to be included in order to reproduce the observed surface temperatures at Joyce Glacier. It was estimated that 18 % of Sin, equating to 43 % of the Snet, penetrated the subsurface for the most optimal surface temperature simulation. This value is comparable to 37 % of Snet that was found by Kuipers Munneke et al. (2009) for dry snow on top of the Greenland Ice Sheet. The percentage is smaller compared to the optimal simulations found by Hoffman et al. (2014) for Taylor Glacier using a refreezing and drainage model, where 60 % and 80 % of Snet, respectively, penetrated the subsurface. In the simulation presented in this study, density does not change when subsurface melt runs off. Including the formation of such a “weathering crust” in the surface height calculation as done by Hoffman et al. (2014) may enhance ablation and better represent observations but does not significantly affect the energy fluxes. Established methods to measure subsurface radiation, as well as internal melt rates and internal melt discharge for model calibration, are still missing, and subsurface penetration and melt remain, therefore, the largest uncertainties in MDV mass balance modelling.
Table 2Comparison of geographic characteristics, meteorological observations and SEB fluxes (W m−2) from glacial SEB studies in the MDV. The values represent averages for the December and January months within the study period, and for Joyce Glacier averages over only hours with surface melt are given in square brackets.

a Using drainage model. b Shows averages over period 21 December 1994–21 January 1995 and 22 November 1995–10 January 1996. c For the 1994/95 season 2.7 W m−2 and for the 1995/96 season 46 W m−2. d Average over 2004–2009. n/a indicates that no average values were given in the literature.
The different ways to treat solar radiation penetration between the energy balance studies in the MDV are reflected in the solar and subsurface heat fluxes (Table 2). When no penetration is allowed, QG remains small, while more heat is brought back to the surface for simulations with increasing rates of solar radiation penetration. The largest energy loss for all MDV glaciers was by Lnet followed by LH. LH losses to sublimation are smaller at Joyce Glacier compared to the more inland Taylor Glacier, where humidity is lower and wind speeds generally higher (Table 2). The average SH at most of the MDV glaciers is close to zero (Table 2), while it is more negative at Joyce Glacier, suggesting the atmosphere is often unstable. The higher elevation and lower air temperatures at Joyce Glacier ensure that energy losses through SH are larger compared to at Taylor and Canada glaciers, where the average flux is small or positive closer to the glacier terminus. The diurnal pattern in SH found in this study is comparable to a study by Bintanja and van den Broeke (1994) that showed that unstable conditions (negative SH) during the daytime lasted much longer and nighttime conditions were less stable over blue ice compared to snow surfaces.
5.3 Comparing the foehn impact on the SEB components in different Antarctic regions
During the two melt seasons at Joyce Glacier, melt occurred more frequently during foehn events compared to non-foehn conditions and melt energy was on average larger during foehn melt events. This agrees with findings of foehn-induced melt over the Antarctic Peninsula. There, the highest melt rates occur during foehn conditions, and foehn can contribute to 45 % of the total melt in some regions of the Larsen C shelf (Elvidge et al., 2020). The extra shortwave radiation through widespread cloud clearance during foehn events over the Antarctic Peninsula (King et al., 2017; Elvidge et al., 2020; Turton et al., 2020; Laffin et al., 2021) was not evident from the summer foehn events at Joyce Glacier. In fact, during winter foehn events, Joyce Glacier experienced on average cloudier conditions. The foehn warming over Joyce Glacier is dominated by isentropic drawdown, and foehn clearance might play a minor role through the strong low-level blocking by the Royal Society Range, which prohibits the warmer and more humid air from low levels from rising and condensing on the windward side (Zou et al., 2021b). Besides, the foehn winds might not be able to penetrate fully to the surface over Joyce Glacier and might only partly erode the moist air originating from McMurdo Sound. As melt in the MDV is driven by solar radiation, future foehn studies in the MDV should investigate the cloud effects during summer foehn. There is a need for better radiation observations at the MDV AWS sites to study the sensitivity of melt with respect to clouds.
Over the Antarctic Peninsula, especially under strong foehn jets, melt can be SH driven, leading to melt even in the polar night (Kuipers Munneke et al., 2018; Elvidge et al., 2020). While this study confirms the increased SH warming and LH cooling during foehn events, melt always remains solar radiation dominated at Joyce Glacier. The strong increase in SH warming is largely compensated for by increased LH losses at Joyce Glacier, and the increased melt rates under foehn conditions more likely result from lowered surface albedo and therefore increased Snet. Distinctive for the MDV glaciers is the change from surface melt with subzero air temperatures during non-foehn conditions to melt under stable surface layer conditions during foehn events. As melt at Joyce Glacier is driven by Snet, it occurs solely around midday, when solar fluxes are peaking. The increased SH heating throughout the entire day during foehn events suggests that melt does also occur in periods with a lower solar angle, under the condition that SH is not compensated for by large LH losses. Studies covering several melt seasons are needed to confirm the impact of foehn events on melt duration and intensity in the MDV.
While melt during foehn events is still a small part of the total melt, we suspect that foehn events play an important role in melt generation in the MDV as the largest melt rates are found during or just after foehn events. At this point the ice surface has warmed and clear-sky conditions lead more frequently to melt generation compared to pre-foehn days. We hypothesize that foehn in this way “primes” the surface through warming and albedo reduction for melt generation in the MDV. Since summer temperatures are mostly below zero in the MDV, foehn occurrence likely plays a key role in the surface reaching the melting point through surface “priming”. This highlights the different role of foehn events in melt generation in the colder environment of the MDV compared to the Antarctic Peninsula, where melt is more persistent in summer. However, in a similar way foehn plays a major role in prolonging the melt season at Larsen C ice shelf and spring foehn events precondition the ice shelf for enhanced summertime melt via reduced albedo (Elvidge et al., 2020).
This study is the first to study the foehn–melt interaction in the MDV from an energy balance perspective. Further studies that include both the spatial and the temporal variability in the energy balance are needed to confirm the role of foehn occurrence in melt generation. Foehn-induced melt at the MDV might vary spatially due to interactions between synoptic flow and the local topography as well as through processes involving localized melt at topographic features such as ice cliffs (Lewis et al., 1999). A climatological study of foehn strength and duration at the MDV glaciers is needed to better understand the impact of foehn on melt occurrence and rates. Dubnick et al. (2017) showed strong nutrient-specific responses to changes in runoff of Joyce Glacier, and therefore future studies using a “watershed” approach could provide key data on how changes to foehn events may be disproportionately impacting the wider receiving environment through enhanced hydrological and associated biogeochemical change.
Table A1Specifications of sensors installed on the Joyce Glacier AWS. Accuracy of the radiation observations is expressed with the estimated accuracy of daily totals (EADT).

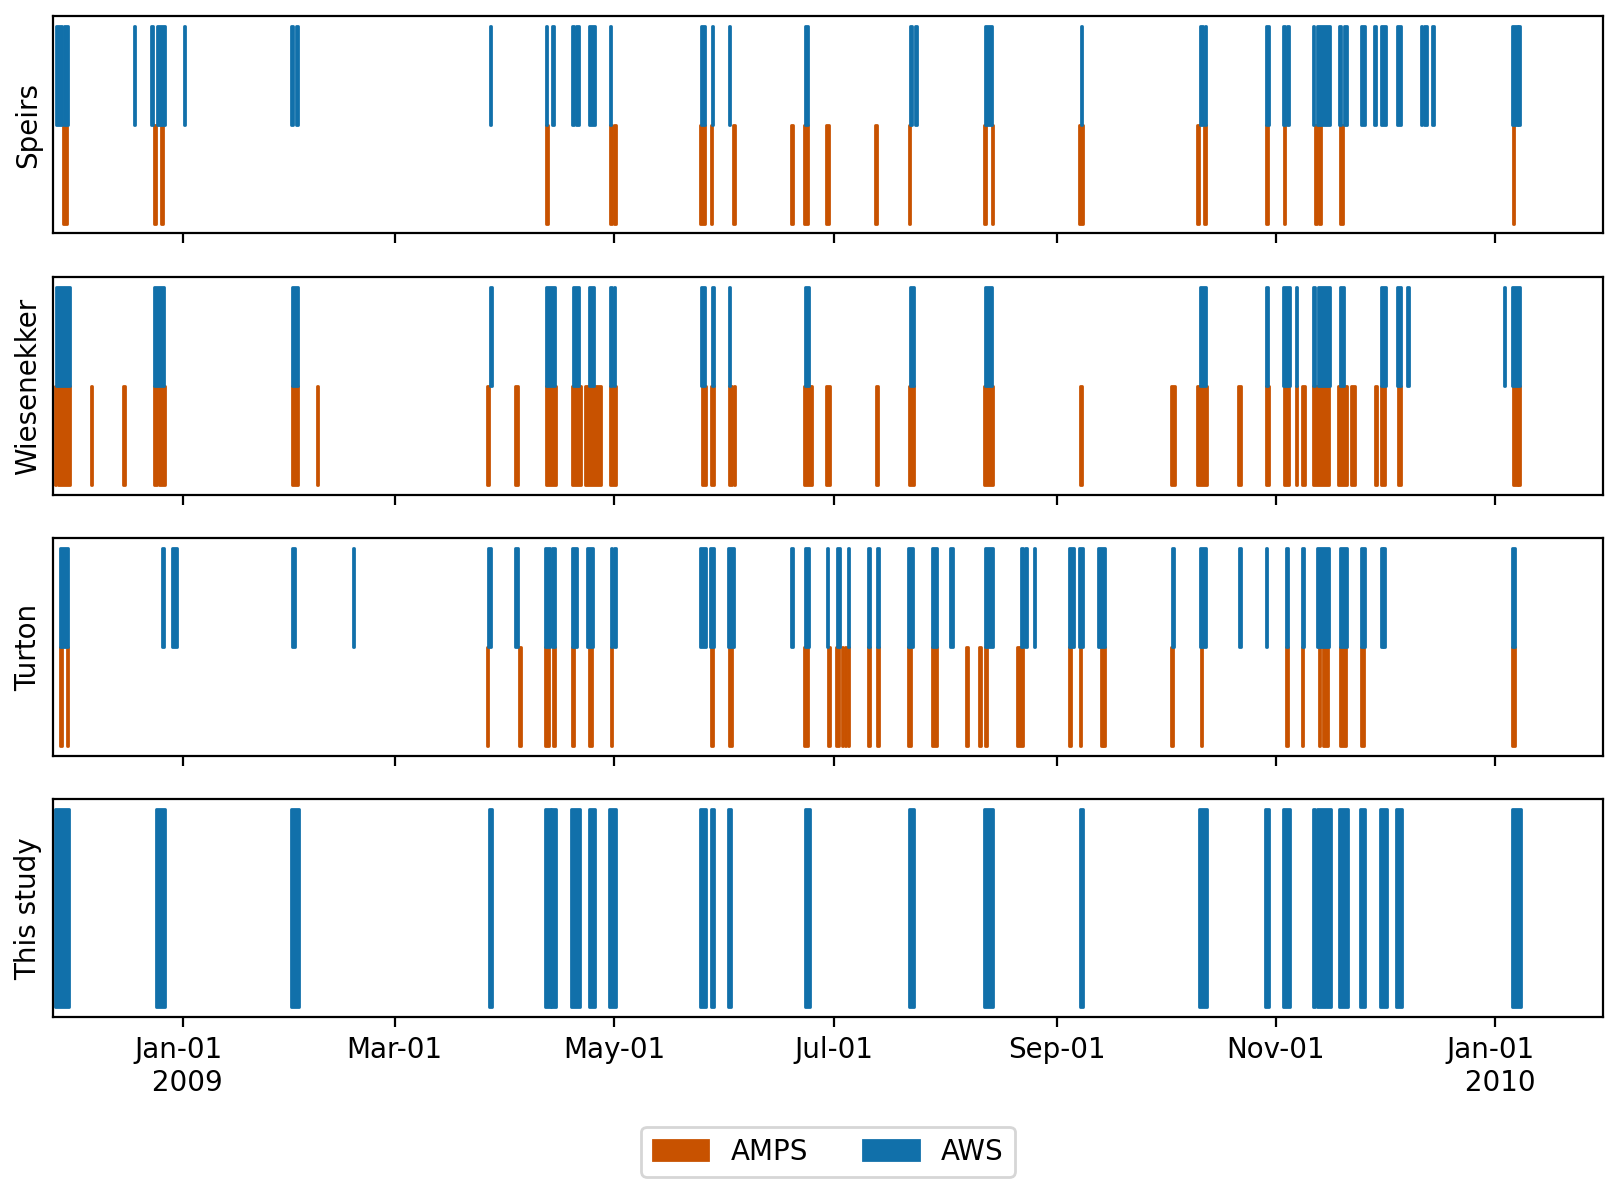
Figure B1Foehn detected by the Speirs, Wiesenekker and Turton methods using temperature, relative humidity and wind speed from AWS observations (blue) or AMPS forecast (red) at Joyce Glacier. In this study foehn is detected when two out of three methods agree in a 6 h period based on AWS data.
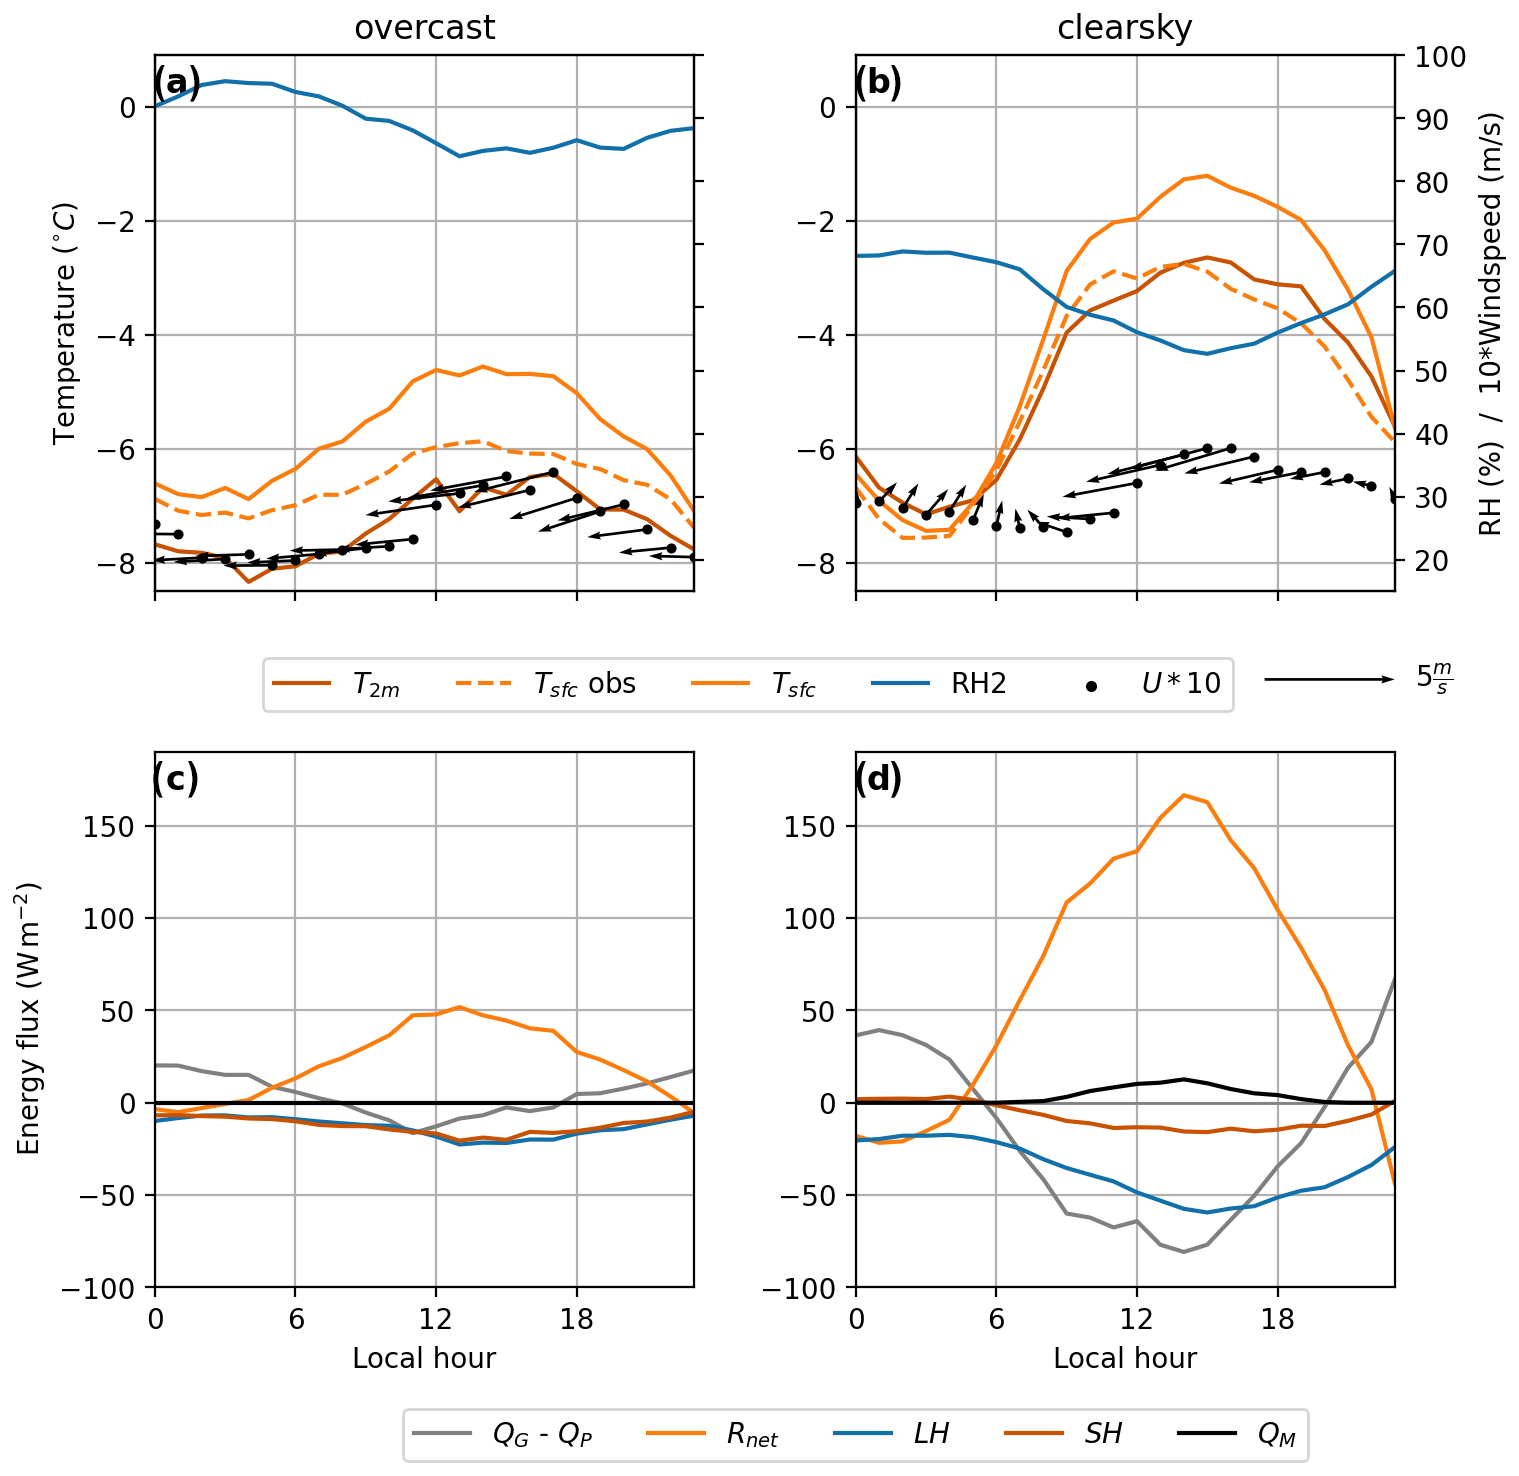
Figure C1Average diurnal cycle in observed meteorological variables and simulated energy fluxes on overcast (Nϵ>0.7) and clear-sky (Nϵ<0.3) days in December and January. Rnet represents Snet+Lnet. Arrows indicate wind direction, with typically a north-easterly sea breeze and south-westerly down-glacier wind.
AMPS forecasts are available as subsets at https://www.earthsystemgrid.org/project/amps.html (last access: 8 November 2022) (NCAR, 2022). The surface energy balance observations and model output from Joyce Glacier are available upon request from the corresponding author.
MGH performed most of the data processing and analyses. JFO and NJC collected the observational data. MGH, NJC, CHR, MvdB and MK were involved in the conceptualization and methodology. MGH wrote the draft paper and edits with review and editing by all co-authors.
The contact author has declared that none of the authors has any competing interests.
Publisher’s note: Copernicus Publications remains neutral with regard to jurisdictional claims in published maps and institutional affiliations.
We thank Mark W. Seefeldt for making the AMPS forecast output available from their data archive. The AMPS forecast was processed and stored on the New Zealand eScience Infrastructure (NeSI) high-performance computing facilities. We would like to thank the wrf-python community (Ladwig, 2017) and Michaela Sizemore for wrf-python support for analysis of the atmospheric model data presented in this study.
This research has been supported by Antarctica New Zealand (grant nos. K064 and ANTA1801) and the Royal Society Te Apārangi (grant no. RDF-UOC1701).
This paper was edited by Emily Collier and reviewed by two anonymous referees.
Bintanja, R. and van den Broeke, M. R.: The Surface Energy Balance of Antarctic Snow and Blue Ice, J. Appl. Meteorol. Clim., 34, 902–926, 1994. a, b
Brandt, R. E. and Warren, S. G.: Solar-heating rates and temperature profiles in Antarctic snow and ice, J. Glaciol., 39, 99–110, https://doi.org/10.3189/S0022143000015756, 1993. a
Bull, C.: Climatological Observations in Ice-Free Areas of Southern Victoria Land, Antarctica, Studies in Antarctic Meteorology, 9, 177–194, https://doi.org/10.1029/AR009P0177, 1966. a, b
Cullen, N. J. and Steffen, K.: Unstable near-surface boundary conditions in summer on top of the Greenland ice sheet, Geophys. Res. Lett., 28, 4491–4493, https://doi.org/10.1029/2001GL013417, 2001. a
Doran, P. T., McKay, C. P., Clow, G. D., Dana, G. L., Fountain, A. G., Nylen, T., and Lyons, W. B.: Valley floor climate observations from the McMurdo dry valleys, Antarctica, 1986–2000, J. Geophys. Res.-Atmos., 107, 4772, https://doi.org/10.1029/2001JD002045, 2002. a, b
Doran, P. T., McKay, C. P., Fountain, A. G., Nylen, T., McKnight, D. M., Jaros, C., and Barrett, J. E.: Hydrologic response to extreme warm and cold summers in the McMurdo Dry Valleys, East Antarctica, Antarct. Sci., 20, 499–509, https://doi.org/10.1017/S0954102008001272, 2008. a, b
Dubnick, A., Wadham, J., Tranter, M., Sharp, M., Orwin, J., Barker, J., Bagshaw, E., and Fitzsimons, S.: Trickle or treat: The dynamics of nutrient export from polar glaciers, Hydrol. Process., 31, 1776–1789, https://doi.org/10.1002/hyp.11149, 2017. a, b
Elvidge, A. D. and Renfrew, I. A.: The Causes of Foehn Warming in the Lee of Mountains, B. Am. Meteorol. Soc., 97, 455–466, https://doi.org/10.1175/BAMS-D-14-00194.1, 2016. a
Elvidge, A. D., Kuipers Munneke, P., King, J. C., Renfrew, I. A., and Gilbert, E.: Atmospheric Drivers of Melt on Larsen C Ice Shelf: Surface Energy Budget Regimes and the Impact of Foehn, J. Geophys. Res.-Atmos., 125, e2020JD032463, https://doi.org/10.1029/2020JD032463, 2020. a, b, c, d, e, f
Eveland, J., Gooseff, M. N., Lampkin, D. J., Barrett, J. E., and Takacs-Vesbach, C.: Spatial and temporal patterns of snow accumulation and aerial ablation across the McMurdo Dry Valleys, Antarctica, Hydrol. Process., 27, 2864–2875, https://doi.org/10.1002/hyp.9407, 2012. a
Foreman, C. M., Wolf, C. F., and Priscu, J. C.: Impact of Episodic Warming Events on the Physical, Chemical and Biological Relationships of Lakes in the McMurdo Dry Valleys, Antarctica, Aquat. Geochem., 10, 239–268, 2004. a, b
Fountain, A. G., Nylen, T. H., Monaghan, A., Basagic, H. J., and Bromwich, D.: Snow in the Mcmurdo Dry Valleys, Antarctica, Int. J. Climatol., 30, 633–642, https://doi.org/10.1002/joc.1933, 2010. a, b
Fountain, A. G., Basagic, H. J., and Niebuhr, S.: Glaciers in equilibrium, McMurdo Dry Valleys, Antarctica, J. Glaciol., 62, 976–989, https://doi.org/10.1017/jog.2016.86, 2016. a, b
Gillett, S. and Cullen, N. J.: Atmospheric controls on summer ablation over Brewster Glacier, New Zealand, Int. J. Climatol., 31, 2033–2048, https://doi.org/10.1002/JOC.2216, 2011. a, b
Hoffman, M. J., Fountain, A. G., and Liston, G. E.: Surface energy balance and melt thresholds over 11 years at Taylor Glacier, Antarctica, J. Geophys. Res.-Earth, 113, F04014, https://doi.org/10.1029/2008JF001029, 2008. a, b, c, d
Hoffman, M. J., Fountain, A. G., and Liston, G. E.: Near-surface internal melting: A substantial mass loss on Antarctic Dry Valley glaciers, J. Glaciol., 60, 361–374, https://doi.org/10.3189/2014JoG13J095, 2014. a, b, c, d
Hoffman, M. J., Fountain, A. G., and Liston, G. E.: Distributed modeling of ablation (1996–2011) and climate sensitivity on the glaciers of Taylor Valley, Antarctica, J. Glaciol., 62, 215–229, https://doi.org/10.1017/jog.2015.2, 2016. a
Jakobs, C. L., Reijmer, C. H., Kuipers Munneke, P., König-Langlo, G., and van den Broeke, M. R.: Quantifying the snowmelt–albedo feedback at Neumayer Station, East Antarctica, The Cryosphere, 13, 1473–1485, https://doi.org/10.5194/tc-13-1473-2019, 2019. a
Katurji, M., Zawar-Reza, P., and Zhong, S.: Surface layer response to topographic solar shading in Antarctica's dry valleys, J. Geophys. Res.-Atmos., 118, 12332–12344, https://doi.org/10.1002/2013JD020530, 2013. a, b, c
Katurji, M., Khan, B., Sprenger, M., Datta, R., Joy, K., Zawar-Reza, P., and Hawes, I.: Meteorological connectivity from regions of high biodiversity within the Mcmurdo Dry Valleys of Antarctica, J. Appl. Meteorol. Clim., 58, 2437–2452, https://doi.org/10.1175/JAMC-D-18-0336.1, 2019. a, b
King, J. C., Kirchgaessner, A., Bevan, S., Elvidge, A. D., Kuipers Munneke, P., Luckman, A., Orr, A., Renfrew, I. A., and van den Broeke, M. R.: The Impact of Föhn Winds on Surface Energy Balance During the 2010–2011 Melt Season Over Larsen C Ice Shelf, Antarctica, J. Geophys. Res.-Atmos., 122, 12062–12076, https://doi.org/10.1002/2017JD026809, 2017. a, b, c
Kirchgaessner, A., King, J., and Gadian, A.: The Representation of Föhn Events to the East of the Antarctic Peninsula in Simulations by the Antarctic Mesoscale Prediction System, J. Geophys. Res.-Atmos., 124, 13663–13679, https://doi.org/10.1029/2019JD030637, 2019. a
Kuipers Munneke, P., van den Broeke, M. R., Reijmer, C. H., Helsen, M. M., Boot, W., Schneebeli, M., and Steffen, K.: The role of radiation penetration in the energy budget of the snowpack at Summit, Greenland, The Cryosphere, 3, 155–165, https://doi.org/10.5194/tc-3-155-2009, 2009. a, b
Kuipers Munneke, P., Ligtenberg, S. R., van den Broeke, M. R., and Vaughan, D. G.: Firn air depletion as a precursor of Antarctic ice-shelf collapse, J. Glaciol., 60, 205–214, https://doi.org/10.3189/2014JoG13J183, 2014. a
Kuipers Munneke, P., Luckman, A. J., Bevan, S. L., Smeets, C. J., Gilbert, E., van den Broeke, M. R., Wang, W., Zender, C., Hubbard, B., Ashmore, D., Orr, A., King, J. C., and Kulessa, B.: Intense Winter Surface Melt on an Antarctic Ice Shelf, Geophys. Res. Lett., 45, 7615–7623, https://doi.org/10.1029/2018GL077899, 2018. a, b
Ladwig, W.: wrf-python (Version 1.3.2), Boulder, Colorado, UCAR/NCAR [software], https://doi.org/10.5065/D6W094P1, 2017. a
Laffin, M. K., Zender, C. S., Singh, S., Van Wessem, J. M., Smeets, C. J., and Reijmer, C. H.: Climatology and Evolution of the Antarctic Peninsula Föhn Wind-Induced Melt Regime From 1979–2018, J. Geophys. Res.-Atmos., 126, e2020JD033682, https://doi.org/10.1029/2020JD033682, 2021. a, b
Lewis, K. J., Fountain, A. G., and Dana, G. L.: Surface energy balance and meltwater production for a Dry Valley glacier, Taylor Valley, Antarctica, Ann. Glaciol., 27, 603–609, https://doi.org/10.3189/1998AOG27-1-603-609, 1998. a, b
Lewis, K. J., Fountain, A. G., and Dana, G. L.: How important is terminus cliff melt?: a study of the Canada Glacier terminus, Taylor Valley, Antarctica, Global Planet. Change, 22, 105–115, https://doi.org/10.1016/S0921-8181(99)00029-6, 1999. a
NCAR: Project: AMPS, NCAR [data set], https://www.earthsystemgrid.org/project/amps.html, last access: 8 November 2022. a
Nylen, T. H., Fountain, A. G., and Doran, P. T.: Climatology of katabatic winds in the McMurdo dry valleys, southern Victoria Land, Antarctica, J. Geophys. Res.-Atmos., 109, D03114, https://doi.org/10.1029/2003JD003937, 2004. a, b, c
Obryk, M. K., Doran, P. T., Waddington, E. D., and McKay, C. P.: The influence of föhn winds on Glacial Lake Washburn and palaeotemperatures in the McMurdo Dry Valleys, Antarctica, during the Last Glacial Maximum, Antarct. Sci., 29, 457–467, https://doi.org/10.1017/S0954102017000062, 2017. a
Obryk, M. K., Doran, P. T., Fountain, A. G., Myers, M., and McKay, C. P.: Climate From the McMurdo Dry Valleys, Antarctica, 1986–2017: Surface Air Temperature Trends and Redefined Summer Season, J. Geophys. Res.-Atmos., 125, e2019JD032180, https://doi.org/10.1029/2019JD032180, 2020. a, b
Reijmer, C. H. and Hock, R.: Internal accumulation on Storglaciären, Sweden, in a multi-layer snow model coupled to a distributed energy-and mass-balance model, J. Glaciol., 54, 61–72, https://doi.org/10.3189/002214308784409161, 2008. a
Reijmer, C. H. and Oerlemans, J.: Temporal and spatial variability of the surface energy balance in Dronning Maud Land, East Antarctica, J. Geophys. Res.-Atmos., 107, 4759, https://doi.org/10.1029/2000JD000110, 2002. a
Seefeldt, M. W. and Cassano, J. J.: A description of the Ross Ice Shelf air stream (RAS) through the use of self-organizing maps (SOMs), J. Geophys. Res.-Atmos., 117, D09112, https://doi.org/10.1029/2011JD016857, 2012. a
Speirs, J. C., Steinhoff, D. F., McGowan, H. A., Bromwich, D. H., and Monaghan, A. J.: Foehn winds in the McMurdo Dry Valleys, Antarctica: The origin of extreme warming events, J. Climate, 23, 3577–3598, https://doi.org/10.1175/2010JCLI3382.1, 2010. a, b, c, d, e, f, g, h, i, j, k, l, m, n
Speirs, J. C., Mcgowan, H. A., Steinhoff, D. F., and Bromwich, D. H.: Regional climate variability driven by foehn winds in the McMurdo Dry Valleys, Antarctica, Int. J. Climatol., 33, 945–958, https://doi.org/10.1002/joc.3481, 2013. a, b, c, d
Steffen, K. and Box, J.: Surface climatology of the Greenland ice sheet: Greenland Climate Network 1995–1999, J. Geophys. Res.-Atmos., 106, 33951–33964, https://doi.org/10.1029/2001JD900161, 2001. a
Steinhoff, D. F., Bromwich, D. H., and Monaghan, A.: Dynamics of the foehn mechanism in the Mcmurdo Dry Valleys of Antarctica from polar WRF, Q. J. Roy. Meteor. Soc., 139, 1615–1631, https://doi.org/10.1002/qj.2038, 2013. a, b, c, d, e, f, g, h
Steinhoff, D. F., Bromwich, D. H., Speirs, J. C., Mcgowan, H. A., and Monaghan, A. J.: Austral summer foehn winds over the McMurdo dry valleys of Antarctica from Polar WRF, Q. J. Roy. Meteor. Soc., 140, 1825–1837, https://doi.org/10.1002/qj.2278, 2014. a, b, c, d, e, f
Turton, J. V., Kirchgaessner, A., Ross, A. N., King, J. C., and Jenny Turton, C. V.: The spatial distribution and temporal variability of föhn winds over the Larsen C ice shelf, Antarctica, 144, 1169–1178, https://doi.org/10.1002/qj.3284, 2018. a, b, c
Turton, J. V., Kirchgaessner, A., Ross, A. N., King, J. C., and Kuipers Munneke, P.: The influence of föhn winds on annual and seasonal surface melt on the Larsen C Ice Shelf, Antarctica, The Cryosphere, 14, 4165–4180, https://doi.org/10.5194/tc-14-4165-2020, 2020. a, b, c, d
van den Broeke, M., van As, D., and Reijmer, C.: Assessing and Improving the Quality of Unattended Radiation Observations in Antarctica, J. Atmos. Ocean. Tech., 21, 1417–1431, 2004. a, b, c
van den Broeke, M., Smeets, P., Ettema, J., van der Veen, C., van de Wal, R., and Oerlemans, J.: Partitioning of melt energy and meltwater fluxes in the ablation zone of the west Greenland ice sheet, The Cryosphere, 2, 179–189, https://doi.org/10.5194/tc-2-179-2008, 2008. a
Wiesenekker, J. M., Munneke, P. K., Van den Broeke, M. R., and Smeets, C. J. P. P.: A Multidecadal Analysis of Föhn Winds over Larsen C Ice Shelf from a Combination of Observations and Modeling, Atmosphere, 9, 172, https://doi.org/10.3390/ATMOS9050172, 2018. a
Zawar-Reza, P., Katurji, M., Soltanzadeh, I., Dallafior, T., Zhong, S., Steinhoff, D., Storey, B., and Cary, S. C.: Pseudovertical temperature profiles give insight into winter evolution of the atmospheric boundary layer over the McMurdo Dry Valleys of Antarctica, J. Appl. Meteorol. Clim., 52, 1664–1669, https://doi.org/10.1175/JAMC-D-13-034.1, 2013. a
Zou, X., Bromwich, D. H., Montenegro, A., Wang, S. H., and Bai, L.: Major surface melting over the Ross Ice Shelf part II: Surface energy balance, Q. J. Roy. Meteor.l Soc., 147, 2895–2916, https://doi.org/10.1002/qj.4105, 2021a. a
Zou, X., Bromwich, D. H., Montenegro, A., Wang, S. H., and Bai, L.: Major surface melting over the Ross Ice Shelf part I: Foehn effect, Q. J. Roy. Meteor. Soc., https://doi.org/10.1002/qj.4104, 2021b. a, b, c
- Abstract
- Introduction
- Methods and data
- Foehn detection and model evaluation
- Results
- Discussion and conclusions
- Appendix A: AWS sensors
- Appendix B: Foehn detection
- Appendix C: Diurnal cycle on clear-sky and overcast days
- Data availability
- Author contributions
- Competing interests
- Disclaimer
- Acknowledgements
- Financial support
- Review statement
- References