the Creative Commons Attribution 4.0 License.
the Creative Commons Attribution 4.0 License.
 | 10 Feb 2022
Strong acceleration of glacier area loss in the Greater Caucasus between 2000 and 2020
Levan G. Tielidze
Gennady A. Nosenko
Tatiana E. Khromova
Frank Paul
An updated glacier inventory is important for understanding glacier behaviour given the accelerating glacier retreat observed around the world. Here, we present data from a new glacier inventory for two points in time (2000, 2020) covering the entire Greater Caucasus (Georgia, Russia, and Azerbaijan). Satellite imagery (Landsat, Sentinel, SPOT) was used to conduct a remote-sensing survey of glacier change. The 30 m resolution Advanced Spaceborne Thermal Emission and Reflection Radiometer Global Digital Elevation Model (ASTER GDEM; 17 November 2011) was used to determine aspect, slope, and elevations, for all glaciers. Glacier margins were mapped manually and reveal that in 2000 the mountain range contained 2186 glaciers with a total glacier area of 1381.5 ± 58.2 km2. By 2020, the area had decreased to 1060.9 ± 33.6 km2 a reduction of 23.2 ± 3.8 % (320.6 ± 45.9 km2) or −1.16 % yr−1 over the last 20 years in the Greater Caucasus. Of the 2223 glaciers, 14 have an area > 10 km2, resulting in the 221.9 km2 or 20.9 % of total glacier area in 2020. The Bezengi Glacier with an area of 39.4 ± 0.9 km2 was the largest glacier mapped in the 2020 database. Glaciers between 1.0 and 5.0 km2 accounted for 478.1 km2 or 34.6 % in total area in 2000, while they accounted for 354.0 km2 or 33.4 % in total area in 2020. The rates of area shrinkage and mean elevation vary between the northern and southern and between the western, central, and eastern Greater Caucasus. Area shrinkage is significantly stronger in the eastern Greater Caucasus (−1.82 % yr−1), where most glaciers are very small. The observed increased summer temperatures and decreased winter precipitation along with increased Saharan dust deposition might be responsible for the predominantly negative mass balances of Djankuat and Garabashi glaciers with long-term measurements. Both glacier inventories are available from the Global Land Ice Measurements from Space (GLIMS) database and can be used for future studies.
- Article
(21813 KB) - Full-text XML
- Companion paper
-
Supplement
(537 KB) - BibTeX
- EndNote


Glaciers are retreating and losing mass in most regions of the world, largely in response to the ongoing atmospheric warming (Hock et al., 2019; Zemp et al., 2019; Hugonnet et al., 2021). This knowledge can only be obtained when a baseline dataset (a glacier inventory) is available to calculate glacier-specific information. Complete and accurate glacier inventories also provide the information required for various hydrological and climate modelling applications (Vaughan et al., 2013) as well as change assessment. Accordingly, a frequent update of glacier inventories is required to reduce uncertainties in subsequent calculations (Paul et al., 2020). Updated glacier inventories are also critical to outline environmental policies for glacier protection and monitoring programmes, as well as for developing mitigation and adaptation strategies in response to the impact of climate changes on future glacier development (Pfeffer et al., 2014; Huss et al., 2017).
Glaciers are an important source of fresh water in countries of the Caucasus region, and runoff in large glacier-fed rivers supplies several hydroelectric power stations. They are also important reservoirs of water for the population living downstream, often providing meltwater during seasonal droughts. Furthermore, glaciers play a significant role in the economy of the Caucasus countries as a major tourist attraction with thousands of visitors each year. Finally, they are the source of or contribute to severe natural hazards in this region (complete detachment of ice and rock, glacier surging, glacier lake outburst floods) (Evans et al., 2009; Chernomorets et al., 2018; Tielidze et al., 2019), requiring a good understanding of related processes to reduce the impact of future events on human well-being. Thus, the comprehensive study of the Caucasus glaciers is crucial for the scientific study of climate change impacts but also for societal applications or sustainable regional development.
Glaciers of the Greater Caucasus started decreasing from their Little Ice Age (LIA) maximum extent in the first half of 19th century (Solomina, 2016; Tielidze et al., 2020a), reaching the highest decrease rates (∼ 0.5 % yr−1) over the past decades (Shahgedanova et al., 2014; Tielidze and Wheate, 2018). A continued decrease in Caucasus glaciers could also lead to considerable changes in glacier runoff, with implications for regional water resources. Therefore, continued glacier inventorying across this region is essential. This will also potentially reduce the uncertainties for further climatic and hydrological modelling in this region as consistent multi-temporal glacier outlines are a key input for calibration and/or validation of glacier evolution models.
In this study we present two new glacier inventories (from 2000 and 2020) for the Greater Caucasus region derived from multi-temporal optical satellite images (Landsat, Sentinel-2, SPOT 6/7) in combination with digital elevation models (DEMs) along with the observed changes. We also compare the new inventories with those already available from public databases such as the Global Land Ice Measurements from Space (GLIMS) and version 6 of the Randolph Glacier Inventory (RGIv6) and highlight the related improvements.
The year 2000 inventory was compiled following the demand for creating improved glacier outlines as close as possible to that year for version 7 of the RGI. It was created because satellite images with the required quality were available from Landsat 5 and 7. The year 2020 inventory was created to also test the improved quality of the 10 m resolution Sentinel-2 data and compare results against even higher-resolution data from SPOT6/7 and Google Earth.
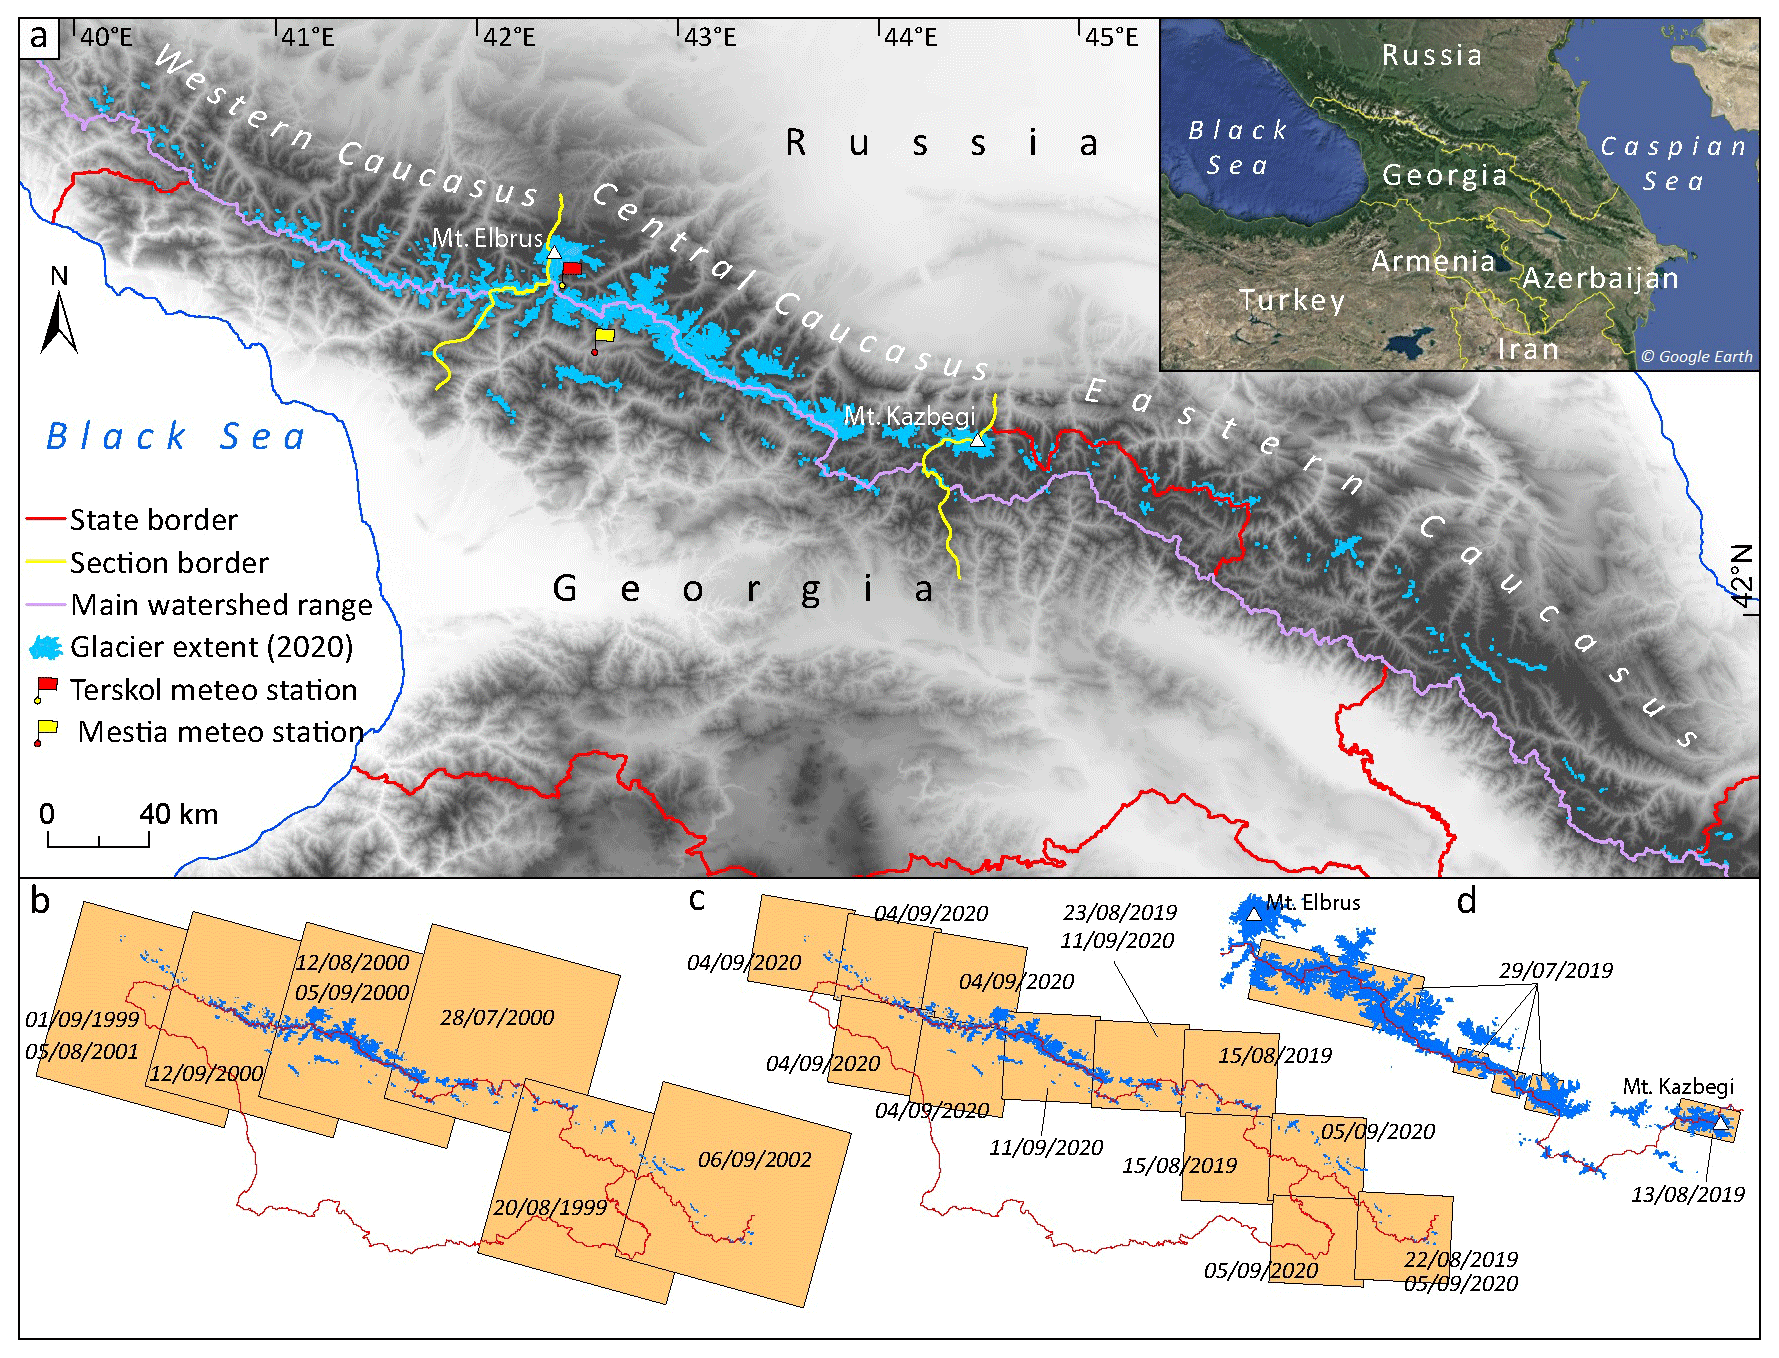
Figure 1(a) The extent of modern glaciers in the Greater Caucasus. (b) Landsat 5 TM and Landsat 7 ETM+ satellite scenes from 1999–2002. (c) Sentinel-2 satellite scenes from 2019–2020. (d) SPOT 6/7 satellite scenes from 2019. The insert map in the upper right shows the location of the Caucasus region (© Google Earth).
2.1 General characteristics
The Greater Caucasus mountain range is situated between the Black and Caspian seas and stretches for about 1300 km from west-northwest to east-southeast. Its width ranges from 30 to 180 km. The average elevation for its western, central, and eastern sectors is 3200, 4100, and 3700 m, respectively, with the highest point being Mt. Elbrus (5642 m). The highest central sector is situated between Mt. Elbrus and Mt. Kazbegi (5047 m), with at least five other peaks exceeding 5000 (Fig. 1). Almost 70 % of the Caucasus glaciers are situated in the central section. About 13.4 % of the surface area of 659 glaciers was covered by debris in 2014 (Tielidze et al., 2020b).
The Greater Caucasus is in the path of the Mediterranean and Atlantic cyclones, which carry moisture from the west and southwest. The maximum amount of precipitation falls in the southern slope of the western region, with annual precipitation of about 3200 mm. This amount declines to 2000 mm in the central section and to 1000 mm in the eastern part (Volodicheva, 2002). The mean annual temperatures at the southern slopes are usually 1–2 ∘C higher than those in the north (Tielidze and Wheate, 2018). At the mean elevation of glaciers (around 3400 ), they are around −5.0 ∘C (Kutuzov et al., 2016; Tielidze, 2016). The average regional lapse rate has a maximum in summer (−5.2 ∘C per km) and a minimum in winter (−2.3 ∘C per km) (Kozachek et al., 2017).
2.2 Previous studies
The Caucasus is one of the most studied glacierized regions in the world. The first information about glaciers dates back to the 18th and 19th centuries (Kotlyakov et al., 2015; Tielidze, 2016). The first inventory of the Caucasus glaciers was published at the beginning of the 20th century (Podozerskiy, 1911). This was the result of the compilation of a topographic map, which was carried out by military topographers from 1881 to 1910 (1329 glaciers, with a total area of 1967.4 km2). Based on the same maps and in situ measurement, Reinhardt (1916) determined a summer snowline elevation at ∼ 3100 in the Georgian Caucasus.
The second inventory of the Caucasus glaciers was initiated within the framework of the International Hydrological Decade (1965–1975) (Catalog of Glaciers of the USSR, 1967–1978; Vinogadov et al., 1978). This inventory was created based on aerial photographs from 1955–1960, topographic maps from 1960s, and data from field observations. The inventory does not contain digital outlines of glaciers but includes only tables with glacier parameters (2002 glaciers, with a total area of 1421.78 km2). Based on the same aerial imagery and topographic maps, the elevation of summer snowline increased from about 2600 (western section) to 3600 (eastern section). On the Elbrus Massif the snowline reached 3800 (World Atlas of Snow and Ice Resources, 1977). At the same time, the snowline for the Georgian Caucasus was measured at ∼3270 , with the highest values (∼3470 ) in the eastern Georgian Caucasus (Gobejishvili, 1995; Tielidze, 2017).
The state of the Caucasus glaciers was determined within the framework of the Global Land Ice Measurements from Space (GLIMS) initiative using the ASTER and Landsat (1999–2004) satellite images (Khromova et al., 2016). The number and area of glaciers were calculated only for 21 river basins (out of 53), and an incomplete but first digital database was created for the southern and northern slopes of the Greater Caucasus (1706 glaciers, with a total area of 1174.52 km2). This database was later also used for version 6 of the Randolph Glacier Inventory (RGIv6) that incorporated nominal glaciers (circles covering an area equivalent to glacier size) in the eastern and western Caucasus sections (Tielidze and Wheate, 2018) from the World Glacier Inventory – Extended Format (WGI-XF; Cogley, 2009).
Recently, an updated and expanded glacier inventory covering the entire Greater Caucasus was compiled by Tielidze and Wheate (2018). The authors used large-scale topographic maps and satellite imagery (Corona, Landsat 5, Landsat 8, and ASTER) to conduct a remote-sensing survey of glacier change for three time periods (1960, 1986, 2014), with a total glacier area of 1193.2 ± 54.0 km2 in 2014.

Figure 2(a) Three glaciers shown on the Landsat scene (28 July 2000), which were later selected for multiple digitizing. An example of multiple digitizing based on the imagery from the same year – (b) Sentinel-2 23 August 2019, (c) SPOT 13 August 2019, and (d) Google Earth 14 September 2019. Image credits: (a) https://earthexplorer.usgs.gov (last access: November 2020), (b) Copernicus Sentinel data 2019, (c) Azercosmos satellite data, (d) © Google Earth 2022.
We processed eight Landsat 5 Thematic Mapper (TM) and Landsat 7 Enhanced Thematic Mapper Plus (ETM+) scenes from 1999–2002 along with nine Sentinel-2 and five SPOT 6/7 scenes from 2019–2020 to cover the entire study region in both periods (Fig. 1, Table S1 in the Supplement). In addition, high-resolution QuickBird images (2019) superimposed upon the SRTM3 topography (Raup et al., 2014) were used through to the Google Earth. All the Landsat and Sentinel scenes were downloaded from EarthExplorer (http://earthexplorer.usgs.gov) (last access: November 2020), while the orthorectified high-resolution (spatial resolution 1.5 m) SPOT scenes were received from Azercosmos (https://azercosmos.az/, last access: November 2020). The Sentinel scenes served as a basis for glacier mapping, while the Google Earth and SPOT scenes were used for correction of glacier outlines and comparison of manually mapped glacier margins to those of Sentinel-2 scenes from the same year (Fig. 2) (see also Sect. 4.1). All images were acquired at the end of the ablation season, ranging from 28 July to 12 September, when glaciers were mostly free of seasonal snow under cloud-free conditions. In the case of local clouds, shadow, or snow cover, a few additional scenes from the same period were used to correctly digitize glacier outlines.
We used false-colour composites for each Landsat acquisition date, combining the shortwave infrared (SWIR), near-infrared (NIR), and red bands as RGB. The panchromatic band (15 m resolution) from Landsat 7 ETM+ was also used for better identification of glacier extents. For Sentinel-2, the colour composites were created from 10 m resolution visible and near-infrared band composites, resulting in much higher quality outlines than those derived from the Landsat scenes. The 20 m resolution SWIR band (11) was bilinearly resampled to 10 m resolution to obtain glacier outlines at this resolution automatically (e.g. Paul et al., 2020).
The ASTER Global Digital Elevation Model (GDEM, 17 November 2011) version 3 was used to determine topographic details such as aspect, slope, and elevation distribution of glaciers. The DEM was downloaded from NASA LP DAAC Collections (http://earthexplorer.usgs.gov/, last access: November 2020).

Figure 3(a) Selected glaciers for multiple digitizing based on Landsat 5 TM scene (12 August 2000). (b) Manually mapped debris-free glacier outline with a half-pixel (15 m) buffer interval. (c) Manually mapped debris-covered glacier outline with a two-pixel (60 m) buffer interval (light blue). Image credit: (a) https://earthexplorer.usgs.gov (last access: November 2020).
4.1 Glacier mapping
Glacier boundaries have been manually delineated from our study area. This mapping method is well adopted for the Caucasus region (e.g. Shahgedanova et al., 2014; Tielidze, 2016; Tielidze and Wheate, 2018) despite some advantages of the automated mapping method of clean ice (Paul et al., 2013). This decision was made due to the significant amount of debris-covered glaciers in this region (Tielidze et al., 2020b) as well as deep shadows where automated mapping often fails and manual corrections are required (Paul et al., 2013). Moreover, seasonal snow off glaciers was present in several scenes, and instead of removing them after an automated classification they were just not digitized. We acknowledge that identification of such non-glacier snow patches was sometimes difficult and is a highly subjective process. As a guide, we excluded snow-only features and those with a complex perimeter. This was facilitated by local experience and using the outlines of the previous glacier inventory (Tielidze and Wheate, 2018). The size of the smallest glacier included was finally restricted to 0.01 km2. Glacier length was measured from changes of a centre line (Paul and Svoboda, 2009).
Estimation of the glacier mapping uncertainty is necessary to assess the significance of derived glacier changes and avoid misinterpretation of mapping. For this purpose, first we tested multiple digitization as a supplementary tool for uncertainty assessment of glacier margin identification (Paul et al., 2013). A sub-sample of three glaciers from a high-resolution SPOT image with areas of 0.3–6.3 km2 were re-digitized by three different operators. The selected glaciers included Maili (42∘43′21′′ N, 44∘28′36′′ E), Chachi (42∘43′14′′ N, 44∘30′20′′ E), and G044493E42730N (GLIMS ID) (42∘43′41′′ N, 44∘29′40′′ E). All outlines obtained from the SPOT image (13 August 2019), along with original (basic) outlines obtained from the Sentinel image (23 August 2019), were then exported to Google Earth (14 September 2019) for comparison and visual inspection (Fig. 2b–d). The uncertainty for two debris-free glaciers (Chachi and G044493E42730N) based on normalized standard deviation (NSD – delineations by multiple digitalization divided by the mean glacier area for all outlines) was small at 1.8 % while the one debris-covered glacier (Maili) showed a much higher uncertainty at 5.1 %. The average uncertainty between the two datasets was calculated as 3.5 %. A similar approach was used for glaciers ranging from 0.4 to 6.1 km2 from the Landsat imagery. The selected glaciers included Kirtisho (42∘49′52′′ N, 43∘35′37′′ E), Bartuy (42∘49′54′′ N, 43∘37′33′′ E), Khvargula (42∘48′12′′ N, 43∘37′29′′ E), and four relatively small neighbouring glaciers. The mapping uncertainty for debris-free glaciers was 2.1 %, while it was 6.7 % for debris-covered glaciers and 4.4 % for all glaciers of this sample (Fig. 3).
Table 1The Greater Caucasus glacier count and area change in 2000–2020 by country.

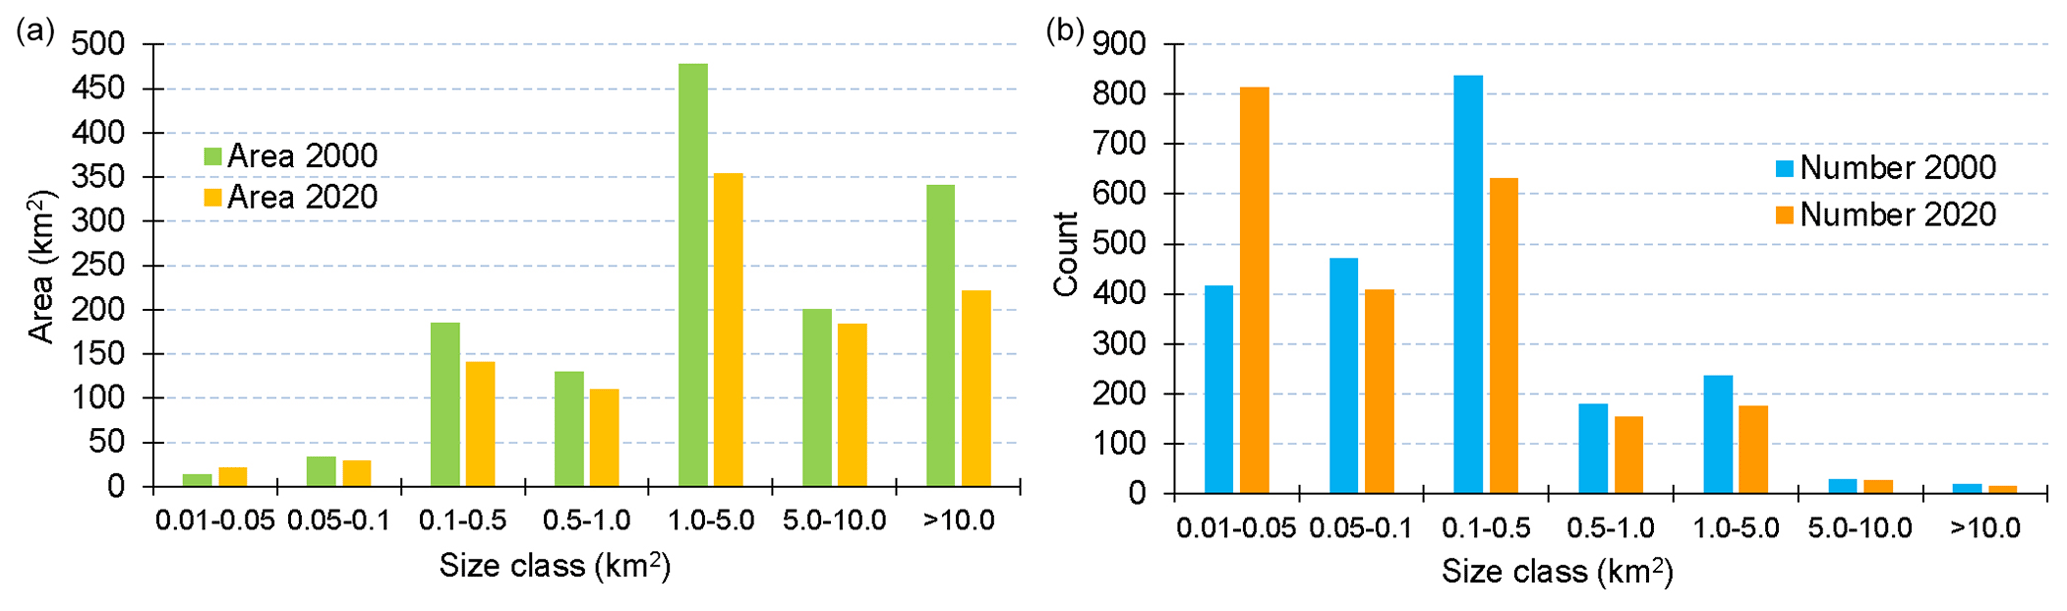
Figure 4Relative frequency histograms for (a) glacier area and (b) count for the seven glacier size classes in the Greater Caucasus in 2000 and 2020.
We used the buffer method as a further tool of uncertainty estimation for the entire Greater Caucasus. A buffer was drawn around the glacier outlines using ArcGIS 10.6.1 software, as suggested by Granshaw and Fountain (2006). For the images of 2020 we used a buffer equal to the resolution of the Sentinel scenes (10 m) and a half-pixel-sized buffer (15 m) for the glacier outlines derived from Landsat images for 2000. The selected buffer size for Landsat scenes is based on a recent study from the Caucasus region (Tielidze et al., 2020b) while the Sentinel buffer was selected based on a study from the European Alps (Paul et al., 2020). We assume that the larger buffer should be used for debris-covered parts of the glaciers, due to their higher uncertainty (Tielidze et al., 2020b). However, we did not enforce this here, as the related calculations are computationally difficult and challenging (Mölg et al., 2018) and would still not reflect the real problem in debris identification (see Paul et al., 2020). Instead, we used buffer with a size of two pixels for debris-covered glaciers (e.g. Frey et al., 2012), resulting in an upper-bound value of the uncertainty (Paul et al., 2020) (Fig. 3). Overall, the mapping uncertainty of the total glacier area was calculated as ±33.6 km2 or (±3.2 %) for Sentinel data from 2020, which is comparable with our uncertainty estimate based on the multiple digitization method (±3.5 %). For Landsat data from 2000, the buffer uncertainty was calculated as ±58.2 km2 or ±4.3 %, again comparable with the multiple digitization method for Landsat imagery (±4.4 %). It was explored that the larger glacier outlines had smaller uncertainty than the small glaciers.
Other potential uncertainties were related to the interpretation and manual digitization of the glacier margins (e.g. seasonal snow, topographic shadows, and supraglacial debris). To reduce the effect of this uncertainty, local knowledge and outlines from a previous glacier inventory (Tielidze and Wheate, 2018) were used as a delineation reference source.
4.2 Terminus measurement
Changes in the glacier terminus are a delayed and filtered response to changes in climate and are thus widely used to demonstrate climate change impacts for a large public (Lea et al., 2014). Their interpretation in climatic terms is, however, challenging as glacier-specific characteristics (e.g. response times) have to be considered (Oerlemans, 2005). Front variation measurements were conducted by intersecting the glacier outlines for each date with the centre lines. Additionally, we measured the elevations of the point at the intersection to determine the change in elevation of the glacier fronts. Length change uncertainties for the related glaciers were calculated according to source image resolution following Hall et al. (2003).
Table 2Cumulative glacier area and count change for seven size classes in the Greater Caucasus by slope and section in 2000–2020. Bold numbers indicate the initial size class of glaciers in 2020 to fairly determine the decrease in area per size class between 2000 and 2020, while the other numbers show the absolute glacier area and count in 2020 by the same size classes (see also Fig. 9).
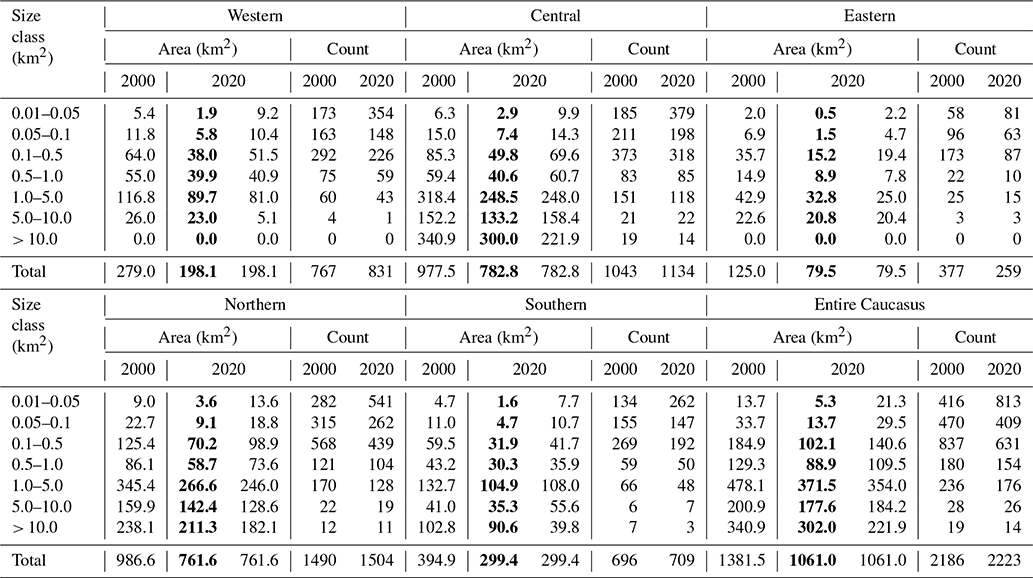
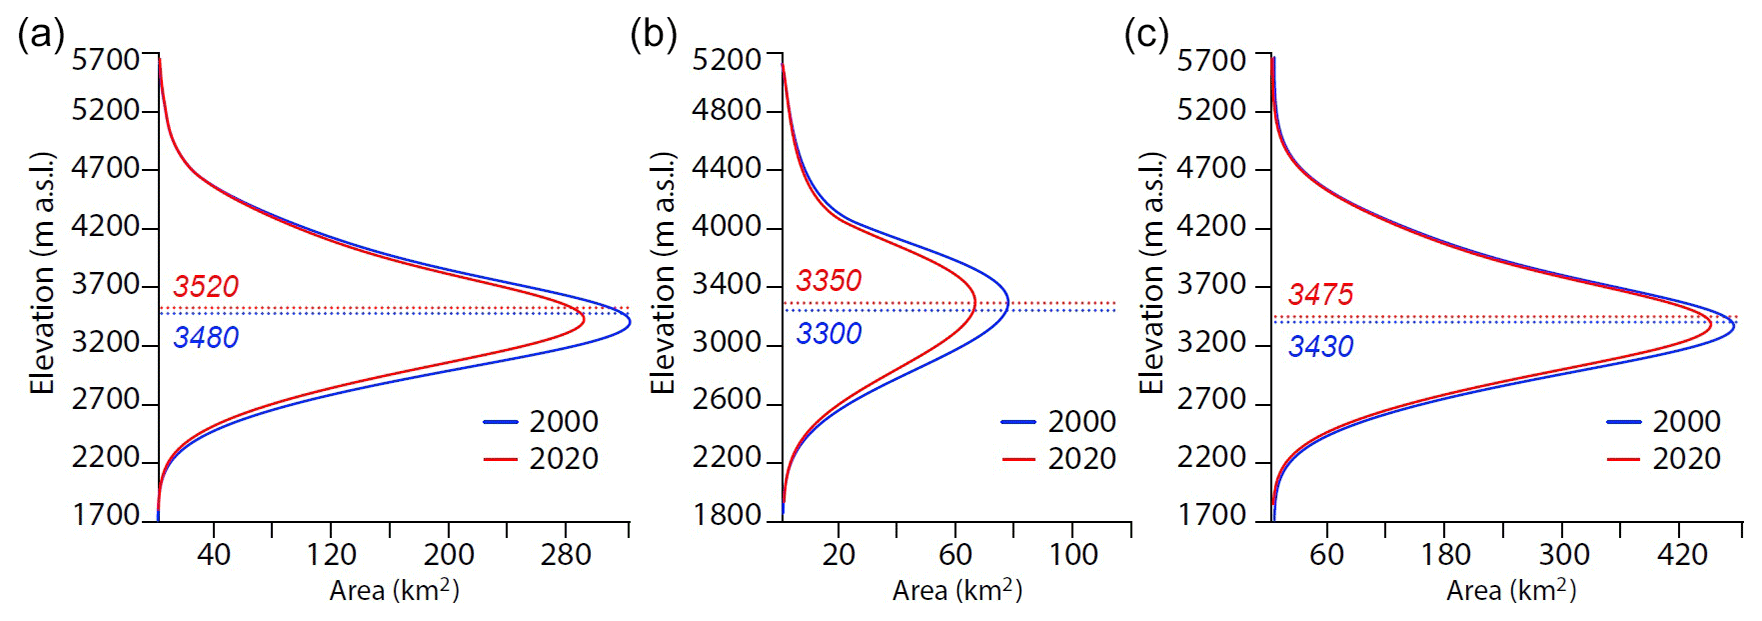
Figure 5The histogram of glacier area distribution along with mean elevation (dotted line) in 2000 and 2020 for (a) the northern, (b) the southern, and (c) the entire Greater Caucasus.
5.1 Glacier inventory 2000
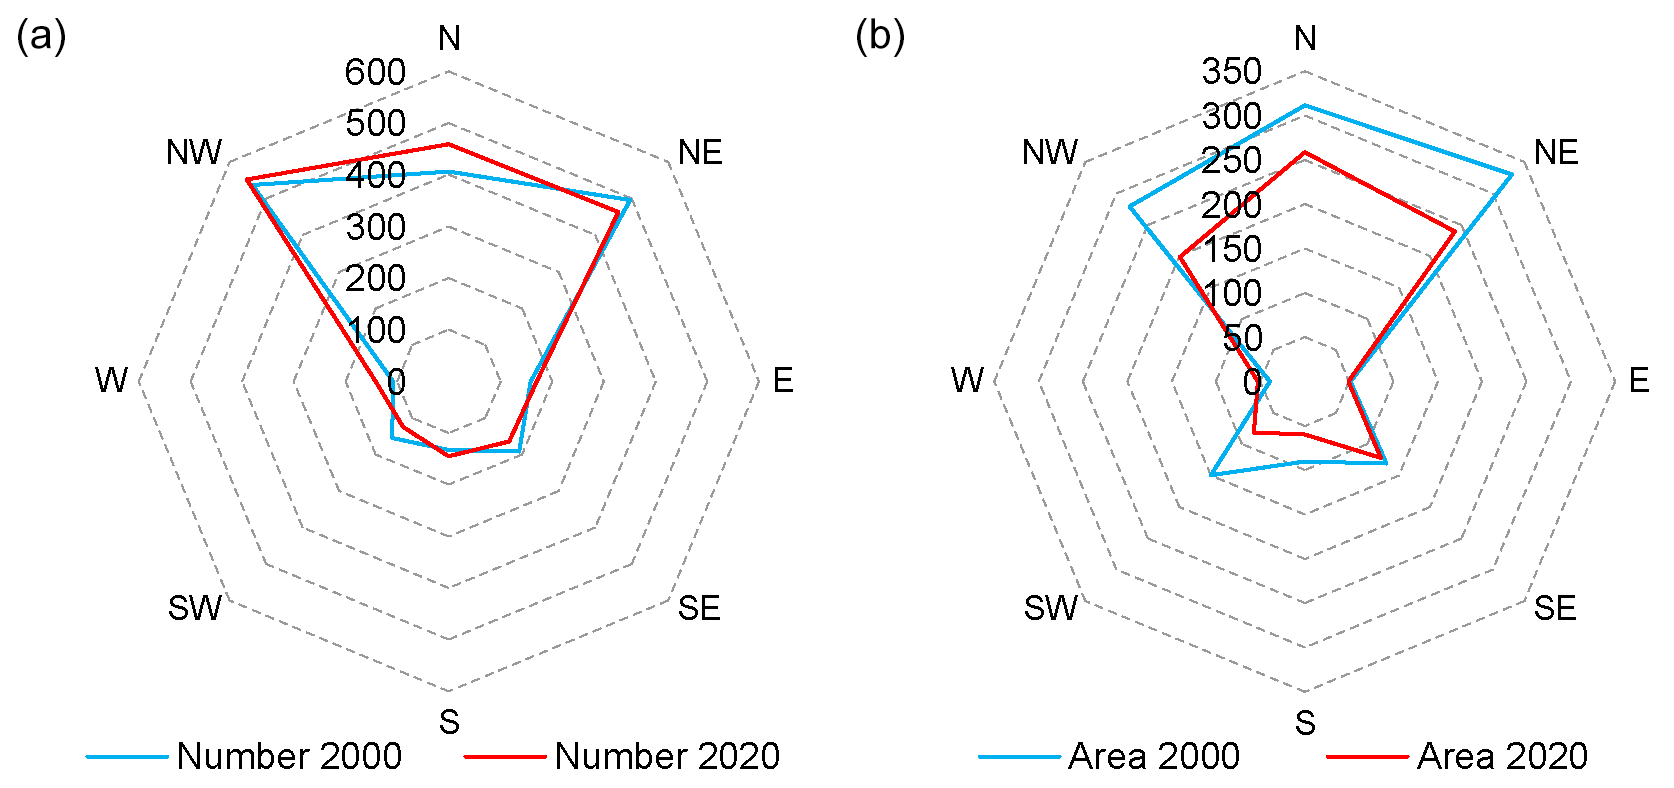
Based on Landsat data from 2000 we have identified and mapped 2186 glaciers larger than 0.01 km2 with a total area of 1381.5 ± 58.2 km2 from 53 river basins in the Greater Caucasus (Table S2 in the Supplement). From this, 931.6 ± 37.7 km2 or 67.4 % of the total glacier area was found in Russia, 446.6 ± 19.9 km2 or 32.3 % in Georgia, and 3.4 ± 0.3 km2 or 0.3 % in Azerbaijan (Table 1). The mean glacier size for the entire mountain region was 0.63 km2, and the glacier size class 1.0–5.0 km2 dominated with a total area of 478.1 km2 (Fig. 4a), which is 34.6 % of the total by area. The glacier size class 0.1–0.5 km2 had the most when counting by number (837 glaciers) in 2000 (Table 2, Fig. 4b). The pattern of size classes was different in the western Greater Caucasus compared to those in the central and eastern parts. The mean elevation of the glaciers ranged from 3300 (southern slope) to 3480 (northern slope), with an average of 3430 (Fig. 5). The number distribution by aspect showed that the glaciers were predominantly oriented towards the northwest (538 glaciers), while according to the area, the majority of the glaciers were oriented northeast (330.4 km2) (Fig. 6).
The total area of 20 glaciers from Elbrus Massif was mapped as 121.5 ± 2.2 km2 in 2000 (Fig. S1 in the Supplement). The three largest glaciers mapped from the Greater Caucasus based on Landsat imagery (2000) are Bezengi – 39.4 ± 0.9 km2 (43∘2′47′′ N, 43∘4′0′′ E), Dykhsu – 33.6 ± 0.9 km2 (42∘59′5′′ N, 43∘10′46′′ E) (Russia), and Lekhziri 32.8 ± 0.9 km2 (43∘9′26′′ N, 42∘45′54′′ E) (Georgia).
5.2 Glacier inventory 2020
Over the entire Greater Caucasus, the total glacier area mapped for 2020 is 1060.9 ± 33.6 km2 (2223 glaciers) (Table S2). From this, 719.4 ± 22.9 km2 (67.8 %) of glacier area is found in Russia, 340.8 ± 11.2 km2 (32.1 %) in Georgia, and 0.8 ± 0.04 km2 (0.1 %) in Azerbaijan (Table 1). Very small glaciers (0.01–0.5) dominate in terms of total number (749 glaciers), but the vast majority of the glacier area belongs to medium or 1.0–5.0 km2 (354.0 km2) and large or > 10.0 km2 glaciers (221.9 km2) (Table 2, Fig. 4b).
The mean elevation of the glaciers ranged from 3350 (southern slope) to 3520 (northern slope), with an average of 3475 (Fig. 5). Most of the glacier number (1476) and area (697 km2) in 2020 belong to north-facing glaciers (mean aspects N, NW, and NE), while relative area and number of E- and W-exposed glaciers are very small (Fig. 6).
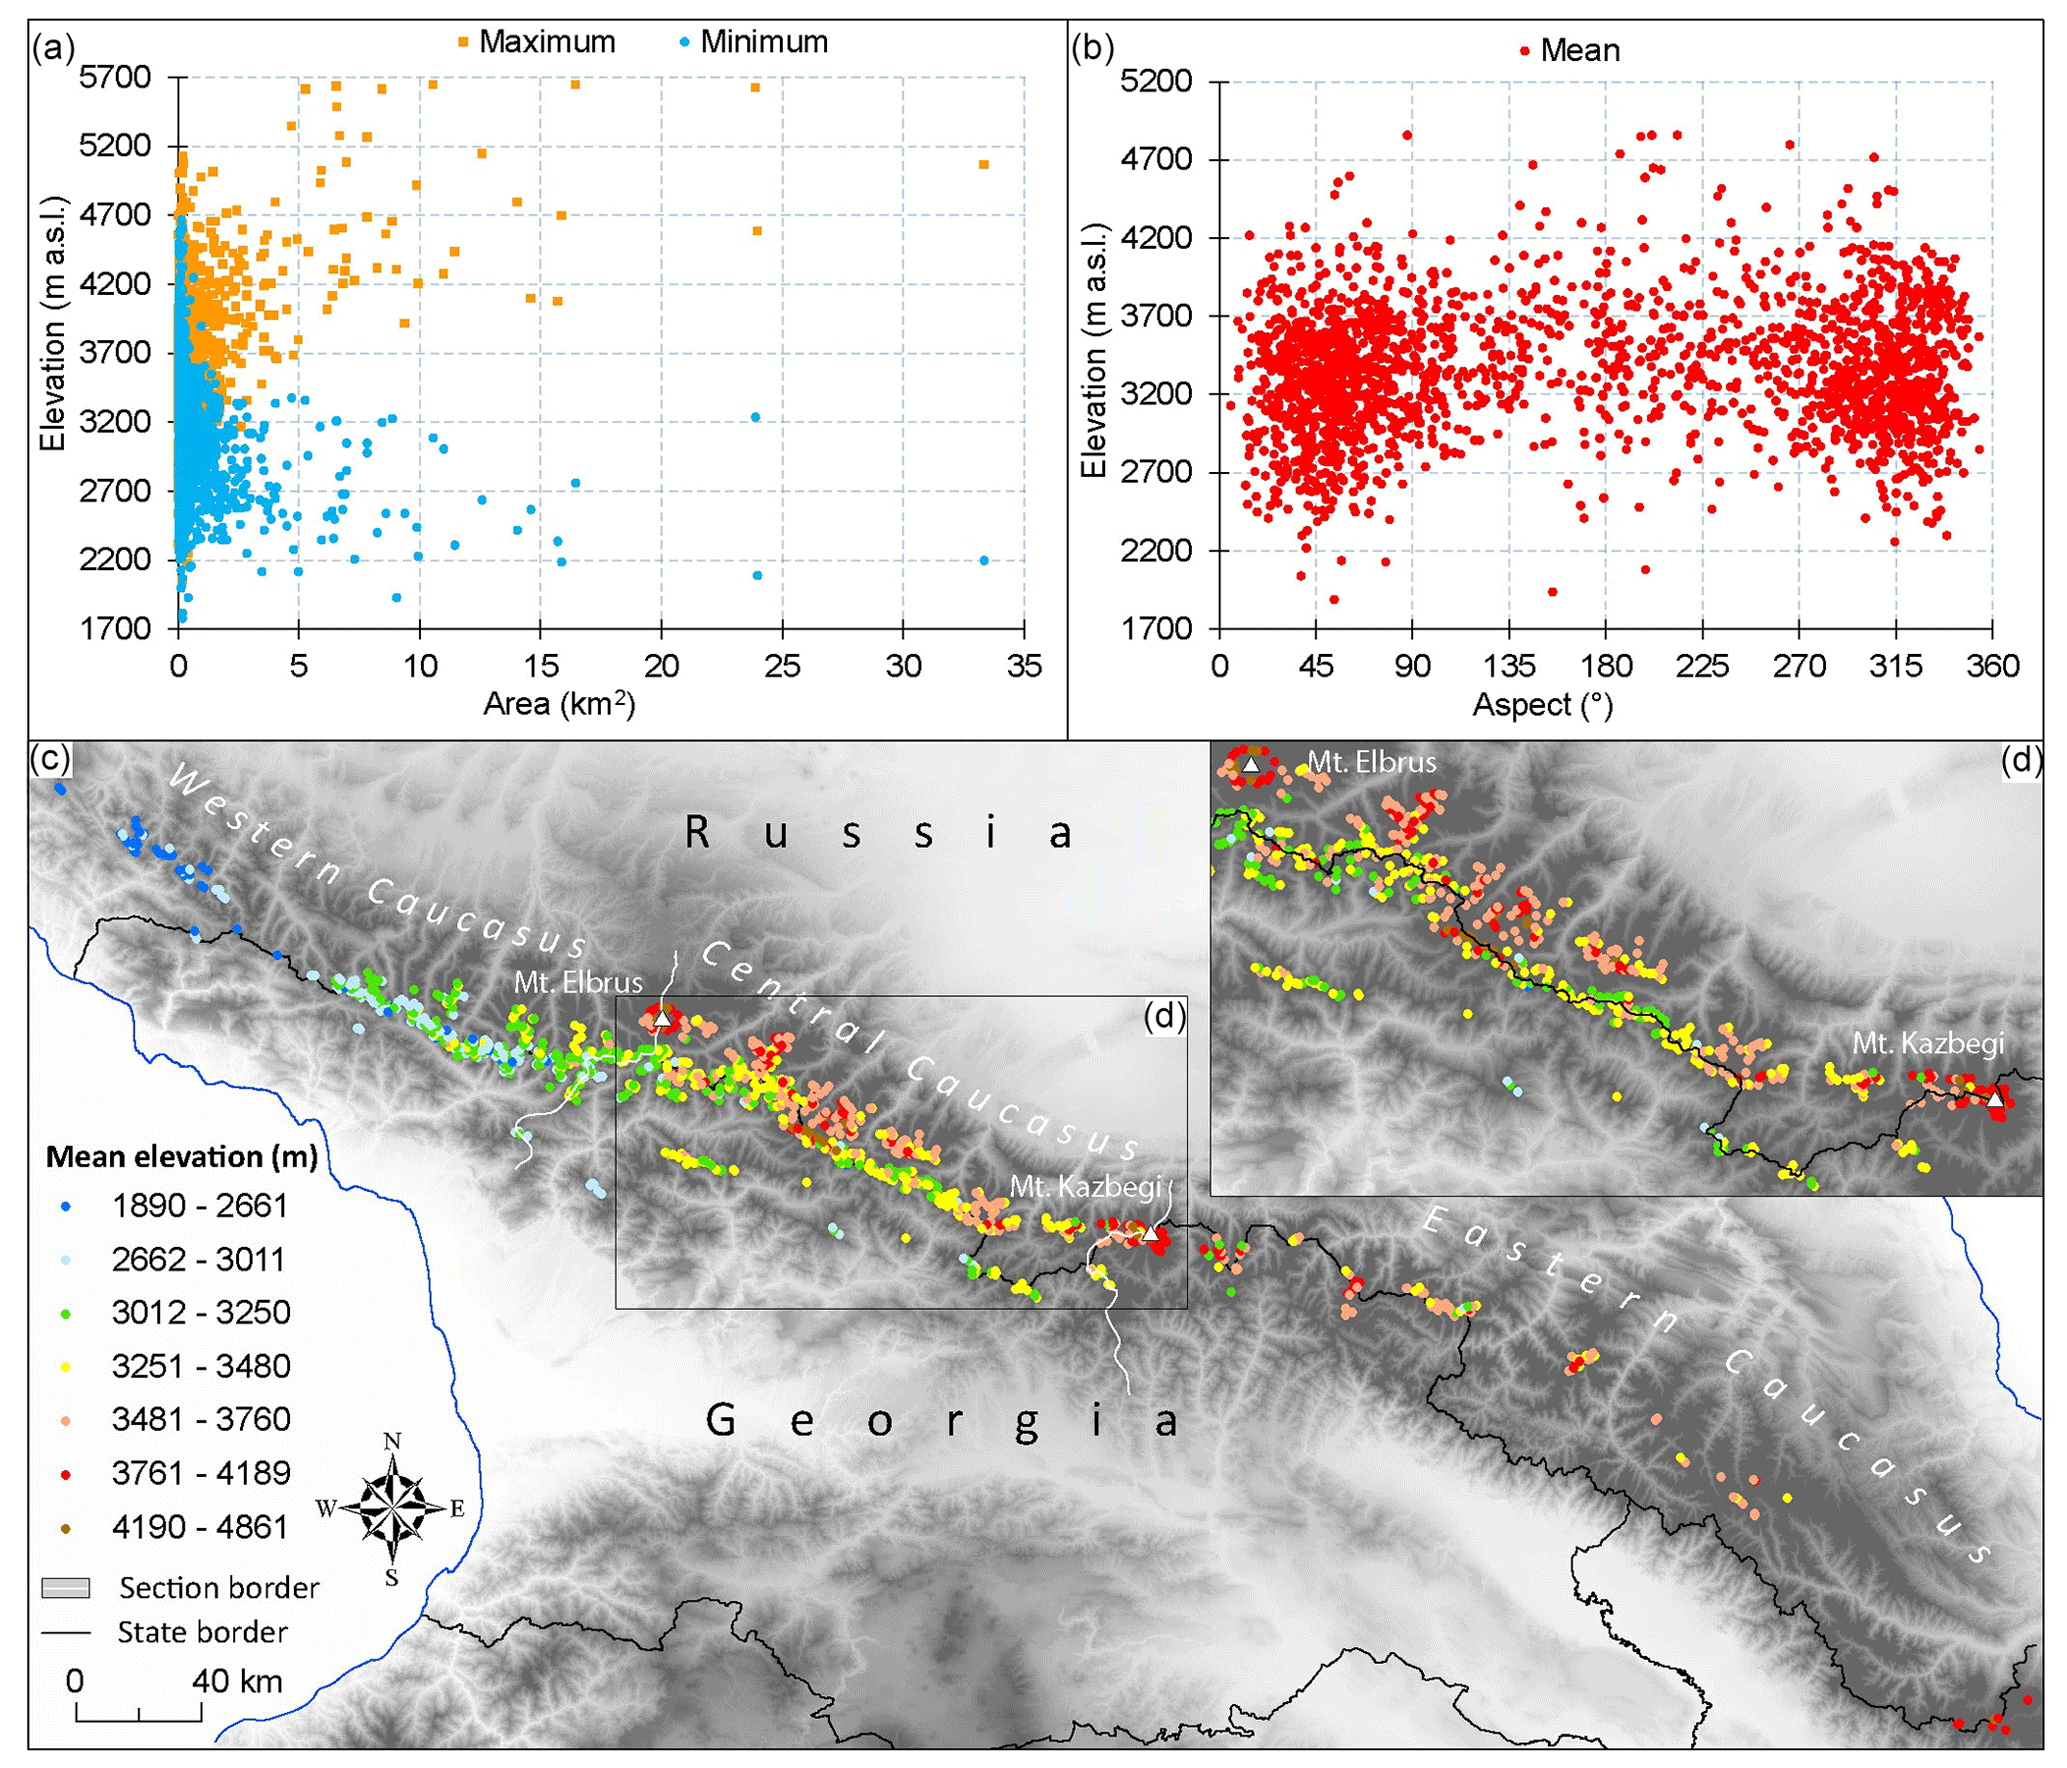
Figure 7(a) Glacier area vs. maximum and minimum elevation in 2020. (b) Glacier aspect vs. mean elevation in 2020. (c) Spatial distribution of mean elevation (colour-coded) for all glaciers in the Greater Caucasus larger than 0.1 km2 in 2020. (d) Close view of the central part of the Greater Caucasus.
The glacier termini are located around an average minimum elevation of 3159 m a.s.l while the average maximum elevation is 3561 Consequently, large valley glaciers have lower termini, while smaller glaciers have higher snout positions. All other topographic parameters (e.g. maximum, minimum, and mean elevations) depend on morphological type, aspect, and size class of the individual glaciers. Figure 7a and b show the glacier area distribution according to the maximum and minimum elevation and glacier aspect vs. mean elevation, while the colour-coded map at Fig. 7c shows spatial distribution of mean elevation for glaciers larger than 0.1 km2 in 2020.
In 2020, the Elbrus Massif had a total glacier area of 107.7 ± 1.6 km2 (Fig. S1). The three glaciers Bezengi (34.8 ± 0.8 km2), Karaugom (23.6 ± 0.3 km2), and Dzhikiugankez (19.4 ± 0.2 km2) are now the largest glaciers of the Greater Caucasus and are all located in Russia. Overall, there are 14 glaciers > 10 km2 in the Greater Caucasus with a total area of 221.9 km2. Three glaciers are situated in Georgia and 11 in Russia.
5.3 Glacier change in 2000–2020
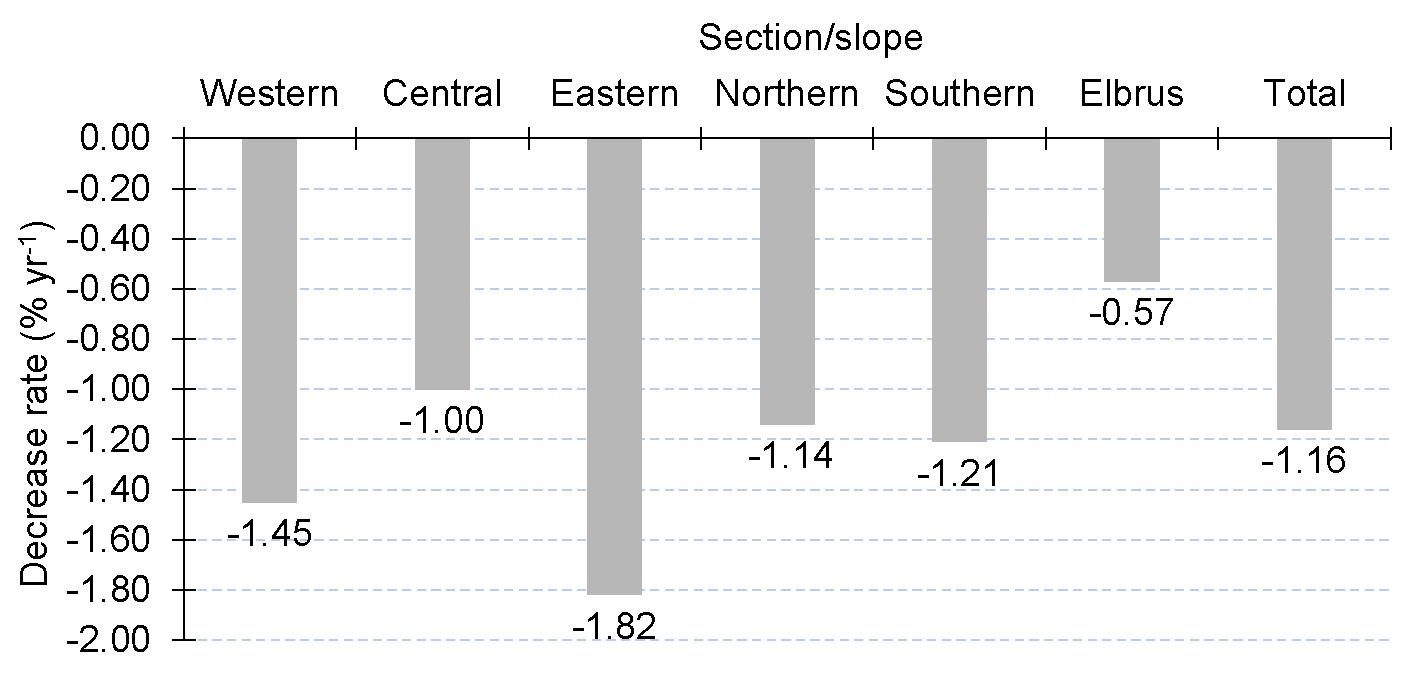
Results from our study on glacier area change indicate a significant decrease in the glaciers in the Greater Caucasus between 2000 and 2020 (Fig. 8). The total ice area loss between these two periods was 320.6 ± 45.9 km2 or 23.2 ± 3.8 % (−1.16 % yr−1). The eastern part experienced the highest absolute decrease of −1.82 % yr−1, while the Elbrus Massif experienced the lowest rate of −0.57 % yr−1. Compared to other sub-regions, the western region had also somewhat higher change rates (−1.45 % yr−1). The Elbrus Massif has the largest glacier mean area, changing from 6.07 km2 in 2000 to 3.98 km2 in 2020.
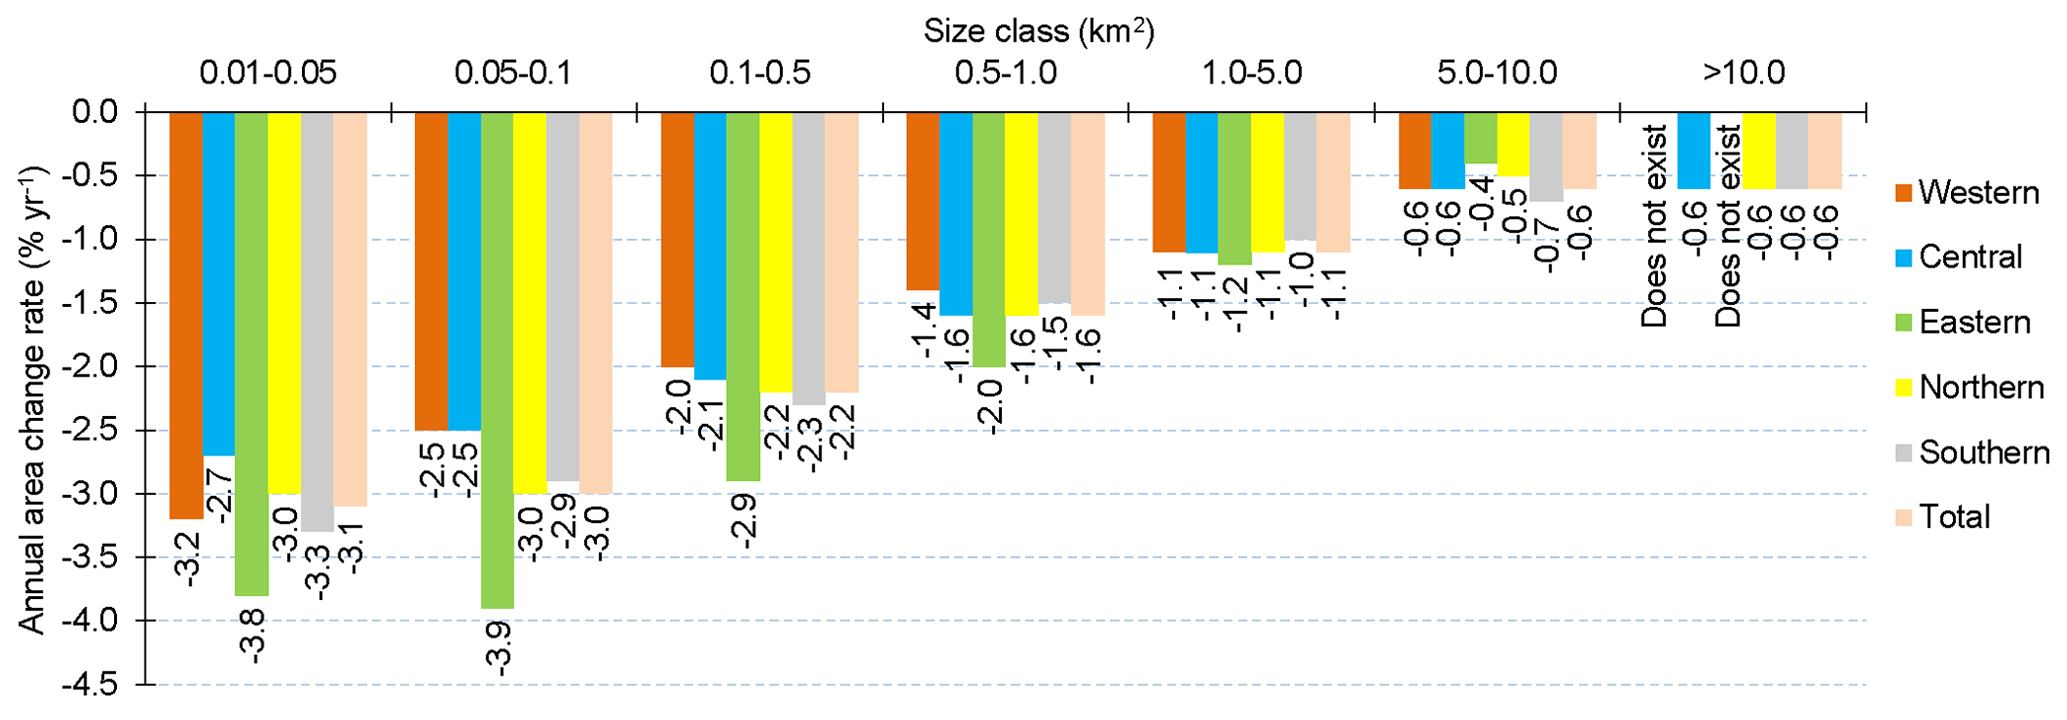
Figure 9Averaged annual area change rate (% yr−1) from 2000 to 2020 for the seven glacier size classes in all sections and slopes of the Greater Caucasus.
The smallest size classes of glaciers (0.01 to 0.1 km2) experienced the highest area loss rates across all regions, with maximum rates in the eastern Greater Caucasus (Table 2, Fig. 9). The 0.1–0.5 km2 size class also experienced high area loss rates (up to −2.9 % yr−1 in the eastern part). For the larger size classes (> 1.0 km2) the loss rates are smaller and more similar. The difference in the loss rate between northern and southern slopes is not significant. Overall and similar to most other regions in the world, the observed relative area loss rates decrease towards larger glaciers.
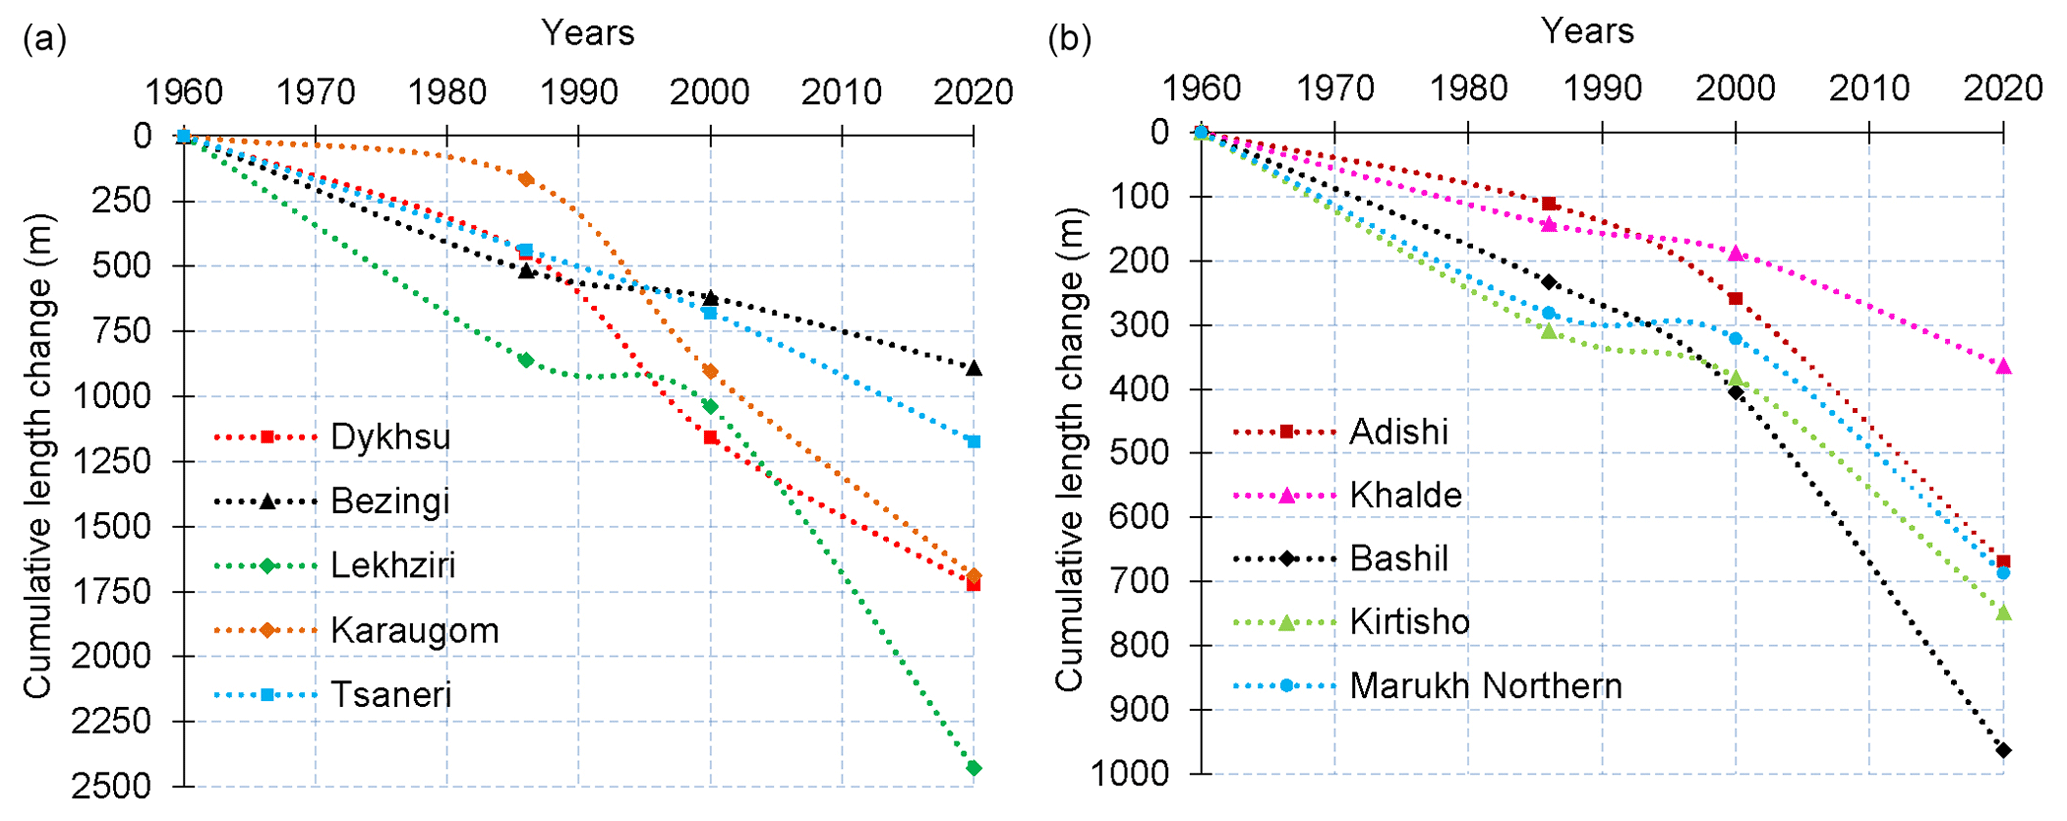
Figure 10Comparison of cumulative curves of terminus changes in 1960–2020: (a) for glaciers with size class > 10 km2 and (b) for glaciers with size class 5–10 and 1–5 km2. In both panels the dotted lines only connect the four measurement points. Data for 1960 and 1986 were taken from Tielidze and Wheate (2018).
From 16 selected glaciers (> 1 km2), the Lekhziri Glacier (43∘9′26′′ N, 42∘45′54′′ E) experienced the highest absolute retreat (1395 m or 69.8 m yr−1) between 2000 and 2020, when the annual retreat of Lekhziri Glacier was ∼ 33 m in 1960–1986 and ∼ 13 m in 1986–2000 (Fig. 10a, Table S3 in the Supplement). Relatively small glaciers (1–5 and 5–10 km2) also experienced higher terminus retreat over the last 20 years, compared to previous time periods (Fig. 10b, Table S3). The smallest retreat between 2000 and 2020 from the selected glaciers was observed for Dolra Glacier (43∘10′10′′ N, 42∘31′29′′ E) with 178 m or 8.9 m yr−1 (Table S3).
Table 3Glacier area and count changes in the Greater Caucasus according to different inventories from 1911 to 2020.
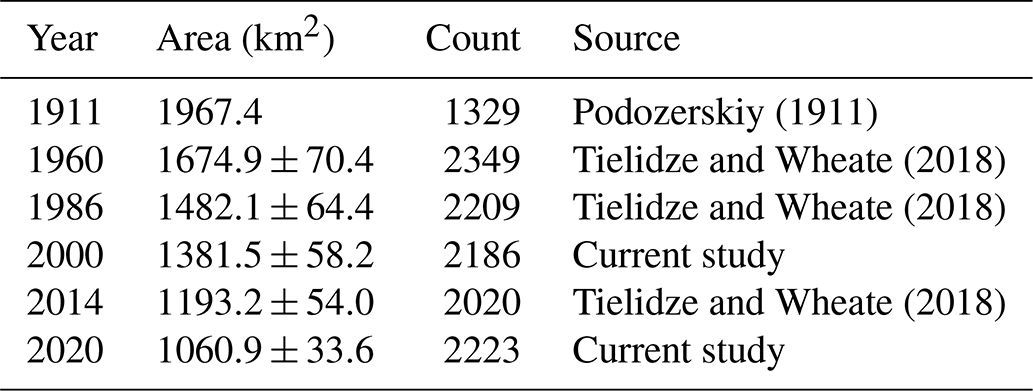
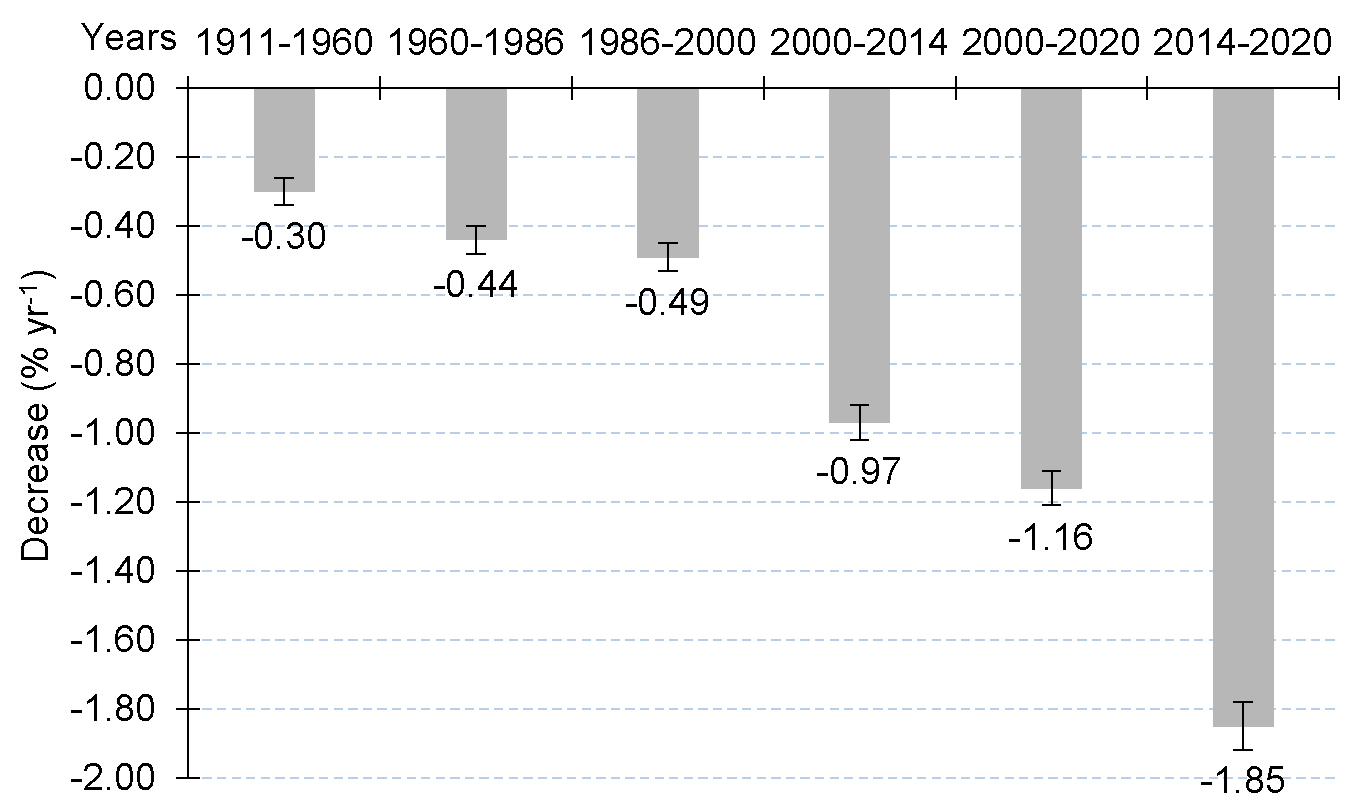
Figure 11Comparison of glacier area decrease rates in the Greater Caucasus for six different periods.
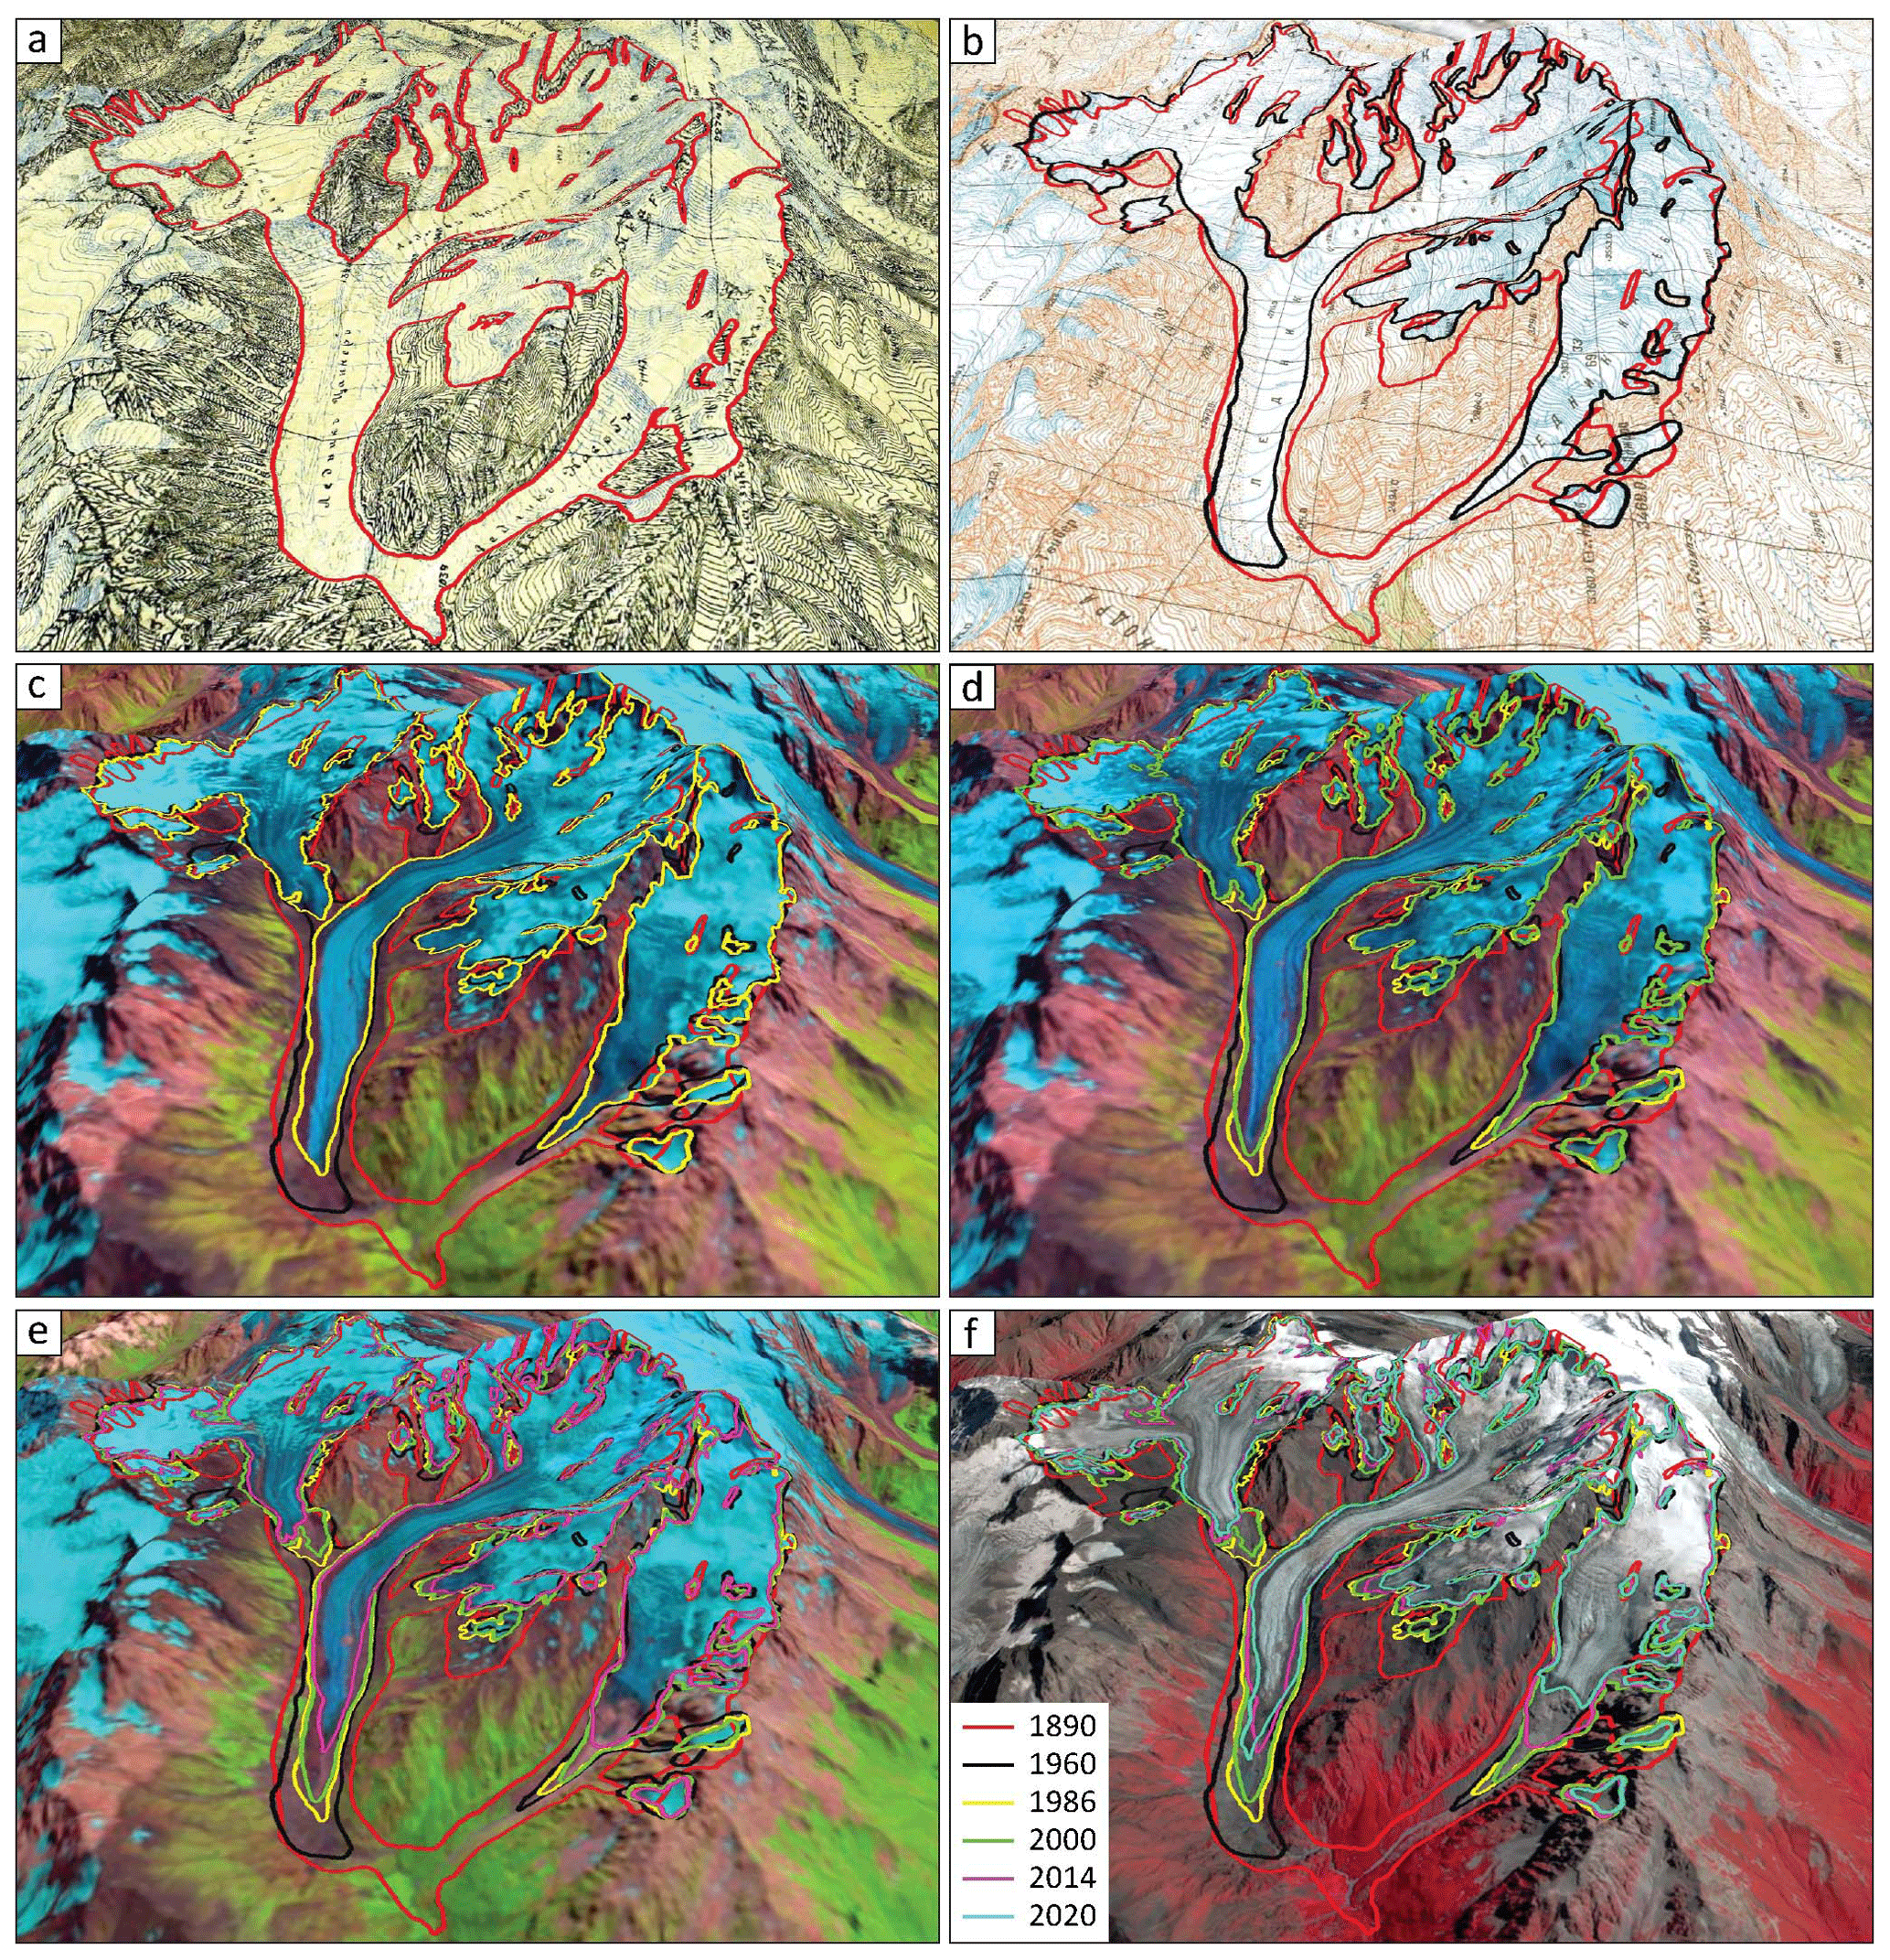
Figure 12An example of a century-long area changes of Tsaneri Glacier (43∘3′25.68′′ N 42∘59′1.92′′ E) in 1890 (topographical map – X14, 1:42 000) (a); 1960 (topographical map – k_38_27, 1:50 000) (b); 1986 (Landsat 5 TM – 6 August 1986) (c); 2000 (Landsat 7 ETM+ – 5 September 2000) (d); 2014 (Landsat 8 OLI – 3 August 2014) (e); and 2020 (Sentinel 2B – 11 September 2020) (f). Outlines for 1890–2014 were taken from Tielidze (2016). Image credits: Panels (c), (d), (e): https://earthexplorer.usgs.gov (last access: November 2020); (f) Copernicus Sentinel data 2020.
6.1 Comparison with previous investigations
In comparison to previous studies, our analysis reveals that the overall decline in glacier extent between 2000 and 2020 in the Greater Caucasus is 4 times higher than it was between 1911 and 1960, 3 times higher than it was between 1960 and 1986, and 2 times as high as it was from 1986 to 2000. An unprecedentedly higher decline was observed over the last 6 years, between 2014 and 2020 (Table 3; Figs. 11 and 12). Hence, our century-long comparison showed a clear decrease in glacier area in the entire region, which became much more pronounced over the last 20 years.
The observed glacier shrinkage in the Greater Caucasus from 2000 to 2020 (−1.16 % yr−1) is similar to in the European Alps where Paul et al. (2020) reported a −15 % (or −1.3 % yr−1) area reduction between 2003 and 2015/16. Direct comparisons with other glacierized regions are difficult because they are subject to different dynamics and size class distributions. Most of the related studies also cover different time periods. However, annual area loss rates larger than −1 % yr−1 over the past decades have been reported for several regions in the world (e.g. Liu et al., 2020; Miles et al., 2021).

Figure 13Comparison of glacier outlines from the RGI (v6) and GLIMS (in green) with the outlines from the new Caucasus glacier inventory (in yellow). (a) RGI nominal glaciers (circles) and glacier outlines derived during this study. The 28 July 2000 Landsat 7 image (Table S1) is used as the background. (b) The GLIMS outlines (an example of inconsistent registration) and glacier outlines derived during this study. The 12 August 2000 Landsat 5 image (Table S1) is used as the background. Image credit: https://earthexplorer.usgs.gov (last access: November 2020).
In comparison to existing glacier inventories, we found regionally large discrepancies that have now been corrected. The outlines included in the RGI v6 and GLIMS (2000) database were mostly created based on Landsat and ASTER imagery from 1999–2004 (Pfeffer et al., 2014; Khromova et al., 2009; Khromova et al., 2016). By detailed visual inspection, we found partly large differences between RGI v6, GLIMS (2000) outlines, and our database that was compiled using Landsat imagery from 2000. The RGI v6 contains nominal glaciers (circles) in the eastern and western Greater Caucasus, as well as the side ranges in the central Greater Caucasus that were replaced by real glacier outlines in our study (Fig. 13a). The GLIMS outlines also involve a horizontal geolocation shift (Fig. 13b), which appears to be associated with a shift in the ASTER images used (Tielidze and Wheate, 2018).
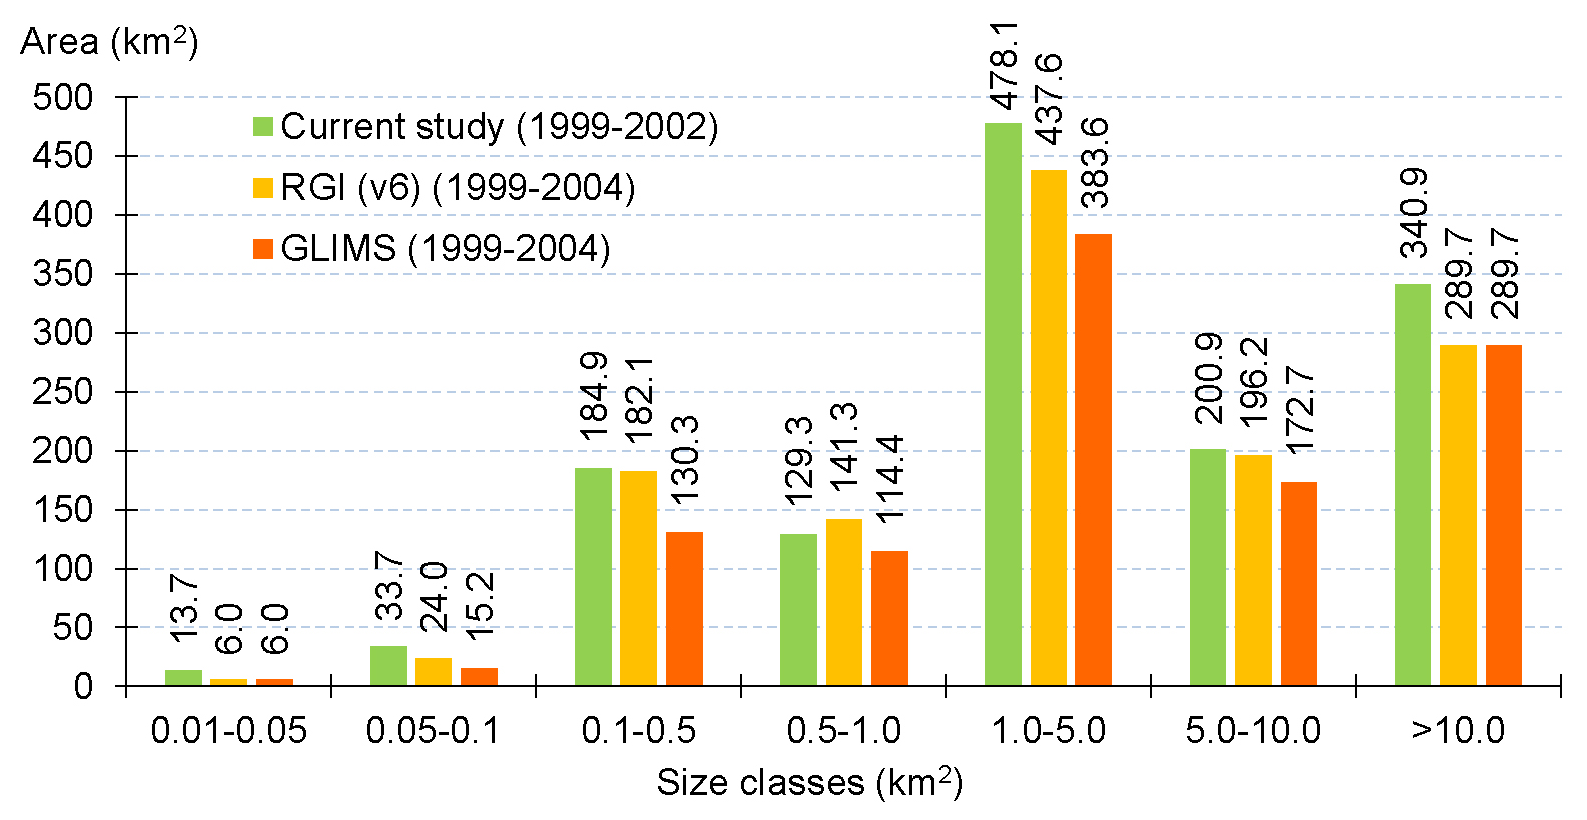
Figure 14Comparison of cumulative glacier areas sorted for seven size classes for the RGI (v6), GLIMS, and current glacier inventory from 2000.
The RGI v6 contains 1638 glacier outlines with a total area of 1276.9 km2. This is 548 fewer glaciers and ∼ 105 km2 (∼ 7.5 %) less glacier area than mapped for this inventory. The largest differences were found for glaciers in the size class 1–5 km2 (Fig. 14). The GLIMS database for the Caucasus region contains an even smaller number and area of glaciers than in the RGI (v6). In particular GLIMS does not contain the majority of glacier outlines from the eastern Greater Caucasus, resulting in 891 fewer glaciers and ∼ 270 km2 (∼ 19.5 %) less glacier area than in our new database.
6.2 Uncertainties and limitations
The uncertainty of the mapping was assessed by a comparison of glaciers derived from multiple digitizations by different operators and using the buffer method. The resulting average uncertainty was less than ∼ 5 % of the mapped area, confirming the uncertainty estimate for the entire Greater Caucasus based on the buffer method (∼ 4 %). The major sources of uncertainty include the correct interpretation of debris cover, seasonal snow, and shadows, which can all impede accurate glacier mapping. Using imagery from a different date and local knowledge, the debris cover and shadow error have been partly resolved for some glaciers; while incorrect identification of seasonal snow generally affects small glaciers more than larger ones, where possibly included snow fields do not make up a large percentage of the total area.
We have not analysed here the temporal evolution of debris-covered glacier parts, as this is considerable extra effort and because we wanted to keep this study focused on the new inventories and the change assessment. However, we intend to analyse changes in debris cover in a separate study that might also consider recently developed methods (Holobâcă et al., 2021).
We used the ASTER GDEMv3 from around 2010 to derive topographic information for each glacier, although it fits neither 2000 nor 2020. The simple reasons for this decision are larger artefacts found in the SRTM DEM from 2000 and that a year 2020 DEM was not available for the study region. Accordingly, for shrinking and retreating glaciers mean and median elevations are underestimated for 2000 and – along with minimum elevation – overestimated for 2020. We assume that the related biases are within the uncertainty of the GDEM for most glaciers, but we wanted to stress that they have to be considered when working with the data. Unfortunately, this caveat is common in most similar studies (e.g. Paul et al., 2020) as the repeat frequency of freely available DEMs is still small. The impact of the wrong DEM timing on mean slope and aspect should be negligible.
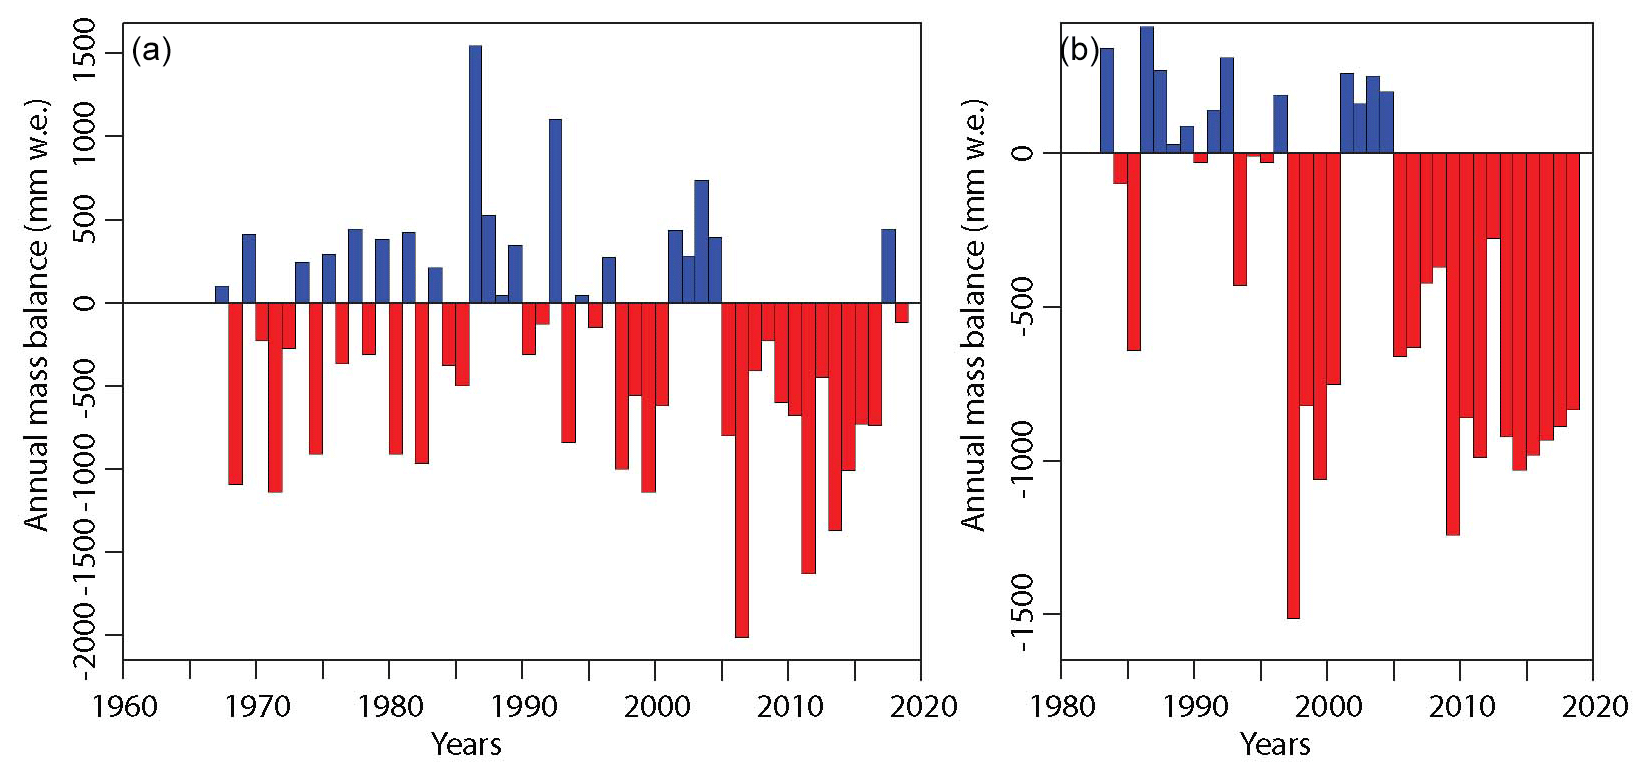
Figure 15Changes of mass balance of (a) Djankuat and (b) Garabashi glaciers in 1967–2019 and 1983–2019, respectively (WGMS, 2022).
6.3 Climatic and mass balance trends
Temperature data from Terskol meteorological station (northern Greater Caucasus – 43∘15′29′′ N, 42∘30′51′′ E) (Fig. 1) indicate annual air temperature increase by ∼ 1 ∘C (from 11.5 ∘C to 12.5 ∘C) during the summer period (June, July, August) in 2000–2019 in contrast to a decreasing trend in October–May precipitation at the same time (from ∼ 720 mm to ∼ 650 mm) (Rototaeva et al., 2019). Increased summer temperature was also observed at the Mestia meteorological station (southern Greater Caucasus – 43∘2′56′′ N, 42∘44′17′′ E) (Fig. 1) between 2000 and 2014 (Tielidze et al., 2020c). Furthermore, the extension of ablation season over the last 2 decades was confirmed by instrumental measurement from both the northern (Garabashi Glacier) and southern (Zopkhito and Chalaati glaciers) Greater Caucasus (Rototaeva et al., 2019; Tielidze et al., 2020c).
The increased temperatures are also reflected in mass balance observations of two WGMS reference glaciers in the Caucasus region such as Djakuat (43∘11′48′′ N, 42∘45′28′′ E) and Garabashi (43∘18′15′′ N, 42∘28′5′′ E). They both show strong negative mass balances between 2005 and 2019 (Kutuzov et al., 2019; Rets et al., 2019; WGMS, 2022), resulting in a much higher ice loss in this time period than accumulated before 2005 (Fig. 15). Furthermore, assessment of glacier mass changes in the Caucasus region using the geodetic method over the period 2000–2019 (Hugonnet et al., 2021; Tielidze et al., 2022) showed a 3-fold increase in the rate of glacier mass loss.
It might be possible that the increase in incoming short-wave solar radiation in the high Caucasus mountains observed since the 1980s (10 W m2 over 10 years) has played a significant role in the accelerated mass loss of glaciers in recent years. It has been proposed that this trend is associated with a weakening of the processes of formation of high and low clouds, which is due to an increase in the frequency of anticyclones in the warm season (Toropov et al., 2019). Moreover, a decrease in the albedo of the glacier surfaces due to an increase in the concentration of mineral particles can be another possible reason of amplified glacier mass loss. Two different pollution events (5 May 2009 and 23 March 2018) are especially noteworthy, when an extreme amount of dust from the Sahara was deposited on the Caucasus glaciers, which sharply changed the albedo and accelerated melting in the accumulation areas (Kutuzov et al., 2013; Dumont et al., 2020). Due to additional factors involved for area changes (response times, ice thickness distribution), we do not relate here the observed more negative mass balances with the increased area loss over the same time period. However, in particular for the thin ice near the glacier terminus, we cannot exclude that the strong recent mass loss also contributed to the increased area loss.
We have presented the new Caucasus glacier inventory derived from manual delineation of glacier outlines based on medium-resolution (Landsat, Sentinel) and high-resolution (SPOT) satellite imagery acquired around 2000 and 2020. Within the entire Greater Caucasus, the total glacierized area mapped for 2000 and 2020 is 1381.5 ± 58.2 and 1060.9 ± 33.6 km2, respectively, resulting in 23.2 ± 3.8 % (320.6 ± 45.9 km2) or −1.16 % yr−1 reduction in total glacier area over the last 20 years. Glaciers < 0.5 km2 contributed nearly 35 % to the total area loss but covered only 17 % of the total area (in 2000).
Glaciers in the western Greater Caucasus mostly have a lower mean elevation compared to glaciers in the central and eastern sections, indicating decreasing precipitation amounts from west to east. The highest area loss was observed in the eastern section, which is likely related to the decreasing glacier size to the east as relative area change rates increase towards smaller glaciers. The lowest decrease rate in the entire region was observed on the Elbrus Massif, which can be explained by the largest glacier area class dominating and maybe also an elevation that is sufficiently high to accumulate solid precipitation.
A century-long comparison with glacier areas mapped in previous inventories reveals a strong increase in area loss rates, nearly 4 times higher in 2000–2020 than it was between 1911 and 1960. Combined with the recent dominance of strongly negative mass balances, it can be expected that the Caucasus glaciers will continue to decline in the future under current climatic conditions.
With these two new glacier inventories for the Greater Caucasus, we have corrected errors in previously available datasets and hope that they will improve our understanding of climate change impacts at a regional scale and support related modelling studies by providing high-quality validation data.
The data include glacier outlines from a new glacier inventory for two points in time (2000, 2020) covering the entire Greater Caucasus (Georgia, Russia, and Azerbaijan) and can be accessed at https://doi.org/10.5281/zenodo.5116329 (Tielidze et al., 2021a) and https://www.glims.org/maps/glims (Tielidze et al., 2021b).
The new Caucasus glacier inventory includes Table S1 – satellite images and digital elevation models used in this study, Table S2 – the Greater Caucasus glacier number and area change in 2000–2020 by individual river basins, Table S3 – characteristics of glaciers used for measuring length change, and Fig. S1 – glacier area changes for Elbrus Massif in 2000–2020. The supplement related to this article is available online at: https://doi.org/10.5194/tc-16-489-2022-supplement.
LGT designed the conceptual framework for the study, mapped glacier outlines, and wrote the paper based on input and feedback from all co-authors. GAN reviewed glacier outlines (2020) and contributed to the discussion and data analysis. TEK contributed to the introduction, study area, and previous studies. FP reviewed glacier outlines (2000) and contributed to data analysis and writing of the manuscript.
The contact author has declared that neither they nor their co-authors have any competing interests.
Publisher's note: Copernicus Publications remains neutral with regard to jurisdictional claims in published maps and institutional affiliations.
We gratefully acknowledge the support of the editor, Chris R. Stokes, and two reviewers, Rakesh Bhambri and the anonymous referee, for useful suggestions and detailed comments which clearly enhanced the quality of the paper. We thank Eldaniz Aliyev and Azercosmos for providing the SPOT satellite images used in this study.
This study is financially supported by the French–Russian–Georgian collaborative project “DEGLaciation dans le grAnd Caucase DEGLAC” (IRP 00008 Deglac) (principal investigator – Vincent Jomelli). Frank Paul acknowledges financial support from the ESA project Glaciers_cci (grant no. 4000127593/19/I-NB) and the Copernicus Climate Change Service (C3S) that is implemented by the European Centre for Medium-Range Weather Forecasts (ECMWF) on behalf of the European Commission. Gennady A. Nosenko and Tatiana E. Khromova's work was supported within the State Assignment Scientific Theme (no. 0148-2019-0004) of the Institute of Geography RAS.
This paper was edited by Chris R. Stokes and reviewed by Rakesh Bhambri and one anonymous referee.
Catalog of Glaciers of the USSR: Katalog Lednitov USSR, vol. 8–9, Gidrometeoizdat, Leningrad, 1967–1978.
Chernomorets, S. S., Petrakov, D. A., Aleynikov, A. A., Bekkiev, M. Y., Viskhadzhieva, K. S., Dokukin, M. D., Kalov, R. K., Kidyaeva, V. M., Krylenko, V. V., Krylenko, I. V., Krylenko, I. N., Rets, E. P., and Savernyuk, E. A., and Smirnov A. M.: The outburst of Bashkara glacier lake (Central Caucasus, Russia) on September 1, 2017, Earth's Cryosphere, XXII, 70–80, https://doi.org/10.21782/KZ1560-7496-2018-2(70-80), 2018.
Cogley, J. G.: A more complete version of the World Glacier Inventory, Ann. Glaciol., 50, 32–38, https://doi.org/10.3189/172756410790595859, 2009.
Dumont, M., Tuzet, F., Gascoin, S., Picard, G., Kutuzov, S., Lafaysse, M., Cluzet, B., Nheili, R., and Painter, T. H.: Accelerated snow melt in the Russian Caucasus mountains after the Saharan dust outbreak in March 2018, J. Geophys. Res.-Earth, 125, e2020JF005641, https://doi.org/10.1029/2020JF005641, 2020.
Evans, S. G, Tutubalina, O. V., Drobyshev, V. N., Chernomorets, S. S., McDougall, S., Petrakov, D. A., and Hungr, O.: Catastrophic detachment and high-velocity long-runout flow of Kolka Glacier, Caucasus Mountains, Russia in 2002, Geomorphology, 105, 314–321, https://doi.org/10.1016/j.geomorph.2008.10.008, 2009.
Frey, H., Paul, F., and Strozzi, T.: Compilation of a glacier inventory for the western Himalayas from satellite data: methods, challenges, and results, Remote Sens. Environ., 124, 832–843, https://doi.org/10.1016/j.rse.2012.06.020, 2012.
Gobejishvili, R. G.: Saqartvelos tanamedrove mkinvarebi da Evraziis mtebshi gamkinvarebis evolucia gvian Pleistocensa da Holocenshi (Present day glaciers of Georgia and evolution of glaciation in the mountains of Eurasia in late Pleistocene and Holocene), sadoqtoro disertacia, Doctoral thesis Published in Institute of Geography, Georgian National Academy of Sciences, Tbilisi, 320 pp., 1995.
Granshaw, F. D. and Fountain, A. G.: Glacier change (1958–1998) in the North Cascades National Park Complex, Washington, USA, J. Glaciol., 52, 251–256, https://doi.org/10.3189/172756506781828782, 2006.
Hall, D. K., Bayr, K. J., Schöner, W., Bindschadler, R. A., and Chien, J. Y. L.: Consideration of the errors inherent in mapping historical glacier positions in Austria from the ground and space (1893–2001), Remote. Sens. Environ., 86, 566–577, https://doi.org/10.1016/S0034-4257(03)00134-2), 2003.
Hock, R., Rasul, G., Adler, C., Cáceres, B., Gruber, S., Hirabayashi, Y., Jackson, M., Kääb, A., Kang, S., Kutuzov, S., Milner, A., Molau, U., Morin, S., Orlove, B., and Steltzer, H.: High Mountain Areas, in: IPCC Special Report on the Ocean and Cryosphere in a Changing Climate, edited by: Pörtner, H. O., Roberts, D. C., Masson-Delmotte, V., Zhai, P., Tignor, M., Poloczanska, E., Mintenbeck, K., Alegría, A., Nicolai, M., Okem, A., Petzold, J., Rama, B., and Weyer, N. M., 2019.
Holobâcă, I. H., Tielidze, L. G., Ivan, K., Elizbarashvili, M., Alexe, M., Germain, D., Petrescu, S. H., Pop. O. T., and Gaprindashvili, G.: Multi-sensor remote sensing to map glacier debris cover in the Greater Caucasus, Georgia, J. Glaciol., 67, 685–696, https://doi.org/10.1017/jog.2021.47, 2021.
Hugonnet, R., McNabb, R., Berthier, E., Menounos, B., Nuth, C., Girod, L., Farinotti, D., Huss, M., Dussaillant, I., Brun, F., and Kääb, A.: Accelerated global glacier mass loss in the early twenty-first century, Nature, 592, 726–731, https://doi.org/10.1038/s41586-021-03436-z, 2021.
Huss, M., Bookhagen, B., Huggel, C., Jacobsen, D., Bradley, R., Clague, J., Vuille, M., Buytaert, W., Cayan, D., Greenwood, G., Mark, B., Milner, A., Weingartner, R., and Winder, M.: Toward mountains without permanent snow and ice, Earths Future, 5, 418-435, https://doi.org/10.1002/2016EF000514, 2017.
Khromova, T., Nosenko, G., and Chernova L.: Mapping of glacier extent changes in the mountain regions using space images and glacier inventories, in: The 24th International Cartographic Conference, Santiago, Chile, 15–21 November, 6_2, 1–9, https://icaci.org/files/documents/ICC_proceedings/ICC2009/html/nonref/6_2.pdf (last access: February 2022), 2009.
Khromova T., Nosenko G., Muraviev A., Nikitin S., Chernova L. Zverkova N.: Chapter 2 – Mountain Area Glaciers of Russia in the 20th and the Beginning of the 21st Centuries. Developments in Earth Surface Processes, in: Mountain Ice and Water – Investigations of the Hydrologic Cycle in Alpine Environments, Vol. 21, edited by: Shroder, J. F. and Greenwood, G. B., 47–129, https://doi.org/10.1016/B978-0-444-63787-1.00002-0, Elsevier, 2016.
Kotlyakov, V. M., Khromova, T. E., Nosenko, G. A., Popova, V. V., Chernova, L. P., and Murav'ev A. Ya.: New Data on Current Changes in the Mountain Glaciers of Russia, Dokl. Earth Sci., 464, 1094–1100, https://doi.org/10.1134/S1028334X15100207, 2015.
Kozachek, A., Mikhalenko, V., Masson-Delmotte, V., Ekaykin, A., Ginot, P., Kutuzov, S., Legrand, M., Lipenkov, V., and Preunkert, S.: Large-scale drivers of Caucasus climate variability in meteorological records and Mt El'brus ice cores, Clim. Past, 13, 473–489, https://doi.org/10.5194/cp-13-473-2017, 2017.
Kutuzov, S., Shahgedanova, M., Mikhalenko, V., Ginot, P., Lavrentiev, I., and Kemp, S.: High-resolution provenance of desert dust deposited on Mt. Elbrus, Caucasus in 2009–2012 using snow pit and firn core records, The Cryosphere, 7, 1481–1498, https://doi.org/10.5194/tc-7-1481-2013, 2013.
Kutuzov, S., Lavrentiev, I., Smirnov, A., Nosenko, G., and Petrakov, D.: Volume Changes of Elbrus Glaciers From 1997 to 2017, Earth Sci., 7, 153, https://doi.org/10.3389/feart.2019.00153, 2019.
Kutuzov, S. S., Mikhalenko, V. N., Grachev, A. M., Ginot, P., Lavrentiev, I. I., Kozachek, A. V., Krupskaya, V. V., Ekaykin, A. A., Tielidze, L. G., and Toropov, P. A.: First geophysical and shallow ice core investigation of the Kazbek plateau glacier, Caucasus Mountains, Environ. Earth Sci., 75, 1488, https://doi.org/10.1007/s12665-016-6295-9, 2016.
Lea, J., Mair, D., and Rea, B.: Evaluation of existing and new methods of tracking glacier terminus change, J. Glaciol., 60, 323–332, https://doi.org/10.3189/2014JoG13J061, 2014.
Liu, J., Yao, X., Liu, S., Guo, W., and Xu, J.: Glacial changes in the Gangdisê Mountains from 1970 to 2016, J. Geogr. Sci., 30, 131–144 https://doi.org/10.1007/s11442-020-1719-6, 2020.
Miles, E., McCarthy, M., Dehecq, A., Kneib, M., Fugger, S., and Pellicciotti, F.: Health and sustainability of glaciers in High Mountain Asia, Nat. Commun., 12, 2868, https://doi.org/10.1038/s41467-021-23073-4, 2021.
Mölg, N., Bolch, T., Rastner, P., Strozzi, T., and Paul, F.: A consistent glacier inventory for Karakoram and Pamir derived from Landsat data: distribution of debris cover and mapping challenges, Earth Syst. Sci. Data, 10, 1807–1827, https://doi.org/10.5194/essd-10-1807-2018, 2018.
Oerlemans, J.: Extracting a climate signal from 169 glacier records, Science, 308, 675–677, https://doi.org/10.1126/science.1107046, 2005.
Paul, F. and Svoboda, F.: A new glacier inventory on southern Baffin Island, Canada, from ASTER data: II. Data analysis, glacier change and applications, Ann. Glaciol., 50, 22–31, https://doi.org/10.3189/172756410790595921, 2009.
Paul, F., Barrand, N. E., Baumann, S. Berthier, E. Bolch, T. Casey, K. Frey, H. Joshi, S. P., Konovalov, V., Le Bris, R., Molg, N., Nosenko, G., Nuth, C., Pope, A., Racoviteanu, A., Rastner, P., Raup, B., Scharrer, K., Steffen, S., and Winsvold, S.: On the accuracy of glacier outlines derived from remote-sensing data, Ann. Glaciol., 54, 171–182, https://doi.org/10.3189/2013AoG63A296, 2013.
Paul, F., Rastner, P., Azzoni, R. S., Diolaiuti, G., Fugazza, D., Le Bris, R., Nemec, J., Rabatel, A., Ramusovic, M., Schwaizer, G., and Smiraglia, C.: Glacier shrinkage in the Alps continues unabated as revealed by a new glacier inventory from Sentinel-2, Earth Syst. Sci. Data, 12, 1805–1821, https://doi.org/10.5194/essd-12-1805-2020, 2020.
Pfeffer, W. T., Arendt, A. A., Bliss, A., Bolch, T., Cogley, J. G., Gardner, A. S., Hagen, J., Hock, R., Kaser, G., Kienholz, C., Miles, E. S., Moholdt, G., Mölg, N., Paul, F., Radic V., Rastner, P., Raup, B. H., Rich, J., Sharp, M. J., and The Randolph Consortium: The Randolph Glacier Inventory: a globally complete inventory of glaciers, J. Glaciol., 60, 537–552, https://doi.org/10.3189/2014JoG13J176, 2014.
Podozerskiy, K. I.: Ledniki Kavkazskogo Khrebta (Glaciers of the Caucasus Range): Zapiski Kavkazskogo otdela Russkogo Geograficheskogo Obshchestva, Publ. Zap. KORGO., Tifis, 29, 200 pp., 1911 (in Russian).
Raup, B. H., Khalsa, S. J. S., Armstrong, R. L., Sneed, W. A., Hamilton, G. S., Paul, F., Cawkwell, F., Beedle, M. J., Menounos, B. P., Wheate, R. D., Rott, H., Shiyin, L., Xin, Li., Donghui, S., Guodong, C., Kargel, J. S., Larsen, C. F., Molnia, B. F., Kincaid, J. L., Klein, A., and Konovalov, V.: Quality in the GLIMS glacier database, in: Global Land Ice Measurements from Space, edited by: Kargel, J. S., Leonard, G. J., Bishop, M. P., Kääb, A., and Raup, B. H., Springer Berlin Heidelberg, 163–182, https://doi.org/10.1007/978-3-540-79818-7_7, 2014.
Reinhardt, A. L.: Snejnaya granica Kavkaze (The snow line in the Caucasus), Izvestia Kavkazskogo otdela Imperatorskogo Russkogo Geograficheskogo Obshchestva, 3, 275–307, 1916 (in Russian).
Rets, E. P., Popovnin, V. V., Toropov, P. A., Smirnov, A. M., Tokarev, I. V., Chizhova, J. N., Budantseva, N. A., Vasil'chuk, Y. K., Kireeva, M. B., Ekaykin, A. A., Veres, A. N., Aleynikov, A. A., Frolova, N. L., Tsyplenkov, A. S., Poliukhov, A. A., Chalov, S. R., Aleshina, M. A., and Kornilova, E. D.: Djankuat glacier station in the North Caucasus, Russia: a database of glaciological, hydrological, and meteorological observations and stable isotope sampling results during 2007–2017, Earth Syst. Sci. Data, 11, 1463–1481, https://doi.org/10.5194/essd-11-1463-2019, 2019.
Rototaeva, O. V., Nosenko, G. A., Kerimov, A. M., Kutuzov, S. S., Lavrentiev, I. I., Nikitin, S. A., Kerimov, A. A., and Tarasova, L. N.: Changes of the mass balance of the Garabashy Glacier, Mount Elbrus, at the turn of 20th and 21st centuries, Ice and Snow, 59, 5–22, https://doi.org/10.15356/2076-6734-2019-1-5-22, 2019 (in Russian).
Shahgedanova, M., Nosenko, G., Kutuzov, S., Rototaeva, O., and Khromova, T.: Deglaciation of the Caucasus Mountains, Russia/Georgia, in the 21st century observed with ASTER satellite imagery and aerial photography, The Cryosphere, 8, 2367–2379, https://doi.org/10.5194/tc-8-2367-2014, 2014.
Solomina, O., Bushueva, I., Dolgova, E., Jomelli, V., Alexandrin, M., Mikhalenko, V., and Matskovsky, V.: Glacier variations in the Northern Caucasus compared to climatic reconstructions over the past millennium, Global Planet. Change, 140, 28–58, https://doi.org/10.1016/j.gloplacha.2016.02.008, 2016.
Toropov, P. A, Aleshina, M. A., and Grachev, A. M.: Large-scale climatic factors driving recession in the Greater Caucasus, 20th–21st century, Int. J. Climatol., 39. 4703–4720, https://doi.org/10.1002/joc.6101, 2019.
Tielidze, L. G.: Glacier change over the last century, Caucasus Mountains, Georgia, observed from old topographical maps, Landsat and ASTER satellite imagery, The Cryosphere, 10, 713–725, https://doi.org/10.5194/tc-10-713-2016, 2016.
Tielidze L.: The Morphological Types, Exposition, Snow, and Firn Line Location of the Glaciers of Georgia, in: Glaciers of Georgia. Geography of the Physical Environment, Springer, Cham, https://doi.org/10.1007/978-3-319-50571-8_4, 2017.
Tielidze, L. G. and Wheate, R. D.: The Greater Caucasus Glacier Inventory (Russia, Georgia and Azerbaijan), The Cryosphere, 12, 81–94, https://doi.org/10.5194/tc-12-81-2018, 2018.
Tielidze, L. G., Kumladze, R. M., Wheate, R. D., and Gamkrelidze, M.: The Devdoraki Glacier Catastrophes, Georgian Caucasus, Hungarian Geographical Bulletin, 68, 21–35, https://doi.org/10.15201/hungeobull.68.1.2, 2019.
Tielidze, L. G., Solomina, O. N., Jomelli, V., Dolgova, E. A., Bushueva, I. S., Mikhalenko, V. N., Brauche, R., and ASTER Team: Change of Chalaati Glacier (Georgian Caucasus) since the Little Ice Age based on dendrochronological and Beryllium-10 data, Ice and Snow, 60, 453–470, https://doi.org/10.31857/S2076673420030052, 2020a.
Tielidze, L. G., Bolch, T., Wheate, R. D., Kutuzov, S. S., Lavrentiev, I. I., and Zemp, M.: Supra-glacial debris cover changes in the Greater Caucasus from 1986 to 2014, The Cryosphere, 14, 585–598, https://doi.org/10.5194/tc-14-585-2020, 2020b.
Tielidze, L. G., Svanadze, D., Gadrani, L., Asanidze, L., Wheate, R. D., and Hamilton, G. S.: A 54-year record of changes at Chalaati and Zopkhito glaciers, Georgian Caucasus, observed from archival maps, satellite imagery, drone survey and ground-based investigation, Hungarian Geographical Bulletin, 69, 175–189, https://doi.org/10.15201/hungeobull.69.2.6, 2020c.
Tielidze, L., Nosenko, G., Khromova, T., and Paul, F.: Glacier inventory for the Greater Caucasus (2000–2020), In The Cryosphere, Zenodo [data set], https://doi.org/10.5281/zenodo.5116329, 2021a.
Tielidze, L., Nosenko, G., Khromova, T., and Paul, F.: GLIMS, https://www.glims.org/maps/glims (last access: February 2022), 2021b.
Tielidze, L. G., Jomelli, V., and Nosenko, G. A.: Analysis of Regional Changes in Geodetic Mass Balance for All Caucasus Glaciers over the Past Two Decades, Atmosphere, 13, 256, https://doi.org/10.3390/atmos13020256, 2022.
WGMS: Fluctuations of Glacier Browser, available at: https://wgms.ch/fogbrowser/, last access: February 2022.
World Atlas of Snow and Ice Resources: Russian Academy of Sciences, Moscow, 372 p., 1977.
Vaughan, D. G., Comiso, J. C., Allison, I., Carrasco, J., Kaser, G., Kwok, R., Mote, P., Murray, T., Paul, F., Ren, J., Rignot, E., Solomina, O., Steffen, K., and Zhang, T.: Observations: Cryosphere, in: Climate change 2013: The physical science basis. Contribution of working group I to the fifth assessment report of the intergovernmental panel on climate change, edited by: Stocker, T. F., Qin, D., Plattner, G. K., Tignor, M., Allen, S. K., Boschung, J., Nauels, A., Xia, Y., Bex, V., and Midgley, P. M., Cambridge University Press, Cambridge, UK and New York, NY, USA, 2013.
Vinogadov, O. N., Konovalova, G. I., and Psareva, T. V.: Some characteristics of Caucasus glacier system, methods and results of mapping, Materialy glyatziologicheskih issledovanii, Vol. 30, Academy of Sciences of the USSR, Moscow, 115–126, 1977 (in Russian).
Volodicheva, N.: The Caucasus, in: The Physical Geography of Northern Eurasia, edited by: Shahgedanova, M., Oxford University Press, Oxford, 350–376, 2002.
Zemp, M., Huss, M., Thibert, E., Eckert, N., McNabb, R., Huber, J., Barandun, M., Machguth, H., Nussbaumer, S. U., Gärtner-Roer, I., Thomson, L., Paul, F., Maussion, F., Kutuzov, S., and Cogley, J. G.: Global glacier mass changes and their contributions to sea-level rise from 1961 to 2016, Nature, 568, 382–386, 2019.