the Creative Commons Attribution 4.0 License.
the Creative Commons Attribution 4.0 License.
 | 11 Oct 2022
Impact of measured and simulated tundra snowpack properties on heat transfer
Victoria R. Dutch
Nick Rutter
Leanne Wake
Melody Sandells
Chris Derksen
Branden Walker
Gabriel Hould Gosselin
Oliver Sonnentag
Richard Essery
Richard Kelly
Phillip Marsh
Joshua King
Julia Boike
Snowpack microstructure controls the transfer of heat to, as well as the temperature of, the underlying soils. In situ measurements of snow and soil properties from four field campaigns during two winters (March and November 2018, January and March 2019) were compared to an ensemble of CLM5.0 (Community Land Model) simulations, at Trail Valley Creek, Northwest Territories, Canada. Snow micropenetrometer profiles allowed for snowpack density and thermal conductivity to be derived at higher vertical resolution (1.25 mm) and a larger sample size (n=1050) compared to traditional snowpit observations (3 cm vertical resolution; n=115). Comparing measurements with simulations shows CLM overestimated snow thermal conductivity by a factor of 3, leading to a cold bias in wintertime soil temperatures (RMSE=5.8 ∘C). Two different approaches were taken to reduce this bias: alternative parameterisations of snow thermal conductivity and the application of a correction factor. All the evaluated parameterisations of snow thermal conductivity improved simulations of wintertime soil temperatures, with that of Sturm et al. (1997) having the greatest impact (RMSE=2.5 ∘C). The required correction factor is strongly related to snow depth () and thus differs between the two snow seasons, limiting the applicability of such an approach. Improving simulated snow properties and the corresponding heat flux is important, as wintertime soil temperatures are an important control on subnivean soil respiration and hence impact Arctic winter carbon fluxes and budgets.
Please read the corrigendum first before continuing.
-
Notice on corrigendum
The requested paper has a corresponding corrigendum published. Please read the corrigendum first before downloading the article.
-
Article
(1800 KB)
-
The requested paper has a corresponding corrigendum published. Please read the corrigendum first before downloading the article.
- Article
(1800 KB) - Full-text XML
- Corrigendum
- BibTeX
- EndNote


Seasonal snow is an effective insulator, with snow thermal properties influencing the soil microclimate (Lawrence and Slater, 2009; Wilson et al., 2020) and the distribution and state of permafrost (Biskaborn et al., 2019; Goncharova et al., 2019; Zhang, 2005). The temperature of the subnivean environment, particularly the extent to which it allows for the presence of small amounts of liquid water, acts as an important control on biogeochemical cycling, including soil respiration (Semenchuk et al., 2015; Sullivan et al., 2008; Williams et al., 2009). In addition, the soil temperature also impacts hydrology through controls on soil infiltration and runoff (Niu and Yang, 2006; Quinton and Marsh, 1999). Accounting for how well the thermal and hydrological conditions of subnivean soils (including the physical state of soil water content) are simulated is therefore critical for understanding how well current land models such as the Community Land Model (CLM; Lawrence et al., 2019) simulate winter carbon fluxes (e.g. Natali et al., 2019) and permafrost evolution (Koven et al., 2012).
The depth, (micro)structure and stratigraphy of a snowpack determine its capacity to insulate the underlying soil and are in turn influenced by the temperature of the ground surface. Tundra snowpacks typically consist of a basal depth hoar layer, formed as strong temperature gradients within the snowpack induce kinetic metamorphism, overlain by an upper wind slab layer, compacted and densified over the course of a snow season by strong Arctic winds (Sturm et al., 1995; Derksen et al., 2009, 2014; Rees et al., 2014; among others). Between these two layers, an indurated hoar layer may also be formed (Sturm et al., 2008), where the lower part of the wind slab takes on some of the microstructural properties of depth hoar (e.g. faceted grains) while maintaining the density and hardness of a wind slab (Derksen et al., 2009).
The thermal influence of the snowpack on the underlying soil can be considered in terms of an effective snow depth (Sdepth,eff), which describes the insulative properties of the snowpack by weighting the mean monthly snow depth by its relative position in the season at a given location across an entire winter (October–March) (Slater et al., 2017), emphasising the timing of snow accumulation as more important than the end-of-season snow depth in determining wintertime soil temperatures (Lafrenière et al., 2013). Rapid snow accumulation and snowpack establishment early in the winter will insulate the ground, thereby dampening soil temperature fluctuations, leading to a higher Sdepth,eff than steady accumulation throughout the entire winter, even if the total amount of precipitation is the same (Slater et al., 2017). The relationship between Sdepth,eff and the normalised temperature difference between air and soil (Anorm) can be used to understand heat transfer between the air and the soil and through the snowpack (Slater et al., 2017). The deviation of this relationship from the expected exponential form (Fig. 3 of Slater et al., 2017), termed the snow heat transfer metric (SHTM), can be calculated and used to evaluate simulated heat transfer processes in the soil and snowpack as was undertaken by Slater et al. (2017) for the land surface components of participating models in CMIP5 (Coupled Model Intercomparison Project; Taylor et al., 2012). The closer the value of the SHTM is to one, the smaller the disagreement between modelled and observed air and soil temperature differences. Being able to quantitatively assess snow heat transfer is of particular importance because model parameterisations of snow physical properties can lead to differences in soil temperature and therefore contribute to uncertainties in estimates of Arctic winter carbon fluxes and budgets, which are currently not well constrained (Fisher et al., 2014; Natali et al., 2019; Virkkala et al., 2021).
The effective thermal conductivity of the snowpack (Keff; heat conducted through ice and interstitial air) determines the rate of heat transfer to underlying soil (Domine et al., 2015; Jafarov et al., 2014). From here on, we refer to the effective thermal conductivity of the snowpack as snow thermal conductivity for brevity, after Jafarov et al. (2014). Snow has a low thermal conductivity, typically in the range 0.01–0.7 W m−1 K−1 (Gouttevin et al., 2018). Typical Keff values for tundra snowpacks are at the lower end of this range; for example Domine et al. (2016) found a maximum value of 0.33 W m−2 K−1. Measurement of snow thermal conductivity is typically undertaken using a heated needle probe (Morin et al., 2010), although snow anisotropy causes 29 % uncertainty in these estimates of Keff (Domine et al., 2015), which is a notable limitation to this method (Riche and Schneebeli, 2013). Models typically parameterise Keff as a function of the simulated snow density (Gouttevin et al., 2018), for which a number of different statistical relationships have been proposed (e.g. Sturm et al., 1997; Calonne et al., 2011).
This study characterises the variability of the thermal properties of tundra snow and resultant soil temperatures at Trail Valley Creek, Northwest Territories, Canada, over the 2017–2018 and 2018–2019 winters using in situ measurements. We then use these measurements to evaluate an ensemble of simulations from the Community Land Model (CLM5.0), particularly with regard to how thermal properties are simulated and the sensitivity of soil temperatures and SHTM to the properties of the snowpack.
2.1 Study location
Trail Valley Creek (TVC; N, W) is a 57 km2 boreal–tundra transition research watershed located in the Inuvialuit Settlement Region, approximately 55 km northeast of Inuvik, Northwest Territories, Canada. TVC has an average elevation of approximately 99 m above sea level (Marsh et al., 2008) and a mean annual air temperature of −7.9 ∘C for the period 1999–2018 (Grünberg et al., 2020). Land cover at TVC predominately consists of graminoid tundra, with some lakes, small clusters of willow and alder shrubs, and some isolated black spruce stands (Essery and Pomeroy, 2004; Grünberg et al., 2020; King et al., 2018). The terrain consists of mineral soil hummocks of up to a metre in diameter and peaty inter-hummock hollows (Quinton and Marsh, 1998). The ground is underlain by continuous permafrost to a depth of 350–500 m (Wilcox et al., 2019), with a maximum active-layer depth of up to 1 m at the end of the summer (Grünberg et al., 2020). Snow cover at TVC has a typical duration of 8 months (Pomeroy et al., 1993), with typical depths of 0.2–0.5 m, though drifts exceeding 1–2 m occur surrounding tall shrubs and in proximity to steep slopes (Marsh and Pomeroy, 1999).
2.2 Field methods
Comprehensive snow and soil data are used from four winter season intensive measurement periods (14–21 March 2018, 12–18 November 2018, 11–20 January 2019 and 18–27 March 2019). Additionally, meteorological data for the entirety of the study period (1 August 2017–31 August 2019; plus model spin-up), measured at the TVC eddy covariance tower (AWS, automatic weather station), were also used. Half-hourly 2 m air temperatures were measured using an HMP35CF sensor (Campbell Scientific, Logan, Utah), and precipitation totals were measured using a weighted T-200B gauge (Geonor Inc., Branchville, New Jersey). Precipitation gauge undercatch is common in tundra environments such as TVC (Smith, 2008; Watson et al., 2008; Gray and Male, 1981); therefore precipitation was corrected as per Pan et al. (2016). Automated snow depth measurements used were from the nearby Meteorological Service of Canada station and measured by an SR50A sensor (Campbell Scientific). Soil temperature profiles (Boike et al., 2020) were measured at 2, 5, 10 and 20 cm depths using 107B thermistors (Campbell Scientific). Soil moisture content (Boike et al., 2020) was profiled at the same depths using CS615 soil water content reflectometers (Campbell Scientific).
Spatially distributed snow micropenetrometer (SMP; Schneebeli and Johnson, 1998) profiles (n=1050) were measured across the TVC sub-catchment. The SMP provides vertical profiles of force at 40 µm resolution (Proksch et al., 2015). Bespoke coefficients for tundra snowpacks were calculated based on the methodology of King et al. (2020b) to derive high-vertical-resolution snow density profiles from the SMP force profiles (see Appendix A for detailed methodology). Briefly, a K-fold recalibration was used to derive new coefficients (Table A1) from 36 co-located snowpits and SMP profiles across the TVC catchment. These coefficients were then applied to all 1050 SMP force profiles from the three campaigns over a 2.5 mm rolling window to give recalibrated density profiles. These density profiles were then used to approximate profiles of thermal conductivity using the Keff relationships derived by Sturm et al. (1997), Calonne et al. (2011), Jordan (1991) and Fourteau et al. (2021b), denoted Keff−Sturm, Keff−Calonne, Keff−Jordan and Keff−Fourteau respectively (the parameterisations are similarly referred to as Sturm, Calonne, Jordan and Fourteau). Use of the SMP allows for a large increase in both the number of sites and the vertical resolution at each site compared to traditional snowpits, but some coincident snowpit measurements are still required to derive the coefficients to estimate snow density. Sources of uncertainty in the SMP measurements include interactions with vegetation within the snowpack and collapse of the depth hoar layer during measurement; an experienced SMP user can easily identify and remove profiles which are affected by these issues. A positive bias in derived depth hoar density occurs because of large distances between snow grain failures (see Appendix A and King et al., 2020b, for more details).
During the March 2018 and March 2019 campaigns, thermal conductivity was also measured using a TP02 needle probe (Hukseflux, Delft, the Netherlands) after Morin et al. (2010). Measurements of thermal conductivity of each snowpack layer, a total of 105 measurements from 37 different snowpits, were made across these two campaigns. Almost 36 500 GPS-located snow depths (Toose et al., 2020; King et al., 2020a) were measured across the four campaigns using a Magnaprobe instrument (Sturm and Holmgren, 2018), allowing for spatial distributions of snow depths across the catchment to be examined. Vertical profiles of snow density, using a 100 cm3 box cutter (Conger and Mcclung, 2009), and snowpack temperature were measured at all snowpit locations for each campaign. Stratigraphic information profiled in each snowpit (n=115) was used to assign one of four different layer types (surface snow, wind slab, indurated hoar and depth hoar) to the measured densities (Fierz et al., 2009) in order to assess spatial variability in the thickness and properties of different snowpack layers.
2.3 Snowpack simulations
The Community Land Model v5.0 (CLM; Lawrence et al., 2019) is the land surface component of the Community Earth System Model v2.0, which can be run at a variety of spatial scales. In this study, 1D “point mode” (a grid cell) CLM (PTCLM; CESM research tools, 2021) simulations were centred at the location of the TVC station. Minor adjustments were made to the model in order to better emulate snow accumulation and melt at the point scale; the snow accumulation factor was increased (Swenson and Lawrence, 2012) from 0.1 to 2.0 and the standard deviation of elevation set to 0.5 m after Malle et al. (2021; Fig. S4). These adjustments limit the period of fractional snow cover so that PTCLM represents a binary state of snow presence or absence over a flat surface. PTCLM simulations were run from August 2017 to August 2019, with model spin-up from January 2013. Spin-up of PTCLM was necessary in order to allow for soil temperatures to equilibrate. Variation between model runs with the same parameterisation after more than 2 full years of spin-up is limited to ∼ 1 ∘C throughout the top 5 m of the soil column. The impact of spin-up on soil temperature is further discussed in Appendix B.
Simulations were forced with gap-filled AWS data from TVC. Following Essery et al. (2016), gaps of 4 h or less were filled using linear interpolation and larger gaps were filled using ERA5 reanalysis data (Hersbach et al., 2020). Gap filling was only required for measurements of incoming long-wave and short-wave radiation, and comparison of observations (obs) and reanalysis data showed an offset of less than 60 W m−2. Bias correction of reanalysis data was not undertaken due to the small size of this offset. Daily precipitation amounts from the AWS were converted to the hourly resolution required by CLM using the fraction of daily precipitation at each hourly time step from ERA5. ERA5 reanalysis data were also used to partition precipitation into rain and snow for comparison against the linear ramp used by CLM. All precipitation falling when air temperatures are below 0 ∘C is classed as snow, after which point an increasing proportion of the precipitation is classed as rain until air temperatures are above 2 ∘C, where all precipitation is classed as rain (Lawrence et al., 2019).
Developments between CLM4.5 and CLM5.0, as outlined in Van Kampenhout et al. (2017), improved the snow scheme in CLM. The version of the model used herein produces a computationally layered snowpack, with the number of snow layers dependent on the snowpack depth, up to a theoretical maximum of 12 layers (as opposed to the 5-layer maximum in previous versions of CLM). Once the total snow depth exceeds a given threshold, the initial snow layer is subdivided into two layers with equal properties. Snow layer formation continues in this manner as layer thicknesses surpass the prescribed ranges given in Jordan (1991). When a layer divides, the new layer is formed beneath it, rather than new layers being formed at the surface by new snowfall. As this process is not stratigraphically representative, layers are not described by snow type (for example, as per Fierz et al., 2009) but instead numbered from the snow surface down. Layer thicknesses are also influenced by snow compaction, parameterised following Anderson (1976). Unsaturated layers may compact due to overburden pressure, the breakdown of new snow crystals or melting, with the thickness of a snow layer as a function of the snow thickness at the previous time step and the rate of compaction. Snow depths below 1 cm are not discretely modelled and are instead combined into the surface soil layer.
Density, thickness and thermal conductivity are output as a daily mean for each layer. CLM calculates snow density as a function of the relative proportions of ice (mass of ice: mi) and liquid water (mass of liquid water: mlw), weighted by the snow cover fraction (Fsno) for each grid cell (Lawrence et al., 2018):
In practice, due to the adjusted snow cover fraction and as liquid water in the snowpack is zero until the start of melt out, the computed snow layer density simplifies to the mass of ice (mi) divided by the height of the snow layer (hsl). Changes implemented in CLM5.0 also include a new snow densification scheme, whereby fresh snow density is parameterised as a function of temperature and wind speed. The density of fresh snow can increase through the process of wind-driven compaction if wind speeds exceed 0.1 m−1 (Van Kampenhout et al., 2017). Over time, the density of the snowpack evolves as a result of the compaction processes outlined above. CLM does not allow for temperature-gradient metamorphism and thus does not represent the development of depth hoar layers (Van Kampenhout et al., 2017).
The computed snow layer densities are then used to calculate snow layer effective thermal conductivities (Keff), as per Jordan (1991):
Values for Kice and Kair, the thermal conductivities of ice and interstadial air, are given in Lawrence et al. (2018). Snow (and soil) temperatures are defined for the midpoint of each layer at an hourly resolution, with the soil column consisting of 25 layers of increasing thickness (down to a depth of 49 m). Despite the simplicity of the snowpack scheme included in CLM, previous evaluation of snow heat transfer in CLM4.0 (Slater et al., 2017) suggests this modelling framework should perform well.
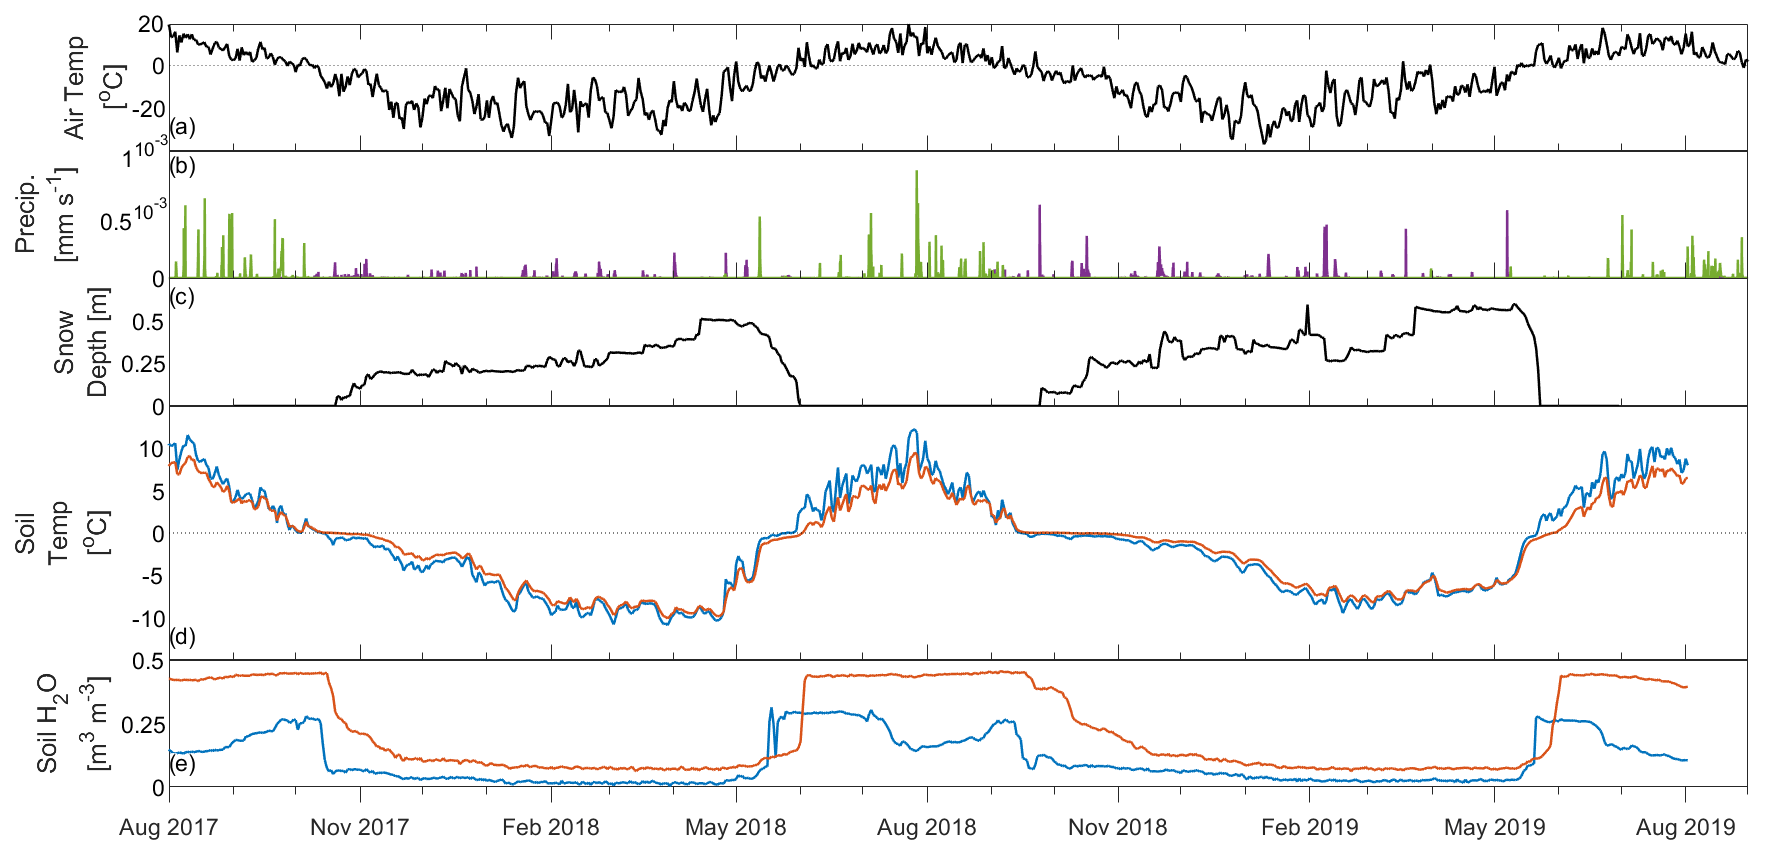
Figure 1Daily averaged meteorological and soil conditions at Trail Valley Creek from 1 August 2017 to 31 August 2019: (a) 2 m air temperature, (b) precipitation as snow (purple) and rain (green), (c) snow depth, (d) soil temperatures at depths of 5 cm (blue) and 20 cm (orange), and (e) volumetric soil water content at 5 cm (blue) and 20 cm (orange) depths.
3.1 Observed meteorological, soil moisture and thermal conditions
Mean annual air temperature for 2017–2019 was −7.4 ∘C, with minimum air temperatures of −33.9 (2018) and −36.9 ∘C (2019) reached in early January (Fig. 1a). The cold period was twice as long as the growing season, with consistent subfreezing air temperatures from 10 October 2017 to 30 May 2018 (232 d) and from 23 September 2018 to 11 May 2019 (230 d).
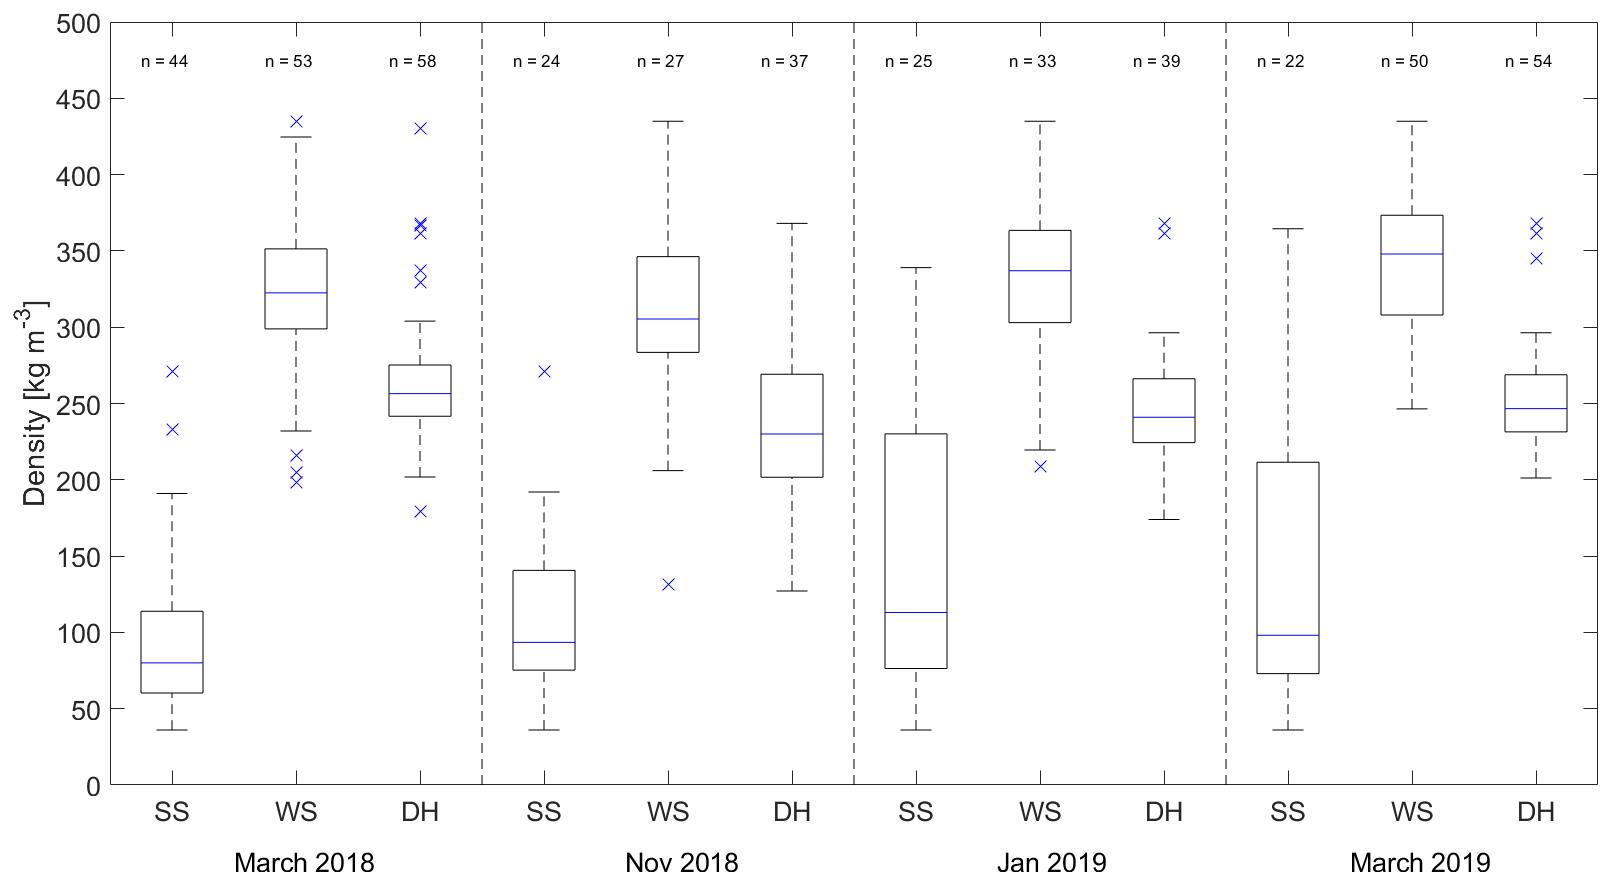
Figure 2(a) Frequency distributions of Magnaprobe depths for each sampling campaign where snow micropenetrometer (SMP) measurements are available. (b–d) Profiles of median SMP-derived densities (colour-coded for the respective campaigns (Fig. 3a); interquartile range shaded in grey), with snow stratigraphy as per Fierz et al. (2009) superimposed.
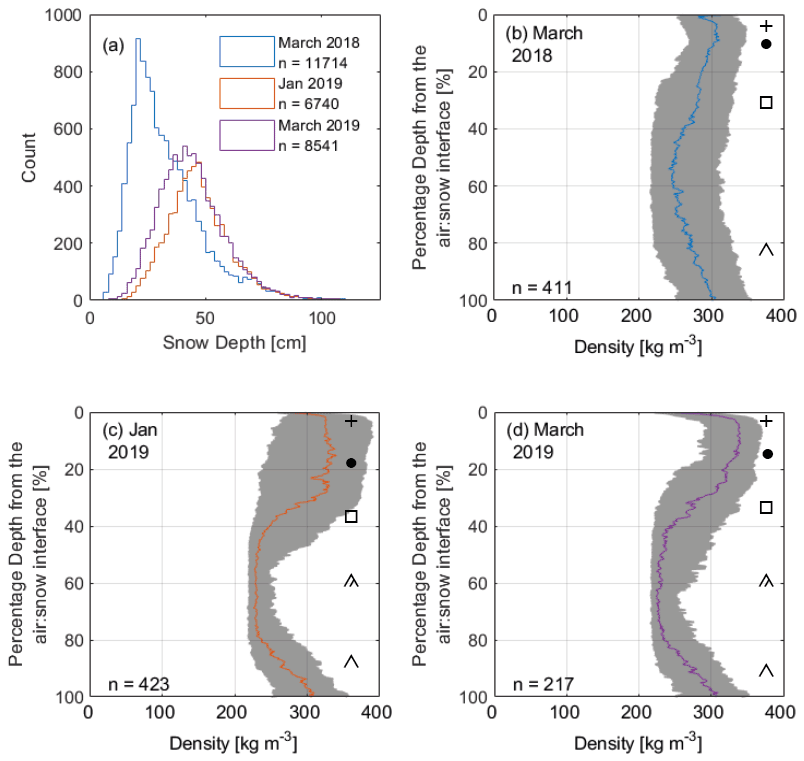
Figure 3Distributions of measured layer densities (SS: surface snow, WS: wind slab, DH: depth hoar) from four sampling campaigns: box (interquartile range), blue line (median) and whiskers (dashed lines) extend from the end of each box to 1.5 times the interquartile range; blue crosses represent outliers beyond this range.
Figure 1c shows snowpack initiation in 2018 was 26 d earlier than in the previous year, with snow-on dates of 25 September 2018 and 21 October 2017 respectively. A maximum snow depth of 51 cm (2017–2018) and 59 cm (2018–2019) was measured at the AWS on 14 April 2018 and 11 May 2019 respectively. Snow depth from spatially distributed Magnaprobe measurements showed a greater difference between the 2 years than at the AWS, with mean March snow depths 11 cm higher in 2018–2019 than 2017–2018. Magnaprobe measurements also show a higher mean March snow depth than the AWS, with March 2018 snow depths more heavily skewed than snow depths in 2019 (Fig. 2a). The snow-off date, as measured at the AWS snow depth sounder, was 1 week later in 2017–2018 (30 May) than in the following year (23 May).
Soil freeze-up began with the onset of snowfall (Fig. 1b and d); 5 cm soil temperatures dropped to 0 ∘C on 13 October in 2017 and a month earlier on 15 September in 2018. Soil temperatures remained around 0 ∘C as the soil froze and released latent heat. Soil saturation increased with depth causing a slower soil freeze-up at 20 than 5 cm depth in both years. A longer freeze-up in 2018 was evident from the more gradual liquid soil moisture decrease, particularly at depth (20 cm). Deeper soil (20 cm) stayed at 0 ∘C for longer than soil nearer the surface (5 cm) and generally remained warmer until the start of the thaw period. Minimum 2017–2018 soil temperatures at both 5 cm (−10.9 ∘C) and 20 cm (−10.1 ∘C) depths in winter were colder than the following year (−9.5 and −8.2 ∘C), as the combined effect of earlier snowpack initiation and a deeper snow cover prevented colder soil temperatures being reached. Variations in soil temperature in response to diurnal and synoptic weather patterns of energy inputs from the atmosphere became increasingly muted with depth in the soil column once the snowpack was established. Anomalously warm mid-winter air temperatures that approached (22 December 2017 and 9 February 2019) or exceeded 0 ∘C (18 and 31 March 2019, with a rain-on-snow event occurring on the latter of these dates) had only a muted influence on the soil temperature profile (Fig. 1d), with temperatures fairly stable until sharply increasing with thaw in early May. Soil temperatures at 5 cm increased above 0 ∘C for the first time on the final day of the snowmelt period in both years (Fig. 1d), with a 5 (2017–2018) to 7 d (2018–2019) lag in the 20 cm soil temperatures.
Table 1End-of-March snow depth summary. Mean and standard deviation of spatially distributed measurements with a sample size greater than n=1 are shown; otherwise the daily value for 31 March is shown.
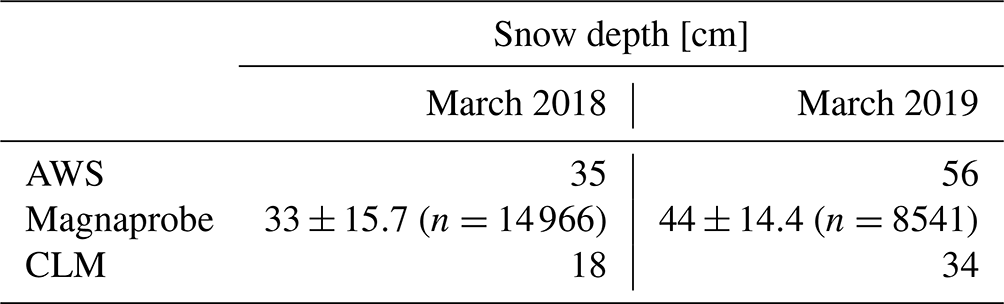
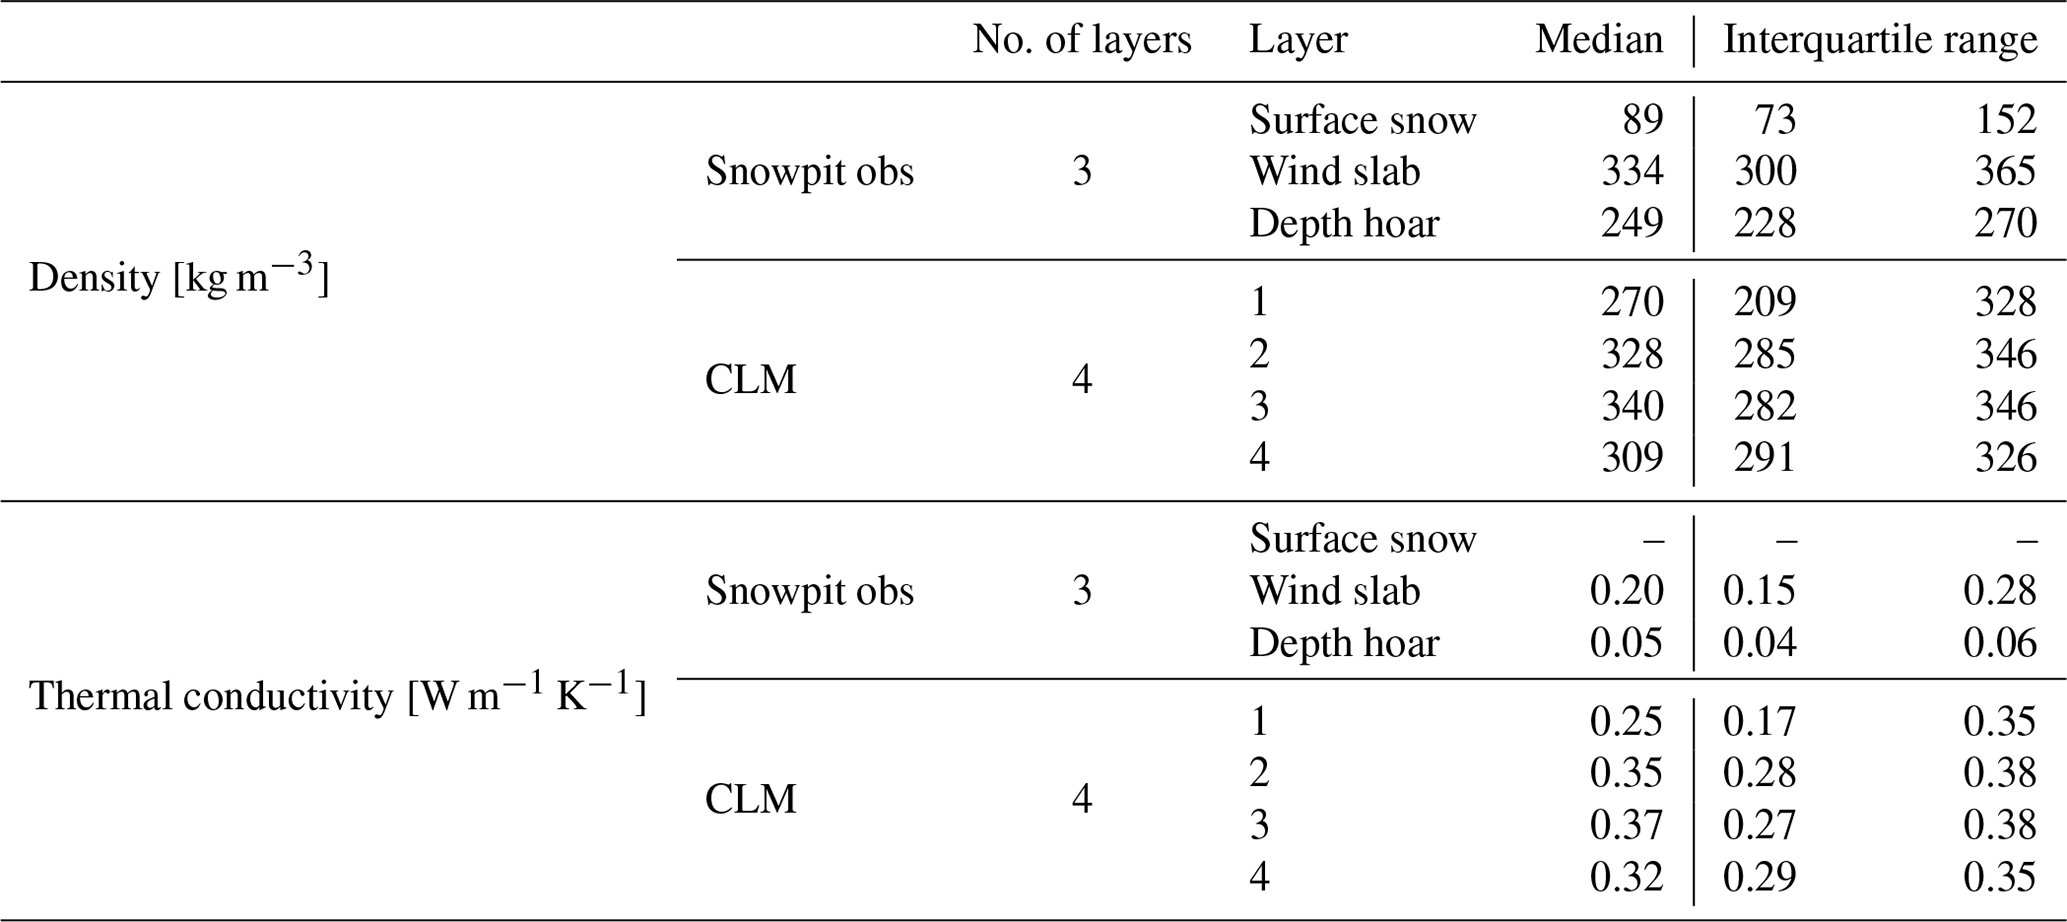
Table 2Summary of modelled (CLM) and measured snow densities and thermal conductivities (from the manual density profiles and the needle probe respectively).
3.2 Measured snow properties
Median density profiles from the SMP fall within the interquartile range of measured densities from volumetric sampling in snowpits (Table 2). Snowpacks in all three campaigns (Fig. 2b–d) had a very thin surface snow layer (composed of recent snowfall), with low near-surface snow densities (<300 kg m−3) rapidly increasing in the top 5 % of the snowpack. A higher-density (∼ 320 kg m3) wind slab layer was evident between 5 %–30 % of normalised depth from the snow surface. The next ∼ 10 % of the profile was a transitional section where density decreased by about 100 kg m3. The lowest ∼ 60 % of the profiles is dominated by a lower-density (∼ 230 kg m3) depth hoar layer, the density of which increases slightly towards the base of the snowpack. Differences between median layer densities exceed the ∼ 10 % sampling error associated with the use of density cutters (Proksch et al., 2016; Conger and Mcclung, 2009), and in all but one instance, there was no overlap in the interquartile ranges of different snow layers within a campaign (Fig. 3). Densities between 40 %–80 % of normalised depth (low-density depth hoar) are likely overestimated due to microstructural assumptions made by the algorithm of Proksch et al. (2015), which prevent the calculation of SMP densities below 200 kg m3 (see Appendix A).
The transitional section, or indurated hoar layer, with transitioning properties between wind slab and depth hoar, evident at between ∼ 30 %–40 % depth, is often difficult to capture through traditional snowpit density profiles due to the 3 cm vertical resolution of density cutters and the layer being more defined by its crystal shape than density alone. The SMP enabled the detection of such features due to the increased vertical resolution and vastly reduced sampling times compared to traditional snowpits. Indurated hoar in SMP profiles was more pronounced in the 2019 campaigns; well-defined layers were not as clearly visible in the SMP measurements from March 2018 (Fig. 2b), despite different layer densities being statistically separate in the snowpit measurements, regardless of which year or when in the winter season the measurements were taken (Fig. 3). Ice lenses were present in March 2018 but not during the 2019 campaigns. Throughout the course of the 2018–2019 winter, slight increases in the density of wind slab and depth hoar layers occurred as the snowpack developed. Late-season snow densities in both 2018 and 2019 were similar, with the exception of surface snow. The density of this layer became more variable as each winter progressed due to the competing processes of wind compaction (increasing density) and temperature-gradient metamorphism (decreasing density). The timing of sampling relative to fresh snowfall events, noted during both March campaigns, also influenced measured surface snow densities.
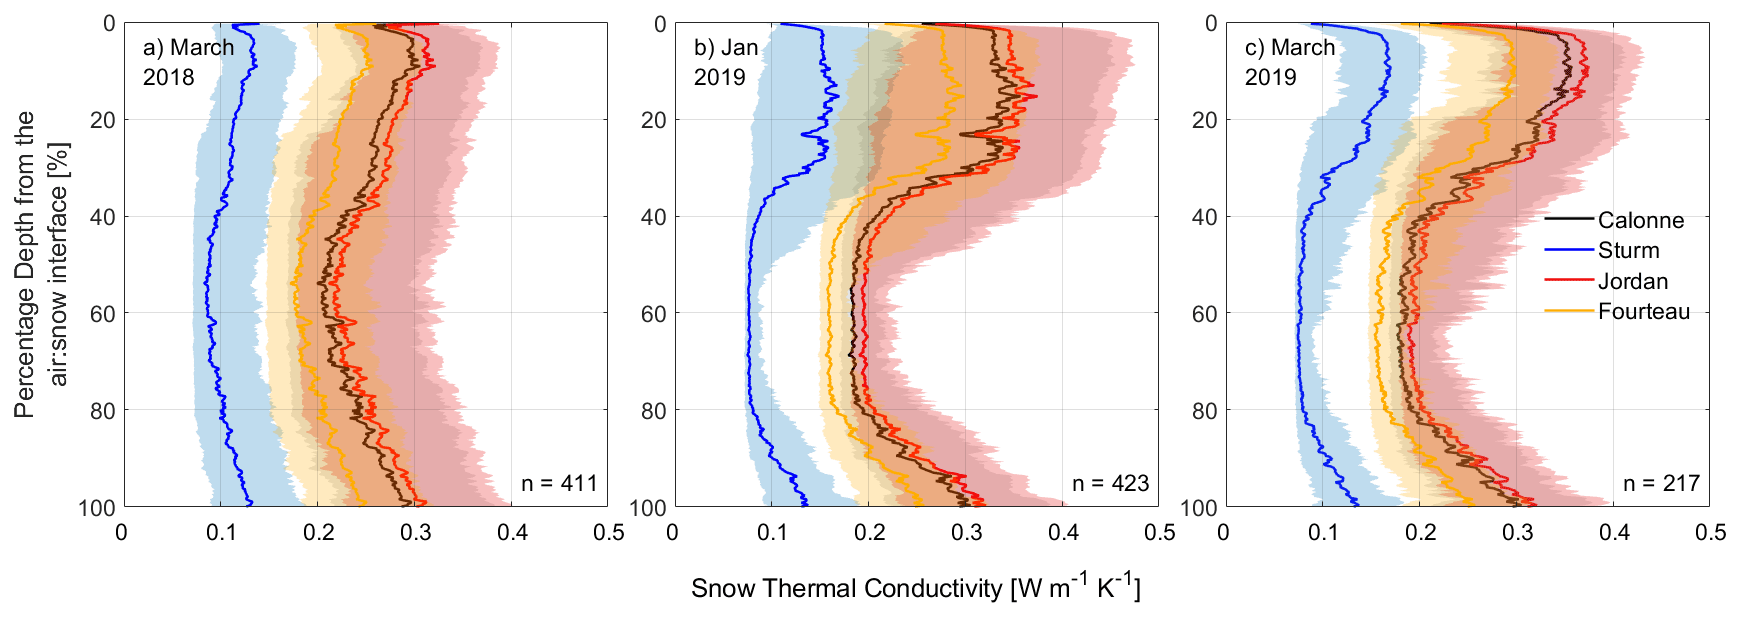
Figure 4Median thermal conductivity profiles (lines) and interquartile range (shaded areas) approximated from SMP densities, using the parameterisations of Calonne et al. (2011) in black/grey, Sturm et al. (1997) in blue, Jordan (1991) in red and Fourteau et al. (2021b) in yellow.
SMP density profiles were used to parameterise profiles of thermal conductivity for the full depth of the snowpack. Patterns in parameterised thermal conductivity profiles (Fig. 4) resemble those in SMP densities from which they were derived (Fig. 2b–d). Surface snow thermal conductivities were low ( W m−1 K−1, W m−1 K−1) but sharply increased with depth for the upper 5 % of the snowpack (Fig. 4b and c). Below this, at normalised depths of ∼ 5 %–30 %, thermal conductivity reached maximum values ( W m−1 K−1, W m−1 K−1, W m−1 K−1, W m−1 K−1). Between ∼ 25 %–40 % normalised depth, thermal conductivity declined before stabilising at minimum values ( W m−1 K−1, W m−1 K−1, W m−1 K−1) in the lower ∼ 60 % of the snowpack. All three parameterisations showed similar variation in thermal conductivity with depth. Analysis of variance showed the mean Keff from the Sturm et al. (1997) and Fourteau et al. (2021b) parameterisations to statistically significantly differ from those using the parameterisation of either Calonne et al. (2011) or Jordan (1991) and each other in all 3 months (FMarch2018=3168, FJan2019=656, FMarch2019=636). No significant difference was found between the Calonne et al. (2011) or Jordan (1991) parameterisations in either of the 2019 campaigns. All statistical tests herein gave a p value less than 0.001, denoting significance at the 99.9 % level.
Profiles of snowpack thermal conductivity were temporally consistent, with similar shape and values in January and March 2019. In March 2018, the amplitude of the thermal conductivity profiles was less pronounced than January and March 2019, particularly for the parameterisation of Sturm et al. (1997). We recognise that the thermal conductivity of a snowpack is dependent on more than just its density (Sturm et al., 2002), with other factors such as snow microstructure and temperature also having an influence (i.e. Calonne et al., 2011), but these profiles still provide novel insights and a useful first-order approximation of snow heat transfer for model evaluation.
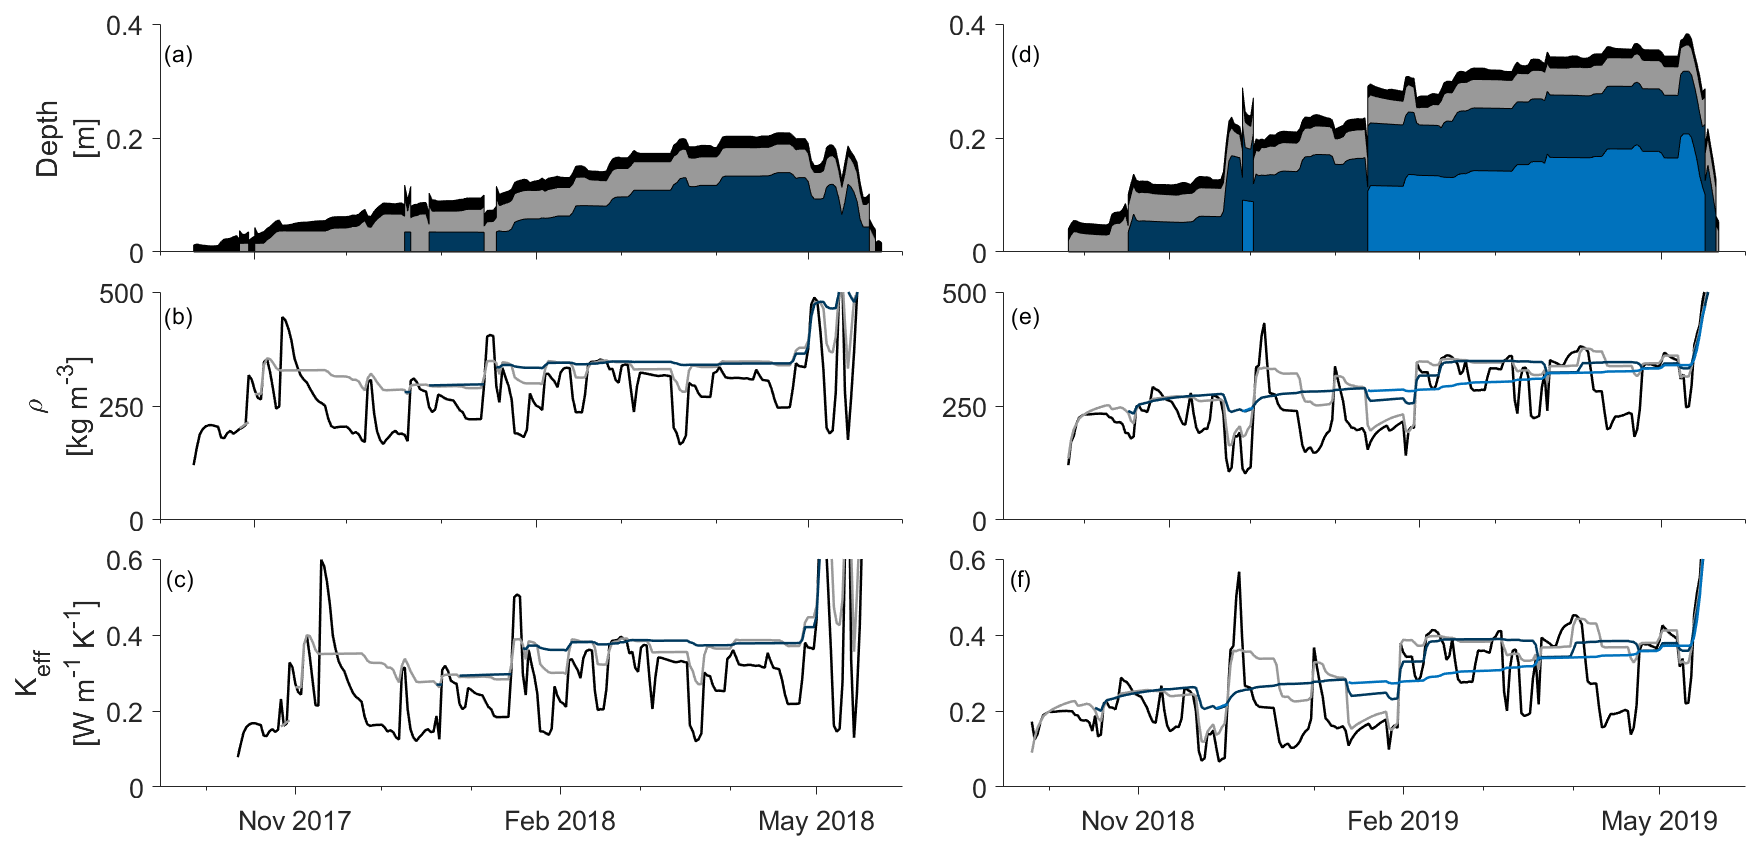
Figure 5Simulated snow layers and their properties for winter 2017–2018: (a) simulated snow layer thicknesses, (b) snow layer densities and (c) snow layer thermal conductivities. (d–f) As before but for winter 2018–2019. Each colour represents a different computational snow layer.
3.3 Modelled snowpack properties and comparison with observations
Simulated snow depths (Fig. 5a and d) were consistently lower than observations (from either Magnaprobe measurements (mean value) or the acoustic sounder depth on 31 March at the AWS; Fig. 1b, Table 1). Timing of simulated snowpack accumulation leads to an effective snow depth in 2018–2019 ( cm) more than double that in 2017–2018 ( cm) with earlier snow onset allowing for a greater degree of soil insulation. Simulated snow onset (11 October) and melt-out dates (25 May) were both approximately a week earlier than observed at the AWS in 2017–2018; for the following year the length of this offset was reduced to just 1 d. Observations of effective snow depth ( cm, cm) similarly reflect greater insulation of the soil surface in 2018–2019 compared to 2017–2018.
The physical properties of the simulated snow layers do not correspond to observations, with the number and thickness of snow layers only a function of overall snowpack depth. Fig. 5b and e show three (or four) relatively homogenous layers, with a slight increase in density with depth. The highest mean (329 kg m3) and median (340 kg m3; Table 2) densities are found in third snow layer (dark blue in Fig. 5).
This is in contrast to the three observed layers (surface snow, wind slab and depth hoar) consistently identified in the snowpit observations. Similar to other snow models (Domine et al., 2016; 2019) the physical characteristics of the depth hoar layer at the base of the snowpack (large faceted grains; low density) are not clearly distinct from an overlying wind slab layer (small rounded grains; high density). This is the result of the lack of representation of depth hoar layer development in CLM (Van Kampenhout et al., 2017). These discrepancies between modelled and measured snow density and stratigraphy negatively impact the simulation of Keff, as layer thermal conductivities were dependent on density of each layer (Eq. 2).

Figure 6(a) Histograms of measured and simulated thermal conductivity from March 2018 and 2019 sampling campaigns; dashed lines show the four different thermal conductivity parameterisations applied to the SMP densities. (b) Sensitivity testing of simulated thermal conductivities for the same time period using both the default CLM snow thermal conductivity parameterisation, application of the α correction (solid lines) and alternative snow thermal conductivity parameterisations (Calonne et al., 2011; Fourteau et al., 2021b; Sturm et al., 1997; dashed lines). Note the different scales on the y axes.
CLM overestimated the thermal conductivity of tundra snowpacks compared to in situ measurements using needle probes or estimated from SMP profiles (Fig. 6a). Median simulated snow thermal conductivities (0.34 W m−1 K−1) were at least 3 times greater than either needle probe measurements (0.08 W m−1 K−1) or SMP-derived estimates using the Sturm parameterisation ( W m−1 K−1), with the median thermal conductivity using the Calonne, Fourteau and Jordan approximations still lower (x W m−1 K−1, W m−1 K−1, W m−1 K−1) than simulated thermal conductivities. SMP Keff parameterisation from Sturm et al. (1997; derived from snow measurements in the Alaskan Arctic) is closer to values from needle probe measurements than SMP Keff derived using Calonne et al. (2011) (Fig. 6a). The modelled thermal conductivity of simulated snow layers was relatively homogenous between layers in contrast to thermal conductivities derived from either the SMP (Fig. 4) or the needle probe measurements (Table 2). Analysis of variance only shows simulated snow layer thermal conductivities significantly differ from that of the surface layer (F=39.74). Needle probe measurements of the depth hoar layer had low thermal conductivities (0.05 W m−1 K−1), with a slight increase in mean thermal conductivity for indurated hoar (0.09 W m−3 K−1) and a further increase for the mean wind slab thermal conductivity (0.20 W m−1 K−1). Distributions of simulated snow thermal conductivities were statistically significantly different from all measurement methods at the 0.01 level using a Kruskal–Wallis test. Differences between the distribution of needle probe measurements and the SMP with the Sturm parameterisation were not statistically significant.

Figure 7(a) Simulated 10 cm soil temperature time series using the four different parameterisations of snow thermal conductivity compared to field measurements. (b) Time series of 10 cm soil temperatures when using different values of the correction factor α compared to field measurements. (c) Observed and simulated snow depths for the same time period.
3.4 Improving simulated soil temperatures, snow thermal conductivity and snow heat transfer
Simulated soil temperatures were considerably colder than observations (RMSE=5.0 ∘C, ∘C), especially during the maximum annual duration of continuous simulated snow cover (15 September–31 May; RMSE=5.8 ∘C). Two approaches were taken to reduce simulated snow thermal conductivities, both of which resulted in warmer soil temperatures closer to observed values (Fig. 7a, b).
In order to see how results from the SMP (Fig. 6a) manifested in simulations of soil temperature from CLM, we reran the model substituting the default parameterisation of snow thermal conductivity (Eq. 1; Jordan, 1991) for those of Sturm et al. (1997), Calonne et al. (2011) and Fourteau et al. (2021b). The Sturm parameterisation resulted in lower simulated thermal conductivities (Fig. 6b) and closer temperatures to observations (Fig. 7b; RMSE=2.5 ∘C). Soil temperatures in 2017–2018 were still too cold regardless of parameterisation used, likely due to model underestimation of snow depth (Fig. 7c). As for the SMP, thermal conductivity values derived using the Calonne and Fourteau parameterisations are closer to the default Jordan (1991) parameterisation than those derived using the Sturm et al. (1997) parameterisation (Fig. 6b). The impact of either of these parameterisations on simulated wintertime soil temperatures is limited (Fig. 7a), particularly that of Calonne et al. (2011), which reduces the RMSE by only 0.2 ∘C. However, all three alternative parameterisations tested do show an improvement in simulated snow thermal conductivities (Fig. 6b) and soil temperatures (Fig. 7a), with an increase in the value of the SHTM in each case.
We also tested the application of a multiplier (α) to the ice content term in Eq. (1):
Although appearing to be a function of density, this multiplier is added separately from the calculation of layer snow densities and only feeds into the calculation of snow thermal conductivity, and thus snow mass is conserved. Values of α were chosen which would reduce simulated densities to the range of observed values, with an α of 0.65 giving the Keff for snow with a density between the interquartile range of observed values for all snow types (73–365 kg m3). A set of sensitivity tests were then carried out where the value of α was iteratively changed from 0.75 to 0.25 in increments of 0.05. As the RMSE and the SHTM quantify changes over slightly different time periods (RMSE for the entire winter, SHTM for October–March), different metrics may imply different adjustments give the best model performance. In 2018–2019, a value of α between 0.65 and 0.6 resulted in the optimal model performance, with an SHTM value of 0.991 (or 0.979) and an RMSE of 1.5 ∘C (or 1.2 ∘C). However, a smaller value of α was required for best model performance in 2017–2018, with an α of 0.4 giving the lowest RMSE of 1.6 ∘C and highest SHTM of 0.986. Reducing simulated snow density in Eq. (3) () below the lowest quartile of observed values was required to increase soil temperatures to the observed range, particularly for 2017–2018, where wintertime minimum soil temperatures are up to 12.8 ∘C warmer relative to the baseline model run (Fig. 7b). Different α values will better fit different years of the simulation, though using the same best-fit value of α for the entire model run can still give good model performance, with a maximum value for the SHTM of 0.987 for an α of 0.40.
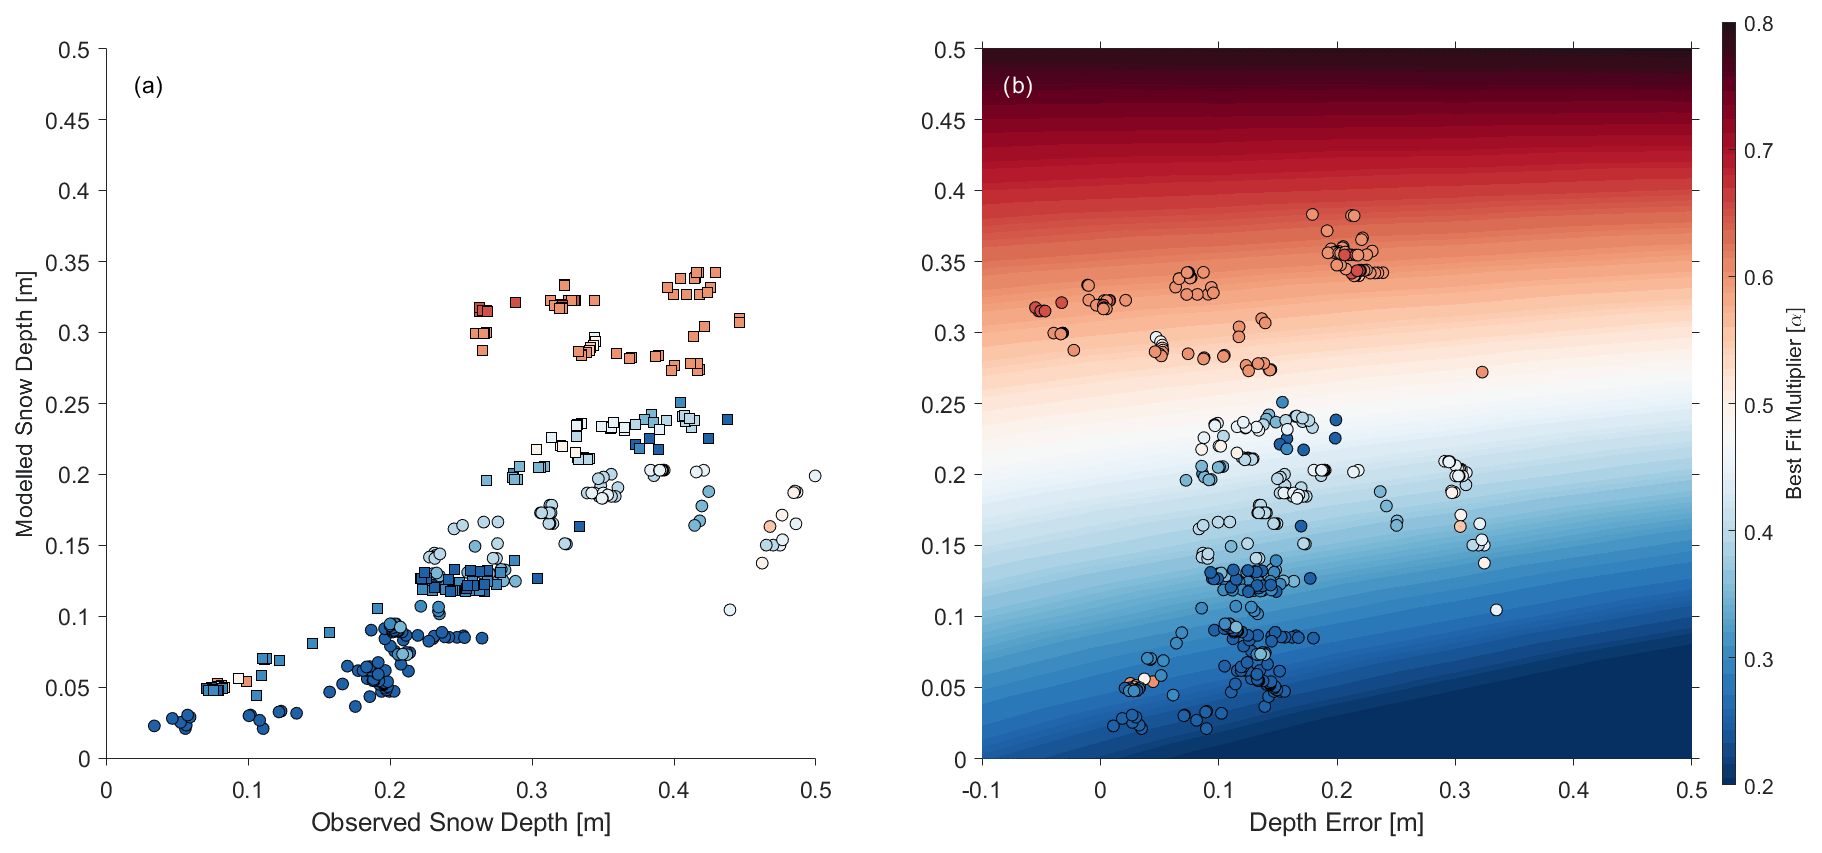
Figure 8Influence of observed (x axis; a) and modelled (y axis; both) snow depth and snow depth error (x axis; b) on the best-fit correction (colour) at each time step for both the 2017–2018 (circles) and 2018–2019 (squares) snow seasons.
Errors in the timing and depth of simulated snow cover (Fig. 7c) impact the magnitude of insulation it provides and thus the best-fit value of α (Fig. 8). A multiple linear regression was undertaken to quantify the influence of snow depth and snow depth error on the value of the best-fit correction factor, for the period from snow onset to the start of simulated snowmelt (when the simulated snow cover fraction was equal to one). This showed errors in the simulated snow depth can be compensated by a greater adjustment to snow thermal conductivity (Fig. 8b):
where S equals the simulated snow depth and E equals the simulated snow depth error. Best-fit correction values were strongly related to snow depth (R2=0.77, RMSE=0.066), with different values of α more appropriate for deep (>25 cm, α≈0.6) and shallow (<15 cm, α≈0.3) snow (Fig. 8a).
4.1 Variability of snow thermal properties
SMP profiles, processed as detailed in Appendix A, produced snow layer densities closely matched to density cutter measurements at TVC (Fig. 3) and consistent with measurements from other Arctic and sub-Arctic environments, e.g. kg m3, kg m3 and kg m3 in Barrere et al. (2017), Benson and Sturm (1993), Derksen et al. (2014), and Domine et al. (2002, 2012, 2016). SMP profiling has considerably increased the vertical resolution of density measurements and vastly reduced sampling times compared to traditional snowpits, enabling a far greater number of measurement profiles to be made across a wider distribution of snowpack conditions. Deriving profiles of thermal conductivity for the full depth of the snowpack, as facilitated by the SMP, is a novel approach, with most previous studies of snow thermal conductivity based on values sampled at a resolution of ∼ 5–10 cm (Domine et al., 2012, 2015, 2016; Gouttevin et al., 2018; Morin et al., 2010).
Depth normalisation of SMP profiles (n>200 per measurement campaign) allowed for comparison of snow properties with varying absolute depth. Snow depth distributions from all campaigns matched the shape and median values of tundra snow depths acquired across a ∼ 1500 km traverse as described in Derksen et al. (2009), which suggests transferability across wider Arctic tundra regions. Relative depth profiles of density at TVC remain consistent for all sampling campaigns, regardless of overall snowpack depth. Densities in the portion of the depth hoar layer located between 40 %–80 % depth were likely overestimated (although SMP estimates remain within the interquartile range of snowpit measurements) due to an assumption of heteroscedasticity made by the algorithm of Proksch et al. (2015), which may not apply for a material as anisotropic as depth hoar (Fig. A2). Additionally, pressure exerted on the ice matrix by the SMP may have caused wider collapse of the weak depth hoar structure during measurement (although SMP operators are easily able to handle profiles that are obviously affected by depth hoar collapse). As a result, the force required to penetrate the snow may be reduced (potentially below the detection limit of the SMP) in the gaps where the ice matrix has collapsed; required penetration force will conversely increase towards the base of the snowpack where the collapsed depth hoar has accumulated. This, plus an increased probability of SMP–vegetation interactions at the base of the snowpack, is likely the cause of density (and density-derived Keff) increases in the lower ∼ 20 % of all profiles. While the exact impact of ice matrix collapse in depth hoar is not possible to quantify directly, this limitation is not without comparison in other direct, contact measurements of snow properties such as volumetric sampling of density (Conger and Mcclung, 2009; Proksch et al., 2016) and μCT (micro-computed tomography; Zermatten et al., 2011).
The higher vertical resolution of SMP density profiles (1.25 mm; 0.25 % of snowpack depth) relative to traditional snowpit measurements (3 cm) allows for snowpack features to be much more finely resolved (Calonne et al., 2020; King et al., 2020b; Proksch et al., 2015). Moving away from bulk sampling of layers with boundaries defined by abrupt binary transitions as identified by traditional stratigraphic techniques to more continuous profiles enables features such as indurated hoar, typically a subtle transitional layer, to be captured and quantified (Pielmeier and Schneebeli, 2003; Proksch et al., 2016). Higher-resolution measurements (μCT, SMP) of continuous profiles are increasingly implemented (e.g. Proksch et al., 2016; Calonne et al., 2020; Wagner et al., 2022), but this conceptualisation of snow as a continuous profile rather than a series of discrete layers is not yet implemented in snowpack modelling, excepting the test case outlined by Simson et al. (2021).
4.2 Evaluation of snowpack and soil temperature simulations
Density profiles of Arctic snow from physical snow model simulations are inverted relative to observations, exhibiting low-density snow in the upper part of the snowpack and high-density snow at the base, similar to what would be expected in alpine environments (Barrere et al., 2017; Domine et al., 2019). CLM is no exception, with the model producing three to four layers of uniformly high-density snow, rather than a low-density snow layer adjacent to the ground overlain by a higher-density slab layer. Consequently, simulated density profiles are not representative of field measurements, and the overall bulk density of the snowpack is overestimated. This is common of other snow models of similar physical complexity (e.g. ISBA-ES, Interactions between Soil, Biosphere, and Atmosphere – explicit snow; Barrere et al., 2017) and higher complexity (e.g. SNOWPACK, Bartelt and Lehning, 2001; Crocus, Vionnet et al., 2012) because they do not account for unique Arctic processes (Domine et al., 2016, 2019), such as the snowpack vapour flux necessary to form depth hoar. As Keff is simulated as a function of density, when models are unable to accurately describe the density profiles of Arctic snowpacks, this has a negative impact on how well Keff can be simulated (Gouttevin et al., 2018). Keff values from CLM are overestimated not only relative to field measurements but also in comparison to simulations from more complex snow models in similar environments (Barrere et al., 2017; Domine et al., 2019). These problems with thermal conductivity simulations subsequently impact soil temperatures, with similar issues found for simulations of Arctic snowpacks using other models, i.e. Crocus, SNOWPACK and ISBA-ES (Barrere et al., 2017; Domine et al., 2016; 2019; Royer et al., 2021b).
The impact of snow insulation on soil temperatures is dependent on both the depth and thermal conductivity of the snowpack (Gouttevin et al., 2012), as well as the timing of snow accumulation (Lafrenière et al., 2013). The start of the snow season is particularly important because erroneously modelled heat exchanges between air, snow and soil influence soil and snowpack properties and development, which are carried forward until the end of the snow season (Sandells et al., 2012). Temperature differences between soil and air induce a strong snowpack temperature gradient, leading to depth hoar formation and thus determining the structure of the snowpack and its capacity to insulate the soil (Domine et al., 2018).
4.3 Impact of approaches to correct snow thermal conductivity
Prescribing simulated snow thermal conductivity to a more physically representative value leads to an improvement in simulating soil temperatures in tundra environments, compared to both the findings herein and the permafrost model used in Yi et al. (2020). Cook et al. (2007) also found that reducing simulated snow thermal conductivity to the lower end of observed values (0.1 W m−3) reduced soil temperature biases in an older version of CLM (CLM3.0). It has also been suggested that the simulation of wintertime soil temperatures at TVC may also be influenced by simulated soil properties and the impact of the snow cover on soil moisture content (Haagmans, 2021); bias is unlikely to be completely eliminated solely as a result of changes to snow thermal conductivity.
The impact of alternative parameterisations of snow thermal conductivity on simulated soil temperatures was tested, with a reduction in the RMSE and an improvement in the SHTM found for all three alternative parameterisations tested. Changing the parameterisation of snow thermal conductivity in CLM from that of Jordan (1991) to that of Sturm et al. (1997) gives the largest improvement to the simulation of both snow thermal conductivity values and underlying soil temperatures. Use of the Sturm et al. (1997) thermal conductivity parameterisation also improved soil temperature simulation in Crocus (Royer et al., 2021b), with an RMSE of 2.5 ∘C for soil temperatures from Crocus and CLM. The Sturm et al. (1997) parameterisation demonstrates transferability between tundra sites, having been derived from thermal conductivity measurements in the Alaskan Arctic and successfully applied to both CLM and SMP measurements at TVC. Although concern has been raised that the parameterisation of Sturm et al. (1997) may not be physically representative, we feel this provides the most feasible solution to improving soil temperature simulations in CLM given the sizable improvement in RMSE and its use in more physically representative land surface models (Royer et al., 2021b).
Application of the correction factor α improves the simulation of soil temperatures, increasing the value of the SHTM by up to 0.3. The impact of differences between simulated and observed snow depth can be compensated by a greater adjustment to snow thermal conductivity (Figs. 7b and 8). This bias compensation between underestimates of snow depth and underestimates of snow thermal conductivity is also seen in other land surface models, e.g. JULES (Joint UK Land Environment Simulator) and LPJ-GUESS (Lund–Potsdam–Jena General Ecosystem Simulator) (Wang et al., 2016). However, as discrepancies between observed and simulated snow depth can vary considerably between years, this results in a best-fit correction factor value which also changes between years. A similar bias compensation effect could apply for the use of alternative parameterisations of snow thermal conductivity. If snow depth bias was consistently positive, we suspect that the Calonne, Fourteau and Jordan parameterisations would likely compensate for an overthickened snowpack through increased thermal conductivity. However, under a negative snow depth bias, the Sturm parameterisation remains more suitable; although the absolute magnitude of the improvement in soil temperatures using the Sturm parameterisation was lower when the snow depth bias was greater in 2017–2018, the relative order of impact of the different parameterisations remained the same. These findings indicate that thermal conductivity correction factors are not the solution to soil temperature biases in models like CLM.
Differences between absolute and effective snow depths from both the model and the observational record highlight the importance of the early-season snowpack in regulating soil temperatures for the entire snow season. Simulations are sensitive to latent heat release during soil freeze-up, which maintains soil temperatures close to 0 ∘C for an extended period of time at the beginning of the winter (Yi et al., 2019). At this time, the soil thermal regime is also more sensitive to snow depth, as snow depths are lower and have not yet reached a point where their insulative capacity has become saturated (Zhang, 2005; Lawrence and Slater, 2009; Slater et al., 2017); therefore a stronger correction is needed when snow cover is below ∼ 25 cm. Shallow snowpacks are likely to consist of a lower proportion of wind slab (Rutter et al., 2019), and thus their microstructural properties are less accurately represented by CLM, which does not simulate depth hoar (Van Kampenhout et al., 2017), stipulating the need for a larger adjustment to α. We note that issues in simulating the initial accumulation of the snowpack are likely linked to uncertainties in the forcing data caused by measurement limitations surrounding the use of precipitation gauges in tundra environments (Smith, 2008; Watson et al., 2008; Pan et al., 2016). However, attempting to correct for snow depth errors through adjustment to the precipitation forcing beyond the corrections outlined in Pan et al. (2016) is not advisable due to high variability of snow depth (Fig. 2a) over short spatial scales (metres to tens of metres). Additionally, Fig. 7c suggests that the timing of the snow onset is more important in determining the soil temperature than the absolute snow depth error, as in 2018–2019 soil temperatures simulated using the Sturm parameterisation which are closer to observations than in the previous year, despite an absolute snow depth error of up to 0.2 m. Regardless of the approach, these changes to the model are most applicable where snowpack structure is considerably influenced by depth hoar, as can be approximated by grid-cell plant functional type or climatology (Royer et al., 2021a; Sturm and Liston, 2021).
Ekici et al. (2015) suggests that representation of snow thermal conductivity in land surface models is less important for accurate simulation of soil temperatures than other processes not currently well represented in most land surface schemes, such as blowing snow and depth hoar formation. Further improvements to the SHTM in future iterations of CLM will require a physically representative approach to snow density and thermal conductivity through explicit inclusion of vapour transport within the snowpack, currently under development in standalone snow microphysical models (Fourteau et al., 2021a; Jafari et al., 2020; Schürholt et al., 2022). However, this presents computational and mathematical challenges, as outlined in Jafari et al. (2020). The inclusion of physically representative parameterisations of snow properties in land surface models, such as that of Royer et al. (2021b), where the densities of lower snow layers are not allowed to exceed a maximum observation-based threshold, are more likely in the near future than the explicit representation of snowpack vapour transport. Meanwhile the substitution of the Sturm et al. (1997) thermal conductivity parameterisation provides a computationally efficient compromise, reducing both the value of Keff and the cold bias of simulated wintertime soil temperatures considerably (RMSE reduction of 3.3 ∘C).
Model underestimates of soil temperatures follow through into calculations of soil respiration, further contributing to uncertainties surrounding estimates of wintertime carbon flux (Natali et al., 2019) and suggesting that such modelled values are likely to be an underestimation of the true magnitude of these fluxes. Being able to accurately model fluxes outside of the growing season is important, as these make a considerable contribution to the annual carbon budget (Natali et al., 2019; Schuur et al., 2021). A low soil temperature bias due to poorly simulated snow insulation also has consequences for predicting the evolution of permafrost (Barrere et al., 2017; Burke et al., 2020) and resultant carbon emissions when it degrades (Peng et al., 2016).
A new recalibration to derive profiles of tundra snow density and thermal conductivity from SMP profiles of penetration force is presented, with resulting densities and thermal conductivities then used to evaluate the performance of CLM5.0. SMP-derived density profiles show good agreement with measured snow layer densities at TVC. Comparison of measured snowpack properties from in situ SMP and needle probe techniques with simulations show the model tends to overestimate snow layer thermal conductivities by up to factor of 3, with implications for how well wintertime soil temperatures are simulated. Alternative relationships between snow density and snow thermal conductivity were considered, all of which improved the simulation of wintertime soil temperatures (RMSE reduction of 0.2–3.3 ∘C). Reducing simulated thermal conductivities through the use of a correction factor (α) also improves simulation of soil temperature (RMSE reduction of 3.7 ∘C for an α of 0.45). The optimal magnitude of this reduction is strongly linked to snow depth (with a greater reduction needed for shallower snowpacks). Different optimal correction factors for different snow seasons illustrate the limitations of this approach, but the results are still instructive as a diagnostic for model sensitivity to the treatment of snow thermal conductivity.
Further improvements to simulated snow properties will require more explicit representation of key processes not currently accounted for in CLM, chiefly the formation of depth hoar. A more physically representative snowpack should also improve simulation of wintertime soil thermal conditions. Snowpack vapour kinetics are not currently included within global land surface models, which also have to consider a large variety of other processes and avenues for future development (Blyth et al., 2021; Fisher and Koven, 2020), although developments are being made to consider these in complex microscale snow physics models. Empirical scaling of snow thermal conductivity provides a computationally efficient interim solution with a similar impact on soil temperatures as the explicit representation of a large depth hoar fraction in point-scale simulations by Zhang et al. (1996), but the value of the required scaling factor changes with snow depth. Different parameterisations of snow thermal conductivity also improve simulation of soil temperatures, with that of Sturm et al. (1997) more appropriate for Arctic snowpacks (RMSE reduction of 3.3 ∘C) than that of Jordan (1991), which is used by default in CLM. Improving the accuracy with which Arctic wintertime soil temperatures can be simulated may help to reduce sizable uncertainties (Natali et al., 2019) surrounding current projections of wintertime carbon fluxes.
Differences between study environments (the original SMP coefficients were not derived for tundra snow) and SMP hardware for different versions of the SMP used by Proksch et al. (2015) and this study required new coefficients to be derived in order to relate penetration force to snow density. Methods from King et al. (2020b) were adapted to recalibrate SMP measurements from TVC in January and March 2019, described in detail in Fig. A1. Coincident SMP profiles and snowpit density measurements were available at 36 locations across the TVC catchment. A K-fold process is then used to derive new coefficients (a−d; Table A1) for Eq. (A1) (Eq. 9 in Proksch et al., 2015):
where is the median force value over the vertical distance where density is calculated and L is the element size, the distance between points where force is exerted by the SMP – approximately the distance between snow grains (Löwe and Van Herwijnen, 2012). Individual pairs of SMP-derived and snowpit-measured densities above the 95th percentile of absolute error were removed (step 7 of Fig. A1), and the K-fold recalibration was repeated (step 8) to produce revised coefficients to recalibrate the entire SMP dataset (step 9). This process was iterated until paired SMP–snowpit profiles with an R2 of less than 0.7 were removed. Poor fitting between some paired SMP–snowpit profiles was due to the spatially heterogeneous nature of the snowpack (King et al., 2020b), as microtopographic variation in hummocky tundra can lead to considerable sub-metre snowpack variability. Coefficients (Table A1) were ultimately derived from 21 paired SMP–snowpit density profiles, 16 from the January 2019 campaign and 5 from the March 2019 campaign (R2=0.88, p<0.001). These coefficients give an RMSE of 25.2, compared to an RMSE of 125 for those of Proksch et al. (2015).
Table A1Coefficients used to calculate density from SMP measurements.
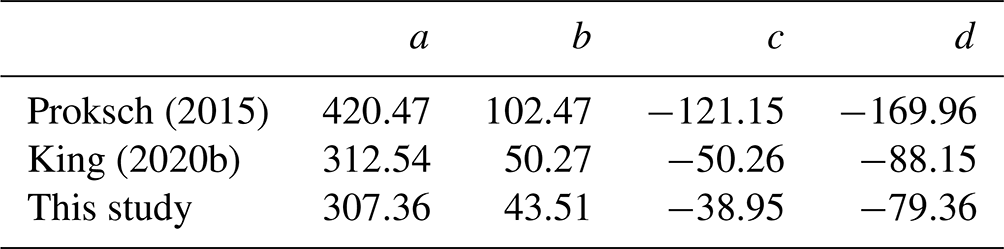
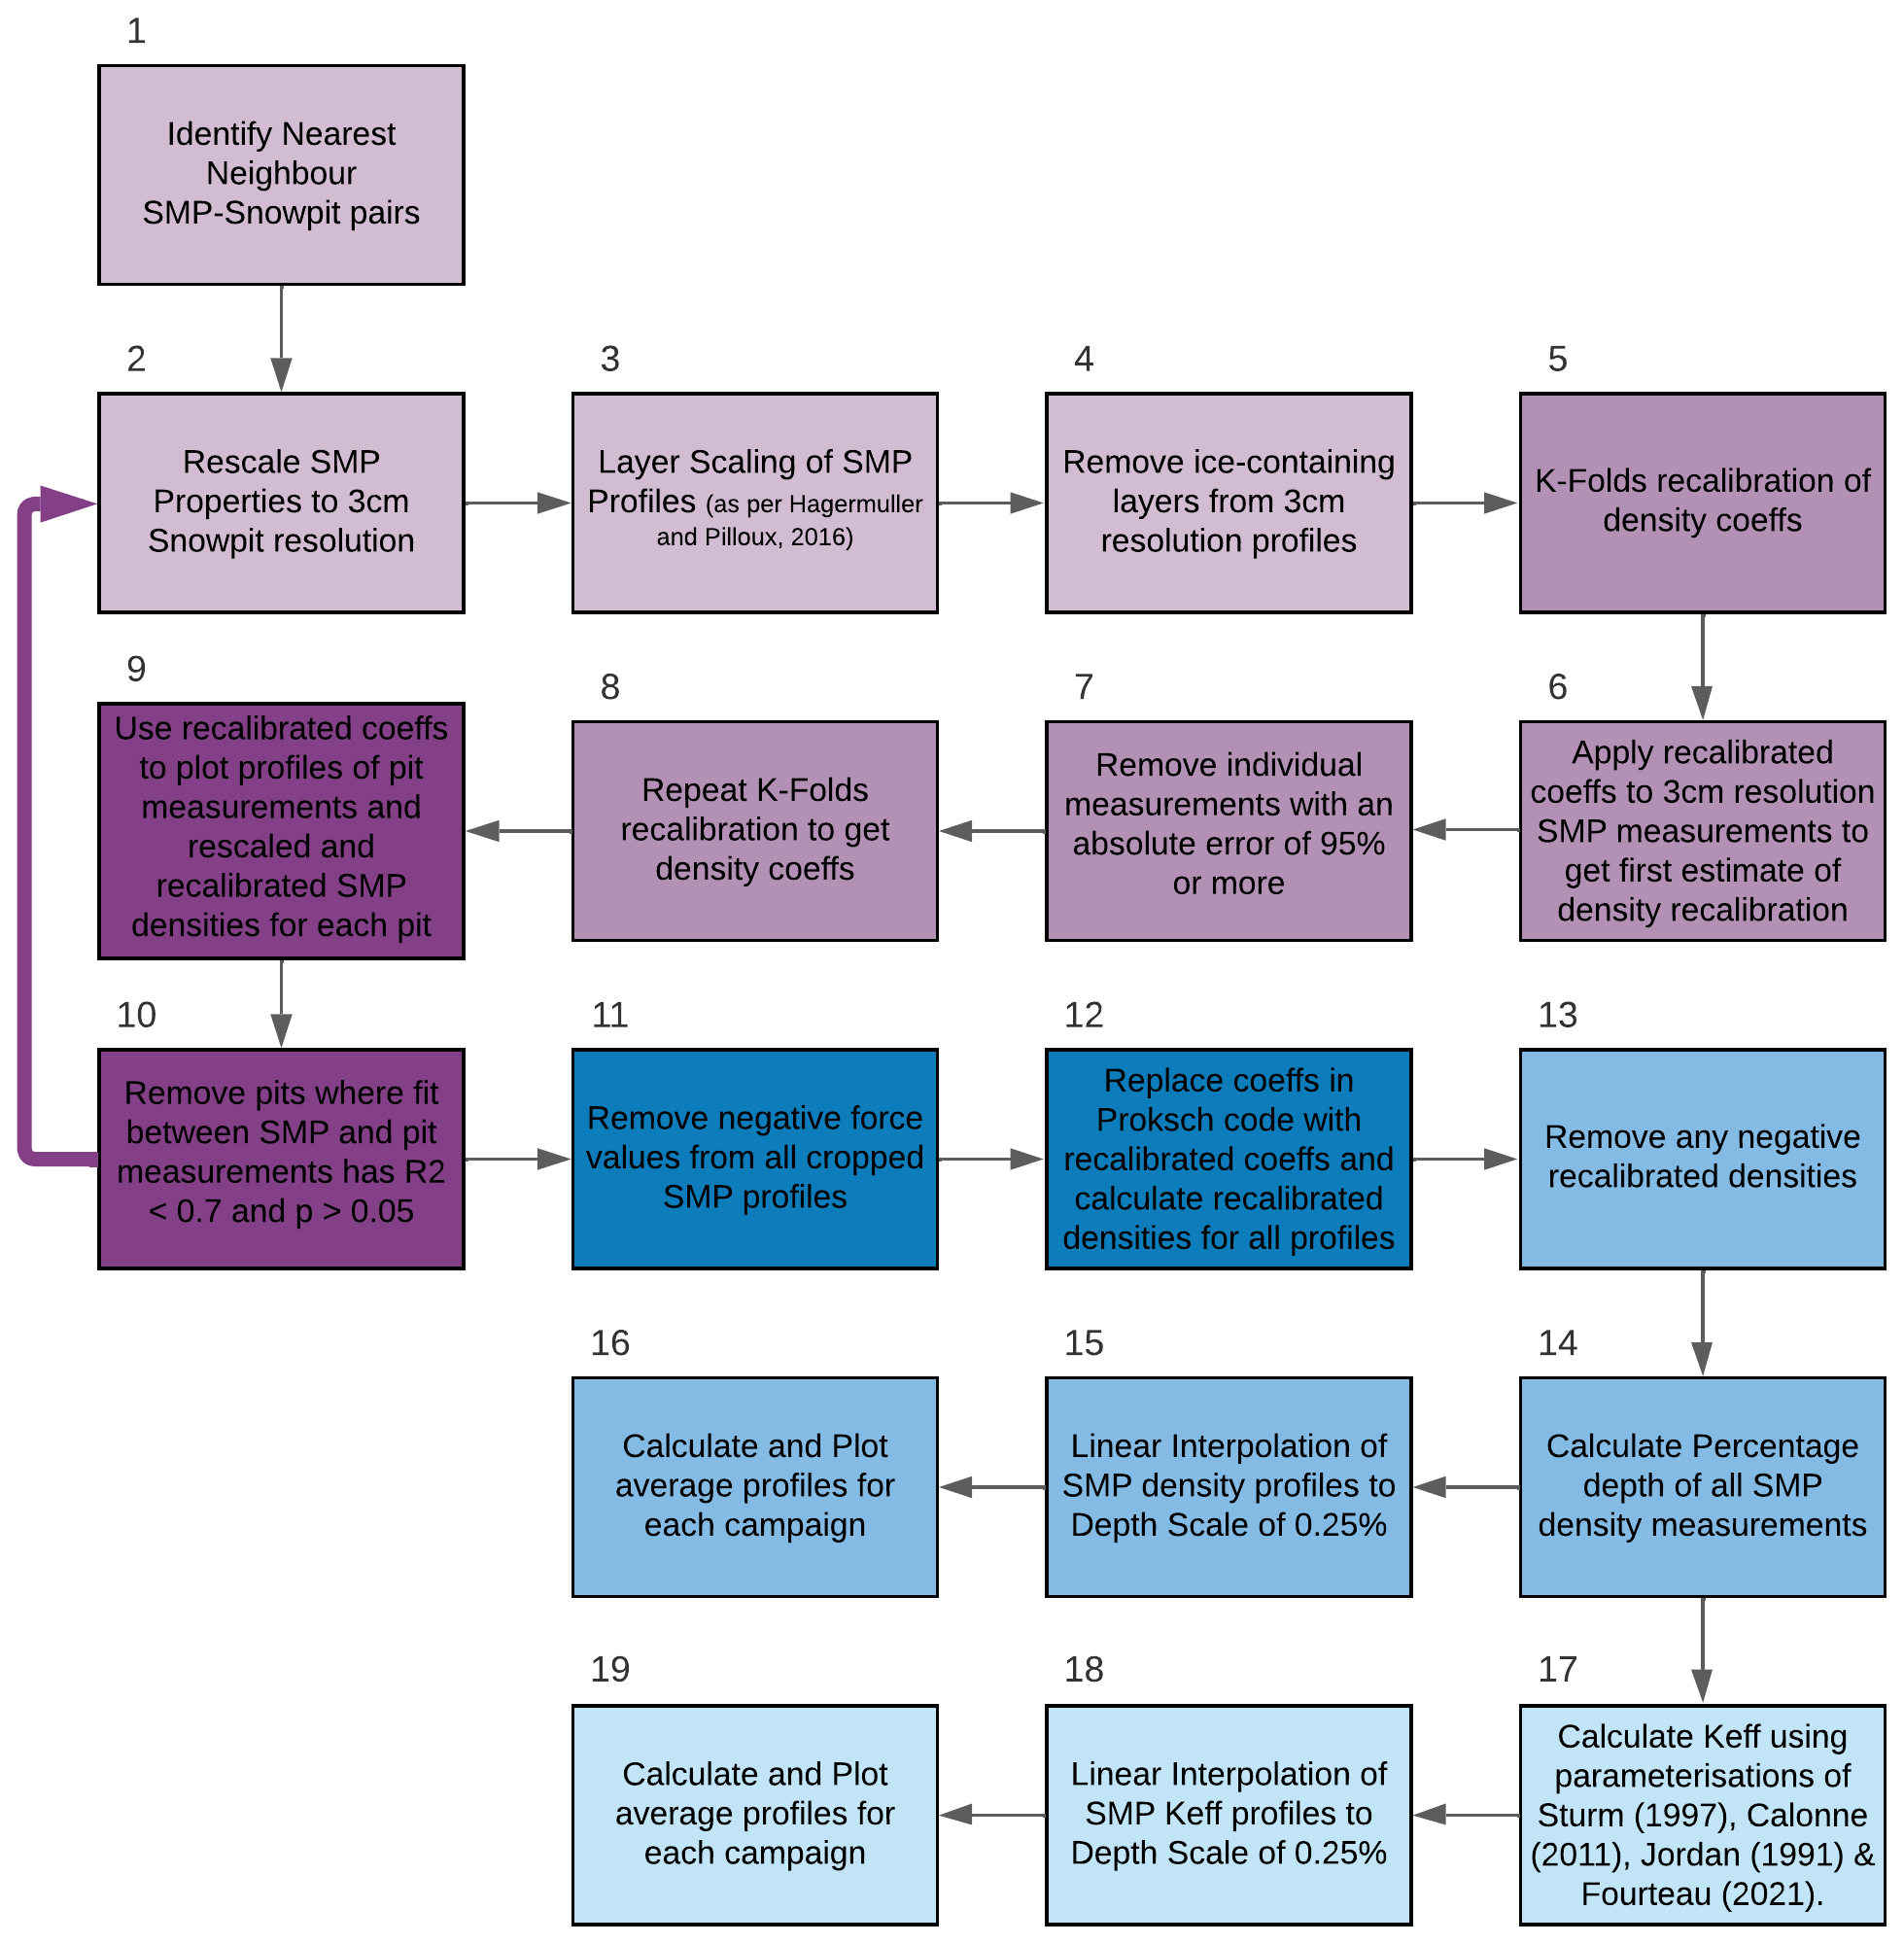
Figure A1Recalibration process for SMP densities. Steps 2–9 (purple) mirror the process of King et al. (2020b), with step 10 providing a quantitative threshold to assess whether the recalibration attempt is successful. Steps 11 to 19 (blue) apply the recalibration to the TVC dataset and derive thermal conductivity profiles from the recalibrated SMP densities. Step 17 refers to Sturm et al. (1997), Calonne et al. (2011), Jordan (1991) and Fourteau et al. (2021b).
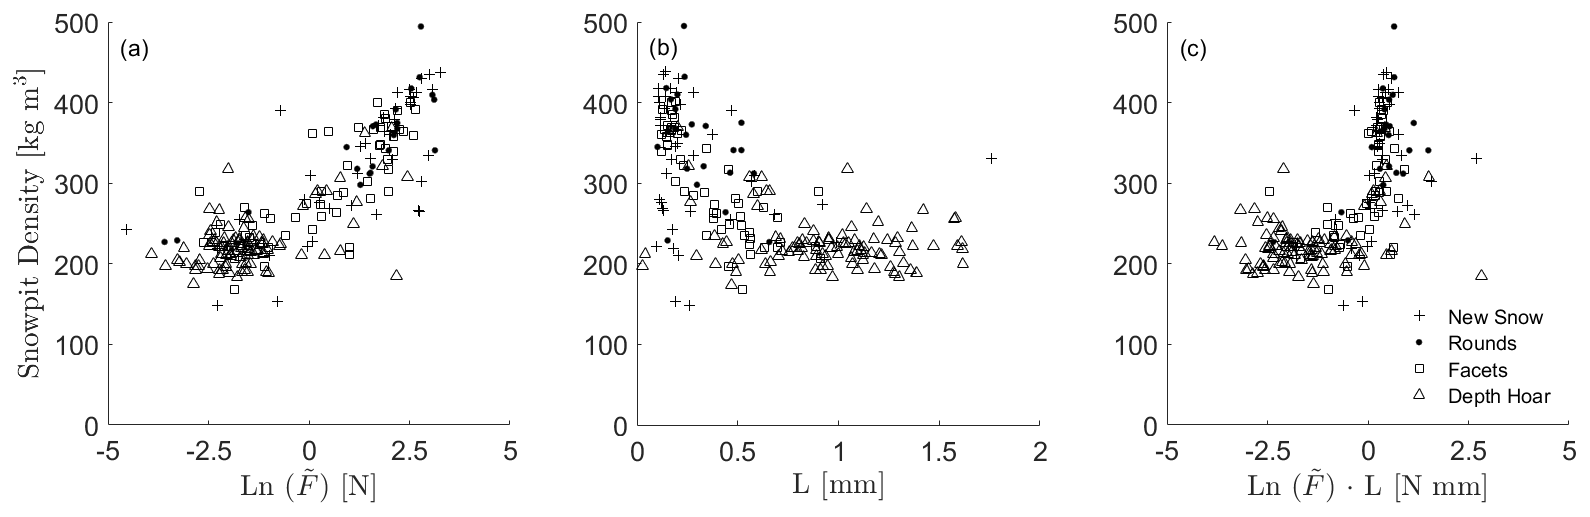
Figure A2Relationships between the snowpit densities and SMP microstructural metrics from the paired profiles in the recalibration dataset, after Fig. 5 of King et al. (2020b).
These coefficients were used to calculate density profiles for all 640 profiles from the 2019 campaigns (step 12 of Fig. A1). Densities for SMP profiles from the March 2018 campaign were also derived from these, but measurements from this campaign were not included in the recalibration dataset. Metrics were calculated over a 2.5 mm sliding window with 50 % overlap (i.e. 1.25 mm resolution), as per Proksch et al. (2015). Profiles of thermal conductivity were then calculated from SMP densities, using the density : Keff relationships derived by Sturm et al. (1997), Calonne et al. (2011), Jordan (1991) and Fourteau et al. (2021b) (step 17 of Fig. A1). It is important to note that the thermal conductivity of a snowpack is dependent on more than just its density (Sturm et al., 2002; Fourteau et al., 2021b), but these parameterisations provide a useful first-order approximation.
Prior to recalibration, negative force values were removed from the SMP profiles. These are erroneous values which can occur in the SMP output when ice gets caught in the cog wheel of the SMP or if part of the instrument is damaged (Lutz, 2009). Buried vegetation may also be present in the lower part of tundra snowpacks, and interaction between SMP and dense shrubs or branches may cause the SMP signal to overload and affect the quality of lower sections of the profile. A normalised percentage depth scale (with profiles rescaled to a resolution of 0.25 % of total depth using linear interpolation) was used to compare SMP-derived profiles of density and Keff from different snow depths (steps 15 and 18). Any negative densities or thermal conductivities were removed during the depth normalisation process.
Recalibrated density profiles from the SMP do not produce values below 200 kg m3, despite observations of lower snow densities in Arctic depth hoar, including some from this campaign (Fig. 2). Figure A2b shows a large spread in the value of L for the depth hoar samples, over a relatively small set of snowpit densities. Large element sizes or distances between snow grain failures are not unexpected in depth hoar, but this results in a low signal-to-noise ratio (King et al., 2020b). Figure A2 shows the relationship between and L is not heteroscedastic as initially assumed, leading to an overestimation of the density (and density-derived Keff) of this layer. Proksch et al. (2015) state that their model does not yet fully account for the anisotropic structure of some snow types, which is of particular relevance to depth hoar.
In order to determine the amount of model spin-up required for soil temperatures to equilibrate, iterative runs of PTCLM with an additional year of spin-up were undertaken from 1 January 2017 to 1 January 2013. Soil temperatures throughout the soil column were compared; three depths are shown in Fig. B1. Internal system variability results in a difference of ∼ 1 ∘C between model runs, with a minimum of 2 years of spin-up required for Keff adjusted runs to converge at a 10 cm soil depth. Deviation between different spin-up start times takes longer to level out deeper in the soil column, but as we only examine soil properties within the top 20 cm of the soil column, we feel this length of spin-up is sufficient. Changes to snow thermal conductivity were evident at all depths in the soil profile and have an impact on the thickness of the active layer with seasonal thawing seen to a depth of 1.7 m (Fig. B1b), in comparison to 1.35 m for the unadjusted CLM runs and the 1 m active-layer depth reported by Grünberg et al. (2020).
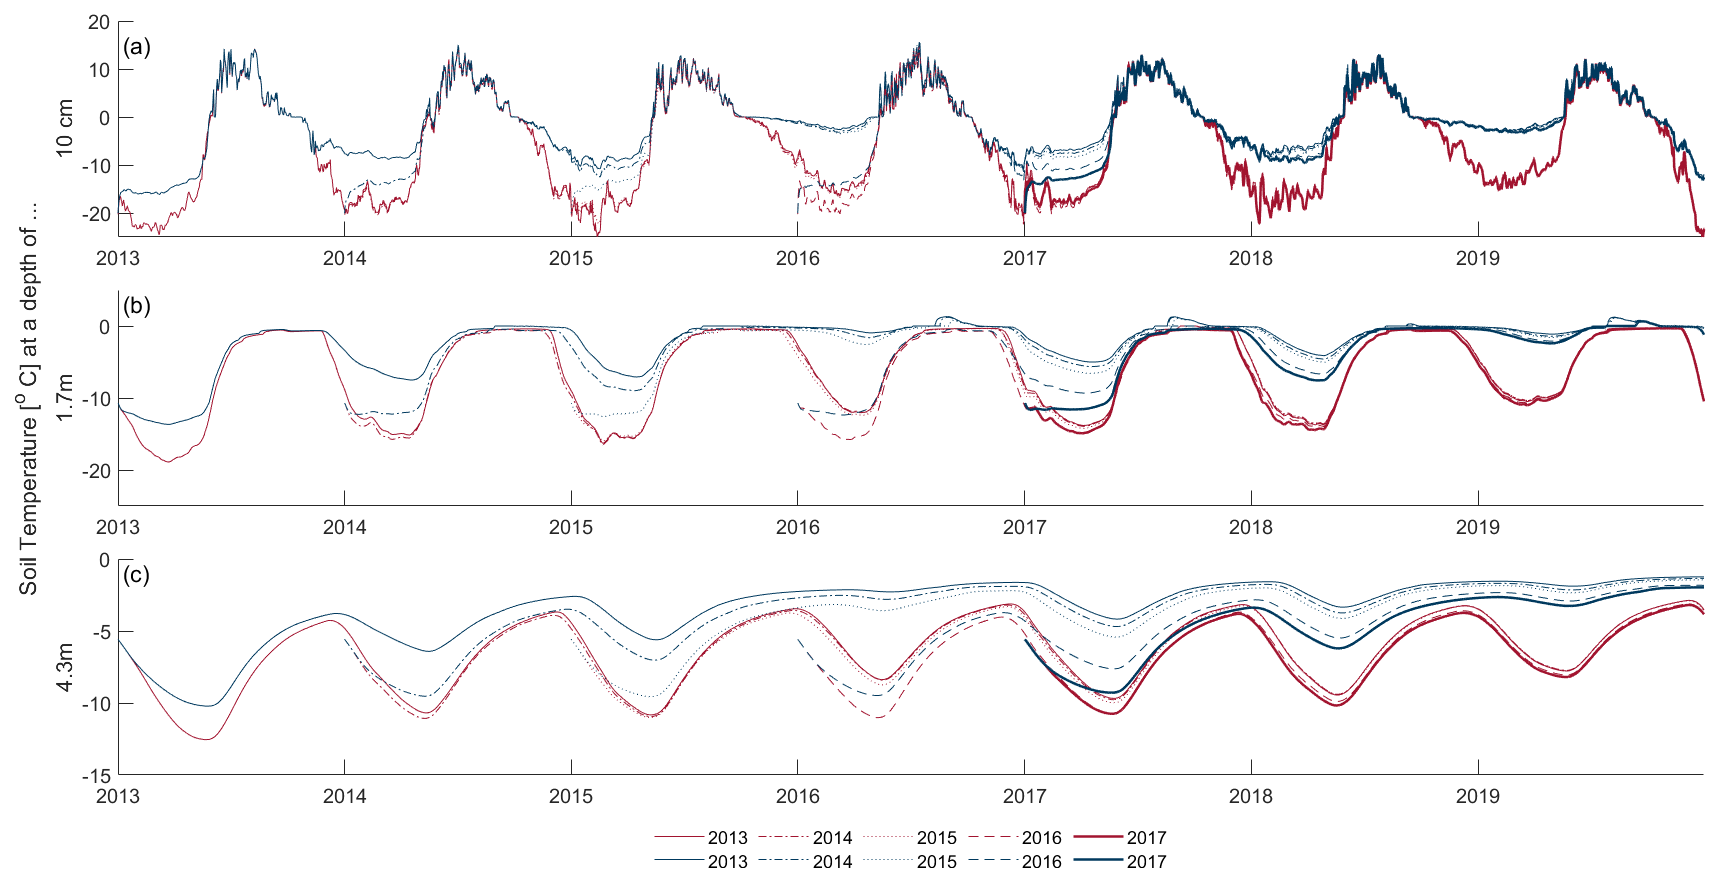
Figure B1Soil temperatures at (a) 10 cm, (b) 1.7 m and (c) 4.3 m (3rd, 11th and 16th CLM soil layers) for varying lengths of model spin-up (line styles; all spin-ups from 1 January, year given in legend), for both baseline (α=1; dark red) and Keff adjusted (α=0.3; navy blue) model conditions.
Code and data to produce figures are available at https://github.com/V-Dutch/TVCSnowCLM and https://doi.org/10.5281/zenodo.7137729 (V-Dutch, 2022).
VRD performed the investigation and formal analysis and wrote the original draft of the paper. NR, LW, MS, CD and RK supervised the project. NR, CD, RE and JK gathered TVC snow data, and BW, GHG, OS and JB acquired data via TVC meteorological observations. PM planned the data acquisition. JK and MS implemented software for SMP data, and LW initialised and assisted with CLM. NR acquired funding. All authors were involved in reviewing and editing the paper.
Some authors are members of the editorial board of The Cryosphere. The peer-review process was guided by an independent editor, and the authors have also no other competing interests to declare.
Publisher’s note: Copernicus Publications remains neutral with regard to jurisdictional claims in published maps and institutional affiliations.
This project was conducted with approval issued by Aurora Research Institute, Aurora College (license nos. 16237 and 16501). The authors would like to acknowledge that this study occurred within the Inuvialuit Settlement Region located in the western Canadian Arctic.
Victoria R. Dutch was funded by a Research Development Fund (RDF) studentship from Northumbria University and the Northern Water Futures project. Nick Rutter and Leanne Wake were supported by the Natural Environment Research Council (NERC; grant no. NE/W003686/1). Nick Rutter and Richard Essery were supported by the NERC Arctic Office UK–Canada Arctic Bursaries. Funding for Julia Boike was provided from the Helmholtz Association in the framework of MOSES (Modular Observation Solutions for Earth Systems).
This paper was edited by Ketil Isaksen and reviewed by Florent Dominé, David Lawrence, and two anonymous referees.
Anderson, E., A.: A point energy and mass balance model of a snow cover, National Oceanic and Atmospheric Administration, NOAA technical report NWS, 19, Silver Spring, Maryland, USA, https://repository.library.noaa.gov/view/noaa/6392 (last access: 4 October 2022), 1976.
Barrere, M., Domine, F., Decharme, B., Morin, S., Vionnet, V., and Lafaysse, M.: Evaluating the performance of coupled snow–soil models in SURFEXv8 to simulate the permafrost thermal regime at a high Arctic site, Geosci. Model Dev., 10, 3461–3479, https://doi.org/10.5194/gmd-10-3461-2017, 2017.
Bartelt, P. and Lehning, M.: A physical SNOWPACK model for the Swiss avalanche warning Part I: numerical model, Cold Reg. Sci. Technol., 35, 123–145, https://doi.org/10.1016/S0165-232X(02)00074-5, 2001.
Benson, C. S. and Sturm, M.: Structure and wind transport of seasonal snow on the Arctic slope of Alaska, Ann. Glaciol., 18, 261–267, https://doi.org/10.3189/s0260305500011629, 1993.
Biskaborn, B. K., Smith, S. L., Noetzli, J., Matthes, H., Vieira, G., Streletskiy, D. A., Schoeneich, P., Romanovsky, V. E., Lewkowicz, A. G., Abramov, A., Allard, M., Boike, J., Cable, W. L., Christiansen, H. H., Delaloye, R., Diekmann, B., Drozdov, D., Etzelmuller, B., Grosse, G., Guglielmin, M., Ingeman-Nielsen, T., Isaksen, K., Ishikawa, M., Johansson, M., Johannsson, H., Joo, A., Kaverin, D., Kholodov, A., Konstantinov, P., Kroger, T., Lambiel, C., Lanckman, J. P., Luo, D., Malkova, G., Meiklejohn, I., Moskalenko, N., Oliva, M., Phillips, M., Ramos, M., Sannel, A. B. K., Sergeev, D., Seybold, C., Skryabin, P., Vasiliev, A., Wu, Q., Yoshikawa, K., Zheleznyak, M., and Lantuit, H.: Permafrost is warming at a global scale, Nat. Commun., 10, 264, https://doi.org/10.1038/s41467-018-08240-4, 2019.
Blyth, E. M., Arora, V. K., Clark, D. B., Dadson, S. J., De Kauwe, M. G., Lawrence, D. M., Melton, J. R., Pongratz, J., Turton, R. H., Yoshimura, K., and Yuan, H.: Advances in Land Surface Modelling, Current Climate Change Reports, 7, 45–71, https://doi.org/10.1007/s40641-021-00171-5, 2021.
Boike, J., Cable, W. L., Bornemann, N., and Lange, S.: Trail Valley Creek, NWT, Canada Soil Moisture and Temperature 2016–2019, PANGAEA [data set], https://doi.org/10.1594/PANGAEA.923373, 2020.
Burke, E. J., Zhang, Y., and Krinner, G.: Evaluating permafrost physics in the Coupled Model Intercomparison Project 6 (CMIP6) models and their sensitivity to climate change, The Cryosphere, 14, 3155–3174, https://doi.org/10.5194/tc-14-3155-2020, 2020.
Calonne, N., Flin, F., Morin, S., Lesaffre, B., du Roscoat, S. R., and Geindreau, C.: Numerical and experimental investigations of the effective thermal conductivity of snow, Geophys. Res. Lett., 38, 00948276, https://doi.org/10.1029/2011gl049234, 2011.
Calonne, N., Richter, B., Löwe, H., Cetti, C., ter Schure, J., Van Herwijnen, A., Fierz, C., Jaggi, M., and Schneebeli, M.: The RHOSSA campaign: multi-resolution monitoring of the seasonal evolution of the structure and mechanical stability of an alpine snowpack, The Cryosphere, 14, 1829–1848, https://doi.org/10.5194/tc-14-1829-2020, 2020.
CESM research tools: CLM4.5 in CESM1.2.0 user’s guide documentation, https://www.cesm.ucar.edu/models/cesm1.2/clm/models/lnd/clm/doc/UsersGuide/x13167.html, last access: 3 December 2021.
Conger, S. M. and McClung, D. M.: Comparison of density cutters for snow profile observations, J. Glaciol., 55, 163–169, 2009.
Cook, B. I., Bonan, G. B., Levis, S., and Epstein, H. E.: The thermoinsulation effect of snow cover within a climate model, Clim. Dynam., 31, 107–124, https://doi.org/10.1007/s00382-007-0341-y, 2007.
Derksen, C., Lemmetyinen, J., Toose, P., Silis, A., Pulliainen, J., and Sturm, M.: Physical properties of Arctic versus subarctic snow: Implications for high latitude passive microwave snow water equivalent retrievals, J. Geophys. Res.-Atmos., 119, 7254–7270, https://doi.org/10.1002/2013jd021264, 2014.
Derksen, C., Sturm, M., Holmgren, J., Liston, G. E., Huntington, H., Silis, A., and Solie, D.: Northwest Territories and Nunavut Snow Characteristics from a Subarctic Traverse: Implications for Passive Microwave Remote Sensing, J. Hydrometeorol., 10, 448–463, https://doi.org/10.1175/2008jhm1074.1, 2009.
Domine, F., Barrere, M., and Sarrazin, D.: Seasonal evolution of the effective thermal conductivity of the snow and the soil in high Arctic herb tundra at Bylot Island, Canada, The Cryosphere, 10, 2573–2588, https://doi.org/10.5194/tc-10-2573-2016, 2016.
Domine, F., Cabanes, A., and Legagneux, L.: Structure, microphysics, and surface area of the Arctic snowpacknear Alert during the ALERT 2000 campaign, Atmos. Environ., 36, 2753–2765, 2002.
Domine, F., Gallet, J.-C., Bock, J., and Morin, S.: Structure, specific surface area and thermal conductivity of the snowpack around Barrow, Alaska, J. Geophys. Res.-Atmos., 117, 1265–1276, https://doi.org/10.1029/2011jd016647, 2012.
Domine, F., Barrere, M., Sarrazin, D., Morin, S., and Arnaud, L.: Automatic monitoring of the effective thermal conductivity of snow in a low-Arctic shrub tundra, The Cryosphere, 9, 1265–1276, https://doi.org/10.5194/tc-9-1265-2015, 2015.
Domine, F., Belke-Brea, M., Sarrazin, D., Arnaud, L., Barrere, M., and Poirier, M.: Soil moisture, wind speed and depth hoar formation in the Arctic snowpack, J. Glaciol., 64, 990–1002, https://doi.org/10.1017/jog.2018.89, 2018.
Domine, F., Picard, G., Morin, S., Barrere, M., Madore, J.-B., and Langlois, A.: Major Issues in Simulating Some Arctic Snowpack Properties Using Current Detailed Snow Physics Models: Consequences for the Thermal Regime and Water Budget of Permafrost, J. Adv. Model. Earth Sys., 11, 34–44, https://doi.org/10.1029/2018ms001445, 2019.
Ekici, A., Chadburn, S., Chaudhary, N., Hajdu, L. H., Marmy, A., Peng, S., Boike, J., Burke, E., Friend, A. D., Hauck, C., Krinner, G., Langer, M., Miller, P. A., and Beer, C.: Site-level model intercomparison of high latitude and high altitude soil thermal dynamics in tundra and barren landscapes, The Cryosphere, 9, 1343–1361, https://doi.org/10.5194/tc-9-1343-2015, 2015.
Essery, R. and Pomeroy, J.: Vegetation and Topographic Control of Wind-Blown Snow Distributions in Distributed and Aggregated Simulations for an Arctic Tundra Basin, J. Hydrometeorol., 5, 735–744, 2004.
Essery, R., Kontu, A., Lemmetyinen, J., Dumont, M., and Ménard, C. B.: A 7-year dataset for driving and evaluating snow models at an Arctic site (Sodankylä, Finland), Geosci. Instrum. Method. Data Syst., 5, 219–227, https://doi.org/10.5194/gi-5-219-2016, 2016.
Fierz, C., Armstrong, R. L., Durand, Y., Etchevers, P., Greene, E., McClung, D. M., Nishimura, K., Satyawali, P. K., and Sokratov, S. A.: The International Classification for Seasonal Snow on the ground, 90 pp., https://unesdoc.unesco.org/ark:/48223/pf0000186462 (last access: 4 October 2022), 2009.
Fisher, J. B., Sikka, M., Oechel, W. C., Huntzinger, D. N., Melton, J. R., Koven, C. D., Ahlström, A., Arain, M. A., Baker, I., Chen, J. M., Ciais, P., Davidson, C., Dietze, M., El-Masri, B., Hayes, D., Huntingford, C., Jain, A. K., Levy, P. E., Lomas, M. R., Poulter, B., Price, D., Sahoo, A. K., Schaefer, K., Tian, H., Tomelleri, E., Verbeeck, H., Viovy, N., Wania, R., Zeng, N., and Miller, C. E.: Carbon cycle uncertainty in the Alaskan Arctic, Biogeosciences, 11, 4271–4288, https://doi.org/10.5194/bg-11-4271-2014, 2014.
Fisher, R. A. and Koven, C. D.: Perspectives on the Future of Land Surface Models and the Challenges of Representing Complex Terrestrial Systems, J. Adv. Model. Earth Sys., 12, 1942-2466, https://doi.org/10.1029/2018ms001453, 2020.
Fourteau, K., Domine, F., and Hagenmuller, P.: Macroscopic water vapor diffusion is not enhanced in snow, The Cryosphere, 15, 389–406, https://doi.org/10.5194/tc-15-389-2021, 2021a.
Fourteau, K., Domine, F., and Hagenmuller, P.: Impact of water vapor diffusion and latent heat on the effective thermal conductivity of snow, The Cryosphere, 15, 2739–2755, https://doi.org/10.5194/tc-15-2739-2021, 2021b.
Goncharova, O. Y., Matyshak, G. V., Epstein, H. E., Sefilian, A. R., and Bobrik, A. A.: Influence of snow cover on soil temperatures: Meso- and micro-scale topographic effects (a case study from the northern West Siberia discontinuous permafrost zone), Catena, 183, 03418162, https://doi.org/10.1016/j.catena.2019.104224, 2019.
Gouttevin, I., Langer, M., Löwe, H., Boike, J., Proksch, M., and Schneebeli, M.: Observation and modelling of snow at a polygonal tundra permafrost site: spatial variability and thermal implications, The Cryosphere, 12, 3693–3717, https://doi.org/10.5194/tc-12-3693-2018, 2018.
Gouttevin, I., Menegoz, M., Dominé, F., Krinner, G., Koven, C., Ciais, P., Tarnocai, C., and Boike, J.: How the insulating properties of snow affect soil carbon distribution in the continental pan-Arctic area, J. Geophys. Res.-Biogeosci., 117, 01480227, https://doi.org/10.1029/2011jg001916, 2012.
Gray, D. M. and Male, D. H.: Handbook of Snow: Principles, Processes, Management & Use, Blackburn Press, Caldwell, New Jersey, USA, ISBN 9781932846065, 1981.
Grünberg, I., Wilcox, E. J., Zwieback, S., Marsh, P., and Boike, J.: Linking tundra vegetation, snow, soil temperature, and permafrost, Biogeosciences, 17, 4261–4279, https://doi.org/10.5194/bg-17-4261-2020, 2020.
Haagmans, V.: Modelling the significance of snow-vegetation interactions for active layer dynamics in an Arctic permafrost region subjected to tundra shrubification, Masters thesis, ETH Zurich, Zurich, Switzerland, https://www.research-collection.ethz.ch/handle/20.500.11850/518127 (last access: 4 October 2022), 2021.
Hagenmuller, P. and Pilloix, T.: A New Method for Comparing and Matching Snow Profiles, Application for Profiles Measured by Penetrometers, Front. Earth Sci., 4, 2296-6463, https://doi.org/10.3389/feart.2016.00052, 2016.
Hersbach, H., Bell, B., Berrisford, P., Hirahara, S., Horányi, A., Muñoz-Sabater, J., Nicolas, J., Peubey, C., Radu, R., Schepers, D., Simmons, A., Soci, C., Abdalla, S., Abellan, X., Balsamo, G., Bechtold, P., Biavati, G., Bidlot, J., Bonavita, M., Chiara, G., Dahlgren, P., Dee, D., Diamantakis, M., Dragani, R., Flemming, J., Forbes, R., Fuentes, M., Geer, A., Haimberger, L., Healy, S., Hogan, R. J., Hólm, E., Janisková, M., Keeley, S., Laloyaux, P., Lopez, P., Lupu, C., Radnoti, G., Rosnay, P., Rozum, I., Vamborg, F., Villaume, S., and Thépaut, J. N.: The ERA5 global reanalysis, Quarterly J. Roy. Meteorol. Soc., 146, 1999–2049, https://doi.org/10.1002/qj.3803, 2020.
Jafari, M., Gouttevin, I., Couttet, M., Wever, N., Michel, A., Sharma, V., Rossmann, L., Maass, N., Nicolaus, M., and Lehning, M.: The Impact of Diffusive Water Vapor Transport on Snow Profiles in Deep and Shallow Snow Covers and on Sea Ice, Front. Earth Sci., 8, 2296-6463, https://doi.org/10.3389/feart.2020.00249, 2020.
Jafarov, E. E., Nicolsky, D. J., Romanovsky, V. E., Walsh, J. E., Panda, S. K., and Serreze, M. C.: The effect of snow: How to better model ground surface temperatures, Cold Reg. Sci. Technology, 102, 63–77, https://doi.org/10.1016/j.coldregions.2014.02.007, 2014.
Jordan, R.: A One-Dimensional Temperature Model for a Snow Cover – Technical Documentation for SNTHERM.89, Cold Regions Research and Engineering Laboratory, USA, https://hdl.handle.net/11681/11677 (last access: 4 October 2022), 1991.
King, J., Toose, P., Silis, A., and Derksen, C.: TVC Snow 2018–2019 tundra snow depth probe measurements (Version 1), Zenodo [data set], https://doi.org/10.5281/zenodo.4021401, 2020a.
King, J., Howell, S., Brady, M., Toose, P., Derksen, C., Haas, C., and Beckers, J.: Local-scale variability of snow density on Arctic sea ice, The Cryosphere, 14, 4323–4339, https://doi.org/10.5194/tc-14-4323-2020, 2020b.
King, J., Derksen, C., Toose, P., Langlois, A., Larsen, C., Lemmetyinen, J., Marsh, P., Montpetit, B., Roy, A., Rutter, N., and Sturm, M.: The influence of snow microstructure on dual-frequency radar measurements in a tundra environment, Remote Sens. Environ., 215, 242–254, https://doi.org/10.1016/j.rse.2018.05.028, 2018.
CESM research tools: CLM4.5 in CESM1.2.0 user's guide documentation, https://www.cesm.ucar.edu/models/cesm1.2/clm/models/lnd/clm/doc/UsersGuide/x13167.html, last access: 3 December 2021.
Koven, C., Riley, W. J., and Stern, A.: Analysis of Permafrost Thermal Dynamics and Response to Climate Change in the CMIP5 Earth System Models, J. Climate, 26, 1877–1900, https://doi.org/10.1175/JCLI-D-12-00228.1, 2012.
Lafrenière, M. J., Laurin, E., and Lamoureux, S. F.: The Impact of Snow Accumulation on the Active Layer Thermal Regime in High Arctic Soils, Vadose Zone Journal, 12, 1–13, https://doi.org/10.2136/vzj2012.0058, 2013.
Lawrence, D. M. and Slater, A. G.: The contribution of snow condition trends to future ground climate, Clim. Dynam., 34, 969–981, https://doi.org/10.1007/s00382-009-0537-4, 2009.
Lawrence, D. M., Fisher, R. A., Koven, C., Oleson, K., Swenson, S., Vertenstein, M., Andre, B., Bonan, G., Ghimire, B., van Kampenhout, L., Kennedy, D., Kluzek, E., Knox, R., Lawrence, P., Li, F., Li, H., Lombardozzi, D., Lu, Y., Perket, J., Riley, W. J., Sacks, W. J., Shi, M., Wieder, W. R., Xu, C., Ali, A. A., Badger, A. M., Bisht, G., Broxton, P. D., Brunke, M. A., Buzan, J., Clark, M., Craig, T., Dahlin, K., Drewniak, B., Emmons, L., Fisher, J. B., Flanner, M., Gentine, P., Lenaerts, J., Levis, S., Leung, L. R., Lipscomb, W. H., Pelletier, J. D., Ricciuto, D. M., Sanderson, B. M., Shuman, J., Slater, A., Subin, Z. M., Tang, J., Tawfik, A., Thomas, Q., Tilmes, S., Vitt, F., and Zeng, X.: Technical Description of version 5.0 of the Community Land Model (CLM), National Centre for Atmospheric Research, Boulder, Colorado, https://www.cesm.ucar.edu/models/cesm2/land/CLM50_Tech_Note.pdf (last access: 4 October 2022), 2018.
Lawrence, D. M., Fisher, R. A., Koven, C. D., Oleson, K. W., Swenson, S. C., Bonan, G., Collier, N., Ghimire, B., Kampenhout, L., Kennedy, D., Kluzek, E., Lawrence, P. J., Li, F., Li, H., Lombardozzi, D., Riley, W. J., Sacks, W. J., Shi, M., Vertenstein, M., Wieder, W. R., Xu, C., Ali, A. A., Badger, A. M., Bisht, G., Broeke, M., Brunke, M. A., Burns, S. P., Buzan, J., Clark, M., Craig, A., Dahlin, K., Drewniak, B., Fisher, J. B., Flanner, M., Fox, A. M., Gentine, P., Hoffman, F., Keppel-Aleks, G., Knox, R., Kumar, S., Lenaerts, J., Leung, L. R., Lipscomb, W. H., Lu, Y., Pandey, A., Pelletier, J. D., Perket, J., Randerson, J. T., Ricciuto, D. M., Sanderson, B. M., Slater, A., Subin, Z. M., Tang, J., Thomas, R. Q., Val Martin, M., and Zeng, X.: The Community Land Model Version 5: Description of New Features, Benchmarking, and Impact of Forcing Uncertainty, J. Adv. Model. Earth Sys., 11, 4245–4287, https://doi.org/10.1029/2018ms001583, 2019.
Löwe, H. and van Herwijnen, A.: A Poisson shot noise model for micro-penetration of snow, Cold Reg. Sci. Tech., 70, 62–70, https://doi.org/10.1016/j.coldregions.2011.09.001, 2012.
Lutz, E. R.: Spatial and Temporal Analysis of Snowpack Strength and Stablity and Environmental Determinants on an Inclined, Forest Opening, Department of Earth Science, Montana State University, USA, https://scholarworks.montana.edu/xmlui/handle/1/1765 (last access: 4 October 2022), 2009.
Malle, J., Rutter, N., Webster, C., Mazzotti, G., Wake, L., and Jonas, T.: Effect of Forest Canopy Structure on Wintertime Land Surface Albedo: Evaluating CLM5 Simulations With InSitu Measurements, J. Geophys. Res.-Atmos., 9, 2169-8996, https://doi.org/10.1029/2020JD034118, 2021.
Marsh, P. and Pomeroy, J. W.: Spatial and temporal variations in snowmelt runoff chemistry, Northwest Territories, Canada, Water Resour. Res., 35, 1559–1567, https://doi.org/10.1029/1998wr900109, 1999.
Marsh, P., Pomeroy, J., Pohl, S., Quinton, W., Onclin, C., Russell, M., Neumann, N., Pietroniro, A., Davison, B., and McCartney, S.: Snowmelt Processes and Runoff at the Arctic Treeline: Ten Years of MAGS Research, in: Cold Region Atmospheric and Hydrologic Studies, The Mackenzie GEWEX Experience, Springer Berlin, vol. 2, 97–123, https://doi.org/10.1007/978-3-540-75136-6_6, 2008.
Morin, S., Domine, F., Arnaud, L., and Picard, G.: In-situ monitoring of the time evolution of the effective thermal conductivity of snow, Cold Reg. Sci. Tech., 64, 73–80, https://doi.org/10.1016/j.coldregions.2010.02.008, 2010.
Natali, S. M., Watts, J. D., Rogers, B. M., Potter, S., Ludwig, S. M., Selbmann, A.-K., Sullivan, P. F., Abbott, B. W., Arndt, K. A., Birch, L., Björkman, M. P., Bloom, A. A., Celis, G., Christensen, T. R., Christiansen, C. T., Commane, R., Cooper, E. J., Crill, P., Czimczik, C., Davydov, S., Du, J., Egan, J. E., Elberling, B., Euskirchen, E. S., Friborg, T., Genet, H., Göckede, M., Goodrich, J. P., Grogan, P., Helbig, M., Jafarov, E. E., Jastrow, J. D., Kalhori, A. A. M., Kim, Y., Kimball, J. S., Kutzbach, L., Lara, M. J., Larsen, K. S., Lee, B.-Y., Liu, Z., Loranty, M. M., Lund, M., Lupascu, M., Madani, N., Malhotra, A., Matamala, R., McFarland, J., McGuire, A. D., Michelsen, A., Minions, C., Oechel, W. C., Olefeldt, D., Parmentier, F.-J. W., Pirk, N., Poulter, B., Quinton, W., Rezanezhad, F., Risk, D., Sachs, T., Schaefer, K., Schmidt, N. M., Schuur, E. A. G., Semenchuk, P. R., Shaver, G., Sonnentag, O., Starr, G., Treat, C. C., Waldrop, M. P., Wang, Y., Welker, J., Wille, C., Xu, X., Zhang, Z., Zhuang, Q., and Zona, D.: Large loss of CO2 in winter observed across the northern permafrost region, Nat. Clim. Change, 9, 852–857, https://doi.org/10.1038/s41558-019-0592-8, 2019.
Niu, G.-Y. and Yang, Z.-L.: Effects of Frozen Soil on Snowmelt Runoff and Soil Water Storage at a Continental Scale, J. Hydrometeorol., 7, 937–952, 2006.
Pan, X., Yang, D., Li, Y., Barr, A., Helgason, W., Hayashi, M., Marsh, P., Pomeroy, J., and Janowicz, R. J.: Bias corrections of precipitation measurements across experimental sites in different ecoclimatic regions of western Canada, The Cryosphere, 10, 2347–2360, https://doi.org/10.5194/tc-10-2347-2016, 2016.
Peng, S., Ciais, P., Krinner, G., Wang, T., Gouttevin, I., McGuire, A. D., Lawrence, D., Burke, E., Chen, X., Decharme, B., Koven, C., MacDougall, A., Rinke, A., Saito, K., Zhang, W., Alkama, R., Bohn, T. J., Delire, C., Hajima, T., Ji, D., Lettenmaier, D. P., Miller, P. A., Moore, J. C., Smith, B., and Sueyoshi, T.: Simulated high-latitude soil thermal dynamics during the past 4 decades, The Cryosphere, 10, 179–192, https://doi.org/10.5194/tc-10-179-2016, 2016.
Pielmeier, C. and Schneebeli, M.: Developments in the Stratigraphy of Snow, Surv. Geophys., 24, 389–416, 2003.
Pomeroy, J., Marsh, P., and Lesack, L.: Relocation of Major Ions in Snow along the Tundra-Taiga Ecotone, Nordic Hydrology, 24, 151–168, 1993.
Proksch, M., Löwe, H., and Schneebeli, M.: Density, specific surface area, and correlation length of snow measured by high-resolution penetrometry, J. Geophys. Res.-Earth Surf., 120, 346–362, https://doi.org/10.1002/2014jf003266, 2015.
Proksch, M., Rutter, N., Fierz, C., and Schneebeli, M.: Intercomparison of snow density measurements: bias, precision, and vertical resolution, The Cryosphere, 10, 371–384, https://doi.org/10.5194/tc-10-371-2016, 2016.
Quinton, W. L. and Marsh, P.: The Influence of Mineral Earth Hummocks on Subsurface Drainage in the Continuous Permafrost Zone, Permafrost Periglac., 9, 213–228, 1998.
Quinton, W. L. and Marsh, P.: A Conceptual Framework for Runoff Generation in a Permafrost Environment, Hydrol. Process., 13, 2563–2581, 1999.
Rees, A., English, M., Derksen, C., Toose, P., and Silis, A.: Observations of late winter Canadian tundra snow cover properties, Hydrol. Process., 28, 3962–3977, https://doi.org/10.1002/hyp.9931, 2014.
Riche, F. and Schneebeli, M.: Thermal conductivity of snow measured by three independent methods and anisotropy considerations, The Cryosphere, 7, 217–227, https://doi.org/10.5194/tc-7-217-2013, 2013.
Royer, A., Domine, F., Roy, A., Langlois, A., Marchand, N., and Davesne, G.: New northern snowpack classification linked to vegetation cover on a latitudinal mega-transect across northeastern Canada, Écoscience, 28, 225–242, https://doi.org/10.1080/11956860.2021.1898775, 2021a.
Royer, A., Picard, G., Vargel, C., Langlois, A., Gouttevin, I., and Dumont, M.: Improved Simulation of Arctic Circumpolar Land Area Snow Properties and Soil Temperatures, Front. Earth Sci., 9, 2296-6463, https://doi.org/10.3389/feart.2021.685140, 2021b.
Rutter, N., Sandells, M. J., Derksen, C., King, J., Toose, P., Wake, L., Watts, T., Essery, R., Roy, A., Royer, A., Marsh, P., Larsen, C., and Sturm, M.: Effect of snow microstructure variability on Ku-band radar snow water equivalent retrievals, The Cryosphere, 13, 3045–3059, https://doi.org/10.5194/tc-13-3045-2019, 2019.
Sandells, M. J., Flerchinger, G. N., Gurney, R. J., and Marks, D.: Simulation of snow and soil water content as a basis for satellite retrievals, Hydrol. Res., 43, 720–735, https://doi.org/10.2166/nh.2012.028, 2012.
Schneebeli, M. and Johnson, J. B.: A constant-speed penetrometer for high-resolution snow stratigraphy, Ann. Glaciol., 26, 107–111, 1998.
Schürholt, K., Kowalski, J., and Löwe, H.: Elements of future snowpack modeling – Part 1: A physical instability arising from the nonlinear coupling of transport and phase changes, The Cryosphere, 16, 903–923, https://doi.org/10.5194/tc-16-903-2022, 2022.
Schuur, E. A. G., Bracho, R., Celis, G., Belshe, E. F., Ebert, C., Ledman, J., Mauritz, M., Pegoraro, E. F., Plaza, C., Rodenhizer, H., Romanovsky, V., Schädel, C., Schirokauer, D., Taylor, M., Vogel, J. G., and Webb, E. E.: Tundra Underlain By Thawing Permafrost Persistently Emits Carbon to the Atmosphere Over 15 Years of Measurements, J. Geophys. Res.-Biogeosci., 126, 2169-8953, https://doi.org/10.1029/2020jg006044, 2021.
Semenchuk, P. R., Elberling, B., Amtorp, C., Winkler, J., Rumpf, S., Michelsen, A., and Cooper, E. J.: Deeper snow alters soil nutrient availability and leaf nutrient status in high Arctic tundra, Biogeochem., 124, 81–94, https://doi.org/10.1007/s10533-015-0082-7, 2015.
Simson, A., Löwe, H., and Kowalski, J.: Elements of future snowpack modeling – Part 2: A modular and extendable Eulerian–Lagrangian numerical scheme for coupled transport, phase changes and settling processes, The Cryosphere, 15, 5423–5445, https://doi.org/10.5194/tc-15-5423-2021, 2021.
Slater, A. G., Lawrence, D. M., and Koven, C. D.: Process-level model evaluation: a snow and heat transfer metric, The Cryosphere, 11, 989–996, https://doi.org/10.5194/tc-11-989-2017, 2017.
Smith, C. D.: Correcting the Wind Bias in Snowfall Measurements Made with a Geonor T-200B Precipitation Gauge and Alter Wind Shield, Bulletin of the Canadian and Oceanographic Meteorological Society, 36, 162–167, 2008.
Sturm, M. and Holmgren, B.: An Automatic Snow Depth Probe for Field Validation Campaigns, Water Resour. Res., 54, 9695–9701, https://doi.org/10.1029/2018WR023559, 2018.
Sturm, M. and Liston, G. E.: Revisiting the Global Seasonal Snow Classification: An Updated Dataset for Earth System Applications, J. Hydrometeorol., https://doi.org/10.1175/jhm-d-21-0070.1, 2021.
Sturm, M., Holmgren, J., and Liston, G. E.: A Seasonal Snow Cover Classification for Local to Global Applications, J. Climate, 8, 1261–1283, 1995.
Sturm, M., Perovich, D. K., and Holmgren, J.: Thermal conductivity and heat transfer through the snow on the ice of the Beaufort Sea, J. Geophys. Res., 107, 0148-0227, https://doi.org/10.1029/2000jc000409, 2002.
Sturm, M., Holmgren, J., Konig, M., and Morris, K.: The thermal conductivity of seasonal snow, J. Glaciol., 43, 26–41, 1997.
Sturm, M., Derksen, C., Liston, G., Silis, A., Solie, D., Holmgren, J., and Huntington, H.: A reconnaissance snow survey across northwest territories and Nunavut, Canada, April 2007, Cold Regions Research and Engineering laboratory, Hanover, New Hampshire, 1–80, https://apps.dtic.mil/sti/pdfs/ADA476959.pdf (last access: 6 October 2022), 2008.
Sullivan, P. F., Welker, J. M., Arens, S. J. T., and Sveinbjörnsson, B.: Continuous estimates of CO2 efflux from arctic and boreal soils during the snow-covered season in Alaska, J. Geophys. Res.-Biogeosci., 113, 01480227, https://doi.org/10.1029/2008jg000715, 2008.
Swenson, S. C. and Lawrence, D. M.: A new fractional snow-covered area parameterization for the Community Land Model and its effect on the surface energy balance, J. Geophys. Res.-Atmos., 117, D21, https://doi.org/10.1029/2012jd018178, 2012.
Taylor, K. E., Stouffer, R. J., and Meehl, G. A.: An Overview of CMIP5 and the Experiment Design, Bull. Am. Meteorol. Soc., 93, 485–498, https://doi.org/10.1175/bams-d-11-00094.1, 2012.
Toose, P., King, J., Silis, A., and Derksen, C.: TVC Snow 2017–2018 tundra snow depth probe measurements (Version 1), Zenodo [data set], https://doi.org/10.5281/zenodo.4021328, 2020.
van Kampenhout, L., Lenaerts, J. T. M., Lipscomb, W. H., Sacks, W. J., Lawrence, D. M., Slater, A. G., and van den Broeke, M. R.: Improving the Representation of Polar Snow and Firn in the Community Earth System Model, J. Adv. Model. Earth Sys., 9, 2583–2600, https://doi.org/10.1002/2017ms000988, 2017.
V-Dutch: V-Dutch/TVCSnowCLM (Version v1), Zenodo [code] and [data set], https://doi.org/10.5281/zenodo.7137729, 2022.
Vionnet, V., Brun, E., Morin, S., Boone, A., Faroux, S., Le Moigne, P., Martin, E., and Willemet, J.-M.: The detailed snowpack scheme Crocus and its implementation in SURFEX v7.2, Geosci. Model Dev., 5, 773–791, https://doi.org/10.5194/gmd-5-773-2012, 2012.
Virkkala, A. M., Aalto, J., Rogers, B. M., Tagesson, T., Treat, C. C., Natali, S. M., Watts, J. D., Potter, S., Lehtonen, A., Mauritz, M., Schuur, E. A. G., Kochendorfer, J., Zona, D., Oechel, W., Kobayashi, H., Humphreys, E., Goeckede, M., Iwata, H., Lafleur, P. M., Euskirchen, E. S., Bokhorst, S., Marushchak, M., Martikainen, P. J., Elberling, B., Voigt, C., Biasi, C., Sonnentag, O., Parmentier, F. W., Ueyama, M., Celis, G., St Louis, V. L., Emmerton, C. A., Peichl, M., Chi, J., Jarveoja, J., Nilsson, M. B., Oberbauer, S. F., Torn, M. S., Park, S. J., Dolman, H., Mammarella, I., Chae, N., Poyatos, R., Lopez-Blanco, E., Christensen, T. R., Kwon, M. J., Sachs, T., Holl, D., and Luoto, M.: Statistical upscaling of ecosystem CO2 fluxes across the terrestrial tundra and boreal domain: Regional patterns and uncertainties, Glob. Chang. Biol., 4040–4059, https://doi.org/10.1111/gcb.15659, 2021.
Wagner, D. N., Shupe, M. D., Cox, C., Persson, O. G., Uttal, T., Frey, M. M., Kirchgaessner, A., Schneebeli, M., Jaggi, M., Macfarlane, A. R., Itkin, P., Arndt, S., Hendricks, S., Krampe, D., Nicolaus, M., Ricker, R., Regnery, J., Kolabutin, N., Shimanshuck, E., Oggier, M., Raphael, I., Stroeve, J., and Lehning, M.: Snowfall and snow accumulation during the MOSAiC winter and spring seasons, The Cryosphere, 16, 2373–2402, https://doi.org/10.5194/tc-16-2373-2022, 2022.
Wang, W., Rinke, A., Moore, J. C., Ji, D., Cui, X., Peng, S., Lawrence, D. M., McGuire, A. D., Burke, E. J., Chen, X., Decharme, B., Koven, C., MacDougall, A., Saito, K., Zhang, W., Alkama, R., Bohn, T. J., Ciais, P., Delire, C., Gouttevin, I., Hajima, T., Krinner, G., Lettenmaier, D. P., Miller, P. A., Smith, B., Sueyoshi, T., and Sherstiukov, A. B.: Evaluation of air–soil temperature relationships simulated by land surface models during winter across the permafrost region, The Cryosphere, 10, 1721–1737, https://doi.org/10.5194/tc-10-1721-2016, 2016.
Watson, S., Smith, C. D., Lassi, M., and Misfeldt, J.: An Evaluation of the Effectiveness of the Double Alter Wind Shield for Increasing the Catch Efficiency of the Geonor T-200B Precipitation Gauge, Bulletin of the Canadian and Oceanographic Meteorological Society, 36, 168–175, 2008.
Wilcox, E. J., Keim, D., de Jong, T., Walker, B., Sonnentag, O., Sniderhan, A. E., Mann, P., and Marsh, P.: Tundra shrub expansion may amplify permafrost thaw by advancing snowmelt timing, Arctic Science, 5, 202–217, https://doi.org/10.1139/as-2018-0028, 2019.
Williams, M. W., Helmig, D., and Blanken, P.: White on green: under-snow microbial processes and trace gas fluxes through snow, Niwot Ridge, Colorado Front Range, Biogeochem., 95, 1–12, https://doi.org/10.1007/s10533-009-9330-z, 2009.
Wilson, G., Green, M., Brown, J., Campbell, J., Groffman, P., Durán, J., and Morse, J.: Snowpack affects soil microclimate throughout the year, Clim. Change, 163, 705–722, https://doi.org/10.1007/s10584-020-02943-8, 2020.
Yi, Y., Kimball, J. S., Chen, R. H., Moghaddam, M., and Miller, C. E.: Sensitivity of active-layer freezing process to snow cover in Arctic Alaska, The Cryosphere, 13, 197–218, https://doi.org/10.5194/tc-13-197-2019, 2019.
Yi, Y., Kimball, J. S., Watts, J. D., Natali, S. M., Zona, D., Liu, J., Ueyama, M., Kobayashi, H., Oechel, W., and Miller, C. E.: Investigating the sensitivity of soil heterotrophic respiration to recent snow cover changes in Alaska using a satellite-based permafrost carbon model, Biogeosciences, 17, 5861–5882, https://doi.org/10.5194/bg-17-5861-2020, 2020.
Zermatten, E., Haussener, S., Schneebeli, M., and Steinfeld, A.: Tomography-based determination of permeability and Dupuit–Forchheimer coefficient of characteristic snow samples, J. Glaciol., 57, 811–816, https://doi.org/10.3189/002214311798043799, 2011.
Zhang, T.: Influence of the seasonal snow cover on the ground thermal regime: An overview, Rev. Geophys., 43, 8755-1209, https://doi.org/10.1029/2004rg000157, 2005.
Zhang, T., Osterkamp, T. E., and Stamnes, K.: Influence of the depth hoar layer of the seasonal snow cover on the ground thermal regime, Water Resour. Res., 32, 2075–2086, https://doi.org/10.1029/96wr00996, 1996.
The requested paper has a corresponding corrigendum published. Please read the corrigendum first before downloading the article.
- Article
(1800 KB) - Full-text XML