the Creative Commons Attribution 4.0 License.
the Creative Commons Attribution 4.0 License.
 | 05 Oct 2022
Quantifying the effects of background concentrations of crude oil pollution on sea ice albedo
Benjamin Heikki Redmond Roche
Sea ice albedo plays an important role in modulating the climate of Earth and is affected by low background concentrations of oil droplets within the ice matrix that absorb solar radiation. In this study, the albedo response of three different types of bare sea ice (melting, first-year, and multi-year sea ice) are calculated at increasing mass ratios (0–1000 ng g−1) of crude oil by using a coupled atmosphere–sea ice radiative-transfer model (TUV-snow; Tropospheric Ultraviolet–Visible) over the optical wavelengths 400–700 nm. The different types of quasi-infinite-thickness sea ice exhibit different albedo responses to oil pollution, with a 1000 ng g−1 mass ratio of oil causing a decrease to 70.9 % in multi-year sea ice, 47.2 % in first-year sea ice, and 22.1 % in melting sea ice relative to the unpolluted albedo at a wavelength of 400 nm. The thickness of the sea ice is also an important factor, with realistic-thickness sea ices exhibiting similar results, albeit with a weaker albedo response for multi-year sea ice to 75.3 %, first-year sea ice to 66.3 %, and melting sea ice to 35.9 %. The type of oil also significantly affects the response of sea ice albedo, with a relatively opaque and heavy crude oil (Romashkino oil) causing a significantly larger decrease in sea ice albedo than a relatively transparent light crude oil (Petrobaltic oil). The size of the oil droplets polluting the oil also plays a minor role in the albedo response, with weathered submicrometre droplets (0.05–0.5 µm radius) of Romashkino oil being the most absorbing across the optical wavelengths considered. Therefore, the work presented here demonstrates that low background concentrations of small submicrometre- to micrometre-sized oil droplets have a significant effect on the albedo of bare sea ice. All three types of sea ice are sensitive to oil pollution; however, first-year sea ice and particularly melting sea ice are very sensitive to oil pollution.
Please read the corrigendum first before continuing.
-
Notice on corrigendum
The requested paper has a corresponding corrigendum published. Please read the corrigendum first before downloading the article.
-
Article
(3309 KB)
-
The requested paper has a corresponding corrigendum published. Please read the corrigendum first before downloading the article.
- Article
(3309 KB) - Full-text XML
- Corrigendum
- BibTeX
- EndNote


Arctic sea ice has significantly declined from its 1981–2010 spring and summer averages, both in the extent and thickness of sea ice cover (Fetterer et al., 2017). The summer sea ice minimum has decreased 13.1 % per decade from the 1981–2010 average, with an average extent of 6.85×10⁶ km2 in 1979–1992 compared to an average extent of 4.44×10⁶ km2 from 2007–2020 (Thoman et al., 2020). First-year sea ice cover is declining at between 12.2 % and 13.5 %, and multi-year sea ice cover is declining at between 15.6 % and 17.5 % per decade, respectively (Comiso, 2012; Tschudi et al., 2019). Consequently, it is now very likely that an ice-free Arctic Ocean, a so-called “Blue Ocean Event”, will be realised by the mid-century unless there is a rapid reduction in greenhouse gas emissions (Notz and Stroeve, 2018). In response to the “blue” Arctic Ocean, there has been significant interest in developing northern shipping routes which can decrease journey lengths from Europe to Asia by up to 40 % (Ho, 2010; Eguíluz et al., 2016; Kikkas and Romashkina, 2018). Additionally, 13 % of total global undiscovered oil reserves are estimated to be in the Arctic Ocean, and their exploitation is of great geopolitical importance for the Arctic (Bird et al., 2008; Krivorotov and Finger, 2019; Czarny, 2019). Therefore, well-established concerns prevail for the associated impacts that blowouts, pollution from offshore drilling, production, and transportation of oil may have in the Arctic (Koivurova and Vanderzwaag, 2007; WWF-Canada, 2011; Gulas et al., 2017).
Sea ice albedo plays a key role in modulating the climate of Earth. The high-latitude radiative balance is primarily controlled by short-wave solar radiation during the summer, which significantly affects both sea ice and snow cover in the region (e.g. Perovich et al., 1986, 1998; Flanner et al., 2007). Several different physical properties affect sea ice albedo, the most significant of which are density, grain size, grain shape, brine content, thickness, snow cover, and light-absorbing impurities (e.g. Perovich et al., 1998; Perovich, 2003; Marks and King, 2014; Hancke et al., 2018). The wavelength integrated and spectral albedos for different types of sea ice have previously been considered in the literature (e.g. Grenfell and Maykut, 1977; Grenfell and Perovich, 1984; Perovich et al., 1986; Buckley and Trodahl, 1987; Grenfell, 1991; Perovich, 1996; Hanesiak et al., 2001); utilising these optical properties, this study focuses on three types of sea ice: melting, first-year, and multi-year sea ice. The optical properties of these different types of sea ice are described in Marks and King (2014) and Lamare et al. (2016). The albedo of sea ice is wavelength-dependent with maximum albedo values occurring at 390 nm in pure ice, where absorption is at a minimum (Warren et al., 2006). The absorption of light-absorbing impurities is also wavelength-dependent and affects where the maximum albedo occurs depending on the absorption spectra and the number of the impurities that are contained within the ice. Different light-absorbing impurities in sea ice such as volcanic dust, mineral dust, black carbon, and soot have previously been examined for their effect on albedo (e.g. Warren and Wiscombe, 1980; Warren, 1984; Light et al., 1998; Doherty et al., 2010; Marks and King, 2013, 2014; Lamare et al., 2016; Marks et al., 2017) and were found to have significant effects on sea ice albedo, even at very low concentrations. Indeed, Glaeser and Vance (1971) released oil on top of ice and found that oil absorbs 30 % more heat from the Sun than normal ice. However, aside from limited and extreme field studies by NORCOR (1975) and Gavrilo and Tarashkevich (1992), the effects that oil pollution has upon sea ice albedo have not previously been considered in the literature, so this is explored here in a modelling study.
As oil is released into seawater it is influenced by several weathering processes: evaporation, dispersion, wave action, sedimentation, photo-oxidation, and bioremineralisation (e.g. Daling et al., 1990; Resby and Wang, 2004; Dilliplaine et al., 2021). The physicochemical properties of oil (e.g. water-in-oil emulsion viscosity, density, pour point) are constrained by oil composition, wave energy, and ice conditions, which largely determine the fate of oil in cold marine environments (Brandvik and Faksness, 2009; Brandvik et al., 2010; Singsaas et al., 2020). In low-energy environments where non-breaking waves occur, oil spilled at the surface will spread into a slick owing to gravity, viscosity, and surface tension. In high-energy environments where plunging, spilling, and breaking waves occur, oil droplets are entrained into the water and continually resurface, resulting in the droplet size decreasing (e.g. Delvigne and Sweeney, 1988; Wang et al., 2005; Li et al., 2008a, b; C. Li et al., 2017; Wilkinson et al., 2017). In these high-energy conditions, oil can spread several square kilometres in several hours and several hundred square kilometres within several days (Berenshtein et al., 2020). There have been extensive modelling studies into both large-scale submarine blowouts (e.g. Johansen, 2003; Zheng et al., 2003; Lima Neto et al., 2008; Socolofsky et al., 2008; Fraga et al., 2016; Dissanayake et al., 2018) as well as surface oil slicks (e.g. Spaulding et al., 1992; Reed and Rye, 1995; Daling et al., 1997; Papadimitrakis et al., 2005, 2011; Gamzaev, 2009), with the consensus being that knowledge of oil droplet size distribution is fundamental to accurately modelling ocean oil spills (Nissanka and Yapa, 2018). There have also been several lab (Hesketh et al., 1991; Masutani and Adams, 2000; Tang and Masutani, 2003; Brandvik et al., 2013, 2014; Wang et al., 2018) and field experiments (Johansen et al., 2003; Brandvik et al., 2010) which have generally focused on very high levels of pollution within a relatively short timeframe from the release of oil. However, away from the initial spill site the size of oil droplets dispersed by breaking waves is typically a log-normal distribution of smaller spherical particles (Otremba, 2007; Li et al., 2011; Johansen et al., 2013; Haule et al., 2015; Haule and Freda, 2016).
Three major joint industry programmes regarding the behaviour and fate of oil in sea ice have taken place – the first was a 4-year SINTEF-led (Stiftelsen for industriell og teknisk forskning) project looking at “Oil Spill Contingency for Arctic and Ice-covered Waters” (Sørstrøm et al., 2010). The second was a 3-year International Association of Oil & Gas Producers-led project looking at “Arctic Oil Spill Response Technology” (Dickins, 2017). The third was a 3-year collaboration between SINTEF and the Research Council of Norway looking at the “Fate, Behaviour and Response to Oil Drifting into Scattered Ice and Ice Edge in the Marginal Ice Zone” (Singsaas et al., 2020). Smaller studies have considered the hyperspectral features of oil-polluted sea ice (Praks et al., 2004; Ivanov et al., 2005; Liu et al., 2016, 2018; Chao et al., 2017). It is possible to calculate the albedo from the bidirectional reflection distribution function (BRDF); however, these are not comparable to this study, as background mass ratios of oil are examined here. In another study, Gavrilo and Tarashkevich (1992) found that crude oil can migrate vertically through multi-year ice if it is pumped either into or below the ice. They also found that the presence of oil decreased both the albedo and mechanical strength of the multi-year sea ice but did not measure the direct relative change in ice albedo in order to parameterise the effects. A similar study by NORCOR (1975) also concluded that the presence of oil released onto the ice may accelerate melting by 1 to 3 weeks but did not parameterise the effects either. Whilst it is now recognised that oil can be trapped in ice in a variety of ways (e.g. Dickins and Buist, 1981; Buist and Dickins, 1983; Buist et al., 1983; Drozdowski et al., 2011), what is missing from the literature is an understanding of how oil exists at low concentrations over a large spatiotemporal range in cold marine environments and what their climatic significance may be.
Studies from the Gulf of Thailand and South China Sea since the 1970s have indicated that mass ratios of oil are highly variable and dependent on location and season but can be up to 75 ng g−1 (75 ppb), even far offshore (Law and Mahmood, 1986; Wongnapapan et al., 1999). In regions of intensive shipping and marine transportation, particularly near offshore oil fields, concentrations of oil ranging from several parts per billion to parts per million are common (Haule and Freda, 2016), and oil concentrations of ship effluent discharge are only limited to a value of 15 ppm (i.e. 15 000 ng g−1) (IMO, 1983). Mega oil spills are also capable of transporting significant quantities of oil vast distances in seawater. Following the Deepwater Horizon blowout, oil mass ratios exceeding 100 ng g−1 were transported via currents over 1000 km from the spill site more than 60 d after the event occurred (Berenshtein et al., 2020). Therefore, it is important to consider a wide range of oil concentrations to replicate a variety of scenarios.
Oil droplets frequently weather more slowly and are more durable in cold environments than in warm environments (Venkatesh et al., 1990; Singsaas et al., 2020). Smaller droplets (< 70 µm diameter) are affected by physical processes induced by atmospheric forcing (e.g. shear-induced turbulence, sea-surface waves, Langmuir circulations, Ekman transport, and thermal convection) in the euphotic zone, resulting in the continuous mixing of the top of the water column and the formation of the ocean mixed layer (Edson et al., 2007; Sullivan and McWilliams, 2010; Özgökmen et al., 2012; D'Asaro, 2014; Xiao and Yang, 2020). The droplets remain in suspension for extended periods of time (i.e. weeks to months) in the presence of adequate mixing energy, with their buoyancy acting as a constant resistant force to the mixing (Ryerson et al., 2012; Yang et al., 2014; Zhao et al., 2016; Uttieri et al., 2019; Xiao and Yang, 2020). The following papers (e.g. Lunel, 1993; Reed et al., 2009a, b; Bandara and Yapa, 2011; Brandvik et al., 2013, 2021; Johansen et al., 2013; Zhao et al., 2014a, b, 2016, 2017a, b; North et al., 2015; Zeinstra-Helfrich et al., 2015a, b, 2016; Nissanka and Yapa, 2016, 2017, 2018; Z. Li et al., 2017a, b; Wang et al., 2018) demonstrate the typical sizes of oil droplets in seawater (3–500 µm, locally up to 12 000 µm) and also focus on relatively large concentrations of crude oil representing the immediate area around a spill site, whereas the study presented here focuses on relatively low background concentrations of weathered crude oil over a large area. The focus of these studies is on droplet sizes between micrometres and millimetres which demonstrate a logarithmic dependence between number density and droplet size that increases as droplet size decreases (Lunel, 1993; Brandvik et al., 2013, 2021; Johansen et al., 2013; Zhao et al., 2017b; Nissanka and Yapa, 2017; C. Li et al., 2017). These larger micrometre- to millimetre-sized droplets are characteristic of oil released in the subsurface, such as during a blowout or similar specific acute event of small geographical extent, which have not undergone significant weathering or transport (e.g. Johansen et al., 2013; Brandvik et al., 2013). The number density of smaller-sized droplets is potentially not reported, owing to limitations of measuring equipment or techniques, and as pointed out by Otremba (2007), they are measuring the larger radius tail of a log-normal distribution of a number density against droplet radius. It is likely that the most numerous droplets affecting wide areas of polar sea ice are these smaller-sized weathered oil droplets. The smallest droplets may not be considered in these studies owing to four factors: (i) the proximity and timing of measurements to droplet release, (ii) equipment limitation in droplet size-range detection (e.g. LISST-100X below 2.5 µm) coupled with the effect of background noise at the smallest scale (e.g. Brandvik et al., 2013), (iii) droplets smaller than 0.2 µm being considered dissolved (e.g. North et al., 2015), and (iv) the difficulty and high uncertainty of direct measurements in situ (e.g. Gonçalves et al., 2016). In addition, Nissanka and Yapa (2017) suggest that many of the equilibrium models utilised in the literature (e.g. Delvigne and Sweeney, 1988; Spaulding et al., 1992; Delvigne and Hulsen, 1994; Reed and Rye, 1995; Tkalich and Chan, 2002; Reed et al., 2009a, b; Johansen et al., 2013, 2015) omit the consideration of the temporal modification of oil droplet size distributions owing to droplet breakup and coalescence.
The study presented here utilises a coupled atmospheric and sea ice radiative-transfer model to quantify how oil pollution may affect the albedo of three different types of sea ice (melting sea ice, first-year sea ice, and multi-year sea ice). The principal aim of this study is to evaluate the impacts increasing amounts of two crude oils that band an envelope of crude oils optically have on sea ice albedo. Previous studies have demonstrated that the size and absorption cross-section of light-absorbing impurities and the type of sea ice affect how sensitive a sea ice is to increasing mass densities of pollutants (e.g. Marks and King, 2013, 2014; Lamare et al., 2016; Marks et al., 2017). Therefore, the effect that oil has on the three different types of sea ice and at different oil droplet sizes is also evaluated.
The methodology is separated into three sections: a description of the radiative-transfer model, a description of the optical properties of the pollutants used in the model, and the different model runs that were examined in this study.
Table 1TUV-snow model sea ice input parameters derived from the literature (Grenfell and Maykut, 1977; Perovich, 1990, 1996; Timco and Frederking, 1996; Gerland et al., 1999) and previously used in other studies (e.g. King et al., 2005; France, 2008; France et al., 2011; Marks and King, 2013, 2014; Lamare et al., 2016).

2.1 Radiative-transfer model
The Tropospheric Ultraviolet–Visible radiation model was originally written by Madronich and Flocke (1998) and later adapted into a coupled atmosphere–snow/sea ice model (TUV-snow) by Lee-Taylor and Madronich (2002). The model is capable of calculating radiative-transfer parameters from the top of the atmosphere into the sea ice and snow layers found at the ocean–atmosphere interface and has been used in several studies (e.g. King et al., 2005; Marks and King, 2013, 2014; Lamare et al., 2016; Marks et al., 2017). The model utilises an eight-stream discrete-ordinates DISORT algorithm (Discrete Ordinates Radiative Transfer; Stamnes et al., 1988) with a pseudo-spherical correction and is comprehensively described by Lee-Taylor and Madronich (2002). In this study, the albedo response of three different types of bare sea ice (multi-year sea ice, first-year sea ice, and melting sea ice) to increasing amounts of two different crude oils is calculated using the TUV-snow model. The sea ice layers are assumed to be horizontally homogeneous, weakly absorbing, and highly scattering. The types of ice have been kept simple, and in keeping with previous work (e.g. Marks and King, 2013, 2014; Lamare et al., 2016), further studies with a better understanding of how oil moves between different ice fabrics may wish to consider the three-layer model proposed by Light et al. (2008). The optical properties of the sea ice layers are described by an asymmetry factor, g; a wavelength-independent scattering cross-section, σscatt; a wavelength-dependent absorption cross-section, σabs; and the sea ice density (Lee-Taylor and Madronich, 2002; France et al., 2011; Reay et al., 2012; Marks and King, 2013, 2014; Lamare et al., 2016; Marks et al., 2017). The optical and physical parameters of the three sea ices emanate from several field studies (Grenfell and Maykut, 1977; Perovich, 1990, 1996; Timco and Frederking, 1996; Gerland et al., 1999; Simpson et al., 2002; Fisher et al., 2005; King et al., 2005; France et al., 2011; Marks and King, 2013) and are summarised in Table 1. The density of sea ice has been fixed in this study to be comparable to previous work (Lamare et al., 2016); however sea ice density can range between extremes of 700–950 kg m−3 (Grenfell and Maykut, 1977; Perovich, 1990, 1996; Timco and Frederking, 1996; Gerland et al., 1999).
Table 2TUV-snow model sea ice input parameters are derived from the literature and detailed in Marks and King (2014).
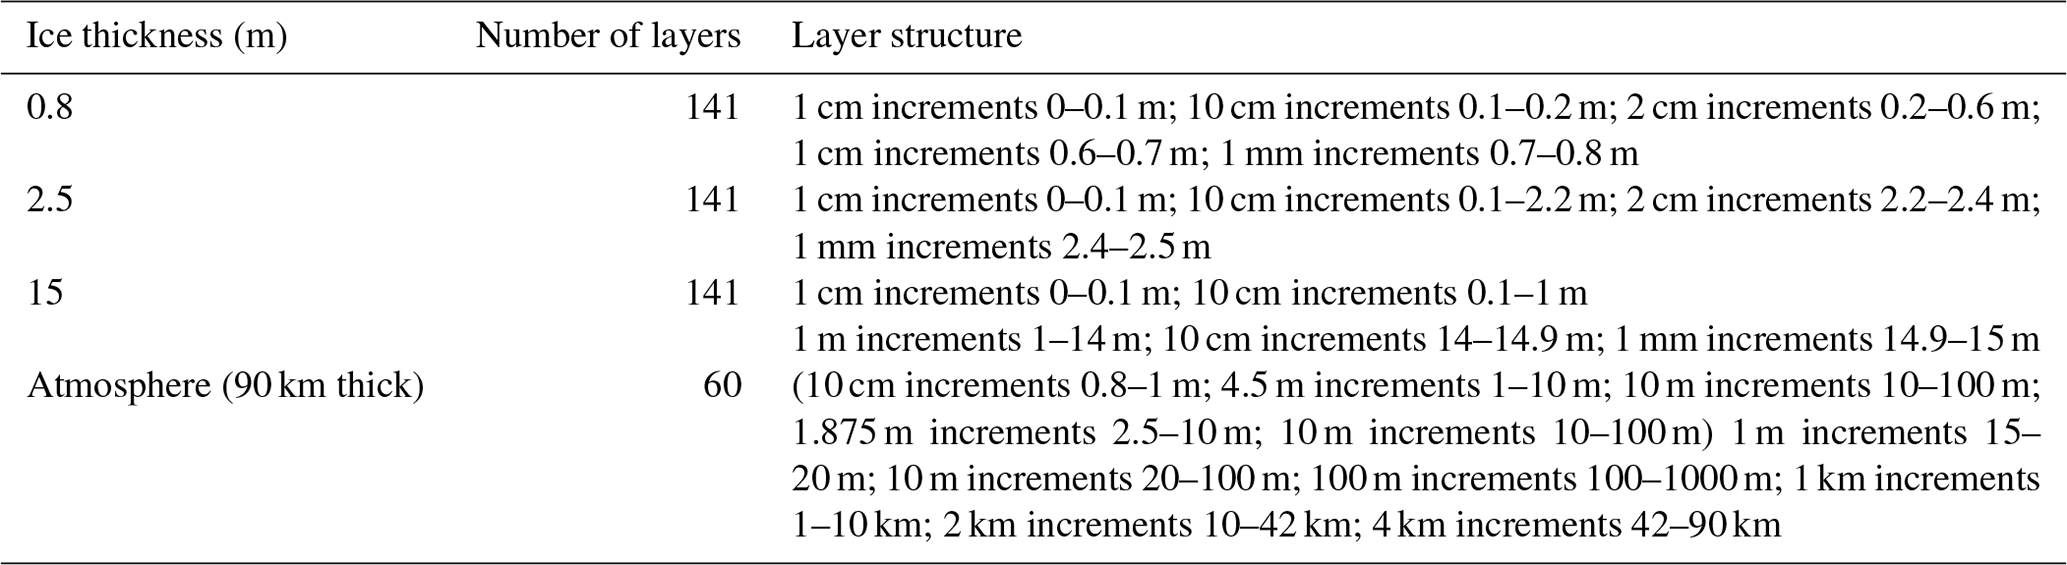
The atmosphere and sea ice in the model are separated into 201 layers comprising a total thickness of 90 km and are shown in Table 2. Marks et al. (2017) found it important to have a large number of layers at the interface, so 201 layers offer a good compromise between computational time and precision. The optical effects are considered both in vacuo, by using a quasi-infinite-thickness sea ice, and at realistic thicknesses of sea ice. The sea ice is set to be optically thick at a quasi-infinite thickness of 15 m (Lamare et al., 2016), therefore making albedo changes at the ice–atmosphere interface independent of the layer under the sea ice and allowing for a fair comparison of the effects explored here. The realistic-thickness sea ices are also considered to allow for a more realistic effect on the different sea ice albedos to be observed. The realistic multi-year and melting sea ice are assigned a thickness of 2.5 m, and the first-year sea ice is assigned a thickness of 0.8 m (Bourke and Garrett, 1987; Laxon et al., 2003; Weeks, 2010).
The “flat plate” irradiance reflectance of the surface layer of the sea ice is calculated in the model and is referred to as albedo in the work described here, represented by Eq. (1):
where Eu is the upwelling irradiance and Ed is the downwelling irradiance. The oil droplets in this study are considered to have a log-normal size distribution that is representative of weathered oil according to experimental measurements by Otremba (2007). The log-normal distribution is centred on a droplet radius size of 0.05 µm and spans a range of 0.05–5 µm, in line with Haule and Freda (2016). Furthermore, a wide range of oil mass ratios are considered (0–1000 ng g−1) so that the data are applicable for a variety of different scenarios. The wavelength-independent albedo of the layer under the sea ice is fixed at 0.1, representative of a dark ocean layer (Payne, 1972). The sea ice is illuminated isotropically to allow for ready comparison with previous work (e.g. Marks and King, 2013, 2014; Lamare et al., 2016; Marks et al., 2017) and remove a solar zenith angle dependency. As shown elsewhere (e.g. Marks and King, 2013), the isotropic illumination allows for any solar zenith angle dependence to be disregarded for simplicity. The atmosphere is assumed to be aerosol-free with a typical ozone column of 300 DU (Dobson units). The distance between Earth and the Sun is set to 1 au (astronomical unit). The model produced a wavelength-dependent surface albedo at a 1 nm interval over a spectrum covering 400–700 nm, corresponding to the wavelength range of the available oil optical properties and the typical optical range measured in the field. The wavelength range 400–700 nm was considered in this study as the absorption coefficient of oil decreases with increasing wavelength, whereas the absorption coefficient of ice increases with wavelength; thus at wavelengths longer than 700 nm the absorption of solar photons is dominated by ice.
2.2 Optical properties of crude oil
The model utilises the absorption spectra for ice as defined in Warren and Brandt (2008). The under-ice surface, snow cover, average Arctic black carbon (5.5–19.2 ng g−1), and average aerosol mass ratios (≤ 193.2 ng g−1) are not considered for the quasi-infinite sea ice in order to independently assess the effect that oil pollution has on the albedo of the different types of sea ice (Zdanowicz et al., 1998; Grenfell et al., 2002; Jiao et al., 2014). However, a very low background mass ratio of black carbon (1 ng g−1) is included, in line with previous studies (e.g. Marks and King, 2013; 2014) and representative of the most pristine snowpack away from the stations at both Dome C, Antarctica, and Summit, Greenland (Zatko et al., 2013). For the realistic-thickness sea ices, a typically low Arctic background black carbon mass ratio of 5.5 ng g−1 is selected (Grenfell et al., 2002). However, snow is not considered to allow for the effect of oil pollution on sea ice albedo to remain independent. The droplets are evenly distributed throughout the ice to be representative of seasonal oil movement in the ice (NORCOR, 1975; Martin, 1979; Drozdowski et al., 2011). The TUV-snow model is capable of considering layers of pollutants in the ice (e.g. Marks and King, 2013; Lamare et al., 2016; Marks et al., 2017); however, until there is a greater knowledge of the thickness, type, and location of these layers for background mass ratios of oil, it is beyond the scope of the present work. The mass ratio of oil in the ice is small, and therefore the light-scattering properties of the ice matrix dominate; thus only the absorption of light by the oil droplets is considered. The total absorption in sea ice is represented by Eq. (2):
where σice(λ) is the wavelength-dependent absorption cross-section of sea ice, χoil is the mass ratio of crude oil in the sea ice, and σoil is the wavelength-dependent mass absorption cross-section by crude oil.
The optical properties of several types of crude oil, lubricating oil, and petroleum are explored by Otremba (2000), who parameterised the real and imaginary parts of their refractive index. Otremba (2000) established that, for the oils capable of forming a surface film, Romashkino crude oil has the largest imaginary refractive index and absorption coefficient values, whereas Petrobaltic crude oil has the smallest values, with other oils bracketed by these parameters. Petrobaltic is described as a relatively transparent light crude oil, whereas Romashkino is described as a heavy, relatively opaque crude oil (Otremba, 2005; 2007; De Carolis et al., 2014). Whilst both crude oils have a variety of uses, including as marine engine fuels, Romashkino can be considered a typical marine engine heavy fuel oil (IMO, 1983; De Carolis et al., 2014). In the model Petrobaltic and Romashkino are assigned characteristic light- and heavy-crude-oil densities of 0.77 and 0.94 g cm−3, respectively (Hollebone, 2015). Both mechanically and chemically dispersed small droplets tend to be spherical in nature, so they are considered to be spherical in the model (Johansen et al., 2013). A log-normal distribution of number density versus radius with a peak radius of 0.05 µm is utilised, corresponding to the weathered oil experimentally measured in Otremba (2007) and used in other studies (e.g. Haule et al., 2015; Haule and Freda, 2016). The log-normal distribution is represented by Eq. (3):
where r is the droplet radius, rm is the median radius of the size distribution, s is the geometric standard deviation, No is the total particle density, and N is the particle density (Seinfeld and Pandis, 2006). To quantify the size effect, a range of droplet sizes spanning 0.05–5 µm (Haule and Freda, 2016) are considered, and the geometric standard deviation of the mean is taken from Otremba (2007). Owing to the size of the droplets and the range of the spectrum considered (400–700 nm), Mie calculations (Bohren and Huffman, 1983) are required to record the efficiency of light absorption for particles of different sizes within the Mie regime, in a sea ice or brine matrix. There are two similar modern determinations of the refractive index of ice (Warren and Brandt, 2008; Picard et al., 2016); to stay consistent with previous work (e.g. Marks and King, 2013, 2014), the values of Warren and Brandt (2008) are used in this paper. The real refractive index of the brine was 1.3402 at a wavelength of 600 nm (Quan and Fry, 1995) and set to a temperature of 0 ∘C and a salinity of 35 ‰, the smallest temperature and largest salinity values available.
Mie calculations of spherical oil droplets are weighted by log-normal size distributions using a modified version of the BHMIE computational code (Bohren and Huffman, 1983). The calculations utilise the real (0 ∘C) and imaginary refractive index values of Romashkino and Petrobaltic oil from Otremba (2000) and are applied in the model in agreement with the literature (Otremba, 2007; Haule and Freda, 2016). The Mie calculations compute the mass absorption cross-sections of the oil from the absorption efficiencies. The mass absorption coefficients of the oils are used in the TUV-snow computational code (Lee-Taylor and Madronich, 2002) to calculate the effect that increasing mass ratios of Romashkino and Petrobaltic oil have on the albedo of the different types of sea ice.
2.3 Calculation of albedo on sea ice with different loadings of crude oil
Albedos of quasi-infinite first-year sea ice doped with different mass ratios of both Petrobaltic and Romashkino from 0–1000 ng g−1 (0, 5, 10, 25, 100, 150, 200, 250, 300, 350, 400, 450, 500, and 1000 ng g−1) are calculated as a function of wavelength. The study presented here is then repeated for quasi-infinite multi-year, first-year, and melting sea ice. The effect of oil droplet size (in the range 0.05–5.0 µm) is then considered for a single wavelength (400 nm) for the oil with the largest absorption cross-section (Romashkino) and for quasi-infinite sea ice with the largest penetration depth to light (melting sea ice) (Marks and King, 2014). These conditions produce the largest variation in sea ice albedo with changing droplet size. The mass absorption coefficient of droplets (in the range 0.005–50 µm) is also considered for the wavelengths 400–700 nm. The albedo of quasi-infinite melting sea ice polluted with increasing amounts of black carbon (1–100 ng g−1) and Romashkino oil is also considered to investigate how sea ice albedo responds to increasing mass ratios of oil as a function of background pollution of sea ice. The albedos of realistic-thickness melting, first-year, and multi-year sea ice are also calculated at increasing mass ratios of both Petrobaltic and Romashkino from 0 to 1000 ng g−1.
The results are separated into five sections: how the type of oil and increasing mass ratios of oil affect quasi-infinite sea ice albedo, the sensitivity of each type of quasi-infinite sea ice to increasing oil, the effect of droplet size distribution on quasi-infinite sea ice albedo, the impact that increasing background mass ratios of black carbon have on the further reduction in quasi-infinite sea ice albedo by oil, and the effect oil has on each type of realistic-thickness sea ice.
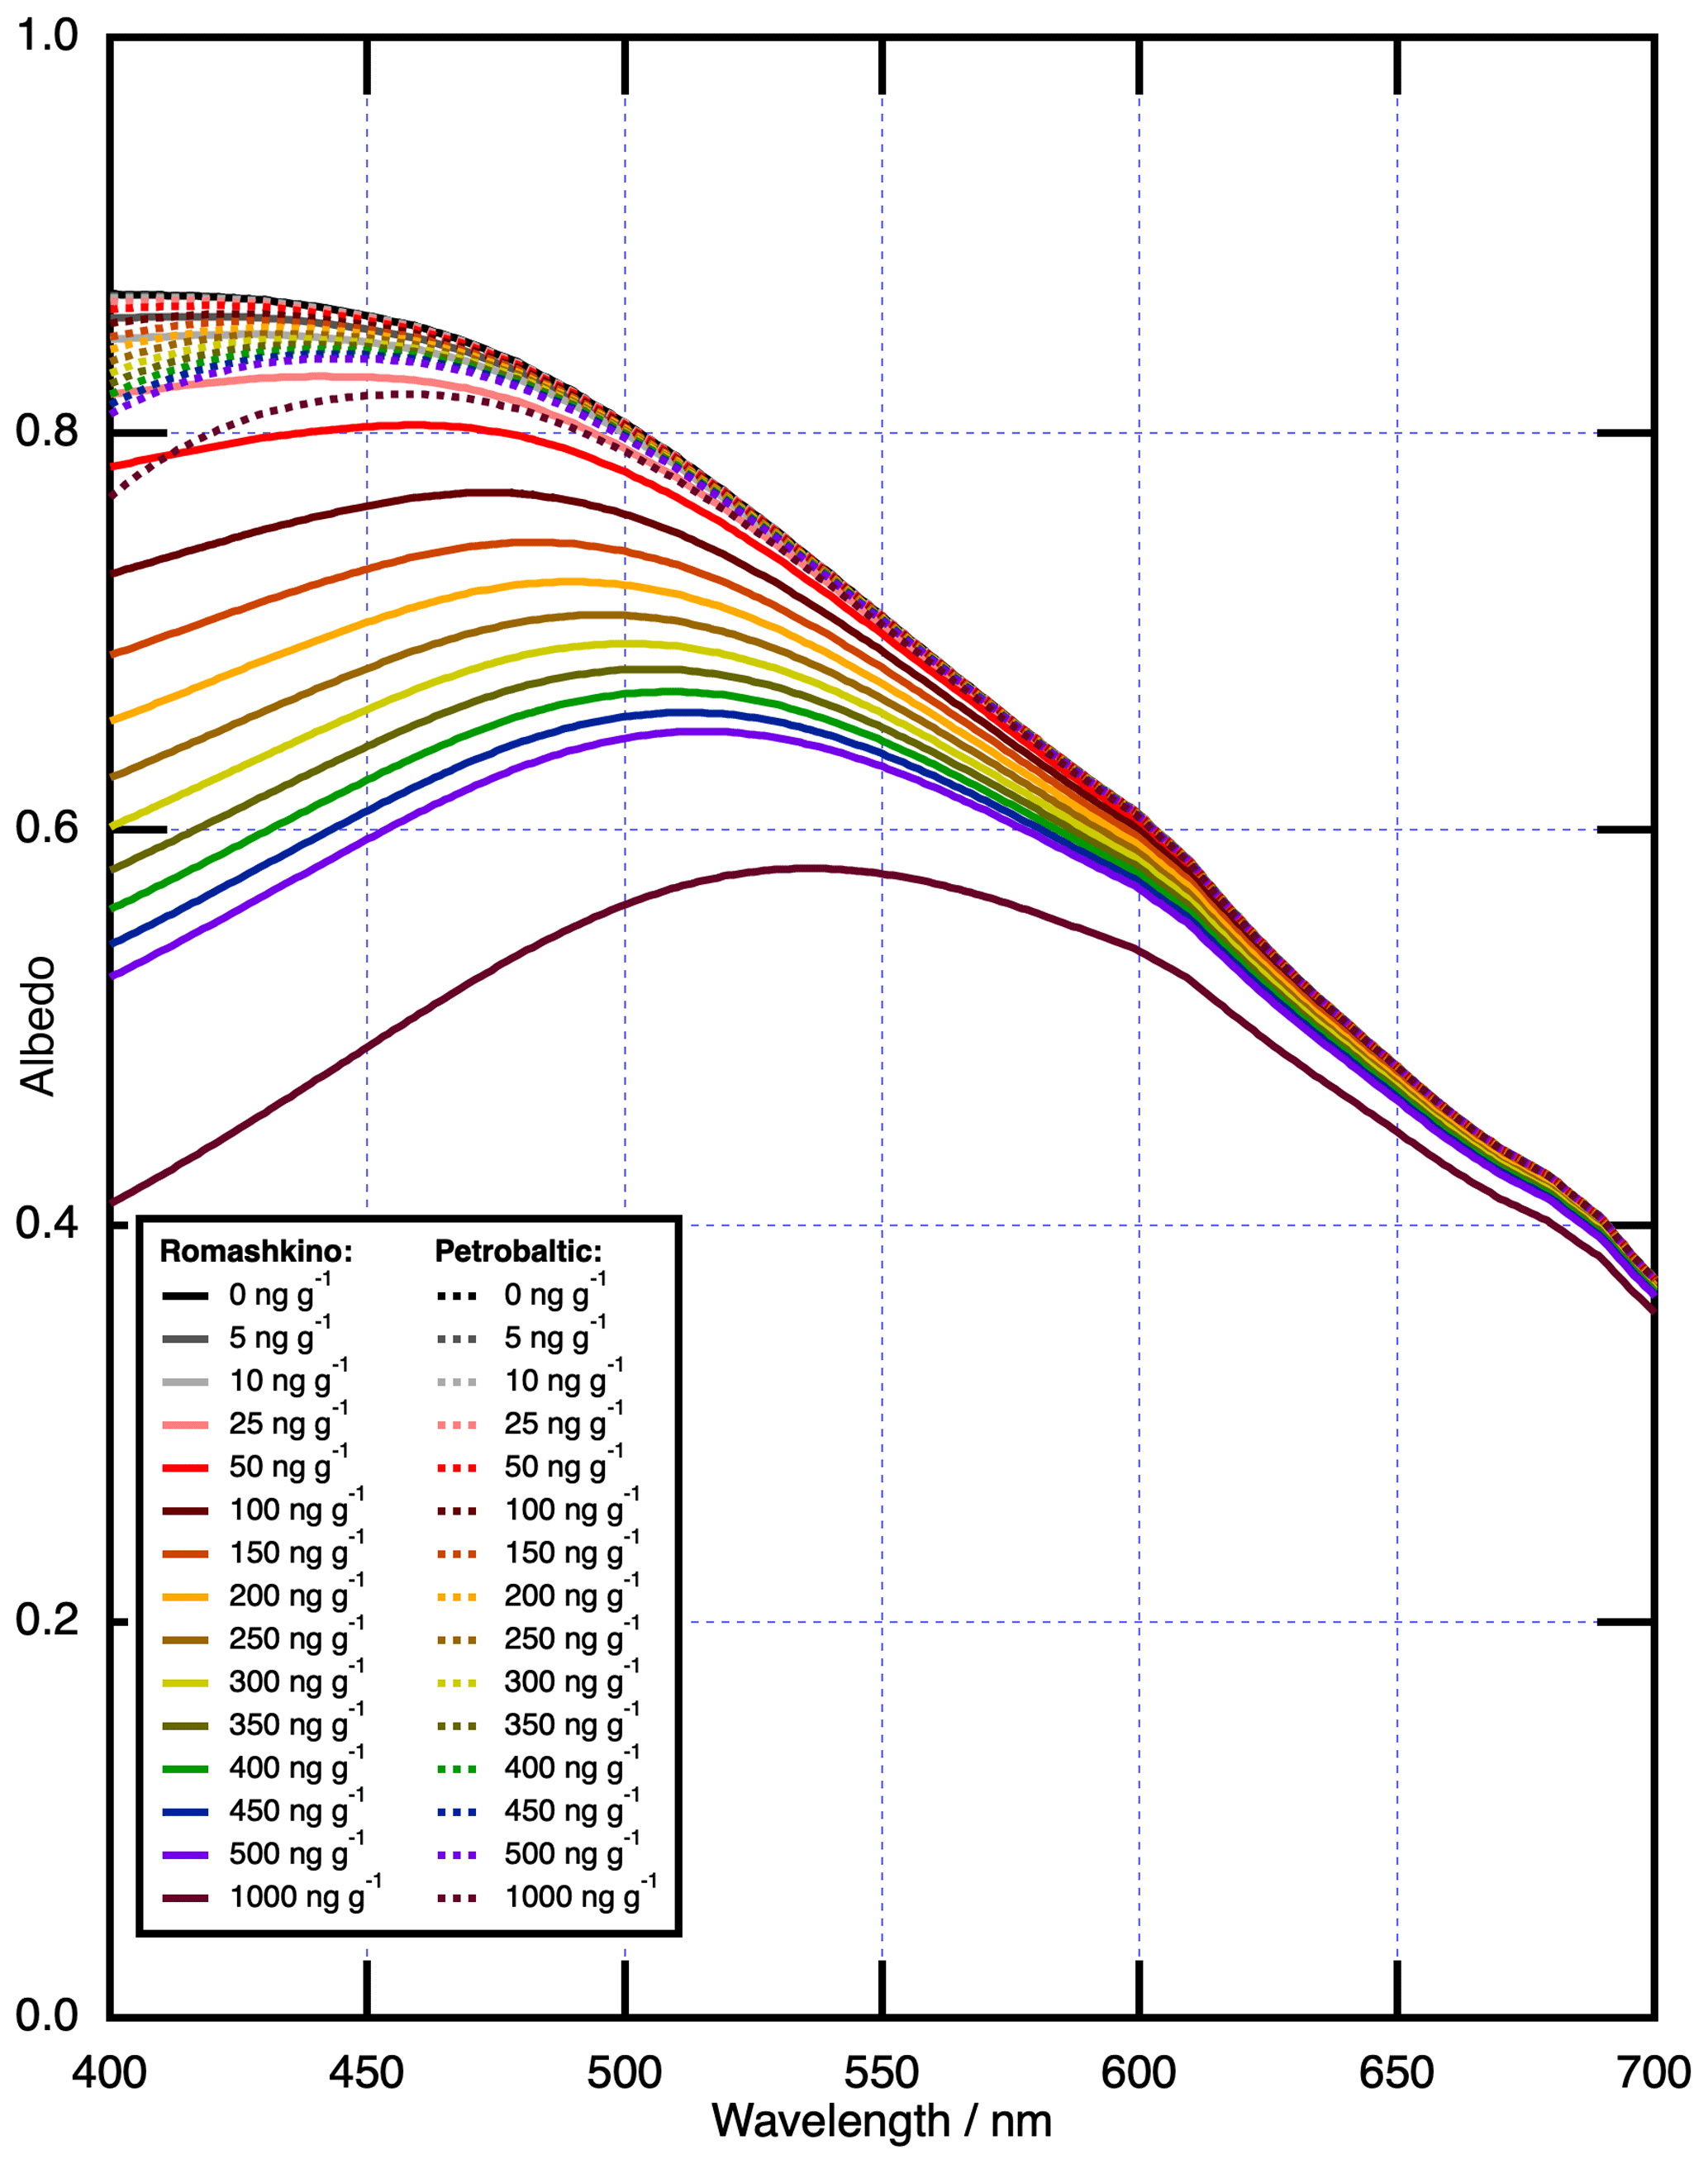
Figure 1Wavelength-dependent albedo of first-year sea ice at increasing mass ratios of Romashkino (solid) and Petrobaltic (dotted) oils (0–1000 ng g−1) with a median droplet radius of 0.05 µm. The first-year sea ice is quasi-infinite (15 m thick), and the properties are described in Table 1. These data demonstrate sea ice albedo is significantly more responsive to Romashkino oil than Petrobaltic oil.

Figure 2Albedos of multi-year, first-year, and melting sea ice with increasing mass ratios of Romashkino (a–c) and Petrobaltic (d–f) oils (0–1000 ng g−1) with a median droplet radius of 0.05 µm. The selected wavelengths are 400, 500, 600, and 700 nm. The three types of sea ice are quasi-infinite, and their properties are described in Table 1. These data demonstrate a large difference in how responsive each type of sea ice is to increasing mass ratios of Romashkino or Petrobaltic oil.
3.1 The effect of increasing mass ratios of different types of oil on the albedo of quasi-infinite sea ice
Figure 1 illustrates the surface albedo of quasi-infinite first-year sea ice between 400–700 nm as a function of Petrobaltic and Romashkino oil mass ratios that are evenly distributed throughout the ice and increase from 0–1000 ng g−1. As the mass ratios of both oils increase, sea ice albedo decreases. The Mie calculation demonstrates that oil droplets are most absorbing at a wavelength of 400 nm, where ice is the least absorbing (Warren and Brandt, 2008). The albedo at 400 nm with no oil pollutant is 0.87, with an addition of 10 ng g−1 of Romashkino resulting in a decrease in albedo to 97.4 % of the unpolluted albedo and 10 ng g−1 of Petrobaltic to 99.8 %. Therefore, Romashkino is more absorbing per unit mass than Petrobaltic, in line with Otremba (2000), and the albedo decreases dramatically with increasing mass ratios of oil. For instance, at a mass ratio of 100 ng g−1, Romashkino and Petrobaltic cause an albedo decrease to 83.8 % and 98.3 % of the unpolluted albedo, respectively, and at 1000 ng g−1, Romashkino and Petrobaltic cause a decrease to 47.2 % and 88.2 % of the unpolluted albedo, respectively. The albedo response to increasing mass ratios of oil is non-linear (Fig. 2) and is exemplified by the doubling of Romashkino mass ratios from 100 to 200 ng g−1, causing a decrease in albedo to 89.8 % of the 100 ng g−1 value, whilst a doubling of the mass ratios from 500 to 1000 ng g−1 causes a decrease in albedo to 78.3 % of the 500 ng g−1 value. For Petrobaltic there is also a non-linear response as mass ratios increase, but it is significantly less pronounced (98.5 % and 94.8 % of the unpolluted albedo, respectively).
The change in albedo is wavelength-dependent, and the Mie calculations indicate the effect of oil significantly decreases as wavelength increases and the ice becomes more absorbing. At a wavelength of 550 nm, 1000 ng g−1 of Romashkino causes albedo to decrease to 81.6 % of the unpolluted albedo, and at 700 nm, this decrease is to 95.5 % of the unpolluted albedo. The effect Petrobaltic has on albedo above 500 nm is negligible, even at a larger mass ratio. Therefore, at shorter wavelengths (400–550 nm), the albedo is more responsive to the oil, whereas, at longer wavelengths (550–700 nm), the albedo is more responsive to the ice.
3.2 The sensitivity of each type of quasi-infinite sea ice to increasing oil
Figure 2 illustrates the surface albedo response of quasi-infinite multi-year, first-year, and melting sea ice as mass ratios of Romashkino and Petrobaltic oils increase from 0–1000 ng g−1. The three types of sea ice have different unpolluted albedos: melting sea ice of 0.72, first-year sea ice of 0.87, and multi-year sea ice of 0.94 at a wavelength of 400 nm, respectively, owing to their different scattering cross-sections (Perovich, 1996; Marks and King, 2014). The three types of sea ice also respond differently to increasing mass ratios of oil, analogous to previous studies exploring the response of sea ice to mineral dust (Lamare et al., 2016). As the mass ratio of Romashkino oil increases in multi-year sea ice, the albedo decreases to 98.8 % at 10 ng g−1, 92.4 % at 100 ng g−1, and 70.9 % at 1000 ng g−1 of the unpolluted albedo at a wavelength of 400 nm. In first-year sea ice, the albedo decreases to 97.4 % at 10 ng g−1, 83.8 % at 100 ng g−1, and 47.2 % at 1000 ng g−1 of the unpolluted albedo at a wavelength of 400 nm. In melting sea ice, the albedo decreases to 94.9 % at 10 ng g−1, 68.8 % at 100 ng g−1, and 22.1 % at 1000 ng g−1 of the unpolluted albedo at a wavelength of 400 nm. The same response occurs with Petrobaltic oil pollution, although the effect is much weaker, with multi-year sea ice albedo decreasing to 94.5 % at 1000 ng g−1, first-year sea ice albedo decreasing to 88.2 % at 1000 ng g−1, and melting sea ice albedo decreasing to 77 % at 1000 ng g−1 of the unpolluted albedo at a wavelength of 400 nm. Therefore, the most responsive type of sea ice to oil pollution is melting sea ice, whilst multi-year sea ice is the least responsive.
At longer wavelengths, the three types of sea ice are less responsive to increasing mass ratios of either Romashkino or Petrobaltic as the absorption coefficient of the ice increases (Warren, 2019). At a wavelength of 500 nm, increasing mass ratios of Romashkino oil significantly affect albedo; however at wavelengths longer than 500 nm the effect of oil pollution is negligible for the three types of sea ice. The albedos of the three types of sea ice are very wavelength-dependent, and the response in albedo to increasing mass ratios of oil significantly decreases as ice absorption increases at longer wavelengths (Warren and Brandt, 2008; Warren, 2019).
Both the type of oil and the type of ice are significant in changing the albedo. There is a large difference in how responsive each type of sea ice is to increasing mass ratios of oil, and melting sea ice is significantly more affected by oil pollution than multi-year sea ice. There is also a significant difference in the effect that different oils have on sea ice albedo. At a wavelength of 400 nm and a relatively low increase in mass ratios of oil (10–100 ng g−1), Romashkino oil causes a relative decrease in albedo to 72.5 % in melting sea ice, 86 % in first-year sea ice, and 93.4 % in multi-year sea ice. At the same wavelength and increasing mass ratios of Petrobaltic oil, there is a relative decrease in albedo to 99.3 % in multi-year sea ice, 98.5 % in first-year sea ice, and 97 % in melting sea ice. Therefore, as mass ratios of oil increase, it is the type of oil that has a larger effect on how responsive sea ice albedo is, rather than what the type of ice is.
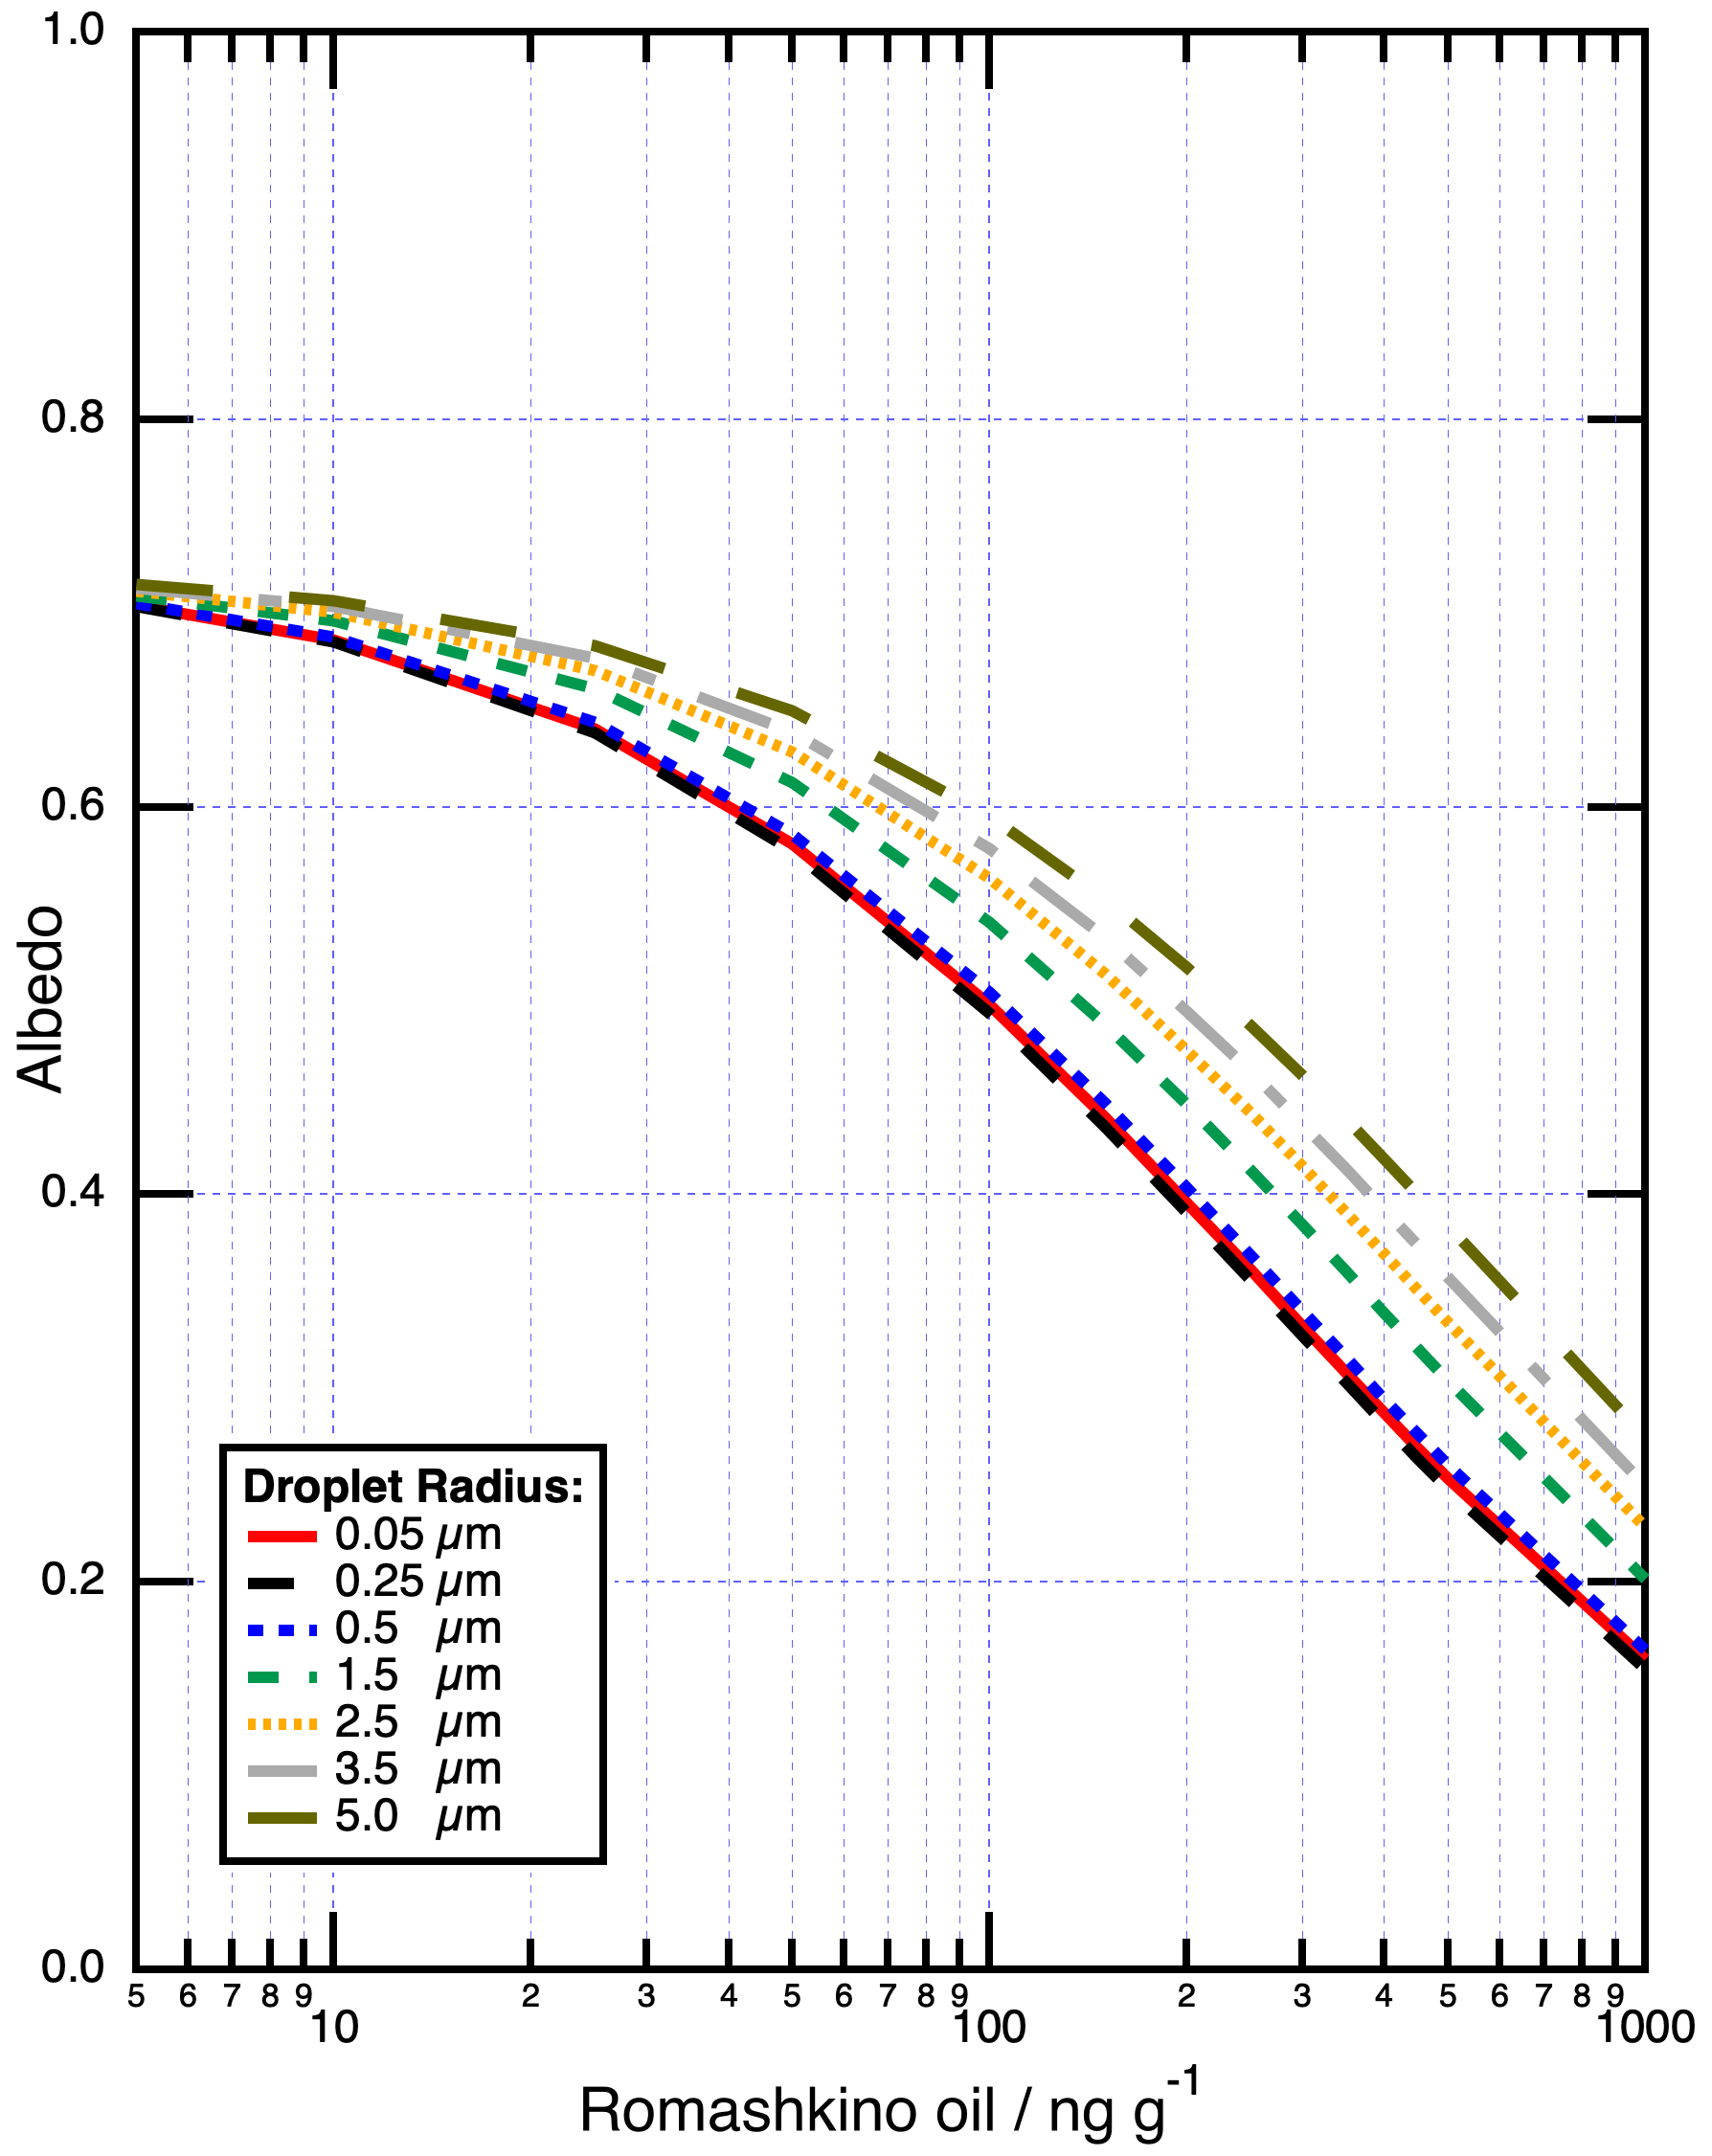
Figure 3The albedo response of melting sea ice as mass ratios of Romashkino oil increase (0–1000 ng g−1) at a wavelength of 400 nm. The different coloured lines represent different log-normally distributed droplet sizes with median radii of 0.05–5.0 µm. The melting sea ice is quasi-infinite, and the properties are described in Table 1. These data demonstrate the sea ice albedo to be most responsive to the smallest droplet sizes (0.05–0.5 µm).
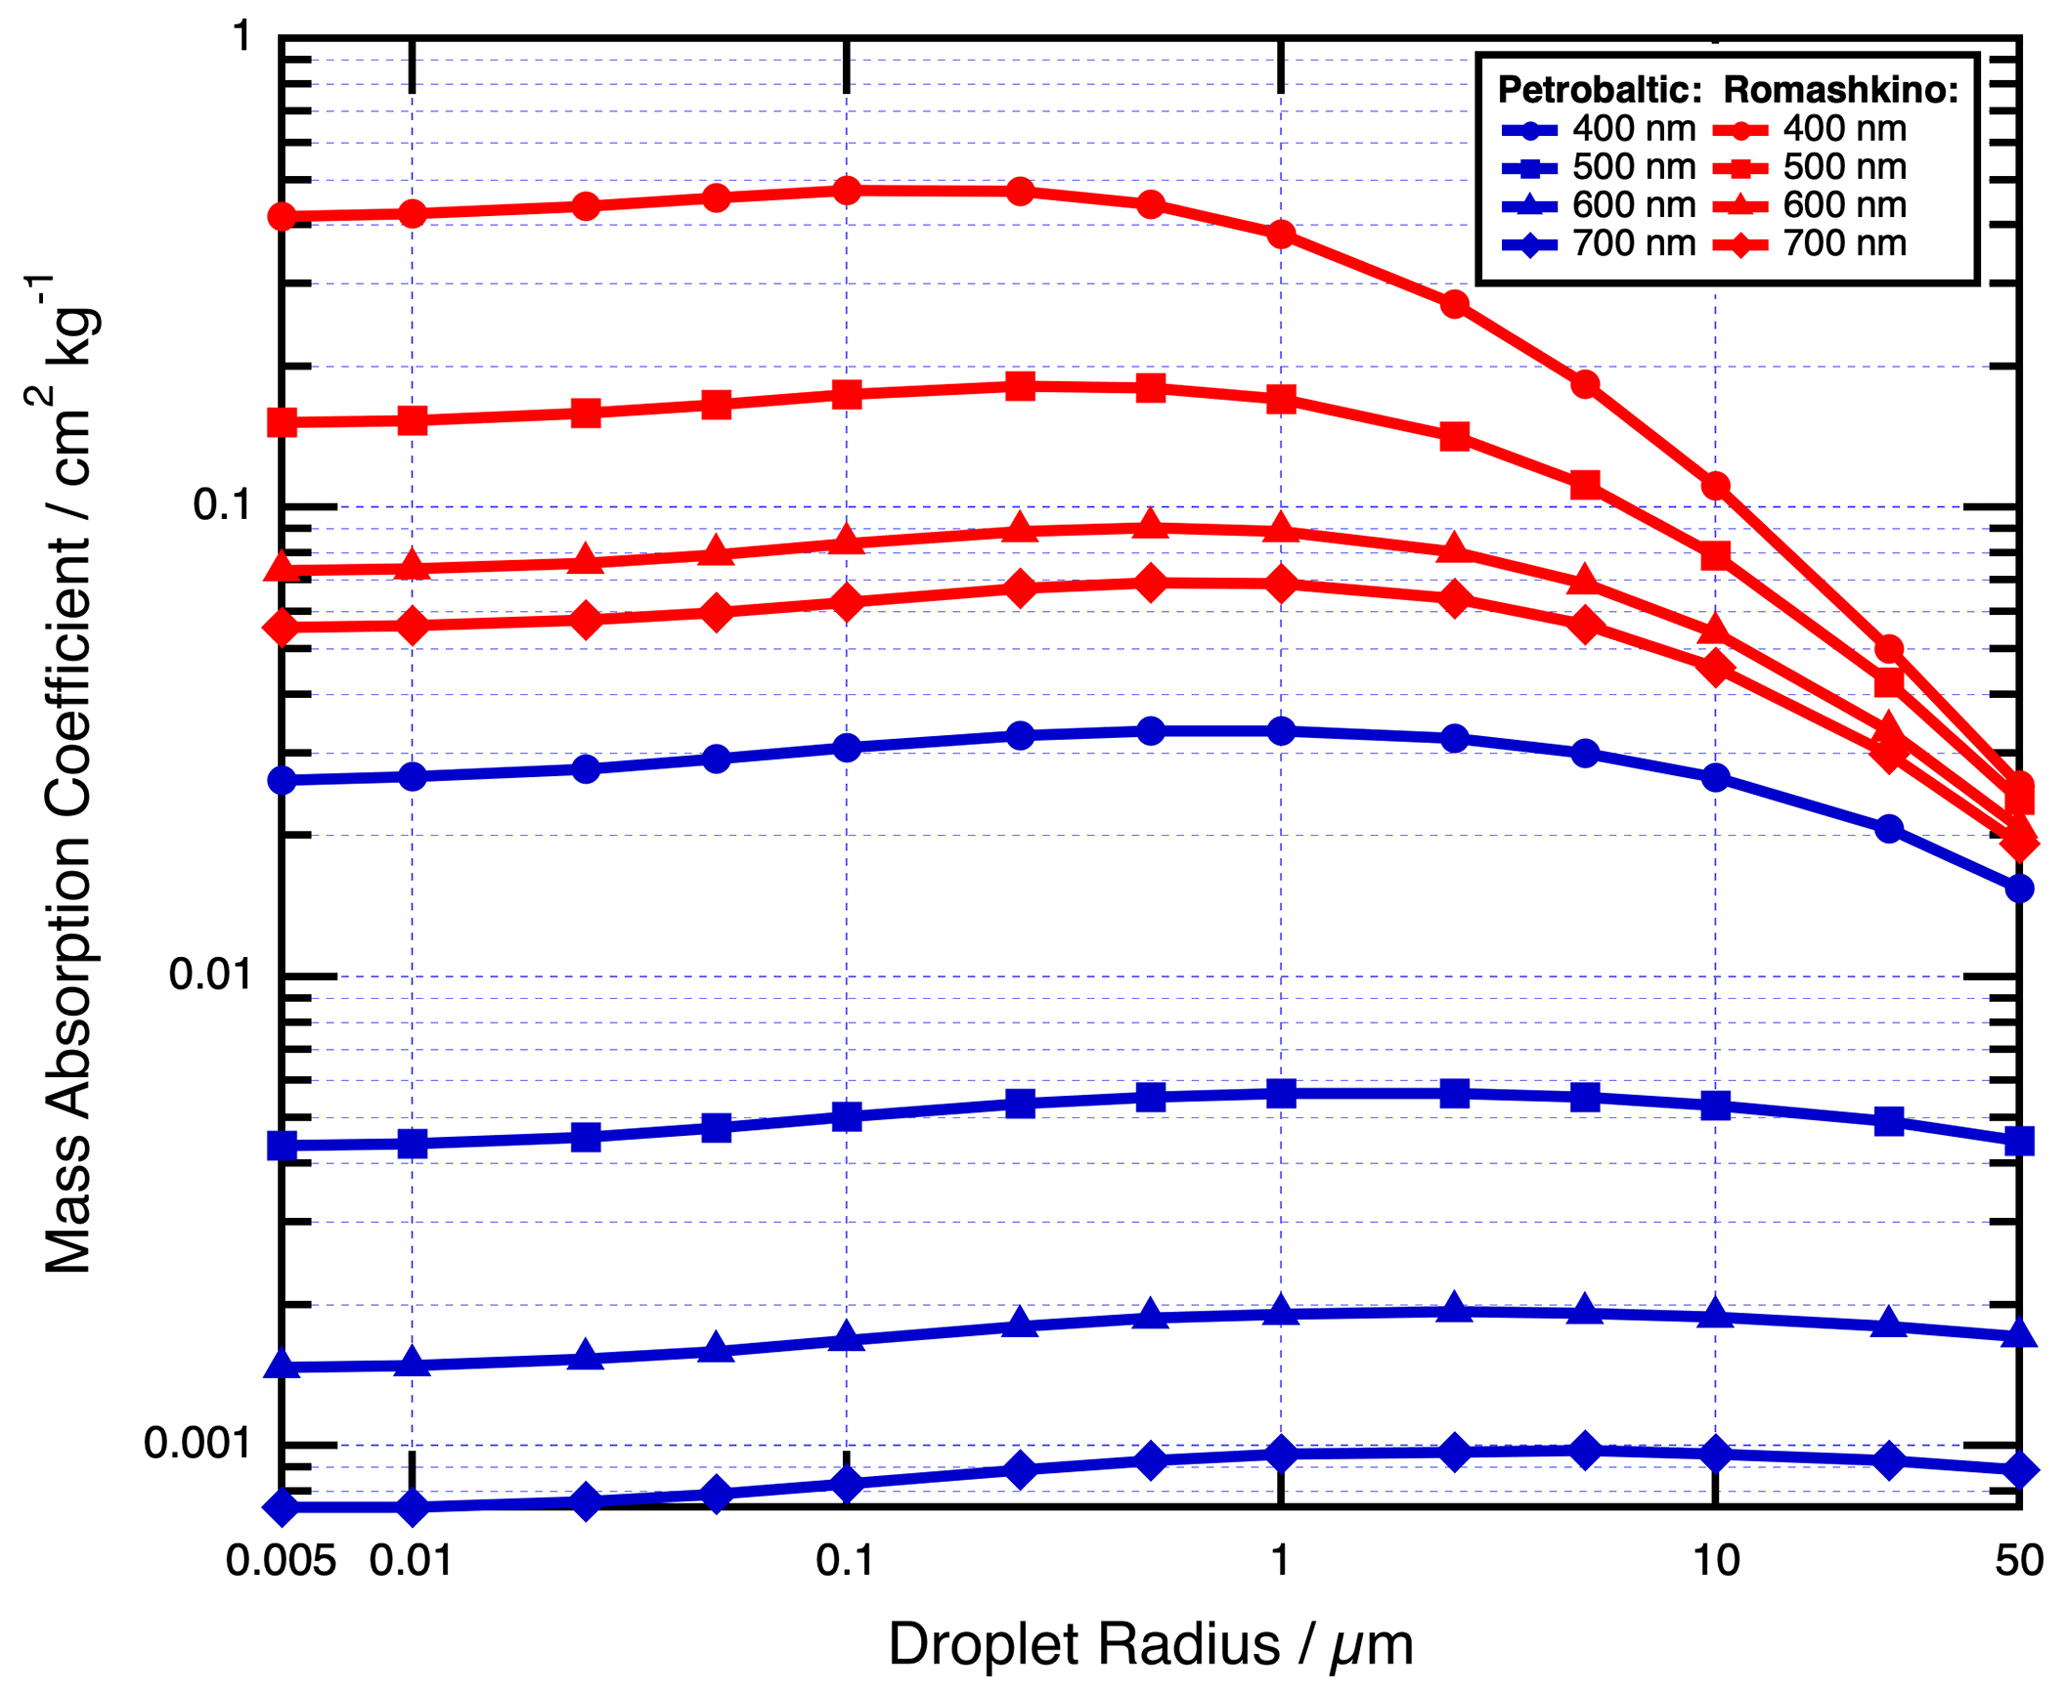
Figure 4Mass absorption coefficient of Romashkino and Petrobaltic oils with peak droplet radii between 0.005–50 µm. The geometric standard deviation size was set to e1 to represent a mid-range value for the particles studied here. These data demonstrate the mass absorption coefficient of Romashkino and Petrobaltic oil peak at different droplet sizes and different wavelengths.
3.3 The effect of oil droplet size distribution on the albedo of quasi-infinite sea ice
Figure 3 illustrates the surface albedo response of melting sea ice at a wavelength of 400 nm as mass ratios of Romashkino oil increase from 0–1000 ng g−1 for different-sized spherical droplets. Melting sea ice was selected as it is liable to have the least conservative effect owing to it having the largest penetration depth to light of the three types of sea ice. The different droplet sizes examined are characteristic of oils that have undergone different extents of weathering and are common in coastal areas, with radii of 0.05, 0.25, 0.5, 1.5, 2.5, 3.5, and 5 µm, in line with Haule and Freda (2016) and utilising the geometric standard deviation that was experimentally measured in Otremba (2007). The albedo is most responsive to the smallest droplet sizes (0.05–0.5 µm) and progressively less responsive as the droplets increase in size. The difference in albedo response to the smallest droplets is small, with a decrease in albedo at a mass ratio of 1000 ng g−1 to 21.7 % of the unpolluted value for a 0.25 µm droplet, 22.1 % for a 0.05 µm droplet, and 23 % for a 0.5 µm droplet. Figure 4 shows the mass absorption coefficient of a larger droplet size range (0.005–50 µm) of both Romashkino and Petrobaltic oils, which are assigned a geometric standard deviation of e1 and are displayed at a wavelength of 400, 500, 600, and 700 nm. The mass absorption coefficient of oil droplets is a function of droplet size in the Mie regime and can be seen to peak for Romashkino oil at a wavelength of 400 nm between 0.05 and 0.5 µm in Fig. 4. The relationship shown in Fig. 4 is an interplay between the value of the absorption efficiency from the Mie calculation and the increasing mass of a larger droplet, resulting in a decreasing mass absorption coefficient as the droplet size increases. As the wavelength increases the critical radius (i.e. the radius with maximum mass absorption coefficient) for Romashkino also changes from 0.1 µm at 400 nm to 0.5 µm at 700 nm. Similarly, for Petrobaltic the critical radius changes with increasing wavelength from 1 µm at 400 nm to 5 µm at 700 nm. For Romashkino there is only a minor decrease in mass absorption coefficient for droplets smaller than the critical radius, with a 0.005 µm droplet decreasing to 87.9 % of the value at 400 nm and 80.2 % at 700 nm. However, there is a significant decrease in the mass absorption coefficient for droplets larger than the critical radius, with a 50.0 µm droplet decreasing to 5.4 % of the value at 400 nm and 27.7 % of the value at 700 nm. For Petrobaltic there is a comparable minor decrease in mass absorption coefficient for droplets smaller than the critical radius, with a 0.005 µm droplet decreasing to 78.6 % of the value at 400 nm and 46.2 % at 700 nm. However, droplets larger than the critical radius do not experience the same reduction that is seen in the Romashkino, and the value only decreases to 75.5 % at 400 nm, as well as 90.8 % at 700 nm for the radii considered, presumably owing to the significantly weaker mass absorption coefficient. Figure 4 demonstrates the need for the size distribution of oil to be known for accurate reproductions of oil spills to be possible.
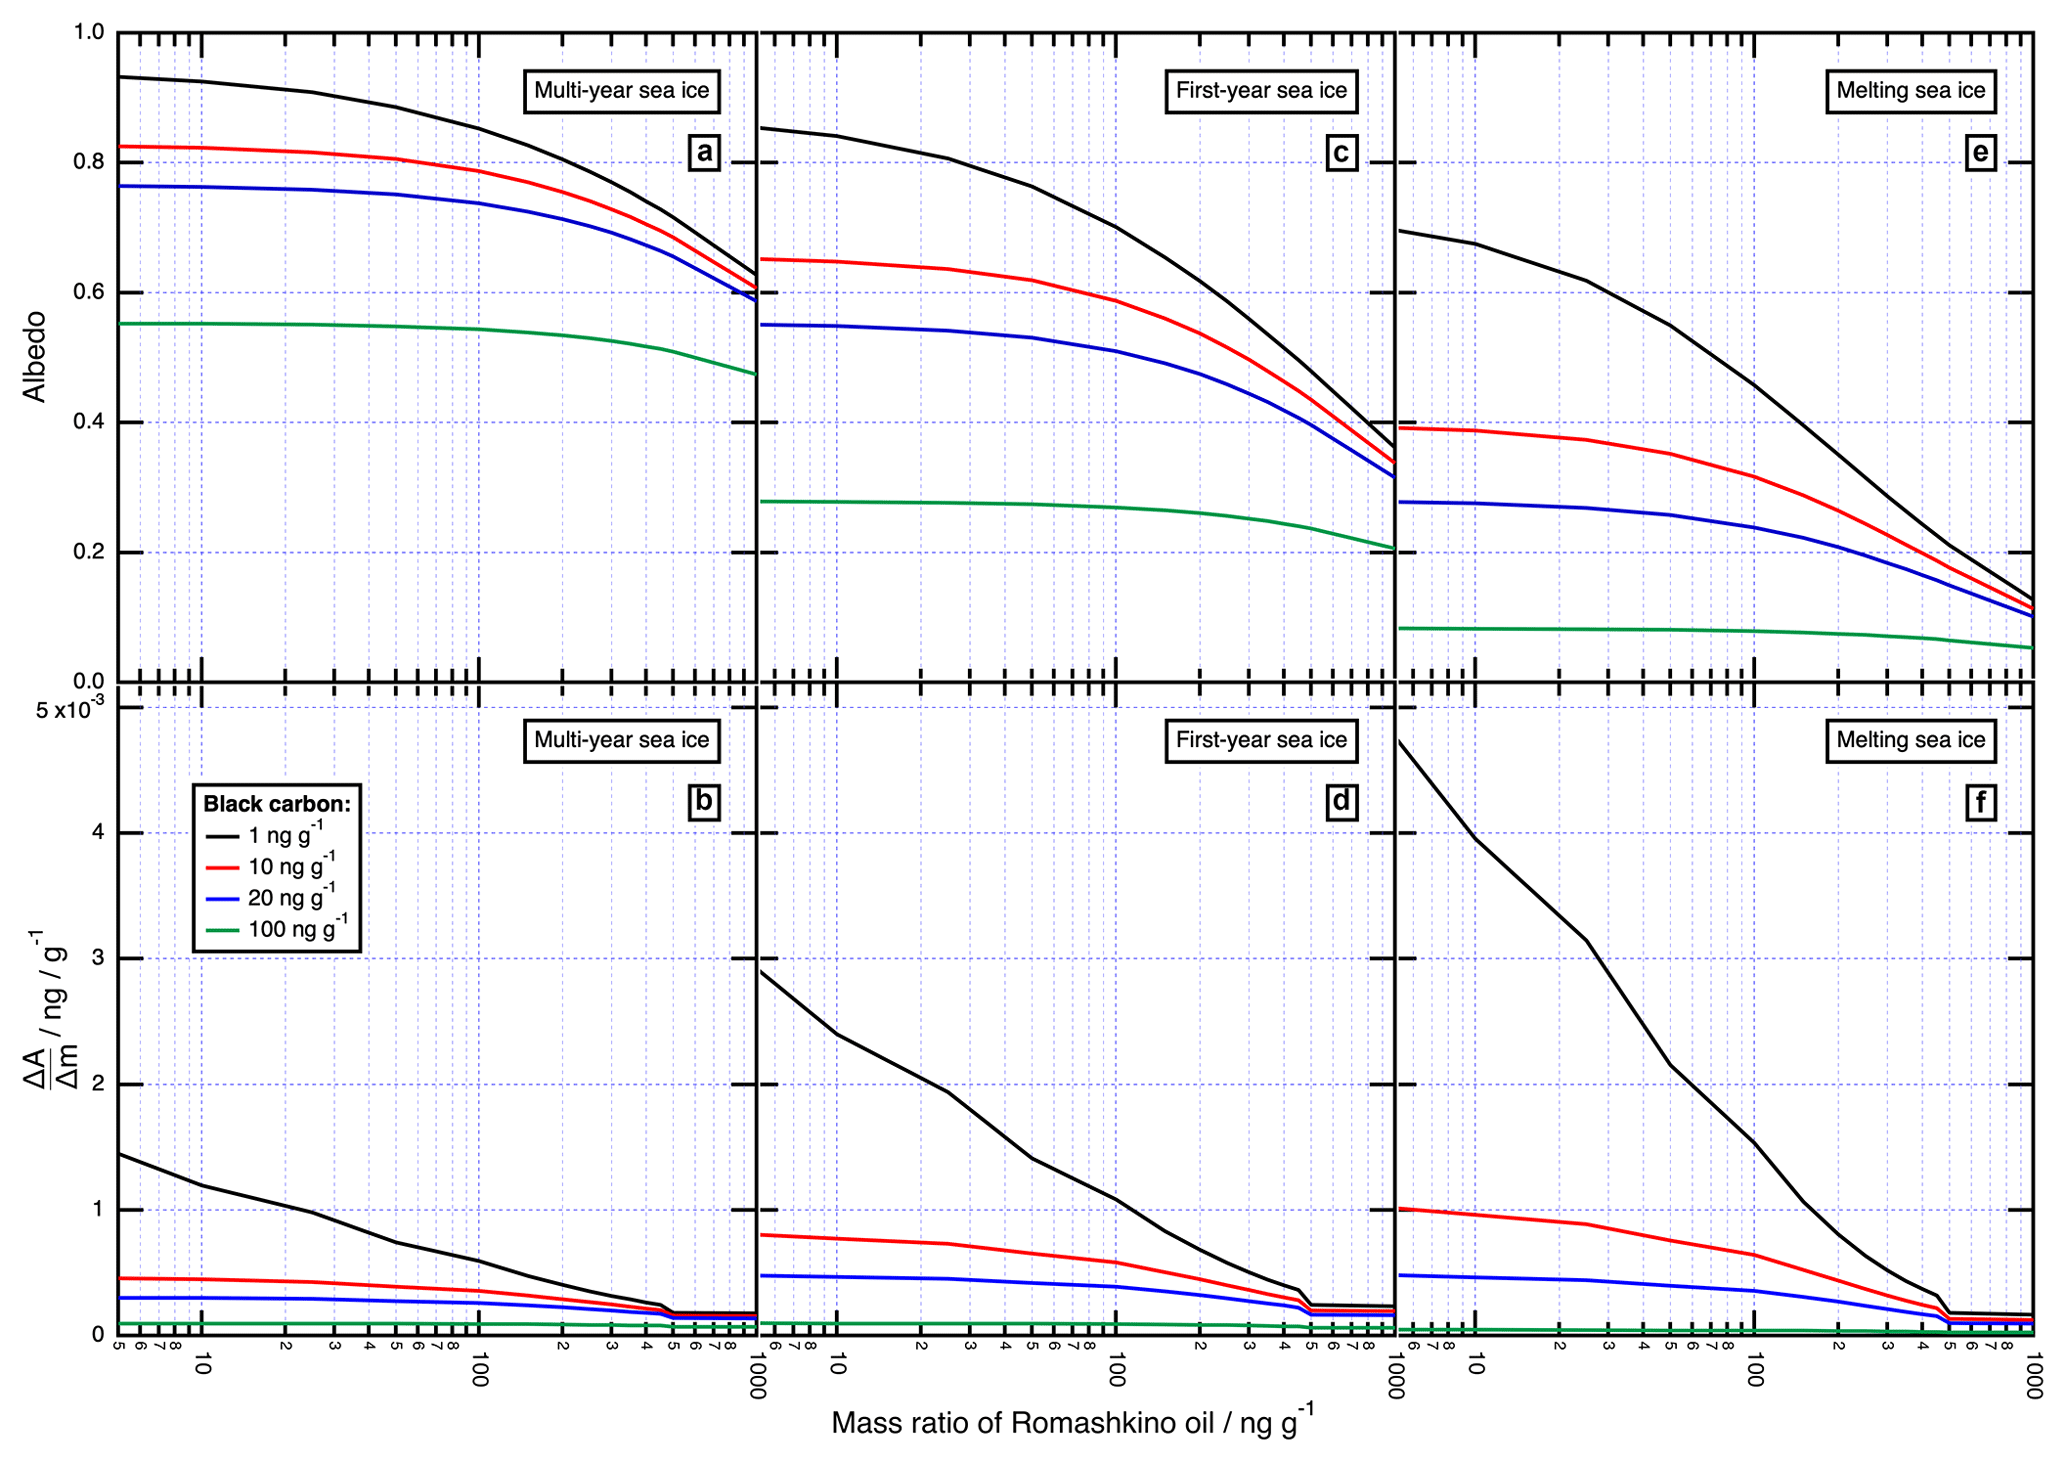
Figure 5Albedos of multi-year (a), first-year (c), and melting (e) sea ice with increasing mass ratios of Romashkino oil (0–1000 ng g−1) with a peak droplet radius of 0.05 µm. The gradients () of plots (a), (c), and (e) are shown for multi-year (b), first-year (d), and melting (f) sea ice, respectively. The selected wavelength is 400 nm, and the background levels of black carbon increase as follows: 1 ng g−1 (black line), 10 ng g−1 (red line), 20 ng g−1 (blue line), and 100 ng g−1 (green line). The three types of sea ice are quasi-infinite, and their properties are described in Table 1. These data demonstrate that increasing mass ratios of black carbon rapidly decrease the albedo response of each type of sea ice to Romashkino oil.
3.4 The effect of increasing background black carbon on the albedo of quasi-infinite sea ice
Figure 5 illustrates the surface albedo of melting, first-year, and multi-year sea ice as a function of increasing mass ratios of Romashkino oil from 0–1000 ng g−1 and background black carbon levels from 1–100 ng g−1. Figure 5a, c, and e indicate albedo versus increasing mass ratios of Romashkino oil, whereas Fig. 5b, d and f are a metric for the sensitivity of an ice to oil in the presence of black carbon, where sensitivity is the rate of change in albedo with increasing mass ratios of Romashkino oil (i.e. ).
Black carbon has a very strong absorption cross-section over short-wave wavelengths which is approximately ∼ 10 m2 g−1 between 400–700 nm (Marks and King, 2013), although global mean values range between 4.3–15 m2 g−1 (Bond et al., 2013). If black carbon is present the three types of sea ice have a decreased sensitivity to increasing mass ratios of oil pollution, as the largest decrease in albedo occurs in the cleanest ices with the smallest black carbon mass ratios. At a 1 ng g−1 mass ratio of black carbon, the albedos of the three sea ices are very responsive to low mass ratios of oil of less than 100 ng g−1. Melting sea ice is the most responsive sea ice to oil and has the largest sensitivity at 1 ng g−1 of black carbon, whereas multi-year sea ice is the least responsive and has the lowest sensitivity comparatively. As the mass ratio of black carbon increases, the sensitivity of the three sea ices to increasing mass ratios of oil rapidly decreases. Even at typical Arctic values of black carbon, which range between 5.5–19.2 ng g−1, the sensitivity is significantly decreased (Grenfell et al., 2002; Jiao et al., 2014). The 100 ng g−1 black carbon mass ratios are extreme values (Jiao et al., 2014) and significantly decrease the albedo of all three ices without any oil pollution present: multi-year sea ice albedo decreases to 59 % of its 1 ng g−1 black carbon value, the first-year sea ice albedo decreases to 32.4 %, and the melting sea ice decreases to 11.8 %. At such high mass ratios of black carbon, the response of the sea ice is significantly decreased as mass ratios of oil increase. Therefore, oil pollution will have a significantly greater effect on the albedo of the cleanest ice that is not already polluted by large mass ratios of black carbon.
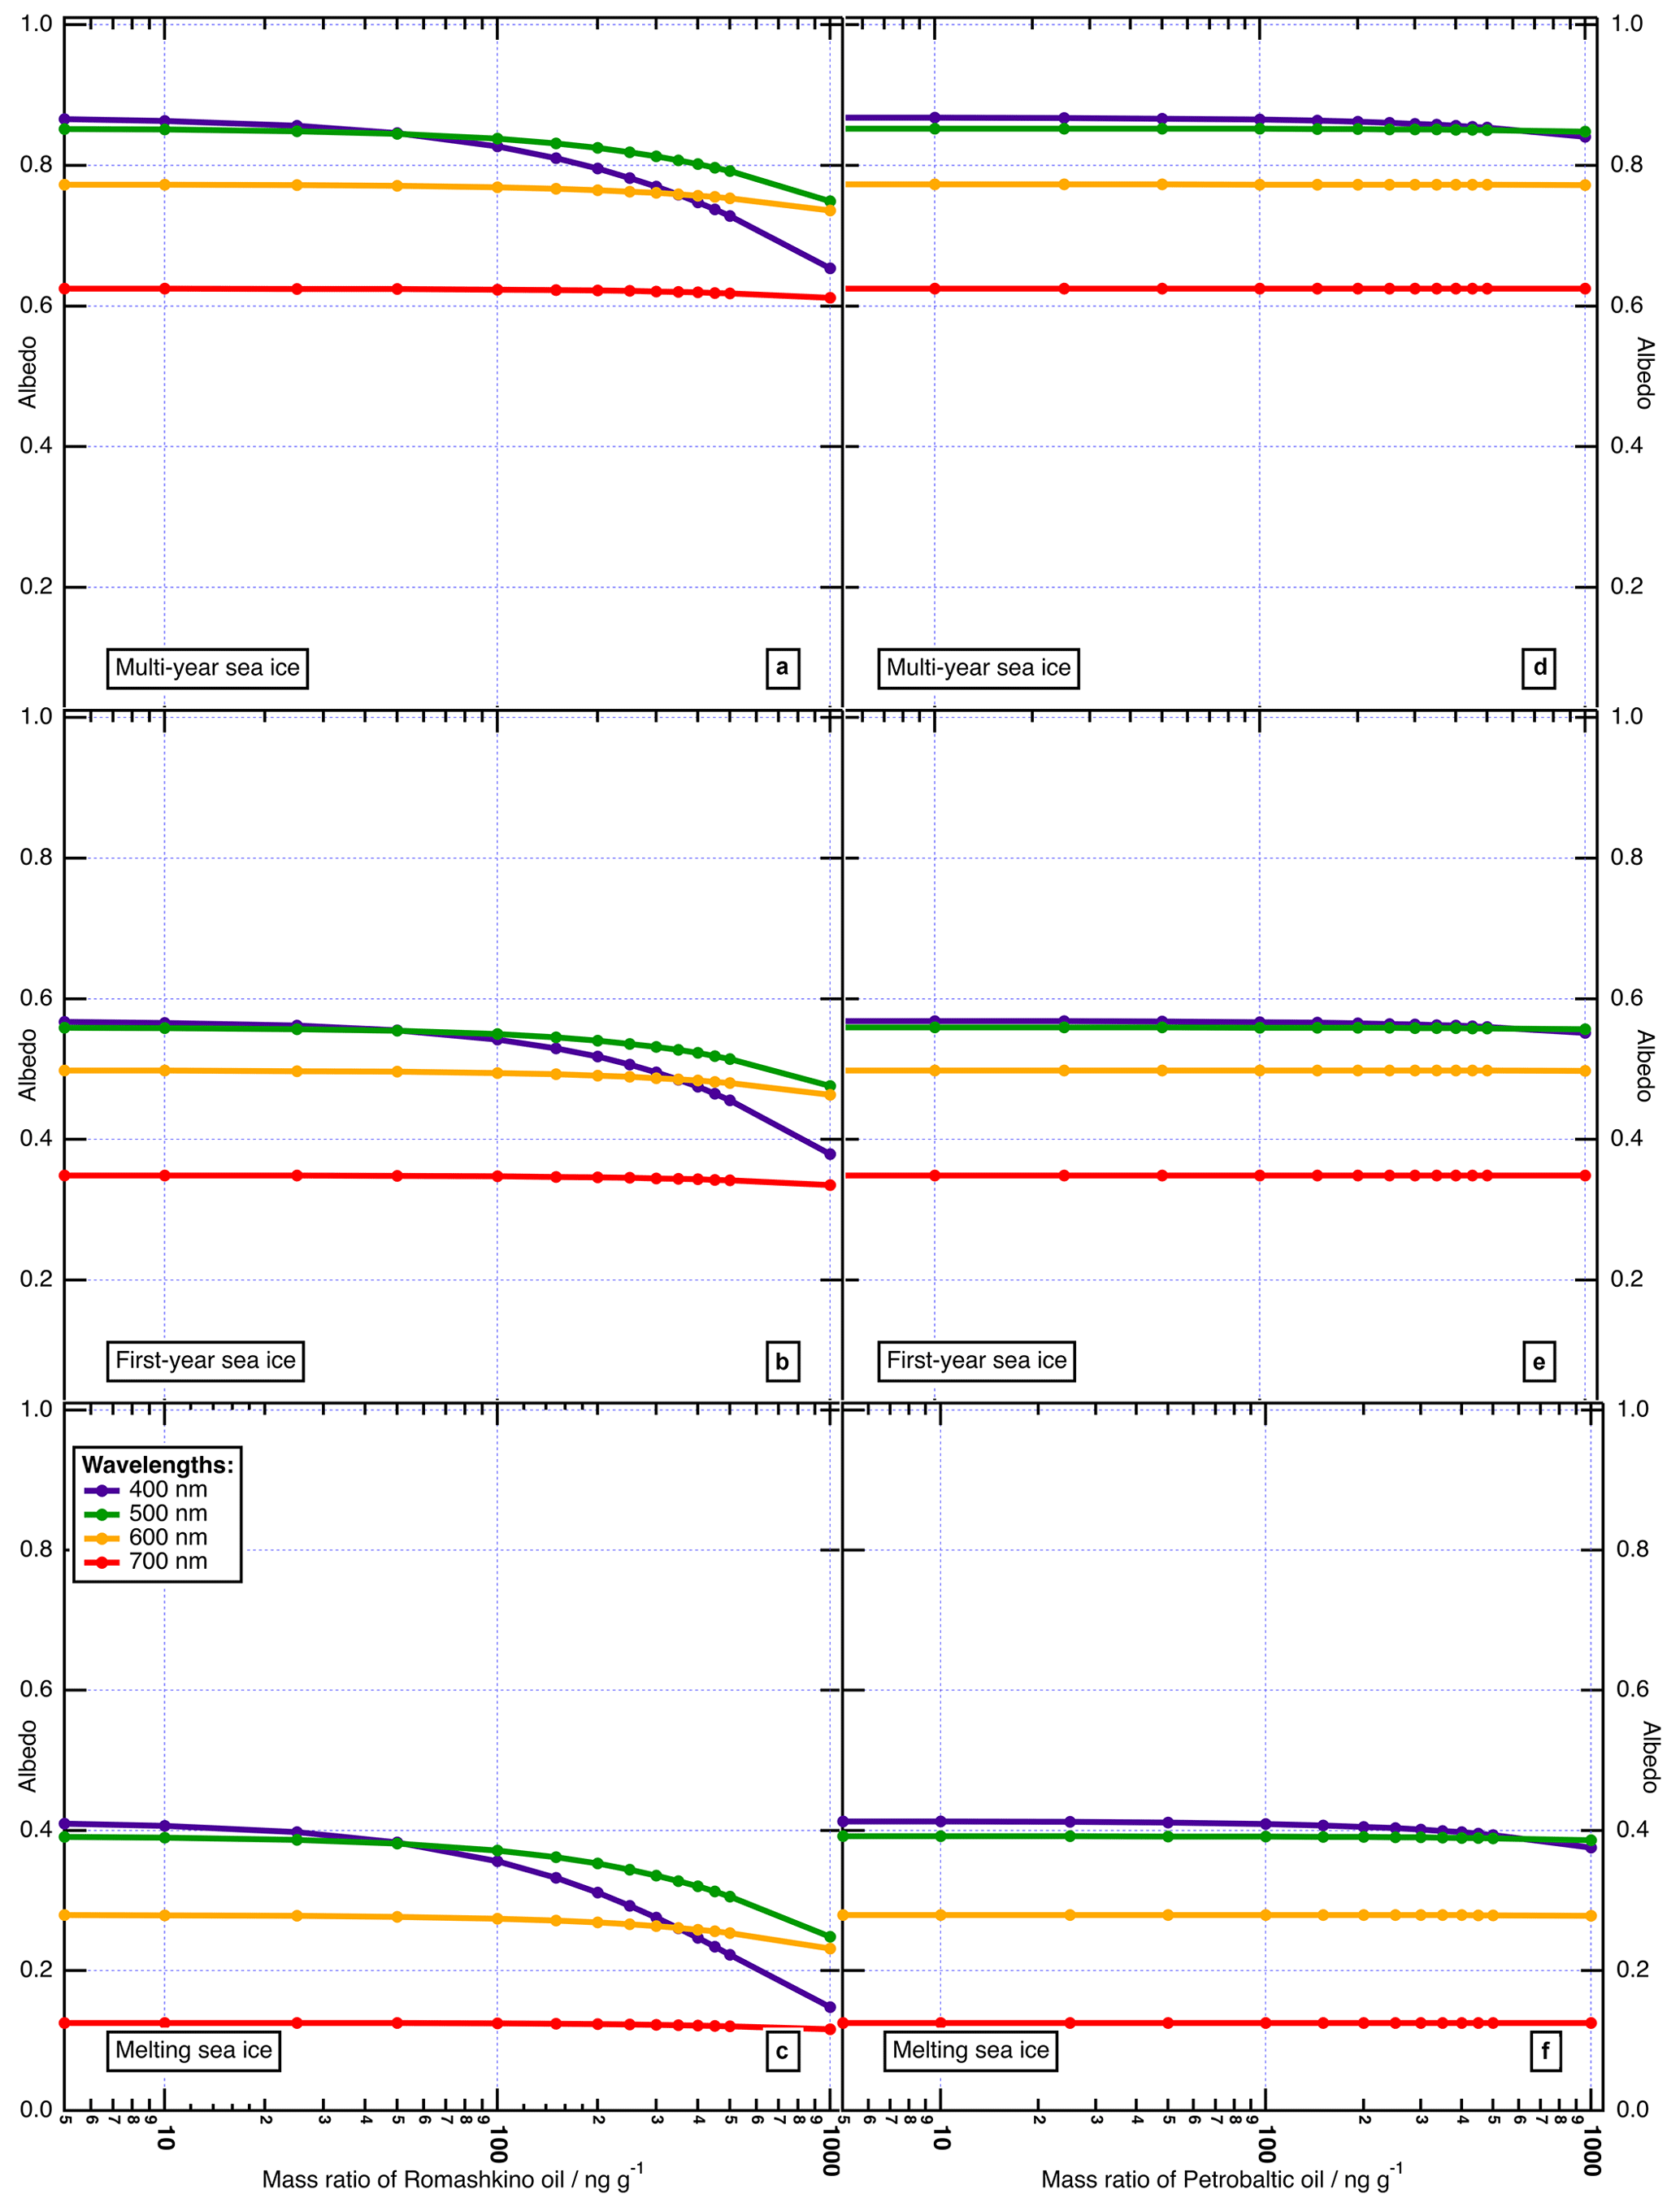
Figure 6Albedos of multi-year, first-year, and melting sea ice with increasing mass ratios of Romashkino (a–c) and Petrobaltic (d–f) oils (0–1000 ng g−1) with a median droplet radius of 0.05 µm. The selected wavelengths are 400, 500, 600, and 700 nm. The melting sea ice and multi-year sea ice are 2.5 m thick; the first-year sea ice is 0.8 m thick, and their properties are described in Table 1. These data demonstrate that the type of oil rather than the type of sea ice may have the largest effect on the albedo of realistic-thickness sea ice.
3.5 The effect of oil, type of sea ice, and mass ratio on realistic-thickness sea ice albedo
Calculations in Sect. 3.2 are replicated with realistic-thickness melting, first-year, and multi-year sea ice as a function of increasing mass ratios of Romashkino and Petrobaltic oils from 0–1000 ng g−1 and are illustrated in Fig. 6. Typical Arctic thicknesses of 2.5 m for multi-year and melting sea ice (Bourke and Garrett, 1987; Laxon et al., 2003; Weeks, 2010) and 0.8 m for first-year sea ice (Weeks, 2010) are used with a realistic background Arctic black carbon mass ratio of 5.5 ng g−1 (Grenfell et al., 2002). The realistic-thickness sea ices have different unpolluted albedos from the quasi-infinite sea ice (melting sea ice of 0.41, first-year sea ice of 0.58, and multi-year sea ice of 0.87 at a wavelength of 400 nm, respectively) and are comparable with previous literature (Marks and King, 2014; Lamare et al., 2016). The albedo response of each sea ice is decreased from the quasi-infinite sea ice albedo response owing to the presence of the dark ocean layer below the ice, with a 1000 ng g−1 mass ratio of Romashkino oil resulting in the albedo decreasing to 75.3 % for the multi-year sea ice, 66.3 % for the first-year sea ice, and 35.9 % for the melting sea ice relative to the unpolluted albedo at a wavelength of 400 nm. The albedo response to increasing mass ratios of Romashkino oil at longer wavelengths is weaker and essentially insignificant at wavelengths longer than 500 nm. Similarly, the albedo response to Petrobaltic oil at a 1000 ng g−1 mass ratio is negligible, with albedo decreasing to 96.8 % for the multi-year sea ice, 97 % for the first-year sea ice, and 90.9 % for the melting sea ice relative to the unpolluted albedo at a wavelength of 400 nm. The thickness and type of sea ice, as well as the type of oil, are important components in the effect that increasing mass ratios of oil have on sea ice albedo. As the ice becomes thinner, photons are likely to penetrate the ice and be absorbed by the underlying dark ocean layer. In the quasi-infinite sea ice, photons were only weakly absorbed by the ice and efficiently by the oil. The first-year sea ice is relatively less responsive to increasing mass ratios of oil than either the melting sea ice or the multi-year sea ice owing to its 0.8 m thickness compared to a 2.5 m thickness. This decreased response in albedo is indicated by the first-year sea ice albedo decreasing by 0.2 as the Romashkino oil mass ratio increases from 0 to 1000 ng g−1, whereas the multi-year sea ice albedo decreases by 0.22. The dramatic difference in albedo response to Romashkino oil and Petrobaltic oil indicates that the type of oil has a greater effect on sea ice albedo than the type or thickness of sea ice.
The Discussion is separated into seven sections: the Mie calculations, the effect of different droplet size distributions, the response of sea ice albedo to Petrobaltic or Romashkino oil, the effect of Romashkino and Petrobaltic oil on different types of sea ice, the albedo response of quasi-infinite sea ice and realistic-thickness sea ice to oil pollution, potential implications of the study, and potential limitations of the study.
4.1 Mie calculations
Several studies have explored the effects of aerosol pollution on snow and sea ice (e.g. Warren and Wiscombe, 1980; Warren, 1984; Clarke and Noone, 1985; Warren and Clarke, 1990; Light et al., 1998; Grenfell et al., 2002; Aoki et al., 2003; Lee-Taylor and Madronich, 2002; Jacobson, 2004; Flanner et al., 2007; Doherty et al., 2010; Dumont et al., 2010; Zatko et al., 2013; Marks and King, 2013; 2014; Lamare et al., 2016; Marks et al., 2017), but there has been limited research into the effect of oil pollution other than two basic field studies by NORCOR (1975) and Gavrilo and Tarashkevich (1992). To the author's knowledge, this is the first time the effect that small mass ratios of dispersed submicrometre weathered oil droplets have on the wavelength-dependent albedo of sea ice are considered. Whilst studies have looked at how oil pollution affects the inherent optical properties (i.e. absorption, scattering, backscattering, and attenuation coefficients) of liquid seawater (e.g. Otremba, 2007; Haule et al., 2015; Haule and Freda, 2016), they have not examined what the effect is on sea ice and its albedo. In this study, background levels of oil pollution are considered over a wide area and not within proximity to any single large and acute event (e.g. Deepwater Horizon or Exxon Valdez oil spills).
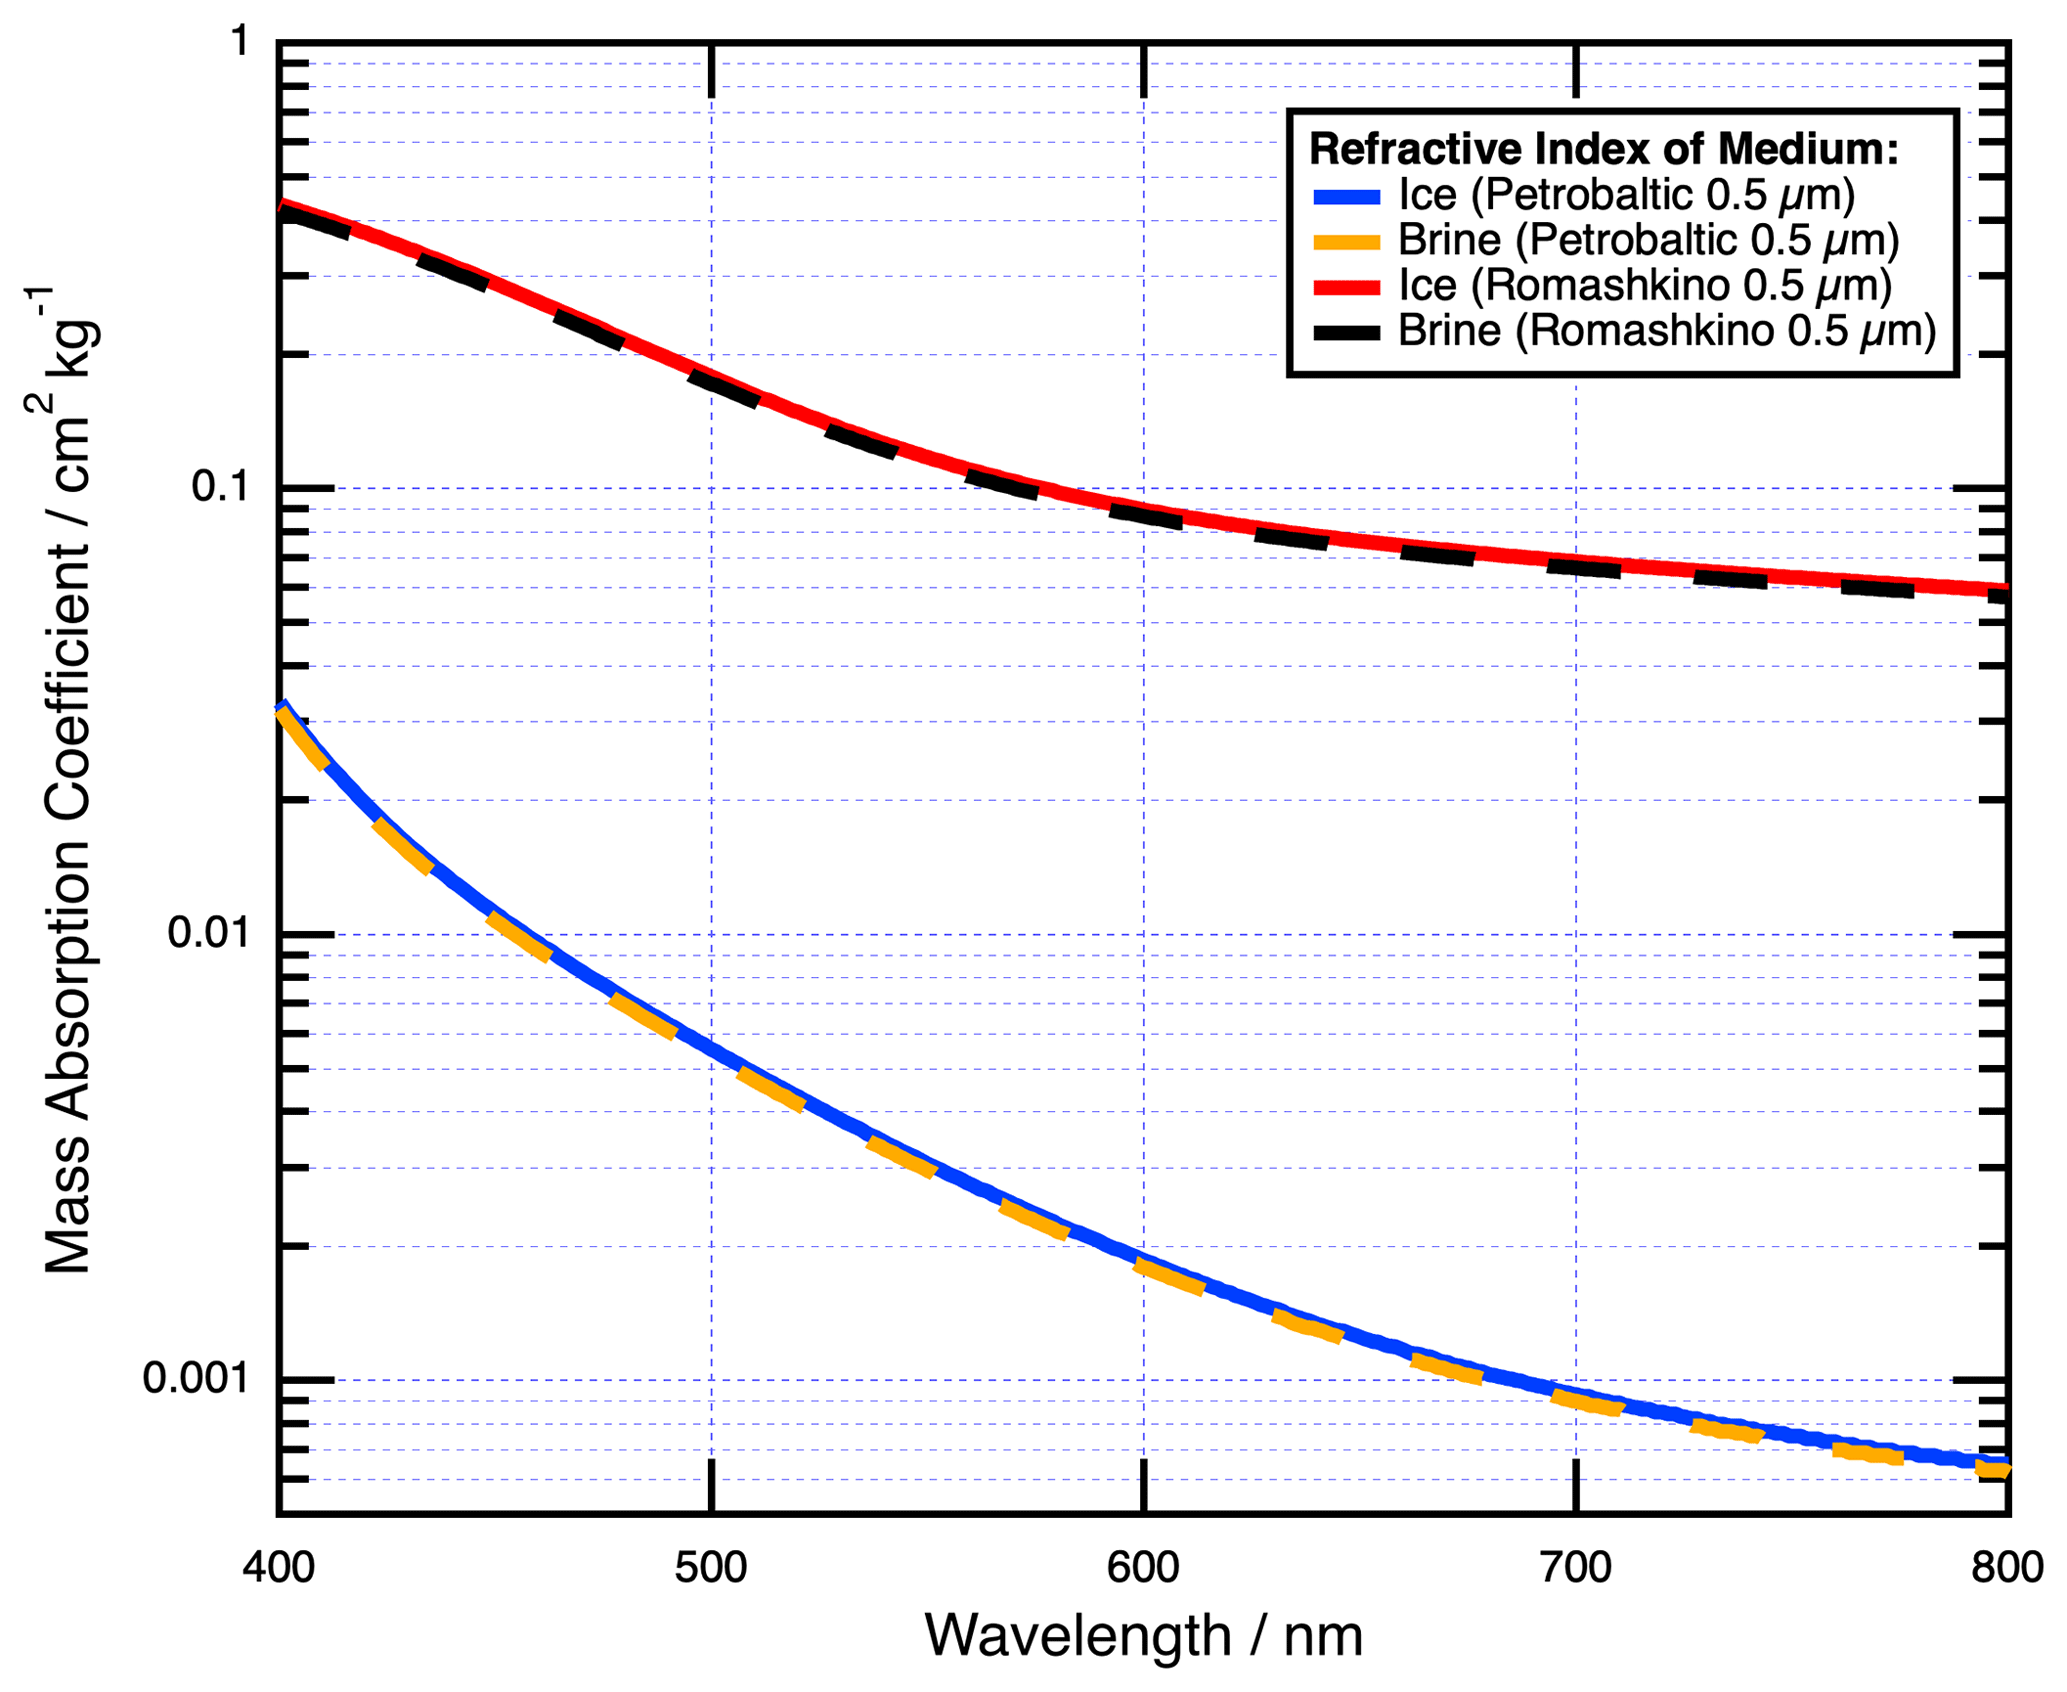
Figure 7Mass absorption coefficient of Romashkino and Petrobaltic oils with a median droplet radius of 0.5 µm in a medium of pure sea ice (Warren and Brandt, 2008) and a medium of brine (Quan and Fry, 1995). These data demonstrate that the mass absorption coefficient is independent of location (i.e. within the brine channel or ice matrix).
Oil is known to entrain itself into sea ice in several ways: (1) oil beneath the sea ice is frozen into the sea ice, and the ice continues to grow at its interface with the ocean, with the oil being fully encapsulated in the ice matrix within 18–72 h (NORCOR, 1975; Dickins and Buist, 1981; Buist and Dickins, 1983; Buist et al., 1983; Wilkinson et al., 2015); (2) oil will drift with the sea ice in broken ice fields when concentrations of sea ice are greater than 60 %–70 % and is incorporated into the sea ice during freeze-up (Venkatesh et al., 1990); and (3) the oil can become trapped in small cavities under the sea ice and may or may not be encapsulated, depending on the time of year (Drozdowski et al., 2011). Once encapsulated in the sea ice the oil can migrate to the surface owing to its buoyancy; however, this rate is heavily dependent upon the amount of brine drainage within the sea ice and therefore the time of year (Drozdowski et al., 2011). Martin (1979) found that during the winter, oil formed thin lenses in the sea ice, which then distributed themselves throughout the brine channel feeder systems in the spring (February to March) as these expanded and eventually formed horizontal layers in the upper part of the sea ice (NORCOR, 1975). Martin (1979) also found that in summer oil at the ice surface leads to melt-pond formation owing to the absorption of solar energy; once on the surface, the oil will be reintroduced to the ocean in a weathered or emulsified form by melting through the ice or flowing off the sides. These studies have focused on macroscopic quantities of oil, whereas the work presented here focuses on microscopic-sized background concentrations of oil which are less well characterised. The mass ratio of 1000 ng g−1 of oil in ice is possibly a large value for diffuse background pollution but is included to provide a significant upper limit to the effect of background oil pollution on sea ice. Therefore, it is unclear whether the droplets are in the matrix or brine channels of the sea ice, so in the work presented here, they are assumed to be evenly distributed throughout the ice to replicate the different stages of the seasonal variation. The droplets are also considered to be in a pure sea ice medium (Warren and Brandt, 2008) as opposed to a brine medium (Quan and Fry, 1995) for optical calculations. The refractive index of the medium in which the oil droplet is contained may affect the value of its mass absorption coefficient established from a Mie calculation. However, as indicated by Fig. 7, the difference in mass absorption coefficient for the oil droplets between a sea ice medium (refractive index of 1.3091 at a wavelength of 600 nm) and brine (refractive index of 1.3402 at a wavelength of 600 nm) medium is inconsequential owing to their similar refractive indices (Quan and Fry, 1995; Warren and Brandt, 2008). Thus, the position of the oil droplet within the sea ice may not be important.
The shape of the oil droplets may also be an important factor that influences the Mie calculations. Whilst the shape of oil droplets in sea ice or brine is not known, immiscible fluids are known to adopt spherical morphologies to reduce their surface relative to volume and both mechanically and chemically dispersed droplets are spherical in nature (Johansen et al., 2013). Brine channels typically have a width of 0.1 mm (Lieb-Lappen et al., 2017), which is far larger than the droplet sizes considered here, so it is unlikely that droplet morphology is affected when being transported through the brine channels (NORCOR, 1975; Martin, 1979). Therefore, the oil droplets are assumed to be spherical in the model, as spheres are computationally facile for Mie calculations and the shape must be known for the calculation.
4.2 Droplet size distribution
Tens-of-micrometres- to millimetre-scale droplets are present in seawater immediately after the release of oil, either from the subsurface or at the surface (e.g. Spaulding et al., 1992; Reed and Rye, 1995; Daling et al., 1997; Johansen, 2003; Zheng et al., 2003; Lima Neto et al., 2008; Socolofsky et al., 2008; Gamzaev, 2009; Papadimitrakis et al., 2005, 2011; Fraga et al., 2016; Dissanayake et al., 2018). Fingas and Hollebone (2014) summarise much of the literature on the behaviour of oil in ice-infested waters; however, all the research discussed involves releasing large quantities of oil either directly under or onto the ice in acute events, whereas this study focuses on background quantities of oil. After release the droplets can travel several hundred square kilometres within several days (Berenshtein et al., 2020) and are exposed to weathering processes that continually decrease the droplet size (e.g. Daling et al., 1990; Resby and Wang, 2004; Dilliplaine et al., 2021). The dispersed droplet distribution sizes can be described by a log-normal distribution of submicrometre droplets with an experimentally measured peak for weathered oil centred around a median radius of 0.05 µm (Otremba, 2007; Li et al., 2011; Johansen et al., 2013; Haule et al., 2015; Haule and Freda, 2016). The focus of this study is on the small mass ratios (i.e. 1000 ng g−1 or less) of submicrometre weathered oil droplets that are incorporated into the sea ice in polluted polar seas. It is likely that small droplets in this range are the most numerous and will affect large areas of polar sea ice, in addition to the fact that droplets that have been treated with dispersants will also be smaller (C. Li et al., 2017). Therefore, log-normal distributions of droplets with medians in the range 0.005–50 µm are considered for completeness (Fig. 4). The droplets considered in Fig. 4 were assigned a geometric standard deviation size e1 as it is a mid-range value from Haule and Freda (2016) and to keep the distribution width equivalent for each droplet size. The geometric standard deviation used for all other figures is consistent with measurements from Otremba (2007) and used in Haule and Freda (2016).
With reference to Fig. 3, it is apparent that sea ice albedo is weakly sensitive to the droplet size of oil in the range explored. Weathered submicrometre droplets of absorbing oils such as Romashkino have a greater effect on albedo than larger micrometre-scale droplets, with Fig. 4 indicating the critical radius changes marginally from 0.1 µm at a wavelength of 400 nm to 0.5 µm at a wavelength of 700 nm. These weathered submicrometre droplets are roughly equivalent in size to the wavelength of light (∼ 0.5 µm), and therefore Mie light scattering must be considered (Petty, 2006). The Petrobaltic oil mass absorption coefficient also decreases as the droplet size increases, albeit more slowly than the Romashkino oil owing to its very low values. This weak dependence of sea ice albedo to droplet size may have implications for remote sensing, and droplet size estimates may be important to calculate the effect of oil pollution on sea ice albedo for future events.
4.3 Effect of different oils in quasi-infinite sea ice
Both the real and imaginary refractive indices of Romashkino and Petrobaltic oil are described as the respective largest and smallest values that oils capable of creating surface films possess, according to Otremba (2000). Therefore, Romashkino has a significantly larger mass absorption cross-section than Petrobaltic, roughly 13-fold greater for a 0.5 µm droplet at a wavelength of 400 nm. The resulting differences in effect on sea ice albedo are therefore very significant, with 1000 ng g−1 of Romashkino decreasing the albedo of first-year ice from 0.87 to 0.41 (a decrease to 47 % relative to the unpolluted value) at 400 nm, whereas Petrobaltic decreases the albedo from 0.87 to 0.77 (a decrease to 88.2 % relative to the unpolluted value). As the ice becomes more absorbing at longer wavelengths (Warren and Brandt, 2008), this difference is decreased: at 550 nm, 1000 ng g−1 causes a decrease in albedo of Romashkino to 81.6 % and of Petrobaltic to 99.3 %. At 700 nm the effect is very low for both oils. Thus, even at small mass ratios, heavy and opaque oils such as Romashkino (0.94 g cm−3) will have a significant effect on sea ice albedo, whilst relatively transparent and light oils, such as Petrobaltic (0.77 g cm−3), may have an insignificant effect on albedo (Otremba, 2005; 2007; Hollebone, 2015). Therefore, both Romashkino and Petrobaltic can be regarded as the upper and lower respective brackets of the effect that oil pollution can have on sea ice albedo. This may be of note as the most commonly used fuel for commercial vessels is heavy fuel oil, which is defined as having a density of 0.9 g cm−3 (IMO, 1983) and is therefore analogous to Romashkino oil.
4.4 Response of melting, first-year, and multi-year sea ice to oil
The three different sea ices considered here are all modelled at a quasi-infinite thickness of 15 m, in line with similar studies (e.g. Marks and King, 2014; Lamare et al., 2016), to ensure that the albedo was independent of the layer under the sea ice and any effects that a non-optically thick sea ice may have, whilst the properties of sea ice type, mass ratio, and droplet size are considered. Although such large thicknesses are not typical in nature and this causes the unpolluted albedo of all three sea ices to be exaggerated from their natural values, it is useful to understand how Romashkino and Petrobaltic fundamentally affect albedo. The multi-year sea ice is the least affected by either type of oil, with a decrease to 70.9 % and 94.5 % of the unpolluted albedo at a mass ratio of 1000 ng g−1 of Romashkino oil and Petrobaltic oil, respectively. The multi-year sea albedo ice is only affected by mass ratios of Romashkino oil exceeding 100 ng g−1. However, multi-year sea ice is susceptible to oil pollution, as Comfort and Purves (1982) confirmed that oil does eventually migrate to the surface, despite a thickness of several metres. First-year sea ice is more sensitive to oil pollution and decreased to 47.2 % and 88.2 % of the unpolluted albedo at a mass ratio of 1000 ng g−1 of Romashkino oil and Petrobaltic oil, respectively. The first-year sea ice albedo is affected by mass ratios of Romashkino exceeding 50 ng g−1. The most sensitive sea ice to oil pollution by a considerable margin is the melting sea ice which decreased to 22.1 % and 77 % of the unpolluted albedo at a mass ratio of 1000 ng g−1 of Romashkino oil and Petrobaltic oil, respectively. The melting sea ice albedo is affected by mass ratios of Romashkino exceeding 25 ng g−1.
Melting sea ice is the least reflective type of sea ice with a scattering cross-section of 0.03 compared to 0.15 (first-year sea ice) and 0.75 (multi-year sea ice) (Perovich, 1996; Marks and King, 2014), resulting in it becoming substantially more absorbing as pollutants are added. Whilst these findings are unsurprising, they are concerning as multi-year Arctic sea ice has declined dramatically from 64 % of the total sea ice in March 1985 to 30 % in March 2020, with ≥4-year-old sea ice decreasing from 33 % to 4.4 %, respectively (Perovich et al., 2020). As these data show, this decline in perennial types of sea ice may render the Arctic more vulnerable to increased oil pollution in the region, particularly as it is opened to both shipping and oil extraction.
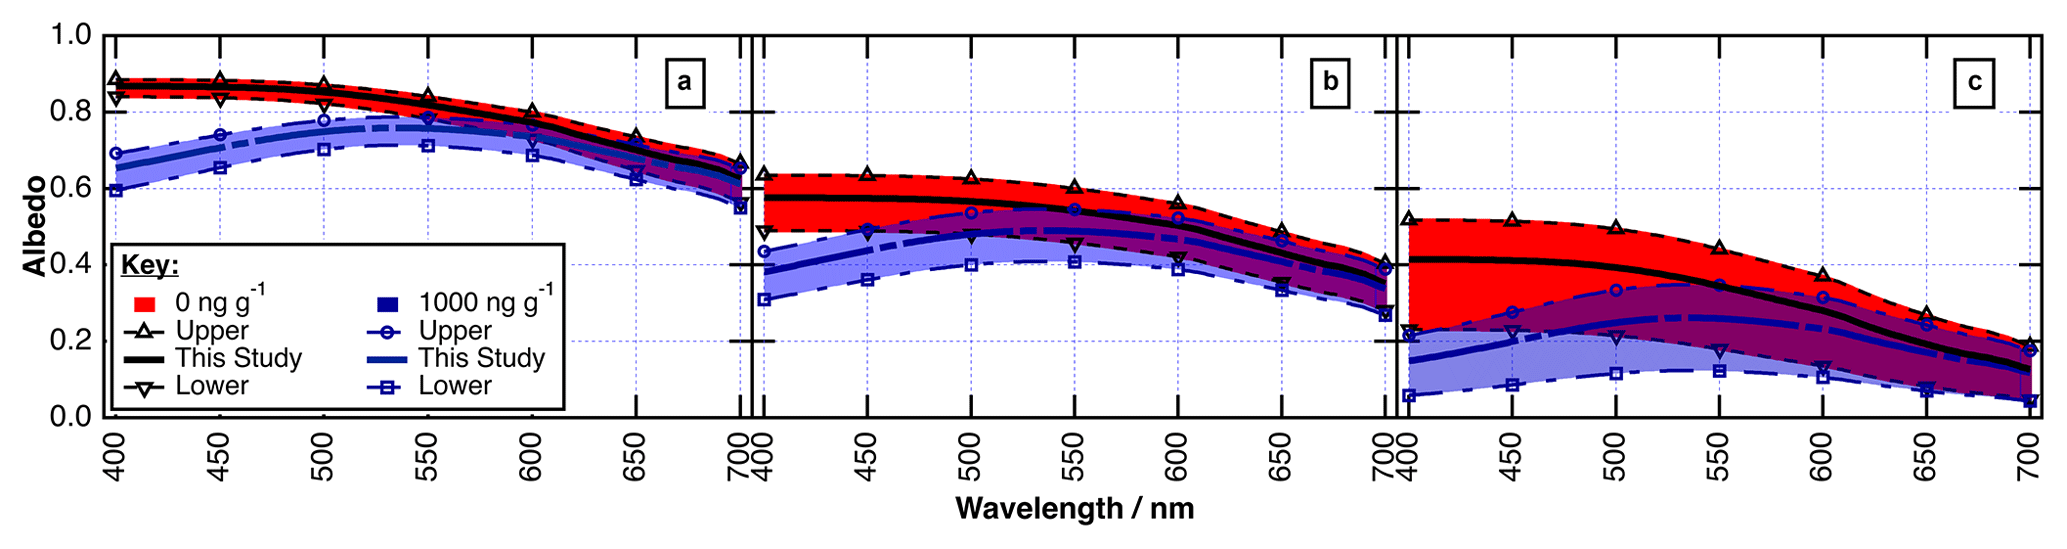
Figure 8Wavelength-dependent albedo of multi-year (a), first-year (b), and melting sea ice (c). Shown here is the variability in the albedo of each type of sea ice based on scattering cross-sections described in the literature (Grenfell and Maykut, 1977; Perovich, 1990, 1996; Timco and Frederking, 1996; Gerland et al., 1999; Simpson et al., 2002; Fisher et al., 2005; King et al., 2005; France et al., 2011; Marks and King, 2013), ranging from 0.5–1 m2 kg−1 for multi-year sea ice, 0.1–0.2 m2 kg−1 for first-year sea ice, and 0.01–0.05 m2 kg−1 for melting sea ice. Shown in red are the data with no oil pollution present, and shown in blue are the data with 1000 ng g−1 of Romashkino oil present. The thicker lines show the values of typical ice that are used in this study. The melting sea ice and multi-year sea ice are 2.5 m thick; the first-year sea ice is 0.8 m thick; and the background concentration of black carbon is set to 5.5 ng g−1.
4.5 The effect of depth
The work described here has focused on quasi-infinite sea ice throughout to ensure that it is optically thick and therefore independent of the layer under the sea ice. Section 4.5 explores the response of realistic sea ice thicknesses and black carbon mass ratios to offer a realistic comparison with the quasi-infinite thicknesses. In comparing the quasi-infinite sea ice with the realistic sea ice (i.e. Figs. 2 and 6), it is apparent that the melting sea ice is less responsive to increasing mass ratios of Romashkino oil and essentially not affected by Petrobaltic oil. The photons are continuously scattered in the quasi-infinite sea ice, and this increases the likelihood of the photons being absorbed by oil droplets, whereas in the realistic ice the photons have a greater chance of passing through the ice and being absorbed by the dark layer under the sea ice. This effect is also apparent in the first-year sea ice which is less affected by increasing mass ratios of both oils than the multi-year sea ice, despite having a smaller scattering cross-section, because it is thinner. Even though the realistic types of sea ice are less responsive to increasing mass ratios of oil, their albedos are still significantly decreased by the Romashkino oil. Therefore, it appears that the type of oil has the biggest effect on how responsive sea ice is to increasing mass ratios of oil owing to the large variability in oil optical properties. This differs from a similar study (Lamare et al., 2016) which concluded that the optical properties of sea ice played a more important role on the response of sea ice albedo than the type of pollutant (e.g. windblown aerosols).
4.6 Implications of the study
Arctic multi-year and first-year sea ice are declining at 17.5 % and 13.5 % per decade, respectively, and melting sea ice is becoming more prevalent earlier in the year (Comiso, 2012; Tschudi et al., 2019). First-year and particularly melting sea ice may be more responsive to oil pollution than multi-year sea ice, so these trends indicate that sea ice albedo in the Arctic may become more vulnerable to background levels of oil pollution as the relative amount of these types of ice dominates in the Arctic. This increasing vulnerability will be exacerbated by the potential future extraction of the vast hydrocarbon reserves in the Arctic Ocean (Bird et al., 2008; Krivorotov and Finger, 2019; Czarny, 2019) and the development of northern sea routes (Ho, 2010; Eguíluz et al., 2016; Kikkas and Romashkina, 2018), resulting in vast quantities of heavy fuel oil akin to Romashkino oil passing through the region and potentially exposing it to increased pollution (IMO, 1983; De Carolis et al., 2014). Furthermore, the albedo of clean sea ice is more responsive to oil pollution than sea ice polluted with higher mass ratios of aerosols such as black carbon, so future oil pollution may imperil vast areas of pristine Arctic sea ice even at low background mass ratios.
4.7 Uncertainties
There are a few potential uncertainties to this study stemming primarily from the fact that it is a modelling study and that, to the author's knowledge, this is the first instance that the effect of background oil pollution on sea ice albedo has been considered. A limitation of the Mie calculations is the uncertainty of whether the oil droplets are spherical in the ice. A careful study of the particle morphology of oil droplets in ice is required to improve the veracity of future modelling studies. However, it is expected that the results presented here would be much better than an order-of-magnitude level. A second potential limitation of this study is that it has not considered the effect of a snowpack on top of the sea ice. Sea ice is frequently covered with snow, and sea ice tends to only be free of snow where it is removed by katabatic winds or during the melting season (Weeks, 2010). Whereas similar studies (e.g. Marks and King, 2013, 2014; Lamare et al., 2016) consider layers of snow on top of the ice, they differ in that the pollutants explored are atmospherically deposited directly on top of both the ice and snow. For the oil considered here to be incorporated into the ice, it must be frozen into the ice directly from the seawater below (NORCOR, 1975; Martin, 1979; Dickins and Buist, 1981; Buist and Dickins, 1983; Buist et al., 1983; Wilkinson et al., 2015; Drozdowski et al., 2011). However, Owens et al. (2005) found that if snow comes into contact with oil, for instance, if the snow ice forms from the surface flooding of an ice floe, it can initially absorb up to 70 % of the oil, thus decreasing the albedo of the snow. Furthermore, a layer of oil underneath the snowpack may expedite melting from below as the oil may be up to 6 ∘C warmer than the air temperature (Chen, 1972). The amount of snow cover on sea ice varies significantly across the Arctic (Zhou et al., 2021), so some areas may be more vulnerable to oil pollution earlier in the spring. Nevertheless, even a thin snow cover (less than 1 cm) can increase the albedo of sea ice and can be considered optically thick when it exceeds 10 cm (France et al., 2011; Marks and King, 2013). Therefore, similar to the work by Light et al. (1998), the findings of this study may only be valid during the ablation season when snow cover has melted or been removed by wind, as the different types of sea ice considered here are bare.
Throughout this study, the typical mid-range values for sea ice have been selected and are reported in Table 1. To assess any uncertainties that may arise from the variability of scattering cross-sections reported in the literature (Grenfell and Maykut, 1977; Perovich, 1990, 1996; Timco and Frederking, 1996; Gerland et al., 1999; Simpson et al., 2002; Fisher et al., 2005; King et al., 2005; France et al., 2011; Marks and King, 2013), Fig. 8 is additionally presented and indicates the response of realistic types of sea ice with both lower and higher scattering cross-sections. There is natural variability in sea ice density between 700–950 kg m−3 (Grenfell and Maykut, 1977; Perovich, 1990, 1996; Timco and Frederking, 1996; Gerland et al., 1999) which can be propagated to a variation in scattering cross-section of approximately a factor of 0.88 and 1.19 of the original values for the lowest and highest reported densities, respectively. These ranges are much smaller than the natural variation in the scattering of sea ice, as shown in Fig. 8. The variation due to the density of ice in this study is not considered important.
This paper is a sensitivity study that considers a wide variety of optical and physical parameters for the oil pollution of sea ice. Ultimately, the results indicate that background concentrations of oil pollution may have an important effect on sea ice albedo. It is anticipated that this study will act as a foundation for more complex studies to follow that, coupled with field- and lab-based experiments, may explore the effects such as the movement of oil within the sea ice column in greater detail.
Background mass ratios of crude oil (≤ 1000 ng g−1) can have a significant effect on sea ice albedo. The albedo response is dependent on the type of oil, with the strongly absorbing Romashkino oil (relative to Petrobaltic oil) having the largest effect owing to its large mass absorption coefficient. The albedo response is also dependent on the type of sea ice, with a 1000 ng g−1 mass ratio of Romashkino oil resulting in quasi-infinite-thickness (15 m thick) multi-year sea ice decreasing to 70.9 %, first-year sea ice decreasing to 47.2 %, and melting sea ice decreasing to 22.1 % relative to the unpolluted albedo at a wavelength of 400 nm. Sea ice thickness also plays an important role on the albedo response with realistic-thickness multi-year sea ice decreasing to 75.3 %, first-year sea ice decreasing to 66.3 %, and melting sea ice decreasing to 35.9 % of the unpolluted value. The size of the oil droplets has a weak effect on the albedo response, with weathered submicrometre Romashkino oil droplets (0.05–0.5 µm) being the most absorbing in the visible spectrum (400–700 nm). This work demonstrates that the type of oil, type of ice, thickness of ice, and droplet size are important components in the response of sea ice albedo to background mass ratios of crude oil pollution. The type of oil is the most important factor in how responsive sea ice is to increasing mass ratios of oil and is more important than the type of sea ice being polluted. By collecting these data in the event of a future spill, it may be possible to model what the effect of background oil pollution may be.
All data have been published using Zenodo and can be accessed at https://doi.org/10.5281/zenodo.6583629 (Redmond Roche and King, 2022).
BHRR performed the radiative transfer calculations, completed the data analysis, prepared the results and figures, and wrote the paper. MDK conceived the study, oversaw the study, and proofread the paper.
The contact author has declared that neither of the authors has any competing interests.
Publisher's note: Copernicus Publications remains neutral with regard to jurisdictional claims in published maps and institutional affiliations.
This paper contains work conducted during a PhD study undertaken as part of the Centre for Doctoral Training (CDT) in Geoscience and the Low Carbon Energy Transition. It is sponsored by Royal Holloway, University of London, via their GeoNetZero CDT Studentship, whose support is gratefully acknowledged.
Martin D. King was supported by NERC (grant no. NE/T00732X/).
This paper was edited by Yevgeny Aksenov and reviewed by two anonymous referees.
Aoki, T., Hachikubo, A., and Hori, M.: Effects of snow physical parameters on shortwave broadband albedos, J. Geophys. Res., 108, 4916, https://doi.org/10.1029/2003JD003506, 2003.
Bandara, U. C. and Yapa, P. D.: Bubble Sizes, Breakup, and Coalescence in Deepwater Gas/Oil Plumes, J. Hydraul. Eng., 137, 729–738, https://doi.org/10.1061/(ASCE)HY.1943-7900.0000380, 2011.
Berenshtein, I., Paris, C. B., Perlin, N., Alloy, M. M., Joye, S. B., and Murawski, S.: Invisible oil beyond the Deepwater Horizon satellite footprint, Sci. Adv., 6, eaaw8863, https://doi.org/10.1126/sciadv.aaw8863, 2020.
Bird, K. J., Charpentier, R. R., Gautier, D. L., Houseknecht, D. W., Klett, T. R., Pitmna, J. K., Moore, T. E., Schenk, C. J., Tennyson, M. E., and Wandrey, C. J.: Circum-Arctic resource appraisal; estimates of undiscovered oil and gas north of the Arctic Circle, U. S. Geol. Surv., 2008–3049, https://doi.org/10.3133/fs20083049, 2008.
Bohren, C. F. and Huffman, D. R. (Eds.): Absorption and Scattering of Light by Small Particles, John Wiley & Sons, Weinheim, Germany, https://doi.org/10.1002/9783527618156, 1983.
Bond, T. C., Doherty, S. J., Fahey, D. W., Forster, P. M., Berntsen, T., DeAngelo, B. J., Flanner, M. G., Ghan, S., Kaercher, B., Koch, D., Kinne, S., Kondo, Y., Quinn, P. K., Sarofim, M. C., Schultz, M. G., Schulz, M., Venkataraman, C., Zhang, H., Zhang, S., Bellouin, N., Guttikunda, S. K., Hopke, P. K., Jacobson, M. Z., Kaiser, J. W., Klimont, Z., Lohmann, U., Schwarz, J. P., Shindell, D., Storelvmo, T., Warren, S. G., and Zender, C. S.: Bounding the role of black carbon in the climate system: a scientific assessment, J. Geophys. Res.-Atmos., 118, 5380–5552, https://doi.org/10.1002/jgrd.50171, 2013.
Bourke, R. H. and Garrett, R. P.: Sea ice thickness distribution in the Arctic Ocean, Cold Reg. Sci. Technol., 13, 259–280, https://doi.org/10.1016/0165-232X(87)90007-3, 1987.
Brandvik, P. J. and Faksness, L.-G.: Weathering processes in Arctic oil spills: Meso-scale experiments with different ice conditions, Cold Reg. Sci. Technol., 55, 160–166, https://doi.org/10.1016/j.coldregions.2008.06.006, 2009.
Brandvik, P. J., Daling, P. S., and Myrhaug, L. J.: Mapping weathering properties as a function of ice conditions: a combined approach using a flume basin verified by large-scale field experiments, in: Proceedings of the 33rd Arctic and Marine Oilspill Program (AMOP) Technical Seminar on Environmental Contamination and Response, Environment Canada, Ottawa, Ontario, Canada, 7–9 June 2010, 701–723, 2010.
Brandvik, P. J., Johansen, Ø., Leirvik, F., Farooq, U., and Daling, P. S.: Droplet breakup in subsurface oil releases – Part 1: Experimental study of droplet breakup and effectiveness of dispersant injection, Mar. Pollut. Bull., 73, 319–326, https://doi.org/10.1016/j.marpolbul.2013.05.020, 2013.
Brandvik, P. J., Johansen, Ø., Farooq, U., Glen, A., and Leirvik, F.: Subsurface oil releases – Experimental study of droplet distributions and different dispersant injection techniques – Version 2, SINTEF Technical Report, SINTEF report no: A26866 (Unrestricted), Trondheim, Norway, A26122, 99 pp., 2014.
Brandvik, P. J., Davies. E., Leirvik, F., Johansen, Ø., and Belore, R.: Large-scale basin testing to simulate realistic oil droplet distributions from subsea release of oil and the effect of subsea dispersant injection, Mar. Pollut. Bull., 163, 111934, https://doi.org/10.1016/j.marpolbul.2020.111934, 2021.
Buckley, R. G. and Trodahl, H. J.: Thermally driven changes in the optical properties of sea ice, Cold Reg. Sci. Technol., 14, 201–204, 1987.
Buist, I. A. and Dickins, D. F.: Fate and Behavior of Water-in-Oil Emulsions in Ice, Prepared by Dome Petroleum Ltd. For the Canadian Offshore Oil Spill Research Association (COOSRA), Calgary, Report No. CS 11, Dome Petroleum Limited, Frontier Division, Oil Spill Research Group, Calgary, Canada, 1983.
Buist, I. A., Potter, S. G., and Dickins, D. F.: Fate and Behavior of Water-in-Oil-Emulsions in Ice, in: Proceedings of the Sixth Arctic Marine Oil Spill Program Technical Seminar, Environment Canada, Ottawa, Ontario, Canada, March 1983, 1983.
Chao, J., Liu, C., Li, Y., Lin, X., and Yan, Y.: Characteristics of the sea ice reflectance spectrum polluted by oil spills based on field experiments in the Bohai Sea, Acta Oceanol. Sin., 36, 73–79, https://doi.org/10.1007/s13131-017-0995-1, 2017.
Chen, E. C.: Arctic Winter Oil Spill Test, Technical Bulletin No. 68, Environment Canada, Ottawa, ON, 20 pp., 1972.
Clarke, A. D. and Noone, K. J.: Soot in the Arctic snowpack: A cause for perturbations in radiative transfer, Atmos. Environ., 19, 2045–2053, https://doi.org/10.1016/0004-6981(85)90113-1, 1985.
Comfort, G. and W. Purves.: The Behaviour of Crude Oil Spilled Under Multi-Year Ice, EPS 4-EC-82-4, Environment Canada, Ottawa, ON, 76 pp., 1982.
Comiso, J. C.: Large Decadal Decline of the Arctic Multiyear Ice Cover, J. Climate, 25, 1176–1193, https://doi.org/10.1175/JCLI-D-11-00113.1, 2012.
Czarny, R. S.: The Arctic: Numerous Interests and Multiple Players, Toruńskie Studia Międzynarodowe, 12, 125–142, 2019.
D'Asaro, E. A.: Turbulence in the upper-ocean mixed layer, Annu. Rev. Mar. Sci., 6, 101–115, https://doi.org/10.1146/annurev-marine-010213-135138, 2014.
Daling, P. S., Brandvik, P. J., Mackay, D., and Johansen, Ø.: Characterization of crude oils for environmental purposes, Oil Chem. Pollut., 7, 199–224, https://doi.org/10.1016/S0269-8579(05)80027-9, 1990.
Daling, P. S., Aamo, O. M., Lewis, A., and Strøm-Kristiansen, T.: Sintef/iku oil-weathering model: predicting oils' properties at sea, in: International Oil Spill Conference Proceedings (1997), Fort Lauderdale, Florida, USA, 2–10 April 1997, 297–307, 1997.
De Carolis, G., Adamo, M., and Pasquariello, G.: On the estimation of thickness of marine oil slicks from sun-glittered, near-infrared MERIS and MODIS Imagery: The Lebanon Oil Spill Case Study, IEEE T. Geosci. Remote, 52, 559–573, https://doi.org/10.1109/TGRS.2013.2242476, 2014.
Delvigne, G. A. L. and Hulsen, L. J. M.: Simplified Laboratory Measurements of Oil Dispersion Coefficient Application in Computations of Natural Oil Dispersion, in: Proceedings of the 17th Arctic Marine Oil Spill Program (AMOP) Technical Seminar, Vancouver, Canada, 8–10 June, 173–187, 1994.
Delvigne, G. A. L. and Sweeney, C. E.: Natural dispersion of oil, Oil Chem. Pollut.,4, 281–310, https://doi.org/10.1016/S0269-8579(88)80003-0, 1988.
Dickins, D.: Arctic Oil Spill Response Technology Joint Industry Programme Synthesis Report, International Association of Oil and Gas Producers, DF Dickins Associates, LLC, London, UK, 2017.
Dickins, D. and Buist, I.: Oil and Gas Under Sea Ice, Prepared by Dome Petroleum Ltd. for the Canadian Offshore Oil Spill Research Association (COOSRA), Report CV-1, Volumes I and II, Dome Petroleum Limited, Frontier Division, Oil Spill Research Group, Calgary, Canada 1981.
Dilliplaine, K., Oggier, M., Collins, R. E., Eicken, H., Gradinger, R., and Bluhm, B. A.: Crude oil exposure reduces ice algal growth in a sea-ice mesocosm experiment, Polar Biol., 44, 525–537, https://doi.org/10.1007/s00300-021-02818-3, 2021.
Dissanayake, A. L., Gros, J., and Socolofsky, S. A.: Integral models for bubble, droplet, and multiphase plume dynamics in stratification and crossflow, Environ. Fluid Mech., 18, 1167–1202, https://doi.org/10.1007/s10652-018-9591-y, 2018.
Doherty, S. J., Warren, S. G., Grenfell, T. C., Clarke, A. D., and Brandt, R. E.: Light-absorbing impurities in Arctic snow, Atmos. Chem. Phys., 10, 11647–11680, https://doi.org/10.5194/acp-10-11647-2010, 2010.
Drozdowski, D., Nudds, S., Hannah, C. G., Niu, H., Peterson, I., and Perrie, W.: Review of oil spill trajectory modelling in the presence of ice, Canadian Technical Report of Hydrographic and Ocean Sciences, Fisheries and Ocean, Canada, Bedford Institute of Oceanography, Dartmouth, Nova Scotia, Canada, 274 pp., 2011.
Dumont, M., Brissaud, O., Picard, G., Schmitt, B., Gallet, J.-C., and Arnaud, Y.: High-accuracy measurements of snow Bidirectional Reflectance Distribution Function at visible and NIR wavelengths – comparison with modelling results, Atmos. Chem. Phys., 10, 2507–2520, https://doi.org/10.5194/acp-10-2507-2010, 2010.
Edson, J., Crawford, T., Crescenti, J., Farrar, T., Frew, N., Gerbi, G., Helmis, C., Hristov, T., Khelif, D., Jessup, A., Jonsson, H., Li, M., Mahrt, L., McGillis, W., Plueddemann, A., Shen, L., Skyllingstad, E., Stanton, T., Sullivan, P., Sun, J., Trowbridge, J., Vickers, D., Wang, S., Wang, Q., Weller, R., Wilkin, J., Williams, III, A. J., Yue, D. K. P., and Zappa, C.: The coupled boundary layers and air-sea transfer experiment in low winds, B. Am. Meteorol. Soc., 88, 341–356, https://doi.org/10.1175/BAMS-88-3-341, 2007.
Eguíluz, V., Fernández-Gracia, J., Irigoien, X., and Duarte, C. M.: A quantitative assessment of Arctic shipping in 2010–2014, Sci. Rep.-UK, 6, 30682, https://doi.org/10.1038/srep30682, 2016.
Fetterer, F., Knowles, K., Meier, W., Savoie, M., and Windnagel, A. K.: Sea Ice Index, Version 3, National Snow and Ice Data Center (NSIDC), Boulder, Colorado USA, https://doi.org/10.7265/N5K072F8, 2017.
Fingas, M. F. and Hollebone, B. P.: Oil behaviour in ice-infested waters, in: International Oil Spill Conference Proceedings 2014, Savannah, Georgia, USA, 5–8 May, 1239–1250, 2014.
Fisher, F., King, M., and Lee-Taylor, J.: Extinction of UV-visible radiation in wet midlatitude (maritime) snow: implications for increased NOx emission, J. Geophys. Res., 110, D21301, https://doi.org/10.1029/2005JD005963, 2005.
Flanner, M. G., Zender, C. S., Randerson, J. T., and Rasch, P. J.: Present-day climate forcing and response from black carbon in snow, J. Geophys. Res.-Atmos., 112, D11202, https://doi.org/10.1029/2006JD008003, 2007.
Fraga, B., Stoesser, T., Lai, C. C. K., and Socolofsky, S. A.: A LES-based Eulerian–Lagrangian approach to predict the dynamics of bubble plumes, Ocean Model., 97, 27–36, https://doi.org/10.1016/j.ocemod.2015.11.005, 2016.
France, J. L.: Chemical oxidation in snowpacks, PhD thesis, Royal Holloway, University of London, 2008.
France, J. L., King, M. D., Frey, M. M., Erbland, J., Picard, G., Preunkert, S., MacArthur, A., and Savarino, J.: Snow optical properties at Dome C (Concordia), Antarctica; implications for snow emissions and snow chemistry of reactive nitrogen, Atmos. Chem. Phys., 11, 9787–9801, https://doi.org/10.5194/acp-11-9787-2011, 2011.
Gamzaev, K. M.: Modeling the spread of an oil slick on the sea surface, J. Appl. Mech. Tech. Phy., 50, 466–469, https://doi.org/10.1007/s10808-009-0062-6, 2009.
Gavrilo, V. P. and Tarashkevich, V. N.: Study of oil intrusion influence on physical properties of sea ice, in: Proceedings of the Second International Offshore and Polar Engineering Conference, San Francisco, USA, 14–19 June, 666–669, 1992.
Gerland, S., Winther, J., Ørbæk, J., Liston, G., Øritsland, N., Blanco, A., and Ivanov, B.: Physical and optical properties of snow covering Arctic tundra on Svalbard, Hydrol. Process., 13, 2331–2343, https://doi.org/10.1002/(SICI)1099-1085(199910)13:14/15<2331::AID-HYP855>3.0.CO;2-W, 1999.
Glaeser, J. L. and Vance, G.: A study of the behaviour of oil spills in the arctic, Report Number 714/08/A/001,002, United States Coast Guard, Washington, DC, USA, 53 pp., 1971.
Gonçalves, R. C., Iskandarani, M., Srinivasan, A., Thacker, W. C., Chassignet, E., and Knio, O. M.: A framework to quantify uncertainty in simulations of oil transport in the ocean, J. Geophys. Res. Oceans, 121, 2058–2077, https://doi.org/10.1002/2015JC011311, 2016.
Grenfell, T. C.: A radiative transfer model for sea ice with vertical structure variations, J. Geophys. Res. Oceans, 96, 16991–17001, https://doi.org/10.1029/91JC01595, 1991.
Grenfell, T. C. and Maykut, G. A.: The optical properties of ice and snow in the Arctic Basin, J. Glaciol., 18, 445–463, https://doi.org/10.3189/S0022143000021122, 1977.
Grenfell, T. C. and Perovich, D. K.: Spectral albedos of sea ice and incident solar irradiance in the southern Beaufort Sea, J. Geophys. Res. Oceans, 89, 3573–3580, https://doi.org/10.1029/JC089iC03p03573, 1984.
Grenfell, T. C., Light, B., and Sturm. M.: Spatial distribution and radiative effects of soot in the snow and sea ice during the SHEBA experiment, J. Geophys. Res. Oceans, 107, SHE 7-1–SHE 7-7, https://doi.org/10.1029/2000JC000414, 2002.
Gulas, S., Downton, M., D'Souza, K., Hayden, K., and Walker, T. R.: Declining Arctic Ocean oil and gas developments: Opportunities to improve governance and environmental pollution control, Mar. Policy, 75, 53–61, https://doi.org/10.1016/j.marpol.2016.10.014, 2017.
Hancke, K., Lund-Hansen, L. C., Lamare, M. L., Højlund Pedersen, S., King, M. D., Andersen, P., and Sorrell, B. K.: Extreme Low Light Requirement for Algae Growth Underneath Sea Ice: A Case Study From Station Nord, NE Greenland, J. Geophys. Res. Oceans, 123, 985–1000, https://doi.org/10.1002/2017JC013263, 2018.
Hanesiak, J. M., Barber, D. G., De Abreu, R. A., and Yackel, J. J.: Local and regional albedo observations of arctic first-year sea ice during melt ponding, J. Geophys. Res. Oceans, 106, 1005–1016, https://doi.org/10.1029/1999JC000068, 2001.
Haule, K. and Freda, W.: The effect of dispersed Petrobaltic oil droplet size on photosynthetically active radiation in marine environment, Environ. Sci. Pollut. Res., 23, 6506–6516, https://doi.org/10.1007/s11356-015-5886-4, 2016.
Haule, K., Darecki, M., and Toczek, H.: Light penetration in seawater polluted by dispersed oil: results of radiative transfer modelling, J. Eur. Opt. Soc.-Rapid, 10, 15052, https://doi.org/10.2971/jeos.2015.15052, 2015.
Hesketh, R. P., Etchells, A. W., and Russell, T. W. F.: Experimental observations of bubble breakage in turbulent flow, Ind. Eng. Chem. Res., 30, 835–841, https://doi.org/10.1021/ie00053a005, 1991.
Ho, J.: The implications of Arctic sea ice decline on shipping, Mar. Policy, 34, 713–715, https://doi.org/10.1016/j.marpol.2009.10.009, 2010.
Hollebone, B.: The oil properties data appendix, in: Handbook of oil spill science and technology, edited by: Fingas, M., John Wiley and Sons, New York, 577–681, https://doi.org/10.1002/9781118989982.app1, 2015.
IMO: MARPOL Annex I – Prevention of Pollution by Oil, http://www.imo.org/OurWork/Environment/PollutionPrevention/OilPollution/Pages/Default.aspx (last access: 29 April 2021), International Maritime Organization, 1983.
Ivanov, B., Bezgreshnov, A., Kubyshkin, N., and Kursheva, A.: Spreading of oil products in sea ice and their influence on the radiation properties of the snow-ice cover, in: Proceedings of the International Conference on Port and Ocean Engineering under Arctic Conditions, POAC, Potsdam, New York, USA, 26–30 June 2005, 853–862, 2005.
Jacobson, M. Z.: Climate response of fossil fuel and biofuel soot, accounting for soot's feedback to snow and sea ice albedo and emissivity, J. Geophys. Res.-Atmos., 109, D21201, https://doi.org/10.1029/2004JD004945, 2004.
Jiao, C., Flanner, M. G., Balkanski, Y., Bauer, S. E., Bellouin, N., Berntsen, T. K., Bian, H., Carslaw, K. S., Chin, M., De Luca, N., Diehl, T., Ghan, S. J., Iversen, T., Kirkevåg, A., Koch, D., Liu, X., Mann, G. W., Penner, J. E., Pitari, G., Schulz, M., Seland, Ø., Skeie, R. B., Steenrod, S. D., Stier, P., Takemura, T., Tsigaridis, K., van Noije, T., Yun, Y., and Zhang, K.: An AeroCom assessment of black carbon in Arctic snow and sea ice, Atmos. Chem. Phys., 14, 2399–2417, https://doi.org/10.5194/acp-14-2399-2014, 2014.
Johansen, Ø.: Development and verification of deep-water blowout models, Mar. Pollut. Bull., 47, 360–368, https://doi.org/10.1016/S0025-326X(03)00202-9, 2003.
Johansen, Ø., Rye, H., and Cooper, C.: Deep spill – field study of a simulated oil and gas blow-out in deep water, Spill Sci. Technol. B., 8, 433–443, https://doi.org/10.1016/S1353-2561(02)00123-8, 2003.
Johansen, Ø., Brandvik, P. J., and Farooq, U.: Droplet breakup in subsea oil releases – Part 2: Predictions of droplet size distributions with and without injection of chemical dispersants, Mar. Pollut. Bull., 73, 327–335, https://doi.org/10.1016/j.marpolbul.2013.04.012, 2013.
Johansen, Ø., Reed, M., and Bodsberg, N. R.: Natural dispersion revisited, Mar. Pollut. Bull., 93, 20–26, https://doi.org/10.1016/j.marpolbul.2015.02.026, 2015.
Kikkas, K. and Romashkina, E.: Potential Opportunities for the Arctic Transport Space, IOP C. Ser. Earth Env., 180, 012016, https://doi.org/10.1088/1755-1315/180/1/012016, 2018.
King, M., France, J., Fisher, F., and Beine, H.: Measurement and modelling of UV radiation penetration and photolysis rates of nitrate and hydrogen peroxide in Antarctic sea ice: an estimate of the production rate of hydroxyl radicals in first-year sea ice, J. Photoch. Photobio. A, 176, 39–49, https://doi.org/10.1016/j.jphotochem.2005.08.032, 2005.
Koivurova, T. and Vanderzwaag, D. L.: The arctic council at 10 years: retrospect and prospects, University of British Columbia Law Review, 40. 121–194, https://ssrn.com/abstract=1860308 (last access: 20 March 2021), 2007.
Krivorotov, A. and Finger, M.: State-Owned Enterprises in the Arctic, in: The GlobalArctic Handbook, edited by: Finger, M. and Heininen, L., Springer, Cham, Denmark, 45–62, https://doi.org/10.1007/978-3-319-91995-9_4, 2019.
Lamare, M. L., Lee-Taylor, J., and King, M. D.: The impact of atmospheric mineral aerosol deposition on the albedo of snow & sea ice: are snow and sea ice optical properties more important than mineral aerosol optical properties?, Atmos. Chem. Phys., 16, 843–860, https://doi.org/10.5194/acp-16-843-2016, 2016.
Law, A. T. and Mahmood, Z. B.: Distribution of petroleum hydrocarbon in the south-western portion of the South China Sea, Ekspedisi Matahari '86, Serdang, Faculty of Fisheries and Marine Science, Universiti Putra, Malaysia, 1986.
Laxon, S., Peacock, N., and Smith, D.: High interannual variability of sea ice thickness in the Arctic region, Nature, 425, 947–950, https://doi.org/10.1038/nature02050, 2003.
Lee-Taylor, J. and Madronich, S.: Calculation of actinic fluxes with a coupled atmosphere–snow radiative transfer model, J. Geophys. Res.-Atmos., 107, ACH 22-1–ACH22-10, https://doi.org/10.1029/2002JD002084, 2002.
Li, C., Miller, J., Wang, J., Koley, S. S., and Katz, J.: Size Distribution and Dispersion of Droplets Generated by Impingement of Breaking Waves on Oil Slicks, J. Geophys. Res. Oceans, 122, 7938–7957, https://doi.org/10.1002/2017JC013193, 2017.
Li, Z., Lee, K., King, T., Boufadel, M. C., and Venosa, A. D.: Oil droplet size distribution as a function of energy dissipation rate in an experimental wave tank, in: Proceedings of the International Oil Spill Conference 2008, Savannah, Georgia, USA, 4–8 March 2008, 621–626, 2008a.
Li, Z., Lee, K., King, T., Boufadel, M. C., and Venosa, A. D.: Assessment of chemical dispersant effectiveness in a wave tank under regular non-breaking and breaking wave conditions, Mar. Pollut. Bull., 56, 903–912, https://doi.org/10.1016/j.marpolbul.2008.01.031, 2008b.
Li, Z., Lee, K., King, T., Niu, H., Boufadel, M. C., and Venosa, A. D.: Application of entropy analysis of in situ droplet-size spectra in evaluation of oil chemical dispersion efficacy, Mar. Pollut. Bull., 62, 2129–2136, https://doi.org/10.1016/j.marpolbul.2011.07.012, 2011.
Li, Z., Spaulding, M. L., French-McCay, D., Crowley, D., and Payne, J. R.: Development of a unified oil droplet size distribution model with application to surface breaking waves and subsea blowout releases considering dispersant effects, Mar. Pollut. Bull., 114, 247–257, https://doi.org/10.1016/j.marpolbul.2016.09.008, 2017a.
Li, Z., Spaulding, M. L., and French-McCay, D.: An algorithm for modeling entrainment and naturally and chemically dispersed oil droplet size distribution under surface breaking wave conditions, Mar. Pollut. Bull., 119, 145–152, https://doi.org/10.1016/j.marpolbul.2017.03.048, 2017b.
Lieb-Lappen, R. M., Golden, E. J., and Obbard, R. W.: Metrics for interpreting the microstructure of sea ice using X-ray micro-computed tomography, Cold Reg. Sci. Technol., 138, 24–35, https://doi.org/10.1016/j.coldregions.2017.03.001, 2017.
Light, B., Eicken, H., Maykut, G. A., and Grenfell, T. C.: The effect of included participates on the spectral albedo of sea ice, J. Geophys. Res. Oceans, 103, 27739–27752, https://doi.org/10.1029/98JC02587, 1998.
Light, B., Grenfell, T. C., and Perovich, D. K.: Transmission and absorption of solar radiation by Arctic sea ice during the melt season, J. Geophys. Res. Oceans, 113, C03023, https://doi.org/10.1029/2006jc003977, 2008.
Lima Neto, I. E., Zhu, D. Z., and Rajaratnam, N.: Bubbly jets in stagnant water, Int. J. Multiphas. Flow, 34, 1130–1141, https://doi.org/10.1016/j.ijmultiphaseflow.2008.06.005, 2008.
Liu, B., Li, Y., Zhang, Q., and Han, L.: Assessing sensitivity of hyperspectral sensor to detect oil with sea ice, J. Spectrosc., 2016, 6584314, https://doi.org/10.1155/2016/6584314, 2016.
Liu, B., Li, Y., Liu, C., Xie, F., and Muller, J.-P.: Hyperspectral Features of Oil-Polluted Sea Ice and the Response to the Contamination Area Fraction, Sensors, 18, 234, https://doi.org/10.3390/s18010234, 2018.
Lunel, T.: Dispersion: Oil droplet size measurements at sea, in: Proceedings of the Sixteenth Arctic and Marine Oil Spill Program Technical Seminar, Environment Canada, Calgary, Canada, 7–9 June 1993, 1023–1055, 1993.
Madronich, S. and Flocke, S.: The role of solar radiation in atmospheric chemistry, in: Handbook of Environmental Chemistry, edited by: Boule, P., Springer-Verlag, New York, USA, 1–26, https://doi.org/10.1007/978-3-540-69044-3_1, 1998.
Marks, A. A. and King, M. D.: The effects of additional black carbon on the albedo of Arctic sea ice: variation with sea ice type and snow cover, The Cryosphere, 7, 1193–1204, https://doi.org/10.5194/tc-7-1193-2013, 2013.
Marks, A. A. and King, M. D.: The effect of snow/sea ice type on the response of albedo and light penetration depth (e-folding depth) to increasing black carbon, The Cryosphere, 8, 1625–1638, https://doi.org/10.5194/tc-8-1625-2014, 2014.
Marks, A. A., Lamare, M. L., and King, M. D.: Optical properties of sea ice doped with black carbon – an experimental and radiative-transfer modelling comparison, The Cryosphere, 11, 2867–2881, https://doi.org/10.5194/tc-11-2867-2017, 2017.
Martin, S.: A field study of brine drainage and oil entrainment in first-year sea ice, J. Glaciol., 22, 473–502, https://doi.org/10.3189/S0022143000014477, 1979.
Masutani, M. S. and Adams, E. E.: Experimental study of multiphase plumes with application to deep ocean oil spills, University of Hawaii Final Report submitted to the US Department of the Interior Minerals Management Service, Contract No. 1435-01-98-CT-30964, US Department of the Interior, Herndon, Virginia, USA 88 pp., 2000.
Nissanka, I. D. and Yapa, P. D.: Calculation of oil droplet size distribution in an underwater oil well blowout, J. Hydraul. Res., 54, 307–320, https://doi.org/10.1080/00221686.2016.1144656, 2016.
Nissanka, I. D. and Yapa, P. D.: Oil slicks on water surface: Breakup, coalescence, and droplet formation under breaking waves, Mar. Pollut. Bull., 114, 480–493, https://doi.org/10.1016/j.marpolbul.2016.10.006, 2017.
Nissanka, I. D. and Yapa, P. D.: Calculation of oil droplet size distribution in ocean oil spills: A review, Mar. Pollut. Bull., 135, 723–734, https://doi.org/10.1016/j.marpolbul.2018.07.048, 2018.
NORCOR Engineering and Research Ltd.: The Interaction of Crude Oil with Arctic Sea Ice, Beaufort Sea Technical Report, No. 27, Beaufort Sea Project, Department of the Environment, Victoria, BC, Canada, 201 pp., 1975.
North, E. W., Adams, E. E., Thessen, A. E., Schlag, Z., He, R., Socolofsky, S. A., Masutani, S. M., and Peckham, S. D.: The influence of droplet size and biodegradation on the transport of subsurface oil droplets during the Deepwater Horizon spill: a model sensitivity study, Environ. Res. Lett., 10, 024016, https://doi.org/10.1088/1748-9326/10/2/024016, 2015.
Notz, D. and Stroeve, J.: The trajectory towards a seasonally ice-free Arctic Ocean, Curr. Clim. Change. Rep., 4, 407–416, https://doi.org/10.1007/s40641-018-0113-2, 2018.
Otremba, Z.: The impact on the reflectance in VIS of a type of crude oil film floating on the water surface, Opt. Express, 7, 123–134, https://doi.org/10.1364/OE.7.000129, 2000.
Otremba, Z.: Influence of oil dispersed in seawater on the bi-directional reflectance distribution function (BRDF), Opt. Appl., 35, 99–109, 2005.
Otremba, Z.: Oil droplets as light absorbents in seawater, J. Opt. Soc. Am., 15, 8592–8597, https://doi.org/10.1364/OE.15.008592, 2007.
Owens, E. H., Dickins, D. F., and Sergy, G. A.: The behavior and documentation of oil spilled on snow- and ice-covered shorelines, in: Proceedings of the International Conference on Oil Spills, Miami Beach, Florida, USA, 15–19 May 2005, 513–519, 2005.
Özgökmen, T. M., Poje, A. C., Fischer, P. F., Childs, H., Krishnan, H., Garth, C., Haza, A. C., and Ryan, E.: On multi-scale dispersion under the influence of surface mixed layer instabilities and deep flows, Ocean Model., 56, 16–30, https://doi.org/10.1016/j.ocemod.2012.07.004, 2012.
Papadimitrakis, J., Psaltaki, M., Christolis, M., and Markatos, N.: Three-dimensional oil spill modelling for coastal waters, J. Marine Env. Eng., 7, 249–260, 2005.
Papadimitrakis, I., Psaltaki, M., and Markatos, K.: 3-D oil spill modelling. Natural dispersion and the spreading of oil-water emulsions in the water column, Global Nest J., 13, 325–338, https://doi.org/10.30955/gnj.000726, 2011.
Payne, R.: Albedo of the sea surface, J. Atmos. Sci., 29, 959–970, https://doi.org/10.1175/1520-0469(1972)029<0959:AOTSS>2.0.CO;2, 1972.
Perovich, D.: Theoretical estimates of light reflection and transmission by spatially complex and temporally varying sea ice covers, J. Geophys. Res. Oceans, 95, 9557–9567, https://doi.org/10.1029/JC095iC06p09557, 1990.
Perovich, D., Meier, W., Tschudi, M., Hendricks, S., Petty, A. A., Divine, D., Farrell, S., Gerland, S., Haas, C., Kaleschke, L., Pavlova, O., Ricker, R., Tian-Kunze, X., Webster, M., and Wood, K.: Arctic Report Card 2020: Sea Ice, National Ocean and Atmospheric Administration, https://doi.org/10.25923/n170-9h57, 2020.
Perovich, D. K.: The Optical Properties of Sea Ice, US Army Corps of Engineers: Cold Regions Research and Engineering Laboratory, US Army Cold Regions Research and Engineering Laboratory, Virginia, USA, 96, 1996.
Perovich, D. K.: Complex yet translucent: the optical properties of sea ice, Physica B, 338, 107–114, https://doi.org/10.1016/S0921-4526(03)00470-8, 2003.
Perovich, D. K., Maykut, G. A., and Grenfell, T. C.: Optical properties of ice and snow in the Polar Oceans. I: Observations, 1986 Technical Symposium Southeast, 7 August 1986, Orlando, USA, 0637, 232–241, 1986.
Perovich, D. K., Roesler, C. S., and Pegau, W. S.: Variability in Arctic sea ice optical properties, J. Geophys. Res. Oceans, 103, 1193–1208, https://doi.org/10.1029/97JC01614, 1998.
Petty, G.: A first course in atmospheric radiation, 2nd edn., Sundog Publishing, Madison, Wisconsin, USA, ISBN 0972903313, 2006.
Picard, G., Libois, Q., and Arnaud, L.: Refinement of the ice absorption spectrum in the visible using radiance profile measurements in Antarctic snow, The Cryosphere, 10, 2655–2672, https://doi.org/10.5194/tc-10-2655-2016, 2016.
Praks, J., Eskelinen, M., Pulliainen, J., Pyhalahti, T., and Hallikainen, M.: Detection of oil pollution on sea ice with airborne and spaceborne spectrometer, 2004 IEEE International Geoscience and Remote Sensing Symposium, 20–24 September 2004, Anchorage, Alaska, USA, 276, https://doi.org/10.1109/IGARSS.2004.1369014, 2004.
Quan, X. and Fry, E.: Empirical equation for the index of refraction of seawater, Appl. Optics, 34, 3477–3480, 1995.
Redmond Roche, B. H. and King, M.: Quantifying the effects of background concentrations of crude oil pollution on sea ice albedo, Zenodo [data set], https://doi.org/10.5281/zenodo.6583629, 2022.
Reay, H. J., France, J. L., and King, M. D.: Decreased albedo, efolding depth and photolytic OH radical and NO2 production with increasing black carbon content in Arctic snow, J. Geophys. Res.-Atmos., 117, D00R20, https://doi.org/10.1029/2011JD016630, 2012.
Reed, M. and Rye, H.: A three-dimensional oil and chemical spill model for environmental impact assessment, in: Proceedings of the 1995 International Oil Spill Conference, Long Beach, California, USA, February–March 1995, 61–66, https://doi.org/10.7901/2169-3358-1995-1-61, 1995.
Reed, M., Johansen, Ø., and Leirvik, F.: Natural dispersion of heavy oil products and weathered crude oils, Interspill Conference 2009, Marseille, France, 12–14 May 2009, http://refhub.elsevier.com/S0025-326X(16)30823-2/rf0270 (last access: 29 April 2021), 2009a.
Reed, M., Johansen, Ø., Leirvik, F., and Brørs, B.: Numerical algorithm to compute the effects of breaking waves on surface oil spilled at Sea, Final Report Submitted to the Coastal Response Research Center, Report F, SINTEF Institute for Materials and Chemistry, Trondheim, Norway, 131 pp., 2009b.
Resby, J. L. M. and Wang, U. M.: Update of weathering properties of Oseberg Blend, SINTEF Technical Report STF80 F04015, SINTEF, Trondheim, Norway, 7 pp., 2004.
Ryerson, T. B., Camilli, R., Kessler, J. D., Kujawinski, E. B., Reddy, C. M., Valentine, D. L., Atlas, E., Blake, D. R., de Gouw, J., Meinardi, S., Parrish, D. D., Peischl, J., Seewald, J. S., and Warneke, C.: Chemical data quantify Deepwater Horizon hydrocarbon flow rate and environmental distribution, P. Natl. Acad. Sci. USA, 109, 20246–20253, https://doi.org/10.1073/pnas.1110564109, 2012.
Seinfeld, J. H. and Pandis, S. N.: Atmospheric chemistry and physics: from air pollution to climate change, 2nd edn., John Wiley & Sons, New York, USA, ISBN 1118947401, 2006.
Simpson, W., King, M., Beine, H., Honrath, R., and Zhou, X.: Radiation-transfer modeling of snow-pack photochemical processes during ALERT 2000, Atmos. Environ., 36, 2663–2670, https://doi.org/10.1016/S1352-2310(02)00124-3, 2002.
Singsaas, I., Leirvik, F., Daling, P. S., Guénette, C., and Sørheim, K. R.: Fate and behaviour of weathered oil drifting into sea ice, using a novel wave and current flume, Mar. Pollut. Bull., 159, 111485, https://doi.org/10.1016/j.marpolbul.2020.111485, 2020.
Socolofsky, S. A., Bhaumik, T., and Seol, D.-G.: Double-plume integral models for near-field mixing in multiphase plumes, J. Hydraul. Eng., 134, 772–783, https://doi.org/10.1061/(ASCE)0733-9429(2008)134:6(772), 2008.
Sørstrøm, S. E., Brandvik, P. J., Buist, I., Daling, P. S., Dickins, D., Faksness, L. G., Potter, S., Fritt-Rasmussen, J., and Singsaas, I.: Joint industry program on oil spill contingency for Arctic and ice-covered waters: Summary Report, SINTEF, Trondheim, Norway, A14181, 40 pp., 2010.
Spaulding, M. L., Howlett, E., Anderson, E., and Jayko, K.: OILMAP: A Global Approach to Spill Modeling, in: Proceedings of the Fifteenth Arctic Marine Oil Spill Program Technical Seminar, Environment Canada, Edmonton, Canada, 9–11 June 1992, 15–21, 1992.
Stamnes, K., Tsay, S.-C., Wiscombe, W., and Jayaweera, K.: Numerically stable algorithm for discrete-ordinate-method radiative transfer in multiple scattering and emitting layered media, Appl. Optics, 27, 2502–2509, https://doi.org/10.1364/AO.27.002502, 1988.
Sullivan, P. P., and McWilliams, J. C.: Dynamics of winds and currents coupled to surface waves, Annu. Rev. Fluid Mech. 42, 19–42, https://doi.org/10.1146/annurev-fluid-121108-145541, 2010.
Tang, L., Masutani, and S. M.: Laminar to turbulent flow liquid-liquid jet instability and breakup, in: Proceedings of the Thirteenth International Offshore and Polar Engineering Conference, Honolulu, Hawaii, USA, 25–30 May, 317–324, 2003.
Thoman, R. L., Richter-Menge, J., and Druckenmiller, M. L.: Arctic Report Card 2020, National Ocean and Atmospheric Administration, 1–141, https://doi.org/10.25923/mn5pt549, 2020.
Timco, G. W. and Frederking, R. M. W.: A review of sea ice density, Cold Reg. Sci. Technol., 24, 1–6, https://doi.org/10.1016/0165-232X(95)00007-X, 1996.
Tkalich, P. and Chan, E. S.: Vertical mixing of oil droplets by breaking waves, Mar. Pollut. Bull., 44, 1219–1229, https://doi.org/10.1016/S0025-326X(02)00178-9, 2002.
Tschudi, M., Meier, W. N., and Stewart, J. S.: Quicklook Arctic Weekly EASE-Grid Sea Ice Age, Version 1, NASA National Snow and Ice Data Center Distributed Active Archive Center, Boulder, CA, USA, https://doi.org/10.5067/2XXGZY3DUGNQ, 2019.
Uttieri, M., Nihongi, A., Hinow, P., Motschman, J., Jiang, H., Alcaraz, M., and Strickler, J. R.: Copepod manipulation of oil droplet size distribution, Sci. Rep.-UK, 9, 1–8, https://doi.org/10.1038/s41598-018-37020-9, 2019.
Venkatesh, S., El-Tahan, H., Comfort, G., and Abdelnour, R.: Modelling the behaviour of oil spills in ice-infested waters, Atmos. Ocean, 28, 303–329, https://doi.org/10.1080/07055900.1990.9649380, 1990.
Wang, B., Socolofsky, S. A., Lai, C. C. K., Adams, E. E., and Boufadel, M. C.: Behaviour and dynamics of bubble breakup in gas pipeline leaks and accidental subsea oil well blowouts, Mar. Pollut. Bull., 131, 72–86, https://doi.org/10.1016/j.marpolbul.2018.03.053, 2018.
Wang, S. D., Shen, Y. M., and Zheng, Y. H.: Two-dimensional numerical simulation for transport and fate of oil spill in seas, Ocean Eng., 32, 1556–1571, https://doi.org/10.1016/j.oceaneng.2004.12.010, 2005.
Warren, S. and Brandt, R.: Optical constants of ice from the ultraviolet to the microwave: a revised compilation, J. Geophys. Res., 113, 1206–1225, https://doi.org/10.1029/2007JD009744, 2008.
Warren, S. G.: Impurities in snow: effects on albedo and snow melt (Review), Ann. Glaciol., 5, 177–179, https://doi.org/10.3189/1984AoG5-1-177-179, 1984.
Warren, S. G.: Optical properties of ice and snow, Philos. T. R. Soc. A, 377, 20180161, https://doi.org/10.1098/rsta.2018.0161, 2019.
Warren, S. G. and Wiscombe, W. J.: A model for the spectral albedo of snow. II: snow containing atmospheric aerosols, J. Atmos. Sci., 37, 2734–2745, https://doi.org/10.1175/1520-0469(1980)037<2734:AMFTSA>2.0.CO;2, 1980.
Warren, S. G. and Clarke, A. D.: Soot in the atmosphere and snow surface of Antarctica, J. Geophys. Res.-Atmos., 95, 1811–1816, https://doi.org/10.1029/JD095iD02p01811, 1990.
Warren, S. G., Brandt, R. E., and Grenfell, T. C.: Visible and near-ultraviolet absorption spectrum of ice from transmission of solar radiation into snow, Appl. Optics, 45, 5320, https://doi.org/10.1364/AO.45.005320, 2006.
Weeks, W.: On Sea Ice, University of Alaska Press, Fairbanks, Alaska, USA, ISBN 160223079X, 2010.
Wilkinson, J. P., Boyd, T., Hagen, B., Maksym, T., Pegau, S., Roman, C., Singh, H., and Zabilansky, L.: Detection and quantification of oil under sea ice: The view from below, Cold Reg. Sci. Technol., 109, 9–17, https://doi.org/10.1016/j.coldregions.2014.08.004, 2015.
Wilkinson, J. P., Beegle-Krause, C., Evers, K.-U., Hughes, N., Lewis, A., Reed, M., and Wadhams, P.: Oil spill response capabilities and technologies for ice-covered Arctic marine waters: a review of recent developments and established practices, Ambio, 46, 423–441, https://doi.org/10.1007/s13280-017-0958-y, 2017.
Wongnapapan, P., Wattayakorn, G., and Snidvongs, A.: Petroleum hydrocarbon in seawater and some sediments of the South China Sea, Area I: Gulf of Thailand and East Coast of Peninsular Malaysia, in: Proceedings of the 1st Technical Seminar on Marine Fishery Resources Survey in the South China Sea, Bangkok, Thailand, 24–26 November 1997, 105–110, 1999.
WWF-Canada: Arctic Offshore Drilling Review, NEB File: OF-EP-Gen-AODR 01 Additional Response to CFI #1 and #2: https://awsassets.wwf.ca/downloads/wwf_canada___submission_to_neb_review_april_2011.pdf (last access: 1 March 2021), 2011.
Xiao, S. and Yang, D.: Effect of oil plumes on upper-ocean radiative transfer – A numerical study, Ocean. Model., 145, 101522, https://doi.org/10.1016/j.ocemod.2019.101522, 2020.
Yang, D., Chamecki, M., and Meneveau, C.: Inhibition of oil plume dilution in Langmuir ocean circulation, Geophys. Res. Lett., 41, 1632–1638, https://doi.org/10.1002/2014GL059284, 2014.
Zatko, M. C., Grenfell, T. C., Alexander, B., Doherty, S. J., Thomas, J. L., and Yang, X.: The influence of snow grain size and impurities on the vertical profiles of actinic flux and associated NOx emissions on the Antarctic and Greenland ice sheets, Atmos. Chem. Phys., 13, 3547–3567, https://doi.org/10.5194/acp-13-3547-2013, 2013.
Zdanowicz, C. M., Zielinski, G. A., and Wake, C. P.: Characteristics of modern atmospheric dust deposition in snow on the Penny Ice Cap, Baffin Island, Arctic Canada, Tellus B, 50, 506–520, https://doi.org/10.3402/tellusb.v50i5.16234, 1998.
Zeinstra-Helfrich, M., Koops, W., Dijkstra, K., and Murk, A. J.: Quantification of the effect of oil layer thickness on entrainment of surface oil, Mar. Pollut. Bull., 96, 401–409, https://doi.org/10.1016/j.marpolbul.2015.04.015, 2015a.
Zeinstra-Helfrich, M., Koops, W., and Murk, A. J.: The NET effect of dispersants – a critical review of testing and modelling of surface oil dispersion, Mar. Pollut. Bull., 100, 102–111, https://doi.org/10.1016/j.marpolbul.2015.09.022, 2015b.
Zeinstra-Helfrich, M., Koops, W., and Murk, A. J.: How oil properties and layer thickness determine the entrainment of spilled surface oil, Mar. Pollut. Bull., 110, 184–193, https://doi.org/10.1016/j.marpolbul.2016.06.063, 2016.
Zhao, L., Boufadel, M. C., Socolofsky, S. A., Adams, E., King, T., and Lee, K.: Evolution of droplets in subsea oil and gas blowouts: Development and validation of the numerical model VDROP-J, Mar. Pollut. Bull., 83, 58–69, https://doi.org/10.1016/j.marpolbul.2014.04.020, 2014a.
Zhao, L., Torlapati, J., Boufadel, M. C., King, T., Robinson, B., and Lee, K.: VDROP: A comprehensive model for droplet formation of oils and gases in liquids - Incorporation of the interfacial tension and droplet viscosity, Chem. Eng. J., 253, 93–106, https://doi.org/10.1016/j.cej.2014.04.082, 2014b.
Zhao, L., Shaffer, F., Robinson, B., King, T., D'Ambrose, C., Pan, Z., Gao, F., Miller, R. S., Conmy, R. N., and Boufadel, M. C.: Underwater oil jet: hydrodynamics and droplet size distribution, Chem. Eng. J., 299, 292–303, https://doi.org/10.1016/j.cej.2016.04.061, 2016.
Zhao, L., Boufadel, M. C., King, T., Robinson, B., Gao, F., Socolofsky, S. A., and Lee, K.: Droplet and bubble formation of combined oil and gas releases in subsea blowouts, Mar. Pollut. Bull., 120, 203–216, https://doi.org/10.1016/j.marpolbul.2017.05.010, 2017a.
Zhao, L., Gao, F., Boufadel, M. C., King, T., Robinson, B., Lee, K., and Conmy, R.: Oil jet with dispersant: macro-scale hydrodynamics and tip streaming, AICHE J., 63, 5222–5234, https://doi.org/10.1002/aic.15864, 2017b.
Zheng, L., Yapa, P. D., and Chen, F.: A model for simulating deepwater oil and gas blowouts – part I: theory and model formulation, J. Hydraul. Res., 41, 339–351, https://doi.org/10.1080/00221680309499980, 2003.
Zhou, L., Stroeve, J., Xu, S., Petty, A., Tilling, R., Winstrup, M., Rostosky, P., Lawrence, I. R., Liston, G. E., Ridout, A., Tsamados, M., and Nandan, V.: Inter-comparison of snow depth over Arctic sea ice from reanalysis reconstructions and satellite retrieval, The Cryosphere, 15, 345–367, https://doi.org/10.5194/tc-15-345-2021, 2021.
The requested paper has a corresponding corrigendum published. Please read the corrigendum first before downloading the article.
- Article
(3309 KB) - Full-text XML