the Creative Commons Attribution 4.0 License.
the Creative Commons Attribution 4.0 License.
 | 31 Aug 2022
Grain-size evolution controls the accumulation dependence of modelled firn thickness
Jonathan Kingslake
Robert Skarbek
Elizabeth Case
Christine McCarthy
The net rate of snow accumulation b is predicted to increase over large areas of the Antarctic and Greenland ice sheets as the climate warms. Models disagree on how this will affect the thickness of the firn layer – the relatively low-density upper layer of the ice sheets that influences altimetric observations of ice sheet mass change and palaeo-climate reconstructions from ice cores. Here we examine how b influences firn compaction and porosity in a simplified model that accounts for mass conservation, dry firn compaction, grain-size evolution, and the impact of grain size on firn compaction. Treating b as a boundary condition and employing an Eulerian reference frame helps to untangle the factors controlling the b dependence of firn thickness. We present numerical simulations using the model, as well as simplified steady-state approximations to the full model, to demonstrate how the downward advection of porosity and grain size are both affected by b but have opposing impacts on firn thickness. The net result is that firn thickness increases with b and that the strength of this dependence increases with increasing surface grain size. We also quantify the circumstances under which porosity advection and grain-size advection balance exactly, which counterintuitively renders steady-state firn thickness independent of b. These findings are qualitatively independent of the stress-dependence of firn compaction and whether the thickness of the ice sheet is increasing, decreasing, or steady. They do depend on the grain-size dependence of firn compaction. Firn models usually ignore grain-size evolution, but we highlight the complex effect it can have on firn thickness when included in a simplified model. This work motivates future efforts to better observationally constrain the rheological effect of grain size in firn.
- Article
(1882 KB) - Full-text XML
- BibTeX
- EndNote


Firn is snow that has persisted for at least 1 full year on the surface of a glacier or ice sheet. In the absence of significant surface melting, firn is transformed into glacial ice through dry firn compaction. As it is buried by subsequent snowfall, the vertical load of the overlying material compacts firn until it becomes glacial ice (e.g. Cuffey and Paterson, 2010). Understanding firn compaction is important for dating gases trapped in ice cores (e.g. Schwander and Stauffer, 1984; Parrenin et al., 2012; Buizert et al., 2015), reconstructing past temperatures from ice core records (e.g. Buizert et al., 2021), and estimating present-day ice sheet mass change (e.g. Helsen et al., 2008; Smith et al., 2020).
Particularly important is understanding how the thickness of the firn layer will respond to changes in temperature and the rate of snow accumulation (Herron and Langway, 1980; Helsen et al., 2008; Buizert et al., 2021). Both surface forcings are predicted to increase as the climate warms (Frieler et al., 2015; Kittel et al., 2021), but models of firn compaction disagree on how this will affect firn thickness. Firn thickness can be characterized by the distance from the surface to where firn reaches a density of 830 kg m−3, z830, which is approximately where gas bubbles become isolated from one another (van den Broeke, 2008). A competition between compaction rate and downward advection of low-density surface firn controls z830; faster downward advection increases z830, while faster compaction rates decrease z830. Compaction rate increases with the surface temperature Ts because the micro-processes that facilitate compaction are more efficient at higher temperatures (Herron and Langway, 1980). Despite disagreement regarding the strength of this relationship and the most appropriate way to describe it mathematically (e.g. Zwally and Jun, 2002; Li and Zwally, 2015), there is widespread agreement that higher Ts leads to thinner firn.
Less consensus exists regarding the dependence of z830 on the net rate of snow accumulation on the ice sheet surface b. Higher b speeds up downward advection of low-density surface firn, which thickens the firn layer. However, confusion surrounds the impact of b on compaction rates. For example, Zwally and Jun (2002) stated that the rate of increase in overburden stress on a parcel of firn increases with b, so increasing b accelerates compaction, decreasing z830. However, if firn compaction is viscous, it is the overburden stress, not the rate of increase in overburden stress, that drives compaction. These contrasting perspectives are reflected in the differing formulation of firn compaction models. These models employ constitutive relations describing compactive strain rates (vertical deformation due purely to compaction rather than due to, for example, horizontal ice sheet flow; Horlings et al., 2021) to simulate firn densities given prescribed environmental conditions, including surface temperature, accumulation, and/or surface grain size. Unfortunately for attempts to untangle the impact of b on z830, models fundamentally differ in how they include b. Some (Groot Zwaaftink et al., 2013; Arnaud et al., 2000; Arthern and Wingham, 1998) treat accumulation as a boundary condition as it is in other ice-deformation modelling contexts (Schoof and Hewitt, 2013). Others (Zwally and Jun, 2002; Helsen et al., 2008; Li and Zwally, 2004, 2015; Medley et al., 2020) include b in their constitutive relations. This was first motivated by Herron and Langway (1980). Their Eq. (4a) describes compaction rate as follows:
where ρ is firn density, ρi is ice density, t is time, D is the material derivative, C is a constant that depends on temperature, and α is a constant that Herron and Langway (1980) found to be approximately one in their low-density regime (ρ<550 kg m−3). A limitation of including b in the constitutive relation is that it causes compaction rates to respond instantaneously throughout the firn column to changes in b. This is unrealistic when b varies on timescales similar to or shorter than the time taken for the firn layer to reach a steady state. Some models circumvent this issue by using the mean accumulation over the time since each firn layer was deposited (Li and Zwally, 2015; Stevens et al., 2020).
Starting from a full dynamic model of firn compaction including grain-size advection and growth, Arthern et al. (2010) (in their Appendix B) provided physical justification for Eq. (1) by assuming a steady state and a negligibly small grain size at the surface. The implication is that models that employ a formulation based on Eq. (1) implicitly make assumptions about grain size and its evolution that have not been examined in detail. Moreover, the inclusion of b in many models' constitutive relations, combined with the fact that most take a Lagrangian approach (and so track each firn layer individually, preventing analytical examination of model equations to isolate the role of advection), makes unravelling the influence of b and grain size on z830 using such models challenging.
In this paper we explore the implications of the assumptions described above and elucidate how firn thickness depends on accumulation and grain size in simple firn compaction models. We present and analyse an Eulerian firn compaction model based on Arthern et al. (2010) and Case and Kingslake (2021), along with reduced, steady-state versions of the model (Sect. 2). In Sect. 3 we describe the results of a series of numerical simulations using the full model and the reduced models to explore the interactions between accumulation, advection, grain size, and compaction. We discuss our results in Sect. 4 and summarize conclusions and our outlook for future work in Sect. 5.
In this section we describe the model equations and boundary conditions, nondimensionalization of the model, and the numerical methods used to solve the equations. We then describe a reduced, steady-state ordinary differential equation (ODE) model that will help us examine the accumulation dependence of steady-state firn thickness.
2.1 Model equations and boundary conditions
We consider a one-dimensional, isothermal column of firn and ice. The model describes the coupled spatial and temporal evolution of five properties of the firn, all defined in a bulk sense (i.e. considering a spatial scale much larger than the grain size): porosity, vertical normal stress, vertical velocity, grain size, and age (Table 1). Unlike most previous firn compaction modelling (Lundin et al., 2017) we use an Eulerian reference frame (Case and Kingslake, 2021). The vertical coordinate z moves with the ice surface and increases downwards, z=0 denotes the ice sheet surface, and z=zb denotes the lower limit of the model domain. At any time t, the total thickness h of the model domain is h(t)=zb.
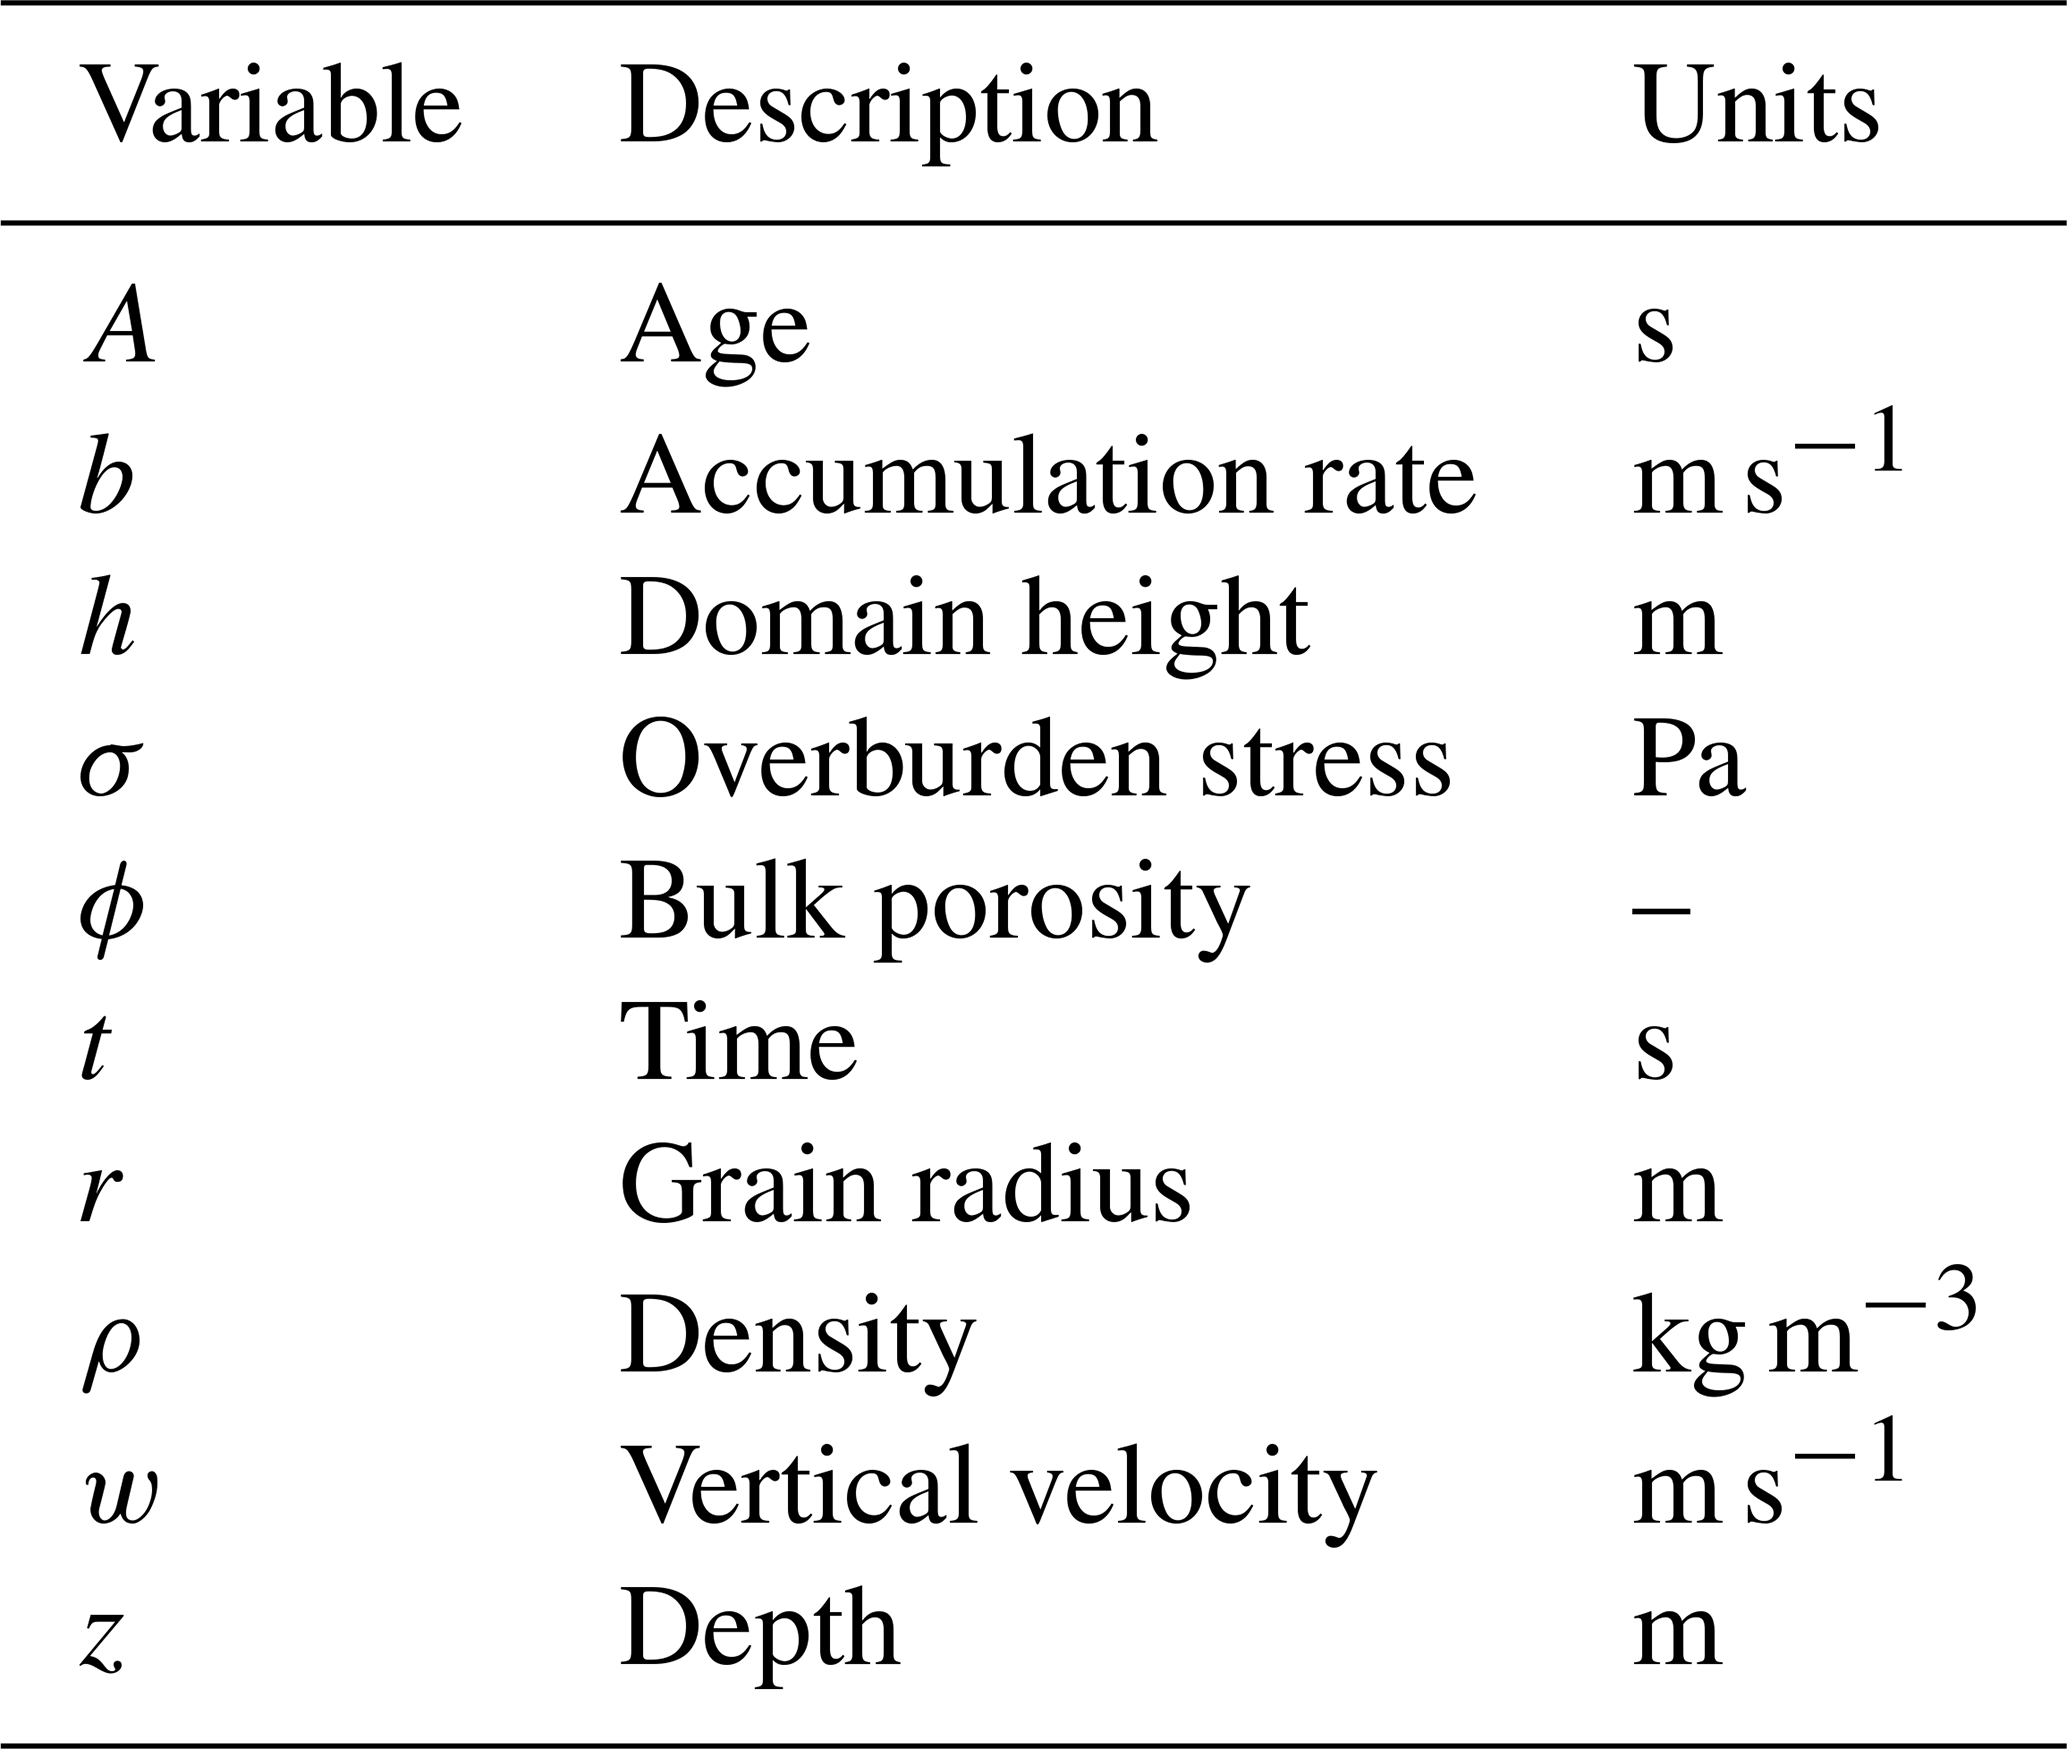
Porosity is defined as , where ρ is the depth-dependent density, and ρi is the density of ice, assumed constant (918 kg m−3). While in reality firn temperatures vary seasonally near the surface, for simplicity we assume that the temperature is equal to the surface temperature Ts everywhere. Table 2 summarizes the physical properties assumed constant in the model. Following Arthern et al. (2010), we describe firn compaction with a viscous constitutive relation:
where σ is the vertical normal stress (following the convention that compressive stresses are negative); kc, n, and m are constants; and fT and fr are functions of Ts and grain radius r, respectively (Arthern et al., 2010). The sign function returns the sign of its argument. The material derivative is defined by , where w is the vertical velocity of the ice and firn relative to ice sheet surface, defined as positive downwards. Assuming a linear rheology, with linear dependence on ϕ, (), Arthern et al. (2010) found that kc = 9.2×10⁻⁹ kg−1 m3 provided a reasonable fit to field observations of firn compaction, and we adopt this value here. Following previous studies (Herron and Langway, 1980; Stevens et al., 2020), we adopt an Arrhenius relation for fT,
where Ec is the activation energy for compaction (60 kJ mol−1), and R is the gas constant (8.3 J mol−1 K−1). Following Arthern et al. (2010), we adopt , consistent with Nabarro–Herring creep by diffusion through the crystal lattice. Combining this expression, Eqs. (2) and (3), and the definition of the material derivative yields an evolution equation for ϕ:
where ϕs is a prescribed surface porosity. The vertical gradient of overburden stress σ is given by
where g is acceleration due to gravity (9.8 m s−2). Ignoring horizontal strain (Jenkins et al., 2006; Horlings et al., 2021; Case and Kingslake, 2021), mass conservation requires
Combining this with Eq. (4) provides an expression for the vertical gradient of w,
where b is the rate of snow accumulation in units of ice-equivalent depth per unit time (i.e. the depth the snow that accumulates in each unit time would have if it had the density of ice). The upper boundary condition on w is motivated by the fact that w is the velocity relative to the ice surface. At the surface this is determined by the accumulation rate and the surface porosity.
Table 2Physical constants.
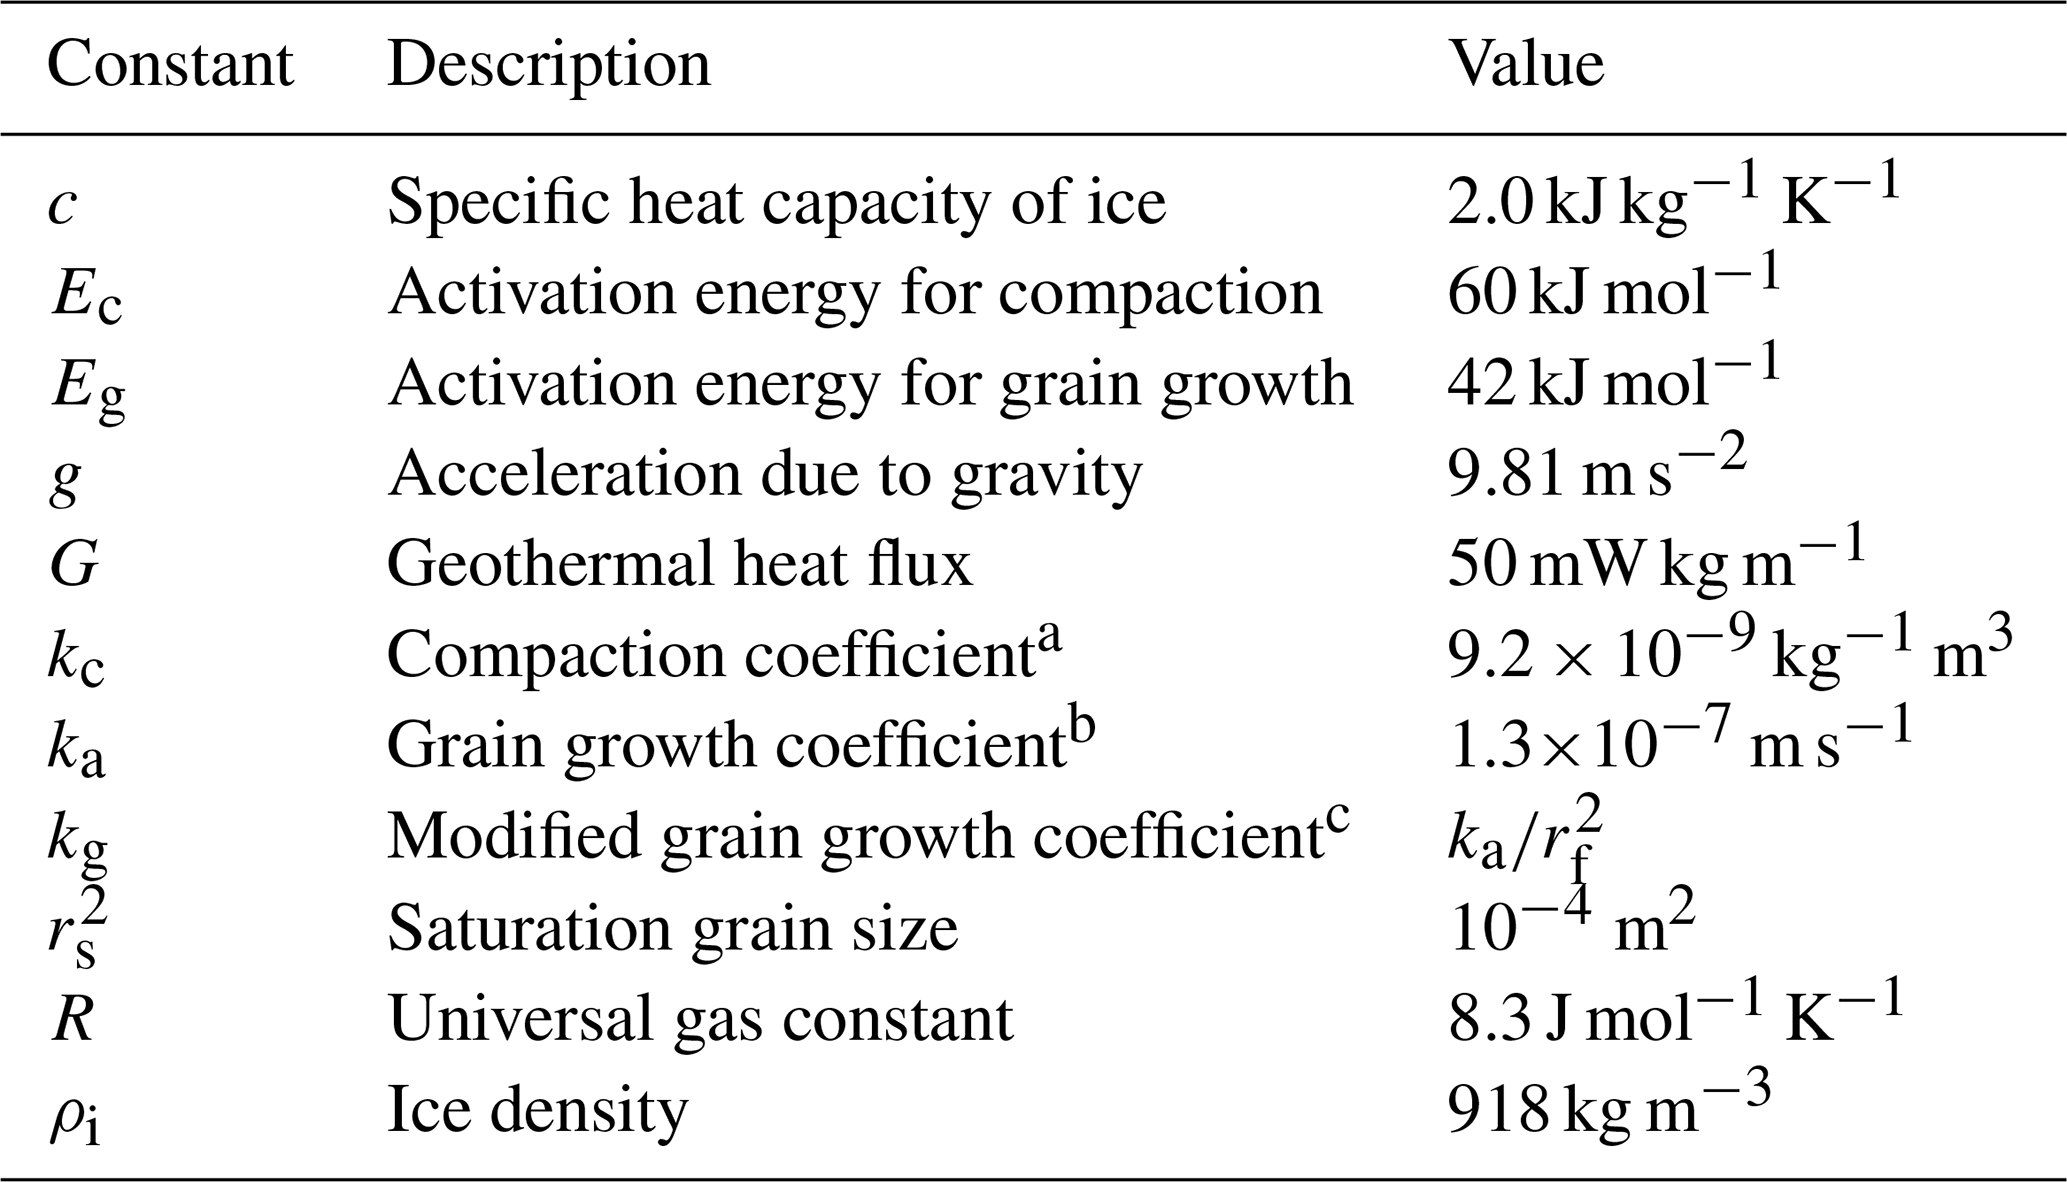
a Assumes , b from Arthern et al. (2010), c modified from ka to account for addition of in Eq. (8).
We follow Arthern et al. (2010) in describing grain-size evolution as independent of stress and obeying an Arrhenius temperature dependence. This is referred to as normal or static grain growth (e.g. Gow, 1969; Alley and Woods, 1996; Jun et al., 1998). This approach assumes that we can characterize grain size by the mean grain radius r, ignoring complications associated with more realistic grain-size distributions (Kipfstuhl et al., 2009). However, we extend this model with the recognition that normal grain growth will not continue indefinitely but will eventually be significantly counteracted by flow-induced recrystallization and polygonization (e.g. Alley, 1992; Duval and Castelnau, 1995; Mathiesen et al., 2004; Roessiger et al., 2011; Kipfstuhl et al., 2009). We modify the grain growth equation of Arthern et al. (2010) to include this effect in a simplistic way and adapt it to our Eulerian framework as follows:
where Eg is the activation energy for grain growth (42 kJ mol−1; Arthern et al., 2010), rf is a saturation grain radius, and rs is the surface grain radius. Given that this expression describes the evolution of the square of the grain radius, hereafter we refer to r2 as the grain size and as the saturation grain size. We conservatively estimate m2. This is considered a conservative estimate because it is low compared to observed saturation grain sizes (e.g. Mathiesen et al., 2004; Roessiger et al., 2011) and because later we show that even with this lower-end estimate of , grain-size saturation within the firn layer is unlikely across a range of climates. The constant kg is defined by modifying the grain growth coefficient of Arthern et al. (2010), m2 s−1, to account for our addition of in Eq. (8): . For simplicity, Eq. (8) neglects the impact of impurities or microstructure on grain growth (e.g. Alley and Woods, 1996; Jun et al., 1998; Roessiger et al., 2011).
Although this has no impact on firn thickness, we include the following evolution for the age of the firn and ice A to aid future work on the ice–gas age offset (e.g. Buizert et al., 2021):
Finally, we use domain-wide mass conservation (Appendix A) to derive a kinematic condition for the time evolution of the thickness of the domain:
which indicates that the lower limit of the domain will move due to any imbalance between the ice-equivalent accumulation rate b (with units of length per time) and the velocity at the lower surface.
Equations (4)–(10) complete the model. It describes how six variables – ϕ, σ, w, r2, A, and h – vary in response to prescribed surface porosity ϕs, surface grain-size , surface temperature Ts, and accumulation rate b.
2.2 Nondimensionalization
We define scales as follows:
where symbols with asterisks represent scaled variables, coordinates, or parameters, and the zero subscripts denote scales. We use β to denote the nondimensional accumulation rate to distinguish this input parameter from the model variables. We scale w by the accumulation rate scale, w0=b0, which we prescribe later, and define t0 as the characteristic transit time of material through the domain, . We set m and ϕ0=1.
Substituting scales into Eq. (4) (dropping asterisks for clarity) yields
where we have used the fact that σ≤0 (Eq. 5) and introduced the nondimensional parameter α, which controls the relative contributions of compaction and advection:
Defining σ0=ρigz0, Eq. (5) becomes
and Eq. (7) becomes
Equating terms in Eq. 8 yields
and the nondimensional grain-size-evolution equation,
where . Defining A0=t0 leaves the age equation (Eq. 9) cosmetically unchanged,
Finally, Eq. (10) becomes
Table 3Surface temperatures, scales, and nondimensional parameters corresponding to three climatic settings: (1) high accumulation and surface temperature (e.g. a mountain glacier in a maritime climate), (2) intermediate temperature and accumulation (e.g. near-coastal Antarctica), and (3) low temperature and accumulation (e.g. interior East Antarctica). Ice equivalent: i.e.
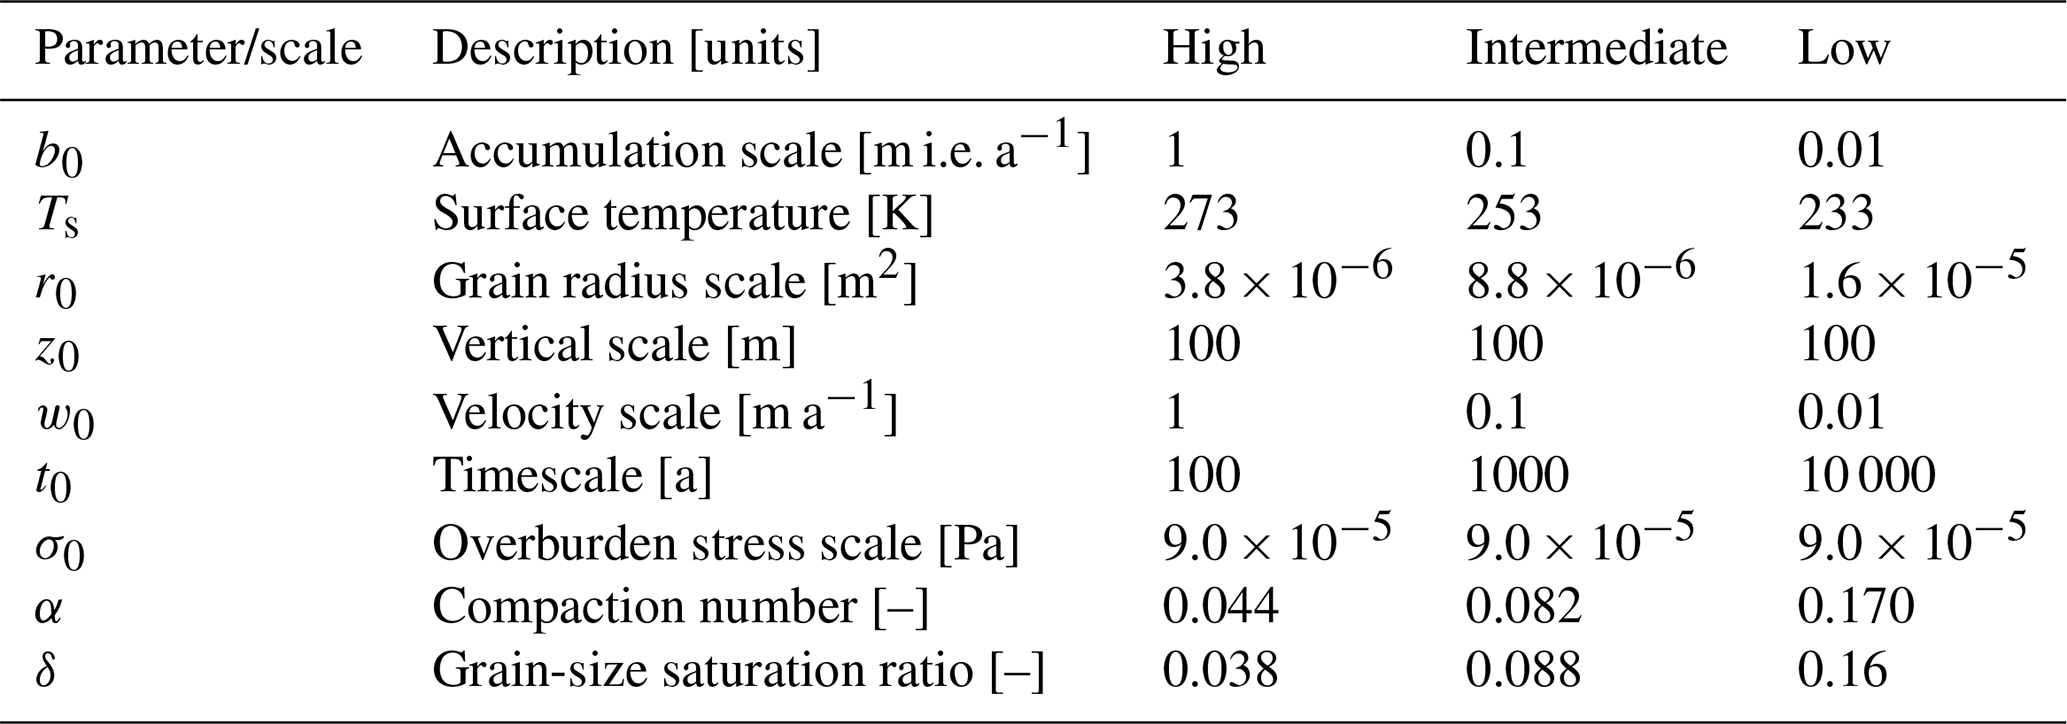
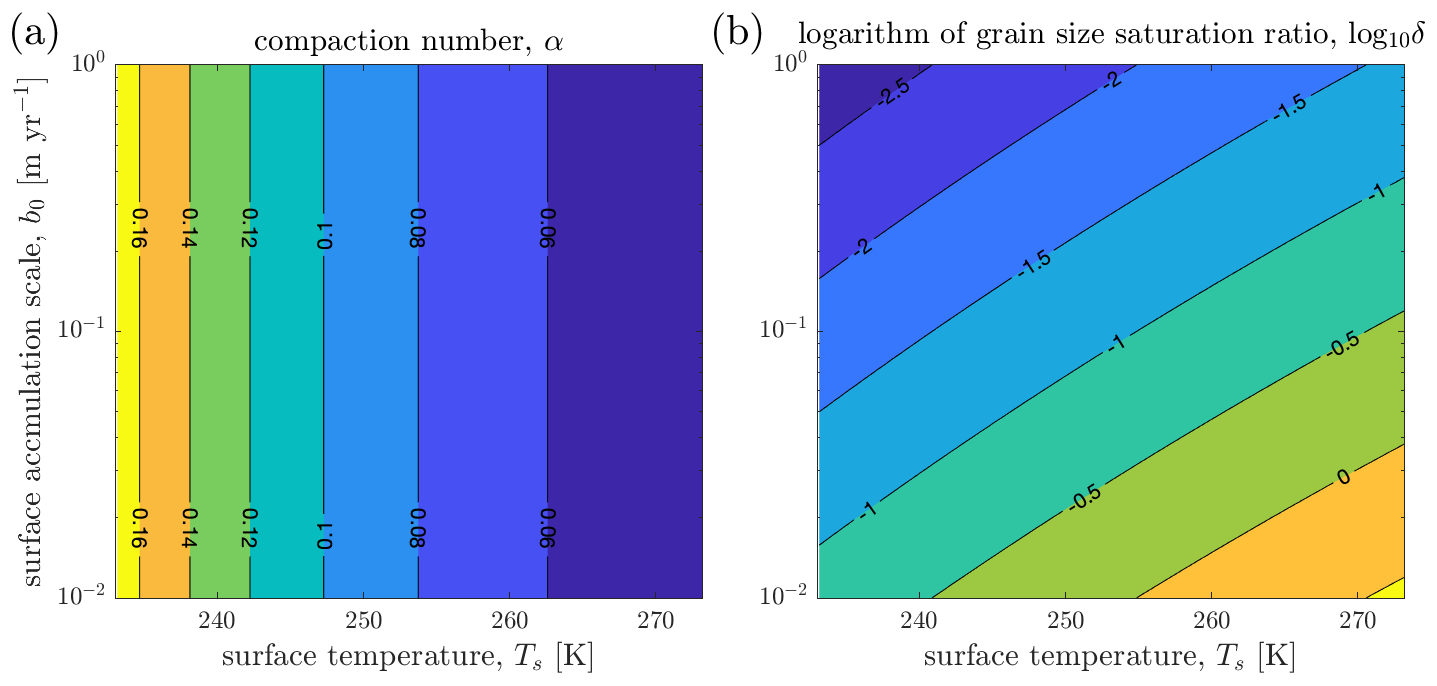
Figure 1Two model parameters, (a) the compaction number α and (b) the base-10 logarithm of the grain-size saturation ratio δ, evaluated for a range of accumulation scales b0 and surface temperatures Ts.
2.3 Parameter values
Table 3 shows the values of model scales and dimensionless parameters corresponding to three climates with high (b0=1 m a−1, Ts=0 ∘C), intermediate (b0=0.1 m a−1, ∘C), and low (b0=0.01 m a−1, ∘C) accumulation and surface temperatures. The timescale, t0, is controlled only by b0 and the prescribed depth scale, z0. It varies from 100 years in the high-accumulation climate to 10 000 years in the low-accumulation climate.
The dimensionless number α describes the relative contributions of firn advection and compaction to the evolution of ϕ for our choice of z0 (100 m); higher α indicates slower compaction. Its dependence on Ts and b0 is controlled by the competing processes of grain growth, advection, and compaction.
We consider first the dependence of α on Ts. Combining Eqs. (13) and (16) yields
This shows that while higher temperatures tend to accelerate compaction directly (the first term in the exponent), this is counteracted by the effect of increasing temperatures on grain size (the second term in the exponent): higher Ts leads to faster grain growth (Eq. 16), which tends to slow compaction (Eq. 12). However, because Ec>Eg the net effect of increasing Ts is faster compaction (decreased α).
In contrast, α is independent of b0 because the impact of b0 on (reflected by the t0 in the denominator of Eq. 13) is balanced by the impact of b0 on grain size (reflected by the in the numerator of Eq. 13 and the b0 in the denominator of Eq. 16). Note that competition between the effects of grain-size evolution and advection manifests here in terms of model scales and nondimensional parameters. Later we discuss the same competition in more detail when it reappears while considering the effect of changing nondimensional model inputs between simulations (specifically, and β).
Given its dependence on Ts, α increases by a factor of 4 between the high- and low-temperature climates (Table 3, Fig. 1). However, even in the low-temperature climate, α<1, indicating that compaction is large compared to advection and that firn porosity will usually closely approach zero at the bottom of the model domain in our simulations.
The grain-size saturation parameter δ provides a measure of how important the addition of in Eq. (8) is for the evolution of r2, i.e. how closely the grain size will approach its saturation value within the firn layer. The dependence of δ on Ts and b0 is controlled by the grain-size scale, r0 (Eq. 16), which is a first-order estimate of the growth in grain size within the firn layer in the absence of grain growth saturation; r0 increases with Ts because grain growth rate increases with temperature and decreases with b0 because higher accumulation rates decrease the time available for grain growth before firn advects through the firn layer. For the three climates considered in Table 3, the accumulation dependence has the largest effect on δ. Therefore, δ is largest in the low-temperature, low-accumulation climate. Figure 1b shows that δ only reaches unity in relatively high-temperature (Ts>255 K), low-accumulation (b0>0.04 m a−1) conditions. Considering the observed correlation between accumulation and temperature over ice sheets (e.g. Dalaiden et al., 2020), this combination of conditions is likely to be rare, indicating that grain size is unlikely to saturate within the firn layer and that δ can safely be neglected when necessary.
2.4 Numerics
Equations (12), (14), (15), (17), (18), and (19) describe our full nondimensional firn compaction model. We solve the equations numerically using the method of lines. We use a change of coordinates (Appendix B) to account for the temporally varying domain length. The method of lines involves discretizing the model domain in space into grid steps connected at nodes and forming a coupled set of ordinary differential equations (ODEs) which describe the time evolution of the model variables. See Appendix B for more details. Unless otherwise stated, we use a grid spacing of Δz=0.01. The ODEs are solved simultaneously using the MATLAB ODE solver ode15s. This solver finds optimal time steps dynamically with user-configurable absolute and relative error tolerances. We set these tolerances to 10−8.
All simulations use the following initial conditions:
Unless otherwise stated, simulations continue until a steady state is reached, as detected when everywhere. See the “Code availability” section for access to model code and figure plotting scripts.
2.5 A reduced, steady-state model
As well as presenting numerical solutions of the full model, we utilize a simplified, steady-state model consisting of a set of coupled ODEs. The purpose of the ODE model is to allow us to test our numerical solutions of the full model and to act as a starting point for several further simplifications designed to clarify the interdependence of firn thickness, porosity, and grain size.
Equating the time derivatives in Eqs. (12), (17), and (18) to zero and rearranging and gathering the results with Eqs. (14) and (15) yields
with the following boundary conditions:
Below we present the results of solving this model, and simplifications of it, using MATLAB's ODE solver ode45, with the same grid spacing as used for the full model (previous section) and absolute and relative error tolerances of 10−10.
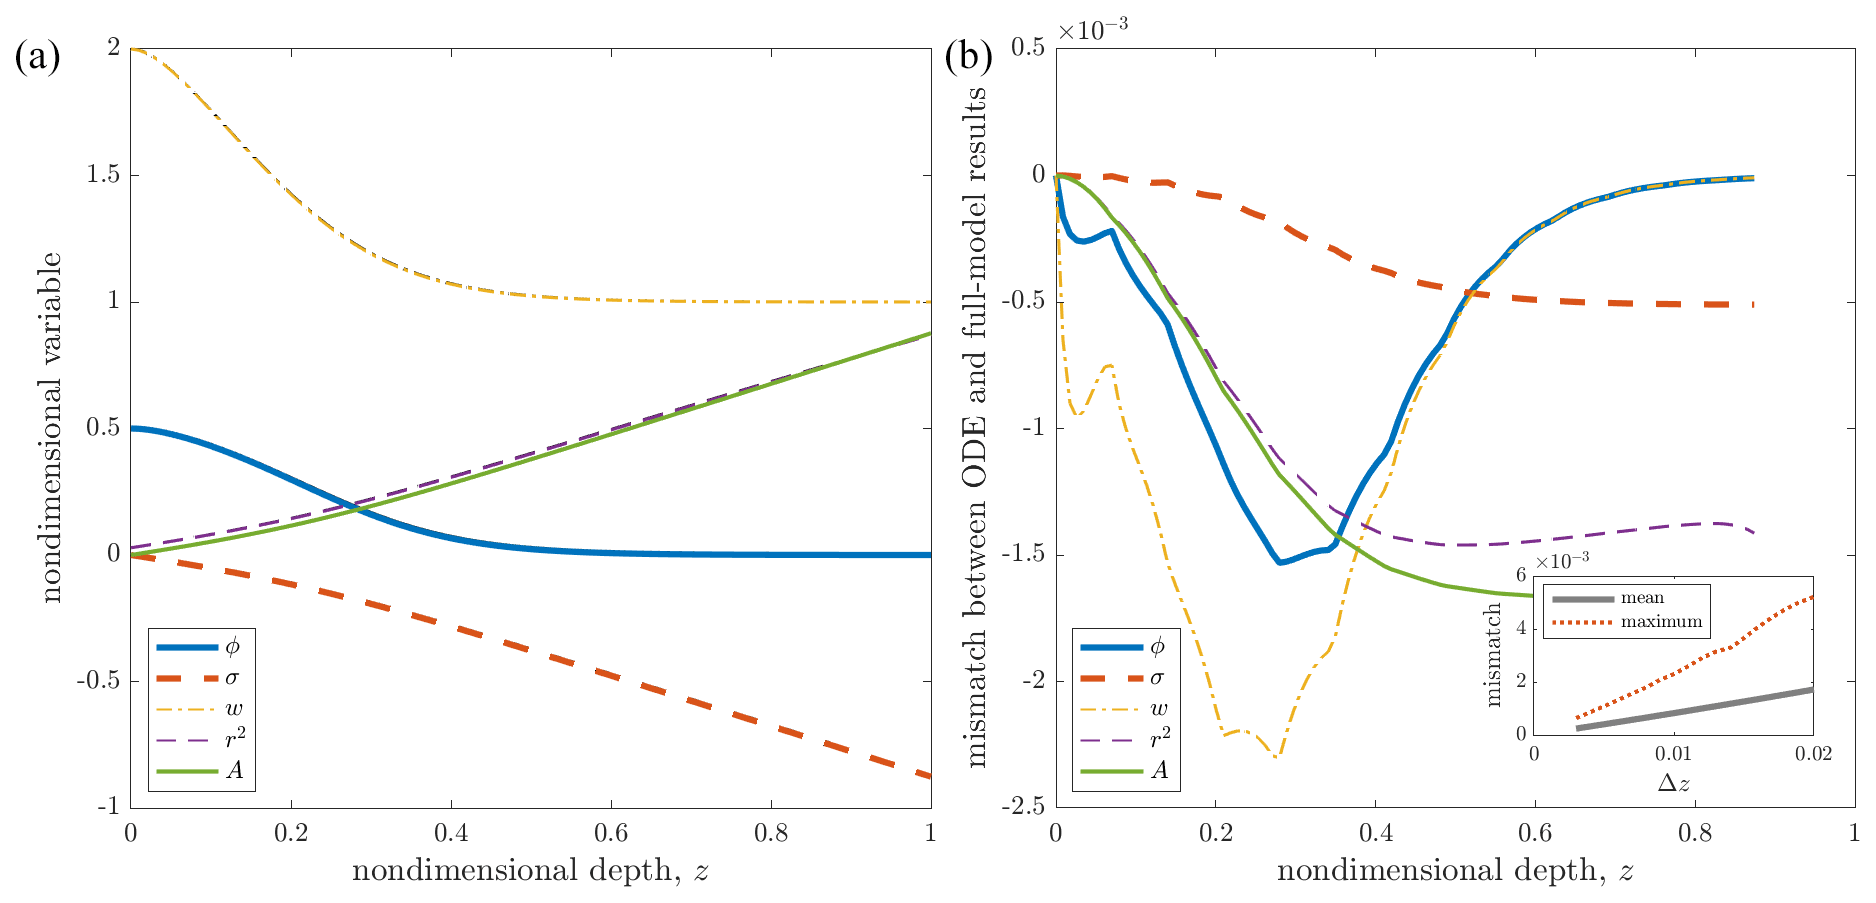
Figure 2(a) A solution to the reduced ODE model overlaid on a steady-state solution to the full compaction model. Both simulations use Δz = 0.01, = 0.029, b0=0.1 m a−1, β=1, ϕs = 0.5, Ts=253.15 K, m2, and , which yields α=0.082 and 088. The two sets of curves are indistinguishable at the scale of the plot. (b) Mismatch between each variable computed with each model, as functions of z. Inset shows the mean and maximum mismatch (over all z and all five variables) as functions of Δz.
3.1 Comparing the full and ODE model results
Figure 2 displays steady-state profiles of ϕ, σ, w, r2, and A, resulting from solving our time-dependent firn compaction model following the methods described in Sect. 2.4. The nondimensional accumulation rate is β=1, and values for model scales and parameters are noted in the figure caption.
Porosity closely approaches a steady state ( everywhere) after a nondimensional time of around 0.8 (800 years). The steady-state vertical velocity w is approximately equal to β over and increases in magnitude towards the surface, where it reaches . The porosity ϕ is close to zero in the lower region and increases towards its prescribed value at the surface. Pointing to limitations in the model that we discuss later, there is an inflection point in ϕ at z=0.212 (21.2 m below the surface), and, because the overburden pressure, σ, is zero at the surface, the gradient of ϕ is also equal to zero at the surface (; Fig. 2a, Eq. 12). The age A, σ, and the grain-size r2 increase approximately linearly with depth, deviating from linear where the gradients in the w and ϕ deviate from zero. Note that this simulation predicts a relatively thin firn layer, given the prescribed surface conditions.
Plotted over the full-model results in Fig. 2a are results from the ODE model (Sect. 2.5) computed using the same scales and parameters. The two sets of results are indistinguishable at the scale of the plot. Figure 2b shows the mismatch between the two sets of results for each variable. The mean absolute difference between the two solutions across the five variables is 8., and the maximum difference is 2.. Mean and maximum differences as percentages of the full-model values are 0.55 % and 3.67 %, respectively. The inset in Fig. 2b shows how the mean and maximum mismatches vary between simulations that used a range of grid spacings, Δz. The fact that the mismatches between the results are small (≪1) and that the mean and maximum mismatches approach zero as the grid spacing decreases gives us confidence that our numerical method recovers the full model's steady state with sufficient accuracy for the purposes of the following analysis.
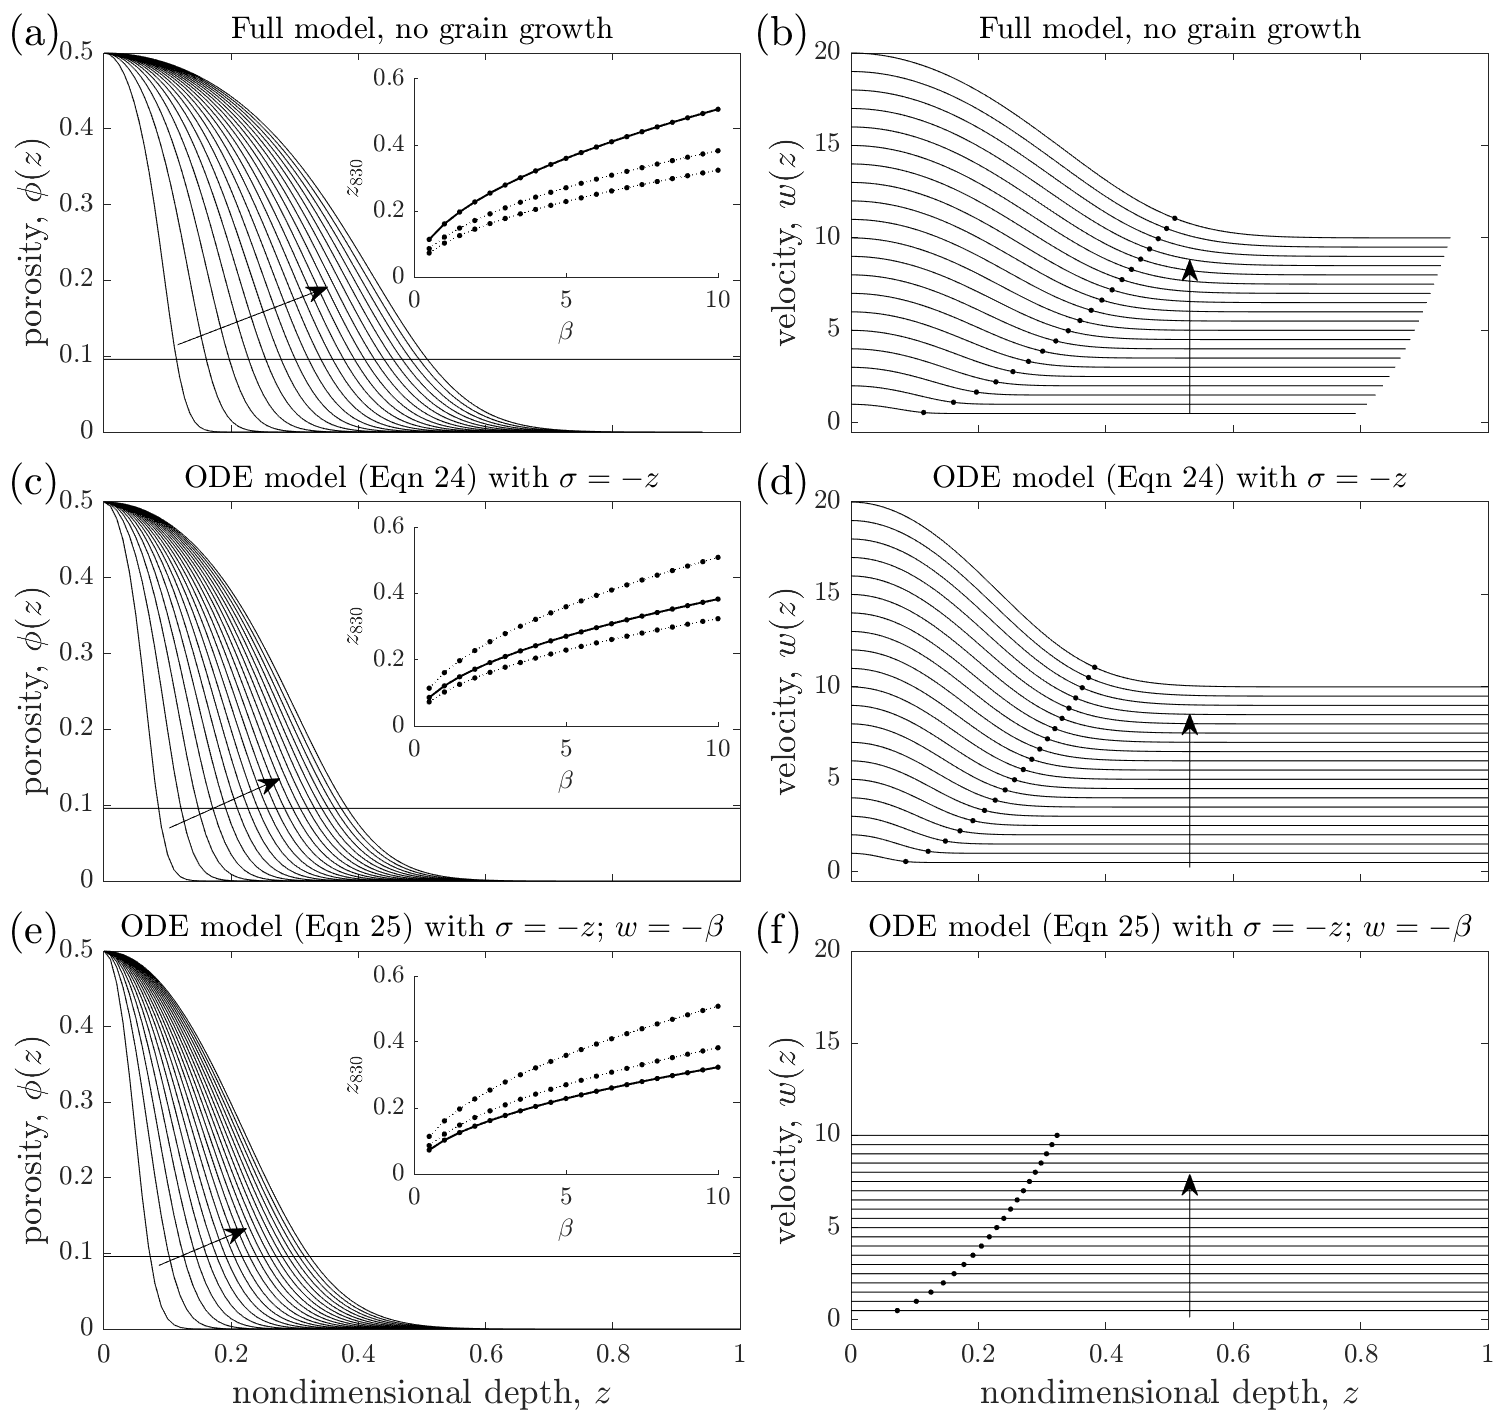
Figure 3Accumulation dependence in the absence of grain-size evolution in three different models. The left panels show porosity ϕ as a function of depth z. The horizontal line shows the porosity corresponding to z830 (0.096). The right panels show velocity w as a function of z. The dots show the depth at which the firn reaches 830 kg m−3. Each row shows the results of 20 simulations each using a different accumulation rate β, which varies linearly between 0.5 and 10. The arrows show the direction of increasing β. All simulations used b0=0.1 m a−1, ϕs=0.5, Ts=253.15 K, .01 m2, and . They also all prescribe r2 equal to its surface value .029 everywhere (corresponding to a dimensional grain radius of .5 mm). Scales and other parameters are the intermediate values from Table 3). (a, b) Steady-state solutions of the full model (Sect. 2.4). (c, d) Solutions to Eq. (24), which assumes , . (e, f) Solutions to Eq. (25), which assumes , , and . The insets in (a), (c), and (e) show the dependence of firn thickness z830 on β for all three sets of simulations (dotted curves). The three dotted curves are the same in each inset, and the solid curve in each inset corresponds to the results shown in the respective row.
3.2 Uniform and constant grain size
To better understand the accumulation dependence of the thickness of the firn layer, we consider a simple case with uniform and constant grain size, . Figure 3a plots steady-state porosity profiles simulated using the full model. Each simulation used the same boundary conditions and parameter values (following the “intermediate” scenario in Table 3), but a different nondimensional accumulation rate, β. In all simulations the grain size is initiated as uniform and equal to the surface grain size and is not updated during the simulation.
In all simulations, higher accumulation leads to thicker firn; z830, the nondimensional depth corresponding to a porosity of , increases sub-linearly with the accumulation rate β (inset, Fig. 3a). Firn thickness is controlled by a competition between porosity advection and compaction. The positive z830–β relationship is due to the increased accumulation leading to increased downward advection of higher-porosity firn (second term on the right of Eq. 12, Fig. 3b), which the corresponding increase in compaction rate (the first term on the right of Eq. 12) is insufficient to balance. Therefore, the result of increasing β is that a given parcel of firn does not reach the bubble-close-off density of 830 kg m−3 until it has reached a greater depth.
Simplifying the ODE model helps to demonstrate this behaviour and will assist with contrasting it to the case when the grain size is allowed to evolve, presented in the next section. We start by ignoring the age equation, which has no effect on the β dependence of firn thickness, and assuming . The results presented in Fig. 2a motivate two additional simplifications. Firstly, recognizing that σ is approximately linear, we substitute into Eqs. (22a) and (22c), reducing the ODE model to
with ϕ(0)=ϕs and . Figure 3c and d plot solutions to Eq. (24). The results retain the sub-linear positive relationship between β and z830 (inset, Fig. 3c). The second simplification ignores the impact of compaction on w by assuming w(z)=β, which reduces Eq. (24) to
with ϕ(0)=ϕs. Figure 3e and f plot solutions to this equation. These too retain the sub-linear positive relationship between β and z830. Because β is in the denominator in Eq. (25), higher accumulation rates lead to thicker firn by decreasing the vertical gradient of ϕ. It achieves this by increasing downward advection. We know this because β appeared in this equation via our simple assumption of w(z)=β.
Ignoring the impact of porosity on σ to reach Eq. (24) and on both σ and w to reach Eq. (25) renders these reduced models highly simplistic representations of firn compaction. Nonetheless, the fact that each progressively simpler model shares a qualitatively similar relationship between β, z830, and w indicates that even the simplest ODE model captures the essence of the physics underlying these relationships; specifically, increased accumulation leads to increased downward advection of high-porosity firn.
3.3 Grain-size evolution
Next we consider how grain-size evolution affects the dependence of firn thickness on accumulation. Figure 4 displays steady-state results of three sets of simulations using the full model. In contrast to the simulations discussed in the previous section, grain size is allowed to evolve in space and time through grain growth (first term on the right of Eq. 17) and advection (second term on the right of Eq. 17). The surface grain-size varies between the three sets of simulations, and the accumulation rate β varies between members of each set of simulations. All other model parameters are uniform across simulations and equal to those used to produce the results displayed in Figs. 2 and 3a.
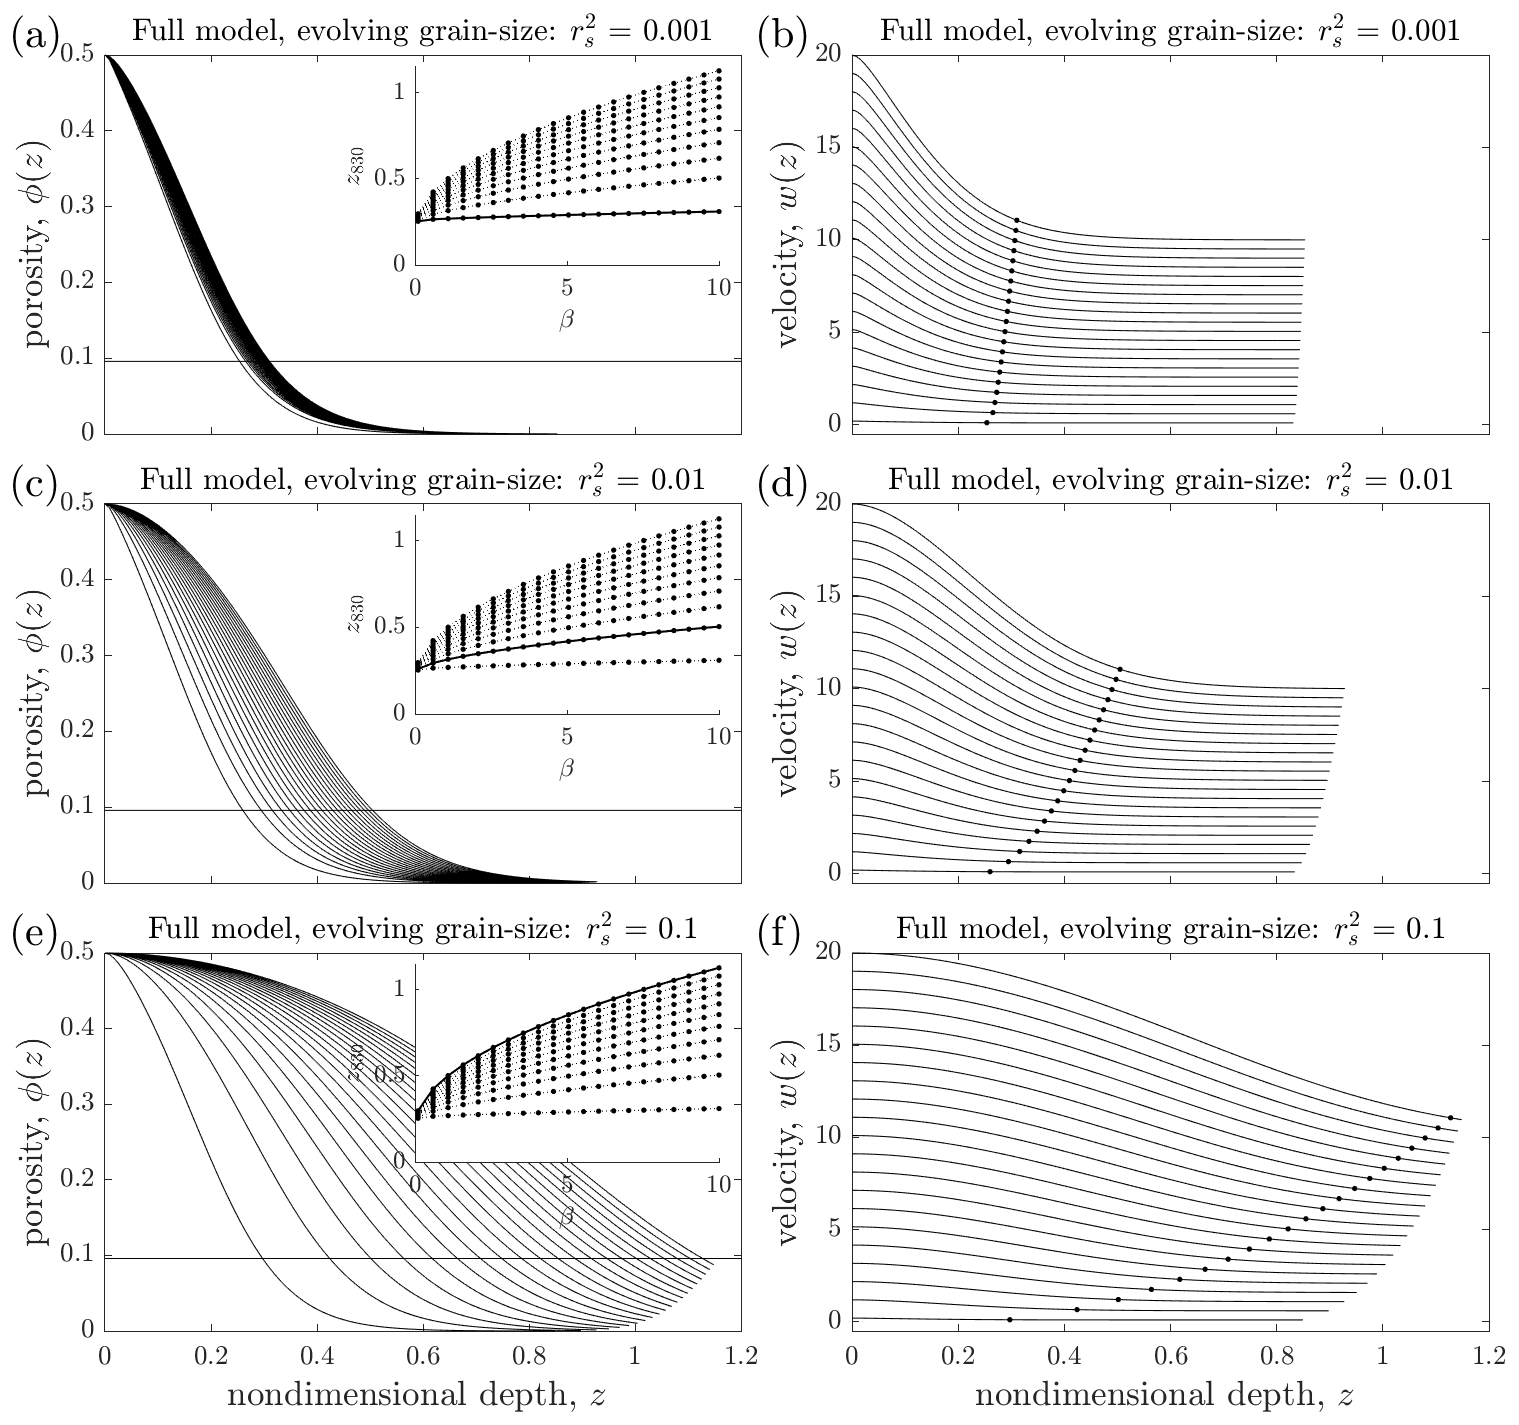
Figure 4Accumulation dependence of the full model, with a grain size that evolves. The layout is similar to Fig. 3, except that only results from the full model are shown, and the rows display results from three sets of selected simulations from among 11 sets of simulations, each using a different value of the surface grain size, . Across each set of simulations the accumulation varies linearly between 0.1 and 10. The insets in (a), (c), and (e) show the dependence of firn thickness z830 on accumulation rate β for all 11 sets of simulations (dotted curves), with each solid curve corresponding to the results shown in each row. The horizontal lines in the left panels show the porosity corresponding to z830 (0.096). The dots in the right panels show the depth at which the firn reaches 830 kg m−3.
In all simulations, just as in the previous section where r2 did not evolve, firn thickness z830 increases sub-linearly with accumulation rate β. However, the strength of this dependence decreases as the surface grain-size decreases (Fig. 4). This can be observed in the variability in the spread of the porosity profiles in Fig. 4a, b, and c. Quantitatively, when surface grain size is relatively large (.1), the gradient of z830 with respect to β has a mean value of 0.075 (Fig. 5) and varies from 0.26 at β=0.1 to 0.048 at β=10 (inset, Fig. 4c). In contrast, when surface grain size is relatively small (.001), the gradient of z830 with respect to β has a mean value of 0.0050 (Fig. 5) and varies from 0.023 at β=0.1 to 0.0040 at β=10 (inset, Fig. 4a). Figure 6a shows how z830 depends on both parameters together. Over this range of parameter values, this mutual dependence is approximately symmetric; increasing β increases the dependence of z830 on , and increasing increases the dependence of z830 on β.
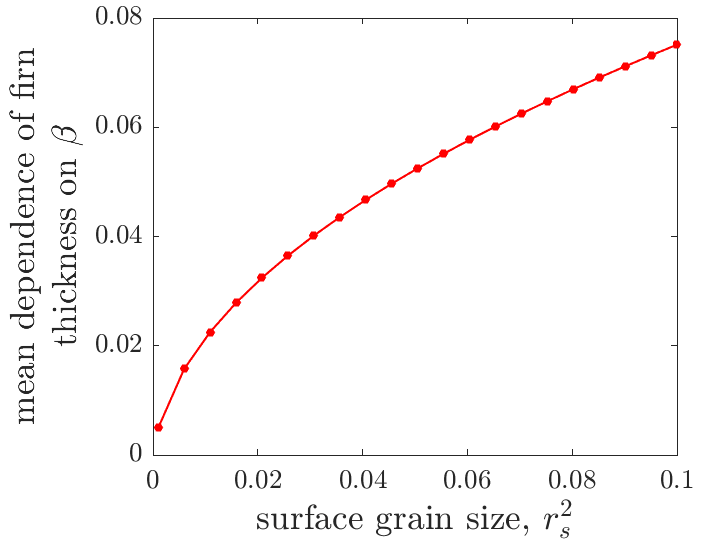
Figure 5The dependence of firn thickness z830 on accumulation rate β and how this varies with surface grain size, . These values were computed as the gradients of the curves in the insets of Fig. 4 (and from the results of 10 additional simulations), which each used a different value of . The gradients were computed using linear least-squares regression. Note that as surface grain size increases, the firn thickness depends more strongly on the accumulation rate. This is the same relationship shown in Fig. 6.
We turn to the ODE model to understand the dependency of the accumulation sensitivity on surface grain size. Starting with Eq. (22), instead of r(z)=rs (which leads to Eq. 24), we assume δ=0 (as motivated by the discussion in Sect. 2.3). Additionally assuming as before yields
with ϕ(0)=ϕs, , and r2(0) = . Figure 6b shows the dependence of z830 on β and computed using Eq. (26). Qualitatively, the relationship between these three quantities is the same as found with the full model (Fig. 6a).
To simplify the model further we assume w=β, then integrate Eq. (26c), rearrange the result, and substitute it into Eq. (26a), yielding
Figure 6c shows the dependence of z830 on β and computed using this simple model. The qualitative agreement between the three panels in Fig. 6, each resulting from a progressively simpler description of firn compaction with grain-size evolution, indicates that insight into the full model's dependence on β and can be gained from the simplest model.
Note that we recover Eq. (25) if we assume in Eq. (27), which is equivalent to neglecting grain-size evolution. Therefore, comparing Eqs. (25) and (27) shows that is always smaller when the grain size is allowed to evolve, which leads to a thicker firn layer. The explanation is that allowing grain size to evolve leads to larger grains, which slows compaction (e.g. Eq. 4).
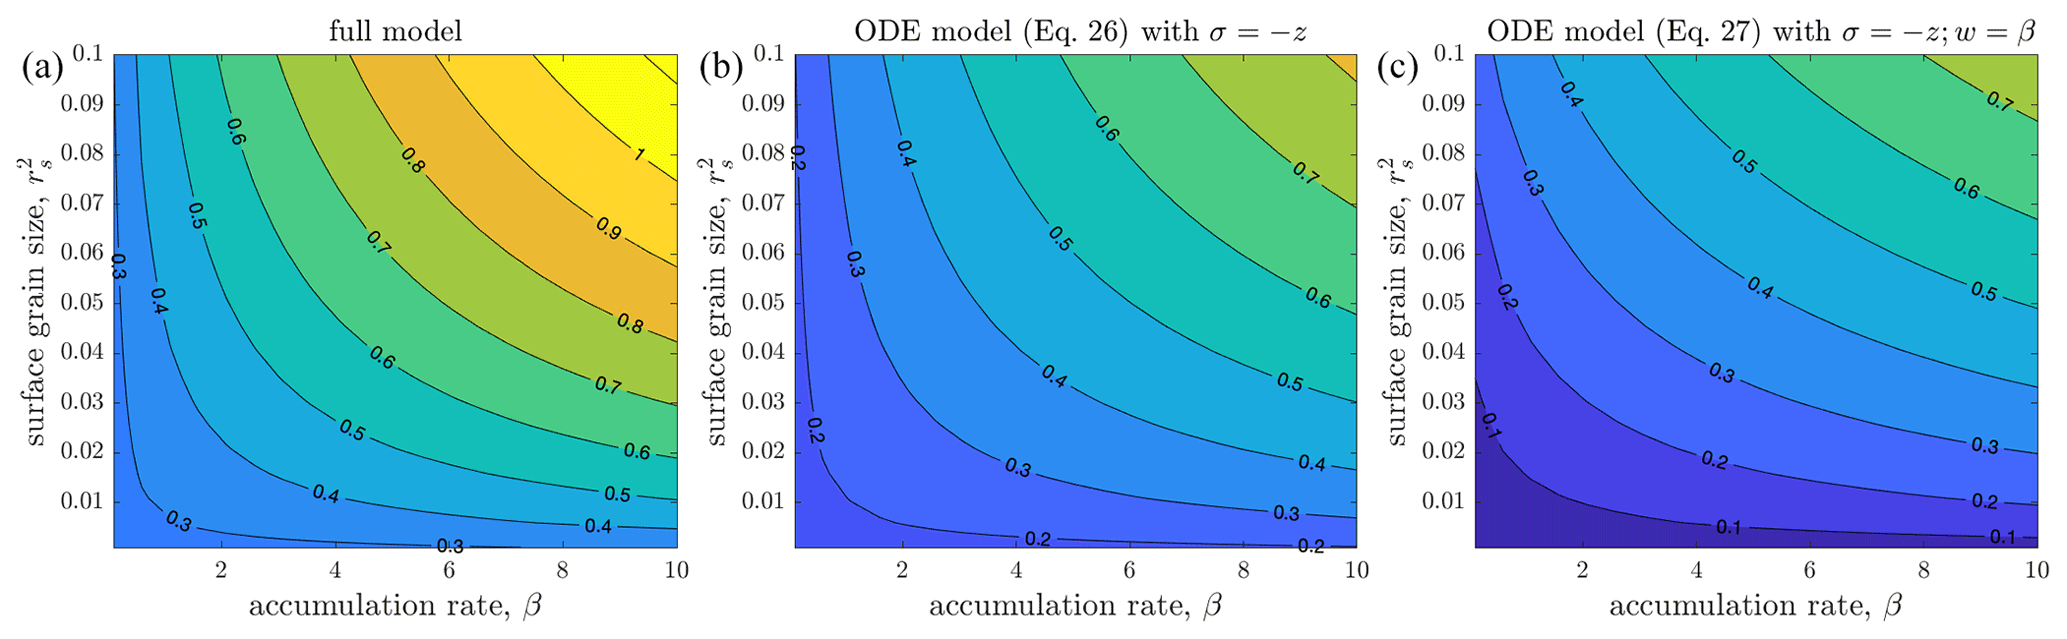
Figure 6Firn thickness z830 as a function of surface grain-size and accumulation rate β (all nondimensional) from (a) the full model using the same parameters as used to produce Fig. 4; (b) a simplified version of the ODE model that assumes δ = 0 and (Eq. 26); and (c) a further simplification of the ODE model that assumes δ=0, , and (Eq. 27). All three panels show the same relationship between surface grain size, accumulation, and firn thickness: as surface grain size increases, the firn thickness depends more strongly on the accumulation rate (see also Fig. 5).
The overbraces in Eq. (27) indicate the origin of two competing β dependencies. The velocity w introduces an inverse dependence on β due, again, to faster downward advection of high-porosity firn. However, this is partially compensated for by the dependence of on grain-size r2, which introduces another dependence on β. Recall that grain size increases with depth (green dashes curve in Fig. 2). Therefore, because grain size is advected with the firn as it moves downwards, and because β controls the rate of advection, a larger β leads to a smaller r2 everywhere. Because smaller-grained firn compacts more easily (Eq. 12), this increase in advection leads to faster compaction and reduces firn thickness. The net result of the inverse dependence of on β from the advection of ϕ and its positive dependence on β from the advection of r2 is that firn thickness increases with β; however, this dependence is not as strong as it is in the case when r2 does not evolve with depth (Sect. 3.2).
The denominator on the right of Eq. (27) indicates that the overall dependence of ϕ on β increases with . This is consistent with the results of simulations using the full model (Figs. 4 and 5). In fact, if surface grain size is sufficiently small that we can assume (or more precisely if ), Eq. (27) has no dependence on β. The explanation is that when , the grain-size profile is simply , i.e. linearly increasing with depth at a rate inversely proportional to β. Combined with the linear dependence of compaction rate on r2, this means that simulations with higher β have lower grain size and therefore faster compaction. This effect exactly balances the effect of faster downward advection of porosity in simulations with higher β. In other words, the effect of increased porosity advection exactly balances the effect of increased grain-size advection when . More generally, when , these two effects do not balance exactly, but because , decreasing rs increases the relative importance of β in determining , which increases the size of the grain-size-advection effect and reduces the dependence of firn thickness on accumulation.
While the explanation for the relationship between z830, β, and has been given in reference to a simplified ODE model (Eq. 27), the same competition between advection of grain size and advection of porosity operates in the full model. This is reflected in the numerical results shown in Figs. 4, 5, and 6a. It can also be shown analytically that z830 is independent of β when (Appendix C). Despite the vertical variation in velocity being more complicated in the full model than in the ODE model (because it is a function of grain size and porosity rather than simply assumed constant), increasing β still leads to faster advection of ϕ, the effect of which is exactly balanced by increased downward advection of grain size when .
3.4 Nonlinear stress dependence
All results presented above assumed a linear viscous rheology where compactive strain rates depend linearly on the overburden stress (n=1). To examine the effect of a nonlinear stress dependence (n≠1) on the relationship between z830, β, and , we performed additional simulations using the full model. The rheological parameters introduced in Eq. (4) were derived assuming n=1 (Arthern et al., 2010). To allow for a more reasonable comparison between multiple simulations using n≠1, we introduce a modified compaction number, . This was derived by equating the strain rates (Eq. 15) resulting from an arbitrarily chosen intermediate stress of computed using n=1 and using n≠1. Our results depend only quantitatively on this arbitrary choice. Figure 7 plots the dependence of firn thickness on accumulation rate and surface grain size using n=2, 3, and 4, using corresponding values of α′. Qualitatively the results are the same as the full-model results computed using n=1 (Fig. 6a); increasing surface grain size increases the dependence of firn thickness on accumulation rate. This indicates that the mechanisms relating z830,β, and discussed above are independent of the stress dependence of compaction. This is consistent with Eq. (27), where the stress exponent does not effect the relationship between these quantities in the simple ODE model. It is also consistent with the analysis in Appendix C of the full model.
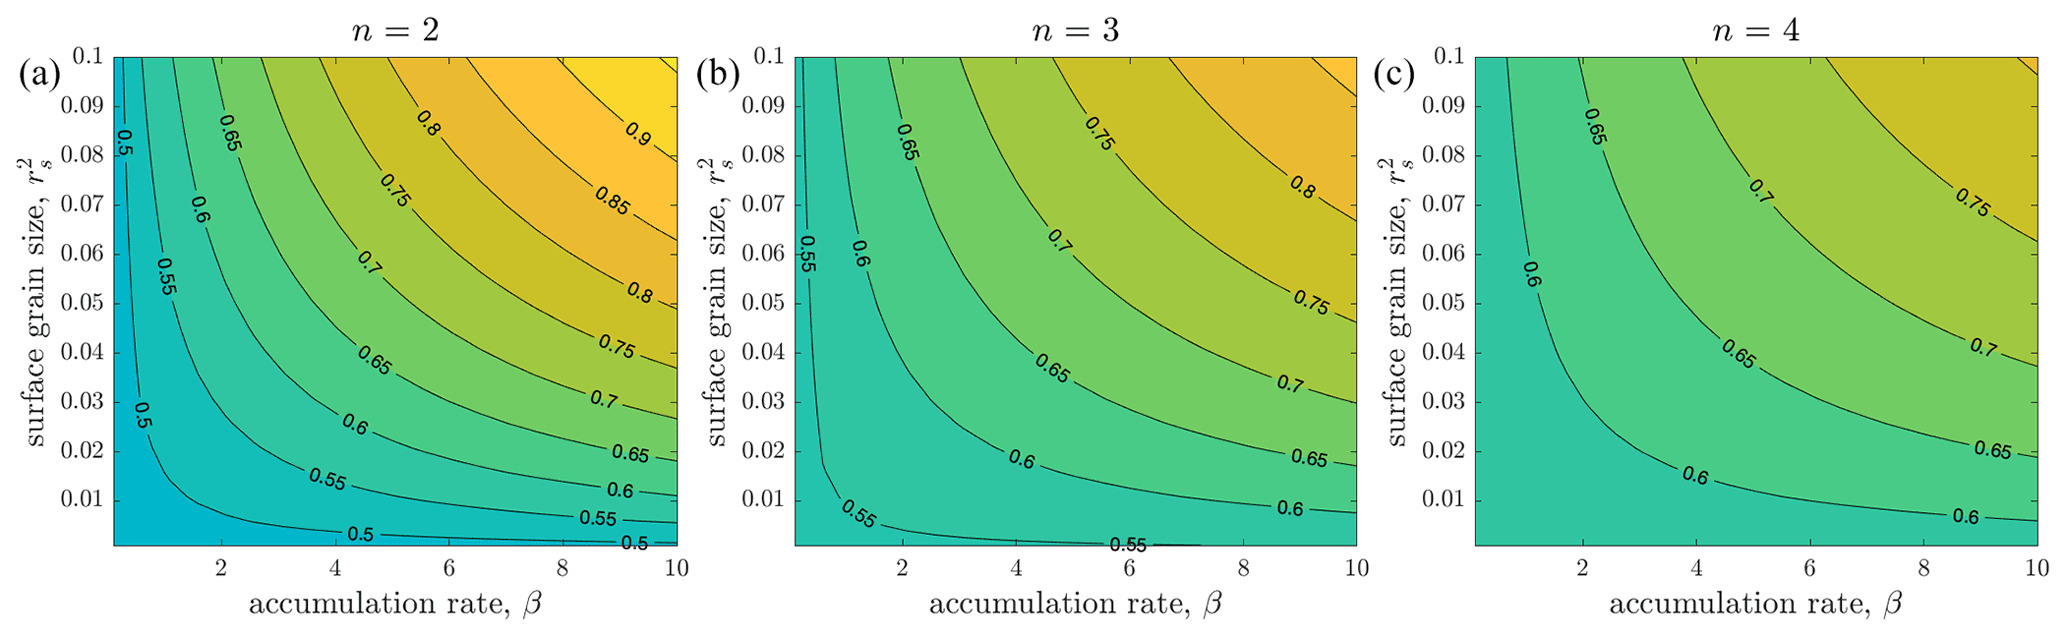
Figure 7Firn thickness z830 as a function of surface grain-size and accumulation rate β using the full model with (a) n=2, (b) n=3, and (c) n=4 and corresponding values of α′. All other parameters are the same as used for the simulations plotted in Fig. 6. The colour scales are the same as used in Fig. 6.
3.5 Ice surface height change
All results presented above have been from steady states where the height of the ice sheet surface, represented in this model by the domain thickness h, has ceased changing significantly (). This state is reached because the velocity at the bottom of the domain, which is the result of the prescribed upper-surface boundary condition on w and the integrated compactive strain rate (Eq. 15), has closely approached the prescribed accumulation (Eq. 19). Figure 8 displays results from a series of experiments in which the ice surface height instead continually increases (left panel) or decreases (right panel). This is implemented by increasing or decreasing the accumulation rate by 10 % (i.e. multiplying the second term on the right of Eq. 19 by 1.1 or 0.9, respectively) while maintaining the lower-surface boundary condition on velocity: . This simulates the scenario where the flow of the ice sheet is in equilibrium with an accumulation rate of β, but the climatically controlled accumulation is larger or smaller than this value. Such a scenario is possible if the response time of the flow of the ice sheet is much larger than the timescale of climate variability. The result is that after an initial transient period, h increases or decreases at a constant rate, and the vertical variations in all model variables with respect to the surface remain constant, despite continuous surface height change.
Figure 8 shows the steady-state z830 resulting from these two sets of experiments as functions of accumulation rate β and the surface grain-size . Comparison between the two panels and between this figure and Fig. 6a shows that steady-state z830 is larger when the ice surface height increases and smaller when the surface height decreases over time. The explanation is that the raising or lowering of the ice surface effectively increases or decreases, respectively, the advection of higher-porosity firn downwards. For example, in the case of continuous, steady surface-height increase, as a parcel of firn is buried and compacted, the surface moves upwards. By the time the parcel of firn reaches the bubble close-off porosity it has reached a larger depth than it would have reached if the surface was stationary. Nonetheless, Fig. 8 shows that qualitatively the relationships between z830,β, and are unchanged from the cases considered in previous sections, indicating that the mechanisms relating these quantities discussed above also operate when the ice surface height is changing in time.
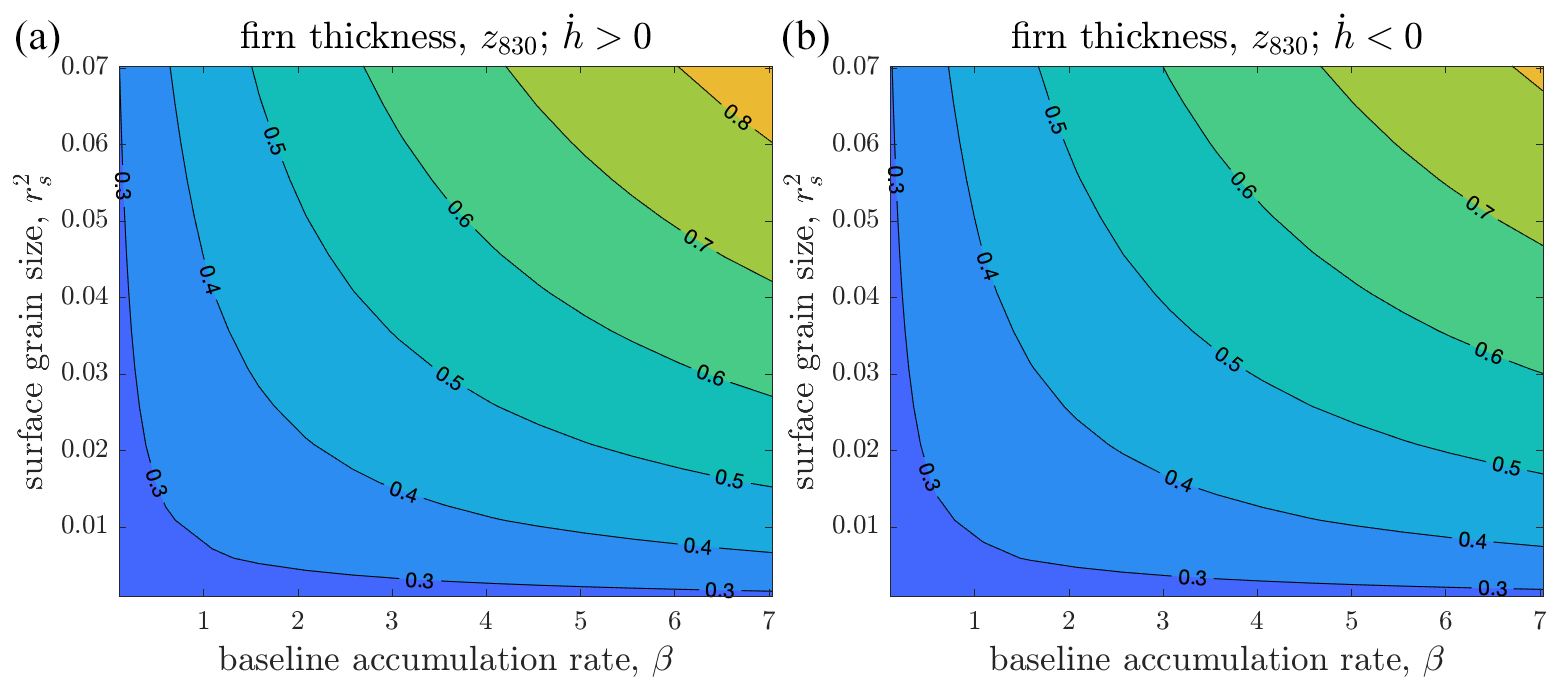
Figure 8Steady-state firn thickness z830 simulated with the full model during steadily (a) increasing and (b) decreasing ice surface height and domain length h, as functions of surface grain-size and the baseline accumulation rate β. Simulations use the same parameters as used to produce Fig. 4 except that the baseline accumulation rate in Eq. (19) is multiplied by (a) 1.1 and (b) 0.9 to force continuous surface height change. Colour scales are the same as used in Figs. 6 and 7. Simulations terminate after a nondimensional time of , which provides enough simulation time for the variation in ϕ with respect to the surface to reach a steady state.
We have described a firn compaction model that includes grain-size evolution. What distinguishes it from most previous models is that it uses an Eulerian reference frame, following the adaption of the equations of Arthern et al. (2010) by Case and Kingslake (2021). Going further than Case and Kingslake (2021), we scaled the model equations and included grain-size saturation, which a scaling analysis suggested is generally negligible in firn. We also derived a simple ODE model from the full model, which can be used to simulate porosity, age, and grain size, when surface forcings change slowly enough that a steady state can be assumed.
We used these models to examine how accumulation affects firn thickness through its impact on the competing processes of compaction and advection. An Eulerian reference frame lends itself to this analysis as it allows us to compare terms describing both processes. We first considered the case when grain size is uniform and constant – which is the case considered by most previous firn models (Stevens et al., 2020) – then we allowed grain size to evolve through grain growth and grain-size advection (Arthern et al., 2010).
When grain size is kept uniform and constant, increasing accumulation increases downward advection. This is not balanced by the resulting increase in compactive strain rates, and the net effect is that firn thickness increases sub-linearly with accumulation rate (Fig. 3). An evolving grain size reduces both the steady-state firn thickness and the dependence of steady-state firn thickness on accumulation rate. Higher accumulation rate increases downward advection of lower-porosity firn, increasing firn depth, but it also increases the downward advection of small-grained firn, which in this model compacts faster than larger-grained firn. These two effects counteract each other, reducing the overall dependence of firn thickness on accumulation rate. We demonstrated this effect using numerical solutions of the full model and explained it using highly simplified versions of the steady-state ODE model.
We showed that the extent to which grain-size advection counteracts porosity advection increases as the surface grain size is decreased between simulations. Therefore, the sensitivity of firn thickness to accumulation rate increases with the surface grain size in this simple model. This is independent of the stress exponent in the firn constitutive relation and of whether the ice surface height is increasing or decreasing at a steady rate. This is significant because if this relationship manifests in nature, then spatial and temporal variability in surface grain size driven by meteorological conditions will translate into spatial and temporal variability in the sensitivity of firn thickness to accumulation rates. Consideration of this effect could yield improvements to reconstructions of past climate that exploit modelled relationships between accumulation, bubble-close-off depth, and stable-isotope ratios (Buizert et al., 2021).
We also considered the case when the grain size can be assumed to be zero at the surface (i.e. when ). Under this assumption, the effects of porosity advection and of grain-size advection balance each other exactly, and modelled firn thickness has no dependence on accumulation rate. Although this assumption may be unrealistic in some cases, it was useful to explore because it was illustrative of the competing processes that explain accumulation dependence in the model. Another reason to understand this limiting case is that this is the scenario Arthern et al. (2010) proposed when providing a physical justification for the low-density region model of Herron and Langway (1980), which describes compaction rate as linearly related to accumulation rate (Eq. 1). As noted by Buizert et al. (2015), this equation, combined with density advection (which is also linearly proportional to accumulation rate), leads to accumulation having no impact on steady-state densities in this low-density regime. This effect manifests in our model as the two instances of accumulation rate, β, in Eq. (27) cancelling when the surface grain size, , is zero. Our results serve to highlight how, as first examined by Arthern et al. (2010) (their Appendix B), constitutive relations which describe firn compaction as linearly dependent on accumulation rate (e.g. Eq. 1) belie the crucial role played by grain size. In particular, usage of such constitutive relations implicitly assumes a negligibly small surface grain size, steady-state conditions, normal grain growth, and a particular form for the dependence of compaction on grain size (which we discuss more below).
An implication of these generally unrecognized assumptions underlying some widely used firn models is that models that include viscous firn compaction and grain-size evolution (e.g. Arthern et al., 2010) are potentially capable of a much richer array of responses to accumulation rate than is usually recognized, if these assumptions were to be relaxed. For example, to correct for mismatch between density profiles observed in Antarctica and modelled by a reduced version of the full model of Arthern et al. (2010), Ligtenberg et al. (2011) multiplied modelled compaction rates by a linear, empirically derived function of accumulation rate. Medley et al. (2020) improved upon this approach by instead tuning the original model's parameters to reduce mismatch between modelled and observed densities. Our work suggests that future work could apply similar approaches to a more complete model that relaxes the assumption of zero surface grain size, to examine if this reduces data–model mismatch.
While our model relaxes some important assumptions, others remain. We assume that temperature is uniform and constant, firn deforms viscously, air pressure is negligible, no water is present, rheological parameters are uniform and constant, firn grains grow via normal grain growth (with a growth exponent of 2), and firn viscosity is proportional to grain size.
To isolate the effects of accumulation rate on firn thickness we assumed a uniform and constant temperature. However, temperature is a first-order control on firn thickness in this model, through its impact on grain growth and on firn compaction (Sect. 2.3). Surface temperatures vary regionally with climate. This variability would need to be taken into account in any attempt to compare model results to observations (e.g. Montgomery et al., 2018), particularly because accumulation rates generally increase with increasing temperature (e.g. Frieler et al., 2015; Dalaiden et al., 2020), complicating the simple relationship between accumulation and firn thickness predicted by our model. Temperature also varies in time, causing transient vertical variability in temperature throughout the firn column, in part through advection of heat. Further model development and analysis will be required to assess how the modelled accumulation dependence of firn thickness differs in this scenario, in particular in the case when accumulation also varies in time. The latter presents the possibility of complex interplay between advection of porosity, grain size, and heat. We leave exploration of this to future work.
We followed most previous firn models and assumed a viscous firn rheology (e.g. Stevens et al., 2020). A recent alternative approach instead assumes a plastic rheology and simulates the effect of air pressure on firn deformation in near-surface firn (Meyer et al., 2020). How our findings apply to such a model is yet to be determined.
Assuming dry firn compaction restricts the applicability of our results to regions where no significant melting takes place. In wet-snow zones the grain-scale processes that control compaction and grain growth will differ significantly from those in dry snow. Moreover, refreezing of meltwater contributes to densification. Understanding how grain growth, compaction, and advection interact to control accumulation dependence in wet-snow zones is beyond our scope but will likely become increasingly important as these regions grow in the future (e.g. Kittel et al., 2021; Gilbert and Kittel, 2021). Incorporating grain-size evolution into a model that accounts for meltwater percolation and refreezing (e.g. Meyer and Hewitt, 2017) may be an important step towards this.
For simplicity, and unlike firn compaction models that aim to accurately simulate porosity profiles, we used a uniform compaction coefficient, kc, and a uniform stress exponent, n. Starting with Herron and Langway (1980), most firn models consider at least two porosity-defined regions with different compaction coefficients motivated by the different compaction mechanisms that operate in each region. Ignoring this complication does not qualitatively affect our key results relating to the accumulation sensitivity of firn thickness but would need to be reconsidered when quantitatively comparing model output to observations. A related issue, which manifests when surface grain size is non-zero, is that the modelled vertical gradients of porosity and compaction velocity approach zero at the surface (Fig. 2). This is counter to observations (e.g. Montgomery et al., 2018; Case and Kingslake, 2021) and is due to the compaction rate, , being zero at the surface due to zero overburden stress (Eq. 2). Any firn compaction model that describes compaction as a function of overburden stress has the potential to suffer this limitation (Cuffey and Paterson, 2010). Arthern and Wingham (1998) circumvented it using a constant high vertical strain rate in the near surface to account for fast compaction processes that cannot be described viscously, while Arthern et al. (2010) assumed zero grain size at the surface. Except in cases where we prescribe to explore accumulation dependence, we take neither approach here but note that describing the variable compaction mechanisms that operate across different porosity ranges is an important next step in understanding the accumulation dependence of firn thickness; in particular, our work highlights how quantifying the grain-size dependence of compaction will be crucial for such efforts.
We also assumed that firn compaction is inversely proportional to the square of a characteristic grain size. Complications to this simple description could arise from non-uniform grain sizes (i.e which are inadequately described by a single-valued grain-size variable) or from other compaction mechanisms that do not obey this simple inverse relationship.
We also assumed normal grain growth with an exponent of two (Eq. 8), as has been considered appropriate for bubble-free ice with grain growth driven by grain boundary migration to reduce interfacial energy (which is related to grain curvature) (Gow, 1969). Azuma et al. (2012) show that in more realistic ice containing air bubbles the exponent could be much higher. Moreover, Kipfstuhl et al. (2009) show evidence of pervasive recrystallization in firn and highlight problems associated with the measurements of grain size used previously as evidence for normal grain growth in firn (Gow, 1969). They conclude that the assumption of normal grain growth in firn should be revisited. A different normal-grain-growth exponent or a different approach to modelling grain-size evolution would affect our results but not change our broader conclusion that grain growth plays a significant role in the dependence of firn thickness on accumulation.
We have not explored the complications of multiple compaction regimes, different dependencies of compaction on grain size, and different grain growth exponents or parameterizations. However, our work highlights the importance of doing so because commonly used constitutive relationships inspired by Herron and Langway (1980) make implicit assumptions related to these components of the system.
The thickness of the firn layer in cold, dry accumulation zones is controlled by a competition between downward advection of firn and the compaction of each parcel of firn as it advects. To better understand the controls on advection and compaction, we analysed a simplified model that is closely related to previous models (Arthern et al., 2010; Case and Kingslake, 2021). We scaled the model, solved model equations numerically, and derived and analysed several simplified steady-state versions of the model. We draw two main conclusions: (1) the strength of the positive relationship between firn thickness and accumulation rate increases with the surface grain size, and (2) assumptions about grain size underlie some widely used compaction models based on Herron and Langway (1980).
Future work could extend the model to include additional physics and apply the model to different scenarios. Model extensions could include employing a dynamically evolving temperature and varying rheological parameters between porosity-defined regions of the firn. Additional simulations could explore model response to temporal changes in accumulation rate and temperature. Because the model incorporates accumulation differently than models that have been used for this purpose before (e.g. Zwally and Jun, 2002), comparison to those previous results could shed further light on the likely future response of firn to increases in accumulation, in particular how transients in grain size affect the temporal response of the firn thickness. As discussed above, another possible future use for this model, or derivatives of it, is to examine how relaxing the assumption of zero surface grain size affects the tuning of firn model parameters to observations of firn thickness (e.g. Ligtenberg et al., 2011; Medley et al., 2020).
The fact that modelled firn thickness depends on grain size at the surface has potentially significant implications because surface grain size varies in time and space due to meteorological conditions. Ongoing and future work by this team to test this idea further include measuring deformation of firn with known grain size using phase-sensitive ice-penetrating radar (Case and Kingslake, 2021) co-located with grain-size measurements from ice cores and conducting laboratory experiments compacting artificial firn samples with controlled grain sizes. Other complementary work could include analysis of recent compilations of firn thickness measurements (e.g. Montgomery et al., 2018), in conjunction with modelled and measured accumulation rates, surface temperatures, and surface grain sizes.
Here we use global mass conservation to derive Eq. (10), a kinematic condition for the rate of change in the length of the model domain, h(t). Conservation of ice mass in the domain demands
This expression can be expanded using the Leibniz integration rule to give
where we have used in the first term. The second term can be found by substituting the definition of the material derivative into Eq. (6), rearranging, and recognizing that
Substituting this into Eq. (A2) and evaluating the integral gives
where w(zb) and w(0) are the velocities at the bottom and top of the domain, respectively. The boundary condition on w at the upper surface is (Eq. 7). Substituting this into Eq. (A4) and the result into Eq. (A2) gives
Rearranging yields Eq. (10):
To take account of the temporally evolving domain length, we employ a change in vertical coordinate.
B1 Partial derivatives
We normalize the vertical (nondimensional) coordinate, z, by h(t), the nondimensional domain length, so that
and and correspond to the lower and upper boundaries of the column, respectively. We then recast all model equations in terms of this new vertical coordinate, . The time coordinate remains unchanged, but we write for clarity. In what follows applying the multi-variable chain rule yields expressions for the partial directives with respect to z and t as functions of the scaled variables and and the partial derivatives with respect to and . Applying the chain rule to expand the spatial derivative gives
Therefore, given and, from Eq. (B1), ,
Applying the chain rule to expand the time derivative gives
As , and, from Eq. (B1),
Eq. (B4) shows that
B2 Scaled equations
The model equations are modified to account for the change in coordinates by substituting Eqs. (B3) and (B6) into the model equations (Eqs. 12, 14, 15, 17, 18, and 19).
The porosity equation (Eq. 12) becomes
where we also used Eq. (15) to simplify the expression. The stress equation (Eq. 14) becomes
The equation for the velocity gradient (Eq. 15) becomes
The grain-size equation (Eq. 17) becomes
The age equation (Eq. 18) becomes
And finally, the domain thickness equation (Eq. 19) remains
B3 Solution method
These six equations are solved with the method of lines to simulate how the six variables evolve in time and space during simulations. Specifically, the spatial domain is discretized into N−1 grid spaces, connecting N nodes. The four equations above containing time derivatives (Eqs. B7, B10, B11, and B12) are treated as 3N+1 coupled ODEs (3N come from the ϕ, r2, and A equations and one comes from the h equation) using upwind finite difference (Kerschbaum, 2020). The coupled equations are solved simultaneously using the MATLAB ODE solver ode15s. The remaining two equations (Eqs. B8 and B9) provide σ and w values used to compute the time derivatives.
To facilitate comparison between the results from simulations with different domain heights, all depths are converted from back to z with Eq. (B1) before plotting.
In Sect. 3.3 numerical solutions of the full model and inspection of a simplified ODE model (Eq. 27) indicate that firn thickness is independent of accumulation rate when . For completeness, here we show the same result, starting from the full model and not making the simplifying assumptions about the velocity used to derive Eq. (27). This will also demonstrate that this finding is independent of the stress exponent n.
Starting with Eq. (12) and assuming a steady state gives Eq. (22a):
In what follows we derive expressions for w, σ, and r2 in turn, then substitute them into the expression above to show that β disappears when . This is for the same reasons described in the main text: advection of porosity and advection of grain size balance each other.
Combining Eqs. (12) and (15) yields
Assuming a steady state and integrating vertically gives
where C1 is a constant of integration. Given the upper-surface boundary condition on the velocity (; Eq. 15), C1=β, yielding
Integrating Eq. (14) gives
Assuming a steady state in Eq. (17), and for simplicity assuming δ=0, yields
which combined with Eq. (C4) gives
Integrating and rearranging this expression gives
Substituting Eqs. (C4), (C5), and (C8) into Eq. (C1) and assuming leaves
The accumulation rate β appears on both sides of this expression – on the right due to grain-size advection (Eq. C8) and on the left due to porosity advection (Eq. C4). Therefore, β cancels, and what remains is a differential equation for ϕ that is independent of the accumulation rate. This is consistent with the simpler ODE model (Eq. 27) and with the numerical solutions of the full model showing a reduction in sensitivity as decreases (e.g. Fig. 4a). Furthermore, Eq. (C9) indicates that the fact that ϕ does not depend on β in a steady state when is independent of the stress exponent n. This is consistent with the numerical results shown in Fig. 7 (Sect. 3.4).
All the code required to run the model and plot the figures in this paper can be found here: https://doi.org/10.5281/zenodo.5213880 (Kingslake, 2022).
JK and EC initiated the study, CM advised on model physics, RS and JK developed the model and the code, JK led the modelling and writing, and all authors contributed ideas and discussion and helped write the manuscript.
The contact author has declared that none of the authors has any competing interests.
Publisher's note: Copernicus Publications remains neutral with regard to jurisdictional claims in published maps and institutional affiliations.
The authors would like to thank the editor and reviewers for constructive comments that improved the paper. The authors would also like to thank Robert Arthern for useful discussions.
This research has been supported by the Directorate for Geosciences (grant nos. OPP 19-35438 and PSU 5861-CU-NSF-8934).
This paper was edited by Elisa Mantelli and reviewed by C. Max Stevens and one anonymous referee.
Alley, R. B.: Flow-law hypotheses for ice-sheet modeling, J. Glaciol., 38, 245–256, https://doi.org/10.3189/S0022143000003658, 1992. a
Alley, R. B. and Woods, G. A.: Impurity influence on normal grain growth in the GISP2 ice core, Greenland, J. Glaciol., 42, 255–260, https://doi.org/10.3189/S0022143000004111, 1996. a, b
Arnaud, L., Barnola, J. M., and Duval, P.: Physical modeling of the densification of snow/firn and ice in the upper part of polar ice sheets, in: Physics of ice core records, Hokkaido University Press, 285–305, 2000. a
Arthern, R. J. and Wingham, D. J.: The natural fluctuations of firn densification and their effect on the geodetic determination of ice sheet mass balance, Climatic Change, 40, 605–624, 1998. a, b
Arthern, R. J., Vaughan, D. G., Rankin, A. M., Mulvaney, R., and Thomas, E. R.: In situ measurements of Antarctic snow compaction compared with predictions of models, J. Geophys. Res.-Earth, 115, F03011, https://doi.org/10.1029/2009JF001306, 2010. a, b, c, d, e, f, g, h, i, j, k, l, m, n, o, p, q, r
Azuma, N., Miyakoshi, T., Yokoyama, S., and Takata, M.: Impeding effect of air bubbles on normal grain growth of ice, J. Struct. Geol., 42, 184–193, https://doi.org/10.1016/j.jsg.2012.05.005, 2012. a
Buizert, C., Cuffey, K. M., Severinghaus, J. P., Baggenstos, D., Fudge, T. J., Steig, E. J., Markle, B. R., Winstrup, M., Rhodes, R. H., Brook, E. J., Sowers, T. A., Clow, G. D., Cheng, H., Edwards, R. L., Sigl, M., McConnell, J. R., and Taylor, K. C.: The WAIS Divide deep ice core WD2014 chronology – Part 1: Methane synchronization (68–31 ka BP) and the gas age–ice age difference, Clim. Past, 11, 153–173, https://doi.org/10.5194/cp-11-153-2015, 2015. a, b
Buizert, C., Fudge, T. J., Roberts, W. H. G., Steig, E. J., Sherriff-Tadano, S., Ritz, C., Lefebvre, E., Edwards, J., Kawamura, K., Oyabu, I., Motoyama, H., Kahle, E. C., Jones, T. R., Abe-Ouchi, A., Obase, T., Martin, C., Corr, H., Severinghaus, J. P., Beaudette, R., Epifanio, J. A., Brook, E. J., Martin, K., Chappellaz, J., Aoki, S., Nakazawa, T., Sowers, T. A., Alley, R. B., Ahn, J., Sigl, M., Severi, M., Dunbar, N. W., Svensson, A., Fegyveresi, J. M., He, C., Liu, Z., Zhu, J., Otto-Bliesner, B. L., Lipenkov, V. Y., Kageyama, M., and Schwander, J.: Antarctic surface temperature and elevation during the Last Glacial Maximum, Science, 372, 1097–1101, https://doi.org/10.1126/science.abd2897, 2021. a, b, c, d
Case, E. and Kingslake, J.: Phase-sensitive radar as a tool for measuring firn compaction, J. Glaciol., 68, 139–152, https://doi.org/10.1017/jog.2021.83, 2021. a, b, c, d, e, f, g, h
Cuffey, K. M. and Paterson, W. S. B.: The Physics of Glaciers, Academic Press, google-Books-ID: Jca2v1u1EKEC, 2010. a, b
Dalaiden, Q., Goosse, H., Klein, F., Lenaerts, J. T. M., Holloway, M., Sime, L., and Thomas, E. R.: How useful is snow accumulation in reconstructing surface air temperature in Antarctica? A study combining ice core records and climate models, The Cryosphere, 14, 1187–1207, https://doi.org/10.5194/tc-14-1187-2020, 2020. a, b
Duval, P. and Castelnau, O.: Dynamic Recrystallization of Ice in Polar Ice Sheets, J. Physique IV, 05, C3–205, https://doi.org/10.1051/jp4:1995317, 1995. a
Frieler, K., Clark, P. U., He, F., Buizert, C., Reese, R., Ligtenberg, S. R. M., van den Broeke, M. R., Winkelmann, R., and Levermann, A.: Consistent evidence of increasing Antarctic accumulation with warming, Nat. Clim. Change, 5, 348–352, https://doi.org/10.1038/nclimate2574, 2015. a, b
Gilbert, E. and Kittel, C.: Surface Melt and Runoff on Antarctic Ice Shelves at 1.5° C, 2° C, and 4° C of Future Warming, Geophys. Res. Lett., 48, e2020GL091733, https://doi.org/10.1029/2020GL091733, 2021. a
Gow, A. J.: On the Rates of Growth of Grains and Crystals in South Polar Firn, J. Glaciol., 8, 241–252, https://doi.org/10.3189/S0022143000031233, 1969. a, b, c
Groot Zwaaftink, C. D., Cagnati, A., Crepaz, A., Fierz, C., Macelloni, G., Valt, M., and Lehning, M.: Event-driven deposition of snow on the Antarctic Plateau: analyzing field measurements with SNOWPACK, The Cryosphere, 7, 333–347, https://doi.org/10.5194/tc-7-333-2013, 2013. a
Helsen, M. M., van den Broeke, M. R., van de Wal, R. S. W., van de Berg, W. J., van Meijgaard, E., Davis, C. H., Li, Y., and Goodwin, I.: Elevation Changes in Antarctica Mainly Determined by Accumulation Variability, Science, 320, 1626–1629, https://doi.org/10.1126/science.1153894, 2008. a, b, c
Herron, M. M. and Langway, C. C.: Firn Densification: An Empirical Model, J. Glaciol., 25, 373–385, https://doi.org/10.3189/S0022143000015239, 1980. a, b, c, d, e, f, g, h, i
Horlings, A. N., Christianson, K., Holschuh, N., Stevens, C. M., and Waddington, E. D.: Effect of horizontal divergence on estimates of firn-air content, J. Glaciol., 67, 287–296, https://doi.org/10.1017/jog.2020.105, 2021. a, b
Jenkins, A., Corr, H. F. J., Nicholls, K. W., Stewart, C. L., and Doake, C. S. M.: Interactions between ice and ocean observed with phase-sensitive radar near an Antarctic ice-shelf grounding line, J. Glaciol., 52, 325–346, https://doi.org/10.3189/172756506781828502, 2006. a
Jun, L., Jacka, T. H., and Morgan, V.: Crystal-size and microparticle record in the ice core from Dome Summit South, Law Dome, East Antarctica, Ann. Glaciol., 27, 343–348, https://doi.org/10.3189/1998AoG27-1-343-348, 1998. a, b
Kerschbaum, S.: Backstepping Control of Coupled Parabolic Systems with Varying Parameters: A Matlab Library, Zenodo [code], https://doi.org/10.5281/zenodo.4274740, 2020. a
Kingslake, J.: ldeo-glaciology/firn_accumulation_model: finalized after second revisions (v1.2), Zenodo [code], https://doi.org/10.5281/zenodo.6941578, 2022. a
Kipfstuhl, S., Faria, S. H., Azuma, N., Freitag, J., Hamann, I., Kaufmann, P., Miller, H., Weiler, K., and Wilhelms, F.: Evidence of dynamic recrystallization in polar firn, J. Geophys. Res.-Sol. Ea., 114, B05204, https://doi.org/10.1029/2008JB005583, 2009. a, b, c
Kittel, C., Amory, C., Agosta, C., Jourdain, N. C., Hofer, S., Delhasse, A., Doutreloup, S., Huot, P.-V., Lang, C., Fichefet, T., and Fettweis, X.: Diverging future surface mass balance between the Antarctic ice shelves and grounded ice sheet, The Cryosphere, 15, 1215–1236, https://doi.org/10.5194/tc-15-1215-2021, 2021. a, b
Li, J. and Zwally, H. J.: Modeling the density variation in the shallow firn layer, Ann. Glaciol., 38, 309–313, https://doi.org/10.3189/172756404781814988, 2004. a
Li, J. and Zwally, H.: Response times of ice-sheet surface heights to changes in the rate of Antarctic firn compaction caused by accumulation and temperature variations, J. Glaciol., 61, 1037–1047, https://doi.org/10.3189/2015JoG14J182, 2015. a, b, c
Ligtenberg, S. R. M., Helsen, M. M., and van den Broeke, M. R.: An improved semi-empirical model for the densification of Antarctic firn, The Cryosphere, 5, 809–819, https://doi.org/10.5194/tc-5-809-2011, 2011. a, b
Lundin, J. M. D., Stevens, C. M., Arthern, R., Buizert, C., Orsi, A., Ligtenberg, S. R. M., Simonsen, S. B., Cummings, E., Essery, R., Leahy, W., Harris, P., Helsen, M. M., and Waddington, E. D.: Firn Model Intercomparison Experiment (FirnMICE), J. Glaciol., 63, 401–422, https://doi.org/10.1017/jog.2016.114, 2017. a
Mathiesen, J., Ferkinghoff-Borg, J., Jensen, M. H., Levinsen, M., Olesen, P., Dahl-Jensen, D., and Svensson, A.: Dynamics of crystal formation in the Greenland NorthGRIP ice core, J. Glaciol., 50, 325–328, https://doi.org/10.3189/172756504781829873, 2004. a, b
Medley, B., Neumann, T. A., Zwally, H. J., and Smith, B. E.: Forty-year Simulations of Firn Processes over the Greenland and Antarctic Ice Sheets, The Cryosphere Discuss. [preprint], https://doi.org/10.5194/tc-2020-266, in review, 2020. a, b, c
Meyer, C. R. and Hewitt, I. J.: A continuum model for meltwater flow through compacting snow, The Cryosphere, 11, 2799–2813, https://doi.org/10.5194/tc-11-2799-2017, 2017. a
Meyer, C. R., Keegan, K. M., Baker, I., and Hawley, R. L.: A model for French-press experiments of dry snow compaction, The Cryosphere, 14, 1449–1458, https://doi.org/10.5194/tc-14-1449-2020, 2020. a
Montgomery, L., Koenig, L., and Alexander, P.: The SUMup dataset: compiled measurements of surface mass balance components over ice sheets and sea ice with analysis over Greenland, Earth Syst. Sci. Data, 10, 1959–1985, https://doi.org/10.5194/essd-10-1959-2018, 2018. a, b, c
Parrenin, F., Barker, S., Blunier, T., Chappellaz, J., Jouzel, J., Landais, A., Masson-Delmotte, V., Schwander, J., and Veres, D.: On the gas-ice depth difference (Δdepth) along the EPICA Dome C ice core, Clim. Past, 8, 1239–1255, https://doi.org/10.5194/cp-8-1239-2012, 2012. a
Roessiger, J., Bons, P. D., Griera, A., Jessell, M. W., Evans, L., Montagnat, M., Kipfstuhl, S., Faria, S. H., and Weikusat, I.: Competition between grain growth and grain-size reduction in polar ice, J. Glaciol., 57, 942–948, https://doi.org/10.3189/002214311798043690, Press, 2011. a, b, c
Schoof, C. and Hewitt, I.: Ice-Sheet Dynamics, Ann. Rev. Fluid. Mech., 45, 217–239, https://doi.org/10.1146/annurev-fluid-011212-140632, 2013. a
Schwander, J. and Stauffer, B.: Age difference between polar ice and the air trapped in its bubbles, Nature, 311, 45–47, https://doi.org/10.1038/311045a0, 1984. a
Smith, B., Fricker, H. A., Gardner, A. S., Medley, B., Nilsson, J., Paolo, F. S., Holschuh, N., Adusumilli, S., Brunt, K., Csatho, B., Harbeck, K., Markus, T., Neumann, T., Siegfried, M. R., and Zwally, H. J.: Pervasive ice sheet mass loss reflects competing ocean and atmosphere processes, Science, 368, 1239–1242, https://doi.org/10.1126/science.aaz5845, 2020. a
Stevens, C. M., Verjans, V., Lundin, J. M. D., Kahle, E. C., Horlings, A. N., Horlings, B. I., and Waddington, E. D.: The Community Firn Model (CFM) v1.0, Geosci. Model Dev., 13, 4355–4377, https://doi.org/10.5194/gmd-13-4355-2020, 2020. a, b, c, d
van den Broeke, M.: Depth and Density of the Antarctic Firn Layer, Arctic Antarct. Alp. Res., 40, 432–438, https://doi.org/10.1657/1523-0430(07-021)[BROEKE]2.0.CO;2, 2008. a
Zwally, H. J. and Jun, L.: Seasonal and interannual variations of firn densification and ice-sheet surface elevation at the Greenland summit, J. Glaciol., 48, 199–207, https://doi.org/10.3189/172756502781831403, 2002. a, b, c, d
- Abstract
- Introduction
- Methods
- Results
- Discussion
- Conclusions and future work
- Appendix A: Derivation of the kinematic surface boundary condition
- Appendix B: Change of coordinates and numerical method
- Appendix C: Accumulation independence of the full model when
- Code availability
- Author contributions
- Competing interests
- Disclaimer
- Acknowledgements
- Financial support
- Review statement
- References