the Creative Commons Attribution 4.0 License.
the Creative Commons Attribution 4.0 License.
 | 08 Aug 2022
Ongoing grounding line retreat and fracturing initiated at the Petermann Glacier ice shelf, Greenland, after 2016
Romain Millan
Jeremie Mouginot
Anna Derkacheva
Eric Rignot
Pietro Milillo
Enrico Ciraci
Luigi Dini
Anders Bjørk
The Petermann ice shelf is one of the largest in Greenland, buttressing 4 % of the total ice sheet discharge, and is considered dynamically stable. In this study, we use differential synthetic aperture radar interferometry to reconstruct the grounding line migration between 1992 and 2021. Over the last 30 years, we find that the grounding line of Petermann retreated 4 km in the western and eastern sectors and 7 km in the central part. The majority of the retreat in the central sector took place between 2017 and 2021, where the glacier receded more than 5 km along a retrograde bed grounded 500 m below sea level. While the central sector stabilized on a sill, the eastern flank is sitting on top of a down-sloping bed, which might enhance the glacier retreat in the coming years. This grounding line retreat followed a speedup of the glacier by 15 % in the period 2015–2018. Along with the glacier acceleration, two large fractures formed along flow in 2015, splitting the ice shelf in three sections, with a partially decoupled flow regime. While these series of events followed the warming of the ocean waters by 0.3 ∘C in Nares Strait, the use of a simple grounding line model suggests that enhanced submarine melting may have been responsible for the recent grounding line migration of Petermann Glacier.
- Article
(12985 KB) - Full-text XML
-
Supplement
(294 KB) - BibTeX
- EndNote


The Greenland Ice Sheet (GrIS) is a main contributor to sea level rise at present (Reager et al., 2016; Mouginot et al., 2019; The IMBIE Team, 2020), and its contribution is expected to increase in the coming years (e.g., Choi et al., 2021). While the vast majority of Greenland marine-terminating glaciers do not end in extensive floating extensions, ∼ 18 % of Greenland's total ice volume is buttressed by ice shelves in the north (Mouginot et al., 2019; Morlighem et al., 2017). It is of prime importance to document the evolution of these ice shelves as their weakening may destabilize this sector and significantly increase the contribution of GrIS to sea level rise (Mouginot et al., 2015). Indeed, enhanced submarine melting (Wilson et al., 2017) and deep rheological damaging (Lhermitte et al., 2020) have the potential to reduce the buttressing effect of glaciers, triggering increased rates of mass losses through dynamic ice discharge.
Petermann Glacier is located on the northwestern part of the GrIS and ends in the second largest floating extension after Nioghalfjerdfjorden glacier, with a length of 70 km in the 1990s and a width of 20 km. Since 1995, this glacier seems to have increased its ice discharge from 10.6 up to 11.7 ± 1.2 Gt yr−1 in 2018 (Mouginot et al., 2019). Recent studies using Worldview digital elevation models (DEMs) revealed submarine melt rates near the glacier grounding line that exceed 50 m yr−1 (Wilson et al., 2017). The grounding line is one of the most sensitive regions of a glacier as its migration significantly modulates the ice shelf resistance to flow (Fürst et al., 2016; Reese et al., 2018; Thomas, 1979). Satellite radar interferometry data from the European Remote Sensing satellites (ERS-1 and ERS-2) were used to map the grounding line of Petermann Glacier in the 1990s and detect its migration between 1992 and 2011 (Rignot, 1996 Hogg et al., 2016). From these observations, it was concluded that the long-term changes in grounding line locations on Petermann Glacier were indistinguishable from tidal fluctuations, despite the reported thinning of the ice shelf (Wilson et al., 2017; Rückamp et al., 2019; Münchow et al., 2014). Petermann Glacier also lost about half of its floating extension via two large calving events in 2010 and 2012. The glacier showed a limited velocity response to these calving events (Hill et al., 2021; Rückamp et al., 2019), suggesting it was still dynamically stable. Hill et al. (2021) proposed, however, that if future calving occurs within 12 km of the grounding line, the changes in the ice shelf buttressing would be sufficient for the glacier to accelerate substantially.
Since 2011, no extensive grounding line mapping of Petermann Glacier has been conducted (Hogg et al., 2016). Nevertheless, with the launches in 2014 and 2016 of a constellation of two Sentinel-1 (S1) C-band synthetic aperture radar satellites by the European Space Agency (ESA) for the European Copernicus initiative, the opportunity to document the dynamics and the grounding line position of Petermann exists (Milillo et al., 2019; Mohajerani et al., 2021). Following recommendations by the Polar Space Task Group under the umbrella of the World Meteorological Organization, Sentinel-1 has continuously acquired since June 2015 a set of six tracks that cover the entire coast of Greenland, hence providing a systematic and comprehensive coverage at a revisit time of 6 d. This continuous observation record has made it possible to map the grounding lines of ice shelves in a more comprehensive and systematic way. Indeed, S1 allows us to not only map the grounding line again since ERS-1, but on multiple occasions, several times a year, which provides information about the zone of short-term migration or grounding zone (Mohajerani et al., 2021) and its long-term evolution. In addition to S1, the Agenzia Spaziale Italiana's COSMO-SkyMed® satellite constellation (X-band synthetic aperture radar) has acquired 1 d repeat pass data over Petermann Glacier in 2013 and 2020, hence providing a complementary and high-resolution coverage of Petermann's grounding line.
Here, we present the grounding line history of Petermann Glacier, spanning between 1992 and 2021, or 30 years. We combine satellite radar interferometry and optical imagery to track both the grounding line and the change in ice velocity of the glacier. We also examine concurrent changes in the ocean waters surrounding the glacier. Finally, we conclude on the evolution of the glacier grounding line and its consequences for the future years.
2.1 Grounding line positions
We use interferometric synthetic aperture radar (InSAR) data from the ESA's ERS radar satellites acquired in 1992 and 2011 with a 3 d revisit time in 1995/1996 from the ERS-1 and ERS-2 tandem mission and in 2011 from a 3 d revisit time ERS-2 mission ending. Data are downloaded via the ESA Online Dissemination Service as Single Look Complex (SLC) scenes and processed using the GAMMA Software (Werner et al., 2000). We measure the tide-induced vertical motion of ice using a quadruple differential SAR interferometry approach (QDInSAR) (Rignot et al., 2011). In order to maintain good phase coherence in fast-flowing regions, we first coregister SLC data by estimating the pixel offset using classical speckle tracking technique (Michel and Rignot, 1999; Scheuchl et al., 2016). Interferograms are then assembled by calculating the phase difference between the two coregistered SLCs. To obtain the grounding line position, we combine two interferograms spanning the same time interval, correct for topography, and differentiate them (Rignot et al., 2011). We use the GIMP v1 DEM time-tagged in 2007 to remove the topographic signal (Howat et al., 2014).

Figure 1(a) Satellite-derived surface flow velocity of Petermann Glacier's ice shelf color coded on a logarithmic scale from brown to red. Dashed white line indicates the location of velocity profiles (see Fig. 3). Inset map shows the location of Petermann ice shelf over the ice velocity map of the Greenland Ice Sheet (Mouginot et al., 2019). (b) Bedrock geometry from BedMachine v3 on a blue color scale (Morlighem et al., 2017). Lines T1, T2, T3, and T4 are used in Fig. 3a to show the evolution of the grounding line position over time. Solid color lines in panels (a) and (b) indicate the position of the QDInSAR grounding lines between 1992 and the present and are color coded on a scale from white (1992) to red (2021).
For the time period 2014 to 2021, we use observations collected by S1 with a repeat cycle of 6 to 12 d in Interferometric Wide (IW) swath mode, a Terrain Observation with Progressive Scans SAR (TOPSAR) mode. In order to avoid phase jumps at burst boundaries, interferograms from this sensor are processed using a precise TOPS coregistration methods, which also registers the Doppler history of the slave data (Scheuchl et al., 2016). We use the GIMP DEM v2 time-tagged in 2014 to correct for the topographic phase for S1 (Howat et al., 2017). For both ERS-1/2 and S1, the differential interferograms are formed after geocoding the interferograms in geographic coordinates (north polar stereographic projection) at 25 m posting. As in Rignot et al. (2014), we map the inward limit of detection of vertical motion, where the glacier first lifts off its bed.
To complement the S1 data in 2020 and 2021, we use high-resolution observation of the grounding line from COSMO-SkyMed® (CSK). CSK grounding line measurements use two satellites (CSK2 and CKS4) each with a 16 d repeat cycle. The temporal baseline between CSK2 and CSK4 is 1 d. In order to avoid changes in the horizontal velocity of the glacier, we combine a double-difference interferogram using two 1 d interferograms acquired 16 d apart. CSK acquires in Stripmap mode three consecutive frames to cover the entire glacier and its ice shelf. We stitch all the frames in order to combine a single SLC covering a 40×120 km swath. Following the approach described in Milillo et al. (2017) and Brancato et al. (2020), we apply eight looks in both range and azimuth to improve InSAR phase coherence. The final geocoded product has a resolution of 25×25 m. As for the S1 case, we use the GIMP v2 DEM to remove the topographic signal. Finally, the grounding line is characterized using the same QDInSAR approach, by differencing two interferograms, in the vicinity of the flexure zone, as for ERS-1/2 and S1 data (see above). We document in Supplement Table S1 the complete list of interferograms used to map the grounding line.
2.2 Ice velocity
In addition to the migration of the grounding line, we monitor the evolution of glacier velocity by calculating the surface displacement from four different satellite sensors using images collected between 2013 and 2021. Three of them, ESA's Sentinel-2 (S2) and NASA's Landsat-7 (L7) and Landsat-8 (L8), are optical imagers and one, ESA's S1, is a synthetic aperture radar. We use persistent surface features or speckle to map ice displacements between two consecutive images. We calculate the normalized cross correlations between the reference and slave image chips using repeat cycles shorter than 30 d for L7/8 and S2 and 12 d for S1 (Mouginot et al., 2017; Millan et al., 2019, 2022a). Between 1999 and 2012 we supplement our L7 ice velocity record with repeat cycles ranging from 336 to 400 d. For L7/L8, S2, and S1, sub-images of 32×32, 32×32, and 192×48 pixels are used, respectively. We calibrate our displacement maps by taking advantage of the ice velocity products from prior surveys in Mouginot et al. (2017). The final calibrated maps are resampled to 150 m posting in the north polar stereographic projection (EPSG:3413). The time series established is completed by historical measurements made from ERS-1/2, RADARSAT-1, ALOS PALSAR, Envisat ASAR, Landsat-4 to 7, and TerraSAR-X (Mouginot et al., 2019; Derkacheva et al., 2020; Joughin et al., 2018). The satellite-derived measurements between 2015 and 2021 are post-processed with locally weighted polynomial regression (Derkacheva et al., 2020) to improve the signal-to-noise ratio and data redundancy. Relative changes in velocity are measured from the 2014–2015 winter mean velocity (January to March).
In order to monitor changes in rates of ice deformation, we derive the evolution of the shear strain rate for 2000 and 2019 using annual ice velocity mosaics (Mouginot et al., 2019). The choice of these two periods is made according to the quality of the surface flow velocity product and to cover time periods preceding and following large events of grounding line migrations (see Sect. 3.1). Strain rates were retrieved using the same methodology as described in Alley et al. (2018), where the shear strain rate is defined as
where , , and are the components of the strain rate tensor, calculated from the two components of the ice velocity field (Nye, 1959), and α is the flow angle, defined counterclockwise from the x axis (positive in the x direction) (Alley et al., 2018).
3.1 Grounding line evolution
We formed more than 800 quadruple difference interferograms, with 90 % from S1 while the rest was acquired from ERS and CSK, which allows grounding line monitoring at a high temporal frequency. Overall, we manually digitized 161 of the total number of interferograms (see Supplement Table S1). In summer, decorrelation due to surface melting prevents us from mapping the grounding line on most interferograms. Differential interferograms and grounding lines are shown in Fig. 2 for 1992, 1996, 2011, 2015, 2016, and every year from 2018 to 2021. For every single year, we display all the grounding line locations, which allows us to document its interannual spatial variability caused, for example, by oceanic tides.
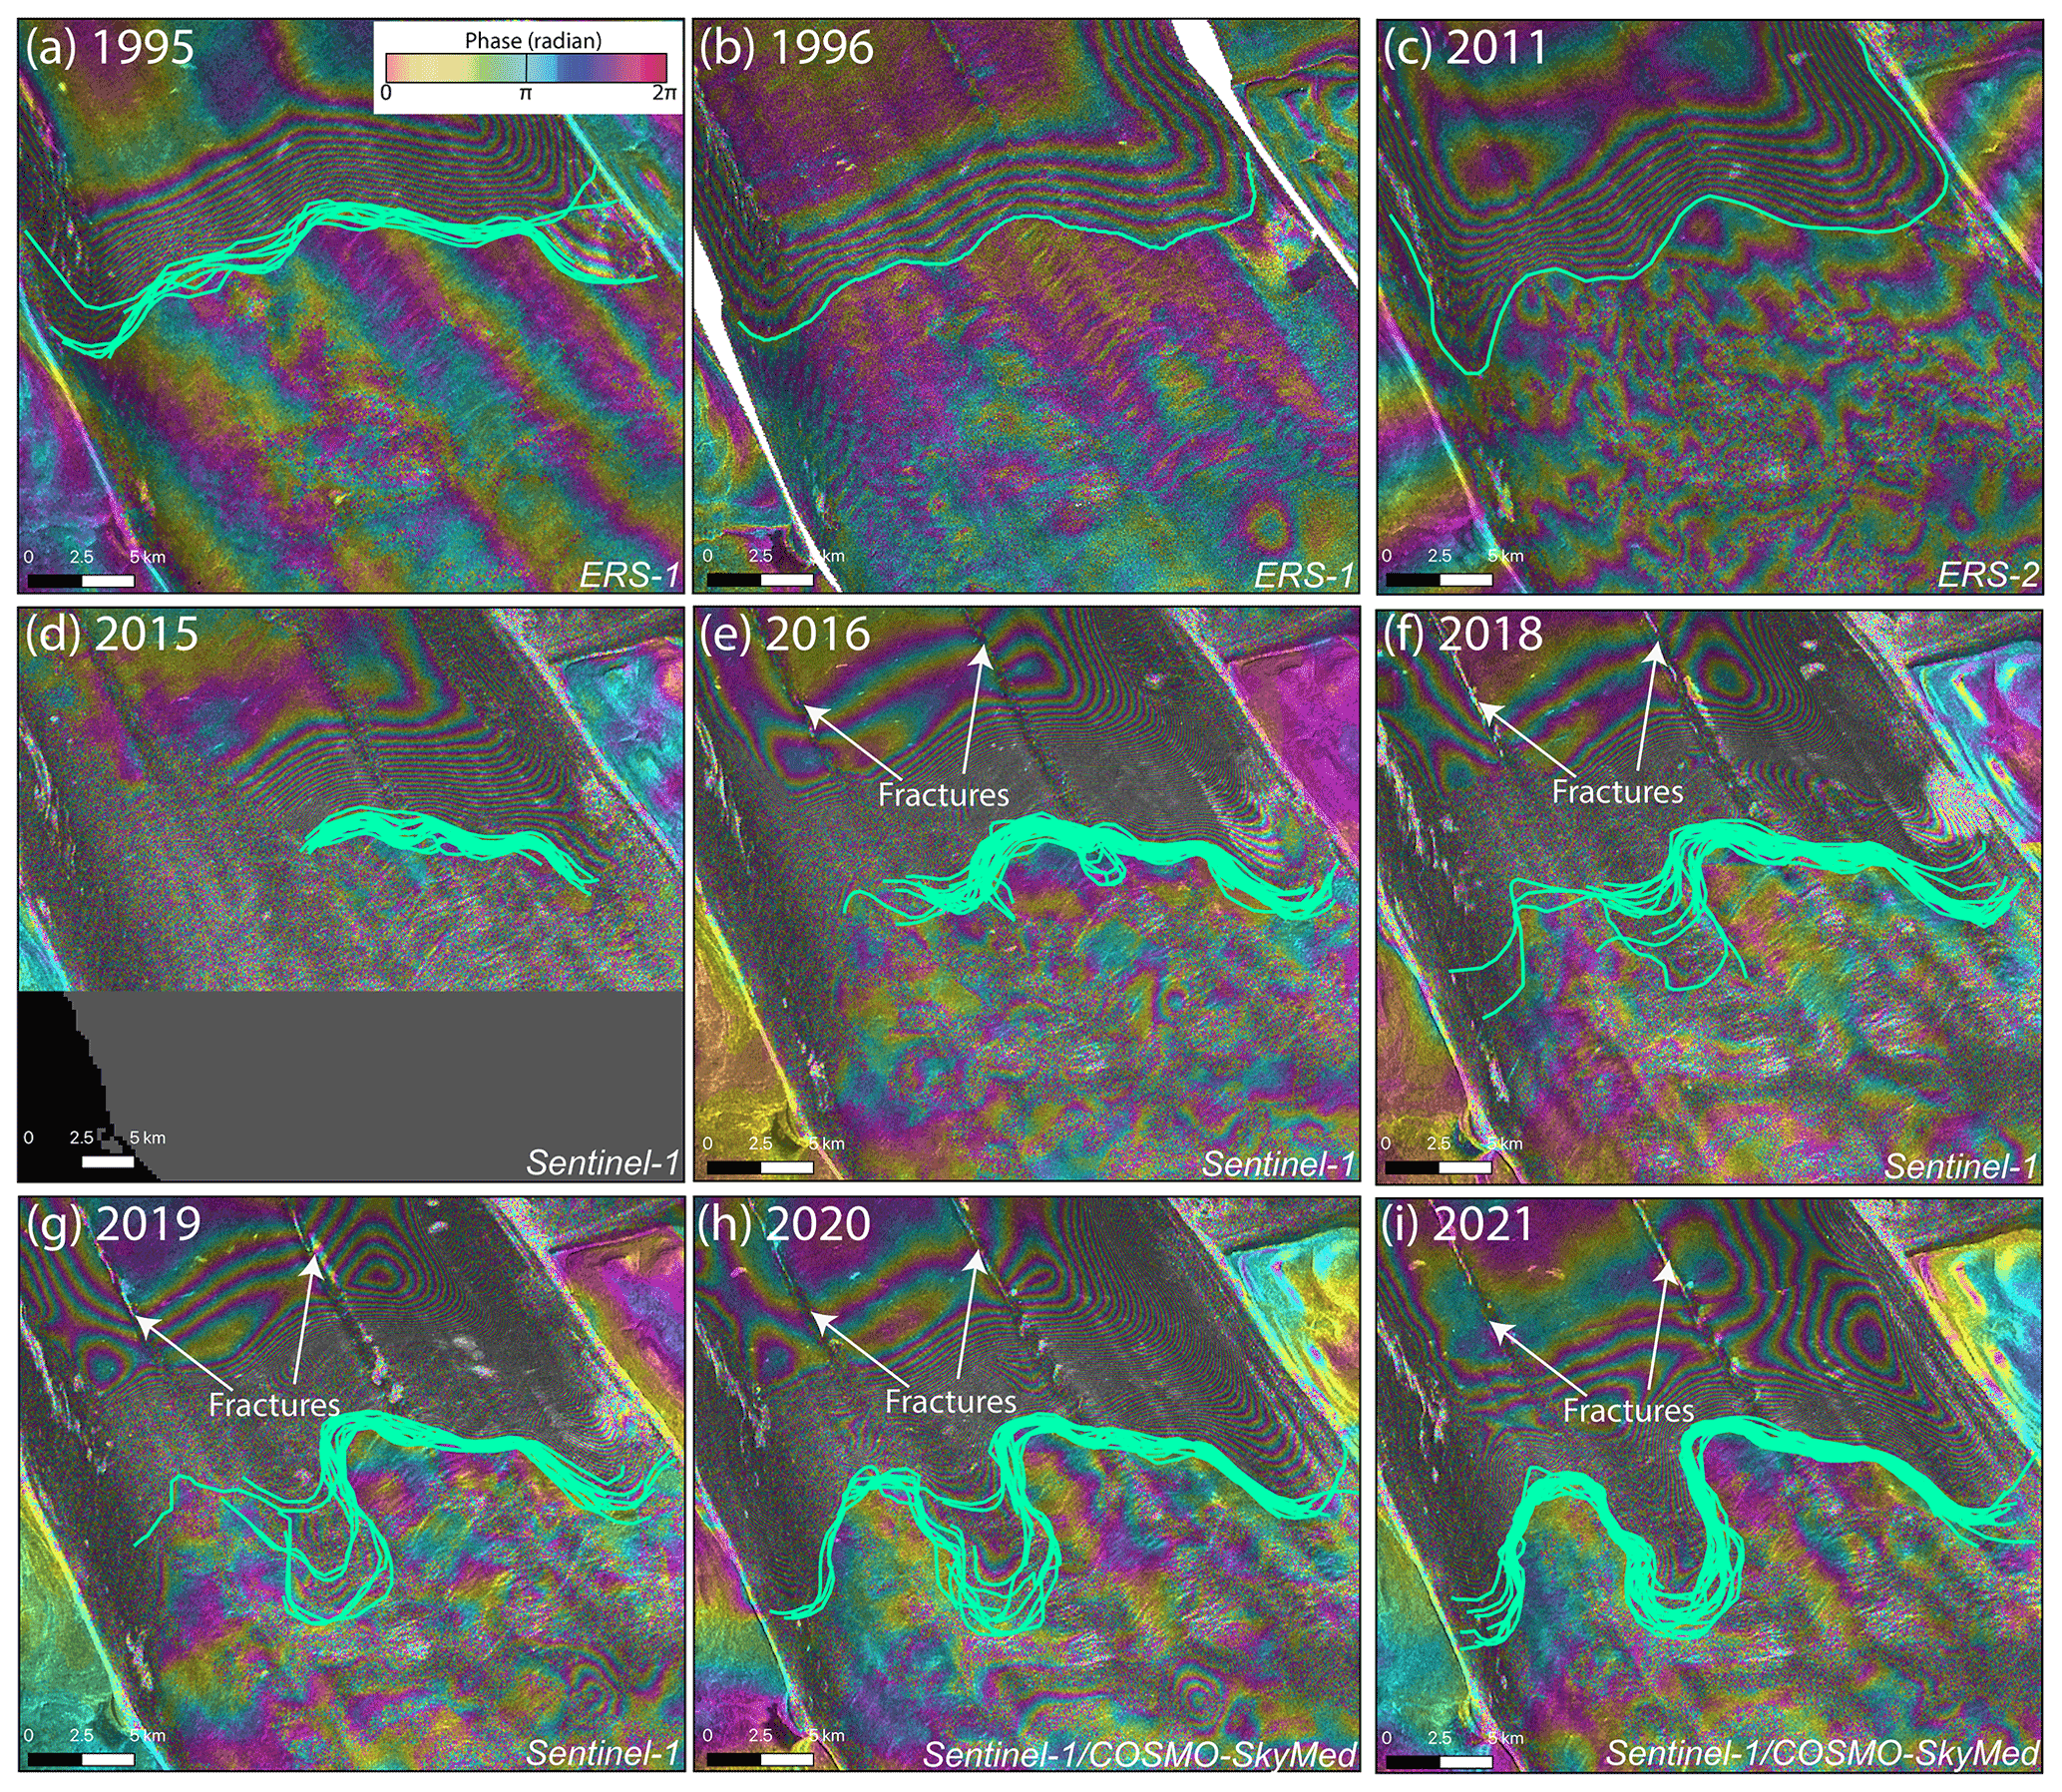
Figure 2Selection of double-difference SAR interferograms of Petermann Glacier, Greenland, collected between 1992 and 2021. Solid light green lines indicate the digitized grounding line positions for a given year. White arrows show the location of across-shelf fractures.
The high number of ERS and S1 double-difference interferograms allows us to provide a rough quantification of the grounding zone width of the glacier, which averaged 550 m in 1992 and 630 m in 2015, before the glacier started to retreat substantially (Fig. 3a). Considering an error in grounding line delineation of 110 m (Mohajerani et al., 2021), these estimates are consistent with those of Hogg et al. (2016) with 470 m in 1992–2011. In 1992, the grounding line position of Petermann Glacier was located 70 km from the ice front and remained relatively stable until 2011, meaning that it did not exceed variations induced by tidal modulations (Figs. 2, 3). Between the period 1992–2011 and 2016, the western (T1) and eastern (T4) margins of the grounding line retreated by 3 km. During the same time frame, we observe a retreat of 2 and 1.1 km along transects T2 and T3, respectively (Figs. 2 and 3). In 2015–2017, we were only able to map the central and eastern portion of the grounding line.
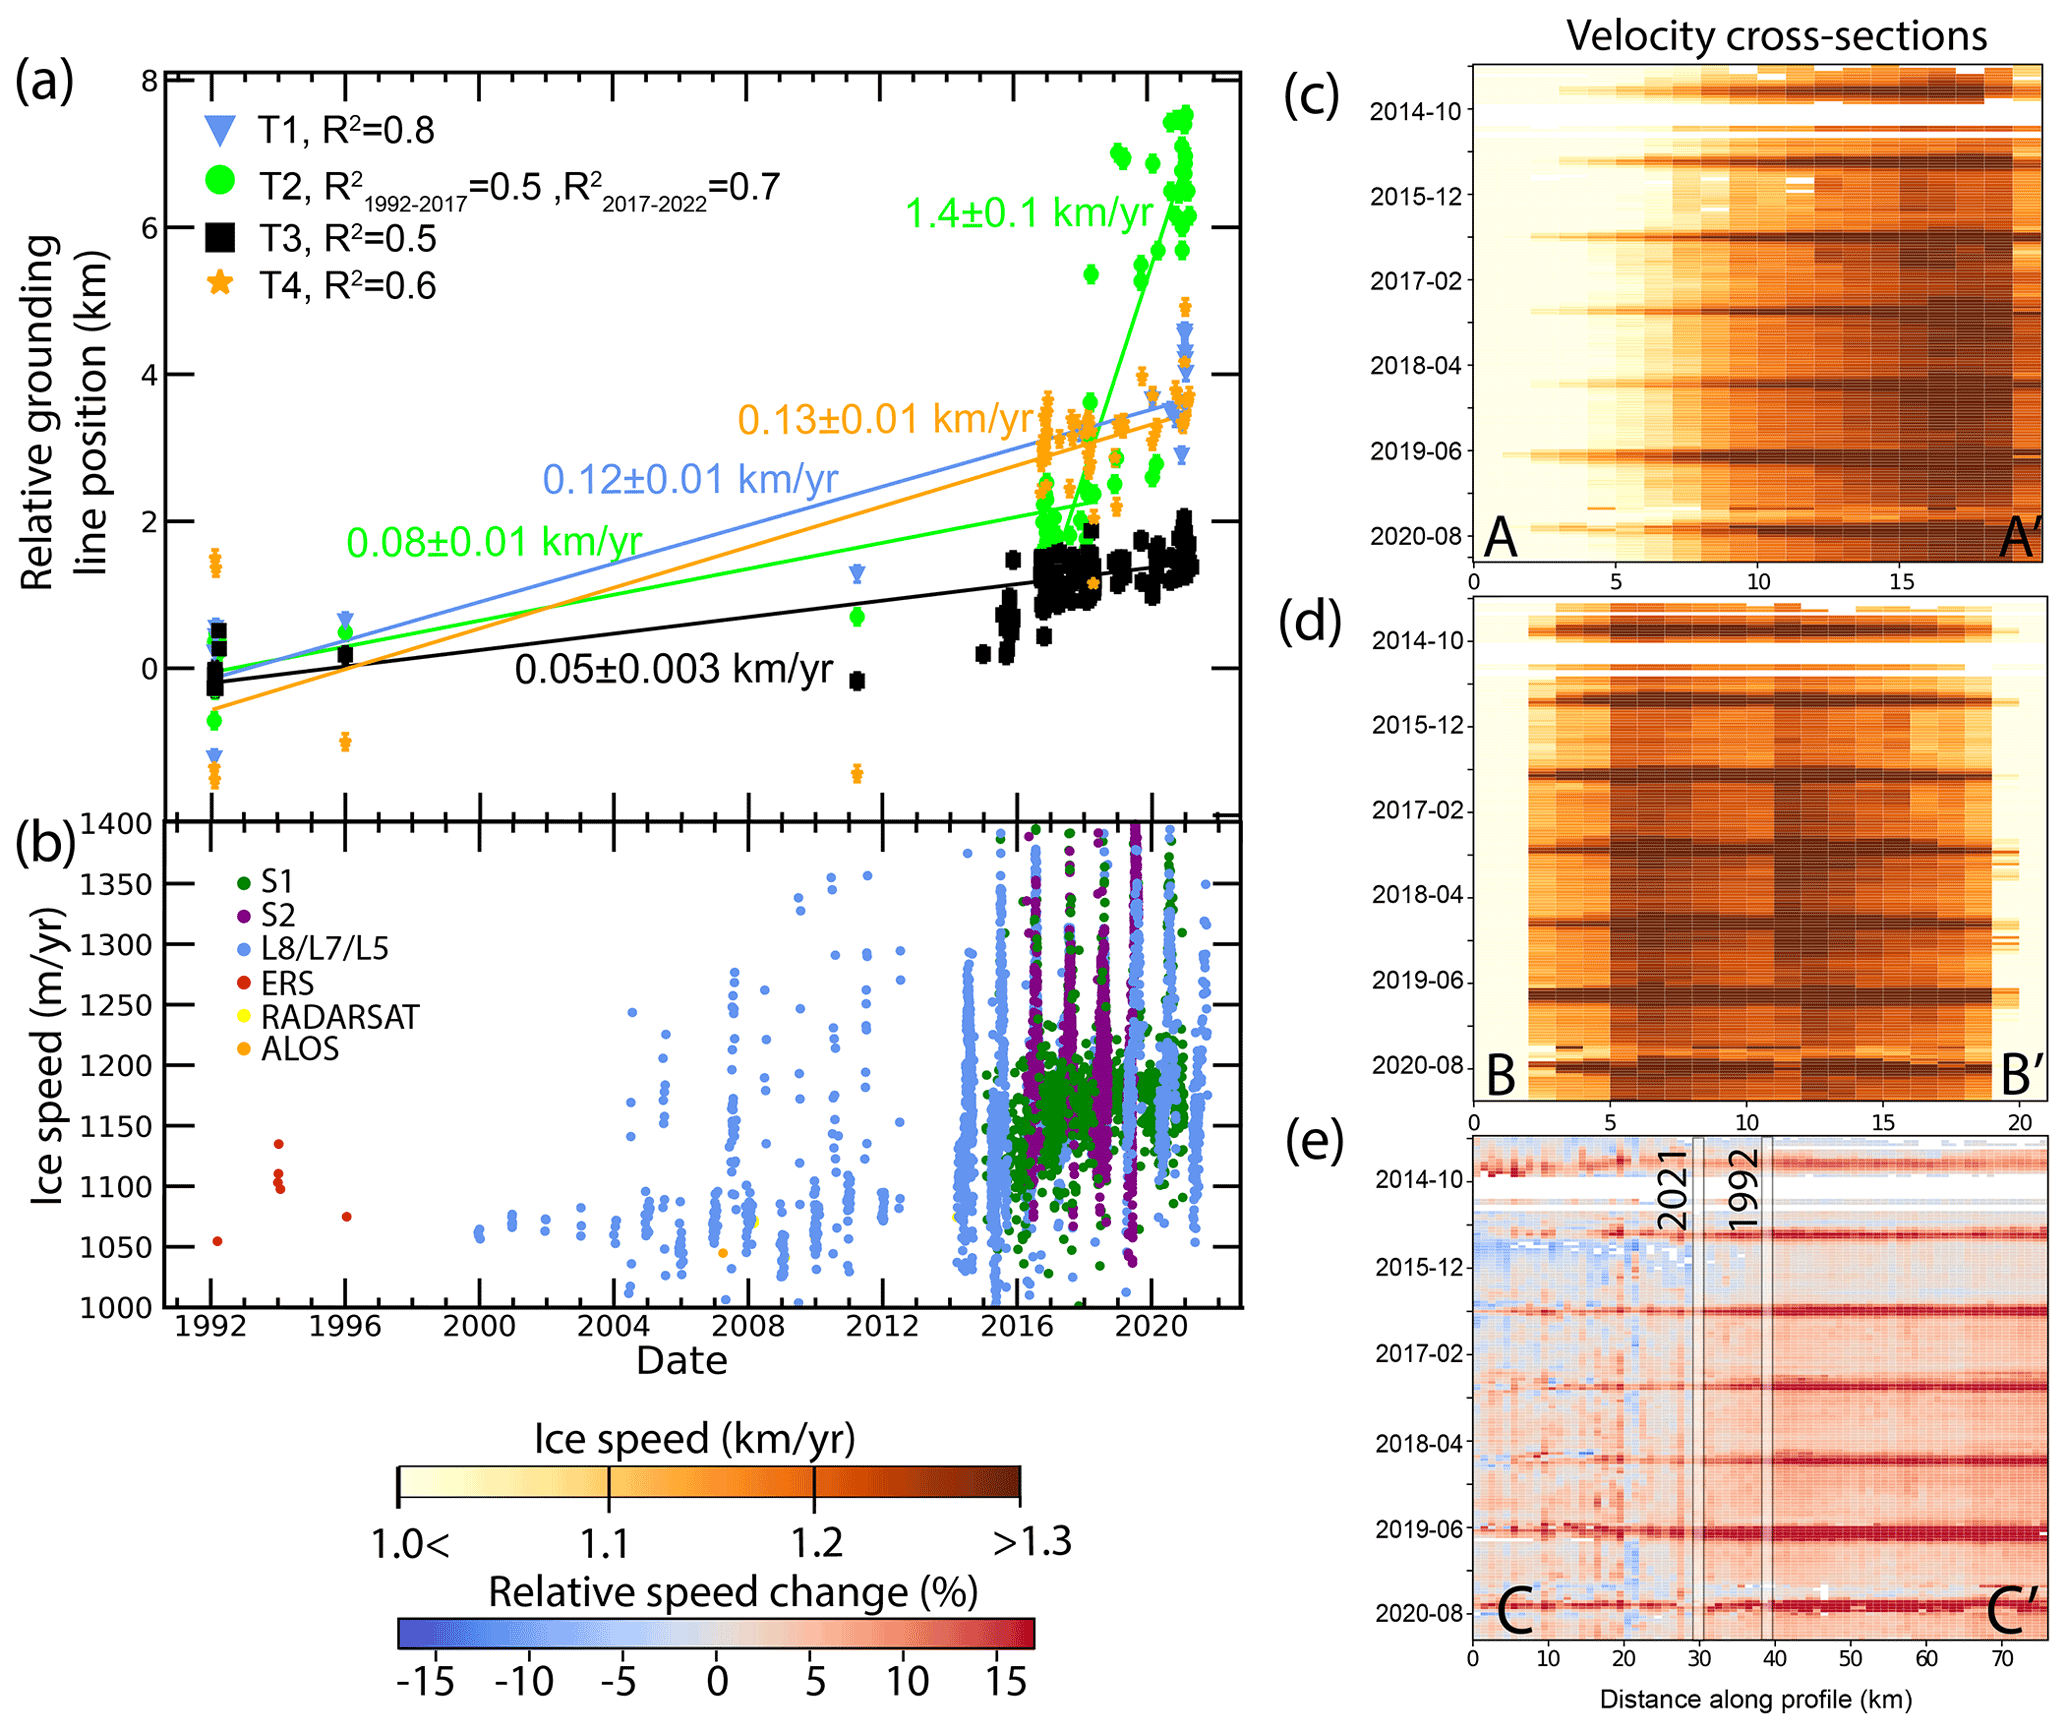
Figure 3Relative grounding line position and change in ice speed of Petermann Glacier. (a) Relative grounding line position with respect to the location in February 1992 for four locations across Petermann's width (see profiles T1 to T4 in Fig. 1b). Slopes of each linear fit (indicating the rate of grounding line retreat) are shown in the same color as each line along with standard errors on the slope. R2 values are given for all linear fit and are shown in the legend. (b) Long-term change in ice flow velocity at the grounding line; (c, d) Hovmöller diagram of velocity at the cross sections A–A′ and B–B′ (see Fig. 1a). (e) Percentage change in speed relative to the 2014 winter average along profile C–C′. The vertical lines indicate the position of the 1992 and 2021 grounding lines on the profile C–C′.
Between 2017 and 2019, the grounding line position along the central transect T2 retreated by more than 4 km, while the rest of the grounding line remained relatively stable. Between 2019 and 2021, the retreat continued along T2 and the glacier retreated by another kilometer (Figs. 2 and 3), for a total retreat of 7 km compared to 1992. Within the same timeframe, the eastern (T4) and western (T1) sections of the grounding line retreated by 1 km, for a total retreat 4 km each, since 1992.
3.2 Ice shelf shear fracturing
In addition to the grounding line signature in the differential interferograms, we note the formation between 1992 and 1996 of a decorrelation structure in the eastern side of the shelf parallel to the flow direction (Fig. 2b), which seems associated with the development of fractures. The fracture zones are manifest in the interferograms as regions of abrupt discontinuity in phase, indicating that the two sides of the fractures are not flexing exactly at the same pace, hence suggesting deep crevasses rather than surface cracks. In 2011, another parallel fracture zone is visible in the western end of the ice shelf (Fig. 2d–e). Between 2016 and present, these features became more pronounced and now extend on both sides of the grounding line section that retreated (Fig. 2e–i). The surface manifestation of these fractures is also visible using optical imagery from L7/8 (Fig. 4c–d), with two distinct and large crevasses developing on the shelf. Using insights from calculated strain rates, it is clearly visible that the development of these fractures corresponds to regions of particularly high shear (Fig. 4a, b). Indeed, while the shear along the eastern fracture averaged −0.02 yr−1 in 2000, it doubled to −0.04 yr−1 in 2019. On the other hand, the fracture on the western side of the grounding line is a region of particularly high shear with a measured shear strain rate of up to −0.08 yr−1 in 2019 (Fig. 4b).
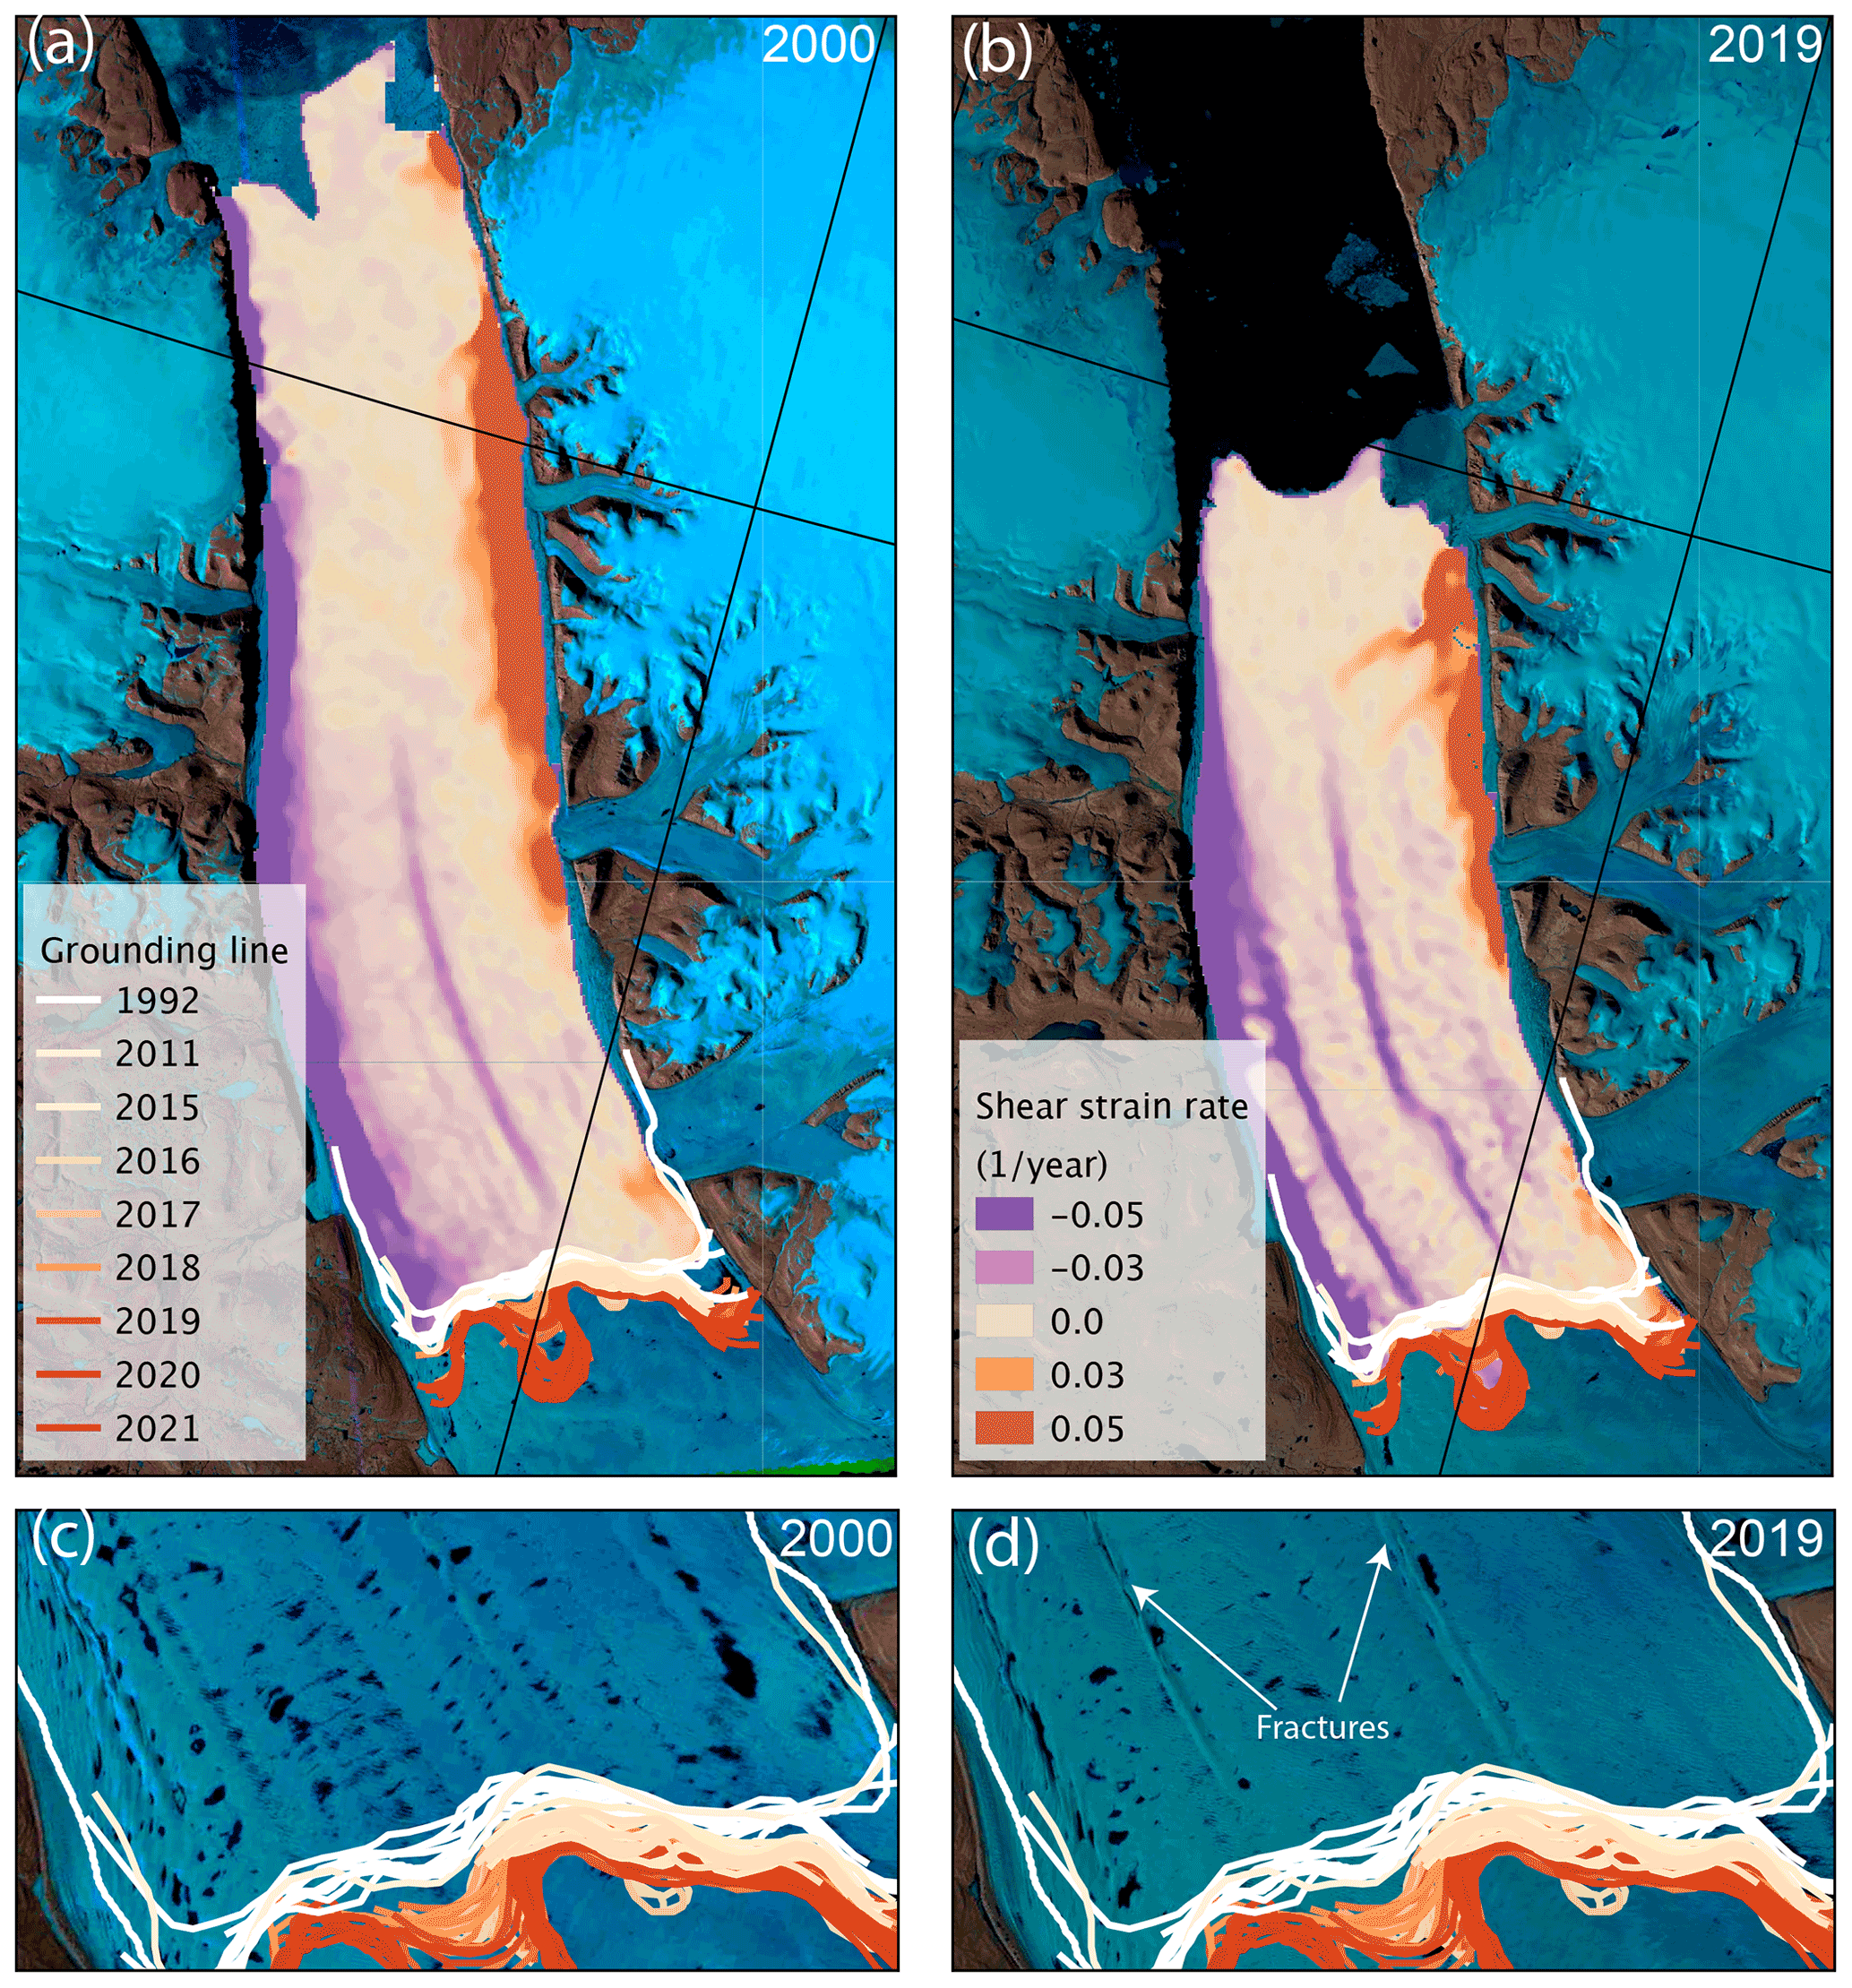
Figure 4Shear strain rates of Petermann Glacier in 2000 (a) and 2019 (b), overlaid on Landsat images from the same year. Strain rates are color coded from violent to orange. Panels (c) and (d) display the surface expression of the shear strain maps from Landsat-7 and Landsat-8 images taken in 2000 and 2019, respectively. Solid color lines show the grounding line position between 1992 and 2021, color coded on a scale from white (1992) to red (2021).
3.3 Time series of ice velocity
In Fig. 3b, we show the evolution of Petermann Glacier's velocity at a point located 1 km upstream of its 2021 grounding line for the time period 1992 to 2021. After 2014, we display in Fig. 3e the relative surface velocity change (see Sect. 2.2) across a 75 km long profile (C–C′) that coincides with transect T2 (Fig. 1). We find that between 1992 and 2021 the average speed increased by 14 %, or 150 m yr−1 (Fig. 3b–e). Before 2014, no multi-year change in ice velocity is observed, with winter speed staying near 1050 m yr−1. A significant speedup started after the summer of 2015, with a winter speed that increased from 1075 m yr−1 to a winter speed of 1200 m yr−1 in 2018. Superimposed on this interannual trend, the frequent velocity measurements available after 2013 reveal a strong summer acceleration of 10 % to 15 % compared to the winter speed (Fig. 3b–e). The summer acceleration occurs uniformly along the ice shelf and propagates 40 km upstream of the grounding line (Fig. 3e). No delay between the acceleration at the grounding line and 40 km upstream is detectable on the weekly time series (Fig. 3e).
We also assembled a time series of surface flow velocity across two gates along the glacier width (Fig. 1). The profile at the grounding displays a pronounced asymmetry in glacier flow, with an ice velocity of 1000 m yr−1 to the west (0 to 10 km in Fig. 3c) versus an ice speed of more than 1300 m yr−1 on the east side of the grounding line (> 10 km of Fig. 3c). The velocity profiles across the ice shelf (Fig. 3d) consistently show two steep transitions (5 and 12 km of Fig. 3d), where the ice velocity abruptly increases from 1100 m yr−1 to more than 1300 m yr−1 over a distance of less than 3 km. These velocity discontinuities are detected more than 30 km downstream of the grounding line (Fig. 4a, b) where the fracture zones with high shear are located as previously described. Figure 2d also shows that these discontinuities evolve over time, with a velocity differential at the fracture location of 100 m yr−1 before 2016 to over 200 m yr−1 afterwards (Fig. 3d).
3.4 Ocean thermal forcing
We reconstruct the history of ocean thermal forcing by compiling conductivity, temperature, and depth (CTD) measurements from the Hadley Centre (https://bodc.ac.uk, last access: February 2022) within Petermann fjord and Nares Strait, spanning from 1960 to 2019, combined with CTD from NASA's Ocean Melting Greenland Earth Venture Suborbital mission from 2016–2021 (Fenty et al., 2016). A warming signal was detected at depth from the 1970s to the 2000s, with a warming of roughly 0.1 ∘C. An even stronger signal has taken place in the last decade (Fig. 5), with a temperature that increased from 0.1 ∘C in 2000 to 0.3 ∘C in 2020. Overall ocean temperature in the fjord at 350–450 m depth (the maximum grounding line depth is ∼ 500 m) is > 0.3 ∘C warmer in the 2020 than in the 1970s–1980s. This warming signal has been documented elsewhere with a change in temperature of 0.23 ∘C between 2003 and 2009 (Washam et al., 2018).
Our results indicate that the surface velocity has remained relatively constant between 1986 and 2010 (Fig. 4a). The significant glacier speedup observed after summer 2015 coincides with the development of the two along-flow shear fractures within the same time period (Figs. 2e–i and 3a). It is worth noting that the pronounced abrupt transitions in ice flow velocity (Fig. 3c–d) are spatially consistent with the development of these breakup zones along the ice shelf length (Fig. 4), showing a partially decoupled flow regime, meaning that the three different parts of the ice shelf flow at a slightly different pace. The development of these large fractures along the shelf may also be responsible for the difference in flow regime between the floating and the grounded ice, where the abrupt transitions are not present (Fig. 3c and d).
The loss of ice shelf resistance to flow, following the 2012 calving event, may have triggered the later increase in ice flow velocity observed in 2015, causing further ice shelf thinning and consequently a grounding line retreat that happened later on between 2017 and 2018. This result is consistent with the potential reduction in ice shelf buttressing after 2012 as it was calculated by Rückamp et al. (2019). After 2018, the surface velocity of Petermann remained stable, at 1200 m yr−1 (Fig. 3b), while the grounding line continued to retreat rapidly on a retrograde bed slope (Fig. 3a). This is consistent with the hypothesis that changes in ice dynamics may be the cause of the glacier retreat and that the recession of the grounding line did not affect the flow of Petermann Glacier yet.
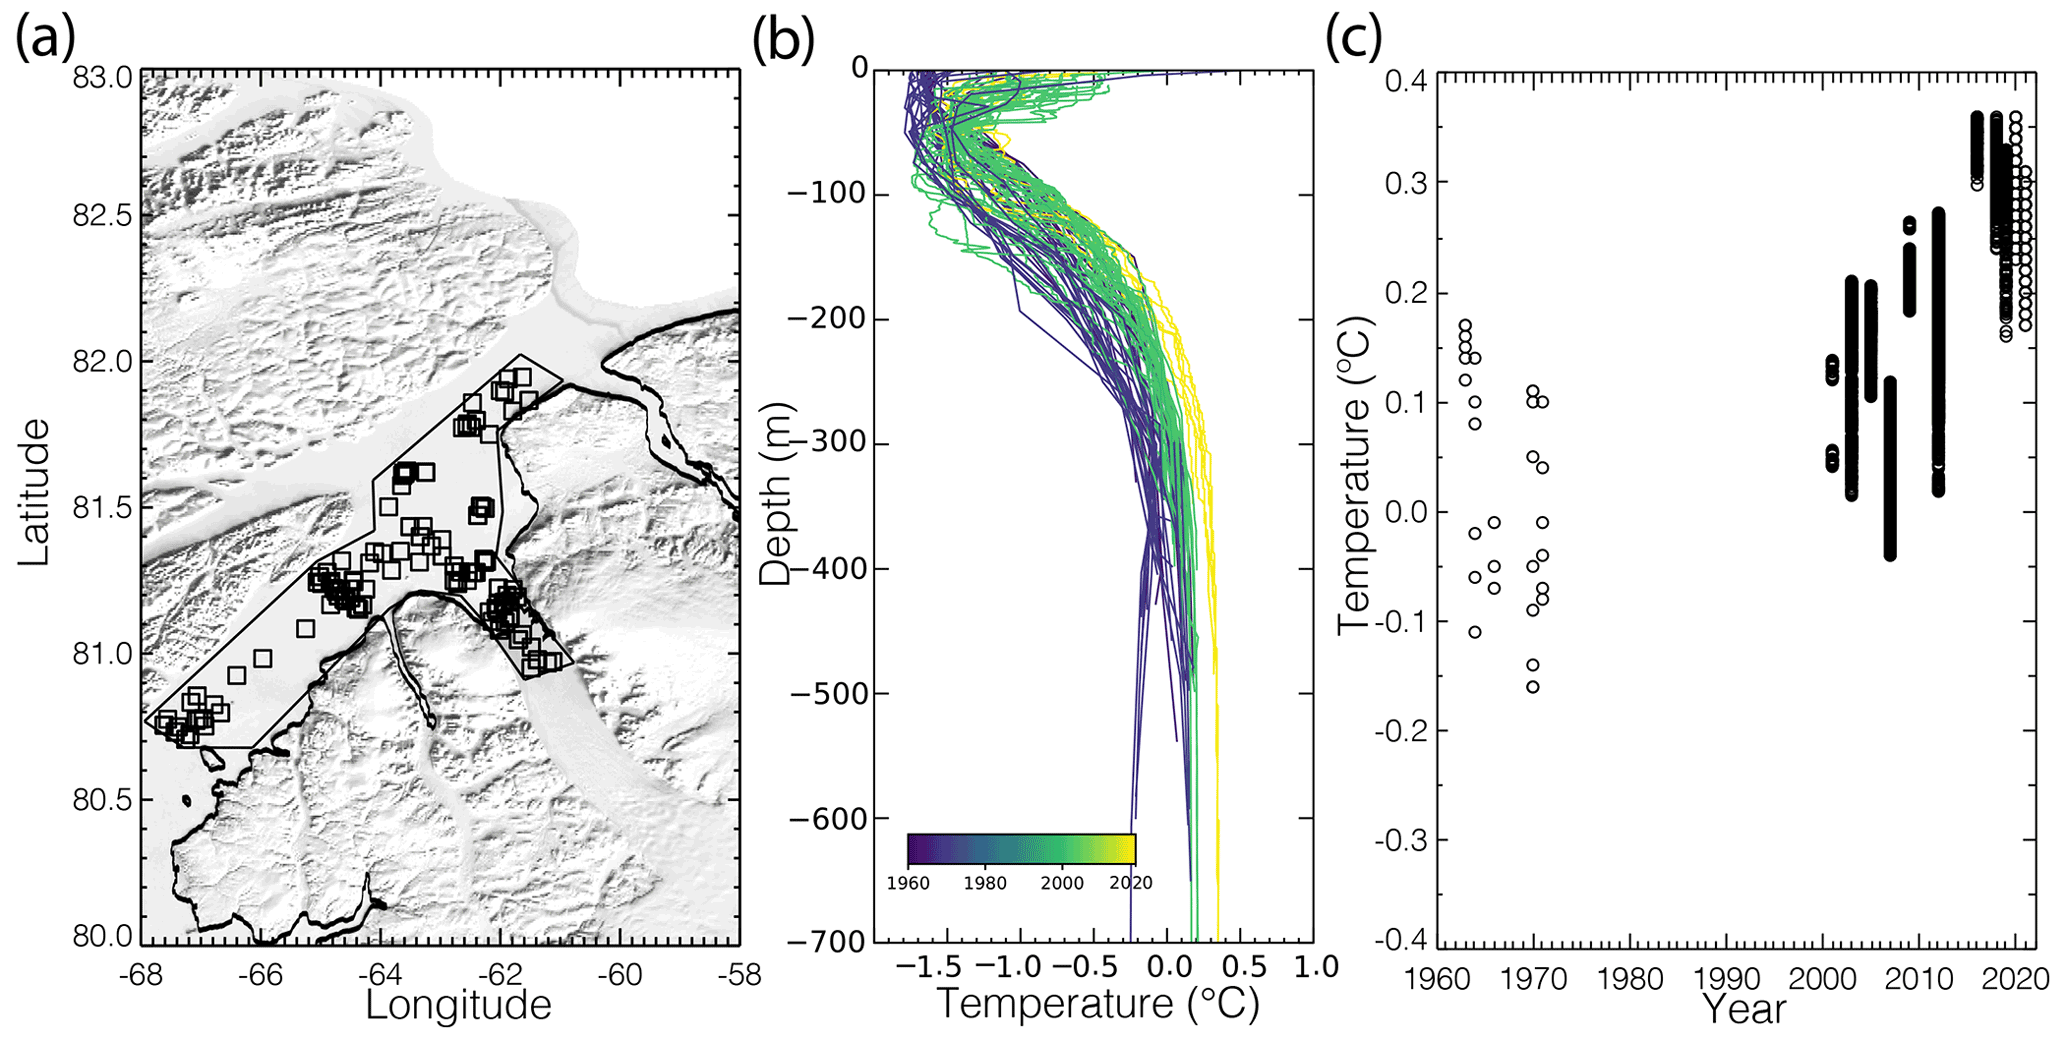
Figure 5CTD measurements near Petermann Glacier, Greenland, with (a) CTD location from 1963–2021 with the coastline in black and the region of extraction in thin black, (b) potential temperature from CTD casts color coded by year from 1963–2021, and (c) change in temperature averaged between 350 and 450 m depth from 1963 to 2021.
A comparison of our 30-year-long time series of grounding line migration with BedMachine v3 (Morlighem et al., 2017) shows that its retreat is correlated with bedrock geometry. Indeed, the recent grounding line retreat (> 5 km between 2017–2021) occurred across a section of retrograde bed topography that deepens from 470 to 517 m below sea level (Fig. 1b, green line). This pattern of retreat is similar to what has been observed for the Thwaites Glacier in the Amundsen Sea Embayment, West Antarctica, or Humboldt Glacier in North Greenland, where the retreat proceeded faster along topographic depressions of the bedrock (Milillo et al., 2019; Carr et al., 2015). In contrast, the eastern and western portions of the grounding zone have migrated slower than the central part, probably because of slightly prograde bedrock at these locations (Fig. 1b). The eastern portion of the grounding line has remained stable since 2016, on a high rise in the bedrock grounded 490 m below sea level. However, we note that the bedrock deepens over the next 8 km on a retrograde slope down to 540 m depth (Fig. 1c). Since the stability of Petermann Glacier is primarily determined by the level of buttressing at the grounding, which depends on the bedrock geometry and ice rheology, the observed down-sloping bedrock geometry along with the increased ice shelf fracturing may promote the glacier retreat in the coming years (Schoof, 2007; Gudmundsson et al., 2013).
Glacier thinning due to flow acceleration (Thomas et al., 2004; Flament and Rémy, 2012) contributes to grounding line retreat since a thinner glacier reaches flotation sooner. Based on the simple geometrical relationship from Rignot (1998), we calculate the grounding line retreat rate as a function of thickness change, grounding line depth, bed and surface slopes. With a dynamic thinning at about 1 m yr−1 (Smith et al., 2020) on a −0.11 % bed slope and a surface slope of 0.8 % measured along the profile C–C′, we calculate an expected retreat of about 130 m yr−1 (Rignot et al., 2016; Hogg et al., 2016), which is below the satellite observations.
A warming ocean signal, however, is observed since about 2000 (Figs. 3–5). A warmer ocean will indeed erode the ice shelf faster by enhancing the submarine melt rate at the grounding line, hence with the potential of promoting glacier retreat (Rignot et al., 2016; An et al., 2021). With an increase in thermal forcing of about 0.3 ∘C (Fig. 5) and neglecting the role of subglacial runoff, the model of Rignot et al. (2016), which expresses submarine melt as a function of thermal forcing, suggests that the melt would increase by 13 m yr−1. A thinning of 13 m yr−1 would correspond to a retreat of 1.6 km yr−1 with the same surface and bed slopes considered previously, which is within 200 m yr−1 of the observed grounding line migration in 2018–2021 (Fig. 3b). Although these calculations must be interpreted with caution, as they rely on simple geometric relationships, they seem to indicate that the recent retreat of the grounding line is mainly caused by rising ocean temperatures rather than dynamic thinning.
Finally, the ice flow of Petermann has not yet increased as much as other glaciers in Greenland such as Jakobshavn Isbræ (Motyka et al., 2011) or Zachariae Isstrøm (Mouginot et al., 2015), which are experiencing increased rates of mass losses. However, the 7 km grounding line retreat and the recent fracturing suggest that Petermann Glacier may be entering a phase of destabilization, which has the potential to change the dynamic of this sector of the Greenland Ice Sheet in the coming years.
In this study, we report on recent developments concerning the stability of Petermann Glacier. In 2015, the glacier surface flow velocity increased markedly for the first time in the last few decades before stabilizing in 2018. Markedly after 2016, large fractures formed and split up the ice shelf in three sections with high strain rates and a partially decoupled flowing regime. Since 2017, the grounding line has begun to retreat rapidly, while it was considered stable in the previous 25 years (Hogg et al., 2016). The central section of the grounding line is now more than 7 km upstream of the 1992 position. This recession initiated after 2017 and is proceeding along topographic depressions of the bedrock. Large sections of the grounding line sitting on down-sloping beds could retreat further in the coming years. We posit that these changes are the consequences of the rapid rise in ocean temperature observed in Nares Strait.
Grounding line and ice velocity measurements are available at https://doi.org/10.5281/zenodo.6685621 (Millan et al., 2022b).
The supplement related to this article is available online at: https://doi.org/10.5194/tc-16-3021-2022-supplement.
RM and JM conceived and designed the research. RM, JM, and EC processed and analyzed data. AD processed ice velocity time series. ER processed and analyzed ocean data. All authors participated in the writing of the manuscript.
The contact author has declared that none of the authors has any competing interests.
Publisher's note: Copernicus Publications remains neutral with regard to jurisdictional claims in published maps and institutional affiliations.
We thank the European Space Agency for the use of ERS and Sentinel-1 acquisitions, as well as the Italian Space Agency (ASI) for granting the use of CSK products in the framework of the Ghiacciai project.
This research has been supported by the Agence Nationale de la Recherche (grant no. ANR-19-CE01-0011-01).
This paper was edited by Stef Lhermitte and reviewed by two anonymous referees.
Alley, K., Scambos, T., Anderson, R., Rajaram, H., Pope, A., and Haran, T.: Continent-wide estimates of Antarctic strain rates from Landsat 8-derived velocity grids, J. Glaciol., 64, 321–332, https://doi.org/10.1017/jog.2018.23, 2018.
An, L., Rignot, E., Wood, M., Willis, J. K., Mouginot, J., and Khan, S. A.: Ocean melting of the Zachariae Isstrøm and Nioghalvfjerdsfjorden glaciers, northeast Greenland, P. Natl. Acad. Sci. USA, 118, e2015483118, https://doi.org/10.1073/pnas.2015483118, 2021.
Brancato, V., Rignot, E., Milillo, P., Morlighem, M., Mouginot, J., An, L., and Prats-Iraola, P.: Grounding line retreat of Denman Glacier, East Antarctica, measured with COSMO-SkyMed radar interferometry data, Geophys. Res. Lett., 47, e2019GL086291, https://doi.org/10.1029/2019GL086291, 2020.
Carr, J., Vieli, A., Stokes, C., Jamieson, S., Palmer, S., Christoffersen, P., and Young, D.: Basal topographic controls on rapid retreat of Humboldt Glacier, northern Greenland, J. Glaciol., 61, 137–150, https://doi.org/10.3189/2015JoG14J128, 2015.
Choi, Y., Morlighem, M., Rignot, E., and Wood, M.: Ice dynamics will remain a primary driver of Greenland ice sheet mass loss over the next century, Comm. Earth Env., 2, 26, https://doi.org/10.1038/s43247-021-00092-z, 2021.
Derkacheva, A., Mouginot, J., Millan, R., Maier, N., and Gillet-Chaulet, F.: Data Reduction Using Statistical and Regression Approaches for Ice Velocity Derived by Landsat-8, Sentinel-1 and Sentinel-2, Remote Sens., 12, 1935, https://doi.org/10.3390/rs12121935, 2020.
Fenty, I., Willis, J. K., Khazendar, A., Dinardo, S., Forsberg, R., Fukumori, I., Holland, D., Jakobsson, M., Moller, D., Morison, J., Münchow, A., Rignot, E., Schodlok, M., Thompson, A. F., Tinto, K., Rutherford, M., and Trenholm, N.: Oceans Melting Greenland: Early results from NASA's ocean-ice mission in Greenland, Oceanography, 29, 72–83, https://doi.org/10.5670/oceanog.2016.100, 2016.
Fürst, J. J., Durand, G., Gillet-Chaulet, F., Tavard, L., Rankl, M., Braun, M., and Gagliardini, O.: The safety band of Antarctic ice shelves, Nat. Clim. Change, 6, 479–482, https://doi.org/10.1038/nclimate2912, 2016.
Flament, T. and Rémy, F.: Dynamic thinning of Antarctic glaciers from along-track repeat radar altimetry, J. Glaciol., 58, 830–840, https://doi.org/10.3189/2012JoG11J118, 2012.
Gudmundsson, G. H.: Ice-shelf buttressing and the stability of marine ice sheets, The Cryosphere, 7, 647–655, https://doi.org/10.5194/tc-7-647-2013, 2013.
Hill, E. A., Gudmundsson, G. H., Carr, J. R., Stokes, C. R., and King, H. M.: Twenty-first century response of Petermann Glacier, northwest Greenland to ice shelf loss, J. Glaciol., 67, 147–157, https://doi.org/10.1017/jog.2020.97, 2021.
Hogg, A. E., Shepherd, A., Gourmelen, N., and Engdahl, M.: Grounding line migration from 1992 to 2011 on Petermann Glacier, North-West Greenland, J. Glaciol., 62, 1104–1114, https://doi.org/10.1017/jog.2016.83, 2016.
Howat, I., Negrete, A., and Smith, B.: MEaSUREs Greenland Ice Mapping Project (GIMP) Digital Elevation Model from GeoEye and WorldView Imagery, Version 1, Boulder, Colorado USA, NASA National Snow and Ice Data Center Distributed Active Archive Center [data set], https://doi.org/10.5067/H0KUYVF53Q8M, 2017.
Howat, I. M., Negrete, A., and Smith, B. E.: The Greenland Ice Mapping Project (GIMP) land classification and surface elevation data sets, The Cryosphere, 8, 1509–1518, https://doi.org/10.5194/tc-8-1509-2014, 2014.
Joughin, I., Smith, B., and Howat, I.: A complete map of Greenland ice velocity derived from satellite data collected over 20 years, J. Glaciol., 64, 1–11, https://doi.org/10.1017/jog.2017.73, 2017.
Lhermitte, S., Sun, S., Shuman, C., Wouters, B., Pattyn, F., Wuite, J., Berthier, E., and Nagler, T.: Damage accelerates ice shelf instability and mass loss in Amundsen Sea Embayment, P. Natl. Acad. Sci. USA, 117, 24735–24741, https://doi.org/10.1073/pnas.1912890117, 2020.
Michel, R. and Rignot, E.: Flow of Glaciar Moreno, Argentina, from repeat-pass Shuttle Imaging Radar images: Comparison of the phase correlation method with radar interferometry, J. Glaciol., 45, 93–100, https://doi.org/10.3189/S0022143000003075, 1999.
Milillo, P., Rignot, E., Mouginot, J., Scheuchl, B., Morlighem, M., Li, X., and Salzer, J. T.: On the short-term grounding zone dynamics of Pine Island Glacier, West Antarctica, observed with COSMO-SkyMed interferometric data, Geophys. Res. Lett., 44, 10436–10444, https://doi.org/10.1002/2017GL074320, 2017.
Milillo, P., Rignot, E., Rizzoli, P., Scheuchl, B., Mouginot, J., Bueso-Bello, J., and Prats-Iraola, P.: Heterogeneous retreat and ice melt of Thwaites Glacier, West Antarctica, Sci. Adv., 5, eaau3433, https://doi.org/10.1126/sciadv.aau3433, 2019.
Millan, R., Mouginot, J., Rabatel, A., Jeong, S., Cusicanqui, D., Derkacheva, A., and Chekki, M.: Mapping Surface Flow Velocity of Glaciers at Regional Scale Using a Multiple Sensors Approach, Remote Sens., 11, 2498, https://doi.org/10.3390/rs11212498, 2019.
Millan, R., Mouginot, J., Rabatel, A., and Morlighem, M.: Ice velocity and thickness of the world's glaciers, Nat. Geosci. 15, 124–129, https://doi.org/10.1038/s41561-021-00885-z, 2022a.
Millan, R., Mouginot, J., Derkacheva, A., Rignot, E., Milillo, P., Ciraci, E., Dini, L., and Bjørk, A.: Ongoing grounding line retreat and fracturation initiated at the Petermann Glacier ice shelf, Greenland after 2016, Zenodo [data set], https://doi.org/10.5281/zenodo.6685621, 2022b.
Mohajerani, Y., Jeong, S., Scheuchl, B., Velicogna, I., Rignot, E., and Milillo, P.: Automatic delineation of glacier grounding lines in differential interferometric synthetic-aperture radar data using deep learning, Sci. Rep., 11, 4992, https://doi.org/10.1038/s41598-021-84309-3, 2021.
Morlighem, M., Williams, C. N., Rignot, E., An, L., Arndt, J. E., Bamber, J. L., Catania, G., Chauché, N., Dowdeswell, J. A., Dorschel, B., Fenty, I., Hogan, K., Howat, I., Hubbard, A., Jakobsson, M., Jordan, T. M., Kjeldsen, K. K., Millan, R., Mayer, L., Mouginot, J., Noël, B. P. Y., Ó Cofaigh, C., Palmer, S., Rysgaard, S., Seroussi, H., Siegert, M. J., Slabon, P., Straneo, F., van den Broeke, M. R., Weinrebe, W., Wood, M., and Zinglersen, K. B.: BedMachine v3: Complete Bed Topography and Ocean Bathymetry Mapping of Greenland From Multibeam Echo Sounding Combined With Mass Conservation, Geophys. Res. Lett., 44, 11051–11061, https://doi.org/10.1002/2017GL074954, 2017.
Motyka, R. J., Truffer, M., Fahnestock, M., Mortensen, J., Rysgaard, S., and Howat, I.: Submarine melting of the 1985 Jakobshavn Isbræ floating tongue and the triggering of the current retreat, J. Geophys. Res., 116, F01007, https://doi.org/10.1029/2009JF001632, 2011.
Mouginot, J., Rignot, E., Scheuchl, B., Fenty, I., Khazendar, A., Morlighem, M, Buzza, A., Paden, J.: Fast retreat of Zachariæ Isstrøm, Northeast Greenland, Science, 6266, 1357–1361, https://doi.org/10.1126/science.aac7111, 2015.
Mouginot, J., Rignot, E., Scheuchl, B., and Millan, R.: Comprehensive Annual Ice Sheet Velocity Mapping Using Landsat-8, Sentinel-1, and RADARSAT-2 Data, Remote Sens., 9, 364, https://doi.org/10.3390/rs9040364, 2017.
Mouginot, J., Rignot, E., Bjørk, A. A., van den Broeke, M., Millan, R., Morlighem, M., Noël, B., Scheuchl, B., and Wood, M.: Forty-six years of Greenland Ice Sheet mass balance from 1972 to 2018, P. Natl. Acad. Sci. USA, 116, 9239–9244, https://doi.org/10.1073/pnas.1904242116, 2019.
Münchow, A., Padman, L., and Fricker, H.: Interannual changes of the floating ice shelf of Petermann Gletscher, North Greenland, from 2000 to 2012, J. Glaciol., 60, 489–499, https://doi.org/10.3189/2014JoG13J135, 2014.
Nye, J. F.: A method of determining the strain-rate tensor at the surface of a glacier, J. Glaciol., 3, 409–419, https://doi.org/10.3189/S0022143000017093, 1959.
Reager, J. T., Gardner, A. S., Famiglietti, J. S., Wiese, D. N., Eicker, A., and Lo, M. H.: A decade of sea level rise slowed by climate-driven hydrology, Science, 351, 699–703, https://doi.org/10.1126/science.aad8386, 2016.
Reese, R., Albrecht, T., Mengel, M., Asay-Davis, X., and Winkelmann, R.: Antarctic sub-shelf melt rates via PICO, The Cryosphere, 12, 1969–1985, https://doi.org/10.5194/tc-12-1969-2018, 2018.
Rignot, E.: Tidal motion, ice velocity and melt rate of Petermann Gletscher, Greenland, measured from radar interferometry, J. Glaciol., 42, 476–485, https://doi.org/10.3198/1996JoG42-142-476-485, 1996.
Rignot, E. J.: Fast recession of a west antarctic glacier, Science, 281, 549–551, https://doi.org/10.1126/science.281.5376.549, 1998.
Rignot, E., Mouginot, J., and Scheuchl, B.: Antarctic grounding line mapping from differential satellite radar interferometry, Geophys. Res. Lett., 38, L10504, https://doi.org/10.1029/2011GL047109, 2011.
Rignot, E., Mouginot, J., Morlighem, M., Seroussi, H., and Scheuchl, B.: Widespread, rapid grounding line retreat of Pine Island, Thwaites, Smith, and Kohler glaciers, West Antarctica, from 1992 to 2011, Geophys. Res. Lett., 41, 3502–3509, https://doi.org/10.1002/2014GL060140, 2014.
Rignot, E., Xu, Y., Menemenlis, D., Mouginot, J., Scheuchl, B., Li, X., Morlighem, M., Seroussi, H., van den Broeke, M., Fenty, I., Cai, C., An, L., and de Fleurian, B.: Modeling of ocean-induced ice melt rates of five west Greenland glaciers over the past two decades, Geophys. Res. Lett., 43, 6374–6382, https://doi.org/10.1002/2016GL068784, 2016.
Rückamp, M., Neckel, N., Berger, S., Humbert, A., and Helm, V.: Calving induced speedup of petermann glacier, J. Geophys. Res.-Earth., 124, 216–228, https://doi.org/10.1029/2018JF004775, 2019.
Scheuchl, B., Mouginot, J., Rignot, E., Morlighem, M., and Khazendar, A.: Grounding line retreat of Pope, Smith, and Kohler Glaciers, West Antarctica, measured with Sentinel-1a radar interferometry data, Geophys. Res. Lett., 43, 8572–8579, https://doi.org/10.1002/2016GL069287, 2016.
Schoof, C.: Ice sheet grounding line dynamics: Steady states, stability, and hysteresis, J. Geophys. Res., 112, F03S28, https://doi.org/10.1029/2006JF000664, 2007.
Smith, B., Fricker, H. A., Gardner, A. S., Medley, B., Nilsson, J., Paolo, F. S., Holschuh, N., Adusumilli, S., Brunt, K., Csatho, B., Harbeck, K., Markus, T., Neumann, T., Siegfried, M., and Zwally, J.: Pervasive ice sheet mass loss reflects competing ocean and atmosphere processes, Science, 368, 1239–1242, https://doi.org/10.1126/science.aaz5845, 2020.
The IMBIE Team: Mass balance of the Greenland Ice Sheet from 1992 to 2018, Nature, 579, 233–239, https://doi.org/10.1038/s41586-019-1855-2, 2020.
Thomas, R. H.: The Dynamics of Marine Ice Sheets, J. Glaciol., 24, 167–177, https://doi.org/10.3189/S0022143000014726, 1979.
Thomas, R., Rignot, E., Kanagaratnam, P., Krabill, W., and Casassa, G.: Force-perturbation analysis of Pine Island Glacier, Antarctica, suggests cause for recent acceleration, Ann. Glaciol., 39, 133–138, https://doi.org/10.3189/172756404781814429, 2004.
Washam, P., Münchow, A., and Nicholls, K. W.: A Decade of Ocean Changes Impacting the Ice Shelf of Petermann Gletscher, Greenland, J. Phys. Oceanogr., 48, 2477–2493, https://doi.org/10.1175/JPO-D-17-0181.1, 2018.
Werner, C., Wegmüller, U., Strozzi, T., and Wiesmann, A.: GAMMA SAR and Interferometric Processing Software, in: ERS – ENVISAT Symposium, Gothenburg, Sweden, 2000.
Wilson, N., Straneo, F., and Heimbach, P.: Satellite-derived submarine melt rates and mass balance (2011–2015) for Greenland's largest remaining ice tongues, The Cryosphere, 11, 2773–2782, https://doi.org/10.5194/tc-11-2773-2017, 2017.