the Creative Commons Attribution 4.0 License.
the Creative Commons Attribution 4.0 License.
 | 12 Jul 2022
Impacts of post-depositional processing on nitrate isotopes in the snow and the overlying atmosphere at Summit, Greenland
Zhuang Jiang
Joel Savarino
Becky Alexander
Joseph Erbland
Jean-Luc Jaffrezo
The effect of post-depositional processing on the preservation of snow nitrate isotopes at Summit, Greenland, remains a subject of debate and is relevant to the quantitative interpretation of ice-core nitrate (isotopic) records at high snow accumulation sites. Here we present the first year-round observations of atmospheric nitrate and its isotopic compositions at Summit and compare them with published surface snow and snowpack observations. The atmospheric δ15N(NO) remained negative throughout the year, ranging from −3.1 ‰ to −47.9 ‰ with a mean of (−14.8 ± 7.3) ‰ (n=54), and displayed minima in spring which are distinct from the observed spring δ15N(NO) maxima in snowpack. The spring average atmospheric δ15N(NO) was (−17.9 ± 8.3) ‰ (n=21), significantly depleted compared to the snowpack spring average of (4.6 ± 2.1) ‰, while the surface snow δ15N(NO) of (−6.8 ± 0.5) ‰ was in between the atmosphere and the snowpack. The differences in atmospheric, surface snow and snowpack δ15N(NO) are best explained by the photo-driven post-depositional processing of snow nitrate, with potential contributions from fractionation during nitrate deposition. In contrast to δ15N(NO), the atmospheric Δ17O(NO) was of a similar seasonal pattern and magnitude of change to that in the snowpack, suggesting little to no changes in Δ17O(NO) from photolysis, consistent with previous modeling results. The atmospheric δ18O(NO) varied similarly to atmospheric Δ17O(NO), with summer low and winter high values. However, the difference between atmospheric and snow δ18O(NO) was larger than that of Δ17O(NO). We found a strong correlation between atmospheric δ18O(NO) and Δ17O(NO) that is very similar to previous measurements for surface snow at Summit, suggesting that atmospheric δ18O(NO) versus Δ17O(NO) relationships were conserved during deposition. However, we found the linear relationships between δ18O and Δ17O(NO) were significantly different for snowpack compared to atmospheric samples. This likely suggests the oxygen isotopes are also affected before preservation in the snow at Summit, but the degree of change for δ18O(NO) should be larger than that of Δ17O(NO). This is because photolysis is a mass-dependent process that would directly affect δ18O(NO) in snow but not Δ17O(NO) as the latter is a mass-independent signal. Although there were uncertainties associated with the complied dataset, the results suggested that post-depositional processing at Summit can induce changes in nitrate isotopes, especially δ15N(NO), consistent with a previous modeling study. This reinforces the importance of understanding the effects of post-depositional processing before ice-core nitrate isotope interpretation, even for sites with relatively high snow accumulation rates.
- Article
(2209 KB) - Full-text XML
-
Supplement
(141 KB) - BibTeX
- EndNote


Ice-core nitrate and its isotopes are potential proxies to constrain atmospheric variability in NOx and oxidant concentrations in past atmospheres. However, this can be compromised by the impacts of post-depositional processing on nitrate concentrations and isotopes (i.e., δ15N, δ18O and Δ17O, where Δ17O =δ17O − 0.52 × δ18O) (Alexander et al., 2020; Erbland et al., 2013; Röthlisberger et al., 2002; Wolff et al., 2008). Nitrate is chemically reactive in snow upon exposure to sunlight, and thus its deposition to snow is not irreversible (Grannas et al., 2007). Numerous studies across Greenland and Antarctica have observed decreases in snow nitrate concentrations with depth in the snowpack (Erbland et al., 2013; Frey et al., 2009; Mulvaney et al., 1998; Röthlisberger et al., 2000) and/or emissions of NOx and HONO from snowpack (Barbero et al., 2021; Dibb et al., 1998; Frey et al., 2015; Honrath et al., 2002; Jones et al., 2001). Follow-up studies further indicate changes in the isotopic compositions of snow nitrate in the snowpack, e.g., increases in δ15N and decreases in δ18O Δ17O with depth or an increasing trend in δ15N from coastal to inland sites (Blunier et al., 2005; Curtis et al., 2018; Erbland et al., 2013; Frey et al., 2009; Shi et al., 2015). Processes leading to such changes were referred to as post-depositional processing, and δ15N of the archived nitrate was used to reflect the degree of post-depositional processing due to its high sensitivity to these processes (Erbland et al., 2013; Frey et al., 2009; Geng et al., 2015; Jiang et al., 2021; Shi et al., 2015; Winton et al., 2020).
Post-depositional processing of snow nitrate is mainly initiated by photolysis (Berhanu et al., 2014; Erbland et al., 2013; Frey et al., 2009; Zatko et al., 2016). The evaporation of nitrate from snow grains may also contribute, but this process has been suggested to have a minimal effect under typical ranges of temperatures in polar regions (Shi et al., 2019). Observations and modeling of snowpack nitrate concentration and isotope profiles across many different sites (e.g., Summit in Greenland and Dronning Maud Land (DML) and Dome A/Dome C in Antarctica) generally agree that photolysis dominates post-depositional processing (Erbland et al., 2013; Frey et al., 2009; Jiang et al., 2021; Winton et al., 2020; Shi et al., 2015). Photolysis of snow nitrate would emit NOx to the overlying atmosphere, which would subsequently reform nitrate under local oxidation conditions and redeposits. This recycling of snow nitrate not only changes the initially deposited nitrate (isotope) signal but also leads to a redistribution of snowpack nitrate. Thus, the final archival snow nitrate, defined as nitrate buried below the photic zone, would be largely impacted by post-depositional processing, which needs to be fully understood to interpret ice-core nitrate records. The degree of the photo-driven post-depositional processing is influenced by three main factors including snow accumulation rate, surface actinic flux and light penetration depth in snow (i.e., the photic zone where actinic flux decreases exponentially) (Zatko et al., 2013). Snow and ice-core nitrate isotope records have shown variations in δ15N(NO) in response to varying snow accumulation rates, as well as light-absorbing impurities (BC, dust, etc.) which influence light penetration depth in snow. For example, Geng et al. (2014) found correlations between δ15N(NO) and snow accumulation rate across the GISP2 ice-core record except in periods with very low snow accumulation rate (< 0.08 m ice a−1) and high dust concentrations. In the latter situation, δ15N(NO) became negatively correlated with dust concentration. These correlations reflect the effect of snow accumulation rate and snow light absorbing impurities on the degree of post-depositional processing. The higher dust concentration during glacial periods could also reduce the volatilization of snow nitrate (Röthlisberger et al., 2000). At the West Antarctic Ice Sheet divide, where snow accumulation rate is high (0.24 m ice a−1) at present, a decreasing trend in snow accumulation rate since 2400 years BP led to an increasing trend in the degree of post-depositional processing as indicated by the elevated δ15N(NO) (Sofen et al., 2014).
Variations in surface actinic flux (especially the UVB radiation) would also induce changes in the degree of post-depositional processing and leave signals in the preserved nitrate in snow and ice cores. Previous studies (Erbland et al., 2013; Frey et al., 2009; McCabe et al., 2007) proposed that δ15N(NO) preserved in snow and ice cores may serve as a proxy of total column ozone (TCO) due to its influence on surface UVB radiation, while a recent study suggested the preserved δ15N(NO) is more sensitive to snow accumulation rate and light penetration depth than to changes in TCO (Winton et al., 2020). Nevertheless, in periods with relatively constant snow accumulation rate but distinct surface actinic flux, e.g., the switch of the polar night and polar day over a year and the Antarctic ozone hole period, changes in the degree of post-depositional processing and the associated isotope effects should be expected. Using a snow column photochemical model (the TRANSITS model by Erbland et al., 2015), Jiang et al. (2021) explicitly quantified the effects of post-depositional processing on snow nitrate and its isotopes on a seasonal scale at Summit, Greenland. Owing to the seasonal differences in surface actinic flux, the model predicted a seasonal variation in δ15N(NO) snowpack similar to the observations. On an annual scale, the model predicted a ≈ 4 % net nitrate mass loss, which is within the range estimated by previous studies (Burkhart et al., 2004; Dibb et al., 2007) but is subject to uncertainties in the fraction of the snow-sourced nitrate exported from the region. In contrast, the model predicted minimum changes in Δ17O of snow nitrate on both seasonal and annual scales because the photo-driven post-depositional processing affects Δ17O mainly from the cage effect (i.e., the intermediate photo-products – NO and NO2 – exchange with water oxygen or react with radicals such as OH in snow grains to regenerate nitrate before being emitted to the atmosphere) (McCabe et al., 2005; Meusinger et al., 2014), and the cage effect is minimum at Summit given the high snow accumulation. The study by Jiang et al. (2021) further suggested that seasonal δ15N(NO) variations in the snowpack at Summit, Greenland, is caused by photo-driven post-depositional processing, an alternative to previous interpretations that attributed the seasonality to NOx source variability (Hastings et al., 2004). Jarvis et al. (2009) also found enrichment in snowpack δ15N(NO) compared to the surface snow samples at Summit, Greenland, providing observational evidence of post-depositional processing altering snow δ15N(NO) at this high snow accumulation rate site. These results are in conflict with the conclusion of Fibiger et al. (2013, 2016) who suggested that there is little to no isotope effect caused by post-depositional processing relying on the oxygen isotopes of nitrate. However, as argued by Jiang et al. (2021), the nitrogen isotopes are more sensitive to post-depositional processing. In addition, Fibiger et al. (2013, 2016) collected atmospheric and surface snow samples in May and June. The process of photolysis of snow nitrate to NOx and the oxidation of snow-sourced NOx to nitrate, followed by re-deposition of snow-sourced nitrate, will render the isotopic composition of atmospheric and surface snow nitrate similar to each other. Nitrate at depth, isolated from surface deposition but still in the photic zone, would continue to experience photolysis, making post-depositional loss more apparent in the isotope observations. Therefore, in order to reflect the full picture of post-depositional processing, snow samples covering the entire photic zone (∼ 40 cm at Summit) must be considered (Jiang et al., 2021).
To thoughtfully evaluate the effects of post-depositional processing at Summit, Greenland, and to verify the modeling results by Jiang et al. (2021), nitrate isotopes in the atmosphere and in snow covering a full cycle of polar seasons with distinct actinic flux variations are necessary. Here, we present the first year-round observations of nitrate isotopes in the air at Summit and compare them with similar observations in surface snow and in snow at depth (i.e., snowpack) to conduct a comprehensive evaluation on the seasonality in nitrate isotopes in both air and snow, as has already been done in Antarctica (Erbland et al., 2013; Frey et al., 2009; Winton et al., 2020). These observations provide information regarding the evolution of nitrate isotopes from atmospheric nitrate to its final preservation in snowpack, which is critical for assessing the post-depositional changes in nitrate isotopes.
2.1 Atmospheric nitrate sampling and measurements
From July 2001 to July 2002, atmospheric samples were collected at Summit, Greenland, using a high-volume air sampler (HVAS) with glass fiber filters (20.3 × 25.4 cm). All glass fiber filters were pre-cleaned by an overnight soak and several rinses with ultra-pure water, then dried in a clean room, and stored in clean plastic food storage bags until used. Glass fiber filters have been shown to be capable of collecting atmospheric nitrate with high efficiency even when gas-phase nitrate dominates total atmospheric nitrate (Erbland et al., 2013). This is likely due to the high NaCl blank in the glass fiber filter, which is known to promote the collection efficiency of atmospheric nitrate (Morin et al., 2009; Erbland et al., 2013). The quantitative collection of atmospheric nitrate is further supported by the similar concentration range of our measurements with previous Summit studies (Supplement). In this study we assumed that the collected filtered nitrate sample represented the total atmospheric nitrate in the passed air, i.e., the sum of aerosol nitrate and gas-phase nitric acid. Each sample covering 3–4 d was routinely collected over the year, with a total of 97 samples. We have also collected nine field blanks during the sampling period in different months, with the same sampling procedure but the sampling time limited to 1 min. These samples were stored frozen until analysis.
Measurements of nitrate concentrations and isotopes were conducted in the laboratory at the Institute des Géosciences de l'Environnement, Grenoble, France, in 2013. Nitrate collected on the glass fiber filters was first extracted by about 40 mL of 18 MΩ water via centrifugation using Millipore Centricon™ filter units. The samples were then measured for nitrate concentrations by colorimetry using the Saltzman method (Vicars et al., 2012). The average nitrate concentration in the filtrate for all atmospheric samples was (1363 ± 1603) ng g−1, while that of the nine blank samples was (183 ± 44) ng g−1. Among these samples, 54 out of 97 were determined to be valid by comparing the extracted nitrate concentration with the blank, i.e., only samples with a concentration exceeding 3 times that of the blank samples were judged as valid for further analyses. These samples were then individually concentrated on a 0.3 mL resin bed with anionic exchange resin (Bio-Rad™ AG1-X8, chloride form) and eluted with 5 × 2 mL of NaCl solution (1 M). The isotopic compositions of each sample were determined by using the bacterial denitrifier method. Briefly, NO in each sample was converted to N2O by denitrifying bacteria under anaerobic conditions. N2O was then thermally decomposed into N2 and O2 on a gold tube heated to 800∘C. The N2 and O2 were separated by a gas chromatography column and injected into an isotope ratio mass spectrometer (Thermo Finnigan™ MAT 253) for isotope analyses of 15N 14N, 17O 16O and 18O 16O. To correct for the potential isotope fractionation during laboratory isotope analysis, international reference materials (IAEA-NO3, USGS-32, 34 and 35) were used for data calibration. We treated the reference materials the same as the filtrations from filter samples, e.g., making the reference material solution using 1 M NaCl solution. The blank filter samples were processed following the same procedure as atmospheric samples and measured for their isotope ratios. The measured nitrate isotope ratio of each atmospheric sample was further corrected by deducting the contribution of the filter blanks. The measurement uncertainty was assessed based on the reduced standard deviations of the residuals from the linear regression between the measured reference materials and their expected values as detailed in Erbland et al. (2013). The overall measurement uncertainties were estimated to be 0.6 ‰ for δ18O and 0.3 ‰ for both Δ17O and δ15N(NO).
2.2 Atmosphere, surface snow and snowpack data compilation
From the literature, we collected nitrate isotope data (δ15N, δ18O and Δ17O) of atmospheric particulate or gas-phase nitrate, surface snow, and snowpack nitrate available at Summit, Greenland (Fibiger et al., 2013, 2015; Geng et al., 2014; Hastings et al., 2004; Jarvis et al., 2009; Kunasek et al., 2008). Details about these data (e.g., sample type, depth, age, sampling technique) and the corresponding references are listed in Table 1. Note that in some early publications only the seasonal averages instead of the original data with finer resolution were available. These data were compiled to produce a dataset including all seasons for nitrate in the air, surface snow and snowpack by averaging samples covering multiple years and/or by different groups to reduce the spatial and temporal heterogeneities. For samples with resolution finer than monthly, we compiled them as their mass-weighted monthly averages (if the mass information for each sample is known), and for samples with coarser than monthly resolution, seasonal averages were used, and we here report seasonal averages of multiple years if more than one year's data are available in the literature.
For atmospheric and surface snow samples, age information was indicated as the time of sampling. Snowpack samples require a conversion from depth to age. The snowpack samples from Hastings et al. (2004) and Kunasek et al. (2008) were dated by seasonal binning according to the measured accumulation rate and water isotopes, and their age information was used as is. For samples from Geng et al. (2014), we recalculated the dating by bamboo-stake-measured snow accumulation data (Burkhart et al., 2004; Dibb et al., 2004; Kuhns et al, 1997) constrained by snow density and further justified by seasonal peaks of Na+ and Cl− Na+ ratio. This is similar to the dating method in Hastings et al. (2004), and the only difference is which proxy was used as the seasonal marker. Briefly, we used the bamboo stake measurements of weekly snow accumulation at Summit and the snowpack density profile to estimate the deposition timing of each sample in the 2.1 m snowpack that was collected in July of 2007. We first converted the thickness of each sample (referred to as Dm) to a fresh snow thickness (referred to as Df) by the following equation:
where ρm is the real snow density at each depth from field measurement (Geng et al., 2014), and ρf is the fresh snow density (0.32 g cm−3; Dibb et al., 2004). These fresh snow thicknesses were then stacked to construct an idealized snow depth profile without densification due to compaction and/or metamorphism. This idealized depth profile was then matched to the stacked depth by the observed average weekly snow accumulation rate to determine the exact age for each sample. A previous study showed that the vertical profile of snowpack nitrate can be reconstructed using the stack measured accumulation rate (Burkhart et al., 2004). This dating method has uncertainties, mostly owing to the large variability in measured accumulation rate among different stakes (Burkhart et al., 2004). To reduce the uncertainties in our dating results, we calculated their monthly average and compared it with atmospheric and/or surface snow data with a similar or coarser time resolution. The compiled δ15N and Δ17O data in monthly resolution display seasonal patterns similar to their original seasonal variations observed in snowpack, and the Cl− Na+ ratio of the compiled samples also displays summer highs and winter lows, as has been previously observed in snowpack or firn cores (Geng et al., 2014), corroborating the dating method in terms of capturing the seasonality (Fig. 2e). The monthly Δ17O values compiled from Geng et al. (2014) data were further averaged with the monthly Δ17O values reported by Kunasek et al. (2008) to generate the final snowpack monthly Δ17O data. In comparison to Δ17O, the δ18O data from different groups indicated a much larger range of variability or were even inconsistent as the data from Jarvis et al. (2009) indicated a winter peak of δ18O instead of summer, which is different from other studies (e.g., Geng et al., 2014) and difficult to explain from the current understanding of nitrate chemistry. Therefore, we did not average the δ18O data from different groups.
Table 1Nitrate isotope data information and references. The atmospheric sampling technique in different studies is also listed in the table.
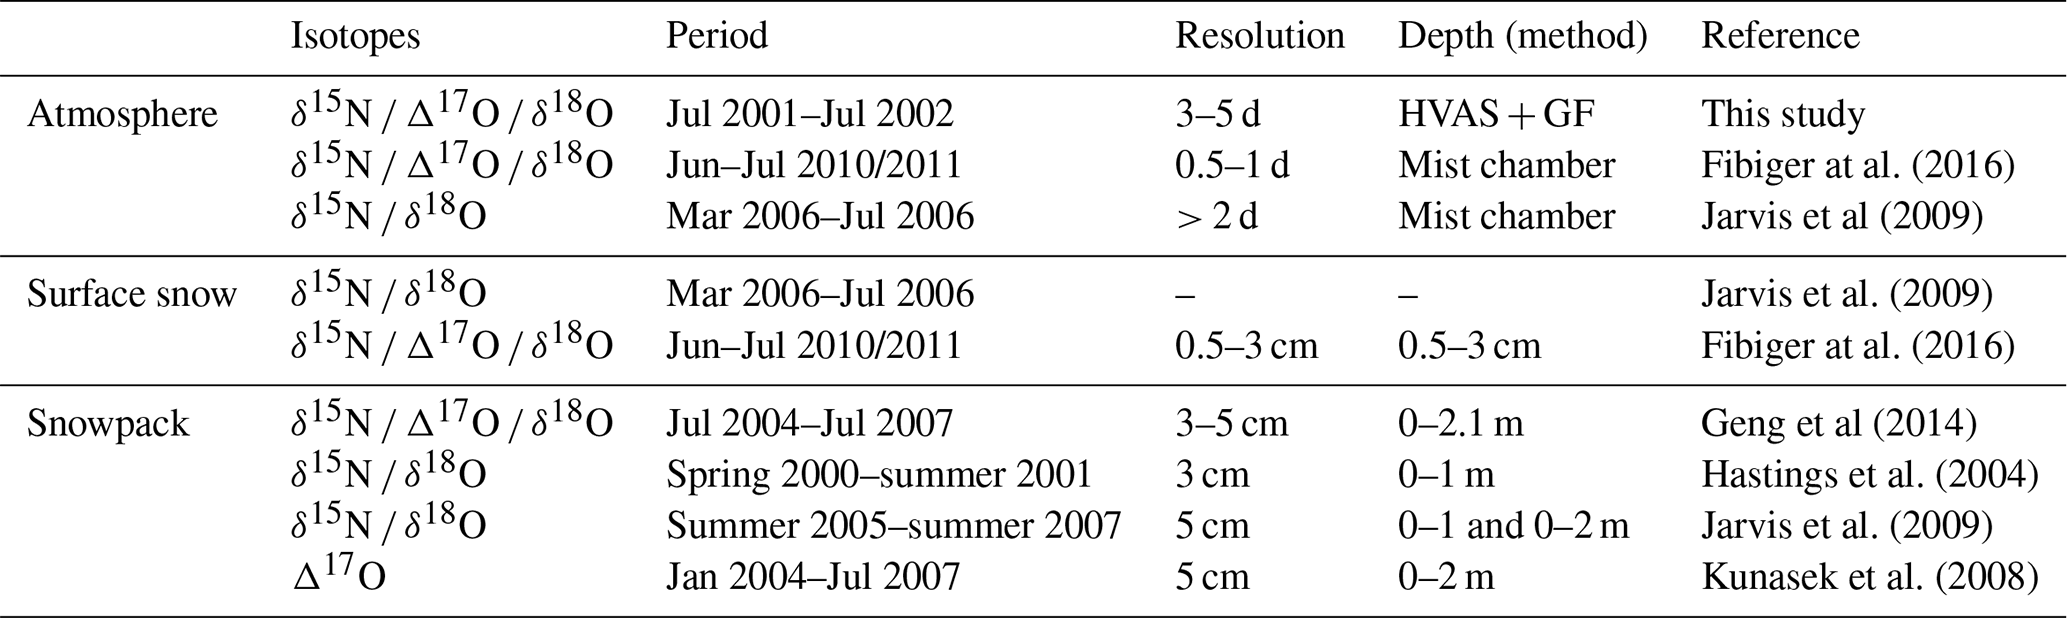
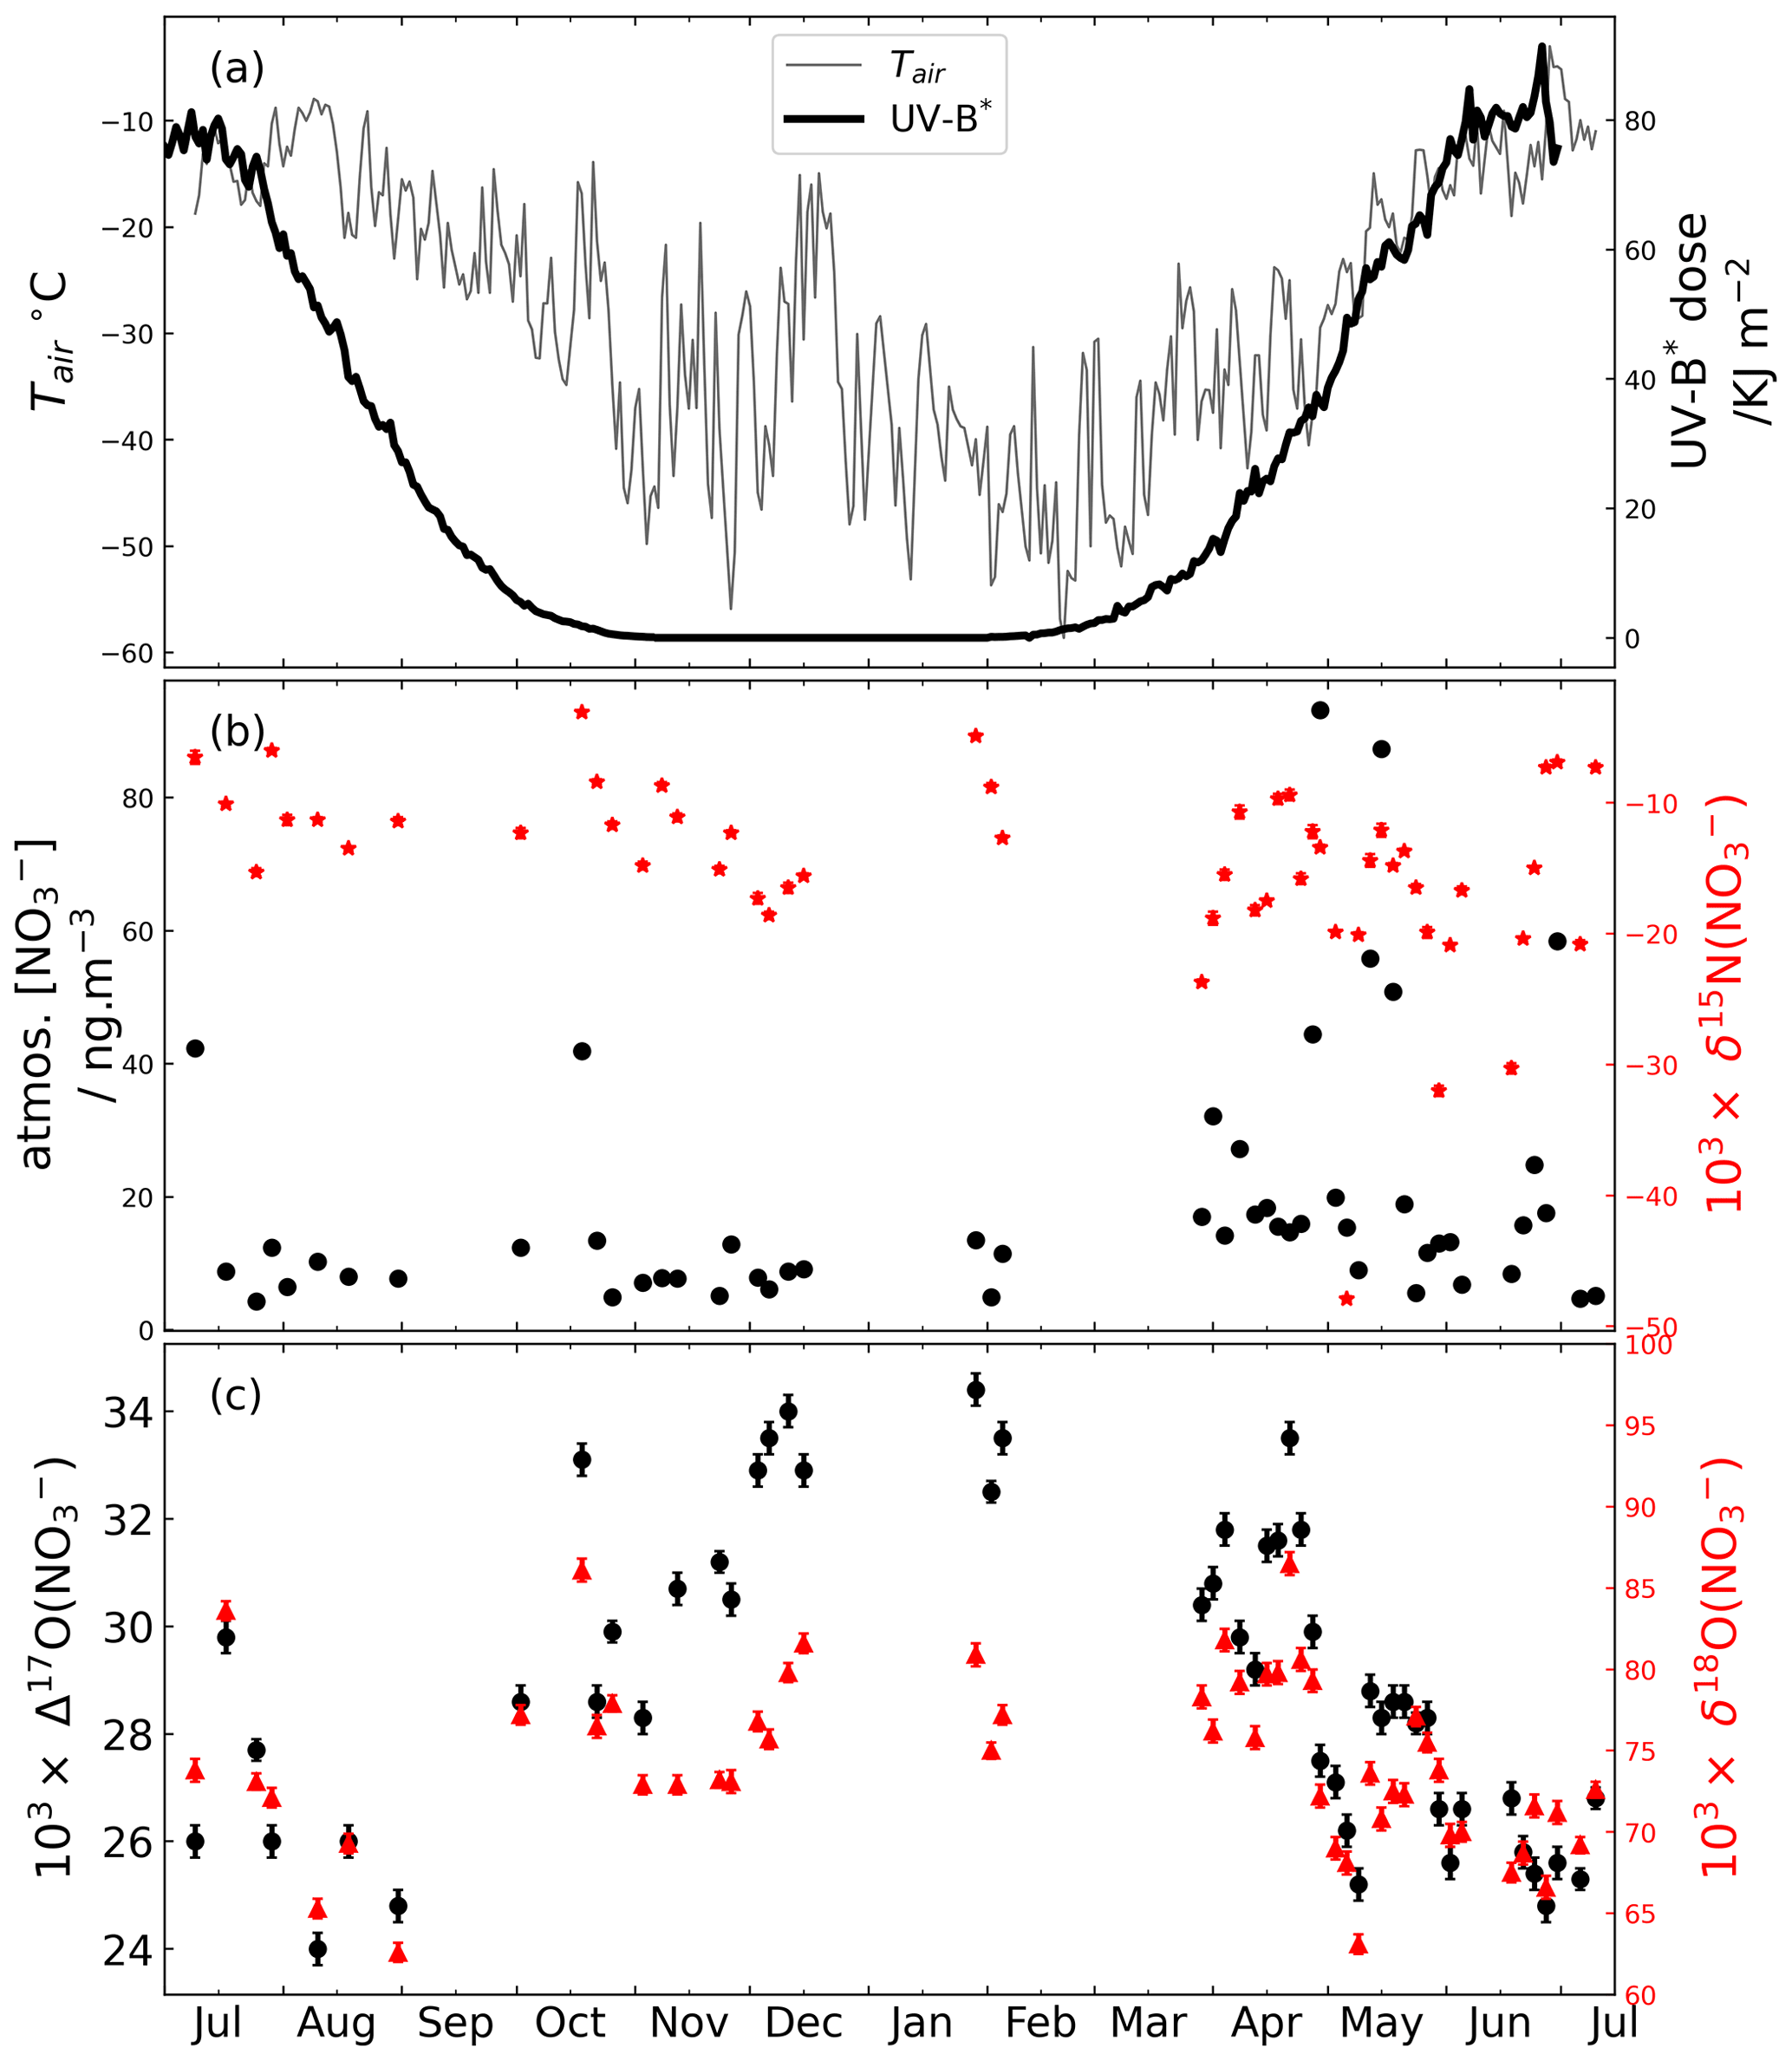
Figure 1Atmospheric nitrate concentrations and isotopes at Summit over the sampling period (July 2001 to July 2002). (a) Daily air temperature and observed UV-B* (280–320 nm) dose at Summit, Greenland, from July 2001 to July 2002 (data source: NSF Arctic Data Center, link: https://arcticdata.io/catalog/data, last access: 13 June 2022), (b) NO concentration (black circle) and δ15N(NO) (red star), and (c) Δ17O(NO) (black circle) and δ18O(NO) (red triangle).
3.1 Year-round atmospheric nitrate concentrations and isotopes at Summit, Greenland
The measured nitrate concentrations and isotopic compositions (δ15N, Δ17O and δ18O) in the filter samples are shown in Fig. 1, together with surface air temperature and UV-B∗ level (wavelength ranges from 280 to 320 nm) measured at Summit station. As shown in the figure, the annual mean atmospheric NO concentration was (19.9 ± 19.1) ng m−3, and most of them ranged from ∼ 1 to 95 ng m−3, consistent with the values reported by previous studies at Summit (Supplement). There was no distinct seasonal pattern in atmospheric nitrate concentrations, but some spikes (samples with much higher nitrate concentrations than average) in spring and summer months were observed, which are typical to intrusion of Arctic haze events at the altitude of the ice sheet (Quinn et al., 2007; Jaffrezo et al., 1997). Alternatively, these nitrate concentration spikes could reflect a more efficient scavenging of atmospheric nitrate by sea salt aerosol during transport, as indicated by the elevated Na+ concentration in Summit aerosol during April and May (Rhodes et al., 2017).
The atmospheric δ15N(NO) was negative throughout the year with an annual mean of (−14.8 ± 7.3) ‰. The springtime atmospheric δ15N(NO) exhibited a significantly lower shift compared to other seasons (two-sided t test, pz = 0.001), and the average for the winter half year was (−12.0 ± 4.2) ‰, slightly higher than that of (−16.0 ± 3.9) ‰ in the summer half year. The mean atmospheric δ15N(NO) from May to June was (−19.3 ± 9.6) ‰, close to the value of (−16.8 ± 8.7) ‰ reported by Fibiger et al. (2016) covering the same months. In addition, some extremely negative δ15N(NO) values (<−30 ‰) were observed in spring and summer months. Such very low δ15N(NO) values were also observed by Fibiger et al. (2016).
The atmospheric Δ17O (NO) values ranged from 24.0 ‰ to 34.4 ‰ with a seasonal minimum near mid-summer, concurrent with the maximum UV-B∗ radiation intensity (Fig. 1a), and a peak in winter. The atmospheric δ18O(NO) data ranged from 49.7 ‰ to 86.5 ‰ and displayed an almost identical seasonal pattern with Δ17O(NO). The similar seasonality between δ18O(NO) and Δ17O(NO) is expected. At the seasonal scale, the primary controlling factor of atmospheric δ18O(NO) and Δ17O(NO) is the relative importance of O3 versus HOx to nitrate formation in different seasons. In summer, HOx oxidation is more important and leads to nitrate with lower δ18O(NO) and Δ17O(NO), while in winter O3 oxidation is more important and leads to higher δ18O(NO) and Δ17O(NO) (Alexander et al., 2020; Michalski et al., 2012). The δ18O(NO) values between March and June ranged from 63.1 ‰ to 86.5 ‰, much higher than the values (24 ‰ to 50 ‰) reported by Jarvis et al. (2009) and in the upper band of that (37.4 ‰ to 93.4 ‰) reported by Fibiger et al. (2016) over the same months (but in different years). Note that the Jarvis et al. (2009) and Fibiger et al. (2016) studies reported values for atmospheric gas-phase HNO3 instead of bulk nitrate. Overall, the absolute values and the seasonal patterns of Δ17O(NO) were similar to those observed in snowpack samples at Summit (Kunasek et al., 2008; Geng et al., 2014), while those of δ18O(NO) were similar to that reported for snowpack samples by Hastings et al. (2004).
3.2 Compiled seasonal δ15N, δ18O and Δ17O in atmospheric, surface snow and snowpack nitrate
The compiled nitrate isotopes (i.e., δ15N δ18O Δ17O) with monthly or seasonal resolutions are plotted in Fig. 2. These compiled data of atmospheric, surface snow and snowpack averages should represent the status of nitrate before deposition and after deposition and archival, respectively. To validate our dating results on the snowpack data, we also plotted the resampled monthly snowpack Na+ concentration and Cl− Na+ ratio. As shown in Fig. 2e, the Na+ concentration and Cl− Na+ ratio displayed a clear winter and summer peak, respectively, indicating a general reliability of our dating method. We also calculated the accumulated UV-B∗ daily dose for nitrate deposited in different weeks of a year using Eq. (2):
where A(t) and ze represent the weekly snow accumulation rate and e-folding depth (12.3 cm; Jiang et al., 2021) at Summit, respectively. The daily UV-B∗(t) dose was shown in Fig. 2a. The accumulated UV-B∗ dose computed here represents the integrated UV-B∗ radiation that snow nitrate received from being deposited on surface snow until being buried below the photic zone (≈ 40 cm according to Jiang et al., 2021). This gives a first-order estimation of the total radiation (i.e., the degree of post-depositional processing) that the archived nitrate experienced at Summit.
The snowpack samples from Geng et al. (2014) cover ∼ 3 years of snow accumulation, and we averaged the monthly data of the 3 years for each month. As shown in Fig. 2b, its seasonal δ15N(NO) variation displays an overall good agreement with that reported by Hastings et al. (2004) and Jarvis et al. (2009) with a spring peak. In general, the δ15N(NO) data among different sample types indicated a systematic pattern for spring and summer samples, with the atmospheric samples the most depleted (−16.0 ± 7.9) ‰ and the snowpack samples the most enriched (2.7 ± 3.0) ‰, while the surface snow samples were in between (−5.8 ± 0.7) ‰. In addition, the snowpack δ15N(NO) data indicated a clear spring and summer maximum coincident with the maximum accumulated UV-B∗ dose (Fig. 2a), while the surface snow δ15N(NO) was only moderately enriched in spring and summer compared to other seasons. For atmospheric δ15N(NO), although uncertainties of the monthly averages were large, they were moderately depleted in spring and summer compared to other seasons, opposite to the surface snow and snowpack data. In addition, for fall and winter seasons, the δ15N(NO) values of different sample types converged, opposite to their behaviors in spring and summer when they diverged. Note that the atmospheric samples from Jarvis et al. (2009) collected in April and May were for gas-phase HNO3, and their δ15N(NO) values were higher than those in atmospheric nitrate measured by this study but within the range of those in surface snow and lower than those in snowpack.
The compiled monthly Δ17O(NO) values are shown in Fig. 2c. Atmospheric Δ17O(NO) values were consistent with the snowpack values throughout the year, and both atmospheric and snowpack Δ17O(NO) reached a seasonal minimum in summer. Surface snow Δ17O(NO) was only available in May and June as reported by Fibiger et al. (2016), and although highly variable, their averages were consistent with the May and June Δ17O(NO) averages in the atmosphere and snowpack.
The compiled δ18O(NO) results are shown in Fig. 2d. Although the summer minimum for the snowpack data from Geng et al. (2014) was not as obvious as those reported by Hastings et al. (2004) and the atmospheric data reported in this study, the δ18O(NO) data in general indicated a summer minimum. In comparison, the surface snow and snowpack data from Jarvis et al. (2009) indicated a fall minimum, and the original data of Jarvis et al. (2009) indicated a clear summer maximum in the year 2005. These data are nevertheless difficult to interpret given the current understanding of nitrate formation mechanisms which should lead to a summer low and winter high for δ18O(NO). But we note that caution should be taken when interpreting the Jarvis et al. (2009) data as there was a large difference in δ18O(NO) data from one winter (69.5 ± 5.0) ‰ (n=7) to the next (101.1 ± 7.9) ‰ (n=4). In addition, the averaged δ18O(NO) of atmospheric nitrate in gas-phase samples collected by Jarvis et al. (2009) in March and June is (34.1 ± 1.7) ‰, and that by Fibiger et al. (2016) in May and June is (54.2 ± 8.5) ‰ for the year 2010 and (90.5 ± 12.5) ‰ for the year 2011. These values are out of range of the snow samples, as well as our atmospheric samples, and in order to better show the seasonality of δ18O(NO) in snow and atmospheric samples as indicated by other data, we did not plot these data in Fig. 2d. Overall, the δ18O(NO) data were more variable than the Δ17O(NO) data, and there were inconsistences among different observations.
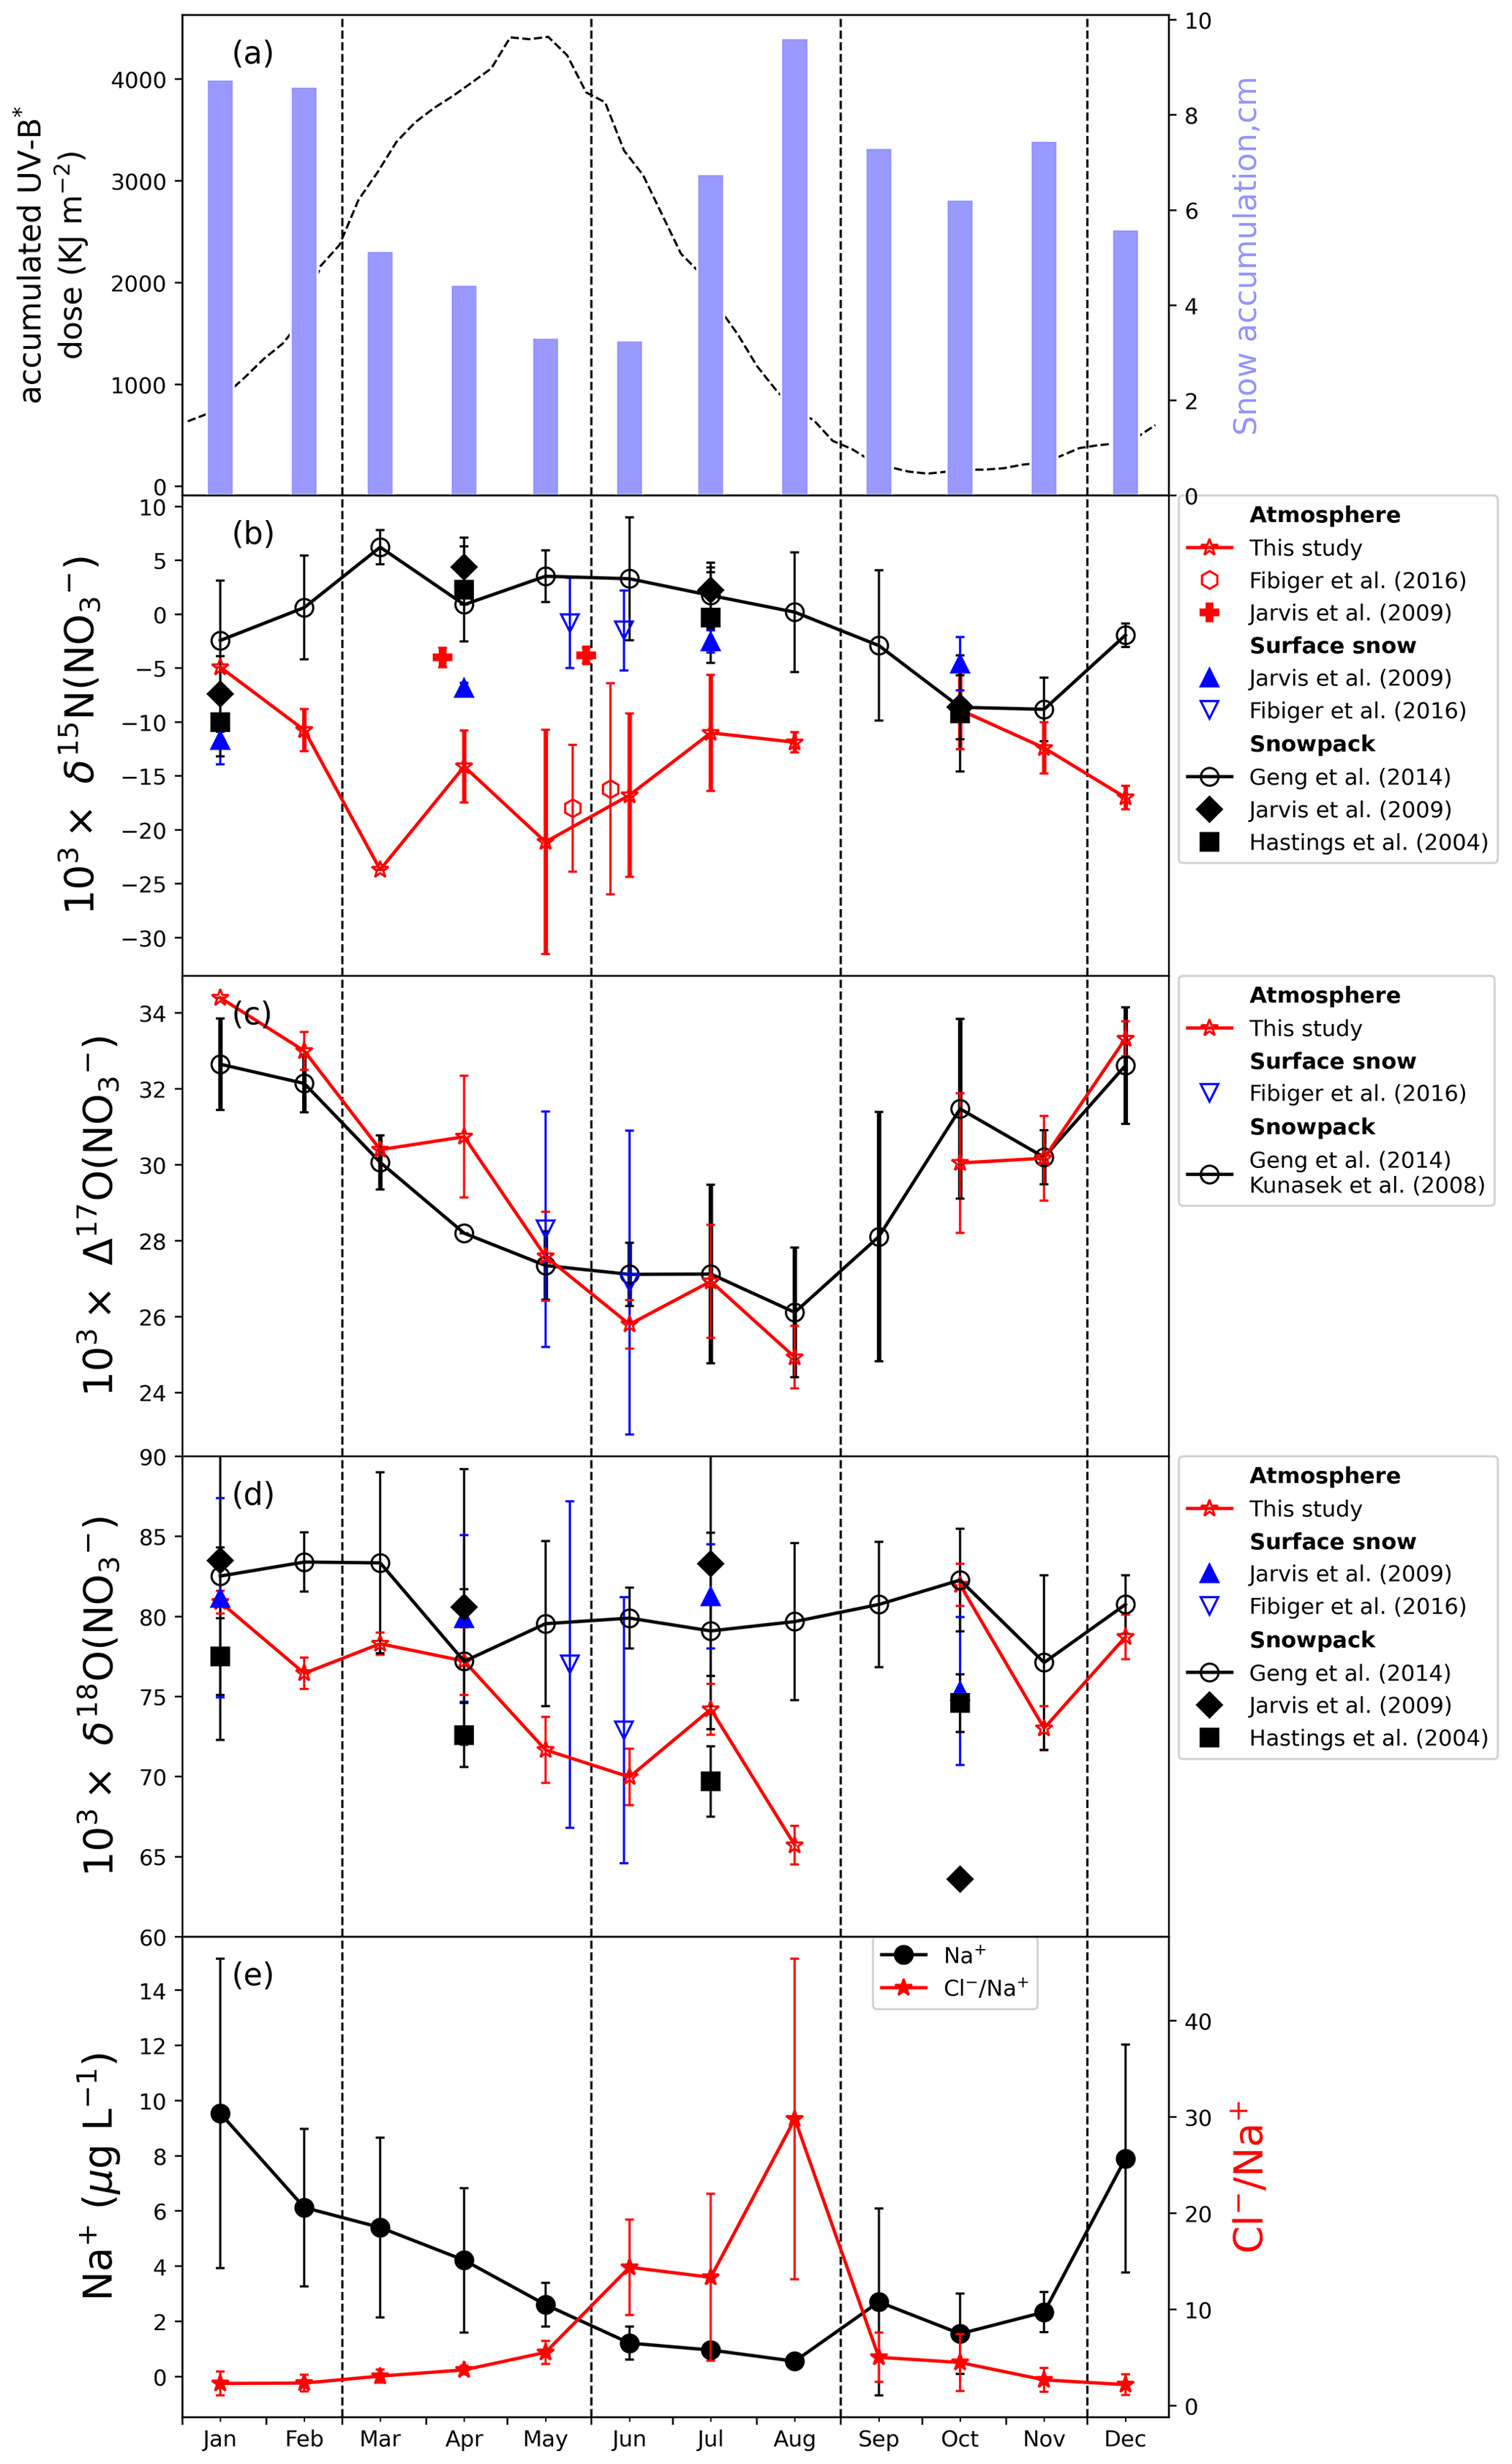
Figure 2(a) Cumulative UV-B∗ dose as a function of the deposited time (dashed black line) calculated according to Eq. (2) and monthly snow accumulation in centimeters (bar plot). The cumulative UV-B∗ dose represents the actinic dose that would have been experienced by snowpack nitrate deposited at different times. (b–d) Compiled monthly and/or seasonal atmospheric, surface snow and snowpack δ15N Δ17O δ18O(NO) data at Summit, Greenland. (e) Compiled monthly snowpack Na+ concentration and Cl− Na+ ratio. The seasonal data (represented by the filled markers) were plotted against the central month of each season. The monthly data were represented by the hollow markers. The vertical lines represent the interval of seasons. The error bar represents 1 standard error for the monthly or seasonal mean. Data sources are summarized in Table 1. The atmospheric δ18O(HNO3) data in Fibiger et al. (2016) and Jarvis et al. (2009) are both out of range of the snow samples, as well as our atmospheric samples, and thus are not shown here.
4.1 Seasonal δ15N(NO) and its difference between atmospheric, surface snow and snowpack nitrate
The atmospheric, surface snow and snowpack samples represent different stages of nitrate in the deposition and preservation processes. The compiled results in Fig. 2b indicated a systematic enrichment in δ15N(NO) from deposition to preservation for spring and summer nitrate. This systematic enrichment refutes the previous hypothesis that seasonal variation in snowpack δ15N(NO) at Summit was driven by shifts in the relative importance of NOx sources (Hastings et al., 2004). Instead, local processes leading to fractionations in δ15N(NO) are needed to reconcile the observed differences between atmospheric and snowpack δ15N(NO). Previous studies suggest there were several processes occurring at the air–snow interface related to nitrate deposition and preservation that could lead to nitrogen fractionation, including (i) fractionations during snow nitrate photolysis and physical release (Berhanu et al., 2014; Erbland et al., 2013; Frey et al., 2009; Jiang et al., 2021; Shi et al., 2019) and (ii) the proposed fractionation during nitrate deposition related to the different deposition mechanisms (Erbland et al., 2013). Jiang et al. (2021) have discussed the effect of the physical release on nitrate isotopes and suggest that this effect is negligible at Summit. This is because the physical release rate and the associated isotope effects are relatively small at cold temperatures. Shi et al. (2019) performed field NO volatilization experiments and found no isotope fractionation occurring in δ15N(NO) when the temperature was set to −24∘C. When the temperature increased to −4∘C, a small positive fractionation constant (4.9 ± 2.1 ‰) was observed, while at Summit the temperature is below −10∘C throughout the year, as shown in Fig. 1a. In the following sections, we discuss the other processes and compare them with the modeling study results from Jiang et al. (2021) to discern the exact cause(s) of the observed systematic changes in δ15N(NO) from the atmosphere to snowpack.
4.1.1 The effects of snow nitrate photolysis
The δ15N(NO) pattern in the summer half year among different types of samples, i.e., atmospheric δ15N(NO) < surface snow δ15N(NO) < snowpack δ15N(NO), is qualitatively consistent with the effects of snow nitrate photolysis which enriches snow δ15N(NO) while providing a snow source of depleted δ15N(NO) to the atmosphere. In fact, the negative isotope fractionation factor associated with nitrate photolysis would favor the release of NOx with lighter 14N, which would rapidly reform nitrate in the overlying atmosphere given the short lifetime of NOx at Summit (typically several hours in summer). The snowpack δ15N(NO) variations within a year showed a similar trend with the accumulated UV-B∗ dose (Fig. 2a and b), i.e., the δ15N(NO) peak and valley corresponded to the seasons with the highest (i.e., spring) and the lowest (i.e., fall) accumulated UV-B∗ dose, respectively. The accumulated UV-B∗ dose reflects the total amount of radiation leading to photolysis (wavelength of 280 to 320 nm) that snow nitrate received before archival for a given snow layer. In contrast, during the winter half year when there is an absence of sunlight, δ15N(NO) among different types of samples are similar, suggesting that the physical transfer between atmosphere and snowpack (deposition, evaporation) leads to negligible 15N isotopic fractionations.
The atmospheric δ15N(NO) in the summer half year should represent the combined signal of primary nitrate from long-range transport and the snow-sourced nitrate from photolysis (Jiang et al., 2021), while in winter atmospheric δ15N(NO) should be less influenced by snow-sourced nitrate and perhaps dominated by primary nitrate. Snow-sourced atmospheric nitrate is very depleted in δ15N(NO) (<−70 ‰ at Summit; Jiang et al., 2021), and its flux to the overlying atmosphere should maximize in summer when surface UV radiation is the strongest. All else being equal, one should expect the summer atmospheric δ15N(NO) to be the lowest throughout the year. This appears to be in conflict with the observations which indicated the spring atmospheric δ15N(NO) was the lowest. Possible explanations for this could be related to spring and summer differences in the export fraction of the snow-sourced nitrate or the δ15N(NO) of primary nitrate. Cohen et al. (2007) conducted studies on the boundary layer dynamics at Summit and found that sustained stable surface layer conditions were frequently observed during spring at Summit, while in summer the boundary layer became more convective. The more stable boundary layer conditions in spring may lower the export fraction of the snow-sourced nitrate compared to summer, which tends to lower the spring atmospheric δ15N(NO) as more snow-sourced nitrate with extremely low δ15N will accumulate in the local boundary layer. Honrath et al. (2002) found that at Summit in summer the snow-sourced nitrate (their measured form was NOx) was not balanced by downward HNO3 flux and suggested that without wet deposition the emitted NOx and reformed HNO3 should be largely exported from the local boundary layer. In addition, Jiang et al. (2021) suggested that the primary nitrate flux dominates the nitrate budget at Summit, and even in mid-summer the snow-sourced nitrate only accounts for about 25 % of total atmospheric nitrate. If δ15N of primary nitrate in summer was higher than that of primary nitrate in spring, the local atmospheric δ15N(NO) at Summit could be still higher in summer even when the contribution of snow-sourced nitrate was larger. Other possible explanations could be (i) the area of snow cover in the Arctic basin is larger in spring than summer, which acts to increase the snow-sourced nitrate with depleted δ15N(NO) and may offset the effects of higher summer actinic flux on snow nitrate photolysis; and (ii) the planetary boundary layer in summer is probably higher than that in spring at Summit, so the effects of snow-sourced nitrate on the atmospheric nitrate budget is greater in spring than in summer.
To better understand the effects of the photo-driven post-depositional processing, we quantitatively compared and analyzed the δ15N(NO) averages in spring when the isotopic differences between surface snow and snowpack are the most pronounced as indicated by the compiled data and the modeling results by Jiang et al. (2021). Since the surface snow δ15N(NO) data in Fibiger et al. (2016) only covered 2 months, we mainly focus on the seasonal data covering 2 years from Jarvis et al. (2009). However, we note the surface snow δ15N(NO) data in Fibiger et al. (2016) was remarkably higher than those in Jarvis et al. (2009) for the same months, which likely indicated the heterogeneity among data from different years. Compared to surface snow nitrate, snowpack nitrate was enriched by (12.8 ± 2.6) ‰ in spring in our compiled dataset, as seen in Fig. 2b. This value should reflect the effect of post-depositional processing on snow nitrate throughout its preservation, i.e., from being deposited on the surface to being archived below the photic zone. In Jiang et al. (2021), this effect was defined as PIE, i.e., the photo-induced isotope effect, and calculated as the difference between surface snow δ15N(NO) and archived snow δ15N(NO). The PIE in spring calculated by the TRANSITS model is averaged at (14.3 ± 1.1) ‰, consistent with the compiled data. Calculating the PIE only requires one to compute the relative nitrate loss induced by nitrate photolysis, which makes the PIE independent of the initially deposited nitrate δ15N and a good tracer of the isotopic effect of post-depositional processing. Here we propose a simplified formula of PIE for quick assessment of the photo-driven post-depositional processing effect on δ15N(NO) at any sites of interest:
where t0 represents the time of nitrate deposited on snow surface in a year (i.e., the starting time of photolysis), and ta is the time for snow nitrate to reach a depth below the snow photic zone (i.e., the archival layer) (3 times the e-folding depth). t is the time variable between t0 and ta. ε and J represent the N isotope fractionation factor and nitrate photolysis rate constant for snow nitrate under surface conditions, respectively. Both ε and J vary seasonally owing to the time-varied actinic flux, while the decrease in nitrate photolysis rate constant with depth is constrained by the exponential term. ze and A(t) represent the e-folding depth and snow accumulation rate, respectively. Here we do not consider the changes in ε with depth as both the TRANSITS model calculation and laboratory experimental results suggested ε is not sensitive to the attenuation of radiation in snow (Berhanu et al., 2015). The diffusion smoothing in δ15N(NO) is also not considered, as the observed multi-year snowpack δ15N(NO) profiles do not show any distinct smoothing (Frey et al., 2009; Shi et al., 2015). The cage effect is also neglected in Eq. (3), which may not hold when the snow accumulation rate is relatively low. Essentially Eq. (3) is the same as Eq. (2) because they both describe the total actinic flux received by a specific snow layer before archival, but Eq. (3) provides a direct way to evaluate the induced isotope effects on δ15N. For illustrative purposes, we calculated PIE of snow nitrate deposited at different times of the year under typical Summit conditions and compare them with the model output from Jiang et al. (2021). As shown in Fig. 3, the calculated PIE according to Eq. (3) is consistent with the output from the TRANSITS model. The small departure is likely caused by the use of a more simplified J value with time in calculations as the TRANSITS model also considers the changes in TCO. Using Eq. (3), one should be able to quickly assess the effect of photolysis on the preserved snow δ15N(NO) as long as the J value and weekly or seasonal accumulation rate are known.
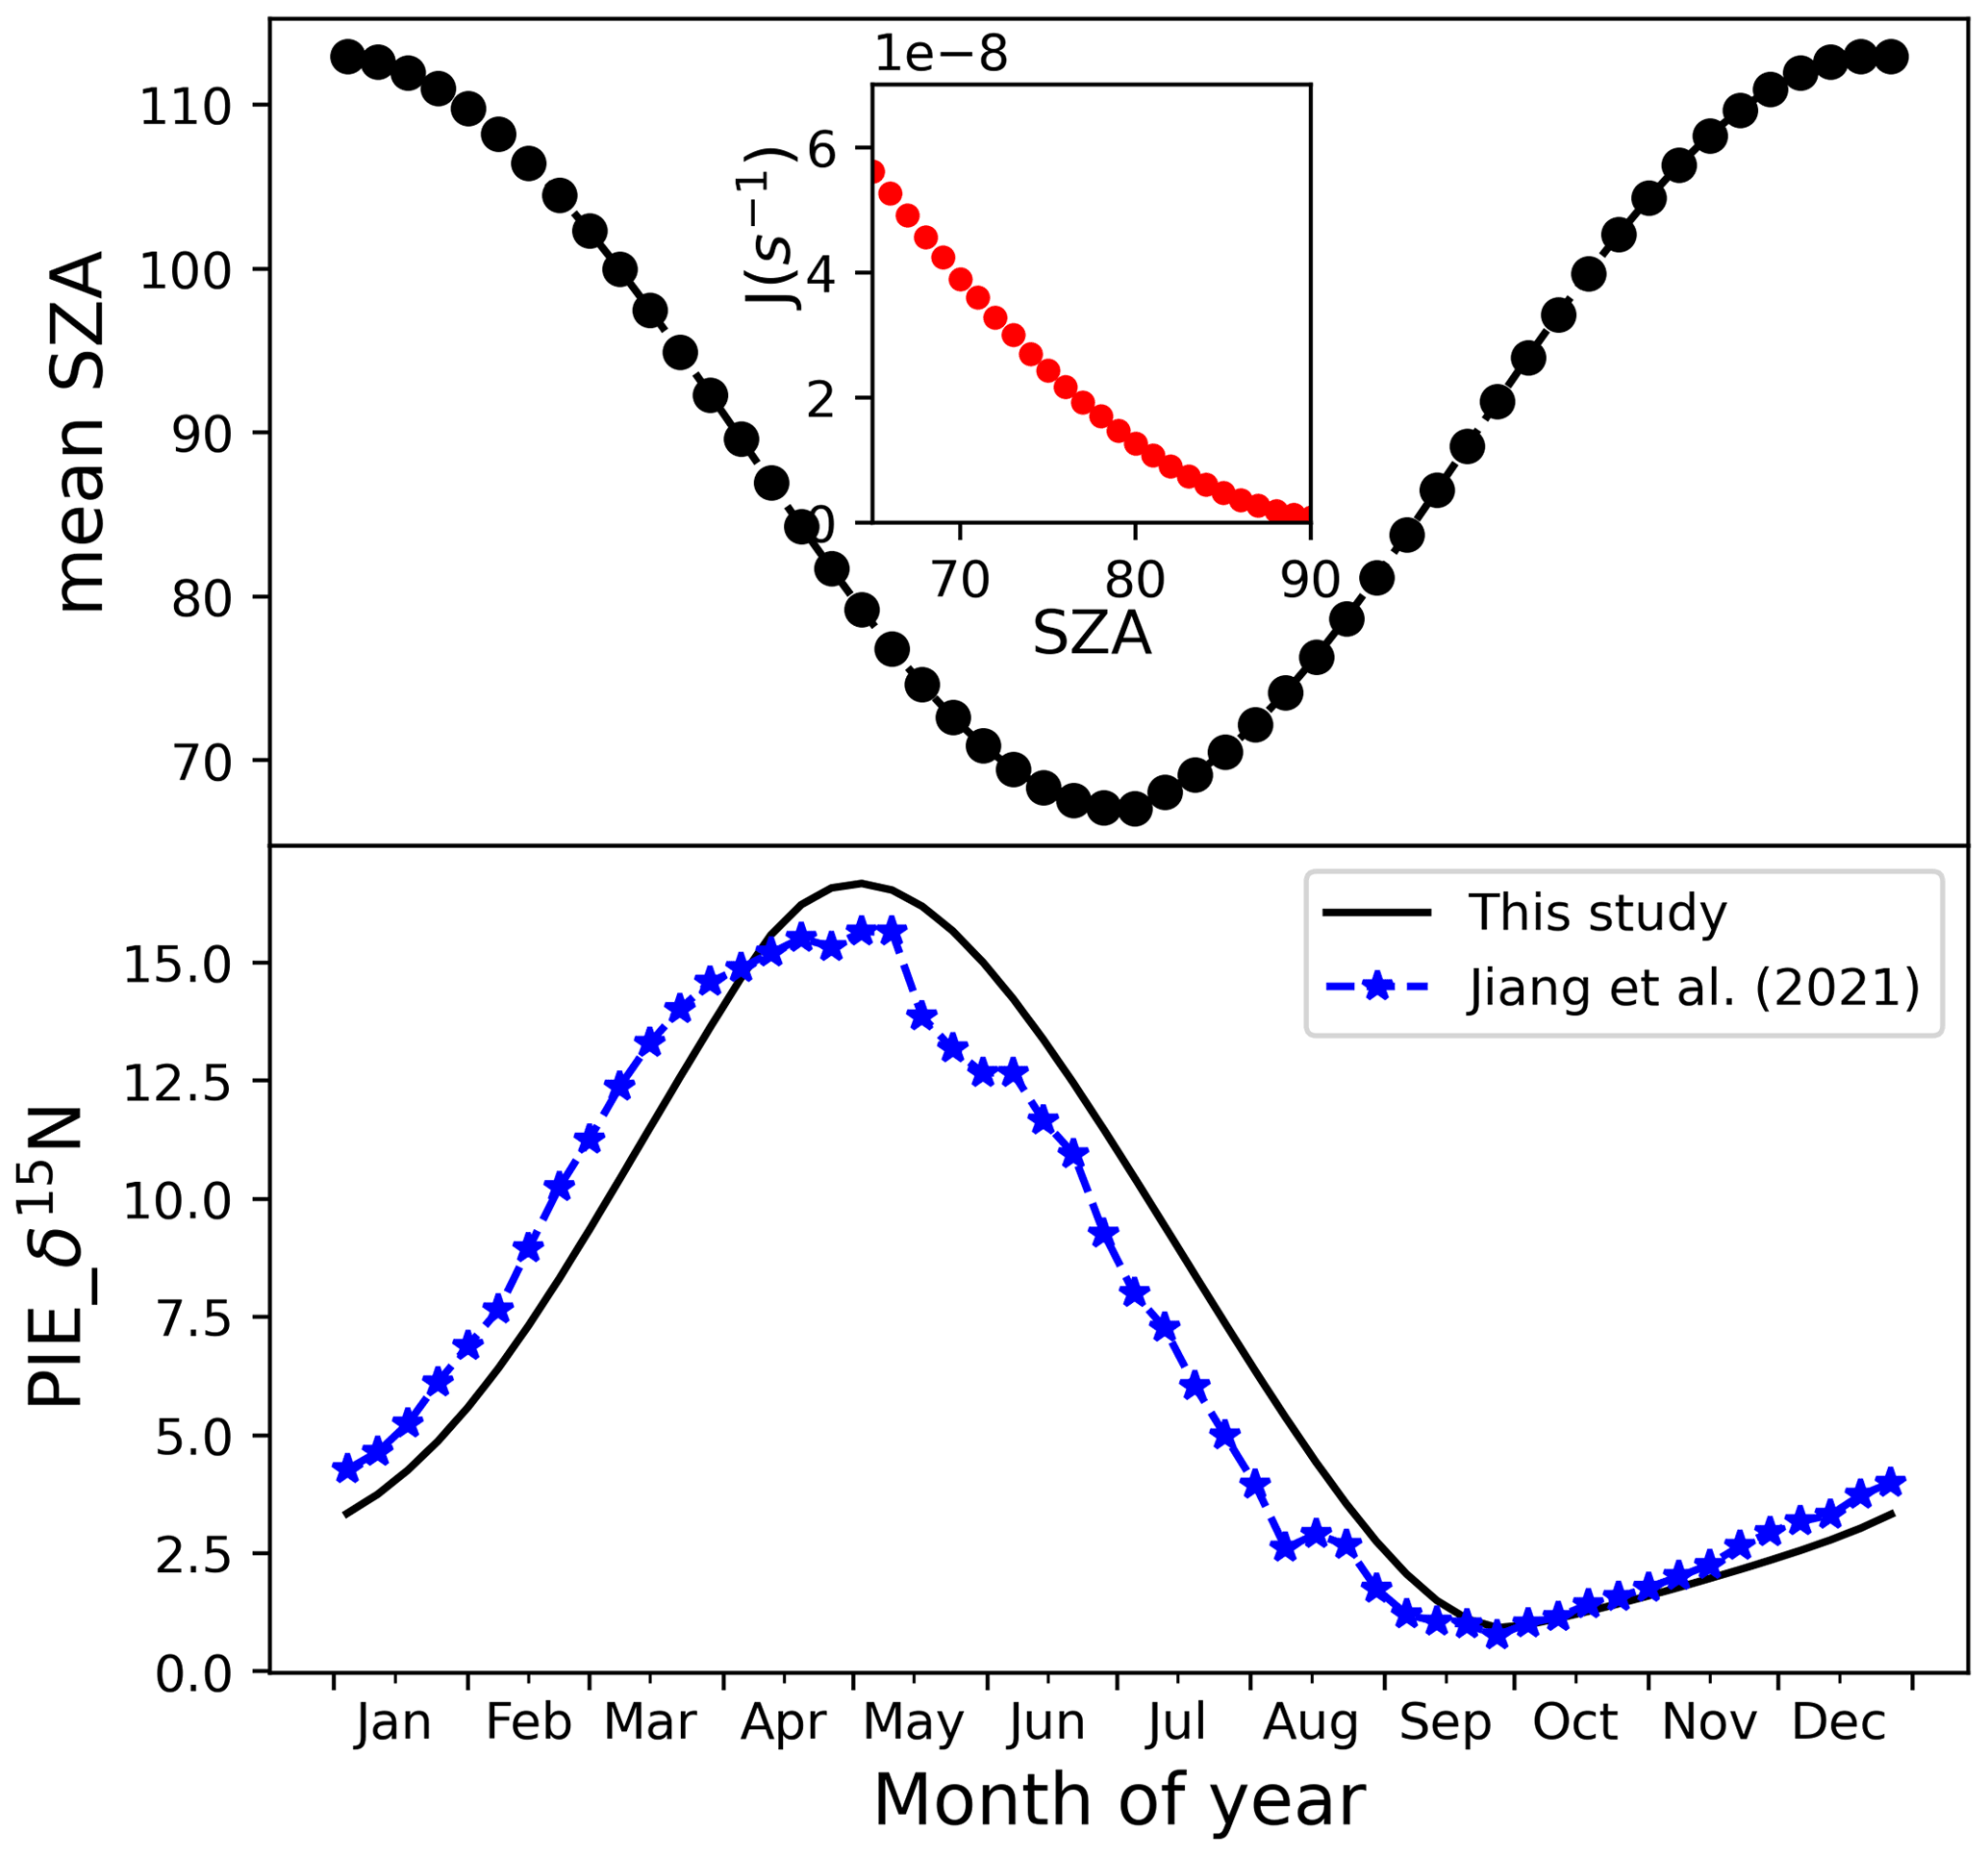
Figure 3Upper panel: weekly average solar zenith angle (SZA) (shown in black circles) at Summit within a year and nitrate photolysis rate constant (J) as a function of SZA (shown in red circles in the inset). The summertime J value is from Galbavy et al. (2007), and we scaled it with SZA to obtain J values for other months for simplicity. Lower panel: calculated PIE using Eq. (3) and that from the TRANSITS model in Jiang et al. (2021); weekly snow accumulation rates were from bamboo stake measurements by Dibb et al. (2004).
The δ15N(NO) of atmospheric nitrate was depleted by (9.8 ± 5.1) ‰ relative to surface snow nitrate during spring (Fig. 2b). In summer, the depletion was (9.1 ± 5.1) ‰, decreased to (4.0 ± 4.3) ‰ in fall and became negligible in winter. Fibiger et al. (2015) and Jarvis et al. (2009) made short-term field observations at Summit in spring and early summer in different years by simultaneously collecting atmospheric gas-phase HNO3 and surface snow for isotope analyses. The Fibiger et al. (2015) results suggested that the surface snow nitrate was enriched in δ15N(NO) by ∼ 12 ‰–15 ‰ compared to atmospheric nitrate in May and June on average, close to the result (∼ 10 ‰) of the compiled data. However, despite using similar sampling techniques (mist chamber) for collection of gas-phase HNO3 in March and May, Jarvis et al. (2009) found no significant δ15N(NO) differences between gas-phase and surface snow nitrate. Note that the reported nitrate concentration from Jarvis et al. (2009) was high (> 3 nmol m−3 STP, standard temperature and pressure, which equals 67.2 pptv, parts per trillion by volume) compared to other studies (ranges from 10 to 20 pptv) (Supplement). This may imply potential contamination during sampling of the gas-phase HNO3 in Jarvis et al. (2009) collections.
Nevertheless, the enrichments of δ15N(NO) in surface snow compared to atmospheric nitrate and its seasonal difference (larger in the summer half year) also imply the effect of the photo-driven post-depositional processing. Erbland et al. (2013) also observed enriched δ15N(NO) in surface snow nitrate compared to atmospheric nitrate at Dome C, Antarctica. At Dome C, the seasonal pattern of the surface snow–atmosphere enrichments was similar to that at Summit, being the largest in austral spring (∼ 30 ‰) and the smallest in austral winter (∼ 10 ‰). In addition, the enrichment at Dome C was observed throughout the year, and even in winter there was still a ∼ 10 ‰ enrichment. The elevated enrichment of δ15N(NO) in surface snow nitrate compared to atmospheric nitrate in spring and summer observed both at Summit and Dome C suggests the role of photolysis as proposed by Erbland et al. (2013). Compared to surface snow, atmospheric nitrate is more influenced by snow-sourced nitrate which is severely depleted in δ15N (−60 ‰ to −100 ‰; Jiang et al., 2021). In addition, surface snow nitrate has experienced photolysis, which tends to increase its δ15N relative to the originally deposited nitrate. Winton et al. (2020) also suggested that at DML low snow accumulation rate and ample solar radiation tends to alter the original deposited nitrate signal through photolysis even for the skin layers (defined as the uppermost 0.5 cm of snow). At Summit, although the snow accumulation rate is high compared to the East Antarctic plateau, unless frequent snowfall occurs to wash out atmospheric nitrate to refresh the surface snow δ15N(NO), dry deposition of atmospheric nitrate is unable to influence the budget of nitrate in surface snow (1–3 cm) and disturb its δ15N(NO) even in a period of a few weeks (Jiang et al., 2021). This is because (i) snow is a much larger reservoir of nitrate compared to the atmosphere and (ii) the nitrate dry deposition flux is very low (Bergin et al., 1995; Dibb et al., 1998).
4.1.2 The potential role of nitrogen isotope fractionation during deposition
Different from Summit, around +10 ‰ enrichment in surface snow δ15N(NO) compared to atmospheric nitrate exists at Dome C during winter in the absence of sunlight. Erbland et al. (2013) attributed this winter enrichment to nitrogen isotope fractionation during nitrate deposition which increases δ15N(NO) in the deposited nitrate compared to the atmospheric pool, and they suggested this also contributes to the observed surface snow to atmospheric enrichment in spring and summer. However, the Summit data indicated no such enrichment in the winter, and this appears to be in conflict with the suggested deposition fractionation by Erbland et al. (2013). Although a detailed physical mechanism leading to the deposition fractionation remains unknown, we speculated that the fractionation might be related to the form of deposition. Given the large difference in snow accumulation rate at Summit (250 kg m−2 a−1) and Dome C (25 kg m−2 a−1), their main nitrate deposition mechanism might be quite different. At Dome C, nitrate concentration in the skin layer is mainly controlled by adsorption and co-condensation of atmospheric nitrate (Bock et al., 2016; Frey et al., 2009; Chan et al., 2018), while at Summit, the dominant mechanism for nitrate incorporation into snow grain is the surface uptake during wet scavenging of atmospheric nitrate (Röthlisberger et al., 2002). Since wet deposition can efficiently scavenge atmospheric nitrate, a more complete removal of atmospheric nitrate at Summit compared to Dome C may occur, which would induce little to no isotope fractionation in δ15N due to mass balance. However, for surface snow that continues to incorporate atmospheric nitrate via co-condensation or dry deposition (adsorption/desorption) after snowfall events, isotope fractionation could occur and lead to detectable enrichments in surface snow nitrate. The surface snow to atmospheric nitrate enrichments of δ15N(NO) at Summit also appears to support the speculated role of fractionation during nitrate deposition. As shown in Fig. 2b, the maximum enrichments occurred in spring and summer, which was also the time with the lowest weekly average snow accumulation rate in a year (Burkhart et al., 2004), and dry deposition of atmospheric nitrate would account for a larger fraction of the total deposited nitrate, which leads to large isotope fractionation effect.
In summary, the systematic differences in δ15N(NO) between atmospheric, surface snow and snowpack samples are consistent with the expected effects of the photo-driven post-depositional processing, while the occurrence and mechanism(s) of nitrogen isotope fractionation during deposition and its contribution to the surface snow–atmospheric δ15N(NO) enrichment need to be further explored and confirmed.
4.2 The oxygen isotope systematics
4.2.1 The similarity of Δ17O(NO) in atmospheric and snowpack nitrate
The atmospheric and snowpack Δ17O(NO) display similar seasonality, and their absolute values were similar (Fig. 2c). The seasonal variations in Δ17O(NO) are well understood as the seasonal shift of dominant HNO3 formation pathways from summer (NO2+ OH → HNO3 with low Δ17O) to winter (N2O5 hydrolysis with high Δ17O) (Alexander et al., 2020), so we do not discuss the cause of the seasonality in further detail. In the following discussion, we focus on the processes occurring at the air–snow interface and in snow and their effects on Δ17O(NO).
Frey et al. (2009) proposed that nitrate in the uppermost layer of snow should reach equilibrium with atmospheric nitrate to maintain consistent isotope ratios. However, the large difference between atmospheric and surface snow δ15N(NO) at Dome C in Antarctica and Summit in Greenland suggests no equilibrium. Conversely, an equilibrium in Δ17O(NO) appears to exist. Erbland et al. (2013) made year-round observations of atmospheric nitrate and nitrate in the skin layer at Dome C and found that Δ17O(NO) in the skin layer was similar to atmospheric Δ17O(NO) except in spring when Δ17O(NO) was ∼ 5 ‰ higher than the former. This was explained by a reservoir effect by Erbland et al. (2013) as the surface snow is always a much larger reservoir for nitrate relative to the atmosphere, and there might be a delay in skin layer nitrate variations compared to the changes in atmospheric nitrate.
Although annual surface snow Δ17O(NO) data are not available at Summit, the two short-term observations by Fibiger et al. (2016) show that the atmospheric and surface snow Δ17O(NO) are not significantly different. Note that the Fibiger et al. (2016) surface snow data have much finer temporal resolution (4–12 h) and show larger variability, but the averages fell well within the ranges of the atmospheric and snowpack data at longer time resolution. As proposed by Frey et al. (2009), one should expect a similar trend in atmospheric and surface snow Δ17O(NO) (i.e., an equilibrium). This is because Δ17O(NO) is a mass-independent fractionation signal and will not be affected by deposition processes or be directly affected by snow nitrate photolysis as these processes only induce mass-dependent fractionation. Once deposited, the only process that would influence snow Δ17O(NO) is the cage effect (Frey et al., 2009; McCabe et al., 2005; Meusinger et al., 2014). The cage effect incorporates water with Δ17O around 0 ‰ in the reformed nitrate and therefore lowers the overall Δ17O of the nitrate compared to nitrate first deposited onto snow. But as observed and discussed by Erbland et al. (2013) and Jiang et al. (2021), the cage effect is likely an accumulated effect over long time periods, and it will not significantly affect Δ17O(NO) in the skin layer or surface snow. This is also supported by the laboratory experimental results showing that the apparent quantum yield was observed to decrease with a longer photolysis time (Meusinger et al., 2014). Therefore, the surface snow nitrate should possess a similar or identical Δ17O signal as atmospheric nitrate, as is observed.
From the surface snow to its final archival, Δ17O(NO) would be further modified by the cage effect. The cage effect on snow Δ17O(NO) is most evident at sites with low snow accumulation rate such as Dome C (Erbland et al., 2013; Frey et al., 2009), where nitrate stays in the photic zone for several years. In comparison, at Summit, the cage effect is negligible (< 0.3 ‰ upon archival, calculated by Jiang et al., 2021), owing to its fast archival (less than a half year), and given the high snow accumulation rate, the archived snow nitrate should carry a similar Δ17O signal to its deposited value at the surface, which is in turn determined by atmospheric nitrate. Therefore, snowpack Δ17O(NO) should be very similar to that of atmospheric nitrate, as is observed (Fig. 2c). However, this does not mean that snow nitrate Δ17O(NO) can be directly linked to primary nitrate. Locally reformed nitrate under sunlight in the summer half year would possess low Δ17O compared to primary nitrate deposited earlier in the season (Kunasek et al., 2009; Jiang et al., 2021) and contribute to the local atmospheric nitrate budget (Jiang et al., 2021).
4.2.2 The atmospheric, surface snow and snowpack δ18O(NO)
Compared to δ15N(NO) and Δ17O(NO), δ18O(NO) displays a much larger variability in terms of monthly averages, as well as in the magnitude of the seasonal variations, and is sometimes inconsistent even for the same type of samples (i.e., atmospheric vs. snow) measured by the same group. For example, Fibiger et al. (2016) reported average atmospheric δ18O(NO) in May and June in 1 year of ∼ 54 ‰, while in the other year it was ∼ 91 ‰. The larger variability in δ18O(NO) is somewhat expected as it is influenced by δ18O in precursor gases (NO, NO2), radicals (O3, OH, BrO, HO2, RO2, etc) and atmospheric water, as well as fractionations during formation (Michalski et al., 2012). Additionally, snow nitrate photolysis also directly influences δ18O with a fractionation factor calculated to be −34 ‰ by Frey et al. (2009) but does not affect Δ17O owing to its mass-independent nature. Some of these processes act to enrich δ18O (e.g., photolysis), while others act to deplete δ18O (e.g., OH oxidation and/or exchange with water).
Conventionally, variations in δ18O(NO) are also used to track nitrate oxidation formation mechanisms, similar to Δ17O (Michalski et al., 2012, and references therein). In general, under sunlight, nitrate formed from the NO2+ OH reaction possesses lower δ18O than that formed from N2O5 hydrolysis under dark conditions. The latter involves more oxygen atoms transferred from O3 which possesses very high δ18O (90 ‰–120 ‰; Johnston et al., 1997; Krankowsky et al., 1995). As a result, higher winter δ18O(NO) and lower summer δ18O(NO) should be expected, as observed for the atmospheric nitrate in this study and many others (Erbland et al., 2013; Savarino et al., 2007; Walters et al., 2019). This is also why we noted that the δ18O(NO) data in Jarvis et al. (2009) should be treated with caution as it indicated a summer maximum, which is difficult to understand given current knowledge. In the following discussion, we do not attempt to describe this discrepancy in Jarvis et al. (2009) compared to other observations and our understanding of processes controlling nitrate δ18O.
Theoretically, after deposition of nitrate to the snow surface, both snow nitrate photolysis and the cage effect will all affect δ18O(NO) but in opposite directions. Similar to Δ17O(NO), there was also a (quasi-)equilibrium in δ18O(NO) between atmospheric and skin layer snow nitrate observed at Dome C, Antarctica (Erbland et al., 2013). Atmospheric gas-phase and surface snow nitrate δ18O(NO) at Summit has been reported by Jarvis et al. (2009) and Fibiger et al. (2016) for spring and summer months. While the Jarvis et al. (2009) study suggested that the surface snow nitrate δ18O(NO) was on average 40 ‰ higher than atmospheric gas-phase HNO3, the Fibiger et al. (2016) study found that surface snow δ18O(NO) was lower than atmospheric nitrate in 1 year but higher in another. The atmospheric gas-phase nitrate δ18O(NO) reported by Jarvis et al. (2009) and Fibiger et al. (2016) was also lower than the atmospheric δ18O(NO) data reported by this study. The seasonal atmospheric and surface snow δ18O(NO) data at Summit also did not indicate an equilibrium. Overall, the proposed equilibrium between atmospheric and surface snow nitrate δ18O(NO) is not supported by current observations.
Because of the lack of sufficient surface snow samples and the relatively large variability among the limited observations by Jarvis et al. (2009) and Fibiger et al. (2015), we are unable to assess the potential oxygen isotope fractionation effects during nitrate deposition. But we note that this could also alter δ18O(NO) along with δ15N(NO), and therefore this point needs to be further explored. After deposition, the post-depositional processing will impact the snow δ18O(NO) in a similar manner as it impacts δ15N. The typical photolysis isotope fractionation factor (18εp) for 18O at Summit was calculated to be −32.8 ‰ using the ZPE (zero-point energy) shift method following Frey et al. (2009). Using the maximum loss fraction of 21% for spring snow from Jiang et al. (2021) and applying the Rayleigh equation, we calculated a maximum PIE of 7.7 ‰ for δ18O(NO). This means that upon archival, snow δ18O(NO) would be enriched by up to 7.7 ‰ by considering only the photolysis fractionation. Conversely, the cage effect works to decrease snow δ18O(NO) by exchanging oxygen atoms with water. A quantification of this effect (but an oversimplified one) is to consider the fraction of exchange of nitrate oxygen atoms with water during the recombination chemistry, but one should keep in mind that the complex kinetic isotope fractionation during the recombination reactions could also affect δ18O(NO) in snow. Here we used a simple mass balance method to assess the magnitude of changes in δ18O(NO) through the apparent “exchange” caused by the cage effect:
where frem and fc represent the remaining fraction of snow nitrate after photolysis and the fraction of exchange of nitrate oxygen atoms with water via the cage effect, respectively. Taking snow δ18O(H2O) to be −35 ‰ (Hastings et al., 2004) and snow nitrate δ18O(NO) to be 80 ‰ (Geng et al., 2014) at Summit, and adapting the frem and fc calculated by Jiang et al. (2021) to be 0.79 and 0.15, respectively, we calculated a maximum decrease in δ18O(NO) of 4.4 ‰ upon archival caused by the cage effect. This is in contrast to Δ17O as the very different δ18O(H2O) and δ18O(NO) value makes the effect significant even for small amounts of exchange. Note fc used here was a purely empirical parameter adapted from Erbland et al. (2015) by best fitting the decreasing trend in Δ17O(NO) observed in Dome C snowpack. If we doubled fc (from 15 % to 30 %), an 8.4 ‰ decrease in δ18O(NO) could be caused by the cage effect at Summit.
These simplified calculations suggest that there might be a difference in atmospheric δ18O(NO) and snowpack δ18O(NO) at Summit, but the magnitude and direction depend on the relative degrees of photolysis fractionation, the cage effect and also other processes mentioned above (e.g., the kinetic isotope fractionation during secondary nitrate formation).
4.2.3 The relationship between Δ17O(NO) and δ18O(NO)
Our atmospheric Δ17O(NO) and δ18O(NO) data exhibited some interesting features. As seen in Fig. 1c, atmospheric Δ17O(NO) and δ18O(NO) appear to diverge during winter, while in summer they were closely linked. The different relationships between δ17O(NO) and δ18O(NO) in different seasons likely suggest different nitrate sources into the local atmosphere, more specifically the perturbation from snow-sourced nitrate in summer. In winter, owing to the low temperature and lack of sunlight, local nitrate production is suppressed and atmospheric nitrate is dominated by primary nitrate via long-range transport. In summer, the reformed atmospheric nitrate from NOx emitted by sunlit snow would possess oxygen isotope signals imprinted by local oxidation conditions that are different form primary nitrate. Although the Δ17O(NO) versus δ18O(NO) relationships for primary nitrate could also vary seasonally, the above explanation is further supported by the observed substantial NOx flux from snow in summer (Honrath et al., 2002), as well as the very negative atmospheric δ15N(NO).
Fibiger et al. (2013) found a strong linear relationship between their measured Δ17O(NO) and δ18O(NO) in surface snow samples at Summit. Based on this relationship they proposed a direct transfer of atmospheric oxygen isotope signals to surface snow at Summit. However, as discussed in Jiang et al. (2021), this relationship should not be viewed as evidence of little to no post-depositional processing. Instead, examining the Δ17O(NO) versus δ18O(NO) relationships among atmospheric, surface snow and snowpack samples may provide some clues on whether or not the photo-driven post-depositional processing impacts the Δ17O(NO) δ18O(NO) ratio since post-depositional processing influences Δ17O(NO) and δ18O(NO) differently. We note that different types of observations are different in their time resolutions. Our atmospheric measurement is typically 3 d per sample, while the surface snow samples (1–2 cm thickness) in Fibiger et al. (2013) represented weekly accumulation, and snowpack sample resolution (5 cm per sample; Geng et al., 2014) is closer to monthly resolution. The linear regression relationship in surface snow would not be changed by aggregation if post-depositional processing were negligible. Here we plotted our atmospheric and snowpack Δ17O(NO) and δ18O(NO) data together with the four months (in the years 2010 and 2011) of surface snow data from Fibiger et al. (2013) in Fig. 4.
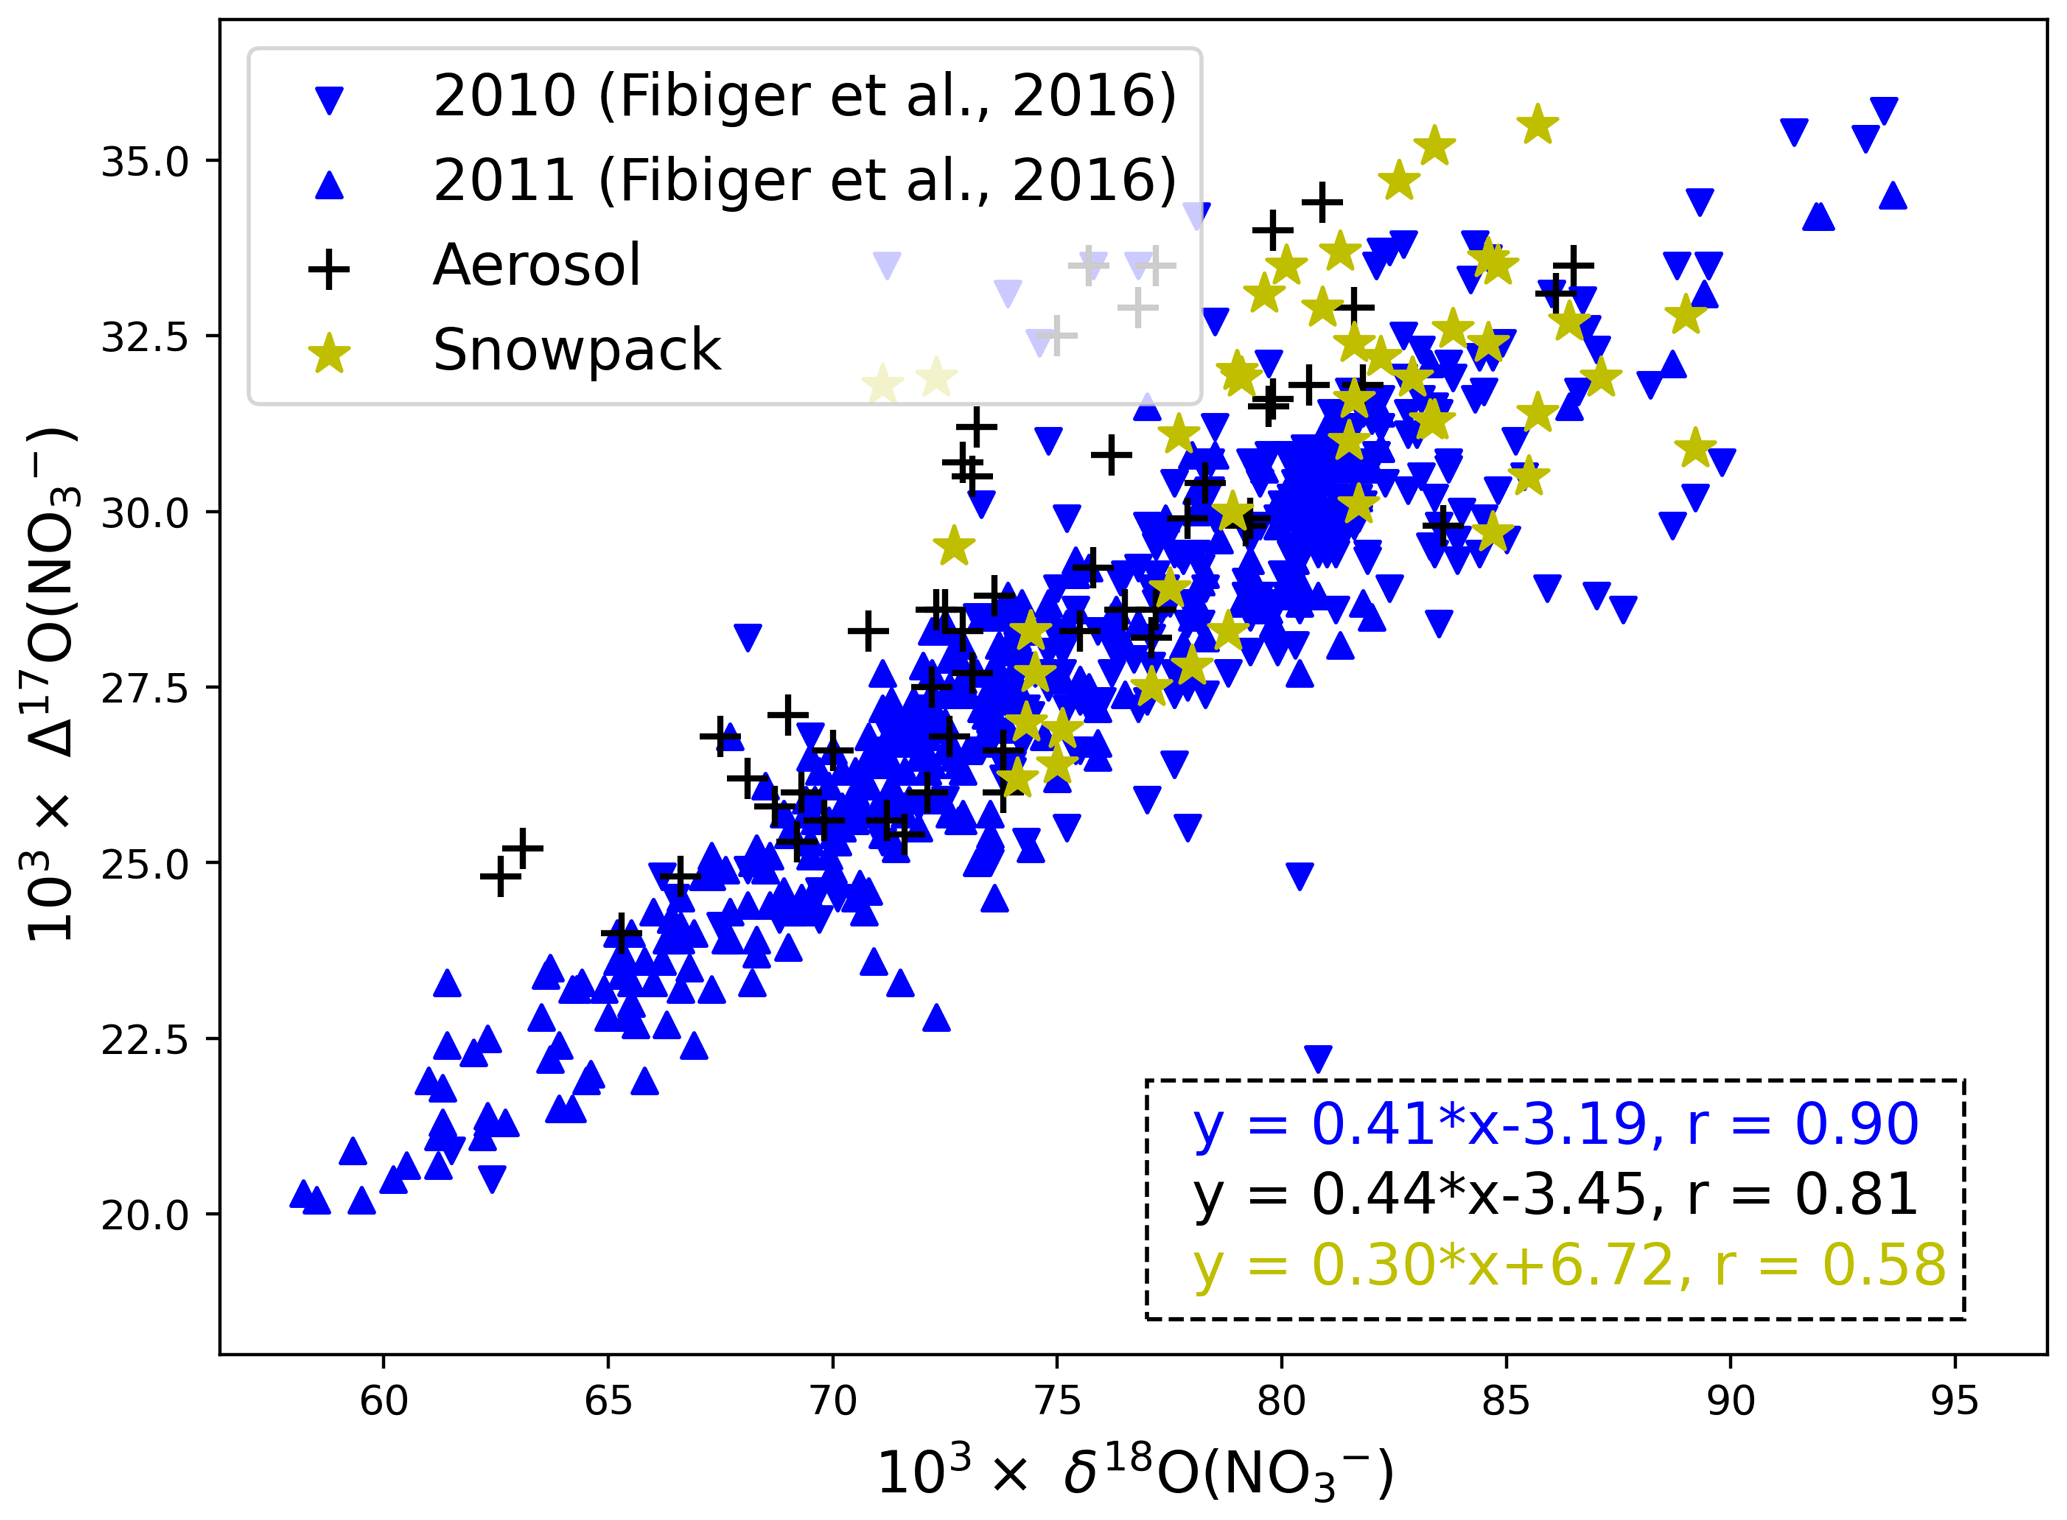
Figure 4Relationship between Δ17O(NO) and δ18O(NO) for all atmospheric (this study), surface snow (Fibiger et al., 2013) and snowpack data (Geng et al., 2014). Note the Fibiger et al. (2013) data were only for 4 months (May to June in 2010 and 2011), and the abnormal Δ17O(NO) value less than 20 ‰ was abandoned.
As shown in Fig. 4, the linear relationship between atmospheric Δ17O(NO) and δ18O(NO) (Δ17O(NO (0.44 ± 0.04) × δ18O(NO) − (3.45 ± 3.28), r=0.81) is very similar to the reported surface snow relationship (Δ17O(NO (0.41 ± 0.01) × δ18O(NO) − (3.19 ± 0.41), r=0.90) despite their different time coverages. Such a relationship suggests that the linearity of Δ17O(NO) versus δ18O(NO) in surface snow may directly originate from atmospheric nitrate, consistent with the conclusion of Fibiger et al. (2013). The conservation of the Δ17O(NO) versus δ18O(NO) relationship during deposition is somehow unexpected as the current observed air–snow δ18O(NO) difference is highly variable in both magnitude and sign (Jarvis et al., 2009; Fibiger et al., 2016). Further studies are required to understand why these observed atmospheric δ18O(NO) values are so different between different years. However, in the snowpack data, the linearity between Δ17O and δ18O(NO) (Δ17O(NO (0.30 ± 0.06) × δ18O(NO (6.72 ± 5.29), r=0.58) was distinctly different from that of atmospheric or surface snow nitrate, suggesting that post-depositional processing likely has changed the originally deposited oxygen isotope signals upon archival. We note that similar observations, i.e., better linearity of Δ17O(NO) versus δ18O(NO) in the atmosphere and surface snow nitrate than in the whole snowpack, were also observed at Dome C where the photolysis of snow nitrate has been unambiguously shown to be dominant (Erbland et al., 2013). This emphasizes again that, when evaluating the degree of post-depositional processing, one should consider samples covering all depths of the photic zone, not only surface samples.
Nitrate isotopes in polar ice cores have been thought to reflect past changes in NOx emissions and atmospheric oxidation environments (Alexander et al., 2015; Geng et al., 2017; Hastings et al., 2009; Wolff, 1995). Although some important progress has been made (e.g., Geng et al., 2017), most interpretations of ice-core nitrate records remain qualitative because the effects of post-depositional processing on nitrate and its isotopes have not been quantified. The latter requires a comprehensive understanding of the degree of post-depositional processing, as well as its influences on ice-core nitrate isotope preservation at different timescales. This is also true for ice-core drilling sites with high snow accumulation rates, in which the degree that nitrate isotopes are changed upon archival is a subject of debate (Fibiger et al., 2013; Geng et al., 2015; Hastings et al., 2005; Jiang et al., 2021).
In this study, we reported the first year-round atmospheric nitrate isotope measurements for Summit, Greenland. The atmospheric δ15N(NO) displayed systematic differences from surface snow and snowpack δ15N(NO) values at Summit compiled from the literature. In general, atmospheric, surface snow and snowpack δ15N(NO) diverged when there was sunlight but converged in the absence of sunlight. The gradual enrichments in δ15N(NO) from atmospheric nitrate to surface snow nitrate, and finally to snowpack nitrate, can only be explained by the effect of the photo-driven post-depositional processing, and the enrichment after deposition can also be quantitatively explained by the photo-induced effect (PIE). We proposed a simplified method for estimating PIE that can quickly assess the degree of δ15N(NO) enrichment from the time of deposition to preservation in snow beneath the snow photic zone. Unlike δ15N(NO), snowpack and atmospheric Δ17O(NO) displayed very similar seasonal patterns and absolute values, suggesting that it is well preserved, consistent with Jiang et al. (2021). We emphasize that atmospheric nitrate is not solely dependent on primary nitrate from long-range transport as it is also influenced by snow-sourced nitrate in the summer half year. The δ18O(NO) data were more variable and showed some inconsistence among different observations. We analyzed the relationships between Δ17O and δ18O(NO) among different types of samples and found that the slope and intercept of Δ17O(NO) versus δ18O(NO) correlations in snowpack are different from those in the atmosphere and surface snow. This suggests that the degrees of preservation for Δ17O and δ18O(NO) are likely different from each other at Summit mainly due to the fact that photo-driven post-depositional processing causes mass-dependent fractionation of isotopes which directly affects δ18O(NO) but not Δ17O(NO). Overall, our analyses suggest that the photo-driven post-depositional processing impacts both δ15N and δ18O(NO) at Summit. As a result, the signals of primary nitrate δ15N(NO) are unlikely preserved at this site, and Δ17O and δ18O(NO) of primary nitrate are also disturbed but to different degrees. These conclusions reinforce the importance of the quantitative assessment of the post-depositional processing on snow nitrate isotopes even at sites with relative high snow accumulation rate (Jiang et al., 2021). Further numerical modeling is needed to correct the effects of post-depositional processing on δ15N(NO), which is critical for the retrieval of information on past atmospheric NOx emissions using ice-core δ15N(NO) records (Hastings et al., 2005, 2009).
In the end, we note the limitations of the compiled data. These data were collected by different groups at different times and with different sampling methods, as well as different temporal resolutions. Although theoretically the seasonality of the isotopes should be similar in different years or for samples collected and measured by different groups, and although the heterogeneity of the samples was reduced by taking weighted average, there were some aspects and inconsistencies in the data that are difficult to interpret. Simultaneous collection of atmospheric, surface snow and snowpack samples with a similar resolution for at least 1 complete year in the future should be conducted. This will provide a more consistent and solid dataset to improve or confirm the current understanding of nitrate preservation and isotope variations at Summit, Greenland. This is not only important for nitrate isotope record interpretation at this site but also for other sites with a similar or higher snow accumulation rate such as the WAIS (West Antarctic Ice Sheet) divide.
The atmospheric nitrate isotope data and the compiled dataset will be provided upon direct request to the corresponding author.
The supplement related to this article is available online at: https://doi.org/10.5194/tc-16-2709-2022-supplement.
LG conceived this study. JLJ and JE collected and analyzed the atmospheric samples respectively. ZJ compiled the dataset, analyzed the data, developed the formula used in calculations and wrote the manuscript with LG. JS and BA provided suggestions for data interpretation. All authors gave feedback on the paper writing.
At least one of the (co-)authors is a member of the editorial board of The Cryosphere. The peer-review process was guided by an independent editor, and the authors also have no other competing interests to declare.
Publisher’s note: Copernicus Publications remains neutral with regard to jurisdictional claims in published maps and institutional affiliations.
Joel Savarino and Jean-Luc Jaffrezo thank the French Polar institute (Institut Polaire Français IPEV, previously IFRTP) for field and funding support and PNCA/CNRS-INSU for funding the SCIRA program (Jean-Luc Jaffrezo). Gilles Aymoz is warmly acknowledged for setting up the experiments on site, and the wintering team members employed by PICO are thanked for sample maintenance during the sampling year. We would like to thank the reviewers and the editors of The Cryosphere for their comments and suggestions, which greatly helped in improving the manuscript.
This research has been supported by the National Natural Science Foundation of China (grant nos. 41822605, 41871051 and 41727901), the Fundamental Research Funds for Central Universities, the Strategic Priority Research Program of Chinese Academy of Sciences (grant no. XDB 41000000), and the National Key R&D Program of China (grant nos. 2019YFC1509100). Support for Joel Savarino and Joseph Erbland was provided by the French national programme LEFE/INSU and the ANR grants ANR-15-IDEX-02 (project IDEX Université Grenoble Alpes) and ANR 16-CE01-0011-01 (EAIIST project) of the French Agence Nationale de la Recherche. Becky Alexander was supported by the National Science Foundation (grant no. PLR 1542723).
This paper was edited by Kaitlin Keegan and reviewed by Matthew Johnson and two anonymous referees.
Alexander, B. and Mickley, L. J.: Paleo-perspectives on potential future changes in the oxidative capacity of the atmosphere due to climate change and anthropogenic emissions, Curr. Pollut. Rep., 1, 57–69, https://doi.org/10.1007/s40726-015-0006-0, 2015.
Alexander, B., Sherwen, T., Holmes, C. D., Fisher, J. A., Chen, Q., Evans, M. J., and Kasibhatla, P.: Global inorganic nitrate production mechanisms: comparison of a global model with nitrate isotope observations, Atmos. Chem. Phys., 20, 3859–3877, https://10.5194/acp-20-3859-2020, 2020.
Barbero, A., Savarino, J., Grilli, R., Blouzon, C., Picard, G., Frey, M. M., Huang, Y., and Caillon, N.: New Estimation of the NOx Snow-Source on the Antarctic Plateau, J. Geophys. Res., 126, e2021JD035062, https://doi.org/10.1029/2021JD035062, 2021.
Bergin, M. H., Jaffrezo, J.-L., Davidson, C. I., Dibb, J. E., Pandis, S. N., Hillamo, R., Maenhaut, W., Kuhns, H. D., and Makela, T.: The contributions of snow, fog, and dry deposition to the summer flux of anions and cations at Summit, Greenland, J. Geophys. Res., 100, 16275–16288, https://doi.org/10.1029/95JD01267, 1995.
Berhanu, T. A., Meusinger, C., Erbland, J., Jost, R., Bhattacharya, S., Johnson, M. S., and Savarino, J.: Laboratory study of nitrate photolysis in Antarctic snow, II. Isotopic effects and wavelength dependence, J. Chem. Phys., 140, 244306, https://doi.org/10.1063/1.4882899, 2014.
Blunier, T., Floch, G. L., Jacobi, H. W., and Quansah, E.: Isotopic view on nitrate loss in Antarctic surface snow, Geophys. Res. Lett., 32, L13501, https://doi.org/10.1029/2005GL023011, 2005.
Bock, J., Savarino, J., and Picard, G.: Air–snow exchange of nitrate: a modelling approach to investigate physicochemical processes in surface snow at Dome C, Antarctica, Atmos. Chem. Phys., 16, 12531–12550, https://doi.org/10.5194/acp-16-12531-2016, 2016.
Burkhart, J. F., Hutterli, M., Bales, R. C., and McConnell, J. R.: Seasonal accumulation timing and preservation of nitrate in firn at Summit, Greenland, J. Geophys. Res.-Atmos., 109, D22309, https://doi.org/10.1029/2004JD004658, 2004.
Chan, H. G., Frey, M. M., and King, M. D.: Modelling the physical multiphase interactions of HNO3 between snow and air on the Antarctic Plateau (Dome C) and coast (Halley), Atmos. Chem. Phys., 18, 1507–1534, https://doi.org/10.5194/acp-18-1507-2018, 2018.
Cohen, L., Helmig, D., Neff, W. D., Grachev, A. A., and Fairall, C. W.: Boundary-layer dynamics and its influence on atmospheric chemistry at Summit, Greenland, Atmos. Environ., 41, 5044–5060, https://doi.org/10.1016/j.atmosenv.2006.06.068, 2007.
Curtis, C. J., Kaiser, J., Marca, A., Anderson, N. J., Simpson, G., Jones, V., and Whiteford, E.: Spatial variations in snowpack chemistry, isotopic composition of NO and nitrogen deposition from the ice sheet margin to the coast of western Greenland, Biogeosciences, 15, 529–550, https://doi.org/10.5194/bg-15-529-2018, 2018.
Dibb, J. E. and Fahnestock, M.: Snow accumulation, surface height change, and firn densification at Summit, Greenland: Insights from 2 years of in situ observation, J. Geophys. Res.-Atmos., 109, D24113, https://doi.org/10.1029/2003JD004300, 2004.
Dibb, J. E., Talbot, R. W., Munger, J. W., Jacob, D. J., and Fan, S. M.: Air–snow exchange of HNO3 and NOy at Summit, Greenland, J. Geophys. Res.-Atmos., 103, 3475–3486, https://doi.org/10.1029/97JD03132, 1998.
Dibb, J. E., Whitlow, S. I., and Arsenault, M.: Seasonal variations in the soluble ion content of snow at Summit. Greenland: Constraints from three years of daily surface snow samples, Atmos. Environ., 41, 5007–5019, https://doi.org/10.1016/j.atmosenv.2006.12.010, 2007.
Erbland, J., Savarino, J., Morin, S., France, J., Frey, M., and King, M.: Air–snow transfer of nitrate on the East Antarctic Plateau – Part 2: An isotopic model for the interpretation of deep ice-core records, Atmos. Chem. Phys., 15, 12079–12113, https://doi.org/10.5194/acp-15-12079-2015, 2015.
Erbland, J., Vicars, W. C., Savarino, J., Morin, S., Frey, M. M., Frosini, D., Vince, E., and Martins, J. M. F.: Air–snow transfer of nitrate on the East Antarctic Plateau – Part 1: Isotopic evidence for a photolytically driven dynamic equilibrium in summer, Atmos. Chem. Phys., 13, 6403–6419, https://doi.org/10.5194/acp-13-6403-2013, 2013.
Fibiger, D. L., Hastings, M. G., Dibb, J. E., and Huey, L. G.: The preservation of atmospheric nitrate in snow at Summit, Greenland, Geophys. Res. Lett., 40, 3484–3489, https://doi.org/10.1002/grl.50659, 2013.
Fibiger, D. L., Dibb, J. E., Chen, D., Thomas, J. L., Burkhart, J. F., Huey, L. G., and Hastings, M. G.: Analysis of nitrate in the snow and atmosphere at Summit, Greenland: Chemistry and transport, J. Geophys. Res.-Atmos., 121, 5010–5030, https://doi.org/10.1002/2015JD024187, 2016.
Frey, M. M., Savarino, J., Morin, S., Erbland, J., and Martins, J.: Photolysis imprint in the nitrate stable isotope signal in snow and atmosphere of East Antarctica and implications for reactive nitrogen cycling, Atmos. Chem. Phys., 9, 8681–8696, https://doi.org/10.5194/acp-9-8681-2009, 2009.
Frey, M. M., Roscoe, H. K., Kukui, A., Savarino, J., France, J. L., King, M. D., Legrand, M., and Preunkert, S.: Atmospheric nitrogen oxides (NO and NO2) at Dome C, East Antarctica, during the OPALE campaign, Atmos. Chem. Phys., 15, 7859–7875, https://10.5194/acp-15-7859-2015, 2015.
Galbavy, E. S., Anastasio, C., Lefer, B. L., and Hall, S. R.: Light penetration in the snowpack at Summit, Greenland: Part 1: Nitrite and hydrogen peroxide photolysis, Atmos. Environ, 41, 5077–5090, https://doi.org/10.1016/j.atmosenv.2006.04.072, 2007.
Geng, L., Cole-Dai, J., Alexander, B., Erbland, J., Savarino, J., Schauer, A. J., Steig, E. J., Lin, P., Fu, Q., and Zatko, M. C.: On the origin of the occasional spring nitrate peak in Greenland snow, Atmos. Chem. Phys., 14, 13361–13376, https://doi.org/10.5194/acp-14-13361-2014, 2014.
Geng, L., Murray, L. T., Mickley, L. J., Lin, P., Fu, Q., Schauer, A. J., and Alexander, B.: Isotopic evidence of multiple controls on atmospheric oxidants over climate transitions, Nature, 546, 133–136, https://doi.org/10.1038/nature22340, 2017.
Geng, L., Zatko, M. C., Alexander, B., Fudge, T., Schauer, A. J., Murray, L. T., and Mickley, L. J.: Effects of postdepositional processing on nitrogen isotopes of nitrate in the Greenland Ice Sheet Project 2 ice core, Geophys. Res. Lett., 42, 5346–5354, https://doi.org/10.1002/2015GL064218, 2015.
Grannas, A. M., Jones, A. E., Dibb, J., Ammann, M., Anastasio, C., Beine, H. J., Bergin, M., Bottenheim, J., Boxe, C. S., Carver, G., Chen, G., Crawford, J. H., Dominé, F., Frey, M. M., Guzmán, M. I., Heard, D. E., Helmig, D., Hoffmann, M. R., Honrath, R. E., Huey, L. G., Hutterli, M., Jacobi, H. W., Klán, P., Lefer, B., McConnell, J., Plane, J., Sander, R., Savarino, J., Shepson, P. B., Simpson, W. R., Sodeau, J. R., von Glasow, R., Weller, R., Wolff, E. W., and Zhu, T.: An overview of snow photochemistry: evidence, mechanisms and impacts, Atmos. Chem. Phys., 7, 4329–4373, https://10.5194/acp-7-4329-2007, 2007.
Hastings, M. G., Steig, E., and Sigman, D. M.: Seasonal variations in N and O isotopes of nitrate in snow at Summit, Greenland: Implications for the study of nitrate in snow and ice cores, J. Geophys. Res.-Atmos., 109, D20306, https://doi.org/10.1029/2004JD004991, 2004.
Hastings, M., Jarvis, J., and Steig, E.: Anthropogenic impacts on nitrogen isotopes of ice-core nitrate, Science, 324, 1288–1288, https://doi.org/10.1126/science.1170510, 2009.
Hastings, M. G., Sigman, D. M., and Steig, E. J.: Glacial/interglacial changes in the isotopes of nitrate from the Greenland Ice Sheet Project 2 (GISP2) ice core, Global Biogeochem. Cy., 19, GB4024, https://doi.org/10.1029/2005GB002502, 2005.
Honrath, R., Lu, Y., Peterson, M. C., Dibb, J. E., Arsenault, M., Cullen, N., and Steffen, K.: Vertical fluxes of NOx, HONO, and HNO3 above the snowpack at Summit, Greenland, Atmos. Environ., 36, 2629–2640, https://doi.org/10.1016/S1352-2310(02)00132-2, 2002.
Jaffrezo, J.-L., Davidson, C. I., Legrand, M., and Dibb, J. E.: Sulfate and MSA in the air and snow on the Greenland Ice Sheet, J. Geophys. Res.-Atmos, 99, 1241–1253, https://doi.org/10.1029/93JD02913, 1994.
Jarvis, J. C., Hastings, M. G., Steig, E. J., and Kunasek, S. A.: Isotopic ratios in gas-phase HNO3 and snow nitrate at Summit, Greenland, J. Geophys. Res.-Atmos, 114, D17301, https://doi.org/10.1029/2009JD012134, 2009.
Jiang, Z., Alexander, B., Savarino, J., Erbland, J., and Geng, L.: Impacts of the photo-driven post-depositional processing on snow nitrate and its isotopes at Summit, Greenland: a model-based study, The Cryosphere, 15, 4207–4220, https://10.5194/tc-15-4207-2021, 2021.
Jones, A. E., Weller, R., Anderson, P. S., Jacobi, H.-W., Wolff, E. W., Schrems, O., and Miller, H.: Measurements of NOx emissions from the Antarctic snowpack, Geophys. Res. Lett., 28, 1499–1502, https://doi.org/10.1029/2000GL011956, 2001.
Johnston, J. C. and Thiemens, M. H.: The isotopic composition of tropospheric ozone in three environments, J. Geophys. Res.-Atmos., 102, 25395–25404, https://doi.org/10.1029/97JD02075, 1997.
Kuhns, H., Davidson, C., Dibb, J., Stearns, C., Bergin, M., and Jaffrezo, J.-L.: Temporal and spatial variability of snow accumulation in central Greenland, J. Geophys. Res.-Atmos, 102, 30059–30068, https://doi.org/10.1029/97JD02760, 1997.
Kunasek, S., Alexander, B., Steig, E., Hastings, M., Gleason, D., and Jarvis, J.: Measurements and modeling of Δ17O of nitrate in snowpits from Summit, Greenland, J. Geophys. Res.-Atmos, 113, D24302, https://doi.org/10.1029/2008JD010103, 2008.
Krankowsky, D., Bartecki, F., Klees, G. G., Mauersberger, K., Schellenbach, K., and Stehr, J.: Measurement of heavy isotope enrichment in tropospheric ozone, Geophys. Res. Lett., 22, 1713–1716, https://doi.org/10.1029/95GL01436, 1995.
McCabe, J., Boxe, C., Colussi, A., Hoffmann, M., and Thiemens, M.: Oxygen isotopic fractionation in the photochemistry of nitrate in water and ice, J. Geophys. Res.-Atmos, 110, D15310, https://doi.org/10.1029/2004JD005484, 2005.
McCabe, J. R., Thiemens, M. H., and Savarino, J.: A record of ozone variability in South Pole Antarctic snow: Role of nitrate oxygen isotopes, J. Geophys. Res.-Atmos, 112, D12303, https://doi.org/10.1029/2006JD007822, 2007.
Meusinger, C., Berhanu, T. A., Erbland, J., Savarino, J., and Johnson, M. S.: Laboratory study of nitrate photolysis in Antarctic snow. I. Observed quantum yield, domain of photolysis, and secondary chemistry, J. Chem. Phys., 140, 244305, https://doi.org/10.1063/1.4882898, 2014.
Michalski, G., Bhattacharya, S. K., and Mase, D. F.: Oxygen Isotope Dynamics of Atmospheric Nitrate and Its Precursor Molecules, in: Handbook of Environmental Isotope Geochemistry: Vol I, edited by: Baskaran, M., Springer Berlin Heidelberg, Berlin, Heidelberg, 613–635, https://doi.org/10.1007/978-3-642-10637-8_30, 2012.
Morin, S., Savarino, J., Frey, M. M., Domine, F., Jacobi, H.-W., Kaleschke, L., and Martins, J. M. F.: Comprehensive isotopic composition of atmospheric nitrate in the Atlantic Ocean boundary layer from 65∘ S to 79∘ N, J. Geophys. Res.-Atmos, 114, D05303, https://doi.org/10.1029/2008JD010696, 2009.
Mulvaney, R., Wagenbach, D., and Wolff, E. W.: Postdepositional change in snowpack nitrate from observation of year-round near-surface snow in coastal Antarctica, J. Geophys. Res.-Atmos, 103, 11021–11031, https://doi.org/10.1029/97JD03624, 1998.
Quinn, P. K., Shaw, G., Andrews, E., Dutton, E. G., Ruoho-Airola, T., and Gong, S. L.: Arctic haze: current trends and knowledge gaps, Tellus B, 59, 99–114, https://doi.org/10.1111/j.1600-0889.2006.00236.x, 2007.
Rhodes, R. H., Yang, X., Wolff, E. W., McConnell, J. R., and Frey, M. M.: Sea ice as a source of sea salt aerosol to Greenland ice cores: a model-based study, Atmos. Chem. Phys., 17, 9417–9433, https://10.5194/acp-17-9417-2017, 2017.
Röthlisberger, R., Hutterli, M. A., Sommer, S., Wolff, E. W., and Mulvaney, R.: Factors controlling nitrate in ice cores: Evidence from the Dome C deep ice core, J. Geophys. Res.-Atmos, 105, 20565–20572, https://doi.org/10.1029/2000JD900264, 2000.
Röthlisberger, R., Hutterli, M. A., Wolff, E. W., Mulvaney, R., Fischer, H., Bigler, M., Goto-Azuma, K., Hansson, M. E., Ruth, U., Siggaard-Andersen, M.-L., and Steffensen, J. P.: Nitrate in Greenland and Antarctic ice cores: a detailed description of post-depositional processes, Ann. Glaciol., 35, 209–216, https://10.3189/172756402781817220, 2002.
Savarino, J., Kaiser, J., Morin, S., Sigman, D. M., and Thiemens, M. H.: Nitrogen and oxygen isotopic constraints on the origin of atmospheric nitrate in coastal Antarctica, Atmos. Chem. Phys., 7, 1925–1945, https://10.5194/acp-7-1925-2007, 2007.
Shi, G., Buffen, A. M., Hastings, M. G., Li, C., Ma, H., Li, Y., Sun, B., An, C., and Jiang, S.: Investigation of post-depositional processing of nitrate in East Antarctic snow: isotopic constraints on photolytic loss, re-oxidation, and source inputs, Atmos. Chem. Phys., 15, 9435–9453, https://doi.org/10.5194/acp-15-9435-2015, 2015.
Shi, G., Chai, J., Zhu, Z., Hu, Z., Chen, Z., Yu, J., Ma, T., Ma, H., An, C., Jiang, S., Tang, X., and Hastings, M. G.: Isotope Fractionation of Nitrate During Volatilization in Snow: A Field Investigation in Antarctica, Geophys. Res. Lett., 46, 3287–3297, https://doi.org/10.1029/2019GL081968, 2019.
Sofen, E. D., Alexander, B., Steig, E. J., Thiemens, M. H., Kunasek, S. A., Amos, H. M., Schauer, A. J., Hastings, M. G., Bautista, J., Jackson, T. L., Vogel, L. E., McConnell, J. R., Pasteris, D. R., and Saltzman, E. S.: WAIS Divide ice core suggests sustained changes in the atmospheric formation pathways of sulfate and nitrate since the 19th century in the extratropical Southern Hemisphere, Atmos. Chem. Phys., 14, 5749–5769, https://10.5194/acp-14-5749-2014, 2014.
Vicars, W. C., Bhattacharya, S. K., Erbland, J., and Savarino, J.: Measurement of the 17O-excess (Δ17O) of tropospheric ozone using a nitrite-coated filter, Rapid Commun. Mass Spec., 26, 1219–1231, https://doi.org/10.1002/rcm.6218, 2012.
Walters, W. W., Michalski, G., Böhlke, J. K., Alexander, B., Savarino, J., and Thiemens, M. H.: Assessing the Seasonal Dynamics of Nitrate and Sulfate Aerosols at the South Pole Utilizing Stable Isotopes, J. Geophys. Res.-Atmos, 124, 8161–8177, https://doi.org/10.1029/2019JD030517, 2019.
Winton, V. H. L., Ming, A., Caillon, N., Hauge, L., Jones, A. E., Savarino, J., Yang, X., and Frey, M. M.: Deposition, recycling, and archival of nitrate stable isotopes between the air–snow interface: comparison between Dronning Maud Land and Dome C, Antarctica, Atmos. Chem. Phys., 20, 5861–5885, https://10.5194/acp-20-5861-2020, 2020.
Wolff, E. W.: Nitrate in polar ice, Ice core studies of global biogeochemical cycles, Springer, Berlin, Heidelberg, 195–224, https://doi.org/10.1007/978-3-642-51172-1_10, 1995.
Wolff, E. W., Jones, A. E., Bauguitte, S. J. B., and Salmon, R. A.: The interpretation of spikes and trends in concentration of nitrate in polar ice cores, based on evidence from snow and atmospheric measurements, Atmos. Chem. Phys., 8, 5627–5634, https://10.5194/acp-8-5627-2008, 2008.
Zatko, M. C., Grenfell, T. C., Alexander, B., Doherty, S. J., Thomas, J. L., and Yang, X.: The influence of snow grain size and impurities on the vertical profiles of actinic flux and associated NOx emissions on the Antarctic and Greenland ice sheets, Atmos. Chem. Phys., 13, 3547–3567, https://doi.org/10.5194/acp-13-3547-2013, 2013.