the Creative Commons Attribution 4.0 License.
the Creative Commons Attribution 4.0 License.
 | 27 Jun 2022
Rapid fragmentation of Thwaites Eastern Ice Shelf
Adrian Luckman
Jan A. Åström
Anna J. Crawford
Stephen L. Cornford
Suzanne L. Bevan
Thomas Zwinger
Rupert Gladstone
Karen Alley
Erin Pettit
Jeremy Bassis
Ice shelves play a key role in the dynamics of marine ice sheets by buttressing grounded ice and limiting rates of ice flux to the oceans. In response to recent climatic and oceanic change, ice shelves fringing the West Antarctic Ice Sheet (WAIS) have begun to fragment and retreat, with major implications for ice-sheet stability. Here, we focus on the Thwaites Eastern Ice Shelf (TEIS), the remaining pinned floating extension of Thwaites Glacier. We show that TEIS has undergone a process of fragmentation in the last 5 years, including brittle failure along a major shear zone, formation of tensile cracks on the main body of the shelf, and a release of tabular bergs on both the eastern and western flanks. Simulations with the Helsinki Discrete Element Model (HiDEM) show that this pattern of failure is associated with high backstress from a submarine pinning point at the distal edge of the shelf. We show that a significant zone of shear, upstream of the main pinning point, developed in response to the rapid acceleration of the shelf between 2002 and 2006, seeding damage on the shelf. Subsequently, basal melting and positive feedback between damage and strain rates weakened TEIS, allowing damage to accumulate. Thus, although backstress on TEIS has likely diminished over time as the pinning point shrunk, accumulation of damage has ensured that the ice in the shear zone remained the weakest link in the system. Experiments with the BISICLES ice-sheet model indicate that additional damage to or unpinning of TEIS is unlikely to trigger significantly increased ice loss from WAIS, but the calving response to the loss of TEIS remains highly uncertain. It is widely recognised that ice-shelf fragmentation and collapse can be triggered by hydrofracturing and/or unpinning from ice-shelf margins or grounding points. Our results indicate a third mechanism, backstress triggered failure, that can occur if and when an ice shelf is no longer able to withstand stress imposed by pinning points. In most circumstances, pinning points are essential for ice-shelf stability, but as ice shelves thin and weaken, the concentration of backstress in damaged ice upstream of a pinning point may provide the seeds of their demise.
- Article
(20126 KB) - Full-text XML
- BibTeX
- EndNote


Ice shelves play a key role in the dynamics of marine ice sheets. By transmitting resistive stresses from lateral or basal pinning points to the grounding line, ice shelves buttress grounded portions of the ice sheet and constrain ice flow (e.g. Doake et al., 1998; Dupont and Alley, 2005). If buttressing is reduced or lost following the retreat or disintegration of ice shelves, tributary glaciers can accelerate and increase ice flux to the ocean (Scambos et al., 2004). Accelerated ice discharge may be temporary and reversible, but modelling studies indicate that in some circumstances (e.g. where the bed is steeply retrograde) the ice-shelf breakup may initiate sustained loss of grounded ice and irreversible retreat through the marine ice-sheet and marine ice-cliff instabilities (Schoof, 2012; Sun et al., 2020; DeConto et al., 2021; Bassis et al., 2021). Large areas of the West Antarctic Ice Sheet (WAIS) are vulnerable to this process, particularly Thwaites Glacier and Pine Island Glacier in the Amundsen Sea sector (Scambos et al., 2017).
In response to recent climatic and oceanic change, the geographical extent of ice-shelf retreat and disintegration has spread south and westward from the Antarctic Peninsula into West Antarctica (Cook and Vaughan, 2010; Liu et al., 2015). If the response of WAIS to a variety of climate change scenarios is to be predicted with confidence, understanding the processes affecting ice-shelf stability is a matter of urgency (Fox-Kemper et al., 2021). The prominent role of melt pond drainage and hydrofracturing in the demise of Larsen B in 2002 (Scambos et al., 2003) has focused attention on surface melting as a trigger for ice-shelf disintegration (e.g. Robel and Banwell, 2019; Lai et al., 2020). Recent observations, however, indicate that ice-shelf retreat and disintegration can occur in the absence of surface melt, if basal melting causes ice to lose contact with lateral or seafloor pinning points. Recent examples include major rifting and calving from the Pine Island Glacier following weakening of lateral pinning points (Arndt et al., 2018; Lhermitte et al., 2020) and fragmentation of the Thwaites Western Ice Tongue (TWIT; Fig. 1) following progressive loss of a seafloor pinning point (Tinto and Bell, 2011; Miles et al., 2020).
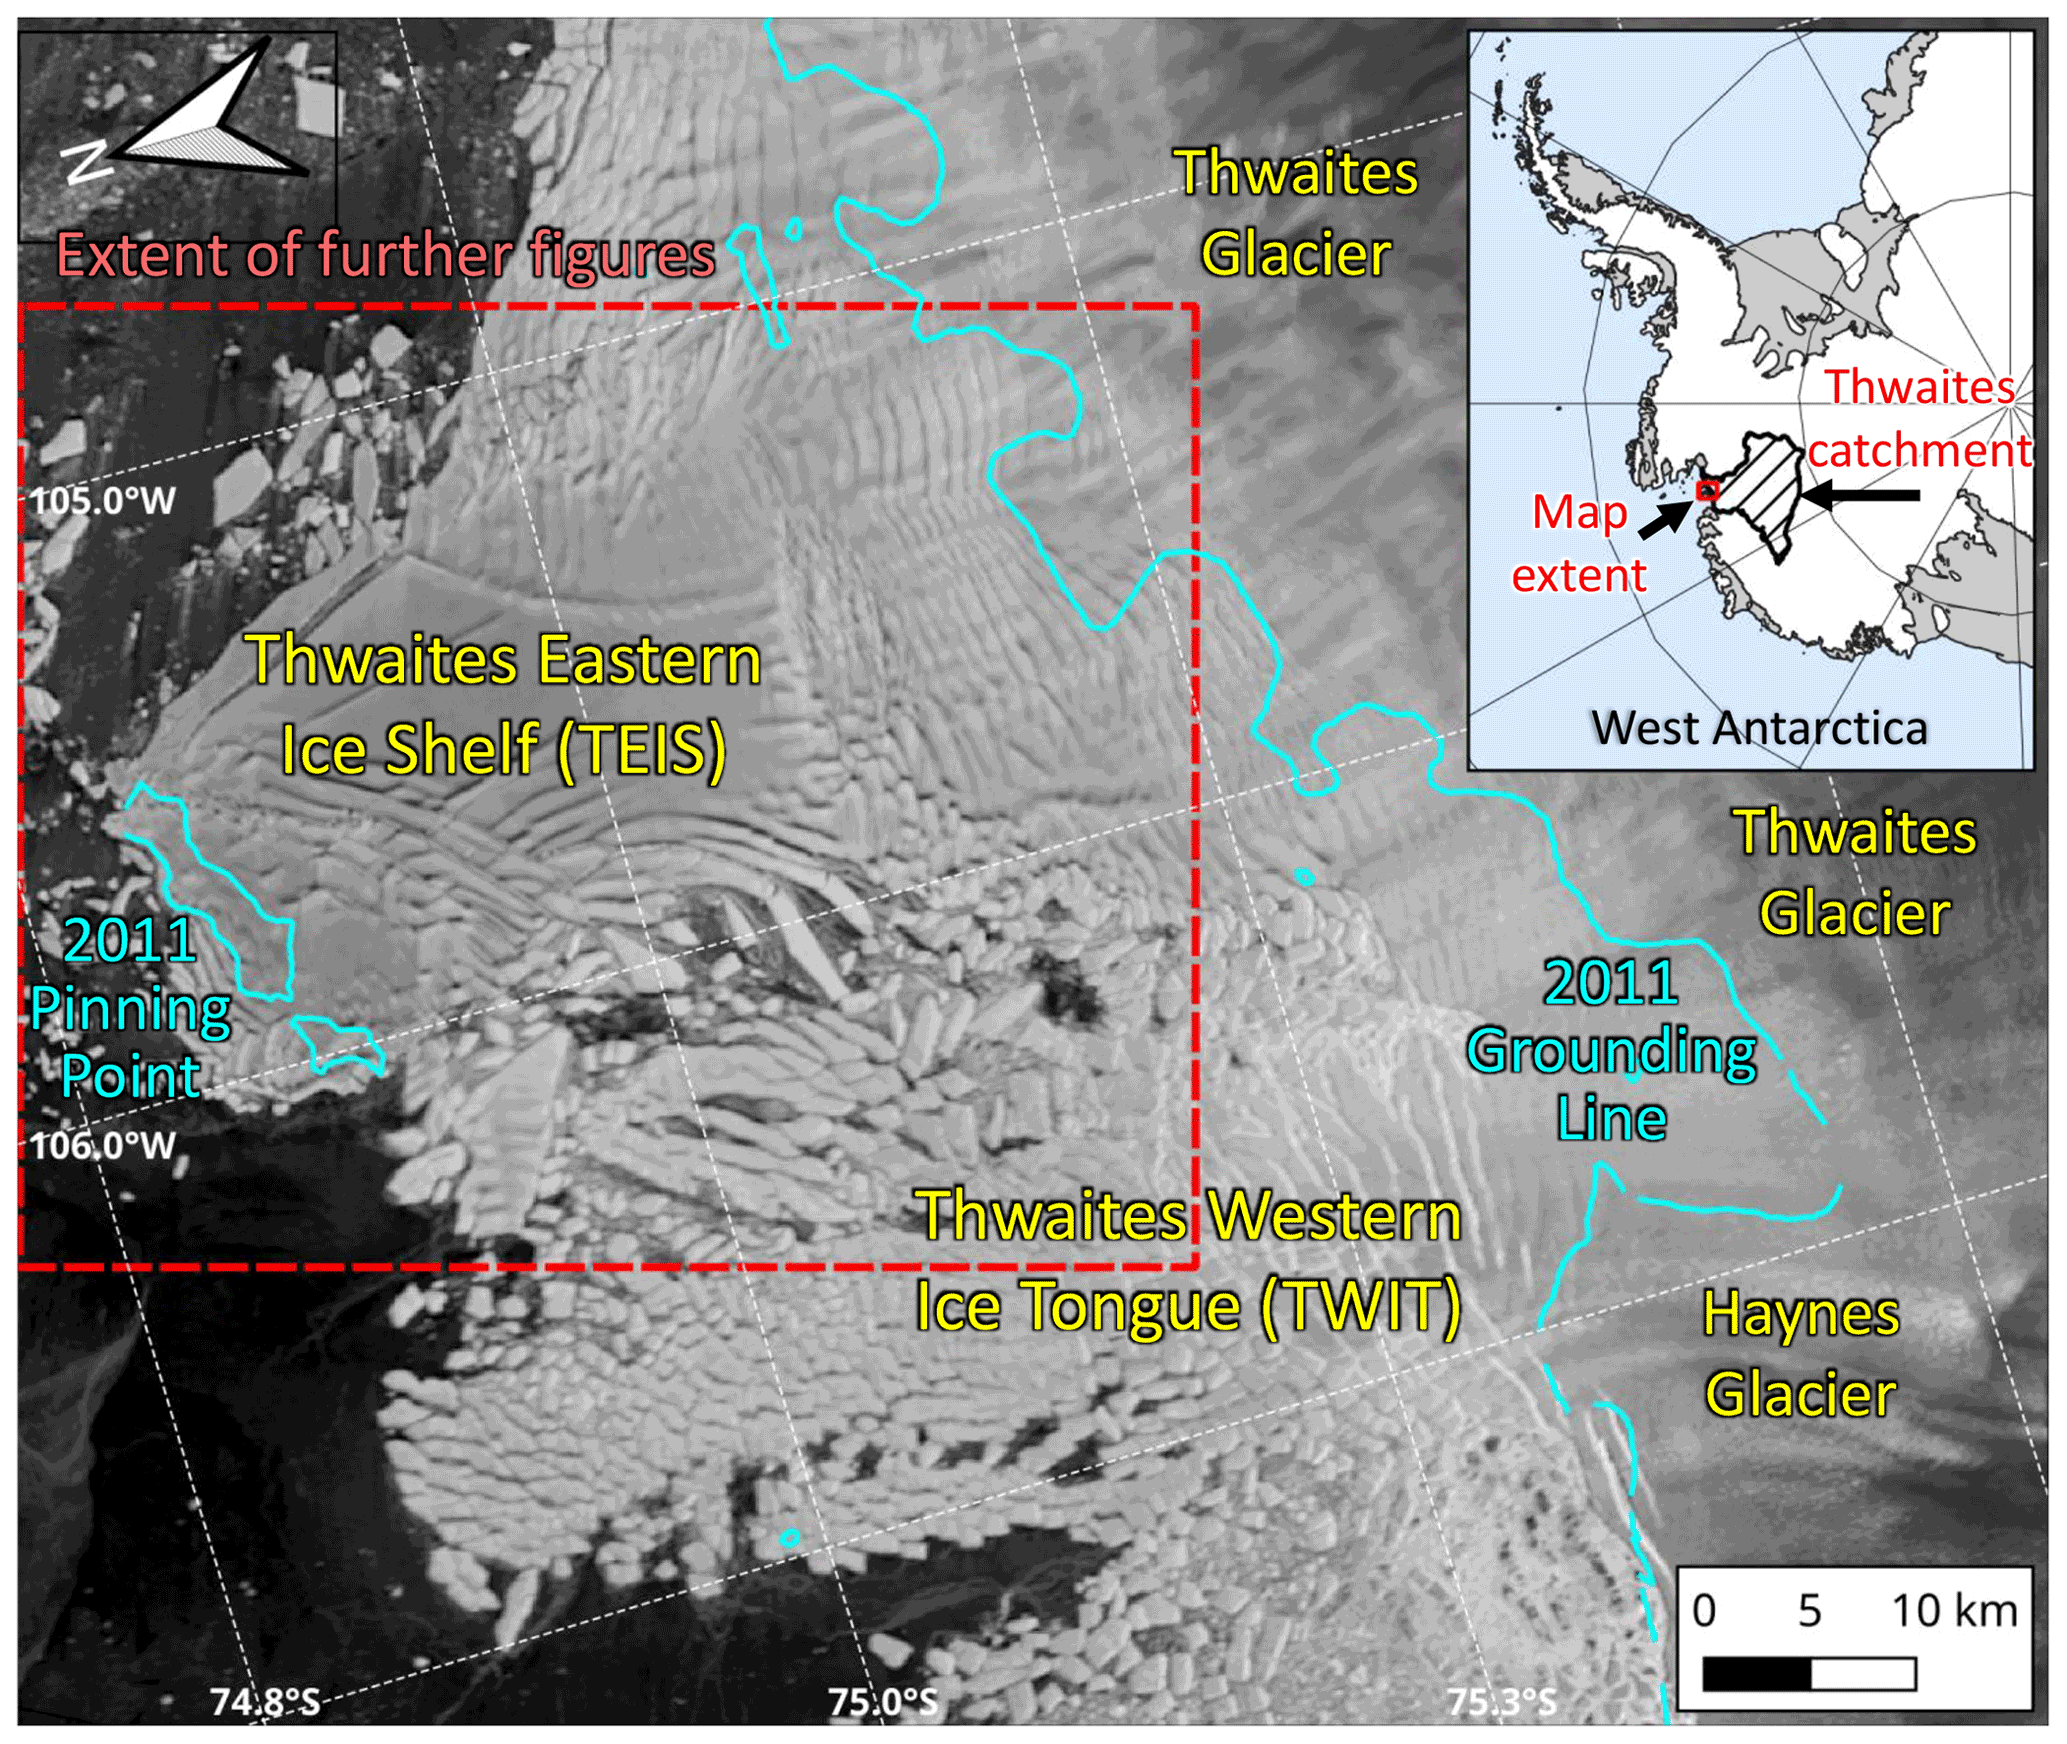
Figure 1The floating extensions of Thwaites Glacier, showing the location of the Thwaites Eastern Ice Shelf (TEIS), the Thwaites Western Ice Tongue (TWIT), and the position of grounding lines and the location of pinning points in 2011 from Rignot et al. (2014).
In this paper, we focus on the Thwaites Eastern Ice Shelf (TEIS), the remaining pinned floating extension of Thwaites Glacier. TEIS is currently pinned at its distal end by a seafloor ridge (Fig. 1), but rates of ice thinning over this pinning point suggest that complete unpinning could occur in less than 1 decade (Alley et al., 2021; Wild et al. 2021). Here we use a high-frequency time series of Sentinel-1 imagery to show that within the last 5 years it has transitioned from an intact ice shelf to a highly fragmented state. The ongoing acceleration of parts of the ice shelf suggests the crossing of a threshold from stable to unstable. Our simulations with the Helsinki Discrete Element Model (HiDEM) show a distinct fracture pattern that supports this threshold-crossing behaviour occurring due to the failure of weakened ice in response to stresses associated with the pinning point, and not due to progressive unpinning. Pinning points, therefore, are not necessarily always a stabilising factor for ice shelves, but instead may have a destabilising effect when ice around them is sufficiently weakened. Finally, we use the ice-sheet model, BISICLES, to explore the possible near-term consequences of damage evolution, shelf thinning and decoupling of TEIS from the pinning point. The recent behaviour and imminent breakup of TEIS have important implications for both ice-shelf stability and the effectiveness of buttressing from intact and fragmented ice shelves.
2.1 Observations
We use satellite data to monitor surface features which indicate the evolution of surface and basal fractures, and to derive surface velocity fields that monitor change in ice flow rate and patterns of surface strain. The main source of satellite data is Sentinel-1 (image resolution ∼10 m, velocity product resolution ∼100 m), but we also use velocity products from MODIS (velocity product resolution ∼500 m; Alley et al., 2021), MEaSUREs (velocity product resolution ∼1 km; Mouginot et al., 2017) and ITS_LIVE (velocity product resolution ∼240 m, Gardner et al., 2019) to provide historical context.
Surface velocity fields are derived from the Sentinel-1 Interferometric Wide Swath (IW) mode using standard feature/speckle tracking procedures (e.g. Luckman et al., 2015). We employ the whole satellite data archive since 2014 and combine velocity maps by averaging following a spatial filter based on signal-to-noise ratio and local variability. We present results of individual velocity maps on key dates and mean velocity products on an annual, quarterly or monthly basis to assess the development of speed and strain. We use a combination of 6 and 12 d Sentinel-1 image pairs from the available archive and our feature tracking window size is 416×128 pixels, which equates to ∼1 km in range and azimuth. We sample the velocity field at 50×10 pixels before geocoding to the Antarctic Polar Stereographic projection (EPSG:3031) at 100 m resolution using the REMA mosaic DEM (Howat et al., 2019) gap-filled by Bedmap2 surface topography data (Fretwell et al., 2013). Strain rates are derived from selected 6 d pair velocity maps with high coherence and low noise, and are calculated in a 3×3 neighbourhood for optimum resolution.
2.2 Modelling experiments
Modelling experiments were conducted with HiDEM and the BISICLES ice-sheet model to investigate fracture processes underway at TEIS and ice-sheet dynamic responses to the ice shelf's evolution, respectively.
HiDEM is a brittle–elastic fracture model that can be used to simulate ice fracture and calving processes by representing ice as arrays of particles linked by breakable elastic beams (Åström et al., 2013). Particles are stacked together in a hexagonal close-packed lattice to form a 3-D domain representing observed ice geometries. The version used in this study (HiDEM2.0) was developed by Jan A. Åström and Fredrik Robertsen at the CSC-IT Center for Science, Finland, with data structures and a parallelisation scheme optimised for effective computation. On a modern HPC system HiDEM2.0 can compute 106 time steps for 108 particles in about 24 h, with a time step length of 0.001 s. This is 1–2 orders of magnitude faster than older versions of HiDEM, allowing simulations of much larger domains with smaller particle sizes.
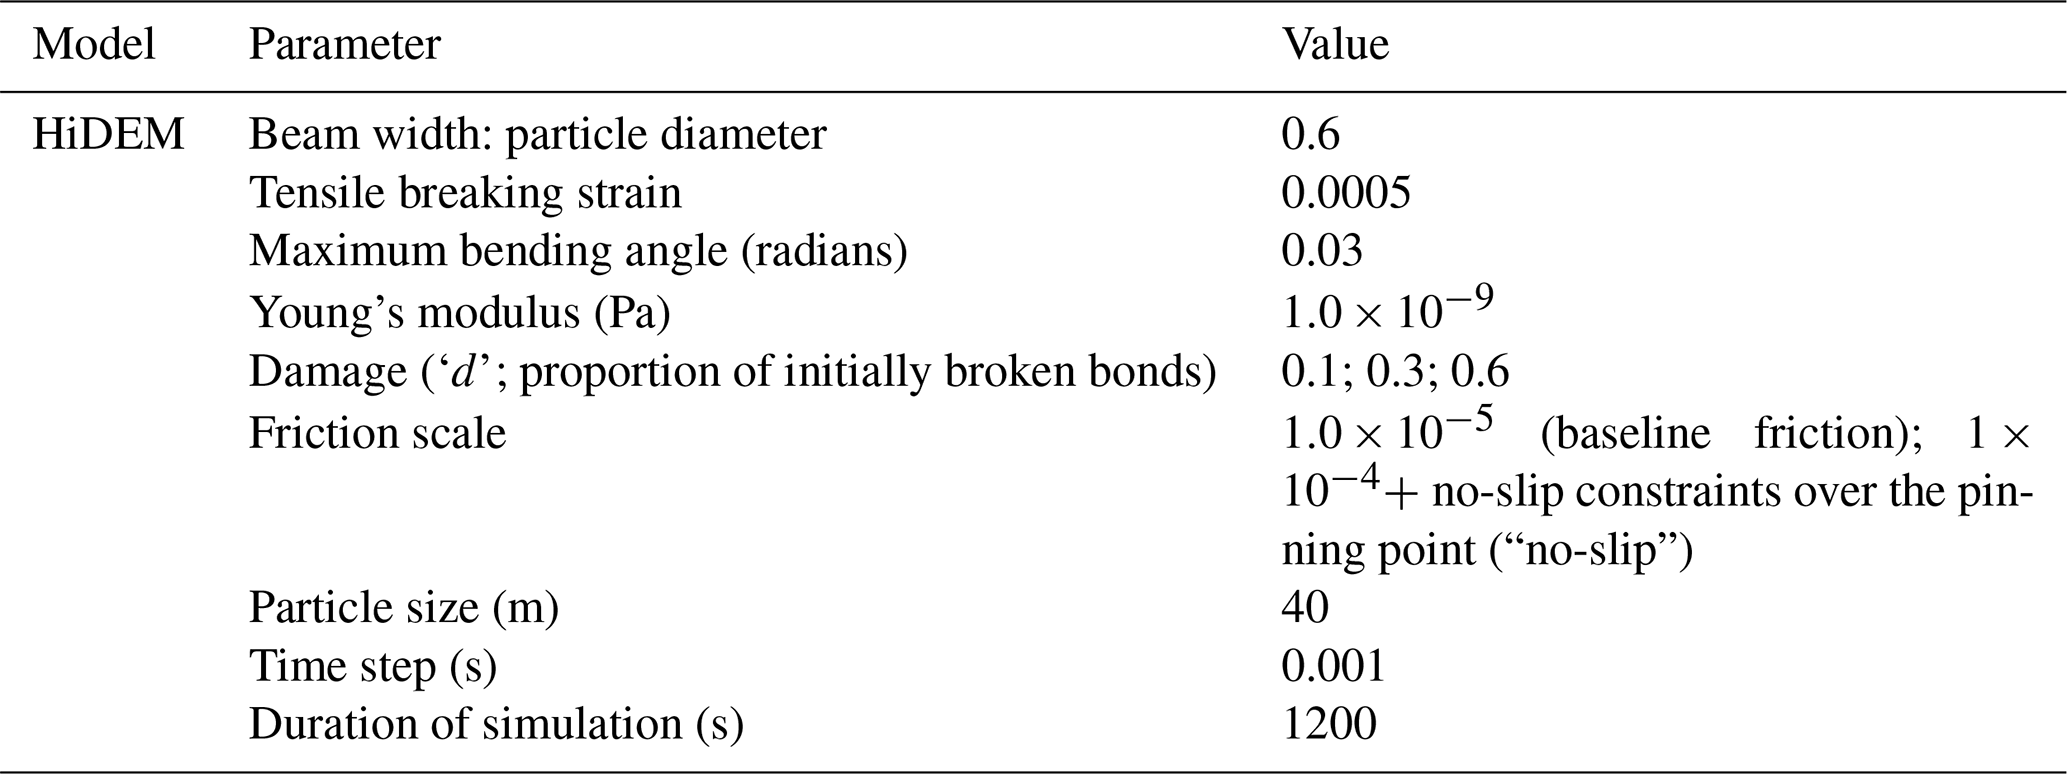
Five parameters determine the bulk tensile and shear strength of the ice: particle size, beam width to particle diameter ratio, beam tensile breaking strain, maximum beam endpoint bending angle, and density of randomly distributed pre-broken beams (damage). In the simulations reported here, we use a particle size of 40 m, a beam width to particle diameter ratio of 0.6, tensile breaking strain of 0.0005, and a maximum bending angle of 0.03 radians. These values were calibrated against observed fracture and calving patterns on the Greenlandic glacier Sermeq Kujalleq (a.k.a. Jakobshavn Isbræ). The calibration was focused at Sermeq Kujalleq given the glacier's large ice thickness and the availability of remotely sensed observations of calving.
The HiDEM domain incorporates the entire area of TEIS and extends 20 to 30 km upstream of the grounding line. The domain is based on BedMachine v2 (Morlighem et al., 2020), which incorporates the REMA mosaic ice-surface elevation DEM (Howat et al., 2019), hydrostatic ice thickness for the fully floating regions, and recent updates to the Thwaites Glacier bed and adjacent seafloor (Jordan et al., 2020). The glacier bed DEM does not incorporate recent data on the TEIS pinning point presented by Wild et al. (2021). The implications of this omission are discussed below.
The model domain was adjusted in a short (2.5 d) surface relaxation in Elmer/Ice, to ensure that the ice-shelf base near the grounding line was at equilibrium with stresses in the ice, as well as buoyant forces. The extent of the pinned ice, which consists of two separate pinning regions, was unchanged over the relaxation period. The surface height changed minimally and the height above flotation over the pinned regions (approximately 20 to 30 m) is comparable to values shown by Wild et al. (2021). Any differences are negligible considering the 40 m particle size used in the HiDEM simulations. Ice viscosity and basal resistance were then estimated following the serial inversion workflow described in Wang et al. (2022) using MEaSUREs v.2 velocity data (Rignot et al., 2011a, b; Mouginot et al., 2012, 2017). The region of the REMA mosaic covering TEIS is based on data acquired in 2013–2014, and the velocity data are from 2007 and 2009. The model domain should thus be regarded as representing an approximation of conditions in recent years rather than a specific snapshot in time. Surface velocities following the inversion were in agreement with observed velocities over the grounded region (approximately 150 m a−1 or less). Subglacial friction coefficients for grounded portions of the domain were determined assuming a linear bed friction law, and friction coefficients were converted to SI units and rescaled () for use in HiDEM. Rescaling bed friction coefficients is necessary to produce useful ice-displacement magnitudes, because HiDEM simulates glacier sliding and fracture taking place over timescales of seconds, whereas in reality these processes take place over timescales of hours to years (van Dongen et al., 2020).
Experiments with HiDEM were designed to test two hypotheses on the causes of the observed fragmentation of TEIS: (1) fragmentation is related to a reduction of backstress on the shelf, consequent upon progressive unpinning; and (2) fragmentation is related to progressive weakening of the ice and continuing backstress from the pinning point. To test these hypotheses, we conducted a matrix of runs with different combinations of ice damage density and pinning point friction. The latter is used to represent the degree to which the TEIS was pinned. Simulations that utilised the rescaled bed friction coefficient noted above, hereafter referred to as baseline friction, represented a less-pinned TEIS. A fully pinned TEIS was represented by placing “no-slip” constraints on particles that were in contact with the pinned region. It is appropriate to apply this no-slip boundary condition given that HiDEM is used to simulate the elastic component of the TEIS deformation. Other, slower processes of ice motion would not result in substantial movement over the short-duration timescales of motion considered in HiDEM simulations.
Ice damage density is represented by the proportion of initially broken bonds in a HiDEM simulation. In the present study, ice strength was varied by adjusting the initial ice damage density d from 0 (no damage) to 0.3 (moderate damage) to 0.6 (highly damaged). This damage index represents a reduction in the load-bearing area and thus has a similar physical meaning to damage as commonly defined (e.g. Lemaitre, 2012; Borstad et al., 2012). However, the dependence of modelled ice properties on particle and bond parameters means that values of d are not directly comparable to damage variables used in other studies, including the BISICLES model discussed below. Ice damage typically increases during model runs as beams are broken in response to inter-particle stresses. Unlike the initial prescribed damage d, which is macroscopically uniform and isotropic, emergent damage is localised and anisotropic, typically taking the form of fractures and shear zones and therefore a more realistic simulation of damaged ice (Åström and Benn, 2019).
The HiDEM settings and experiments are summarised in Table 1. In the form used in this study, HiDEM is a purely brittle–elastic model and does not include viscous deformation. For simulations of short-lived calving processes it is sufficient to allow the domain to evolve under the gravitational and buoyant forces arising from ice geometry and water depth. Crevasses and rifts on ice shelves, however, typically propagate on long timescales during which ice can undergo large displacements, and for such cases some external model forcing is often desirable (e.g. Åström and Benn, 2019; Åström et al., 2021). In the runs reported here, we applied a force at the upstream boundary of the domain that produced a close approximation of the observed velocity structure near the grounding line. The simulated TEIS domain contained 109 particles and was run over 36 h using 2048 cores on the Mahti supercomputer at the CSC-IT Center for Science.
Table 1Key parameters in simulations using the Helsinki Discrete Element Model (HiDEM).
BISICLES is a continuum ice-flow model based on a vertically integrated stress balance equation (Cornford et al., 2020). Its treatment of fracture processes is limited to the calculation of a scalar damage , which modifies the effective viscosity. BISICLES includes a model of damage evolution that attempts to evolve damage according to a simple relationship with local stress and damage advected from upstream (Sun et al., 2017). That model, however, proves too simplistic to model TEIS and TWIT accurately. Instead, we estimate , together with basal friction τb(x,y), through regularised optimisations conducted for monthly intervals from 2016 to 2020, using our velocity data derived from Sentinel-1 imagery. The model domain covers the Amundsen Sea embayment drainage basins including the entire Thwaites Glacier, and is based upon the BedMachine v.2 ice thickness and bedrock elevation (Morlighem et al., 2020). As in the HiDEM simulations, the pinning point at the northern tip of TEIS comprises two separate pinning regions. In contrast to HiDEM, the vertically integrated stress model within BISICLES does not depend on thickness above flotation in the pinning point, but only on its extent.
To assess the possible dynamic response of Thwaites Glacier to further changes on TEIS, we conducted a set of simulations to 2116 with varying damage, ice-shelf thickness and pinning point friction. All simulations start with the basal friction τb calibrated to March 2016, which then evolves according to a regularised Coulomb law (Joughin et al., 2019; Zoet and Iverson, 2020),
where β2(x,y) is a basal friction coefficient, u is the horizontal ice velocity, and u0 is a regularisation parameter. A simple set of calving criteria are also in play: ice is removed wherever m or where ice speed exceeds 104 m a−1. The damage–calving criterion is similar to the full-depth crevasse calving law of Nick et al. (2010) and determines the position of the ice front rather than a calving rate. Fourteen experiments are reported here and summarised in Table 2, designed to assess the impact of different physical processes. Each experiment is named according to the evolution of the ice-shelf damage D(x,y) and the choice of ice shelf melt rate and the choice of the basal friction regularisation parameter in Eq. (1), with a three-letter code (e.g. EMC, meaning “Extrapolation of damage, ice shelf Melting, and Coulomb-like friction”)
Damage evolution follows one of three possibilities:
-
Control experiments have D(x,y) set to the optimal values determined for March 2016.
-
Extrapolation experiments have D(x,y) increases linearly in time within the ice shelf from 2016 in order to reach the optimal values for March 2020, and then continue to increase linearly to 2026 at which point across the shear zone between the pinning point and the remainder of TEIS, and across the shear margin between TEIS and TWIT.
-
Unpinning experiments set the ice thickness to zero in a narrow region surrounding the pinning point from 2016 onward, creating a new northern calving front.
Ice shelf melt rates also follow one of three different schemes. Control experiments fix the ice-shelf thickness in time. Retreat experiments allow the ice shelf to evolve dynamically and fix the melt rate to zero but prevent present-day floating ice regions from grounding, so that the grounding line may retreat but not advance. Melting experiments apply one of the melt rate formulae described in Yu et al. (2018), leading to melt rates:
where zd is the depth of the lower surface of the ice shelf, measured in metres.
The basal friction regularisation parameter was set to either , resulting in plastic bed (Coulomb-like) friction across much of Thwaites Glacier, or to , where hard bed (Weertman-like) sliding dominates.
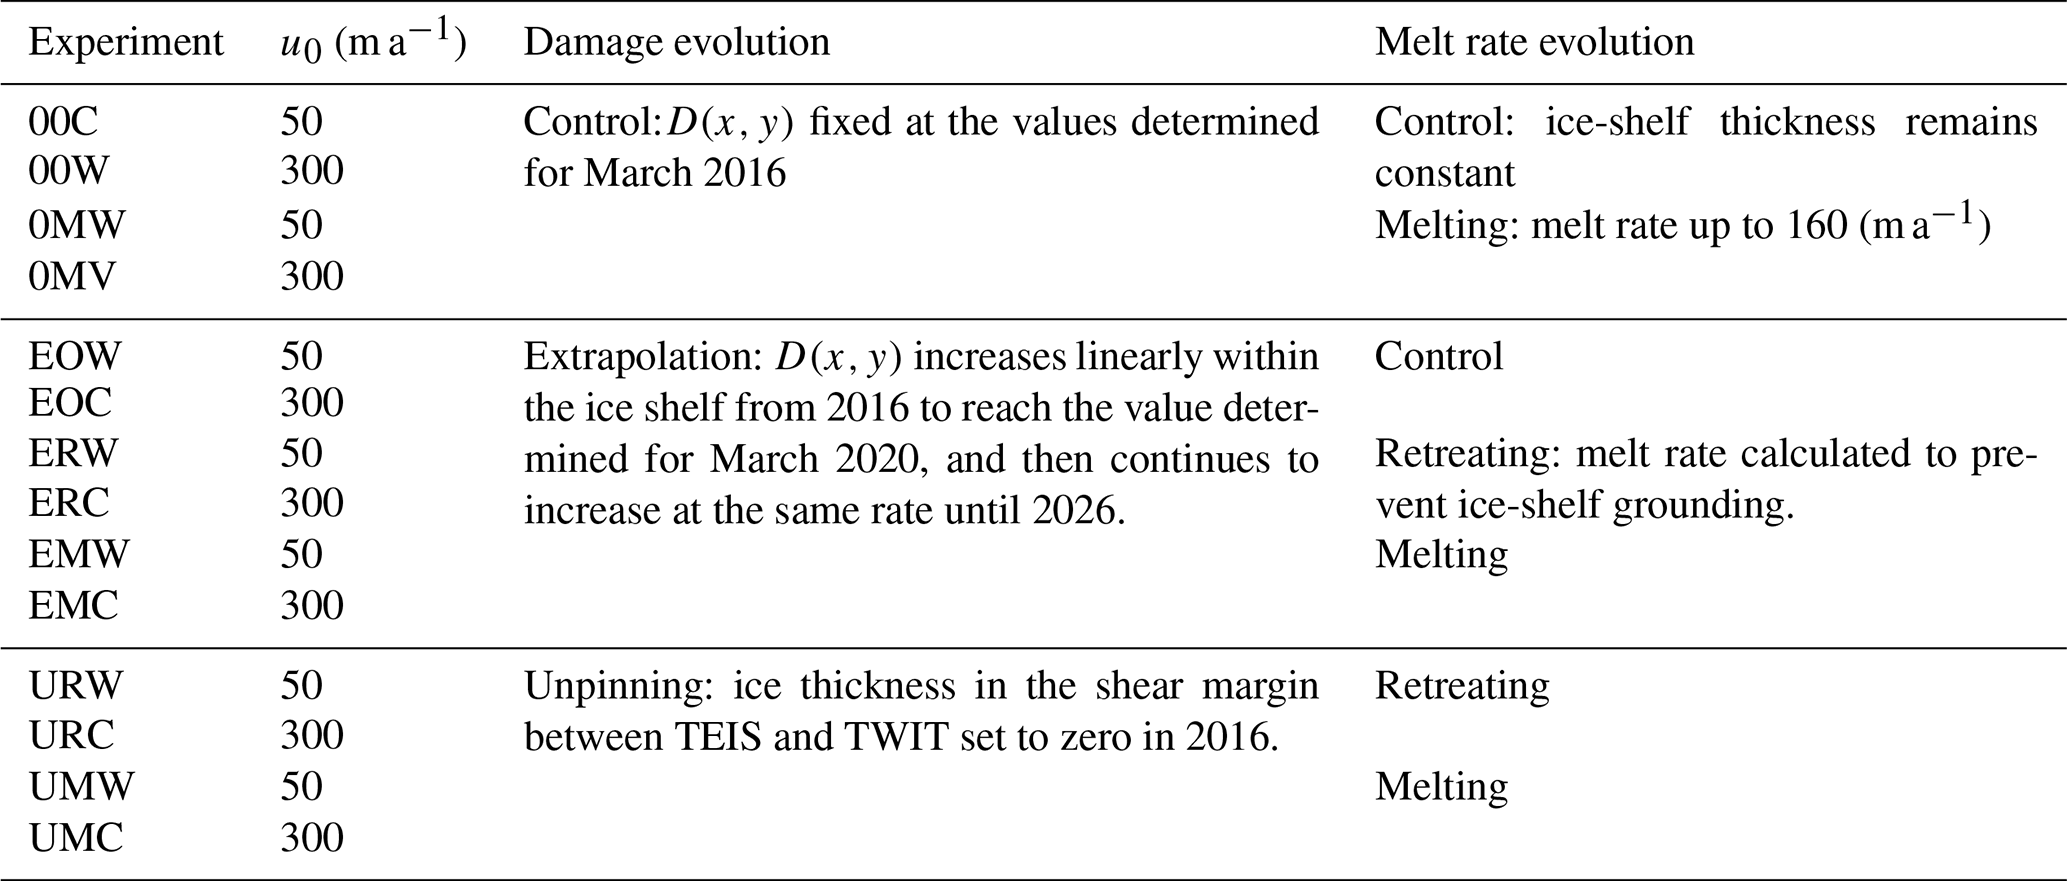
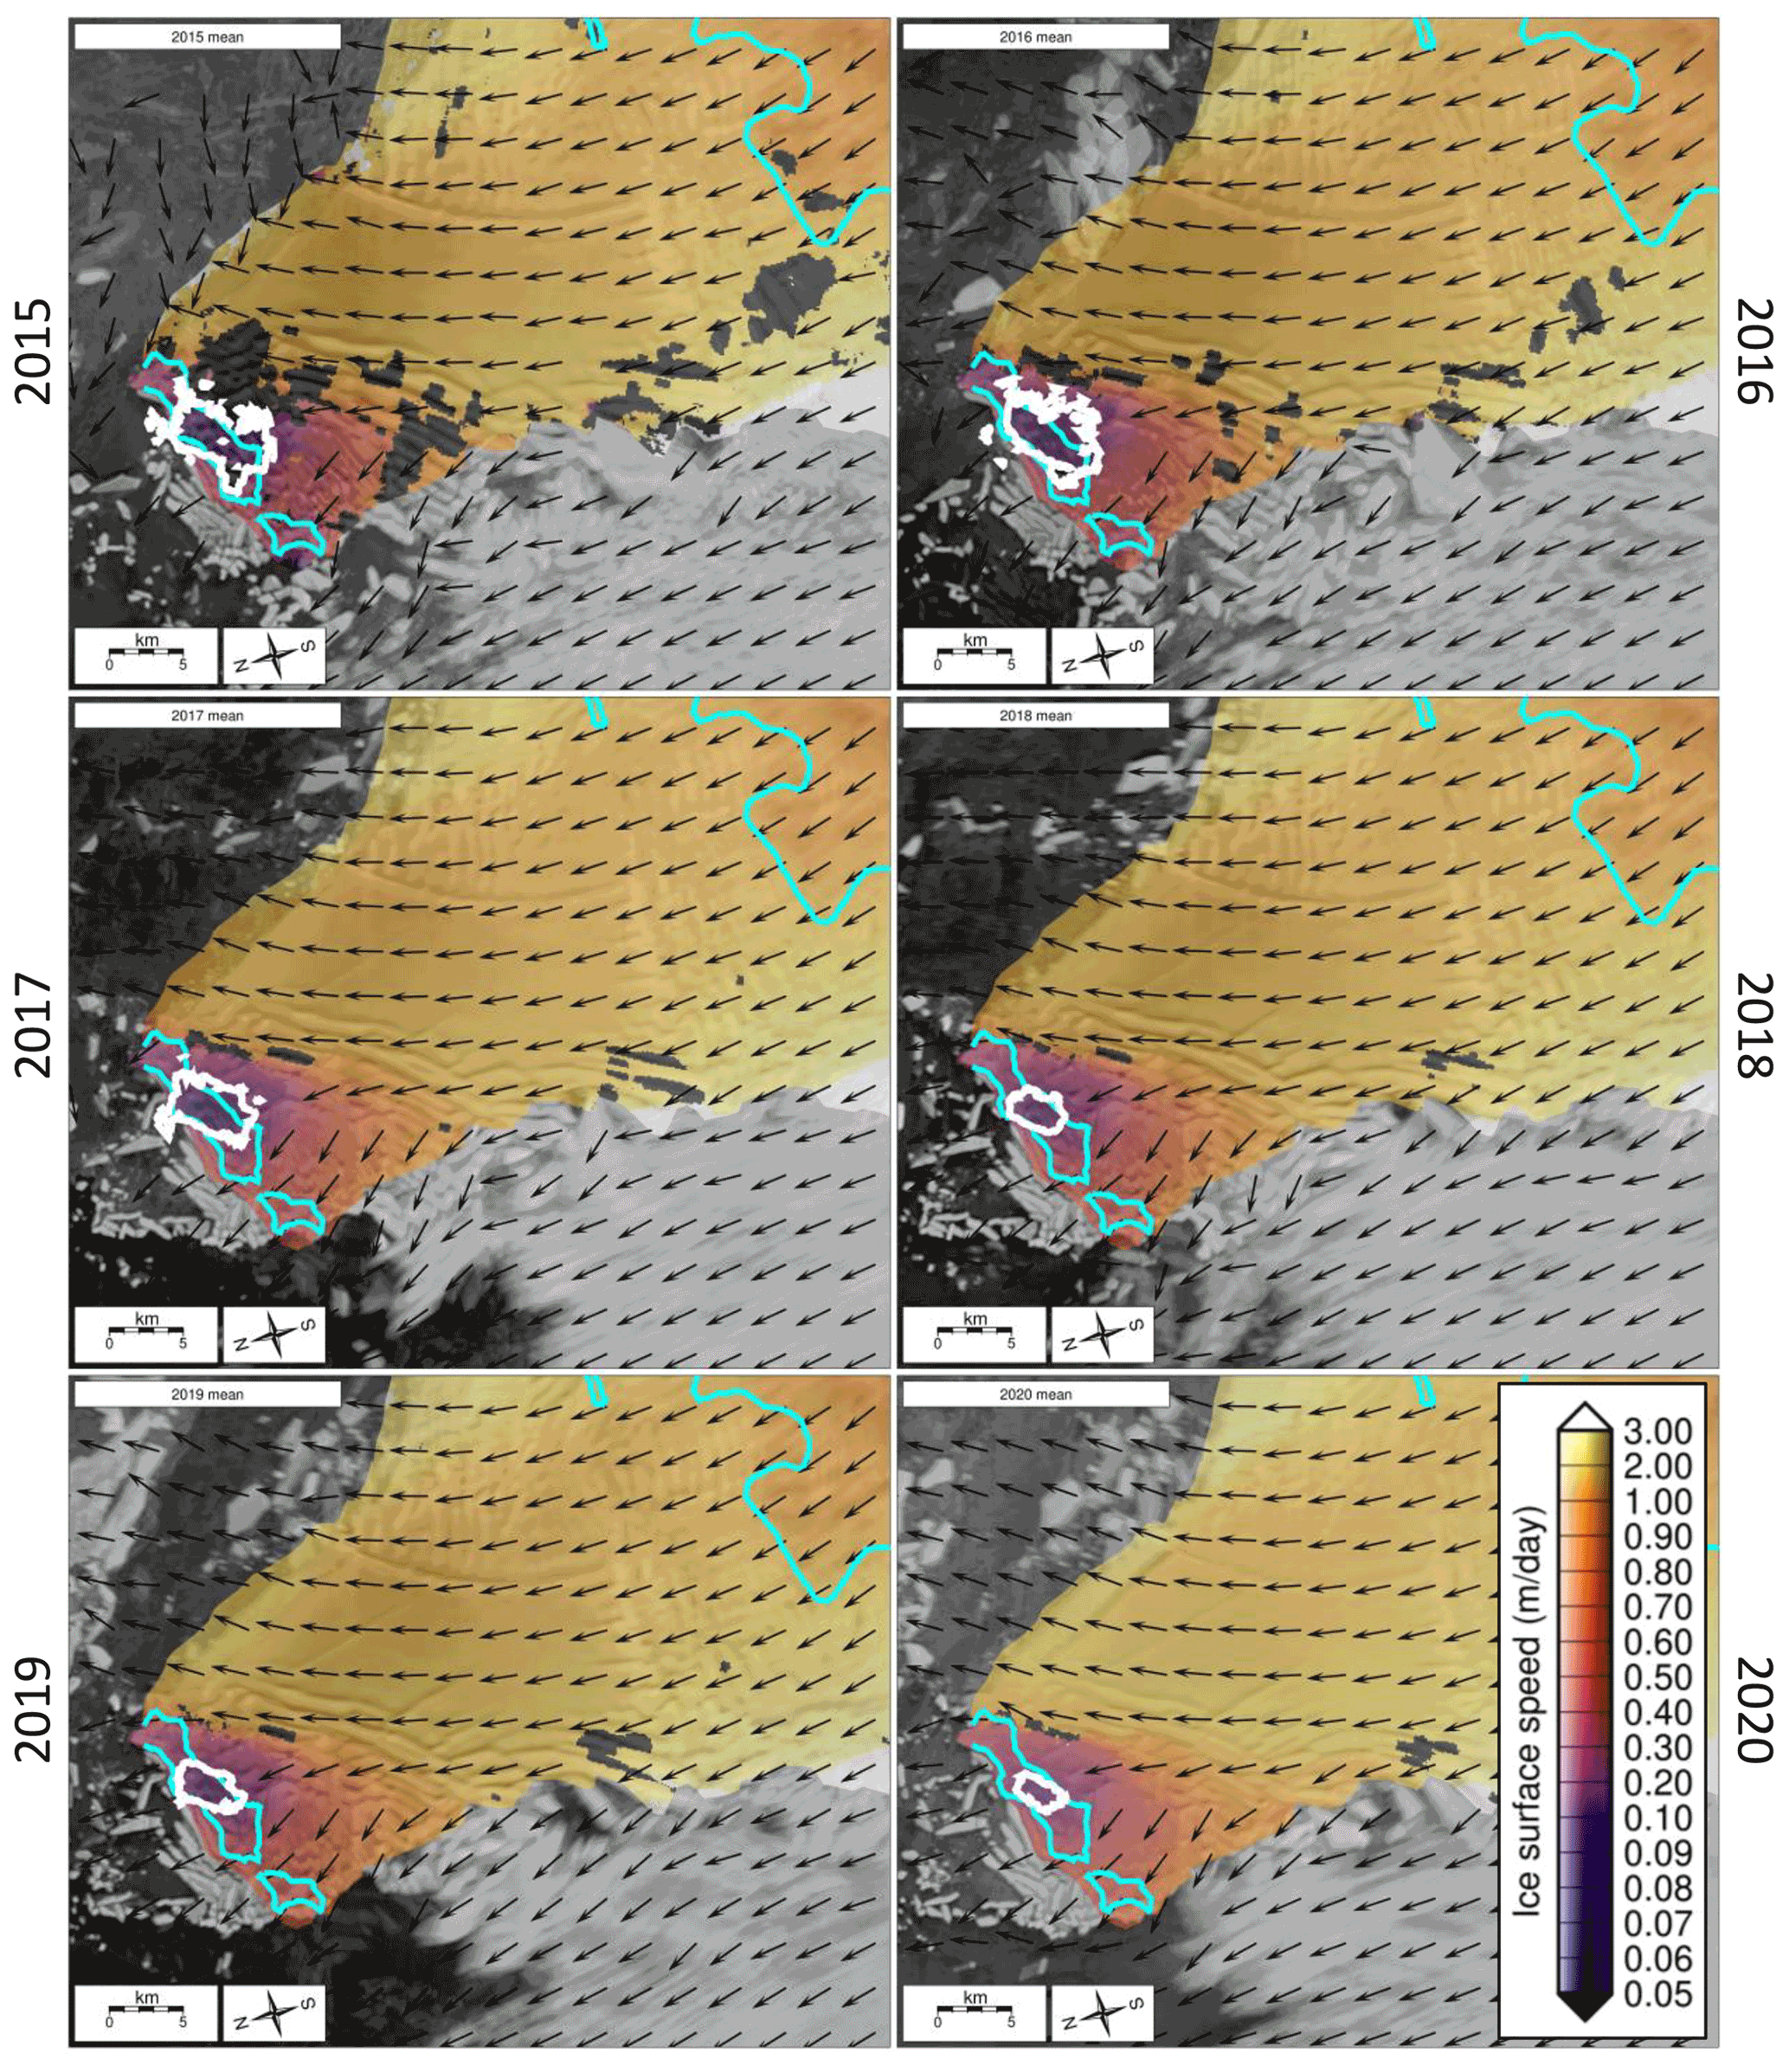
Figure 2Time series of mean annual velocity from TEIS derived from Sentinel-1 speckle tracking between 2015 and 2020. Arrows show flow direction and indicate no significant change in flow orientation during this period. White lines delineate the 0.2 m d−1 velocity contour which is centred on the main established pinning point. Sustained shrinkage over time of the area bounded by this contour confirms that TEIS is losing contact with the pinning point as the shelf thins (Alley et al., 2021; Wild et al., 2021).
3.1 Velocity structure 2015–2021
The large-scale velocity structure of TEIS underwent little change over the period 2015–2020 (Fig. 2). On all velocity maps, ice-flow vectors onto the shelf are aligned approximately normal to the general trend of the grounding line and over most of the shelf progressively veer toward the northeast as ice approaches the pinning point. The only exception to this pattern is in a relatively small region west and southwest of the pinning point, where ice flow is predominantly towards the northwest. Over most of the shelf, flow speeds are typically in the range 1–3 m d−1 and an order of magnitude lower at and around the pinning point. Sustained shrinkage of the area bounded by the 0.2 m d−1 velocity contour indicates progressive loss of traction over the pinning point, consistent with previous work that demonstrated ongoing ice thinning in this region (Fig. 2; Alley et al., 2021; Wild et al., 2021).
3.2 Fracture and strain 2015–2021
Although the large-scale velocity structure of TEIS has remained relatively constant from 2015 to 2020, considerable changes in fracture patterns and strain rates occurred during this period.
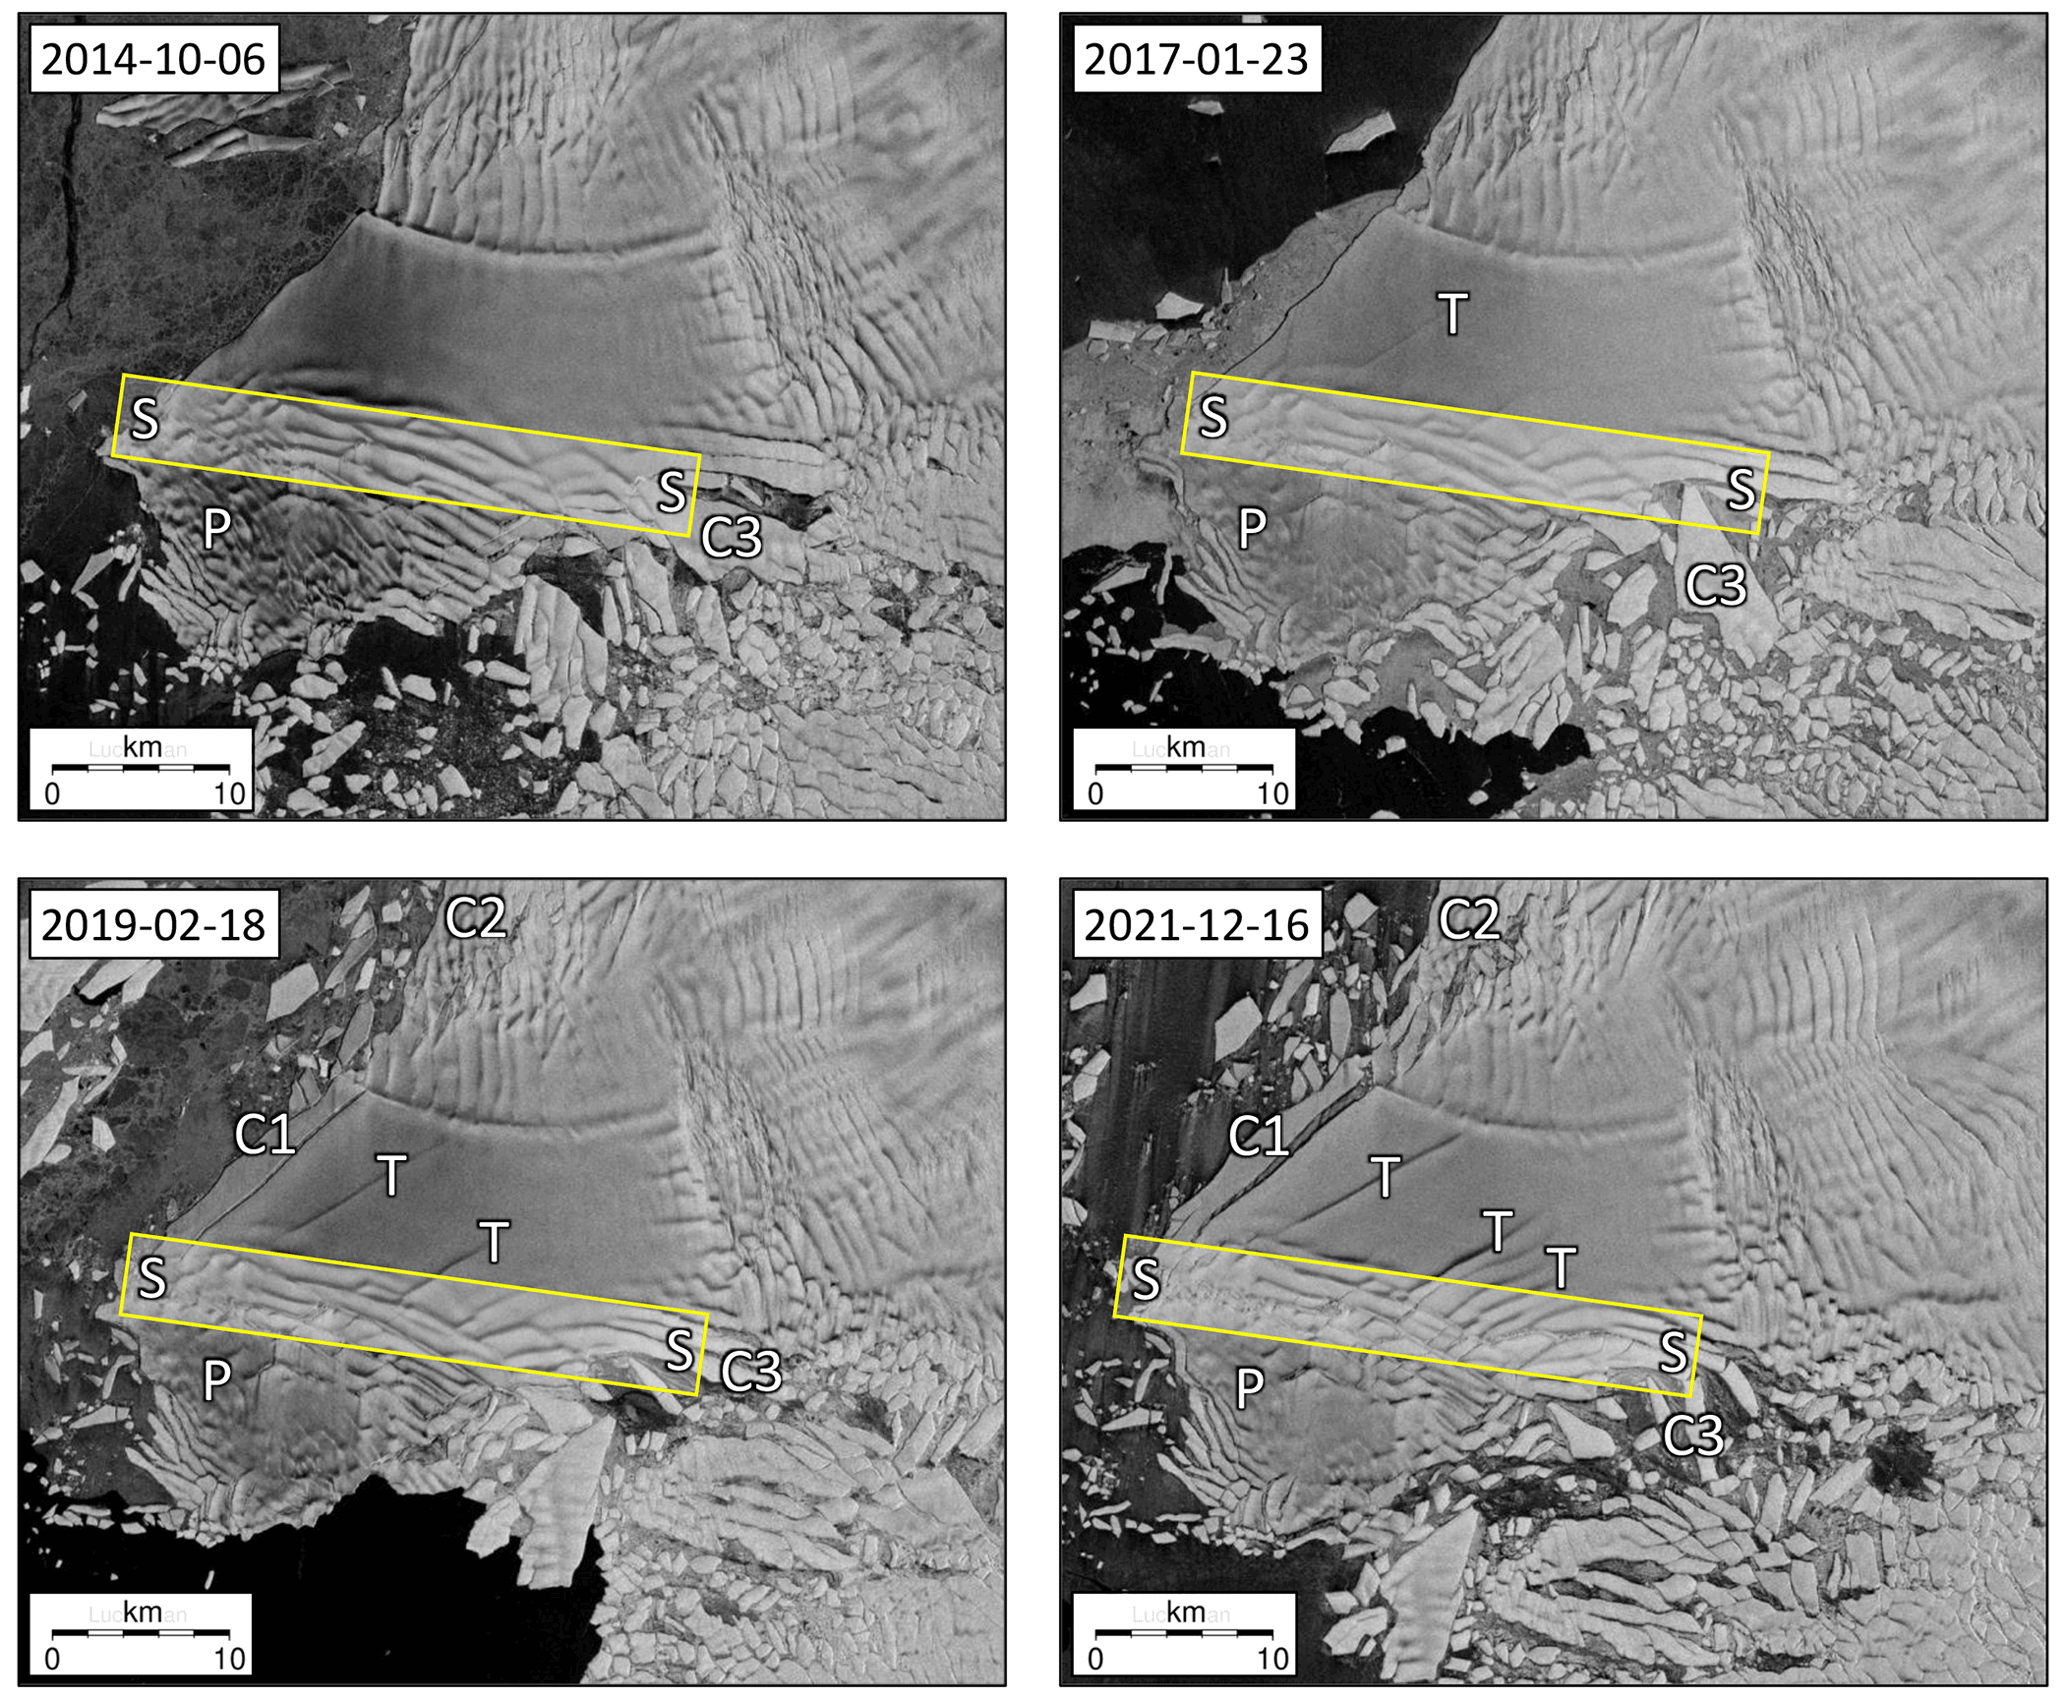
Figure 3Fracture patterns on TEIS 2014–2021. Labels indicate key features described in the text: S–S: TEIS shear zone; T: tensile cracks; C1–C3: calving along rifts; P: slow-moving, relatively intact ice above pinning point.
In Sentinel-1 imagery, evidence for fracturing takes two forms: (1) broad surface troughs indicating depressions above basal crevasses, and (2) sharp-edged linear features indicating surface crevasses or full-depth rifts (e.g. Luckman et al., 2012). In the earliest Sentinel-1 images (2014), sets of subparallel basal crevasses occur downflow of the grounding line and upstream of the pinning point (Fig. 3). The latter set extends diagonally across the shelf from southwest to northeast, coincident with the transition between rapidly and slowly moving ice shown in Fig. 2. This region is interpreted as a narrow shear zone (S; Fig. 3) between slow-moving ice over the pinning point (P; Fig. 3) and more rapidly flowing ice on the main part of the shelf, hereafter termed the TEIS shear zone. In late 2016 and early 2017, a set of secondary basal crevasses started to develop at a high angle to the TEIS shear zone, on the upstream (southern) side (T; Fig. 3). These subsequently propagated southward across the shelf and increased in number. During 2017, the easternmost of these secondary crevasses developed into a full-depth rift, visible as a sharp-edged feature on the Sentinel-1 imagery and leading to the detachment of a tabular berg ∼18 km long and up to 2 km wide (C1; Fig. 3). Other areas of active calving are evident on both the eastern (C2; Fig. 3) and western (C3; Fig. 3) flanks of TEIS, the latter releasing tabular bergs into the area formerly occupied by the shear margin between TEIS and TWIT. Evidence for full-depth rifting within the TEIS shear zone was initially confined to short wing cracks across blocks bounded by basal crevasses, but became increasingly widespread over time.
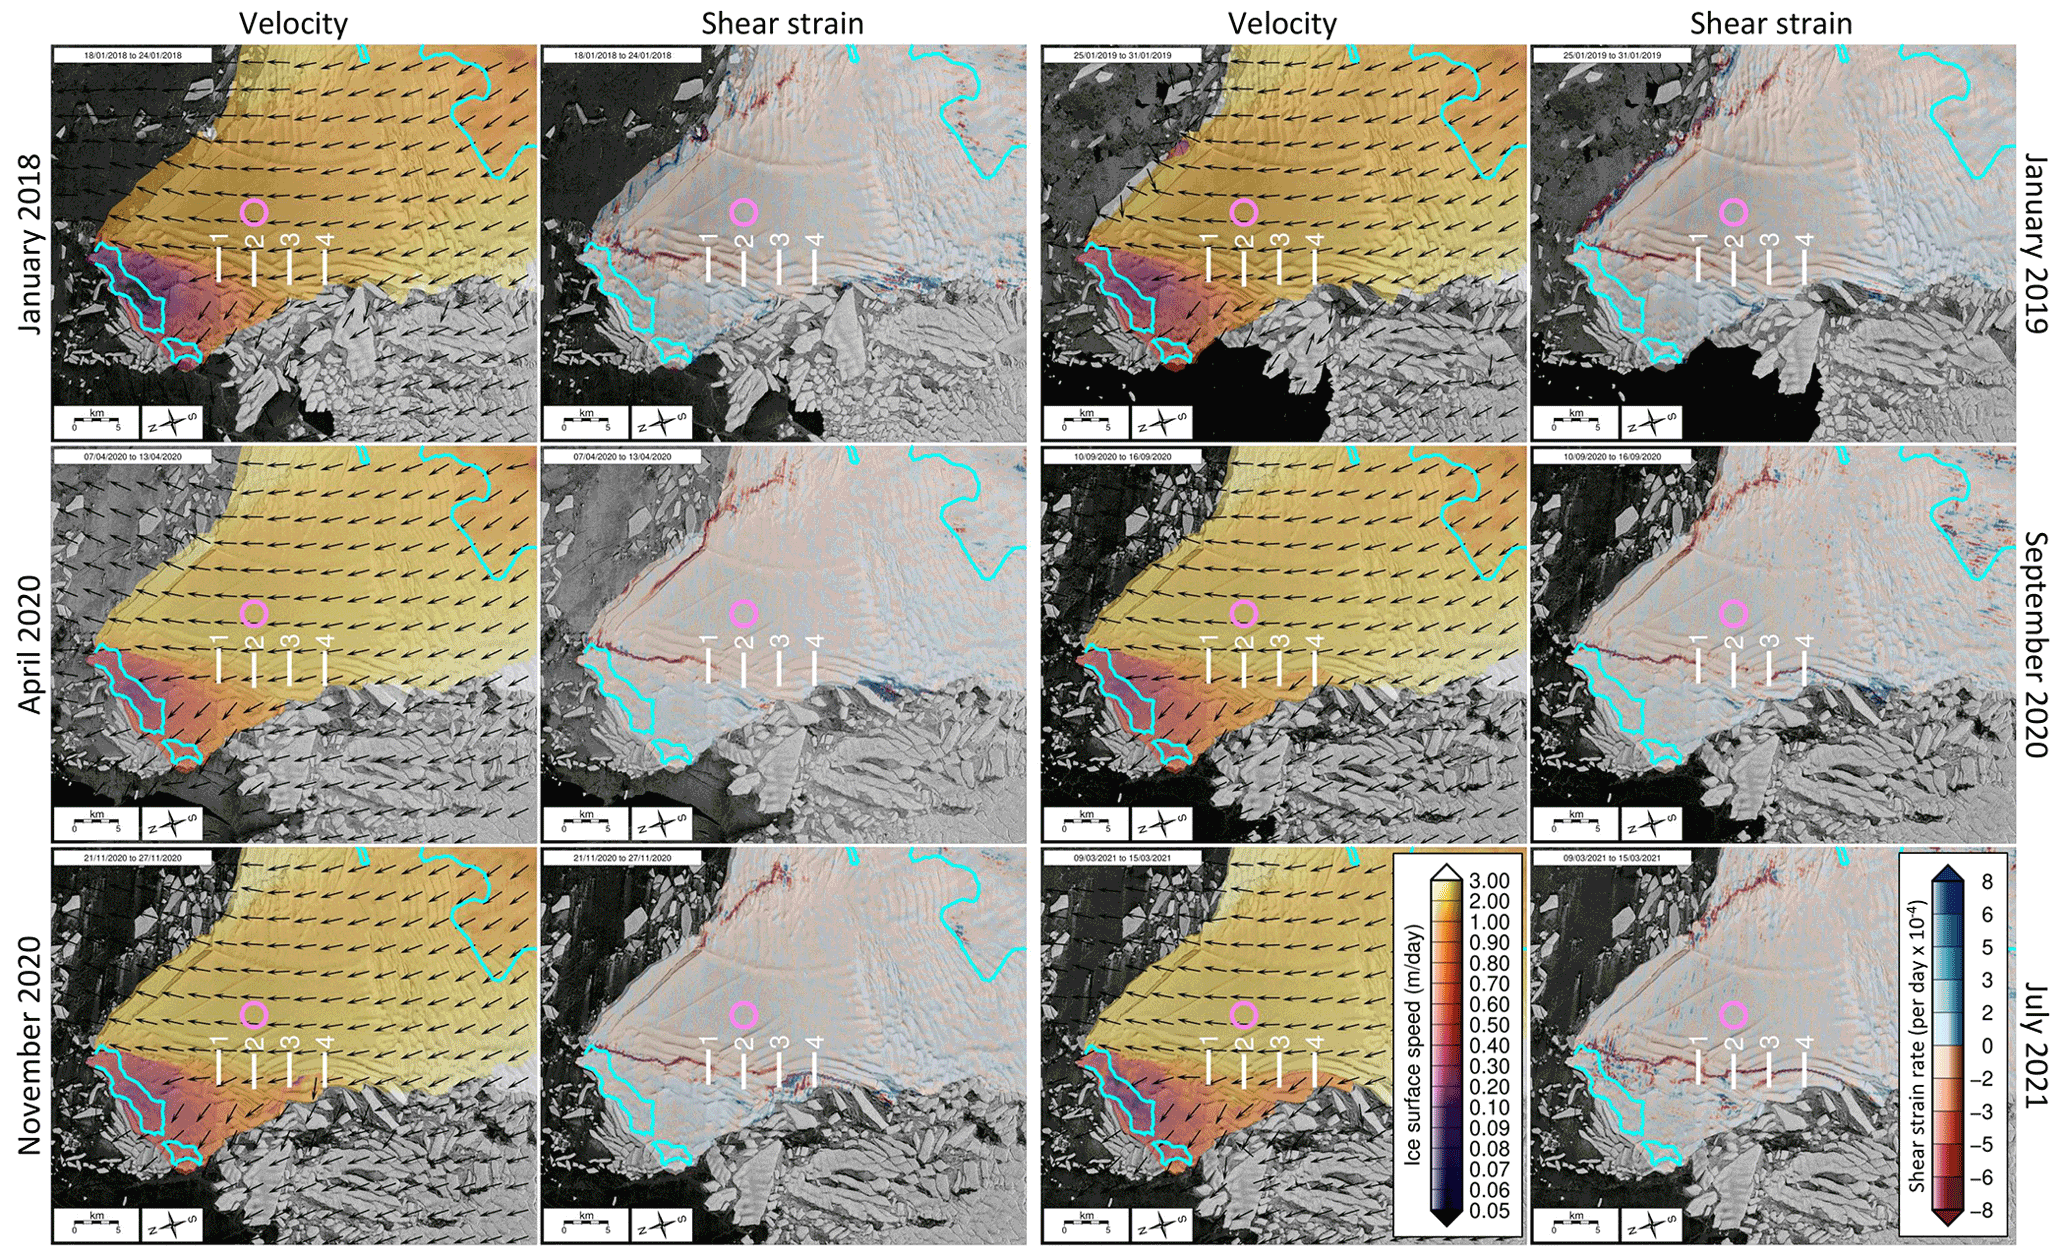
Figure 4Evolution of velocity (first and third columns) and shear strain rate (second and fourth columns) on TEIS derived from Sentinel-1 speckle tracking between 2016 and 2021. Specific image pairs are chosen for excellent coherence and minimal noise, and to focus on recent months. Cyan lines are MEaSUREs InSAR-derived grounding lines from 2011 showing the location of historic known pinning points. White lines show positions of numbered profiles used to extract velocities presented in Fig. 5. The magenta circle indicates the location of the velocity time series shown in Fig. 6.
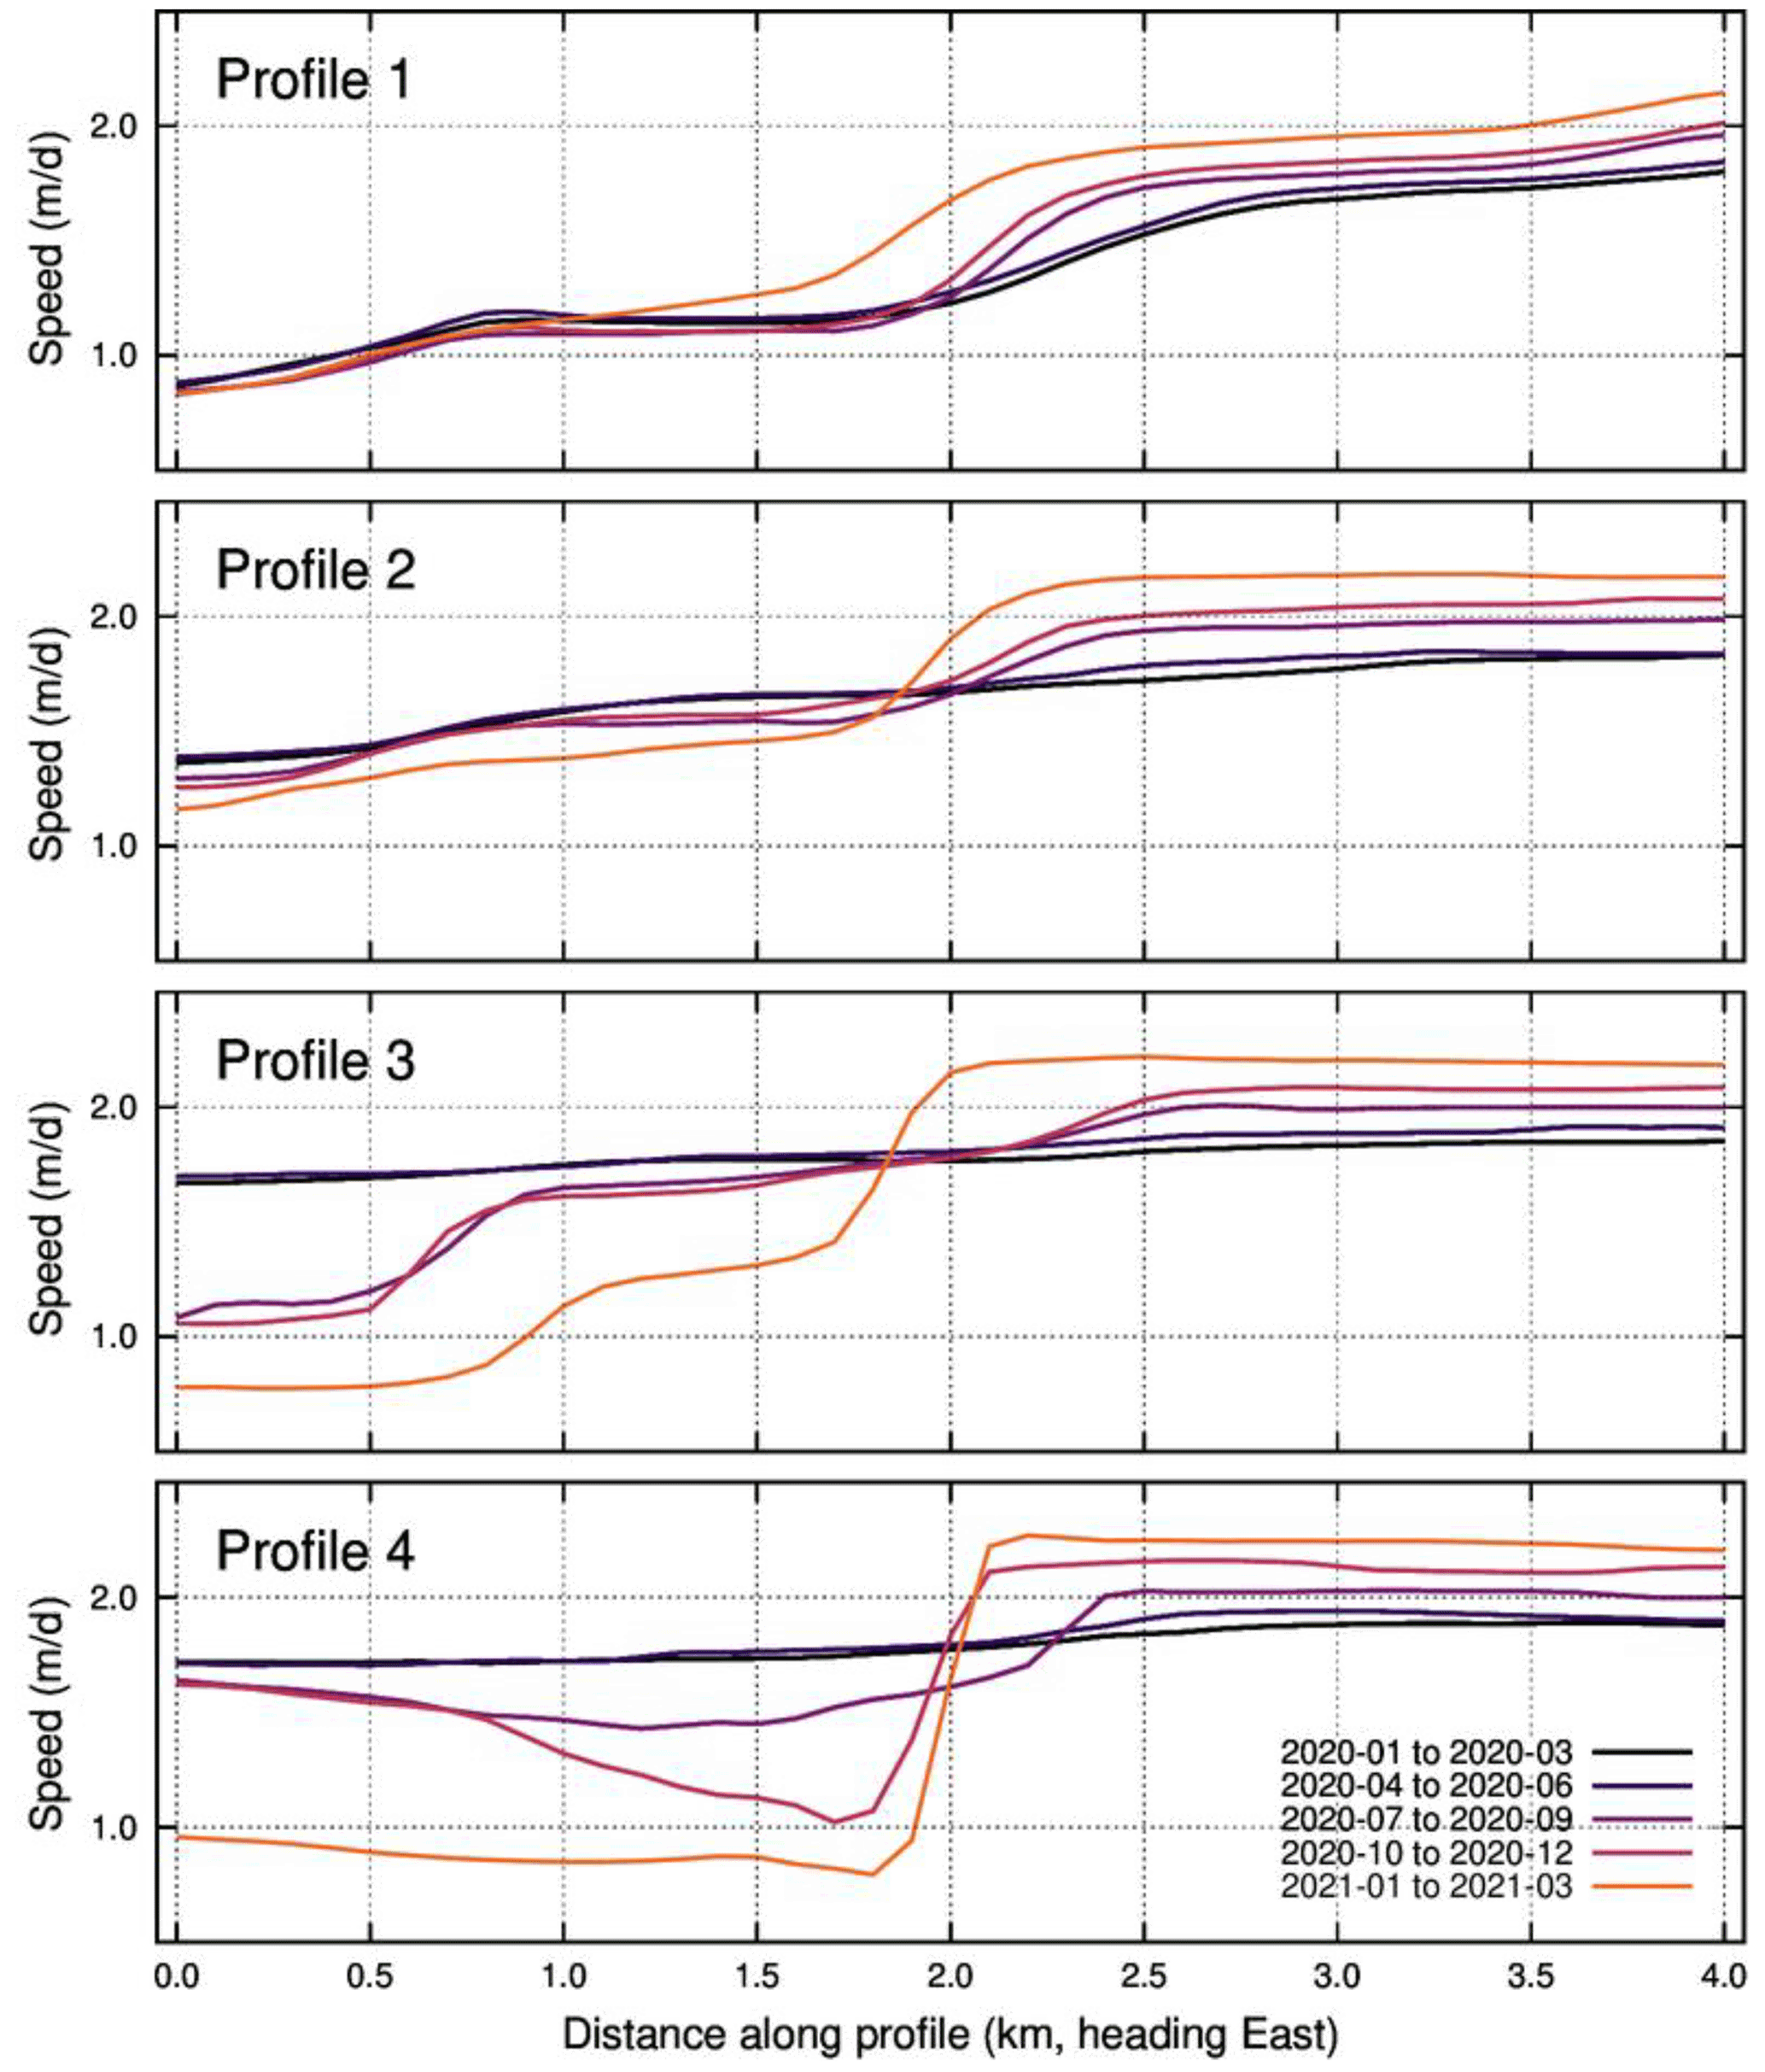
Figure 5Profiles of mean quarterly surface velocity during 2020 and 2021 from Sentinel-1 speckle/feature tracking along the white lines shown in Fig. 4.
Rapid evolution of the shear zone since 2018 is further illustrated by velocity gradients and patterns of shear strain (Figs. 4 and 5). In 2018, a narrow band of high strain existed in the northeastern portion of the shear zone, while strain in the remainder of the shear zone was lower in magnitude and distributed over a much wider area. In late 2020, a second narrow shear band appeared at the southwest end of the shear zone, then both bands connected and extended across the full extent of the shelf by early 2021, indicating a transition to full-thickness fractures. Velocity gradients across the southwestern half of the shear zone (Fig. 5) show distributed strain in the first quarter of 2020, suggesting predominantly viscous deformation or strain distributed across numerous fractures. During 2020 all velocity profiles showed increasing localisation of strain as the shear zone transitioned to full-depth fractures. Increasing shear localisation is accompanied by an increase in ice velocity on the upstream side of the shear zone and a decrease on the downflow (pinning point) side. On the upstream side, ice acceleration is substantial and ongoing (Fig. 6), with >40 % increase in ice speed in the central part of TEIS between 2018 and 2021.
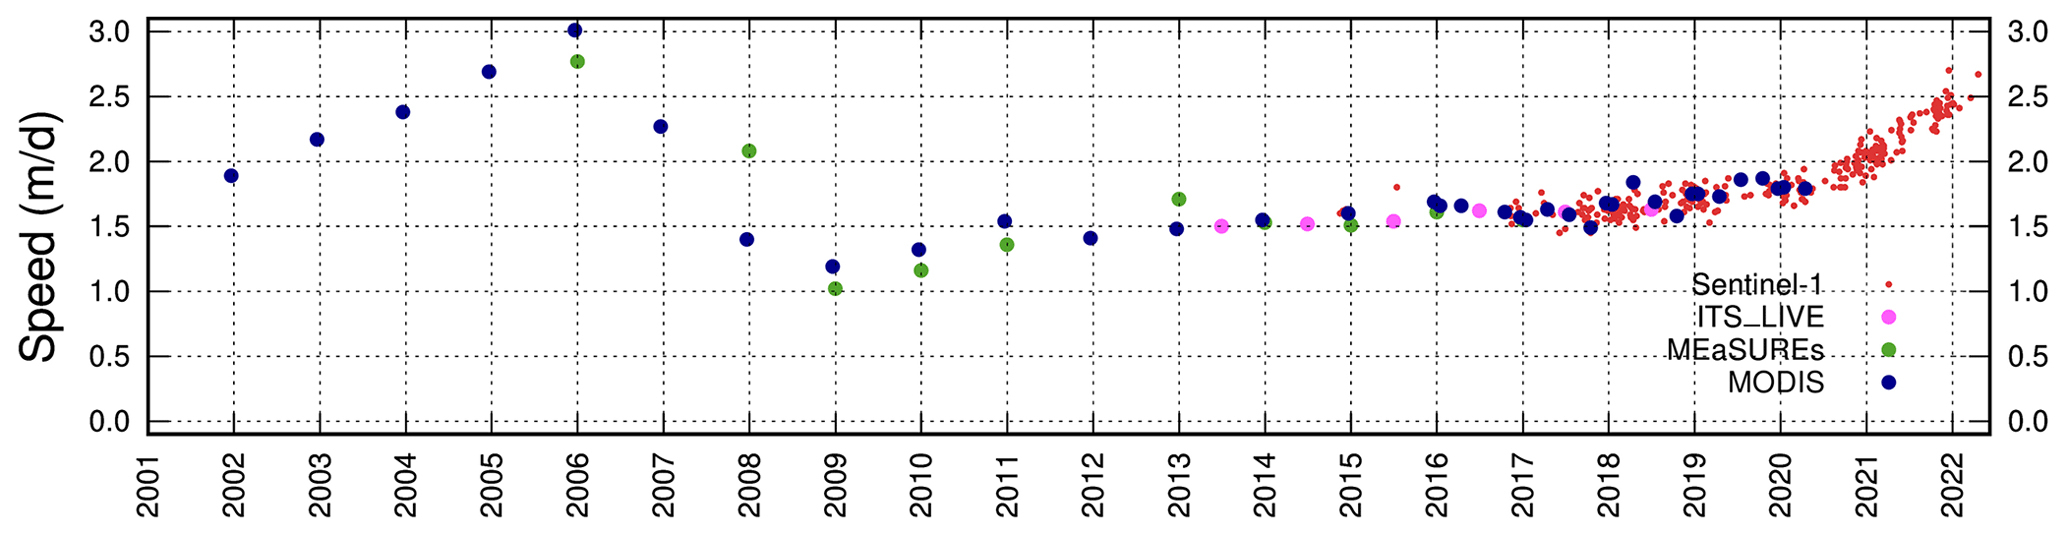
Figure 6Velocity evolution at a point in the centre of TEIS from MODIS (blue dots; Alley et al., 2021), ITS_LIVE (pink), MEaSUREs (green) and Sentinel-1 (small red) showing the 2002–2006 acceleration, the 2006–2009 slowdown, the 2009–2020 modest acceleration and recent rapid acceleration as the shelf crossed the fracture transition. Location of velocity data is shown by the magenta circle in Fig. 4.
3.3 Long-term perspective: velocity and strain from MODIS data 2002–2021
The shear zone on TEIS was already a well-established feature in 2014, when the Sentinel-1 data began. Evolution of TEIS prior to 2014, and the possible origin of the shear zone, can be inferred using MODIS and other historical data (Alley et al., 2021). These data are at a lower spatial resolution (500 m) than the Sentinel-1 imagery, and strain rates were calculated over a longer length scale (2500 m). This precludes detailed analysis, but the MODIS data provide a valuable record of large-scale patterns of velocity and strain and their changes over time.
Figure 6 shows a time series of velocity in the central part of TEIS, ca. 15 km upstream of the pinning point (magenta circle in Fig. 4). The ice accelerated between 2002 and 2006, then rapidly decreased to a minimum in 2009 before gradually increasing until 2020 when the current acceleration began. The 2002–2006 acceleration is attributed to strong coupling between TEIS and TWIT (Alley et al., 2021). The TWIT increased in speed after 2002 (Miles et al., 2020), possibly in response to progressive unpinning (Tinto and Bell, 2011), and the strong shear margin between the two portions of the shelf allowed TEIS to be dragged forward (Alley et al., 2021). After 2006, the shear margin between TEIS and TWIT fragmented and weakened, reducing coupling and allowing TEIS to decelerate. Meanwhile, TWIT fragmented and transitioned into a “mélange ice shelf” and continued to accelerate (Miles et al., 2020; Alley et al., 2021).
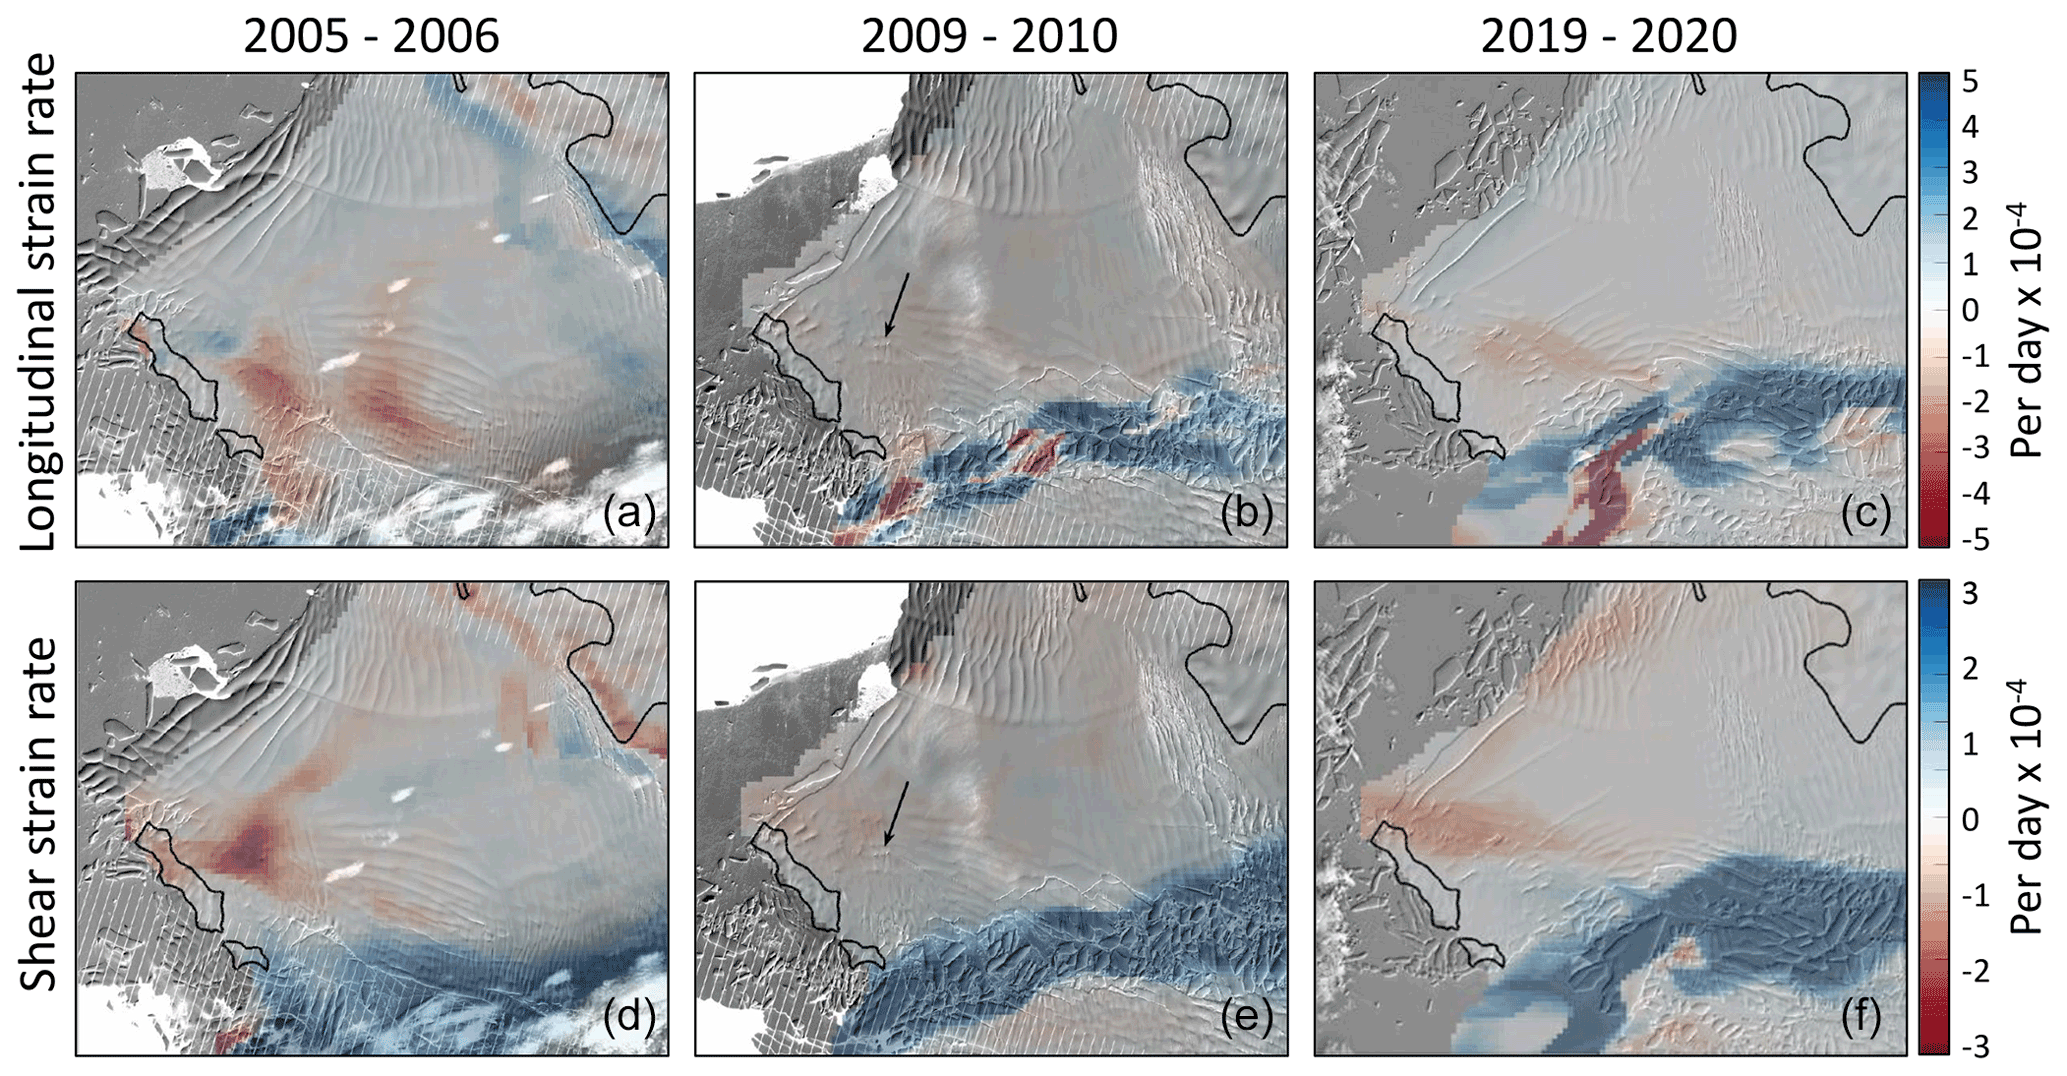
Figure 7Mean longitudinal strain rates (a–c) and shear strain rates (d–f), from MODIS feature tracking in 2005–2006 during the TEIS acceleration event (a, d), 2009–2010 (b, e), and 2019–2020 (c, f). The TEIS–TWIT shear margin is near the bottom of each image and the TEIS shear zone is to the right of the twin “islands” of the pinning point, outlined in black, from the MEaSUREs 2011 grounding line (Rignot et al., 2016). Background images are from Landsat-7 (a, d: 13 January 2005; b, e: 13 December 2010) and Landsat-8 (c, f: 12 November 2019). The first major crevasses within the location of the current shear zone became visible in Landsat imagery around 2010, and examples are indicated by the arrows in the middle column.
Patterns of strain on TEIS for three key time periods are shown in Fig. 7. During the TEIS acceleration event (2005–2006), a band of positive (dextral; blue) shear strain outlines the shear margin between TEIS and TWIT, while a zone of negative (sinistral; red) shear strain is evident around the locus of the modern TEIS shear zone. Very high compressive longitudinal strain rates upstream of the TEIS pinning point indicate significant backstress during the acceleration event. After the acceleration event, the shear margin between TEIS and TWIT weakened, reducing the coupling between them, and allowing TEIS to slow down again. This appears in the middle column of Fig. 7, where high shear strain rates delimit the weakened shear margin between TEIS and TWIT. In contrast, both shear strain and longitudinal strain rates are very low upstream of the TEIS pinning point. However, the first large fractures within the TEIS shear zone are visible in the Landsat imagery (marked with an arrow). Data for 2019–2020 show a renewed increase of shear strain in the vicinity of the shear zone and the development of extensive rifting. This phase of shear zone evolution has been discussed in detail above (Figs. 4 and 5).
In summary, TEIS has undergone a process of fragmentation in the last 5 years, including brittle failure along a major shear zone up-glacier of the pinning point, formation of longitudinal tensile cracks on the main body of the shelf, and release of tabular bergs on both eastern and western flanks of TEIS. This pattern of failure is consistent with longitudinal compression and transverse extension of the shelf. The origins of the shear zone can at least be traced to the 2002–2006 acceleration event on TEIS, when zones of high longitudinal and shear strain developed upstream of the pinning point, indicating high backstress at that time. Fragmentation of the shelf has increased since 2014, with increasing shear localisation and extensive full-thickness rifting since late 2020. Weakening of the shear zone has been accompanied by rapid and ongoing acceleration of the ice on the upstream side.
4.1 Fracture modelling with HiDEM
The results of our HiDEM simulations show that widespread fracturing of the shelf does not occur in runs with low damage density (d<0.3), but does occur for runs with high damage density (d=0.6). Results from two runs with d=0.6 and different pinning point friction are presented here.

Figure 8Modelled and observed fractures on TEIS. Panels (a) and (b) show ice displacement patterns simulated in HiDEM. Panel (c) shows the satellite observations and labels key features as in Fig. 3 (S–S: TEIS shear zone; T: tensile cracks; C1–C3: calving along rifts; P: pinning point). Panel (a) illustrates that the observed shear zone does not develop in the simulation with the baseline friction boundary condition over the pinning point (i.e. values derived from the Elmer/Ice inversion rescaled for HiDEM) and damage density =0.6. The zone of large displacements around TEIS (yellow) consists of mélange and calved icebergs. Panel (b) shows the sharp displacement gradient (shear zone) between the main body of TEIS and the triangular area of stationary ice extending from the pinning point in the HiDEM simulation with a no-slip boundary condition over the pinning point and damage density =0.6. Panel (d) illustrates fracture patterns resulting from the HiDEM simulation, depicting surface elevation in greyscale shading and bonds broken during the simulation in blue. Features with close correspondence to the observations are also indicated.
Results for d=0.6 and baseline friction are shown in Fig. 8a. The pinning point does not exert any significant influence on the pattern of ice displacement, and ice is able to slide over the proximal side of the submarine ridge then calves at its crest. Extensive rifting and calving occur on the eastern flank of TEIS (highlighted by discontinuities in displacement magnitudes), but only limited fracturing occurs on the western flank.
Figure 8b shows results for d=0.6 and a no-slip boundary condition over the pinning point. In this case, a teardrop-shaped area of stagnant, largely intact ice extends upstream from the pinning point. Patterns of ice displacement on TEIS show progressive veering towards the northeast as it approaches the stagnant zone. Mobile and stagnant ice are separated by a shear zone, indicated by the sharp discontinuity in displacement magnitudes. The eastern and western flanks of TEIS exhibit widespread propagation of subparallel rifts and calving of tabular icebergs, and tensile fractures are developed in the central part of the shelf (Fig. 8d).
The fracture pattern in the no-slip simulation exhibits many similarities with the pattern observed in February 2021 (Fig. 8c and d). Key common features are (1) a triangular zone of slowly moving or stagnant ice extending upstream from the pinning point; (2) deflection of ice flow around the stagnant zone; (3) development of a shear zone (TEIS shear zone) upstream of the pinning point; (4) and rifting and calving along the eastern and western flanks of TEIS. Tensile cracks appear on the mid-shelf in the HiDEM simulation, but unlike the separate linear fractures observed on TEIS, they are part of stepped fractures with both shear and tensile components. This difference probably reflects the lack of viscous processes in the model. The otherwise close similarity between the observed pattern of fracture and the no-slip HiDEM simulation supports the conclusion that the recent fragmentation of TEIS occurred in response to uniaxial compression (i.e. opposing driving stress and backstress from the pinning point) and the absence of transverse confining pressure.
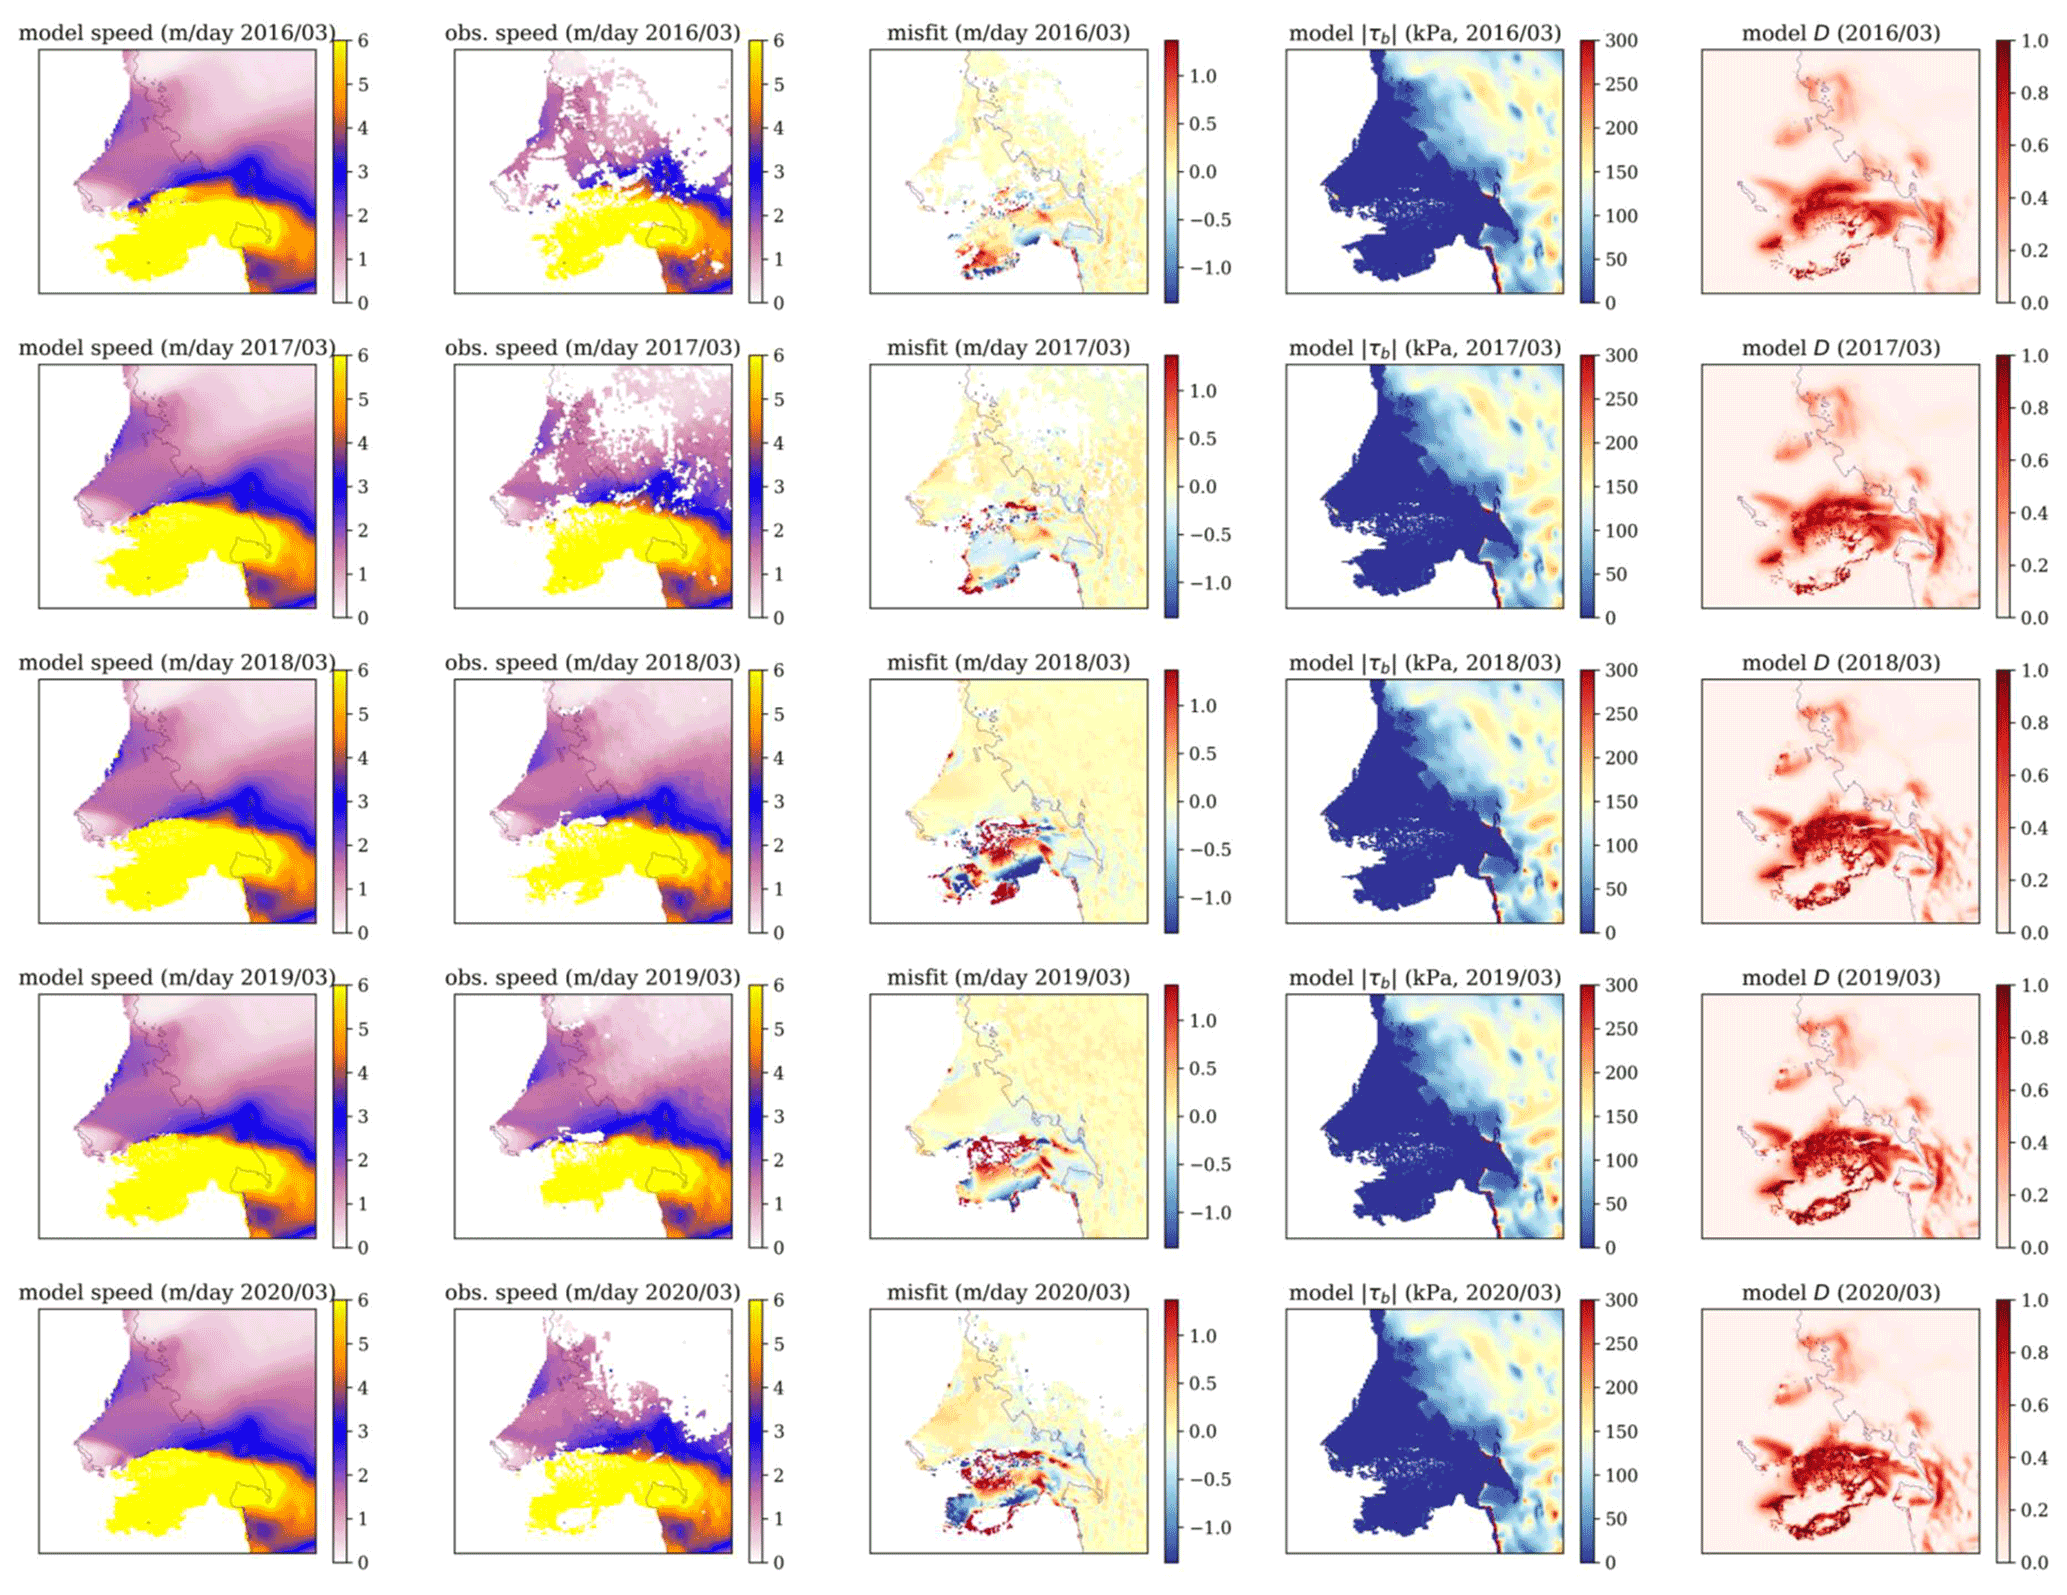
Figure 9BISICLES inverse problem results: March 2016–2020. The first and second columns show the optimised model velocities and observed velocities; the third column shows the misfit between modelled and observed velocities; and the fourth and fifth columns show the resulting optimised basal traction and damage. Each row shows data for March of 1 year.
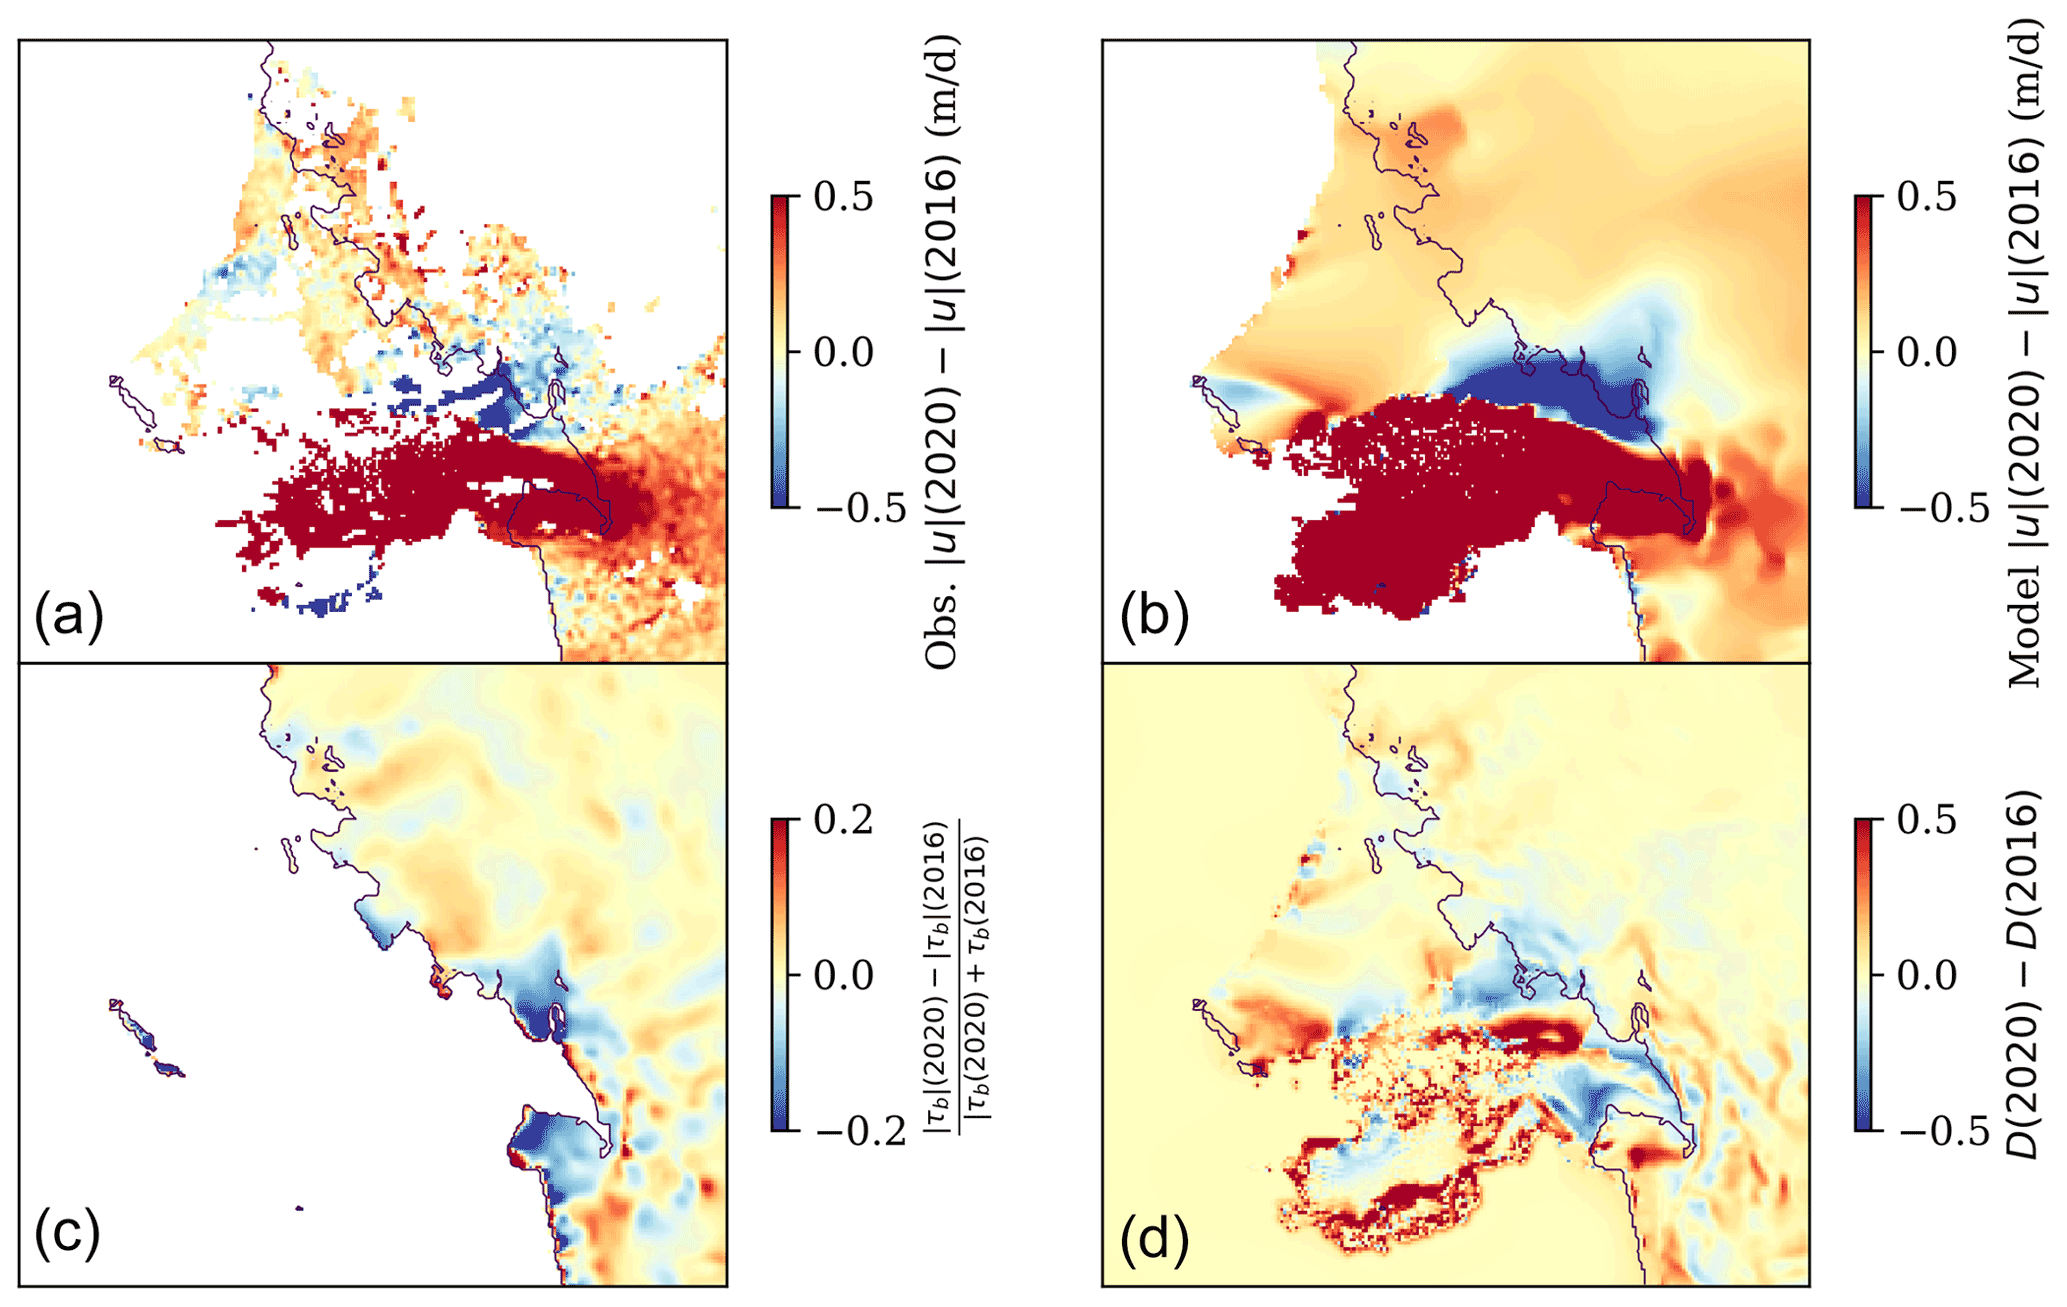
Figure 10BISICLES model inverse problem results: difference between March 2016 and March 2020. Observed speed differences (a). Model speed difference (b). Normalised difference in basal friction magnitude (c). Difference in damage D(xyt) (d).
4.2 BISICLES model results: damage evolution and future dynamics
The observed increase in speed in TEIS between 2016 and 2020 can be reproduced in the optimised BISICLES model by reduced friction close to the 2016 TWIT grounding line and by increased damage in both the shear zone region southeast of the TEIS pinning point as well as the shear margin between TEIS and TWIT. The optimised damage and basal friction fields computed for March 2016 to 2020 are shown in Fig. 9 together with the associated observed and model speeds. Model speeds match observed speeds across the majority of Thwaites Glacier: the notable exception is TWIT, where brittle fracture and the formation of a mélange shelf are poorly described by the continuum model. There the mismatch is as much as 500 m a−1, or 10 % of the observed speed. Figure 10 shows the difference in basal traction, and the difference in damage, between March 2016 and March 2020, together with the difference in both observed and model velocities. The greatest relative changes in the basal friction are concentrated close to the TWIT grounding line and on the TEIS pinning point, perhaps due to the grounding line retreat, or at least the reduction in effective pressure. Damage around the TEIS pinning point increases from around 0.4 to around 0.8, while TEIS and TWIT are essentially separated from one another.
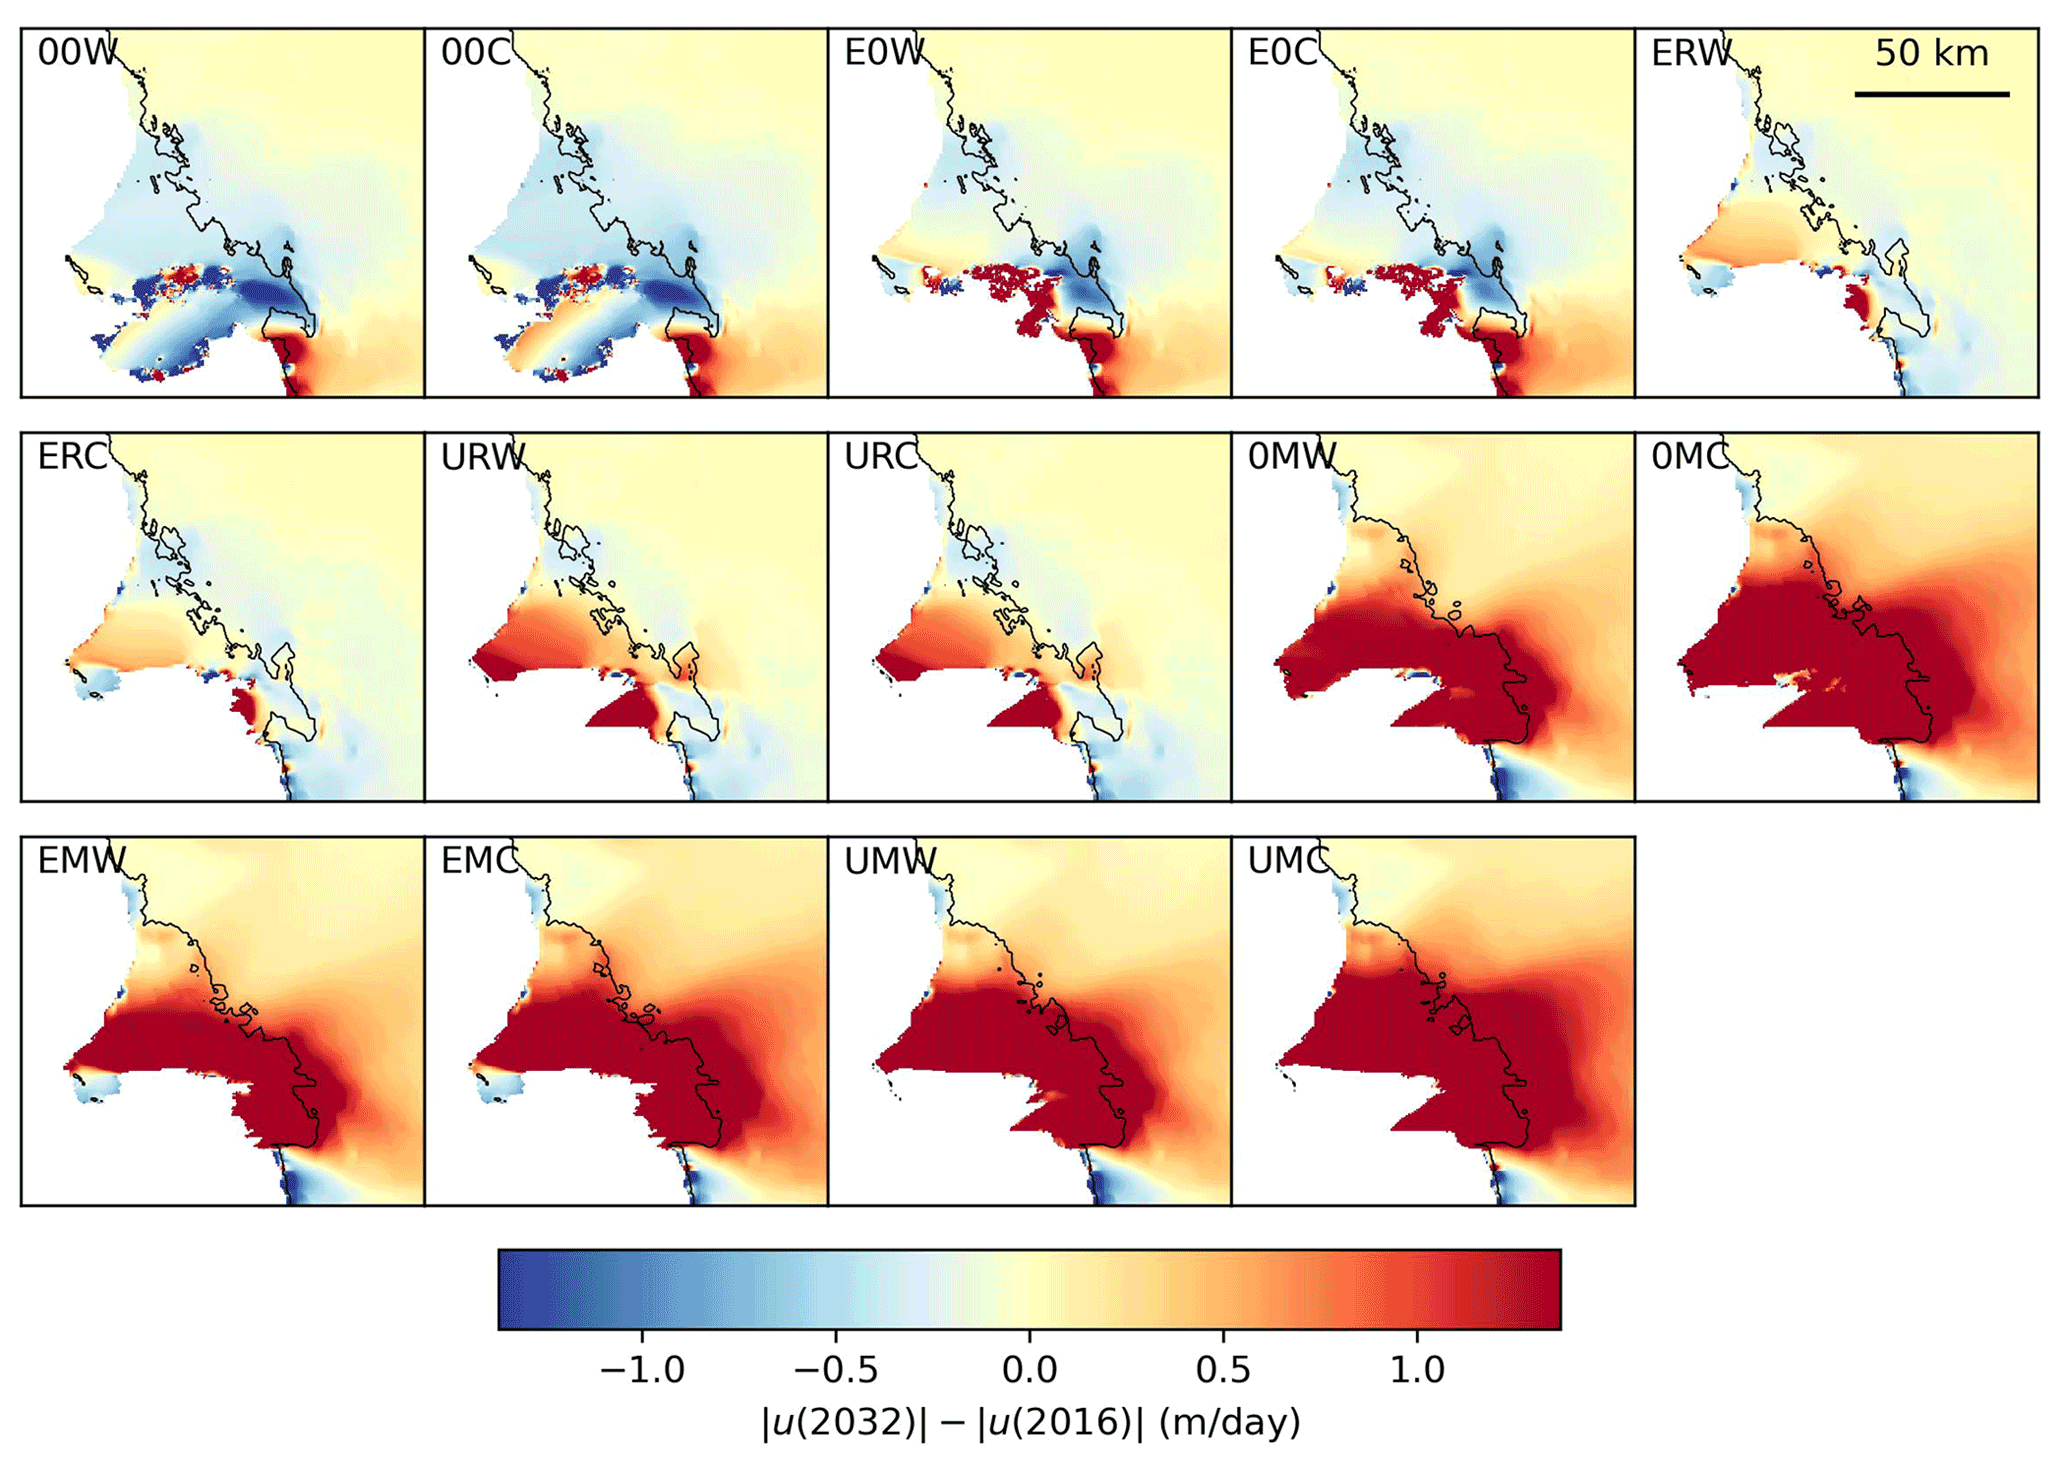
Figure 11Output of BISICLES simulations of TEIS, showing differences in velocity between 2016 and 2032, and the 2032 grounding line (see Appendix for equivalent panels with simulation end years of 2024, 2064 and 2112). Control experiments (00W, 00C) see TEIS and the upstream ice slow down as the geometry relaxes. Damage extrapolation and unpinning experiments without sustained future melting (E0W, E0C, ERW, ERC, URW, URC) see parts of TEIS speed up and a lower rate of upstream slow down. Experiments with sustained future melt forcing (0MW, 0MC, EMW, EMC, UMW, UMC) see ice flowing faster across the whole region, more so when the TEIS damage is greater (EMW, EMC, UMW, UMC).
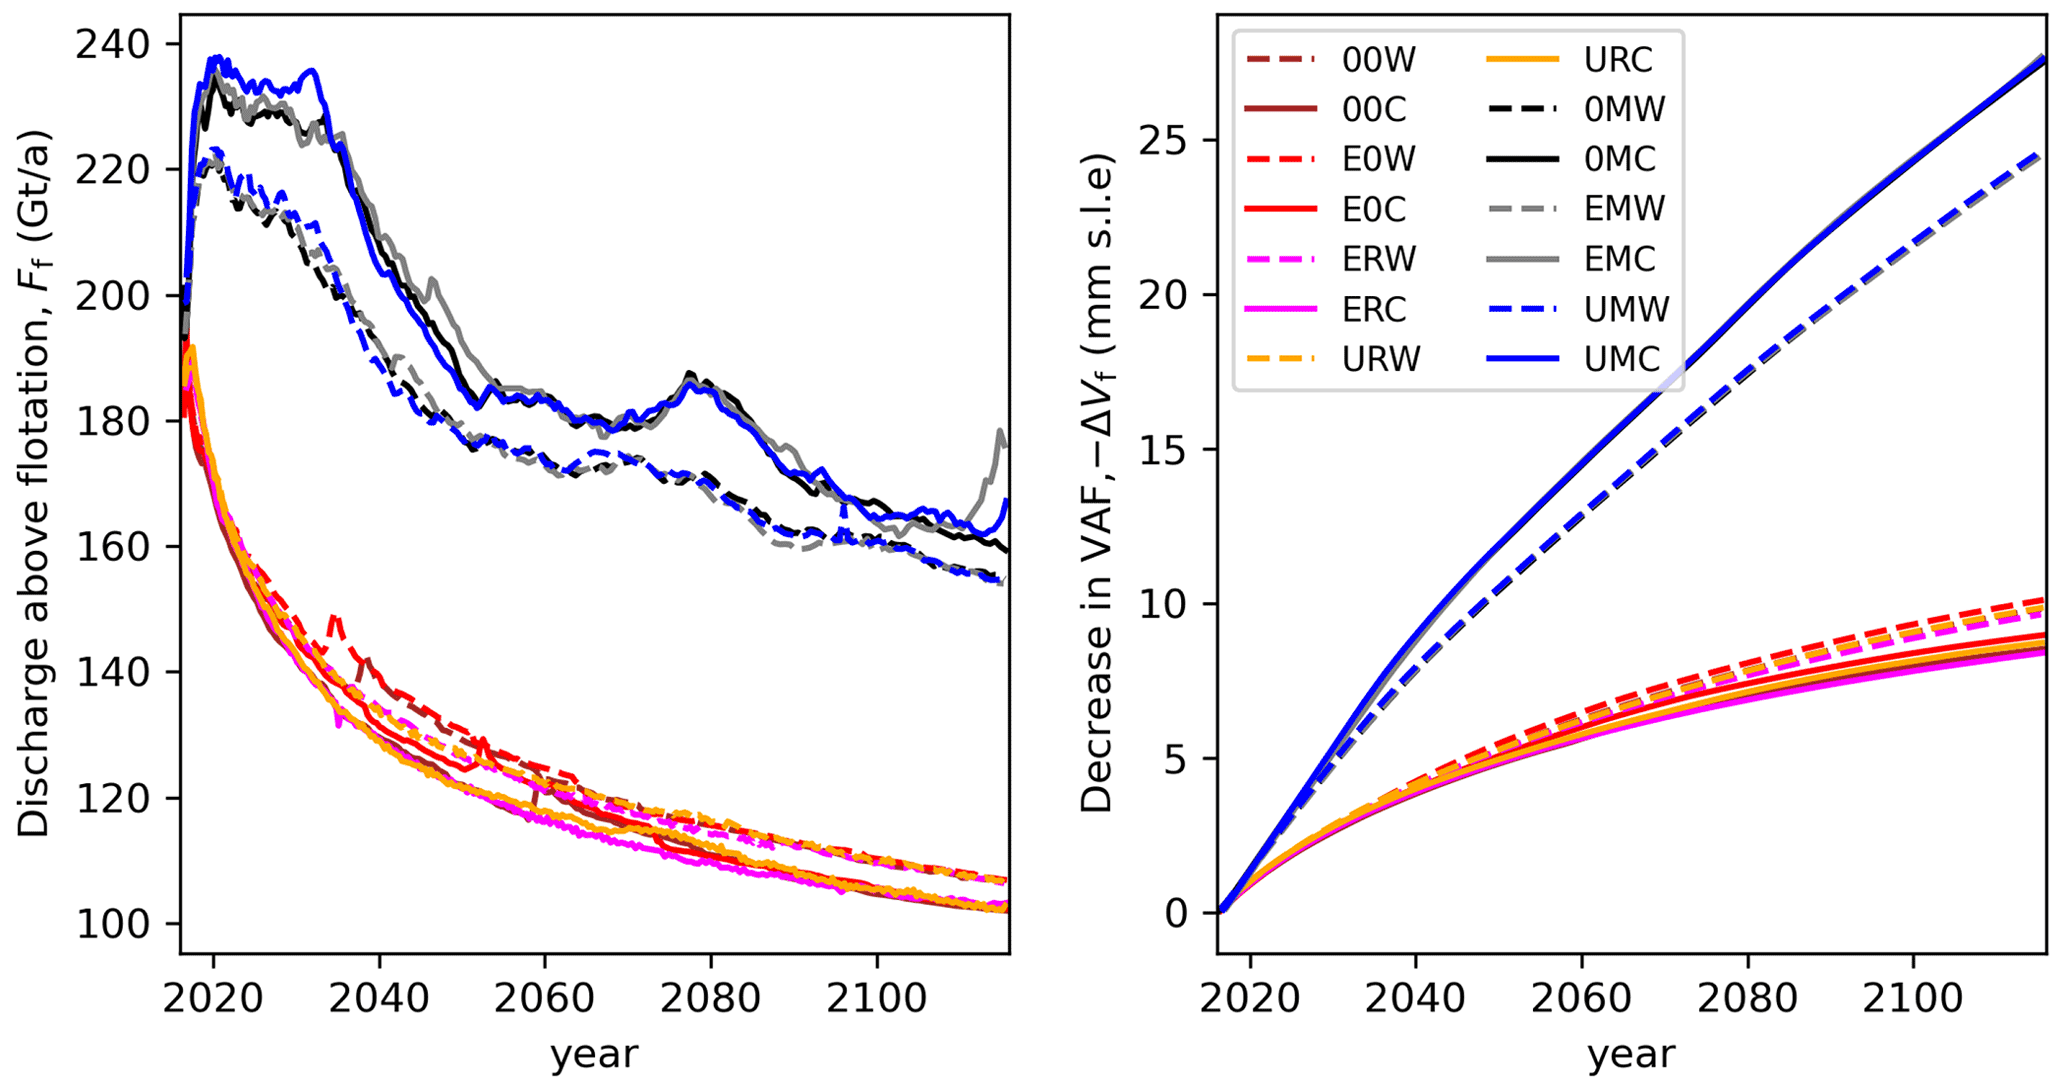
Figure 12Discharge of ice above flotation Ff and change in volume above flotation (VAF), ΔVf associated with modelled changes to TEIS. Colours and line styles are grouped according to melt forcing and friction parameterisation. Dark (blue/grey/black) lines show the results of simulations with sustained future melting, bright lines (red, orange, purple) show the results of simulations without sustained future melting. Solid lines represent simulations with Coulomb-like friction and dashed lines show Weertman-like friction.
We used the optimised basal traction and damage values as the starting point for forward model simulations (Figs. 11, 12, Appendix). In all cases, changes that are quite large occur in the velocity pattern on TEIS. The control experiments (00W, 00C) exhibit a reduction in speed of ∼200 m a−1 across both ice-shelf regions and immediately upstream by 2032, caused by thinning of the ice upstream and the resulting reduced gravitational driving stress. Damage extrapolation and unpinning experiments without sustained future melting (E0W, E0C, ERW, ERC, URW, URC) see an increase in speed on TEIS upstream from the pinning point, attributed to reduced ability of the shelf to support backstress. In contrast, ice around the grounding line of TWIT and the eastern grounding line of TEIS decreases in speed for similar reasons to that in the control experiments. Experiments ERW and ERC (extrapolated damage, dynamically evolving ice-shelf thickness) result in faster flow over most of TEIS than either E0W or E0C (extrapolated damage, constant ice-shelf thickness), with the ice-shelf acceleration leading to thinning and a further loss of buttressing. The greatest speed increase is seen in experiments URW and URC, because a new calving front is created; hence additional tensile stress is imposed on the now unconfined shelf. In all cases, there is at most a modest increase in the ice flux across the grounding line onto TEIS, even when large acceleration occurs on the shelf. On the other hand, experiments with sustained future melt forcing (0MW, 0MC, EMW, EMC, UMW, UMC) see ice flowing faster across the whole region, more so when the TEIS damage is greater (EMW, EMC, UMW, UMC). These experiments also see a grounding line retreat ∼1 km a−1 in both the TEIS and TWIT areas. The much greater retreat in these cases indicates a substantial loss of buttressing when the ice shelf thins close to the grounding line.
The future contribution of Thwaites Glacier to sea-level rise computed by the BISICLES model depends only weakly on changes around the TEIS pinning point. Figure 12 shows the discharge of ice above flotation, that is
and the change in volume above flotation (VAF),
where u is the horizontal ice velocity, h is ice thickness, hf is the flotation thickness, ∇H is the horizontal gradient operator, and ΩG is the grounded part of the Thwaites drainage basin. The most important cause of variation between simulations is the sustained melt rate. Simulations that apply the melt rate of Eq. (2) exhibit discharge of ice above flotation in excess of 180 Gt a−1 for the entire century-long simulations, resulting in around 25 mm eustatic sea-level rise by 2100, consistent with the comparable simulations of Yu et al. (2018). Simulations without sustained ice shelf melt show a long-term trend with discharge declining from 180 to 100 Gt a−1 and less than 10 mm eustatic sea-level rise. The second most important cause of variations is the choice of friction law. Coulomb-like (plastic) friction models produce more discharge than Weertman-like simulations given sustained melt rates, where the grounded ice is generally accelerating with less discharge otherwise. The effects of damage extrapolation and TEIS unpinning are visible as minor additional discharge early in each simulation, most prominently in the difference between experiments UMC and 0MC to 2040. TEIS unpinning and the consequent ice-shelf acceleration (experiments ERW, ERC, URW, URC) result in some additional grounding line retreat compared to the control experiments (00W, 00C) by the end of the 21st century (Figs. A1–A3).
5.1 Observed and modelled fracturing
Sentinel-1 data, available since 2014, show that TEIS has transitioned from a largely intact ice shelf into an extensively fractured state, with full-depth fracturing along the TEIS shear zone, rifting and tabular calving along both the eastern and western flanks, tensile fracturing in the central part of the shelf, and acceleration of ice flow. Concurrently, ice has been progressively decoupling from the submarine pinning point at its distal end.
The HiDEM modelling highlights the key role of backstress from the pinning point in this pattern of fracturing. The TEIS shear zone does not develop in runs where friction over the pinning point has the baseline values derived by rescaling output from the Elmer/Ice inversion. In contrast, a shear zone and other features similar to the observed fracture pattern are seen to develop in runs where a no-slip boundary condition is imposed over the pinning point. It may appear paradoxical that the shear zone fails to develop under model boundary conditions derived from observed ice geometry and dynamics. Two reasons may be suggested for this.
First, the inversion-derived friction coefficients over the pinning point may be unrepresentative because of uncertainties associated with the seafloor topography, the inversion process in Elmer/Ice, and the subsequent rescaling for HiDEM. Radar data show that the bedrock topography is up to 200 m shallower than indicated by the gravity inversion used as the basis for the model bed (Wild et al., 2021). Therefore, some small local differences between our bed and the seafloor topography shown by Wild et al. (2021) may exist. However, the height above flotation is reasonable when considering the full pinning point region in our HiDEM domain. In the Elmer/Ice inversion, the relatively small area of the pinning point may mean that the inverted basal resistance is too low as a result of spatial smoothing in the regularisation process. Rescaling of friction to account for the different functional timescales of HiDEM and Elmer/Ice introduces further uncertainties, particularly because HiDEM does not incorporate viscous processes. Taken together, these factors could mean that the bed is “too slippy” over the pinning point in the HiDEM simulations using the baseline friction values.
Second, the necessity for high pinning point friction to create a shear zone in HiDEM may mean that the observed TEIS shear zone was initiated at a time when pinning point friction was greater than it was when the model input data were acquired (2007 and 2009 for MEaSUREs and 2013–2014 for REMA). It is therefore possible that the TEIS shear zone developed when the pinning point provided greater backstress, and that progressive weakening through shear localisation and damage evolution has allowed the shear zone to persist even though pinning point friction was diminishing. Whatever the case, the HiDEM results are unequivocal: the observed fracture pattern requires sufficient backstress from the pinning point to initiate and sustain shear failure in the shelf. That is, backstress must consistently exceed the evolving effective strength of TEIS.
In the HiDEM runs, a high initial damage density (d=0.6) is required to produce a shear zone. This does not imply that a similar degree of pervasive damage was required to initiate the TEIS shear zone. As noted above, the properties of ice in HiDEM reflect a range of parameters and we chose damage density as a transparent and easily tunable control of ice strength. It must also be emphasised that the version of HiDEM used here is purely brittle–elastic, and does not incorporate viscous deformation. This means that the model cannot include processes likely to have been important on TEIS, particularly viscous shear localisation in the early development of the shear zone. In addition, evolution of TEIS likely involved a number of factors not included in the simulations, such as basal roughness elements, including advected crevasses and basal channels.
5.2 Causes of fragmentation of TEIS
The transformation of TEIS from a largely intact ice shelf into its current fragmented state suggests the pinning point has shifted from being a stabilising to a destabilising influence. Formerly, backstress from the pinning point was sufficient to constrain ice flow, but insufficient to initiate fracturing. At some point the balance shifted, such that backstress from the pinning point exceeded the effective strength of the ice, and damage was able to accumulate. This shift may have occurred for three fundamental reasons:
-
changes in resistive stresses at the grounded margins of the shelf
-
changes in stress patterns due to interactions between TEIS and TWIT
-
changes to the effective strength of the shelf.
The grounded margins of TEIS have undergone overall retreat in recent decades. The area of ice-bed contact at the TEIS pinning point has been reduced (Wild et al., 2021; Fig. 2), and the grounding line at the upstream boundary of TEIS has retreated (e.g. Rignot et al., 2014; Milillo et al., 2019). In addition, interferograms of TEIS for the 1990s indicate the presence of a possible additional pinning point in the middle of TEIS (Rignot, 2001), which is not evident in more recent times. While reduction in the area of the TEIS pinning point may be expected to have reduced backstress on the shelf, the other changes may have increased longitudinal compressive stresses on the floating ice.
Concomitant with the changes to grounded margins, there have been large changes in the relationship between TEIS and TWIT. First, acceleration of TWIT after 2002 (itself likely a response to weakening of a sub-shelf pinning point) was transmitted across shear margin to TEIS, causing the observed speed-up between 2002 and 2006 (Fig. 6). This speed-up was associated with increased longitudinal and shear strain on TEIS, indicating increased loading on the shelf. Subsequently, fragmentation and opening of the shear margin exposed the western flank of TEIS, reducing lateral confining stress on that side.
Several factors may have contributed to the weakening TEIS in recent decades. Basal melting in response to incursions of warm, deep water has reduced ice-shelf thickness, with basal melt rates typically on the order of 5 m yr−1 (Seroussi et al., 2017; Wåhlin et al., 2021; Alley et al., 2021). Focused basal melting in sub-shelf channels can increase basal roughness, create local stress concentrations and interact with fracture processes. Weakening may also occur through the advection of damage from upstream, and basal crevasses or other fractures could seed additional damage when they reach different stress regimes. Finally, damage can accumulate over time via positive feedback between damage and strain (Åström and Benn, 2019; Lhermitte et al., 2020).
The recent evolution of TEIS may have involved a combination of all the above factors. On the balance of available evidence, we propose the following sequence of events as the most likely cause of the recent fragmentation. The TEIS shear zone was initiated, or was significantly modified, in the mid-2000s, when TEIS accelerated in response to stresses transferred across the shear margin with TWIT which was strong at that time (Alley et al., 2021). During the acceleration event, high longitudinal and shear strain rates developed upstream on TEIS in response to elevated, longitudinal compression supported by backstress from the pinning point. Large fractures within the TEIS shear zone first appeared in satellite imagery after the acceleration event, suggesting that damage was initiated or increased in response to elevated stresses (Fig. 7). Fragmentation, opening and significant weakening of the shear margin between TEIS and TWIT removed confining pressure from the western flank of TEIS, encouraging transverse extension in response to ongoing longitudinal compression. Concurrently, damage on the shelf continued to accumulate due to positive feedback between damage and strain. Sentinel-1 data show increasing development of tensile fractures since 2017 in response to transverse extension (Fig. 3), and increasing concentration of strain and extensive rifting within the TEIS shear zone since 2020 (Fig. 5). Thus, although backstress from the pinning point has likely diminished over time (Wild et al., 2021), accumulation of damage on TEIS has ensured that the ice in the shear zone remained the weakest link in the system. Fragmentation of TEIS was not a consequence of unpinning; on the contrary, fragmentation reflects stresses originating at the pinning point acting on progressively weakening ice.
5.3 Future implications of TEIS loss
Results of the BISICLES model indicate that loss of strength in the shear zone or unpinning of TEIS will likely have little impact on basin-wide discharge from Thwaites Glacier. There is currently no evidence that the imminent loss of TEIS will hasten marine ice sheet instability or the demise of Thwaites Glacier. However, future evolution of Thwaites may be significantly influenced by calving processes along unbuttressed grounding lines, and it is possible that calving and iceberg overturn may increase, perhaps substantially, if the ice shelves are lost.
Water depths along the grounding line of TEIS are currently in the range of 400–700 m, which is below the likely threshold for ice-cliff instability (cf. Bassis and Walker, 2012; Crawford et al., 2021). The glacier bed deepens substantially 40 km upstream of the current grounding line, but ice retreat to that point will involve calving by processes such as melt undercutting, longitudinal extension and buoyant calving (e.g. Benn et al., 2007; Benn and Åström, 2018). Detailed observations and process modelling will be required to understand how ice-shelf removal will affect calving processes and ice-retreat rates in this region (e.g. Winberry et al., 2020; Crawford et al., 2021).
Backstress from the pinning point, once a crucial source of support for TEIS, is now hastening its destruction. Complete fragmentation of TEIS appears to be imminent and disintegration could occur sooner than the ∼10-year timescale implied by rates of thinning and unpinning (cf. Wild et al., 2021). Complete loss of the shelf may follow, although the former pinning point and fast ice may retard the evacuation of icebergs in much the same way as currently observed on TWIT.
The main implications of this work extend farther than the immediate future of Thwaites Glacier. Past observations of Antarctic ice-shelf disintegration implicate two main mechanisms for ice shelf collapse: hydrofracture and unpinning. It is already clear that surface melting is neither a necessary nor sufficient condition for ice-shelf disintegration, and our modelling results show that unpinning does not produce the observed fracture patterns on TEIS.
Our remote-sensing observations and modelling results suggest that a third mechanism, the concentration of backstress in damaged ice upstream of a pinning point, will ultimately be responsible for the destruction of TEIS, and may operate on other Antarctic ice shelves in contact with pinning points. The mechanism for damage and development of the shear zone on the TEIS was a dynamic interaction with the neighbouring TWIT. The TWIT, which accelerated and disintegrated in response to unpinning, caused TEIS to accelerate and develop the prominent shear zone where strain is continuing to concentrate. This shear zone may have been further weakened by direct basal melt (Wåhlin et al., 2021), but the continued strain concentration and rift formation implicate dynamics as the ultimate destabilising mechanism.
For ice shelves in steady state, pinning points play a crucial role in their stability and in buttressing the upstream flow of ice off the Antarctic continent. If basal melt and/or dynamic interactions upset this balance, stresses are likely to concentrate upstream of pinning points, causing irreversible damage. In most circumstances, pinning points are essential for ice-shelf stability, but as ice shelves thin and weaken, pinning points can provide the seeds of their demise.
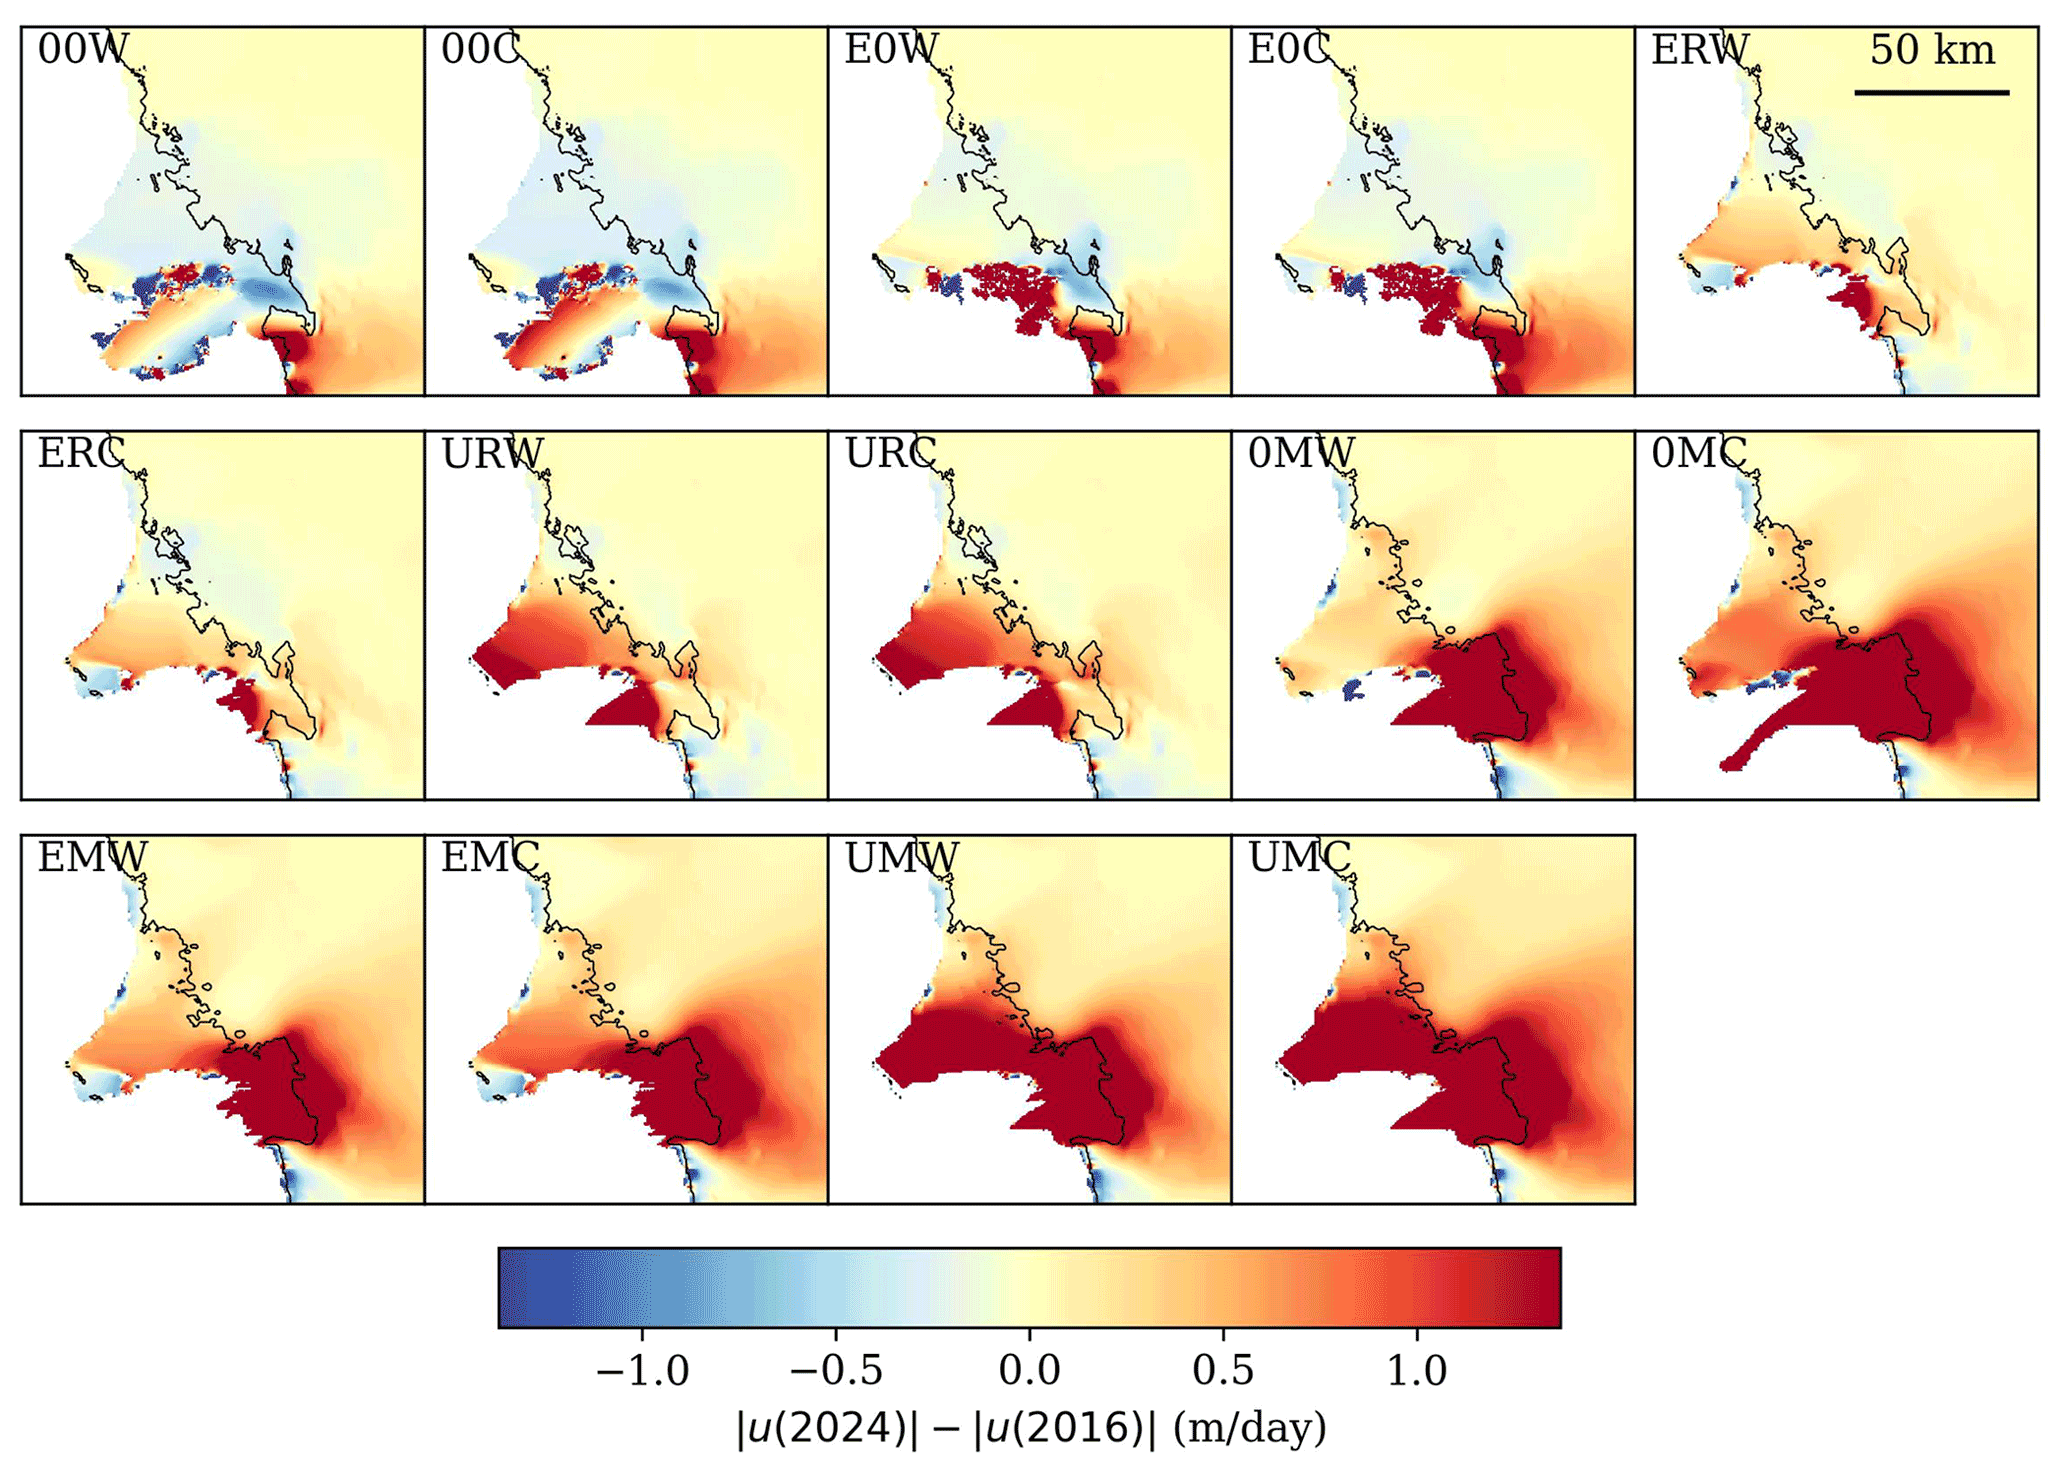
Figure A1As Fig. 11, except showing differences in velocity between 2016 and 2024.
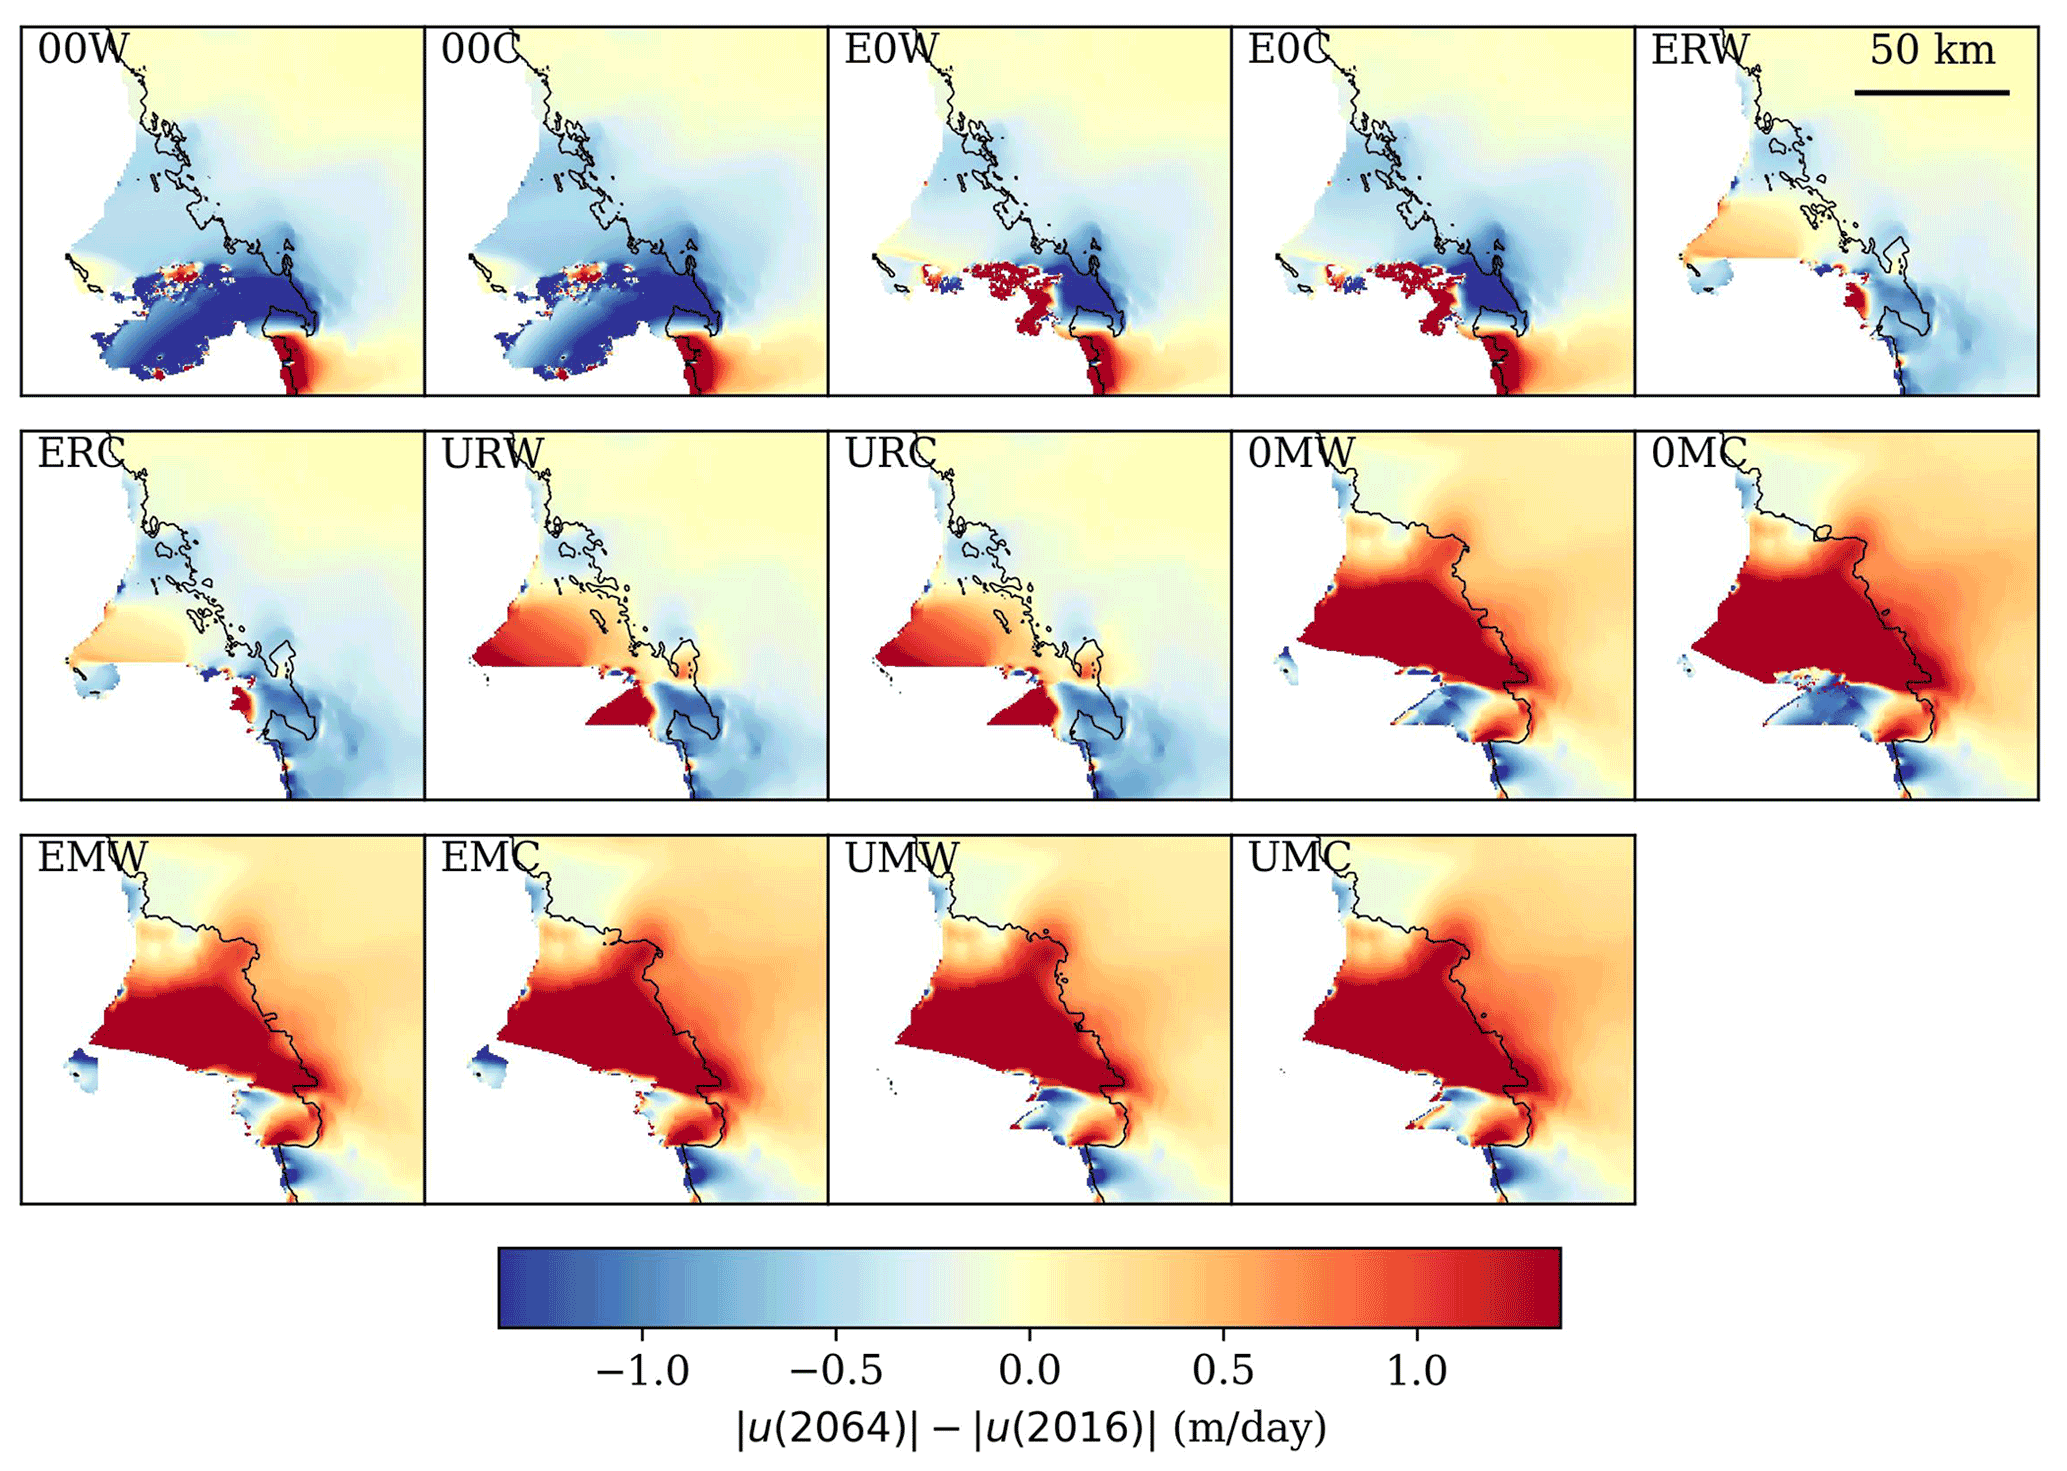
Figure A2As Fig. 11, except showing differences in velocity between 2016 and 2064.
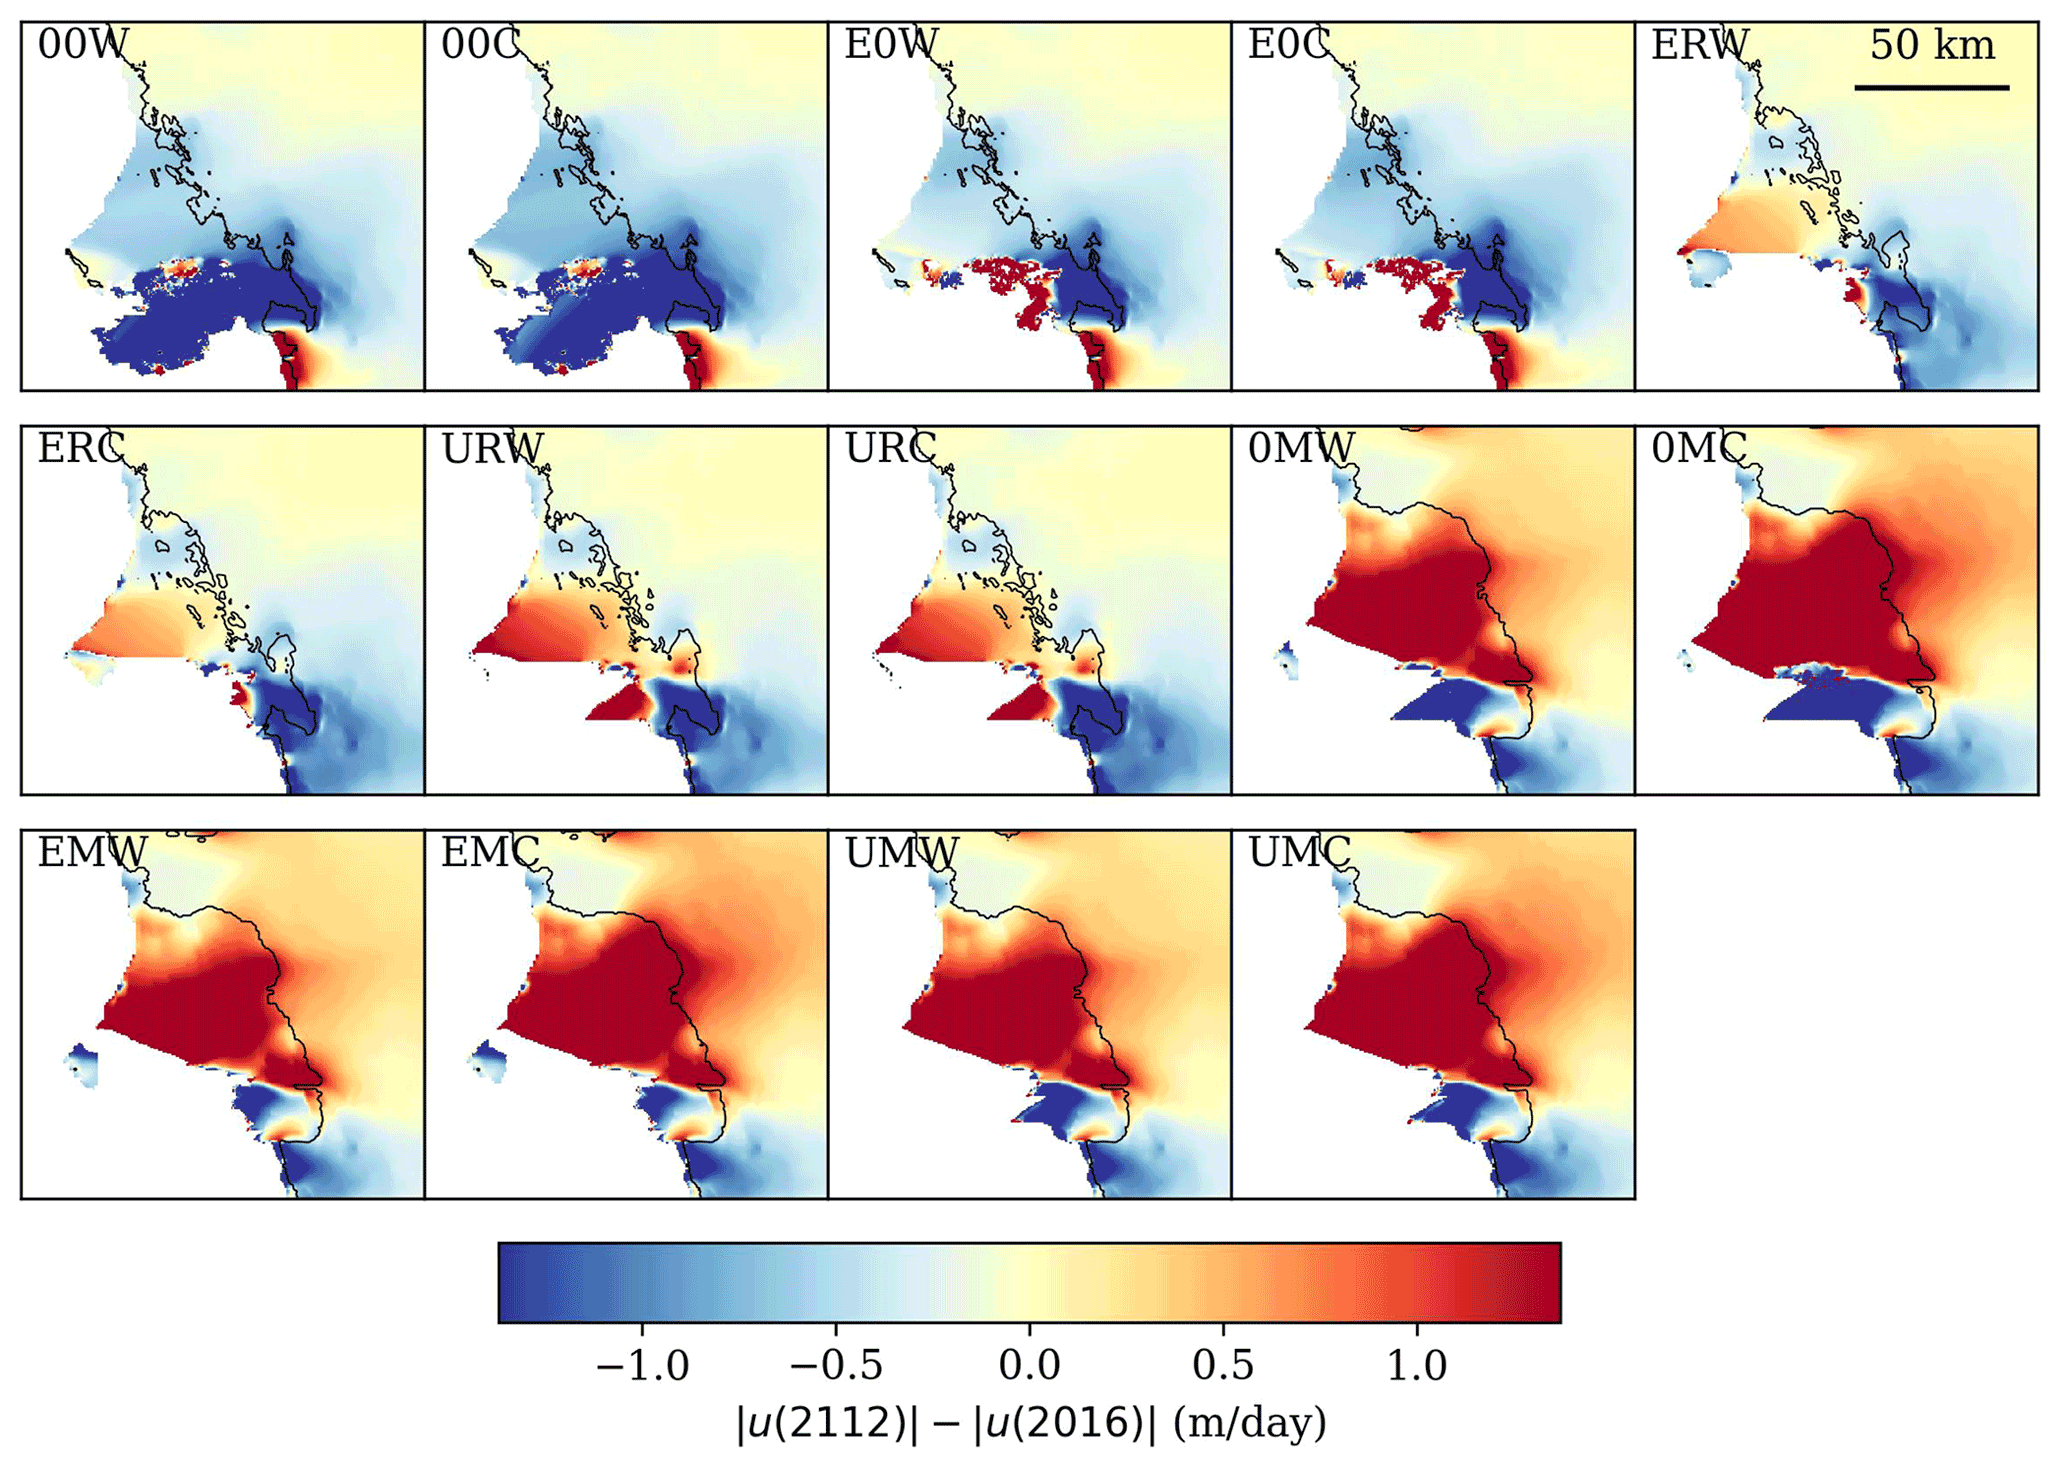
Figure A3As Fig. 11, except showing differences in velocity between 2016 and 2112.
BISICLES is an open-source model available at: https://commons.lbl.gov/display/bisicles/BISICLES (last access: 28 February 2022; Cornford et al., 2013, 2020). HiDEM is an open-source model available at: https://github.com/joeatodd/HiDEM (last access: 25 February 2022).
Sentinel-1 data are freely available via the Copernicus Open Data Hubs (https://scihub.copernicus.eu/, last access: 10 December 2021). MODIS data are freely available from NASA (http://nsidc.org/daac/modis/index.html, last access: 22 August 2021).
Video animation of Sentinel-1 imagery is available via the TIB AV-Portal (https://doi.org/10.5446/57379; Luckman, 2022).
DIB and AL designed and oversaw the study in discussion with JB and EP; remote sensing analyses were conducted by AL (Sentinel-1), SB (DEMs) and KA (MODIS); computer modelling was done by JAÅ and AJC (HiDEM), RG, AJC and TZ (Elmer/Ice), and SLC (BISICLES). DIB wrote the manuscript with input from all authors. Post-review manuscript amendments were handled by AJC and AL.
The contact author has declared that neither they nor their co-authors have any competing interests.
Publisher's note: Copernicus Publications remains neutral with regard to jurisdictional claims in published maps and institutional affiliations.
This work is from the DOMINOS and TARSAN projects, components of the International Thwaites Glacier Collaboration (ITGC). Logistics provided by NSF-U.S. Antarctic Program and NERC-British Antarctic Survey. Sentinel-1 data were provided by the Copernicus Program of the European Commission. The ITGC contribution number is ITGC-055.
Funding was provided by the National Science Foundation (NSF: grant nos. 1738896 and 1929991) and Natural Environment Research Council (NERC: grant no. NE/S006605/1). Rupert Gladstone is supported by Academy of Finland (grant no. 322430), Thomas Zwinger by grant no. 322978.
This paper was edited by Josefin Ahlkrona and reviewed by Stef Lhermitte and Holly Still.
Alley, K. E., Wild, C. T., Luckman, A., Scambos, T. A., Truffer, M., Pettit, E. C., Muto, A., Wallin, B., Klinger, M., Sutterley, T., Child, S. F., Hulen, C., Lenaerts, J. T. M., Maclennan, M., Keenan, E., and Dunmire, D.: Two decades of dynamic change and progressive destabilization on the Thwaites Eastern Ice Shelf, The Cryosphere, 15, 5187–5203, https://doi.org/10.5194/tc-15-5187-2021, 2021.
Arndt, J. E., Larter, R. D., Friedl, P., Gohl, K., Höppner, K., and the Science Team of Expedition PS104: Bathymetric controls on calving processes at Pine Island Glacier, The Cryosphere, 12, 2039–2050, https://doi.org/10.5194/tc-12-2039-2018, 2018.
Åström, J. A. and Benn, D. I.: Effective Rheology Across the Fragmentation Transition for Sea Ice and Ice Shelves, Geophys. Res. Lett., 46, 13099–13106, https://doi.org/10.1029/2019GL084896, 2019.
Åström, J. A., Riikilä, T. I., Tallinen, T., Zwinger, T., Benn, D., Moore, J. C., and Timonen, J.: A particle based simulation model for glacier dynamics, The Cryosphere, 7, 1591–1602, https://doi.org/10.5194/tc-7-1591-2013, 2013.
Åström, J., Cook, S., Enderlin, E. M., Sutherland, D. A., Mazur, A., and Glasser, N.: Fragmentation theory reveals processes controlling iceberg size distributions, J. Glaciol., 67, 603–612, https://doi.org/10.1017/jog.2021.14, 2021.
Bassis, J. N. and Walker, C. C.: Upper and lower limits on the stability of calving glaciers from the yield strength envelope of ice. Proceedings of the Royal Society A: Mathematical, Phys. Eng. Sci., 468, 913–931, 2012.
Bassis, J. N., Berg, B., Crawford, A. J., and Benn, D. I.: Transition to marine ice cliff instability controlled by ice thickness gradients and velocity, Science, 372, 1342–1344, 2021.
Benn, D. I. and Åström, J. A.: Calving glaciers and ice shelves, Adv. Phys. X, 3, 1513819, https://doi.org/10.1080/23746149.2018.1513819, 2018.
Benn, D. I., Warren, C. R., and Mottram, R. H.: Calving processes and the dynamics of calving glaciers, Earth-Sci. Rev., 82, 143–179, 2007.
Borstad, C. P., Khazendar, A., Larour, E., Morlighem, M., Rignot, E., Schodlok, M. P., and Seroussi, H.: A damage mechanics assessment of the Larsen B ice shelf prior to collapse: Toward a physically-based calving law, Geophys. Res. Lett., 39, L18502, https://doi.org/10.1029/2012gl053317, 2012.
Cook, A. J. and Vaughan, D. G.: Overview of areal changes of the ice shelves on the Antarctic Peninsula over the past 50 years, The Cryosphere, 4, 77–98, https://doi.org/10.5194/tc-4-77-2010, 2010.
Cornford, S. L., Martin, D. F., Graves, D. T., Ranken, D. F., Le Brocq, A. M., Gladstone, R. M., Payne, A. J., Ng, E. G., and Lipscomb, W. H.: Adaptive mesh, finite volume modeling of marine ice sheets, J. Computat. Phys., 232, 529–549, https://doi.org/10.1016/j.jcp.2012.08.037, 2013.
Cornford, S. L., Seroussi, H., Asay-Davis, X. S., Gudmundsson, G. H., Arthern, R., Borstad, C., Christmann, J., Dias dos Santos, T., Feldmann, J., Goldberg, D., Hoffman, M. J., Humbert, A., Kleiner, T., Leguy, G., Lipscomb, W. H., Merino, N., Durand, G., Morlighem, M., Pollard, D., Rückamp, M., Williams, C. R., and Yu, H.: Results of the third Marine Ice Sheet Model Intercomparison Project (MISMIP+), The Cryosphere, 14, 2283–2301, https://doi.org/10.5194/tc-14-2283-2020, 2020.
Crawford, A. J., Benn, D. I., Todd, J., Åström, J. A., Bassis, J. N., and Zwinger, T.: Marine ice-cliff instability modeling shows mixed-mode ice-cliff failure and yields calving rate parameterization, Nat. Commun., 12, 2701, https://doi.org/10.1038/s41467-021-23070-7, 2021.
DeConto, R. M., Pollard, D., Alley, R. B., Velicogna, I., Gasson, E., Gomez, N., Sadai, S., Condron, A., Gilford, D. M., Ashe, E. L., Kopp, R. E., Li, D., and Dutton, A.: The Paris Climate Agreement and future sea-level rise from Antarctica, Nature, 593, 83–89, https://doi.org/10.1038/s41586-021-03427-0, 2021.
Doake, C. S. M., Corr, H. F. J., Rott, H., Skvarca, P., and Young, N. W.: Breakup and conditions for stability of the northern Larsen Ice Shelf, Antarctica, Nature, 391, 778–780, https://doi.org/10.1038/35832, 1998.
Dupont, T. K. and Alley, R. B.: Assessment of the importance of ice-shelf buttressing to ice-sheet flow, Geophys. Res. Lett., 32, L04503, https://doi.org/10.1029/2004gl022024, 2005.
Fox-Kemper, B., Hewitt, H. T., Xiao, C., Aðalgeirsdóttir, G., Drijfhout, S. S., Edwards, T. L., Golledge, N. R., Hemer, M., Kopp, R. E., Krinner, G., Mix, A., Notz, D., Nowicki, S., Nurhati, I. S., Ruiz, L., Sallée, J.-B., Slangen, A. B. A., Yu, Y.: Ocean, Cryosphere and Sea Level Change, in: Climate Change 2021: The Physical Science Basis. Contribution of Working Group I to the Sixth Assessment Report of the Intergovernmental Panel on Climate Change, edited by: Masson-Delmotte, V., Zhai, P., Pirani, A., Connors, S. L., Péan, C., Berger, S., Caud, N., Chen, Y., Goldfarb, L., Gomis, M. I., Huang, M., Leitzell, K., Lonnoy, E., Matthews, J. B. R., Maycock, T. K., Waterfield, T., Yelekci̧, O., Yu, R., and Zhou, B., Cambridge University Press, https://doi.org/10.1017/9781009157896.011, 2021.
Fretwell, P., Pritchard, H. D., Vaughan, D. G., Bamber, J. L., Barrand, N. E., Bell, R., Bianchi, C., Bingham, R. G., Blankenship, D. D., Casassa, G., Catania, G., Callens, D., Conway, H., Cook, A. J., Corr, H. F. J., Damaske, D., Damm, V., Ferraccioli, F., Forsberg, R., Fujita, S., Gim, Y., Gogineni, P., Griggs, J. A., Hindmarsh, R. C. A., Holmlund, P., Holt, J. W., Jacobel, R. W., Jenkins, A., Jokat, W., Jordan, T., King, E. C., Kohler, J., Krabill, W., Riger-Kusk, M., Langley, K. A., Leitchenkov, G., Leuschen, C., Luyendyk, B. P., Matsuoka, K., Mouginot, J., Nitsche, F. O., Nogi, Y., Nost, O. A., Popov, S. V., Rignot, E., Rippin, D. M., Rivera, A., Roberts, J., Ross, N., Siegert, M. J., Smith, A. M., Steinhage, D., Studinger, M., Sun, B., Tinto, B. K., Welch, B. C., Wilson, D., Young, D. A., Xiangbin, C., and Zirizzotti, A.: Bedmap2: improved ice bed, surface and thickness datasets for Antarctica, The Cryosphere, 7, 375–393, https://doi.org/10.5194/tc-7-375-2013, 2013.
Gardner, A. S., Fahnestock, M. A., and Scambos, T. A.: ITS_LIVE Regional Glacier and Ice Sheet Surface Velocities, National Snow and Ice Data Center [data set], https://doi.org/10.5067/6II6VW8LLWJ7, 2019.
Howat, I. M., Porter, C., Smith, B. E., Noh, M.-J., and Morin, P.: The Reference Elevation Model of Antarctica, The Cryosphere, 13, 665–674, https://doi.org/10.5194/tc-13-665-2019, 2019.
Jordan, T. A., Porter, D., Tinto, K., Millan, R., Muto, A., Hogan, K., Larter, R. D., Graham, A. G. C., and Paden, J. D.: New gravity-derived bathymetry for the Thwaites, Crosson, and Dotson ice shelves revealing two ice shelf populations, The Cryosphere, 14, 2869–2882, https://doi.org/10.5194/tc-14-2869-2020, 2020.
Joughin, I., Smith, B. E., and Schoof, C. G.: Regularized Coulomb friction laws for ice sheet sliding: Application to Pine Island Glacier, Antarctica, Geophys. Res. Lett., 46, 4764–4771, 2019.
Lemaitre, J.: A Course on Damage Mechanics, 2nd edn., 228 pp., Springer Berlin, Heidelberg, https://doi.org/10.1007/978-3-642-18255-6, 2012.
Lhermitte, S., Sun, S., Shuman, C., Wouters, B., Pattyn, F., Wuite, J., Berthier, E., and Nagler, T.: Damage accelerates ice shelf instability and mass loss in Amundsen Sea Embayment, P. Natl. Acad. Sci. USA, 117, 24735–24741, https://doi.org/10.1073/pnas.1912890117, 2020.
Liu, Y., Moore, J. C., Cheng, X., Gladstone, R. M., Bassis, J. N., Liu, H., Wen, J., and Hui, F.: Ocean-driven thinning enhances iceberg calving and retreat of Antarctic ice shelves, P. Natl. Acad. Sci. USA, 112, 3263–3268, https://doi.org/10.1073/pnas.1415137112, 2015.
Luckman, A.: Thwaites Eastern Ice Shelf Sentinel-1, TIB AV-Portal [video], https://doi.org/10.5446/57379, 2022.
Luckman, A., Jansen, D., Kulessa, B., King, E. C., Sammonds, P., and Benn, D. I.: Basal crevasses in Larsen C Ice Shelf and implications for their global abundance, The Cryosphere, 6, 113–123, https://doi.org/10.5194/tc-6-113-2012, 2012.
Luckman, A., Benn, D. I., Cottier, F., Bevan, S., Nilsen, F., and Inall, M.: Calving rates at tidewater glaciers vary strongly with ocean temperature, Nat. Commun., 6, 8566, https://doi.org/10.1038/ncomms9566, 2015.
Miles, B. W. J., Stokes, C. R., Jenkins, A., Jordan, J. R., Jamieson, S. S. R., and Gudmundsson, G. H.: Intermittent structural weakening and acceleration of the Thwaites Glacier Tongue between 2000 and 2018, J. Glaciol., 66, 485–495, https://doi.org/10.1017/jog.2020.20, 2020.
Milillo, P., Rignot, E., Rizzoli, P., Scheuchl, B., Mouginot, J., Bueso-Bello, J., and Prats-Iraola, P.: Heterogeneous retreat and ice melt of Thwaites Glacier, West Antarctica, Sci. Adv., 5, eaau3433, https://doi.org/10.1126/sciadv.aau3433, 2019.
Morlighem, M., Rignot, E., Binder, T., Blankenship, D., Drews, R., Eagles, G., Eisen, O., Ferraccioli, F., Forsberg, R., Fretwell, P., Goel, V., Greenbaum, J. S., Gudmundsson, H., Guo, J., Helm, V., Hofstede, C., Howat, I., Humbert, A., Jokat, W., Karlsson, N. B., Lee, W. S., Matsuoka, K., Millan, R., Mouginot, J., Paden, J., Pattyn, F., Roberts, J., Rosier, S., Ruppel, A., Seroussi, H., Smith, E. C., Steinhage, D., Sun, B., Broeke, M. R. V. D., Ommen, T. D. V., Wessem, M. V., and Young, D. A.: Deep glacial troughs and stabilizing ridges unveiled beneath the margins of the Antarctic ice sheet, Nat. Geosci., 13, 132–137, https://doi.org/10.1038/s41561-019-0510-8, 2020.
Mouginot, J., Scheuchl, B., and Rignot, E.: Mapping of Ice Motion in Antarctica Using Synthetic-Aperture Radar Data, Remote Sensing, 4, 2753–2767, https://doi.org/10.3390/rs4092753, 2012.
Mouginot, J., Scheuchl, B., and Rignot, E.: MEaSUREs Annual Antarctic Ice Velocity Maps 2005–2017, Version 1, Boulder, Colorado USA, NASA National Snow and Ice Data Center Distributed Active Archive Center, https://doi.org/10.5067/9T4EPQXTJYW9, 2017.
Nick, F. M., van der Veen, C. J., Vieli, A., and Benn, D. I.: A physically based calving model applied to marine outlet glaciers and implications for the glacier dynamics, J. Glaciol., 56, 781–794, https://doi.org/10.3189/002214310794457344, 2010.
Rignot, E.: Evidence for rapid retreat and mass loss of Thwaites Glacier, West Antarctica, J. Glaciol., 47, 213–222, 2001.
Rignot, E., Mouginot, J., and Scheuchl, B.: MEaSUREs InSAR-Based Antarctica Ice Velocity Map, Boulder, Colorado, USA: NASA DAAC at the National Snow and Ice Data Center, https://doi.org/10.5067/MEASURES/CRYOSPHERE/nsidc-0484.001, 2011a.
Rignot, E., Mouginot, J., and Scheuchl, B.: Ice Flow of the Antarctic Ice Sheet, Science, 333, 1427–1430, https://doi.org/10.1126/science.1208336, 2011b.
Rignot, E., Mouginot, J., Morlighem, M., Seroussi, H., and Scheuchl, B.: Widespread, rapid grounding line retreat of Pine Island, Thwaites, Smith, and Kohler glaciers, West Antarctica, from 1992 to 2011, Geophys. Res. Lett., 41, 3502–3509, https://doi.org/10.1002/2014GL060140, 2014.
Rignot, E., Mouginot, J., and Scheuchl, B.: MEaSUREs Antarctic Grounding Line from Differential Satellite Radar Interferometry, Version 2, Boulder, Colorado, USA: NASA DAAC at the National Snow and Ice Data Center Distributed Active Archive Center, https://doi.org/10.5067/IKBWW4RYHF1Q, 2016.
Robel, A. A. and Banwell, A. F.: A Speed Limit on Ice Shelf Collapse Through Hydrofracture, Geophys. Res. Lett., 46, 12092–12100, https://doi.org/10.1029/2019GL084397, 2019.
Scambos, T., Hulbe, C., and Fahnestock, M.: Climate-Induced Ice Shelf Disintegration in the Antarctic Peninsula, Antarctic Peninsula Climate Variability: Historical and Paleoenvironmental Perspectives, 79, 79–92, https://doi.org/10.1029/ar079p0079, 2003.
Scambos, T. A.: Glacier acceleration and thinning after ice shelf collapse in the Larsen B embayment, Antarctica, Geophys. Res. Lett., 31, L1840, https://doi.org/10.1029/2004gl020670, 2004.
Scambos, T. A., Bell, R. E., Alley, R. B., Anandakrishnan, S., Bromwich, D. H., Brunt, K., Christianson, K., Creyts, T., Das, S. B., DeConto, R., Dutrieux, P., Fricker, H. A., Holland, D., MacGregor, J., Medley, B., Nicolas, J. P., Pollard, D., Siegfried, M. R., Smith, A. M., Steig, E. J., Trusel, L. D., Vaughan, D. G., and Yager, P. L.: How much, how fast?: A science review and outlook for research on the instability of Antarctica's Thwaites Glacier in the 21st century, Global Planet. Change, 153, 16–34, https://doi.org/10.1016/j.gloplacha.2017.04.008, 2017.
Schoof, C.: Marine ice sheet stability, J. Fluid Mech., 698, 62–72, https://doi.org/10.1017/jfm.2012.43, 2012.
Seroussi, H., Nakayama, Y., Larour, E., Menemenlis, D., Morlighem, M., Rignot, E., and Khazendar, A.: Continued retreat of Thwaites Glacier, West Antarctica, controlled by bed topography and ocean circulation, Geophys. Res. Lett., 44, 6191–6199, https://doi.org/10.1002/2017GL072910, 2017.
Sun, S., Cornford, S. L., Moore, J. C., Gladstone, R., and Zhao, L.: Ice shelf fracture parameterization in an ice sheet model, The Cryosphere, 11, 2543–2554, https://doi.org/10.5194/tc-11-2543-2017, 2017.
Sun, S., Pattyn, F., Simon, E. G., Albrecht, T., Cornford, S., Calov, R., Dumas, C., Gillet-Chaulet, F., Goelzer, H., Golledge, N. R., Greve, R., Hoffman, M. J., Humbert, A., Kazmierczak, E., Kleiner, T., Leguy, G. R., Lipscomb, W. H., Martin, D., Morlighem, M., Nowicki, S., Pollard, D., Price, S., Quiquet, A., Seroussi, H., Schlemm, T., Sutter, J., Wal, R. S. W. V. D., Winkelmann, R., and Zhang, T.: Antarctic ice sheet response to sudden and sustained ice-shelf collapse (ABUMIP), J. Glaciol., 66, 891–904, https://doi.org/10.1017/jog.2020.67, 2020.
Tinto, K. J. and Bell, R. E.: Progressive unpinning of Thwaites Glacier from newly identified offshore ridge: Constraints from aerogravity, Geophys. Res. Lett., 38, L2050, https://doi.org/10.1029/2011GL049026, 2011.
van Dongen, E. C. H., Åström, J. A., Jouvet, G., Todd, J., Benn, D. I., and Funk, M.: Numerical Modeling Shows Increased Fracturing Due to Melt-Undercutting Prior to Major Calving at Bowdoin Glacier, Front. Earth Sci., 8, 253, https://doi.org/10.3389/feart.2020.00253, 2020.
Wåhlin, A. K., Graham, A. G. C., Hogan, K. A., Queste, B. Y., Boehme, L., Larter, R. D., Pettit, E. C., Wellner, J., and Heywood, K. J.: Pathways and modification of warm water flowing beneath Thwaites Ice Shelf, West Antarctica, Sci. Adv., 7, eabd7254, https://doi.org/10.1126/sciadv.abd7254, 2021.
Wang, Y., Zhao, C., Gladstone, R., Galton-Fenzi, B., and Warner, R.: Thermal structure of the Amery Ice Shelf from borehole observations and simulations, The Cryosphere, 16, 1221–1245, https://doi.org/10.5194/tc-16-1221-2022, 2022.
Wild, C. T., Alley, K. E., Muto, A., Truffer, M., Scambos, T. A., and Pettit, E. C.: Weakening of the pinning point buttressing Thwaites Glacier, West Antarctica, The Cryosphere, 16, 397–417, https://doi.org/10.5194/tc-16-397-2022, 2022.
Winberry, J. P., Huerta, A. D., Anandakrishnan, S., Aster, R. C., Nyblade, A. A., and Wiens, D. A.: Glacial earthquakes and precursory seismicity associated with Thwaites Glacier calving, Geophys. Res. Lett., 47, e2019GL086178, https://doi.org/10.1029/2019GL086178, 2020.
Yu, H., Rignot, E., Seroussi, H., and Morlighem, M.: Retreat of Thwaites Glacier, West Antarctica, over the next 100 years using various ice flow models, ice shelf melt scenarios and basal friction laws, The Cryosphere, 12, 3861–3876, https://doi.org/10.5194/tc-12-3861-2018, 2018.
Zoet, L. K. and Iverson, N. R.: A slip law for glaciers on deformable beds, Science, 368, 76–78, 2020.