the Creative Commons Attribution 4.0 License.
the Creative Commons Attribution 4.0 License.
 | 10 May 2021
The temperature change shortcut: effects of mid-experiment temperature changes on the deformation of polycrystalline ice
Adam Treverrow
Sheng Fan
Mark Peternell
Felicity McCormack
Jason Roberts
It is vital to understand the mechanical properties of flowing ice to model the dynamics of ice sheets and ice shelves and to predict their behaviour in the future. We can increase our understanding of ice physical properties by performing deformation experiments on ice in laboratories and examining its mechanical and microstructural responses. However, natural conditions in ice sheets and ice shelves extend to low temperatures ( ∘C), and high octahedral strains (> 0.08), and emulating these conditions in laboratory experiments can take an impractically long time. It is possible to accelerate an experiment by running it at a higher temperature in the early stages and then lowering the temperature to meet the target conditions once the tertiary creep stage is reached. This can reduce total experiment run-time by > 1000 h; however it is not known whether this could affect the final strain rate or microstructure of the ice and potentially introduce a bias into the data. We deformed polycrystalline ice samples in uniaxial compression at −2 ∘C before lowering the temperature to either −7 or −10 ∘C, and we compared the results to constant-temperature experiments. Tertiary strain rates adjusted to the change in temperature very quickly (within 3 % of the total experiment run-time), with no significant deviation from strain rates measured in constant-temperature experiments. In experiments with a smaller temperature step (−2 to −7 ∘C) there is no observable difference in the final microstructure between changing-temperature and constant-temperature experiments which could introduce a bias into experimental results. For experiments with a larger temperature step (−2 to −10 ∘C), there are quantifiable differences in the microstructure. These differences are related to different recrystallisation mechanisms active at −10 ∘C, which are not as active when the first stages of the experiment are performed at −2 ∘C. For studies in which the main aim is obtaining tertiary strain rate data, we propose that a mid-experiment temperature change is a viable method for reducing the time taken to run low-stress and low-temperature experiments in the laboratory.
- Article
(6690 KB) - Full-text XML
- BibTeX
- EndNote


1.1 Background
Ice is a mechanically anisotropic material, meaning that its mechanical properties change with direction. During deformation, it undergoes microstructural changes in response to changing stress and temperature conditions (here we define “microstructure” as the small-scale structure of the ice, including what is often referred to in materials science as “fabric” and “texture”). This microscale anisotropy leads to large-scale anisotropy of larger ice masses like ice shelves and streams and affects their response to external changes such as those related to climate change (Castelnau et al., 1998; Harland et al., 2013). This effect is dramatic; strain rates for anisotropic polycrystalline ice can be an order of magnitude higher than those for isotropic ice under the same conditions (Gao and Jacka, 1987; Treverrow et al., 2012). Measuring the mechanical and microstructural properties of deforming ice under different conditions is an important process, but it can take an unreasonable length of time (months to years).
Laboratory deformation experiments allow us to examine the behaviour of ice under specific stress and temperature conditions and so are an invaluable tool for understanding ice flow on a small scale. The temperature of ice during deformation can significantly affect both strain rate and microstructural characteristics such as crystallographic preferred orientation (CPO). Studying the mechanical and microstructural response of ice to stress under changing temperature conditions will allow us to examine how long the effects of previous temperature conditions persist as deformation proceeds and evaluate the effect this may have on experimental design.
1.2 Ice creep
From experiments on laboratory-made ice, we have a good understanding of how pure ice with an initially isotropic microstructure deforms (e.g. Kamb, 1972; Budd and Jacka, 1989; Montagnat et al., 2015; Peternell and Wilson, 2016; Vaughan, 2016). When a stress is applied to a mass of polycrystalline ice, it will deform viscously in response to that stress. This deformation, or “creep”, behaviour changes depending on temperature, strain rate, and total strain as the microstructure of the ice changes. As shown in Fig. 1, when a constant stress is applied to a piece of initially isotropic ice, it experiences three main stages of creep: a decelerating creep rate following the initial elastic deformation (primary creep), a period of constant minimum strain rate (secondary creep), and then an acceleration before a quasi-constant higher strain rate is reached (tertiary creep) (Budd and Jacka, 1989).
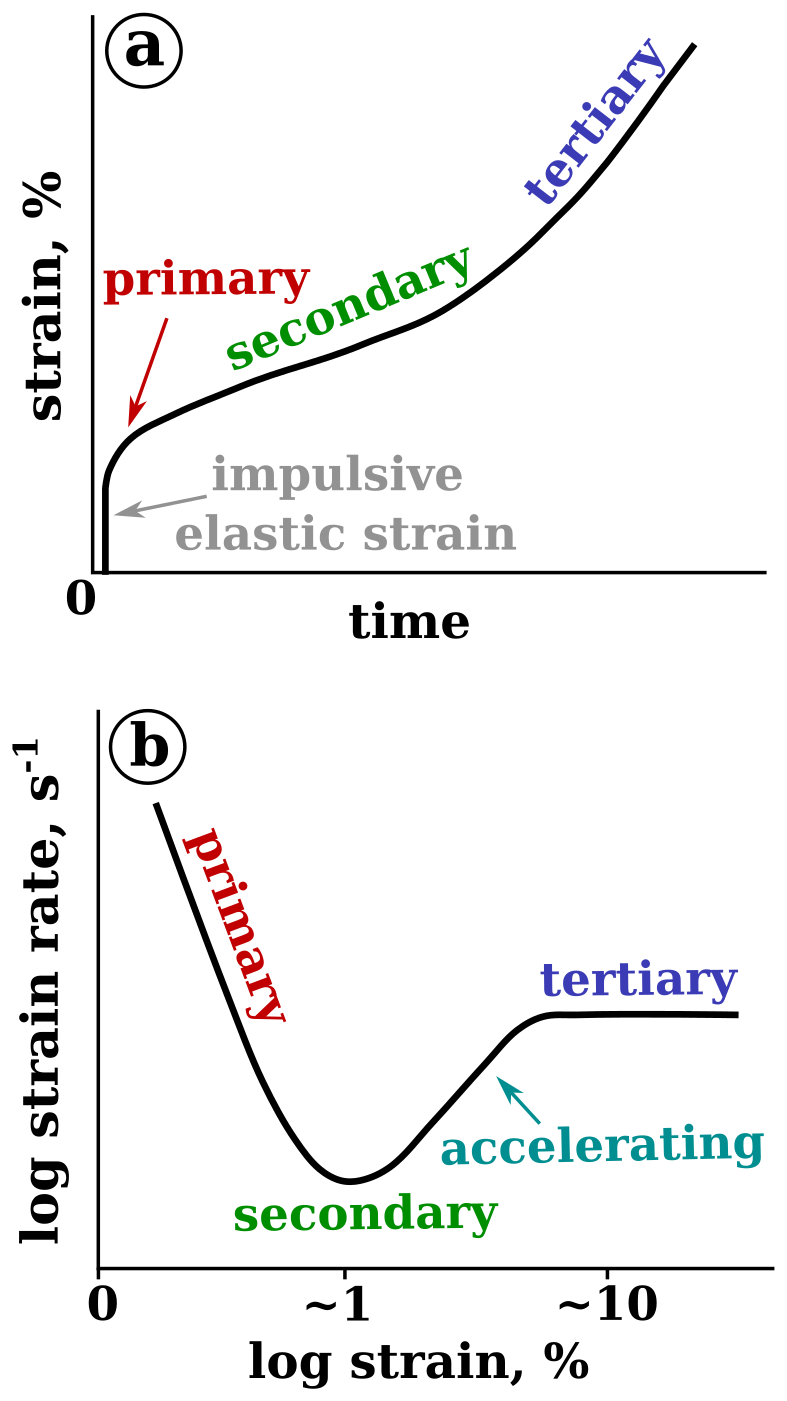
Figure 1Plots adapted from Budd and Jacka (1989) and Durham et al. (2010) showing the primary, secondary, and tertiary stages of creep with respect to (a) strain over time and (b) strain rate over strain in a constant-load experiment.
These stages of creep are associated with distinct stages of microstructural behaviour in the ice.
-
Primary creep. Strain rate decreases rapidly due to work hardening, as strain incompatibilities between grains and the load transfer from easy-glide to hard-glide systems result in heterogeneous internal stresses and the formation of dislocation tangles and subgrain boundaries (Faria et al., 2014). The decreasing rate of deformation is controlled by crystals which are unfavourably oriented for creep (Duval et al., 1983). The primary creep stage lasts until 1 % strain regardless of stress or temperature (Budd and Jacka, 1989), and there is no other significant change in microstructural characteristics during this creep stage (Gao and Jacka, 1987; Vaughan, 2016).
-
Secondary creep. New grains begin to nucleate, which are free of dislocation tangles and are favourably oriented for deformation under the imposed conditions. A minimum strain rate is reached as this process is balanced with strain hardening (Wilson et al., 2014).
-
Acceleration and tertiary creep. A CPO begins to form, causing softening and strain rate increase. A quasi-constant strain rate is then established, which does not change significantly beyond this point as long as the conditions of deformation remain the same. Eventually a “steady-state” microstructure is reached, where continuous dynamic recrystallisation and strain hardening are balanced and grain sizes are constant (Wilson et al., 2014). However, the formation of this steady-state microstructure can occur much later, after the establishment of a quasi-constant strain rate. While tertiary creep is generally reached at octahedral strains of 5 %–10 %, in some experiments deformed to very high strains (> 57 % shortening) a steady-state microstructure has not been firmly established by the end of the experiment (Peternell et al., 2019).
Strain rates at the primary, secondary, and tertiary creep stages are controlled by the specific stress and temperature conditions, as well as microstructural and chemical characteristics of the ice (Gao and Jacka, 1987; Treverrow et al., 2012; Hammonds and Baker, 2018). Because ice in many natural scenarios has been flowing for some time and typically has already reached a quasi-constant tertiary strain rate (except in some key regions where assumptions of tertiary creep are not valid; Budd et al., 2013; Graham et al., 2018), the accelerating and tertiary creep stages are of interest to many glaciologists (Gao and Jacka, 1987). However, the versions of the Glen flow relation most commonly used in ice dynamics modelling (Glen, 1952, 1955; Nye, 1953) are derived from the secondary creep stage, which takes less time to reach in an experiment. A method to more easily measure tertiary creep rates would be very useful for parameterising a flow law based on tertiary creep rates.
In particular, knowledge of secondary and tertiary strain rates is useful for determining enhancement factors for flow laws used in ice sheet models (e.g. Greve and Blatter, 2009). Furthermore, understanding how these enhancement factors vary depending on the underlying stress configurations gives scope for understanding key features of ice deformation, including anisotropy (Budd et al., 2013; Graham et al., 2018).
1.3 Microstructural development
It has been repeatedly observed in ice (e.g. Piazolo et al., 2013; Montagnat et al., 2015; Qi et al., 2017) and rocks (e.g. Avé Lallemant, 1985; Stipp et al., 2002; Little et al., 2015) that the stress and temperature conditions present during deformation affect the microstructure of the material. In experimentally deformed ice, quartz aggregates and natural quartz veins, bulging (BLG) and subgrain rotation (SGR) recrystallisation are the dominant recrystallisation mechanisms at relatively lower temperatures. As temperature and stress increase, grain boundary migration (GBM) becomes more dominant (Hirth and Tullis, 1992; Stipp et al., 2002). Most experiments in ice, for practical reasons, are performed at high homologous temperatures (typically > −10 ∘C) and low stresses, where grain boundary migration is dominant. This produces a characteristic microstructure of hollow cone CPOs and irregularly shaped grains with interlocking boundaries (see e.g. Wilson et al., 2014; Montagnat et al., 2015). When the temperature is decreased, the strength of the CPO decreases in experiments performed at temperatures approaching −15 ∘C, as BLG and SGR become more dominant mechanisms, and CPOs tend toward clusters rather than cones (Jacka and Jun, 2000; Qi et al., 2017). Active GBM allows microstructures to change rapidly, within strains of ∼0.1, while lattice rotation appears to be a slower-acting recrystallisation mechanism (De La Chapelle et al., 1998; Montagnat et al., 2015). It is important to understand the changing characteristics of ice microstructure at a wide range of temperatures and differential stresses and at all stages of creep, as it can have a significant effect on the rheological behaviour of the ice (Piazolo et al., 2013). When evaluating the effects of changing temperature on rheology, we must consider any lasting effects on the microstructure of the ice.
1.4 Temperature changes and experimental design
Laboratory deformation experiments provide an opportunity to replicate natural conditions of ice deformation, varying conditions such as temperature and stress to examine their effects on flow behaviour. However, running an experiment through to the tertiary creep stage at strain rates approaching those found in most natural scenarios can take an impractically long time. Consequently, the majority of experimental ice deformation studies are performed at temperatures of > −10 ∘C, at a narrow range of stresses (e.g. Kamb, 1972; Jacka, 1984; Wilson et al., 2014; Montagnat et al., 2015), with a much smaller number of studies extending to lower temperatures and higher stresses (e.g. Goldsby and Kohlstedt, 2001; Wilson and Peternell, 2012; Qi et al., 2017). This means there is a bias in the available data favouring a small range of conditions which are seldom present in nature. This study is designed to address that problem by assessing whether it is possible to reduce the time taken to complete an experiment by running it at a higher temperature during primary and secondary creep and then lowering the temperature to emulate the target conditions once the tertiary creep stage has been reached.
Studies in both natural ice (Russell-Head and Budd, 1979; Gao and Jacka, 1987) and laboratory ice (Treverrow et al., 2012) have deformed samples through to tertiary strain and then deformed them again at a later stage under the same conditions. In these cases, the second deformation phase of the experiments progresses straight from the initial elastic deformation stage to resume deformation at the same constant tertiary strain rate, with no significant change in CPO, allowing tertiary creep to be reached within strains of 2 %–3 %. However, if the stress configuration is changed in the second stage of the experiment, characteristics of the original CPO can persist to higher strains (Budd and Jacka, 1989).
Russell-Head and Budd (1979) reduced the time required to obtain secondary minimum strain rates in a series of shear experiments by increasing and decreasing temperatures within experiments. They achieved this by beginning each experiment at higher temperatures of −2 or −5 ∘C, running it through to the secondary minimum (strains of ∼0.01) and then stepping the temperature down to −5, −10, −15, and −20 ∘C, accumulating shear strains of at least 0.001 at each step. This allowed them to gather minimum strain rate data at a range of temperatures within a single experiment. Treverrow (2009) used a similar method for a series of horizontal shear experiments, stepping through −2, −5, −10, −15, and −20 ∘C to gather strain rate information at each step. Total accumulated strains were kept to 0.02–0.03 to minimise any microstructural evolution, as deformation did not progress far beyond the secondary minimum.
So far, there has not been a systematic study undertaken on the effects of changing the temperature once the tertiary creep stage has been reached. The purpose of this study is to compare the microstructural and mechanical data from laboratory ice compression experiments conducted at a single temperature to experiments conducted at multiple temperatures, to establish the extent to which microstructural characteristics of laboratory ice deformed to tertiary creep at one temperature persist once the temperature changes. This will allow us to evaluate whether a mid-experiment temperature change can compromise results by introducing any systematic bias into the strain rate and microstructure data.
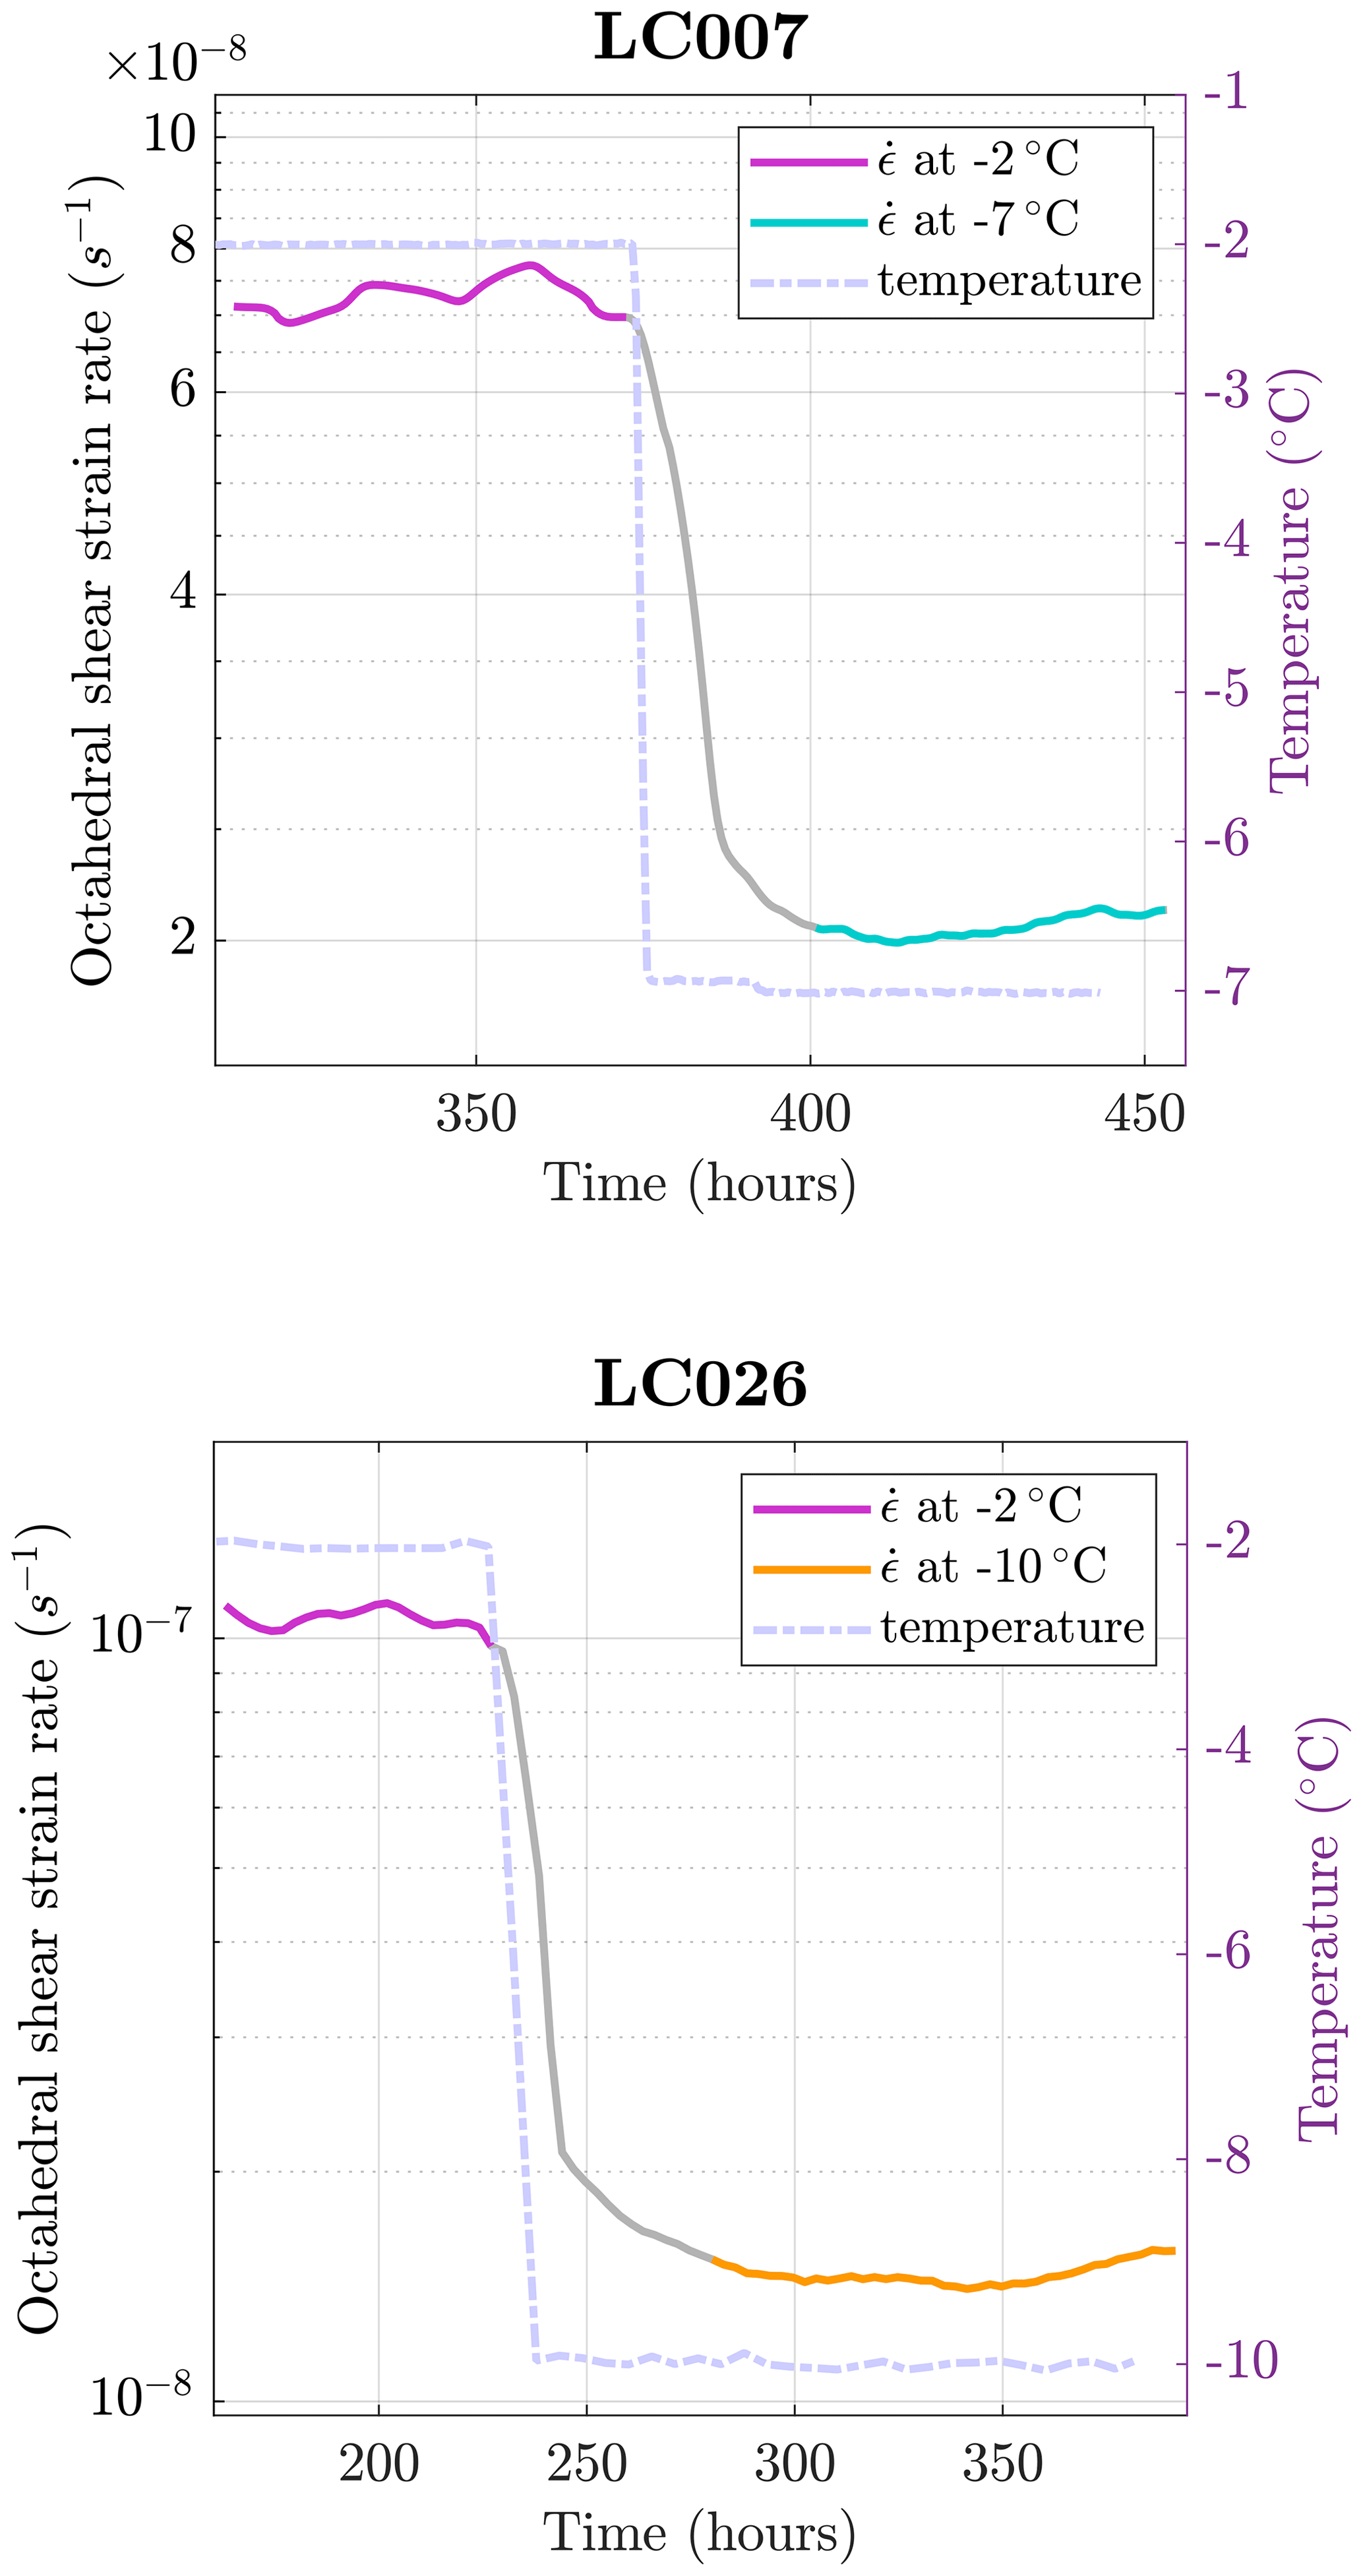
Figure 2Plots of octahedral shear strain rate vs. time for (a) LC007 (−2 to −7 ∘C) and (b) LC026 (−2 to −10 ∘C).
Table 1List of all experiments performed, along with their starting parameters, measured strain rates, and microstructural properties. t is the total experiment run-time excluding set-up and decommission, ϵmax is total accumulated strain, is the secondary strain rate, and are tertiary strain rates measured at the first and second (if applicable) temperatures respectively, gsmed and IQR are the median value and interquartile range of the measured grain sizes after deformation, and J index is a measure of c-axis orientation density as described by Bunge (1983).

2.1 Laboratory
The samples used in this study were initially isotropic polycrystalline pure water ice, prepared using the methods described by Jacka (1984) and Treverrow et al. (2012). Pure de-ionised water was frozen into blocks and passed through an industrial food processor to produce seed grains, which were then sieved to separate out size fractions of 250–425 µm and 425–1800 µm. These two size fractions were combined in equivalent volumes. The seed grains were poured into a mould, which was then flooded with water at 0 ∘C and carefully agitated to remove bubbles. The insulated mould was then left in a −3 ∘C freezer for several days to freeze.
Samples were cut using a bandsaw into rectangular blocks with approximate dimensions of 45 mm × 90 mm × 50 mm, lightly sanded to remove marks from the bandsaw blade, and frozen into depressions in aluminium mounts at the top and bottom to leave ∼50 mm sample height exposed for deformation. The samples were installed into deformation rigs described by Jun et al. (1996) and Treverrow et al. (2012) and deformed through uniaxial compression by loading with lead weights from above. To approximate a near-constant octahedral stress of 0.25 MPa, assuming a constant rate of increase in cross-sectional area and conservation of volume, loads were increased periodically (every 2–5 d, depending on strain rate). Vertical displacement was logged at a frequency of 0.05 Hz using digital dial indicators, and the sample was kept at a constant temperature in a bath of circulating 1–1.5 cSt viscosity silicone oil within a chest freezer, heated by thermistor-controlled elements. Data from the experiments were periodically retrieved and analysed during the course of the experiments. At the conclusion of each experiment, the temperature in the bath was lowered to < −18 ∘C over a time span of 4 to 6 h, and the samples were removed from the rigs within the following week. The amount of additional strain accumulated between the end of the experiment and the removal of the sample (< 0.0015) is not large enough to have any significant effect on microstructure.
After extraction from the deformation rigs, samples were cut using a bandsaw to expose a vertical face containing the axis of compression. This face was sanded to remove marks from the bandsaw blade and then thermally bonded onto 10 cm2 glass slides. Excess ice was removed above the surface of the slide using a motorised microtome until birefringence (when viewing the sample through crossed polars) was minimised, to produce thin sections ∼500 µm thick. These sections were loaded into a custom-built Russell-Head Instruments section viewer and G50 fabric analyser (Wilson et al., 2003, 2007), and scans of the deformed sections were collected at a resolution of 20 µm. Where scans were not of adequate quality, the sections were left to sublimate at −10 ∘C until scan quality improved (∼1 h).
A complete list of experiments and their parameters is shown in Table 1. A series of control experiments were carried out at constant temperatures of −2 ∘C (LC001, LC002 and LC009), −7 ∘C (LC004 and LC005), and −10 ∘C (LC021 and LC023) until a constant tertiary strain rate was well established and microstructural data were collected. Four experiments were run through into tertiary strain at −2 ∘C, and then the temperature was lowered to either −7 ∘C (LC006 and LC007) or −10 ∘C (LC025 and LC026) and left to run until a new stable tertiary strain rate had been established (typically a further 0.03–0.04 accumulated strain). After the temperature was changed, a tertiary strain rate reflective of the new temperature was reached within a span of 30 h for the −2 to −7 ∘C experiments and 60 h for the −2 to −10 ∘C experiments (see Fig. 2). This represents less than 3 % of the total run-time of the changing-temperature experiments. For set 1, the changing-temperature experiments ran for an average of 890 h compared with the −7 ∘C constant-temperature experiments which ran for an average of 1997 h. For set 2, the changing-temperature experiments ran for an average of 688 h, compared with the −10 ∘C constant-temperature experiments which ran for an average of 1521 h. For both sets, the changing-temperature experiments had a shorter run-time by 55 %.
2.2 Mechanical data processing
Erroneous displacement and temperature values were removed by filtering for consecutive values with a difference greater than a minimum step size (an appropriate minimum step size was selected for each experiment based on visual inspection). Sudden jumps in displacement from load increases and disturbances to the apparatus were removed manually. Some more gradual jumps in displacement (e.g. in LC021 and LC025) could not be easily removed and so were left to avoid overprocessing the data. Strains were calculated using the difference between consecutive displacement data points, and strain rates were calculated incrementally over intervals of between 200 and 2000 displacement and time data points (greater intervals were used at lower strain rates). Octahedral shear strains (τoct) were derived from the applied compressive stresses (σ′) using Eq. (1) (Nye, 1953):
Smoothed strain rates were then derived using a cubic spline fit, with a smoothing parameter of 0.01. Octahedral shear strain rates were extracted from the smoothed data for the secondary and tertiary creep stages by averaging values within ranges manually selected from visual inspection of the plotted data. Experiments which reached higher total accumulated strains (> 0.08 at a single temperature) tend to show a drop-off in tertiary strain rate, as samples expand unevenly and the assumption of a constant rate of increase in cross-sectional area becomes less appropriate. In these cases, the tertiary strain rate value was taken from data points closer to the beginning of tertiary creep, before the drop in values.
2.3 Microstructural data processing
The procedures used for processing the microstructural data are novel and are described in detail in Appendix A1. In brief, the raw orientation data from the G50 fabric analyser were first converted to a data format readable by MATLAB®. The data were then filtered to remove anomalies at grain boundaries and other areas of low data quality, and the remnant grains were reconstructed to fill the sample area, using methods based on the FAME (Fabric Analyser Based Microstructure Evaluation) program (Hammes and Peternell, 2016) and functions of the MTEX toolbox (Bachmann et al., 2010; Mainprice et al., 2015). We extracted grain size (equal area diameter), shape-preferred orientation (SPO), and c-axis CPO (one point per pixel) from the processed fabric analyser data. The c-axis CPO was contoured from the c-axis pole figure with a kernel half-width of 7.5∘. We quantified the intensity of the c-axis CPO using the PfJ index (Kilian and Heilbronner, 2017).
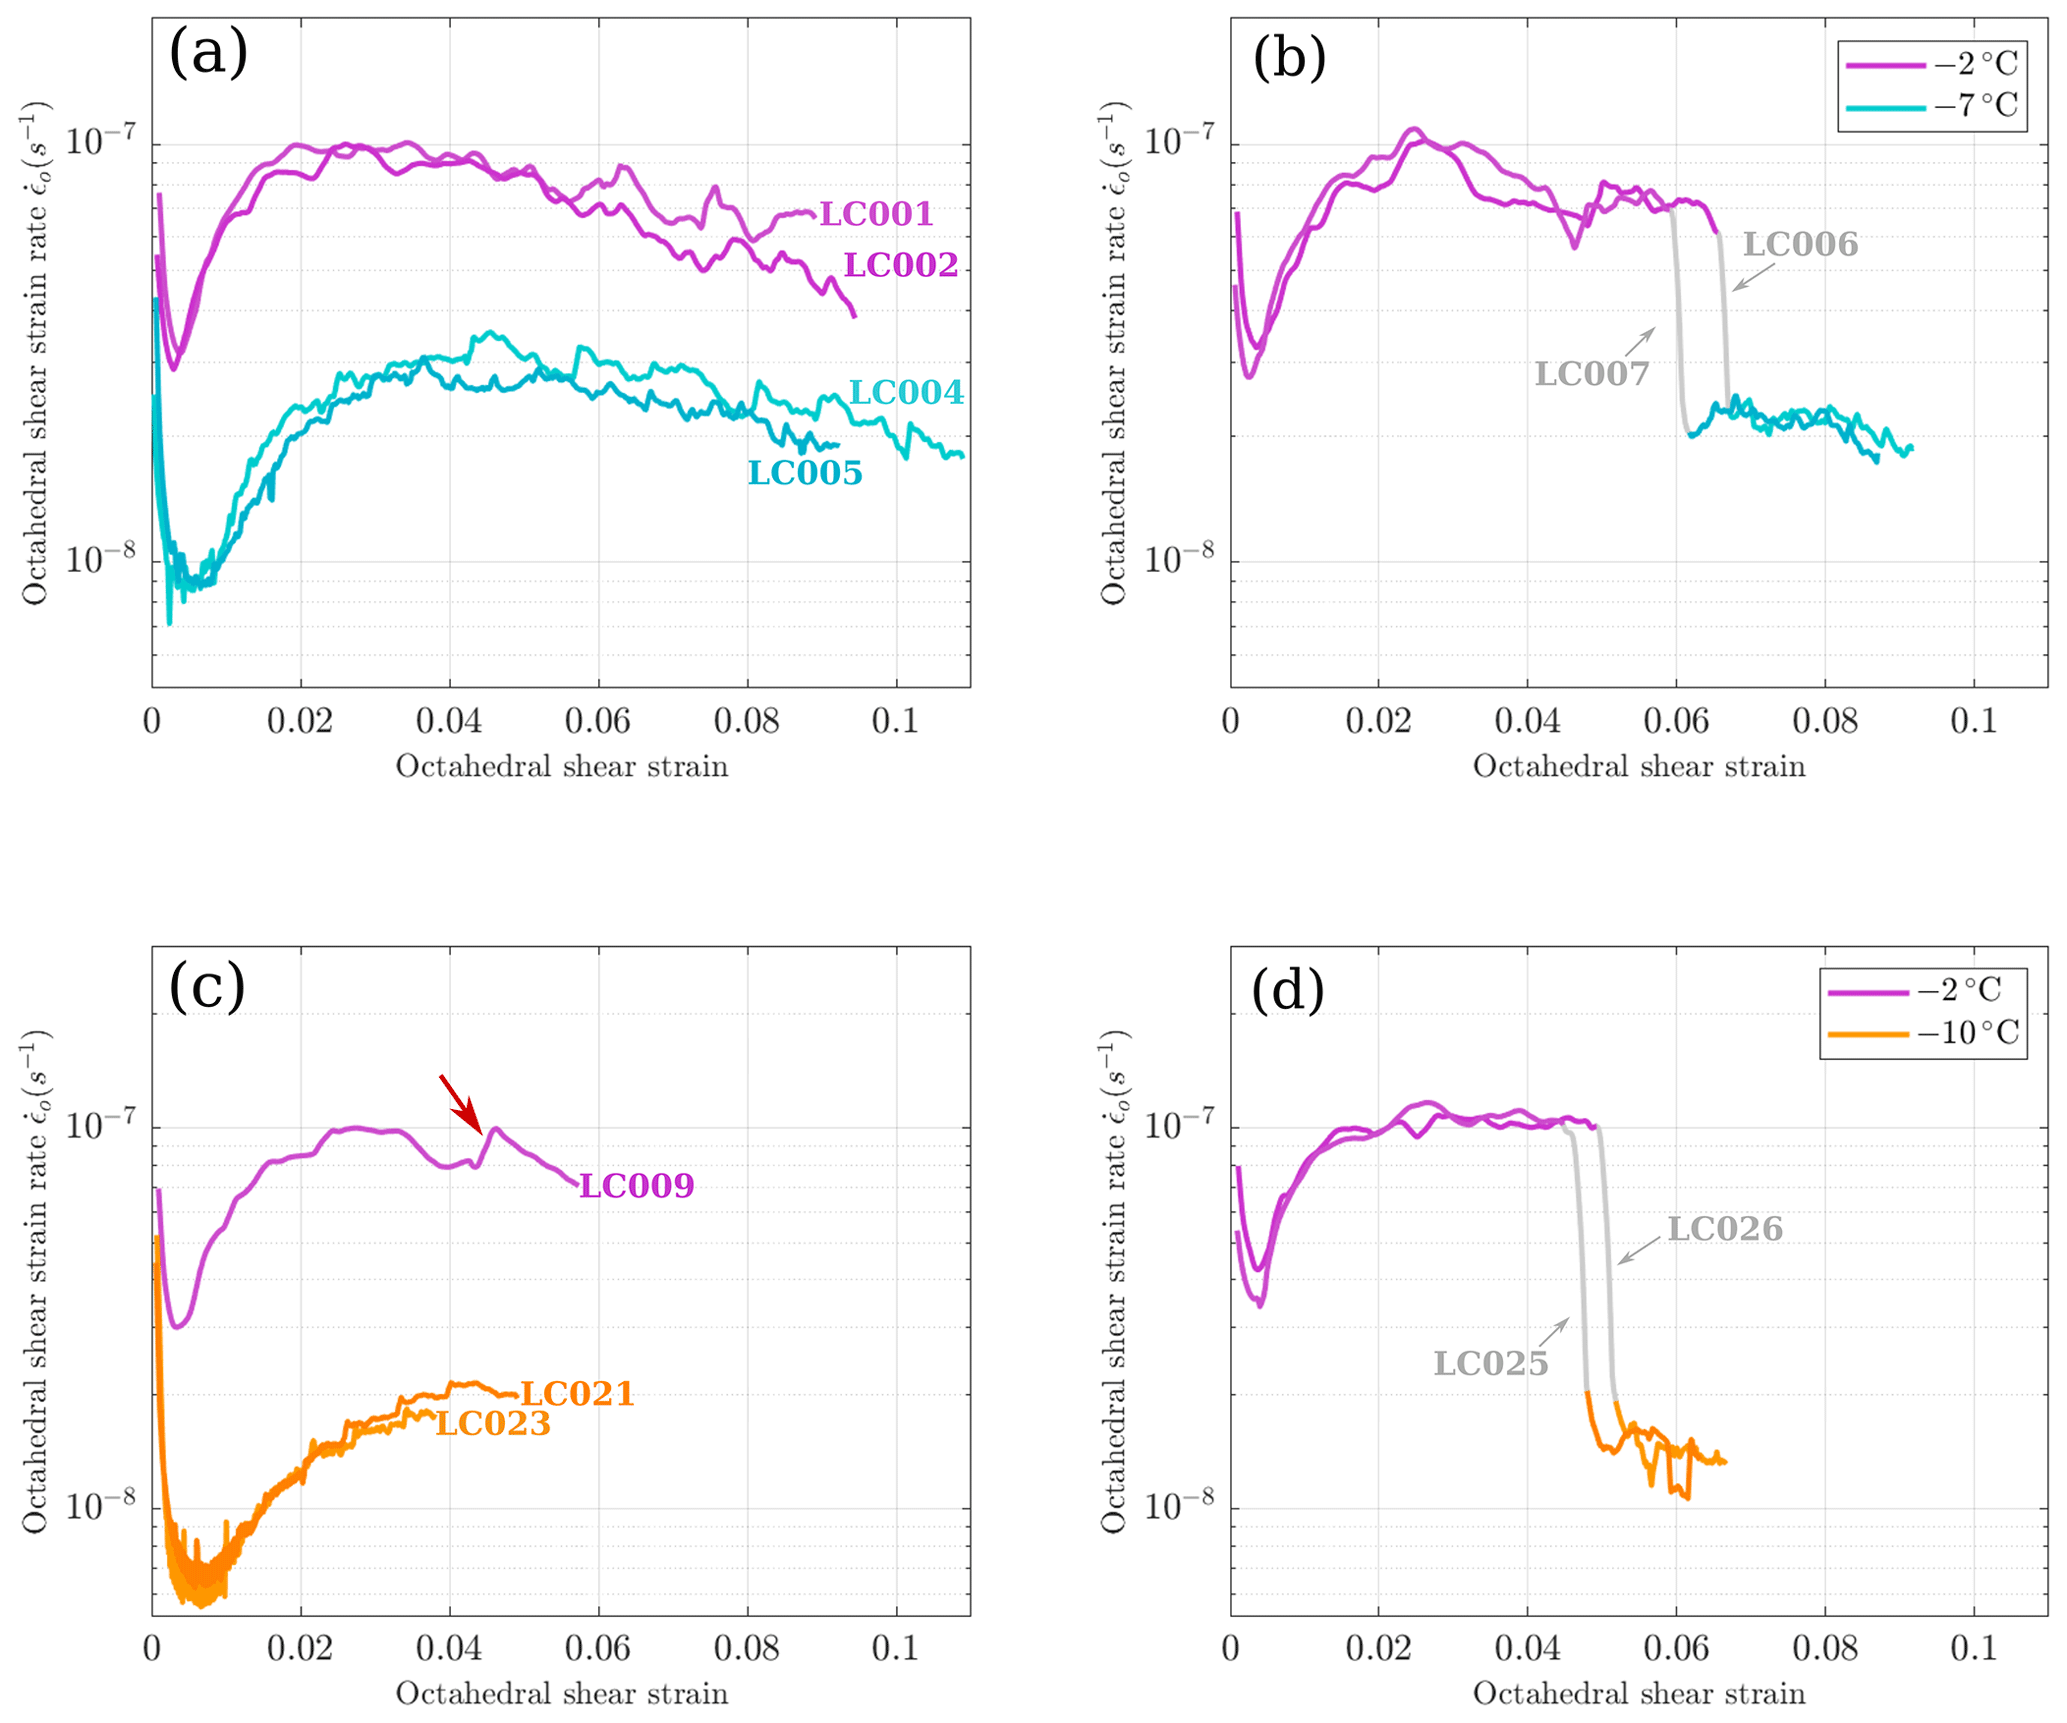
Figure 3Smoothed octahedral shear strain rate data plotted against total accumulated octahedral shear strain for all experiments. (a, c) Constant-temperature experiments. (b, d) Changing-temperature experiments. The red arrow indicates an example of a strain rate jump as described in Sect. 2.2.
3.1 Mechanical data
Plots of octahedral strain rate data for all experiments are shown in Fig. 3. Experiments have been divided into set 1 (for comparison of −2 to −7 ∘C temperature changes) and set 2 (for comparison of −2 to −10 ∘C temperature changes). When comparing the strain rates and final microstructure of changing-temperature experiments to constant-temperature experiments, we will only compare samples which reached a similar total strain, to avoid considering the influence of accumulated strain on behaviour. Therefore, the −2 ∘C control samples for the first set of experiments are LC001 (ϵmax=0.133) and LC002 (ϵmax=0.142), and for the second set only LC009 (ϵmax=0.086) will be used for comparison, as experiments running at −10 ∘C cannot be run to as high total strains within a reasonable timeframe.
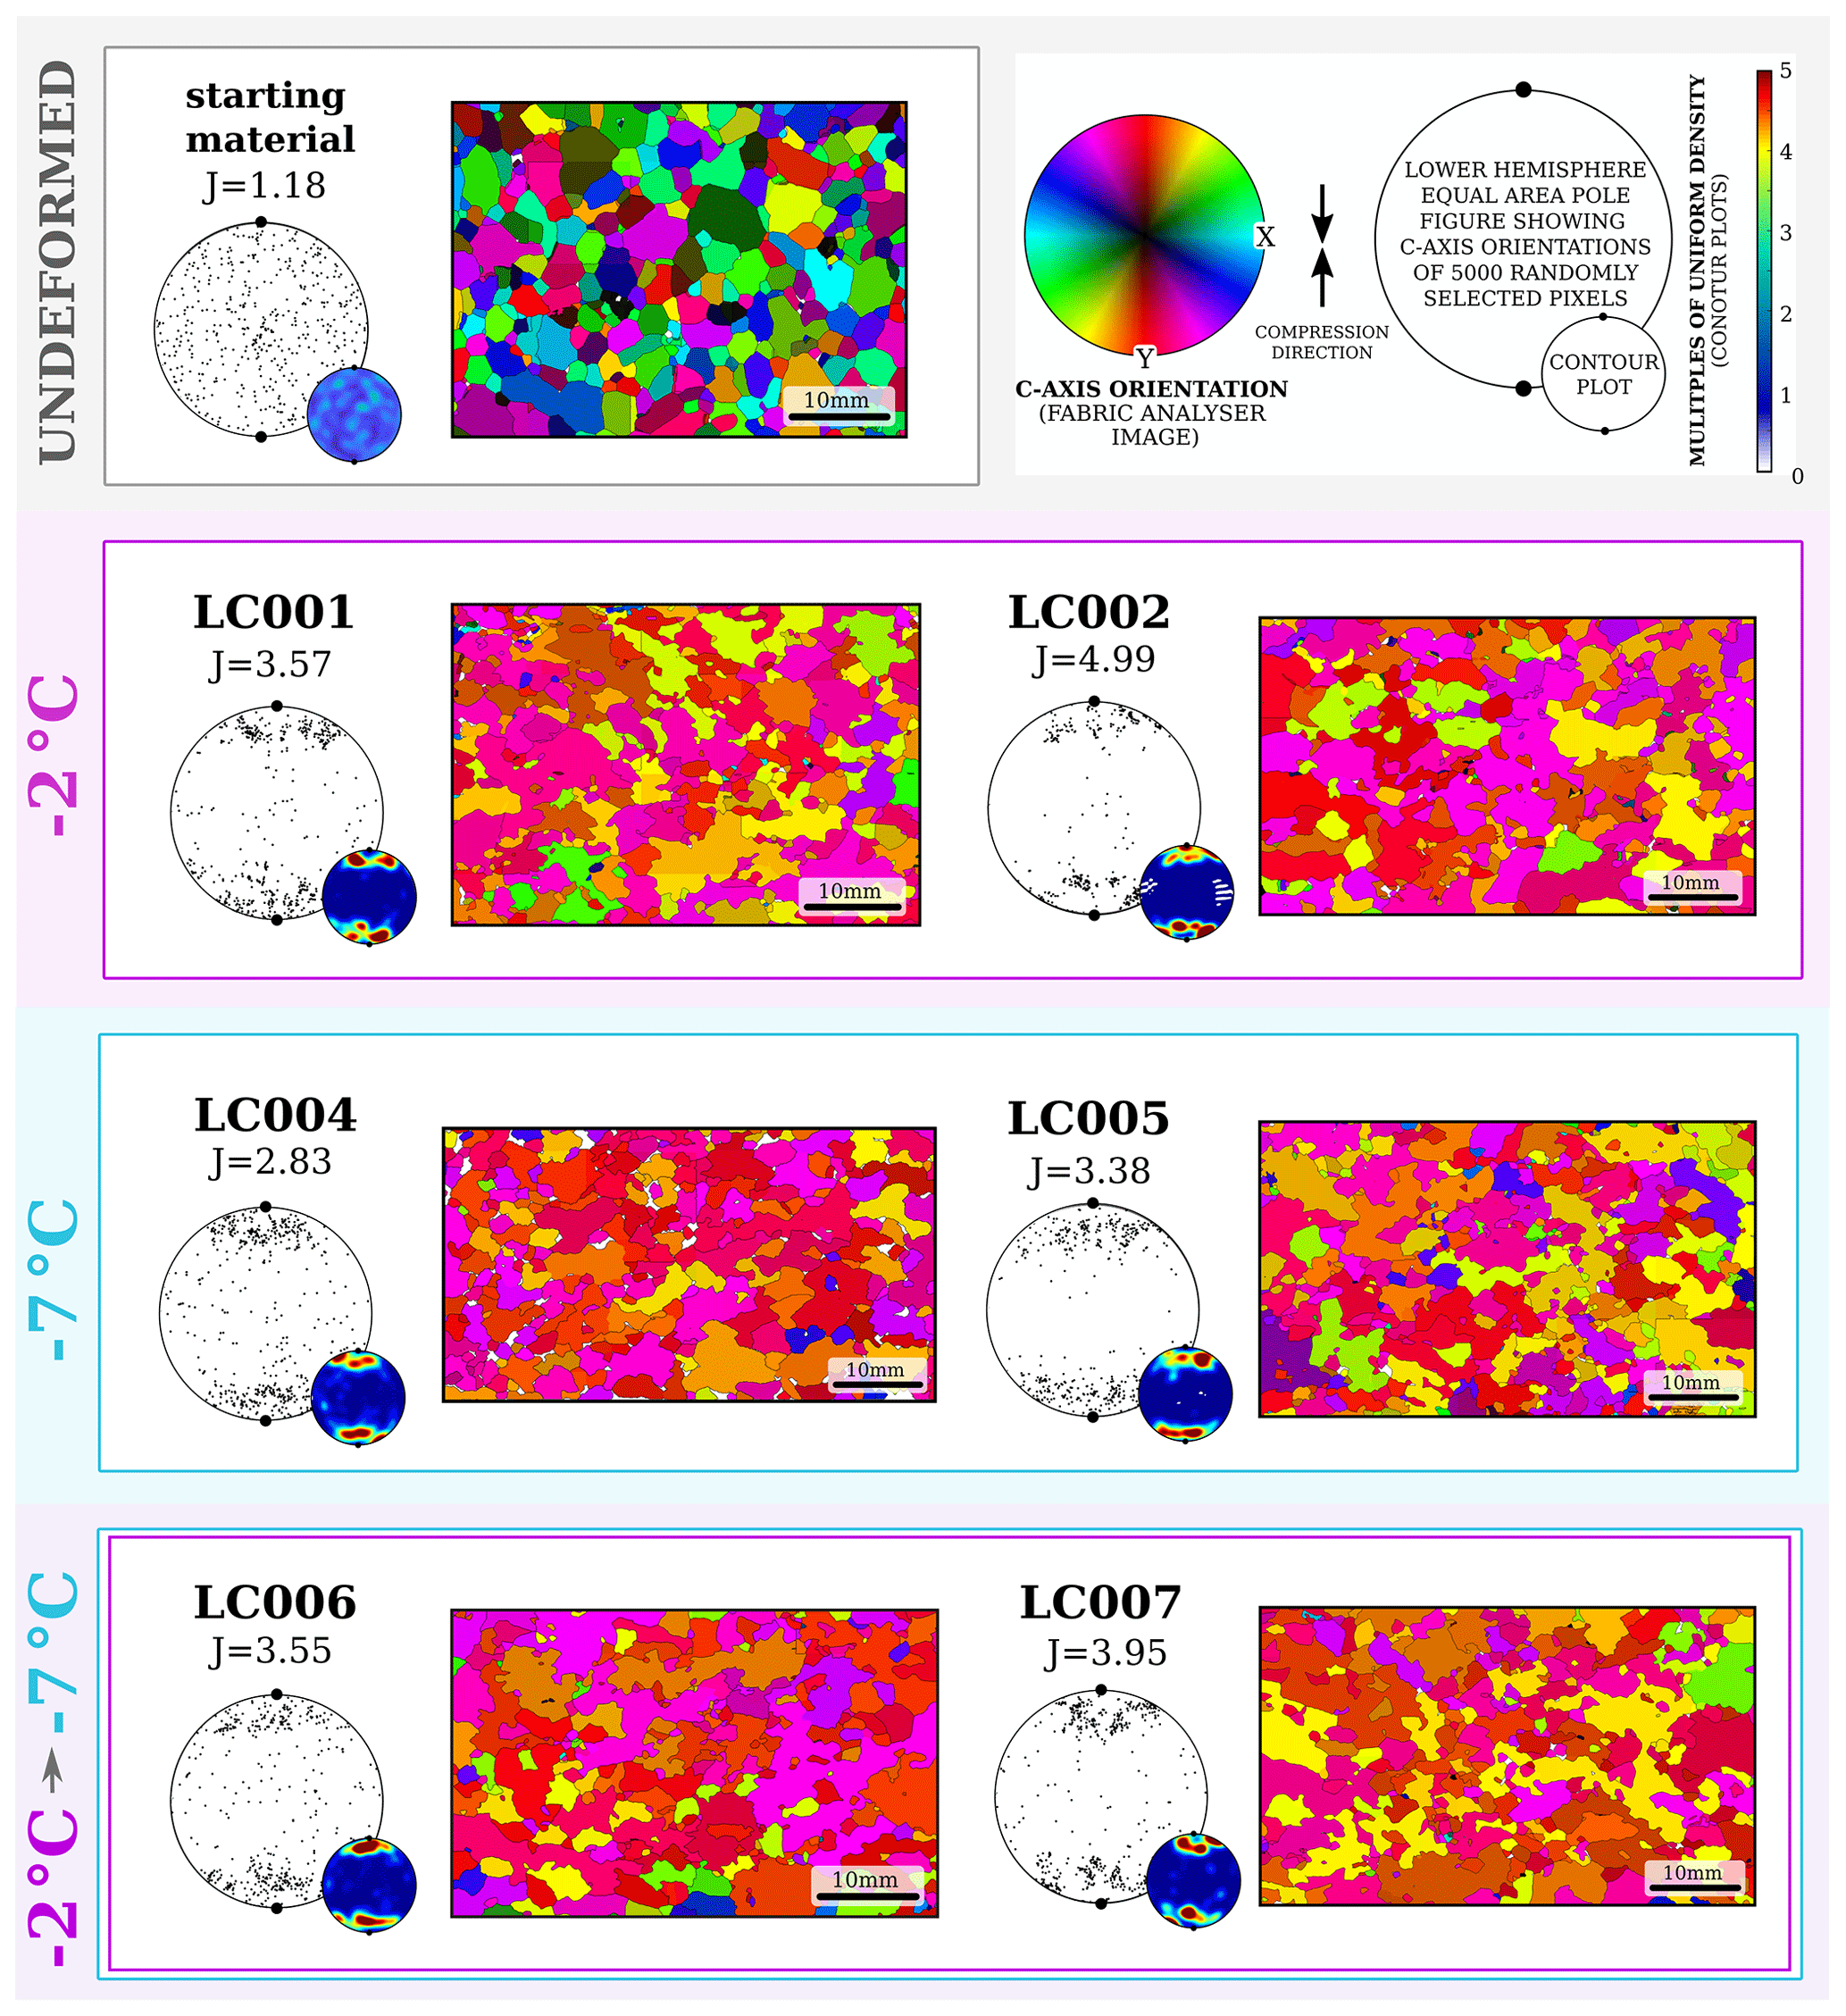
Figure 4Results from microstructural analysis of all samples in set 1 (−2 to −7 ∘C), alongside a sample of undeformed standard ice. Shown for each sample, from left to right: sample number and J index above a lower-hemisphere stereonet plot of c-axis orientations of 5000 randomly selected pixels, alongside a contoured plot of the same data (scale shown in the upper right); thin section image from processed fabric analyser data, coloured by c-axis orientations according to the legend (upper right).
There is good agreement between duplicate experiments, with strain rates from different experiments differing on average by ±10 % when running at the same temperature. In both sets of experiments, the final tertiary strain rates are slightly lower in the changing-temperature experiments than in the constant-temperature experiments. However, this difference is within the level of variability (±20 %) expected based on the magnitude of the strain rate drop-off near the end of longer experiments (see Sect. 2.2).
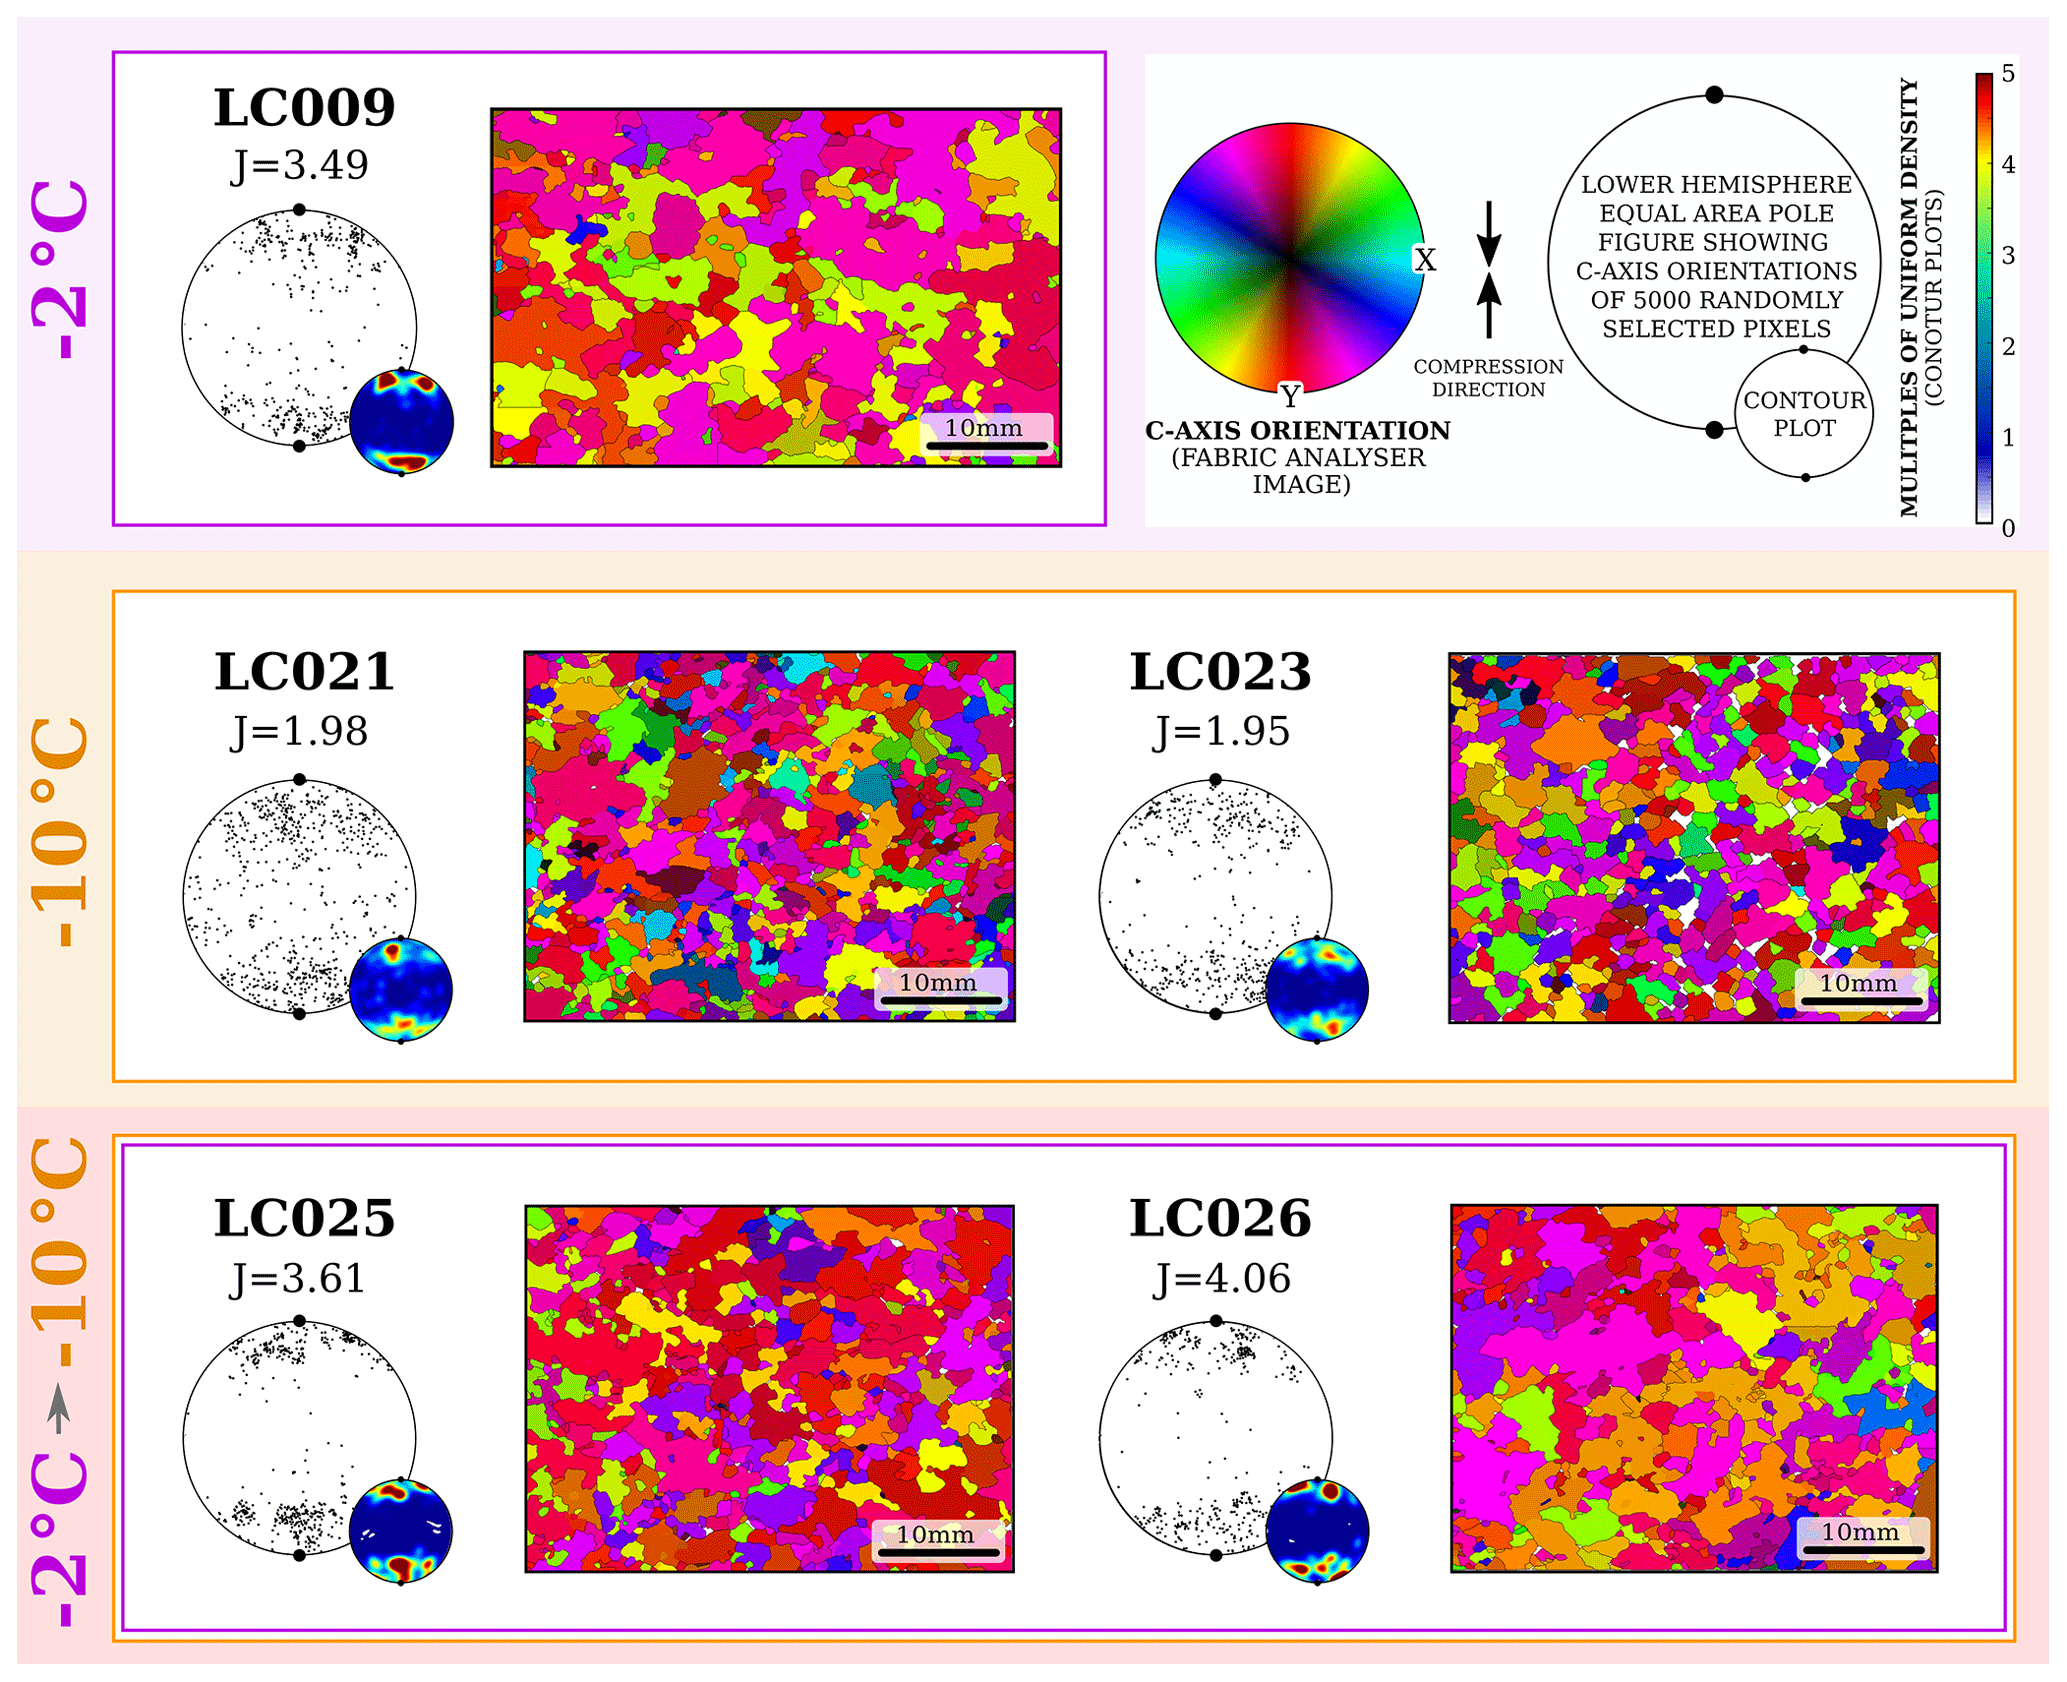
Figure 5Results from microstructural analysis of all samples in set 2 (−2 to −10 ∘C). Shown for each sample, from left to right: sample number and J index above a lower-hemisphere stereonet plot of c-axis orientations of 5000 randomly selected pixels, alongside a contoured plot of the same data (scale shown in the upper right); thin section image from processed fabric analyser data, coloured by c-axis orientations according to the legend (upper right).
3.2 Microstructural data
Processed thin section images and stereonets of c-axis orientations collected from all samples are shown in Fig. 4 (set 1) and Fig. 5 (set 2). Median values and interquartile ranges of grain size distributions, alongside J indices for c-axis CPOs, are also listed in Table 1. Grain size and SPO statistics are included in Appendix B.
The starting material, known as “standard laboratory ice” (Fig. 4, top left), is made up of polygonal grains with straight boundaries and has no CPO (J index = 1.18) or SPO. Grains have a mean size of 1460 µm, with an interquartile range of 1087 µm. With this starting point as a reference, we will consider the microstructural data from both sets of experiments in turn.
-
Set 1 (−2 to −7 ∘C). All deformed samples in this set are composed of irregularly shaped grains with interlocking boundaries. All samples after deformation have a strong cone CPO (J indices 2.83–4.99) with the majority of c axes oriented 10–30∘ from the compression direction. Median grain sizes for all samples lie within a range of 680–1200 µm, with interquartile ranges 610–1801 µm. The J indices, median grain sizes, and grain size interquartile ranges of the two changing-temperature experiments lie within the ranges of the same values for the constant-temperature experiments in this set.
-
Set 2 (−2 to −10 ∘C). The constant-temperature −2 ∘C sample and the changing-temperature samples for this set have the same microstructural characteristics as those from the previous set. All have irregularly shaped grains with interlocking boundaries and a strong 10–30∘ cone CPO centred around the compression direction (J indices 3.49–4.05), median grain sizes in the range 805–1070 µm, and grain size interquartile ranges of 913–1340 µm. However, the constant-temperature −10 ∘C samples have a significantly different microstructure. Most strikingly, their c-axis CPOs, while still vertical cones, are approaching clusters and are much weaker than the other samples in this set, with J indices of 1.95 and 1.98. Their median grain sizes (561 and 867 µm) and interquartile ranges (949 and 421 µm) overlap with the range of values measured in other samples but are at the smaller extremity. Because thin section measurements of grain size sample only a small number of grains, and there is a large range of grain sizes measured in samples deformed under the same conditions, we are unable to draw any conclusions based on grain size differences between sets.
All samples measured from both sets show a similar grain size distribution, with a unimodal distribution skewed toward smaller sizes and a decreasing “tail” extending to larger sizes, and an SPO with an average angle of offset between grain long axis and compression direction of 80–110∘.
A comparison of strain rates at the two temperatures suggests that there is no significant effect of previous temperature history on tertiary strain rate. Strain rate values for experiments performed under identical conditions lie on average within ±10 %, where any larger variations are explained by uncertainties and assumptions made during the experimental process (e.g. constraints on temperature control, uncertainties in sample measurement, and the assumption that displacement is evenly distributed down the length of the sample). Tertiary strain rates at both −7 and −10 ∘C from the changing-temperature experiments agree with those from their equivalent constant-temperature experiments to within the same level of variability, meaning that it is not possible to detect any effect of the previous temperature history of the samples on tertiary strain rate using these experimental methods. Once the temperature has been changed, it is a matter of tens of hours (out of a several-hundred- to thousand-hour experiment) before deformation continues at a quasi-constant strain rate with no obvious perturbations or delay in strain rate response.
The microstructural characteristics observed in these samples after deformation are comparable to those from other compression experiments in the literature; the development of a vertical small-circle girdle CPO centred around the compression direction has been observed many times in polycrystalline ice above −15 ∘C (e.g. Kamb, 1972; Jacka, 1984; Treverrow et al., 2012; Wilson et al., 2014), and the interlocking, irregular grain boundaries seen in all deformed samples in this study are comparable to those observed by Montagnat et al. (2015) and Vaughan (2016) after similar experiments. Mean grain sizes fall within a range consistent with those observed by Jacka and Jun (1994) for tertiary steady-state crystal sizes. The distributions of grain sizes in deformed samples are consistent with those recorded by Stipp et al. (2010) for polycrystalline materials which have undergone dynamic recrystallisation dominated by GBM mechanisms, as expected in high-temperature ice (Qi et al., 2017).
It is not possible to distinguish between changing-temperature and constant-temperature experiments in set 1 on the basis of microstructure. As the stress conditions (unconfined vertical compression at 0.25 MPa) are the same, and the temperatures (−2 and −7 ∘C) are very close, the microstructure that develops during deformation is too similar to be distinguished using these methods. Mean steady-state grain sizes in polycrystalline materials undergoing dynamic recrystallisation have been observed to adjust according to experimental temperature (Jacka and Jun, 1994; Cross et al., 2017; Treverrow, 2009; Stipp et al., 2010); however the level of variability in grain size data across all samples means that it is not possible to distinguish between samples deformed at these temperatures. This means that there is no obvious disadvantage to performing these experiments at a higher temperature initially, saving over 1000 h (55 %) of experiment run-time to derive a reliable tertiary strain rate at −7 ∘C.
In the samples from set 2 there are clear microstructural differences between constant-temperature and changing-temperature experiments. In samples where the temperature was dropped from −2 to −10 ∘C after the onset of tertiary creep, the microstructure is still much more comparable to experiments conducted completely at −2 ∘C, failing to match those conducted entirely at −10 ∘C despite strain rates rapidly adjusting to match the new conditions. Under deformation with no confining pressure at temperatures greater than approximately −15 ∘C, ice generally develops a microstructure characteristic of active GBM and BLG (Alley, 1992; Montagnat et al., 2015). However, in some lower-temperature experiments the strength of the CPO decreases with decreasing temperature. This is due to the increasing contribution of lattice rotation and polyganisation as recrystallisation mechanisms, even while GBM is still present and even dominant (Qi et al., 2017). Our data suggest that the characteristics of the microstructure which develops during all three creep stages at −2 ∘C, at which temperature GBM is overwhelmingly dominant as a recrystallisation mechanism, are sufficiently different from those present after constant-temperature experiments at −10 ∘C. Those characteristics persist once the temperature has been lowered and some further strain (0.02–0.03) has been accumulated. It is possible that if a larger amount of strain were accumulated during tertiary creep at −10 ∘C, the microstructure would further adjust to the new conditions; however this would take longer and therefore reduce the usefulness of this method as a way to decrease experiment run time.
The temperatures we have tested here are comparable to those found in temperate glaciers and in the lower and upper extremities of polar ice sheets. For experiments aiming to replicate colder conditions, it would be best to use a lower starting temperature, so that the balance of deformation mechanisms active at the beginning of the experiment is more comparable to that at the final target temperature. It should also be noted that natural ice has different rheological properties to standard ice, (Budd and Jacka, 1989; Dahl-Jensen et al., 1997; Castelnau et al., 1998; Craw et al., 2018), and so the balance of deformation mechanisms active in experiments may be different to those active under the same conditions in nature.
Strain rate data from compression experiments on standard laboratory ice show that tertiary strain rates adjust very quickly (within 3 % of total experiment run time) to a change in temperature, with no obvious lasting effects resulting from the temperature history of the sample. Therefore, we suggest that for experiments where strain rate data are the main object, a mid-experiment temperature change is a viable way to decrease experiment duration with a temperature change step up to and possibly exceeding 8 ∘C in magnitude. This method is best used when the main objective of an experiment is to measure tertiary strain rate data under different experimental conditions, for example when deriving flow law enhancement factors for use in ice shelf and ice sheet models. In this context it can save 55 % of experiment run time, allowing data to be collected under a far wider range of conditions than has previously been practical.
Differences in final sample microstructure between changing-temperature and constant-temperature experiments are not detectable in high-temperature experiments with a small temperature step (−2 to −7 ∘C); therefore there is no observable disadvantage to using the temperature change method at these temperatures. However, microstructural data where the change in temperature is 8 ∘C in magnitude (in this case changing from −2 to −10 ∘C) may not be truly representative of those expected in a constant-temperature experiment. Even when changing between temperatures where the same recrystallisation mechanisms are dominant, the relative contribution of mechanisms can change significantly, resulting in quantifiably different microstructural characteristics.
These results also show that the tertiary strain rate of deforming ice will adjust almost instantaneously to a change in temperature, a fact which should hold true in natural scenarios. Regardless of the microstructure, using this method will allow strain rate data at much more realistic strain rates and stresses to be derived at low temperatures on a laboratory timescale, allowing laboratory ice experiments to become more representative of natural ice flow. This will allow for the parameterisation of ever more accurate ice flow laws.
The workflow of microstructural data processing is shown in Fig. A1. The process uses MTEX but is closely modelled on FAME (Fabric Analyser Based Microstructure Evaluation). MTEX (Bachmann et al., 2010; Mainprice et al., 2015) is a MATLAB®-based toolbox which has been widely used to analyse ice crystallographic textures measured using electron backscatter diffraction (EBSD) (e.g. Prior et al., 2015; Qi et al., 2017, 2019). FAME is a comprehensive MATLAB®-based software which has been widely used to quantify thin section data from ice (e.g. Peternell et al., 2014; Hammes and Peternell, 2016) and minerals such as quartz (Peternell et al., 2010; Rodrigues et al., 2016; Zibra et al., 2017) and calcite (Köpping et al., 2019). In this study, we used a FAME-based method to convert the raw binary data from the G50 fabric analyser (.cis file format) to text files which could then be imported into the MTEX toolbox in MATLAB®. The converted raw data were then processed and statistically analysed using scripts developed using the MTEX toolbox and FAME program for reference.
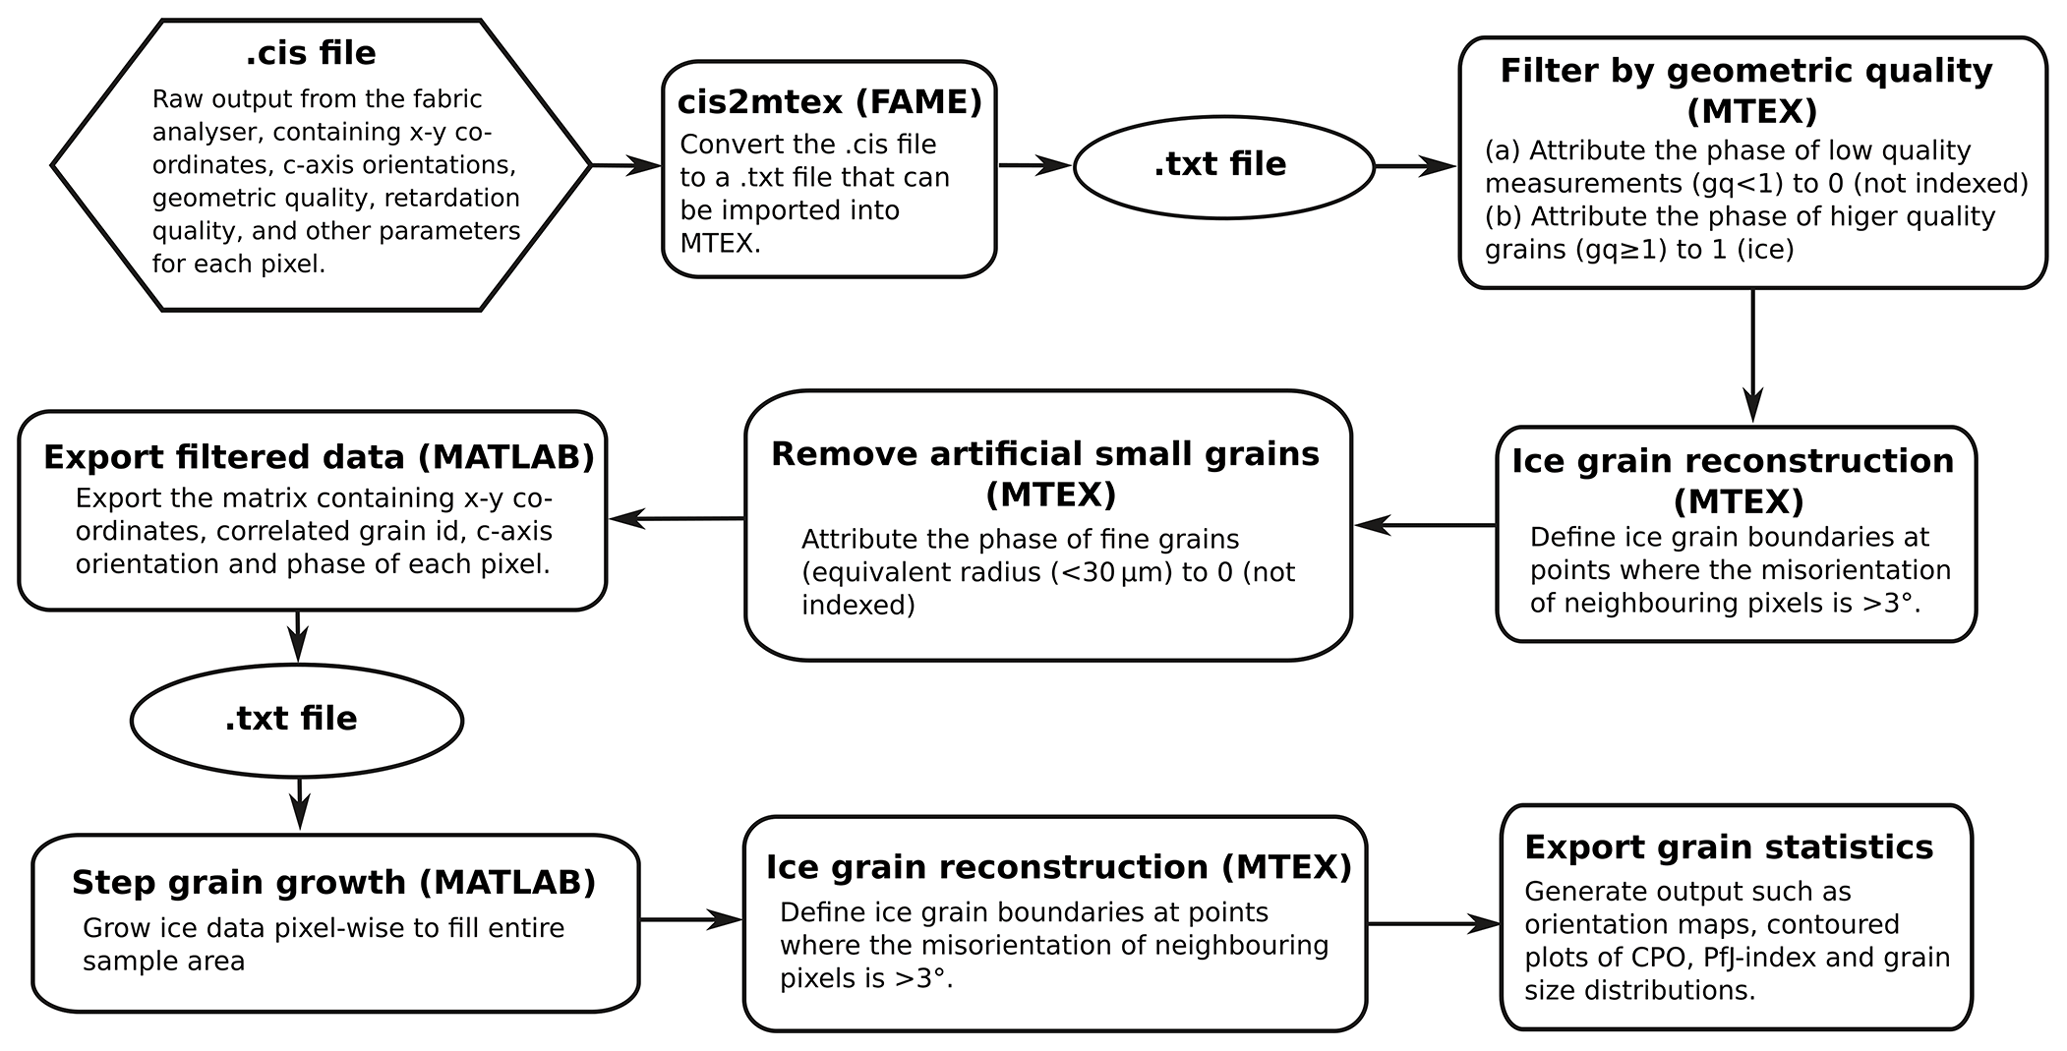
The raw output from a G50 fabric analyser is a binary .cis file containing the positions in x–y co-ordinates, c-axis orientations in Clar notation (dip direction and dip), geometric quality, retardation quality, and other parameters for each pixel in the field of view (Peternell et al., 2014). Geometric quality and retardation quality quantify the data quality of each c-axis orientation measured with a range of 0 (bad) to 100 (excellent) (Peternell et al., 2009). We used FAME to convert the c-axis orientations from Clar notation to Euler angles (phi1, Phi, phi2), with phi2 set to 0. The output is an MTEX import text file containing the .cis binary information and Euler angles (Peternell et al., 2014; Hammes and Peternell, 2016).
The converted raw data were filtered using scripts developed using the MTEX toolbox in MATLAB®. We applied the “grain reconstruction” function (Bachmann et al., 2011) to pixels with geometric quality of ≥1. Grain boundaries were defined where misorientations of neighbouring pixels were larger than 3∘. Grain and sub-grain boundaries, bubbles, and kink bands can have a non-negligible impact on the quality of reconstructed grain data, introducing artificial fine and elongated grains at boundaries. The raw data filtering removes very fine grains (<30 µm).
The raw data filtering leaves blank areas along grain boundaries and within grains where artefacts have been removed. We applied a step grain growth function (Hammes and Peternell, 2016) to the filtered raw data. Step grain growth allows a good restoration of the ice grain geometry, improving the grain statistics when compared with the original data. Grains were grown to fill the entire sample area.
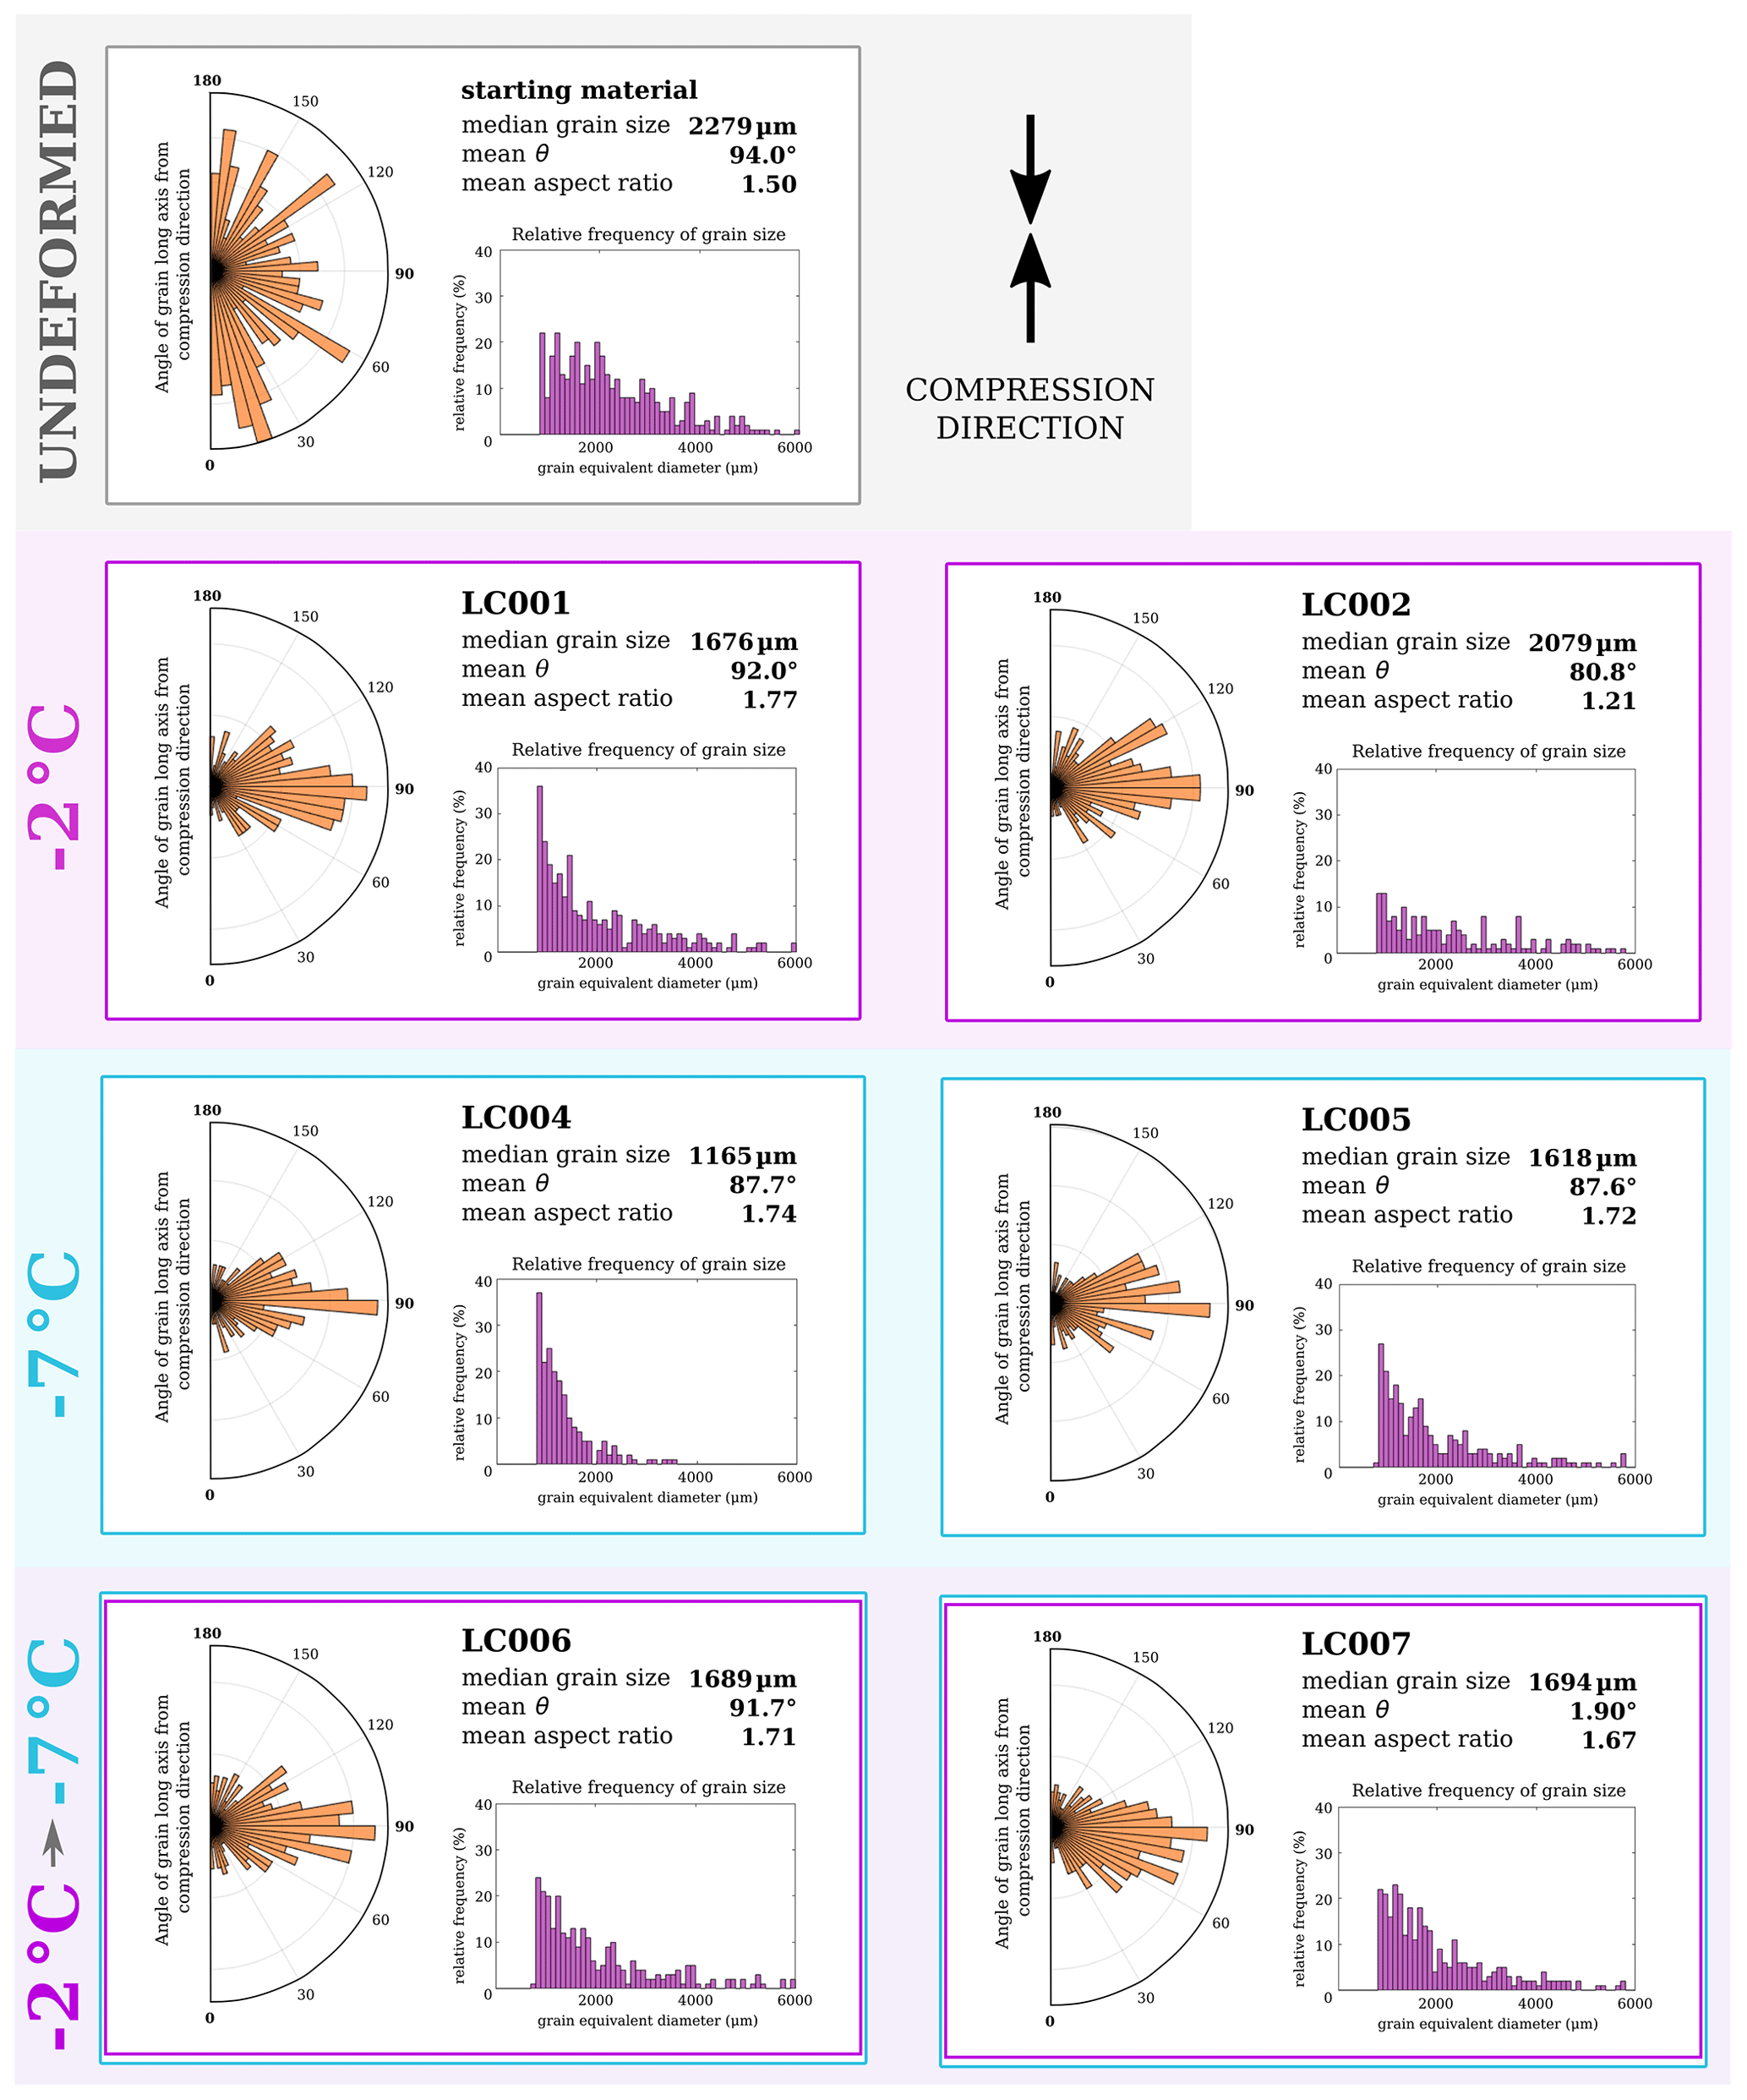
Figure B1Polar histogram of grain orientations (angle of grain long axis from compression direction), histograms of grain size distribution (measured as grain equivalent diameter), and median values for all samples in set 1.
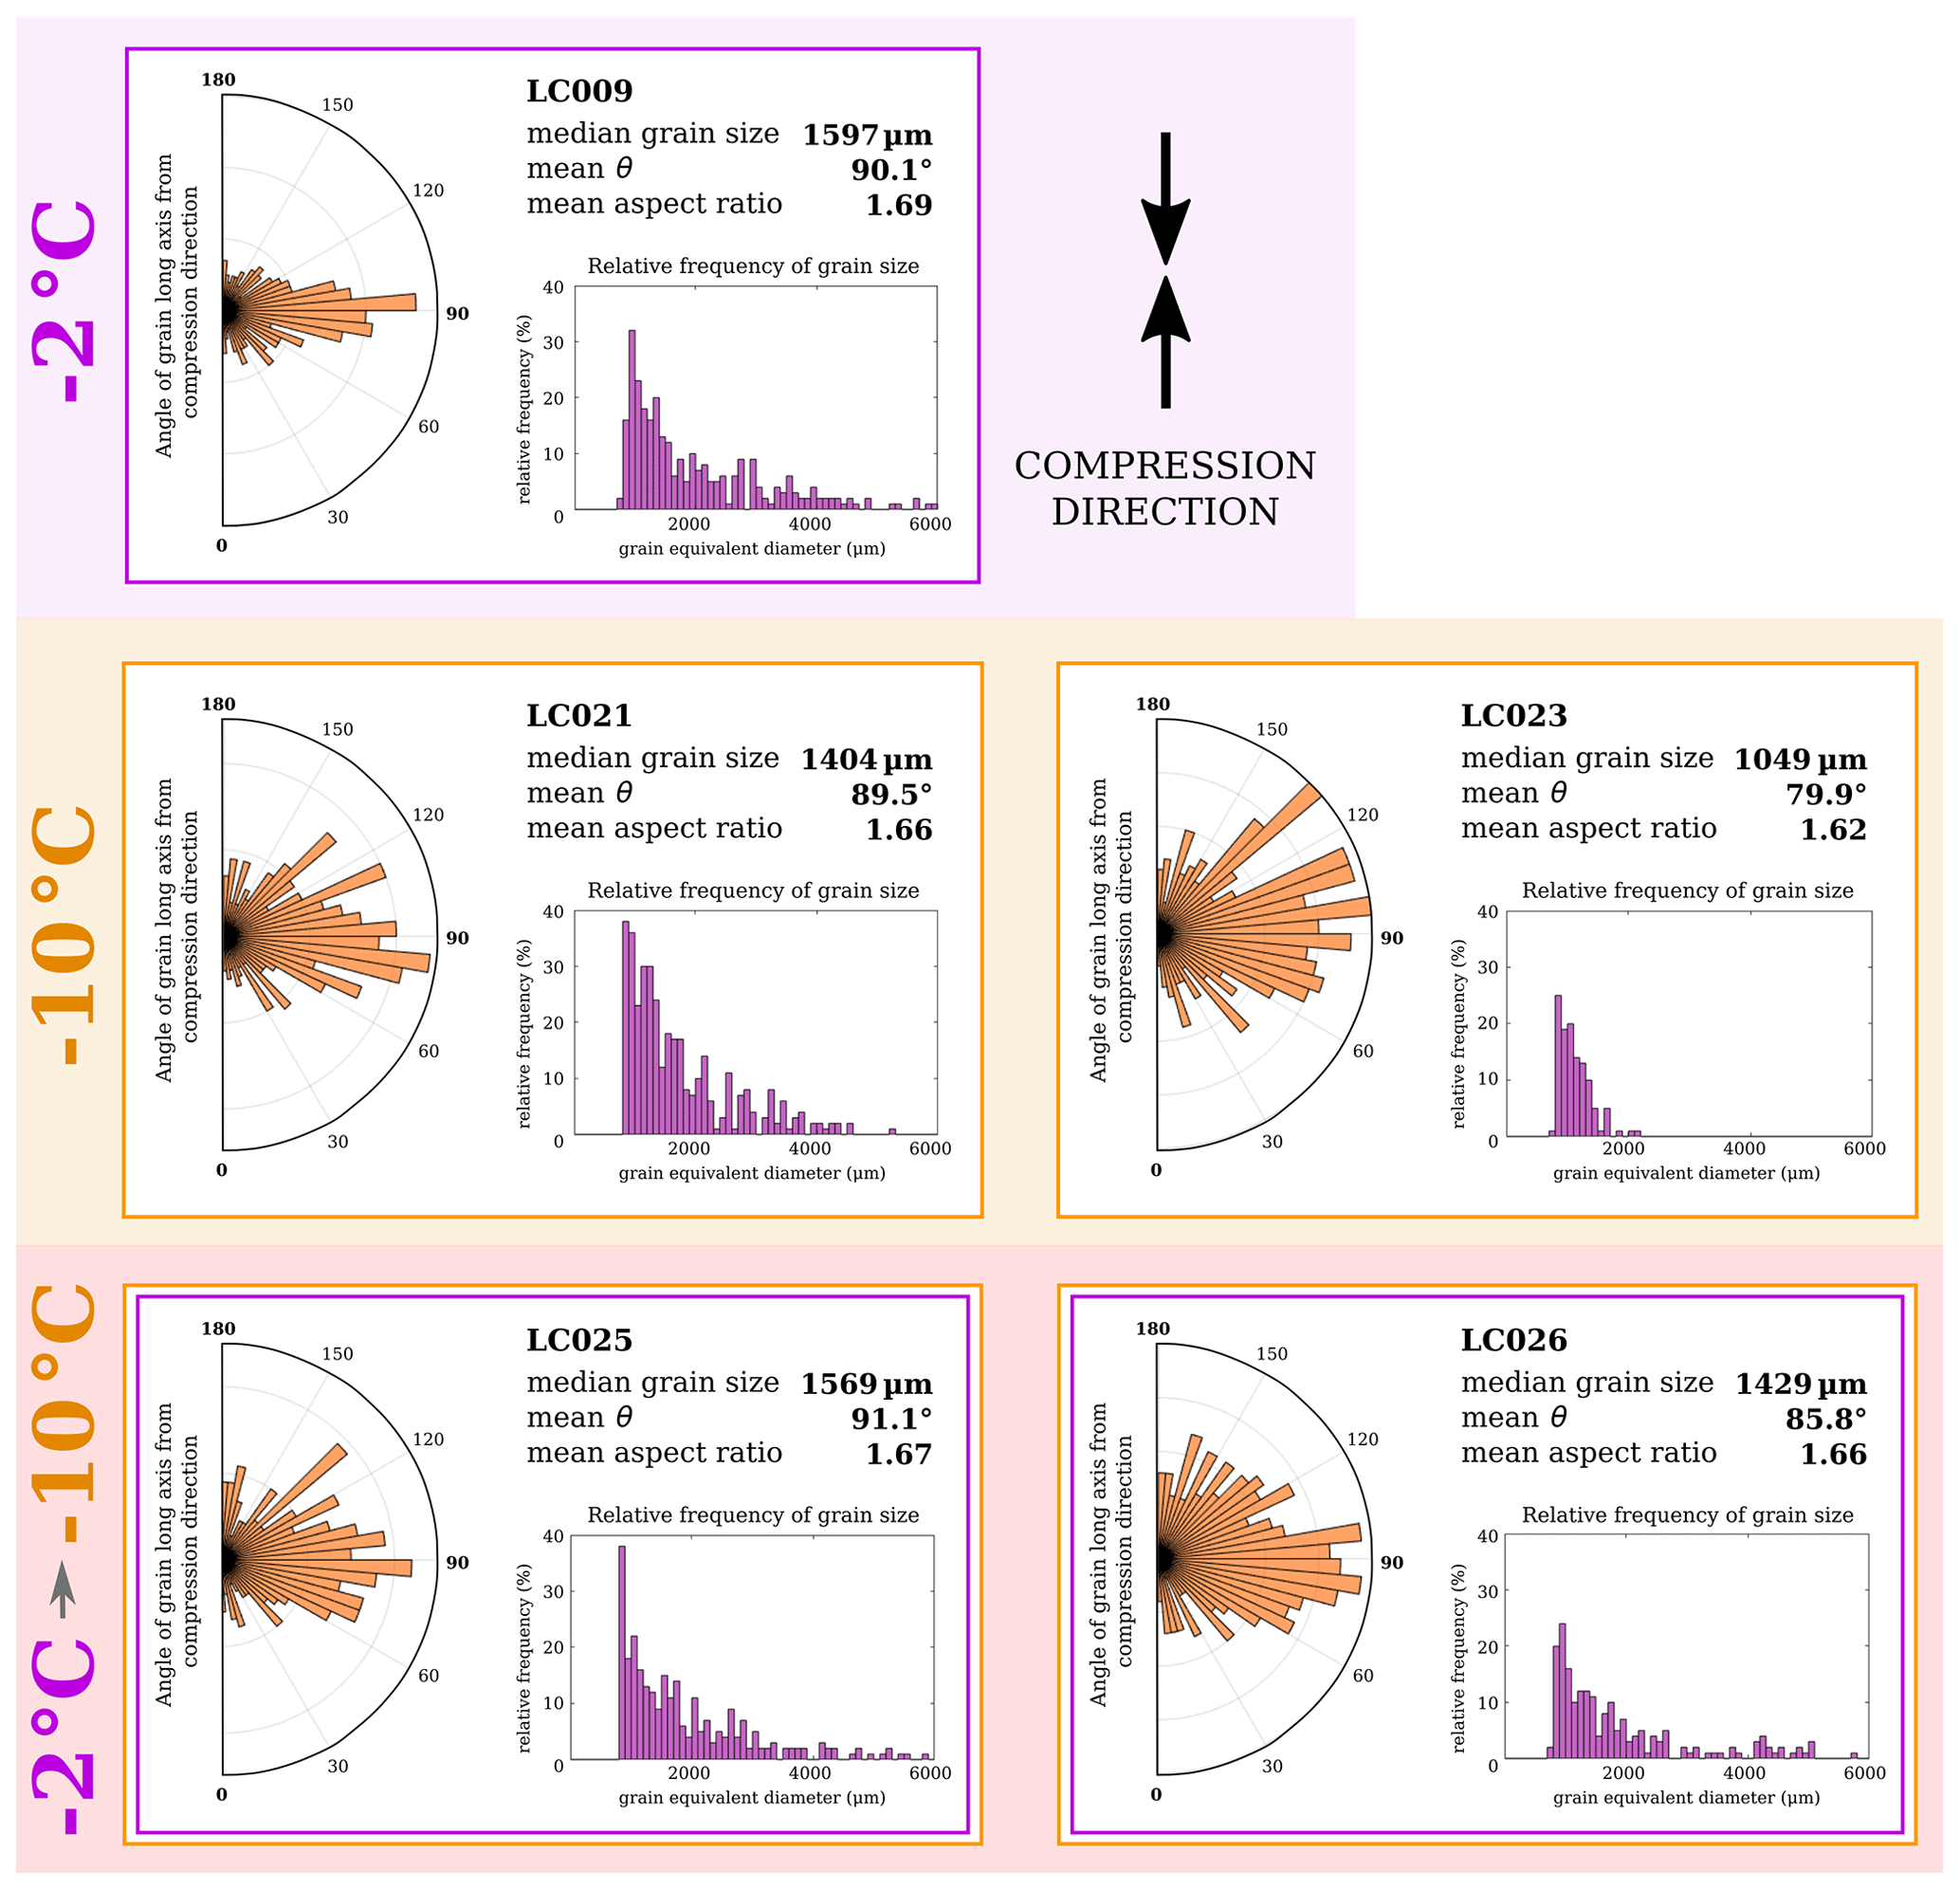
Figure B2Polar histogram of grain orientations (angle of grain long axis from compression direction), histograms of grain size distribution (measured as grain equivalent diameter), and median values for all samples in set 2.
Data can be obtained at https://data.aad.gov.au/metadata/records/AAS_4289_temp_change (last access: 26 October 2020, Craw et al., 2020).
LC, AT, SC, FSM, and JR designed research. LC and AT performed experiments. SF and MP developed methods for microstructural data analysis, and AT designed methods for mechanical data analysis. LC performed data analysis and wrote the draft. All authors edited the paper.
The authors declare that they have no conflict of interest.
We are grateful to Nicolas Stoll and the anonymous reviewer for providing helpful and constructive feedback which greatly improved the paper.
This research has been supported by the Australian Research Council's Special Research Initiative for Antarctic Gateway Partnership (project ID SR140300001) and the Australian Government's Co-operative Research Centres Programme through the Antarctic Climate and Ecosystems Co-operative Research Centre (ACE CRC). Lisa Craw is supported by an Australian Government Research Training Program Scholarship at the University of Tasmania. During this publication, Sue Cook received support from the Australian Government as part of the Antarctic Science Collaboration Initiative programme. Sheng Fan was supported by a University of Otago doctoral scholarship, an Antarctica New Zealand doctoral scholarship and University of Otago PERT (Polar Environment Research Theme) seed funding.
This paper was edited by Nanna Bjørnholt Karlsson and reviewed by Nicolas Stoll and one anonymous referee.
Alley, R. B.: Flow-law hypotheses for ice-sheet modeling, J. Glaciol., 38, 245–256, 1992. a
Avé Lallemant, H. G.: Subgrain rotation and dynamic recrystallisation of olivine, upper mantle diapirism, and extension of the Basin-and-Range province, Tectonophysics, 119, 89–117, 1985. a
Bachmann, F., Hielscher, R., and Schaeben, H.: Texture analysis with MTEX - Free and open source software toolbox, Solid State Phenomena, 160, 63–68, https://doi.org/10.4028/www.scientific.net/SSP.160.63, 2010. a, b
Bachmann, F., Hielscher, R., and Schaeben, H.: Grain detection from 2d and 3d EBSD data-Specification of the MTEX algorithm, Ultramicroscopy, 111, 1720–1733, https://doi.org/10.1016/j.ultramic.2011.08.002, 2011. a
Budd, W. F. and Jacka, T.: A review of ice rheology for ice sheet modelling, Cold Regions Science and Technology, 16, 107–144, 1989. a, b, c, d, e, f
Budd, W. F., Warner, R. C., Jacka, T. H., Li, J., and Treverrow, A.: Ice flow relations for stress and strain-rate components from combined shear and compression laboratory experiments, J. Glaciol., 59, 374–392, https://doi.org/10.3189/2013JoG12J106, 2013. a, b
Bunge, H.: Texture analysis in materials science, 2 Edn., Butterworths, London, https://doi.org/10.1016/0261-3069(83)90207-8, 1983. a
Castelnau, O., Shoji, H., Mangeney, A., Milsch, H., Duval, P., Miyamoto, A., Kawada, K., and Watanabe, O.: Anisotropic behavior of GRIP ices and flow in Central Greenland, Earth Planet. Sc. Lett., 154, 307–322, https://doi.org/10.1016/s0012-821x(97)00193-3, 1998. a, b
Craw, L., Qi, C., Prior, D. J., Goldsby, D. L., and Kim, D.: Mechanics and microstructure of deformed natural anisotropic ice, J. Struct. Geol., 115, 152–166, https://doi.org/10.1016/j.jsg.2018.07.014, 2018. a
Craw, L., Treverrow, A., Fan, S., and Peternell, M.: Mechanical and microstructural data from ice deformation experiments with a change in temperature partway, available at: https://data.aad.gov.au/metadata/records/AAS_4289_temp_change, last access: 26 October 2020. a
Cross, A. J., Prior, D. J., Stipp, M., and Kidder, S.: The recrystallized grain size piezometer for quartz: An EBSD-based calibration, Geophys. Res. Lett., 44, 6667–6674, https://doi.org/10.1002/2017GL073836, 2017. a
Dahl-Jensen, D., Thorsteinsson, T., Alley, R., and Shoji, H.: Flow properties of the ice from the Greenland Ice Core Project ice core: The reason for folds?, J. Geophys. Res., 102, 26831–26840, 1997. a
De La Chapelle, S., Castelnau, O., Lipenkov, V., and Duval, P.: Dynamic recrystallization and texture development in ice as revealed by the study of deep ice cores in Antarctica and Greenland, J. Geophys. Res.-Sol. Ea., 103, 5091–5105, https://doi.org/10.1029/97jb02621, 1998. a
Durham, W. B., Prieto-Ballesteros, O., Goldsby, D. L., and Kargel, J. S.: Rheological and thermal properties of icy materials, Space Sci. Rev., 153, 273–298, https://doi.org/10.1007/s11214-009-9619-1, 2010. a
Duval, P., Ashby, M. F., and Anderman, I.: Rate-controlling processes in the creep of polycrystalline ice, J. Phys. Chem., 87, 4066–4074, https://doi.org/10.1021/j100244a014, 1983. a
Faria, S. H., Weikusat, I., and Azuma, N.: The microstructure of polar ice, Part II: State of the art, J. Struct. Geol., 61, 21–49, https://doi.org/10.1016/j.jsg.2013.11.003, 2014. a
Gao, X. Q. and Jacka, T. H.: Approach To Similar Tertiary Creep Rates for Antarctic Core Ice and Laboratory Prepared Ice, Journal de Physique (Paris), Colloque, 48, 289–296, https://doi.org/10.1051/jphyscol:1987141, 1987. a, b, c, d, e
Glen, J. W.: Experiments on the Deformation of Ice, J. Glaciol., 2, 111–114, https://doi.org/10.1017/s0022143000034067, 1952. a
Glen, J. W.: The creep of polycrystalline ice, Proceedings of the Royal Society of London, Series A, Mathematical and Physical Sciences, 228, 519–538, https://doi.org/10.1098/rspa.1955.0066, 1955. a
Goldsby, D. L. and Kohlstedt, D.: Superplastic deformation of ice: experimental observations, J. Geophys. Res., 106, 11017–11030, 2001. a
Graham, F. S., Morlighem, M., Warner, R. C., and Treverrow, A.: Implementing an empirical scalar constitutive relation for ice with flow-induced polycrystalline anisotropy in large-scale ice sheet models, The Cryosphere, 12, 1047–1067, https://doi.org/10.5194/tc-12-1047-2018, 2018. a, b
Greve, R. and Blatter, H.: Dynamics of Ice Sheets and Glaciers, Springer, Berlin, 109 pp., 2009. a
Hammes, D. M. and Peternell, M.: FAME: Software for analysing rock microstructures, Comput. Geosci., 90, 24–33, https://doi.org/10.1016/j.cageo.2016.02.010, 2016. a, b, c, d
Hammonds, K. and Baker, I.: The Effects of H2SO4 on the Mechanical Behavior and Microstructural Evolution of Polycrystalline Ice, J. Geophys. Res.-Earth, 123, 535–556, https://doi.org/10.1002/2017JF004335, 2018. a
Harland, S. R., Kendall, J. M., Stuart, G. W., Lloyd, G. E., Baird, A. F., Smith, A. M., Pritchard, H. D., and Brisbourne, A. M.: Deformation in Rutford Ice Stream, West Antarctica: Measuring shear-wave anisotropy from icequakes, Ann. Glaciol., 54, 105–114, https://doi.org/10.3189/2013AoG64A033, 2013. a
Hirth, G. and Tullis, J.: Dislocation creep regimes in quartz aggregates, J. Struct. Geol., 14, 145–159, https://doi.org/10.1016/0191-8141(92)90053-Y, 1992. a
Jacka, T. H.: The time and strain required for development of minimum strain rates in ice, Cold Regions Science and Technology, 8, 261–268, https://doi.org/10.1016/0165-232X(84)90057-0, 1984. a, b, c
Jacka, T. H. and Jun, L.: The steady-state crystal size of deforming ice, Ann. Glaciol., 20, 13–18, https://doi.org/10.1017/s0260305500016165, 1994. a, b
Jacka, T. H. and Jun, L.: Flow rates and crystal orientation fabrics in compression of polycrystalline ice at low temperatures and stresses, edited by: Hondoh, T., Physics of Ice Core Records, Sapporo: Hokkaido University Press., 83–102, 2000. a
Jun, L., Jacka, T. H., and Budd, W. F.: Deformation rates in combined compression and shear for ice which is initially isotropic and after the development of strong anisotropy, Ann. Glaciol., 23, 247–252, https://doi.org/10.1017/s0260305500013501, 1996. a
Kamb, B.: Experimental Recrystallization of Ice Under Stress, Flow and Fracture of Rocks, American Geophysical Union Geophysical Monograph, 16, 211–241, https://doi.org/10.1029/gm016p0211, 1972. a, b, c
Kilian, R. and Heilbronner, R.: Analysis of crystallographic preferred orientations of experimentally deformed Black Hills Quartzite, Solid Earth, 8, 1095–1117, https://doi.org/10.5194/se-8-1095-2017, 2017. a
Köpping, J., Peternell, M., Prelević, D., and Rutte, D.: Cretaceous tectonic evolution of the Sava-Klepa Massif, Republic of North Macedonia – Results from calcite twin based automated paleostress analysis, Tectonophysics, 758, 44–54, https://doi.org/10.1016/j.tecto.2019.03.010, 2019. a
Little, T. A., Prior, D. J., Toy, V. G., and Lindroos, Z. R.: The link between strength of lattice preferred orientation, second phase content and grain boundary migration: A case study from the Alpine Fault zone, New Zealand, J. Struct. Geol., 81, 59–77, https://doi.org/10.1016/j.jsg.2015.09.004, 2015. a
Mainprice, D., Bachmann, F., Hielscher, R., and Schaeben, H.: Descriptive tools for the analysis of texture projects with large datasets using MTEX: Strength, symmetry and components, Geological Society Special Publication, 409, 251–271, https://doi.org/10.1144/SP409.8, 2015. a, b
Montagnat, M., Chauve, T., Barou, F., Tommasi, A., Beausir, B., and Fressengeas, C.: Analysis of dynamic recrystallization of ice from EBSD orientation mapping, Front. Earth Sci., 3, 1–13, https://doi.org/10.3389/feart.2015.00081, 2015. a, b, c, d, e, f, g
Nye, J. F.: The flow law of ice from measurements in glacier tunnels, laboratory experiments and the Jungfraufirn borehole experiment, Proceedings of the Royal Society of London, Series A, Mathematical and Physical Sciences, 219, 477–489, https://doi.org/10.1098/rspa.1953.0161, 1953. a, b
Peternell, M. and Wilson, C. J.: Effect of strain rate cycling on microstructures and crystallographic preferred orientation during high-temperature creep, Geology, 44, 279–282, https://doi.org/10.1130/G37521.1, 2016. a
Peternell, M., Kohlmann, F., Wilson, C. J., Seiler, C., and Gleadow, A. J.: A new approach to crystallographic orientation measurement for apatite fission track analysis: Effects of crystal morphology and implications for automation, Chem. Geol., 265, 527–539, https://doi.org/10.1016/j.chemgeo.2009.05.021, 2009. a
Peternell, M., Hasalová, P., Wilson, C. J., Piazolo, S., and Schulmann, K.: Evaluating quartz crystallographic preferred orientations and the role of deformation partitioning using EBSD and fabric analyser techniques, J. Struct. Geol., 32, 803–817, https://doi.org/10.1016/j.jsg.2010.05.007, 2010. a
Peternell, M., Dierckx, M., Wilson, C. J., and Piazolo, S.: Quantification of the microstructural evolution of polycrystalline fabrics using FAME: Application to in situ deformation of ice, J. Struct. Geol., 61, 109–122, https://doi.org/10.1016/j.jsg.2013.05.005, 2014. a, b, c
Peternell, M., Wilson, C. J., and Hammes, D. M.: Strain rate dependence for evolution of steady state grain sizes: Insights from high-strain experiments on ice, Earth Planet. Sc. Lett., 506, 168–174, https://doi.org/10.1016/j.epsl.2018.10.037, 2019. a
Piazolo, S., Wilson, C. J., Luzin, V., Brouzet, C., and Peternell, M.: Dynamics of ice mass deformation: Linking processes to rheology, texture, and microstructure, Geochem. Geophys., Geosys., 14, 4185–4194, https://doi.org/10.1002/ggge.20246, 2013. a, b
Prior, D. J., Lilly, K., Seidemann, M., Vaughan, M., Becroft, L., Easingwood, R., Diebold, S., Obbard, R., Daghlian, C., Baker, I., Caswell, T., Golding, N., Goldsby, D., Durham, W. B., Piazolo, S., and Wilson, C. J.: Making EBSD on water ice routine, J.Microscopy, 259, 237–256, https://doi.org/10.1111/jmi.12258, 2015. a
Qi, C., Goldsby, D. L., and Prior, D. J.: The down-stress transition from cluster to cone fabrics in experimentally deformed ice, Earth Planet. Sc. Lett., 471, 136–147, https://doi.org/10.1016/j.epsl.2017.05.008, 2017. a, b, c, d, e, f
Qi, C., Prior, D. J., Craw, L., Fan, S., Llorens, M.-G., Griera, A., Negrini, M., Bons, P. D., and Goldsby, D. L.: Crystallographic preferred orientations of ice deformed in direct-shear experiments at low temperatures, The Cryosphere, 13, 351–371, https://doi.org/10.5194/tc-13-351-2019, 2019. a
Rodrigues, B. C., Peternell, M., Moura, A., Schwindinger, M., and Pamplona, J.: P-T path development derived from shearband boudin microstructure, J. Struct. Geol., 90, 95–110, https://doi.org/10.1016/j.jsg.2016.07.004, 2016. a
Russell-Head, D. S. and Budd, W. F.: Ice-sheet flow properties derived from bore-hole shear measurements combined with ice-core studies, J. Glaciol., 24, 117–130, https://doi.org/10.1017/S0022143000014684, 1979. a, b
Stipp, M., Stünitz, H., Heilbronner, R., and Schmid, S. M.: The eastern Tonale fault zone: A “natural laboratory” for crystal plastic deformation of quartz over a temperature range from 250 to 700 ∘C, J. Struct. Geol., 24, 1861–1884, https://doi.org/10.1016/S0191-8141(02)00035-4, 2002. a, b
Stipp, M., Tullis, J., Scherwath, M., and Behrmann, J. H.: A new perspective on paleopiezometry: Dynamically recrystallized grain size distributions indicate mechanism changes, Geology, 38, 759–762, https://doi.org/10.1130/G31162.1, 2010. a, b
Treverrow, A.: The flow of polycrystalline anisotropic ice: laboratory and model studies, PhD thesis, University of Tasmania, 2009. a, b
Treverrow, A., Budd, W. F., Jacka, T. H., and Warner, R. C.: The tertiary creep of polycrystalline ice: Experimental evidence for stress-dependent levels of strain-rate enhancement, J. Glaciol., 58, 301–314, https://doi.org/10.3189/2012JoG11J149, 2012. a, b, c, d, e, f
Vaughan, M. J.: Creep behaviour, elastic, and anelastic properties of polycrystalline ice, PhD thesis, University of Otago, 2016. a, b, c
Wilson, C. J. and Peternell, M.: Ice deformed in compression and simple shear: Control of temperature and initial fabric, J. Glaciol., 58, 11–22, https://doi.org/10.3189/2012JoG11J065, 2012. a
Wilson, C. J., Russell-Head, D. S., and Sim, H. M.: The application of an automated fabric analyzer system to the textural evolution of folded ice layers in shear zones, Ann. Glaciol., 37, 7–17, https://doi.org/10.3189/172756403781815401, 2003. a
Wilson, C. J., Russell-Head, D. S., Kunze, K., and Viola, G.: The analysis of quartz c-axis fabrics using a modified optical microscope, J. Microscopy, 227, 30–41, https://doi.org/10.1111/j.1365-2818.2007.01784.x, 2007. a
Wilson, C. J., Peternell, M., Piazolo, S., and Luzin, V.: Microstructure and fabric development in ice: Lessons learned from in situ experiments and implications for understanding rock evolution, J. Struct. Geol., 61, 50–77, https://doi.org/10.1016/j.jsg.2013.05.006, 2014. a, b, c, d, e
Zibra, I., Korhonen, F. J., Peternell, M., Weinberg, R. F., Romano, S. S., Braga, R., De Paoli, M. C., and Roberts, M.: On thrusting, regional unconformities and exhumation of high-grade greenstones in Neoarchean orogens. The case of the Waroonga Shear Zone, Yilgarn Craton, Tectonophysics, 712, 362–395, https://doi.org/10.1016/j.tecto.2017.05.017, 2017. a