the Creative Commons Attribution 4.0 License.
the Creative Commons Attribution 4.0 License.
 | 05 May 2021
Atmospheric extremes caused high oceanward sea surface slope triggering the biggest calving event in more than 50 years at the Amery Ice Shelf
Kyle S. Mattingly
Stef Lhermitte
Marouane Temimi
Petra Heil
Ice shelf instability is one of the main sources of uncertainty in Antarctica's contribution to future sea level rise. Calving events play a crucial role in ice shelf weakening but remain unpredictable, and their governing processes are still poorly understood. In this study, we analyze the unexpected September 2019 calving event from the Amery Ice Shelf, the largest since 1963 and which occurred almost a decade earlier than expected, to better understand the role of the atmosphere in calving. We find that atmospheric extremes provided a deterministic role in this event. A series of anomalously deep and stationary explosive twin polar cyclones over the Cooperation and Davis seas generated tides and wind-driven ocean slope, leading to fracture amplification along the pre-existing rift and ultimately calving of the massive iceberg. The calving was triggered by high oceanward sea surface slopes produced by the storms. The observed record-anomalous atmospheric conditions were promoted by blocking ridges and Antarctic-wide anomalous poleward transport of heat and moisture. Blocking highs helped in (i) directing moist and warm air masses towards the ice shelf and (ii) maintaining the observed extreme cyclones stationary at the front of the ice shelf for several days. Accumulation of cold air over the ice sheet, due to the blocking highs, led to the formation of an intense cold high pressure over the ice sheet, which helped fuel sustained anomalously deep cyclones via increased baroclinicity. Our results stress the importance of atmospheric extremes in ice shelf dynamics via tides and sea surface slope and its need to be accounted for when considering Antarctic ice shelf variability and contribution to sea level, especially given that more of these extremes are predicted under a warmer climate.
Please read the corrigendum first before continuing.
-
Notice on corrigendum
The requested paper has a corresponding corrigendum published. Please read the corrigendum first before downloading the article.
-
Article
(27103 KB)
-
The requested paper has a corresponding corrigendum published. Please read the corrigendum first before downloading the article.
- Article
(27103 KB) - Full-text XML
- Corrigendum
- BibTeX
- EndNote


The rapid collapse of several Antarctic ice shelves, observed recently, and the near-instantaneous acceleration of land ice discharge into the ocean that follows the collapse demonstrate the sensitivity of the Antarctic cryosphere to recent warming (e.g., Smith et al., 2019; Rignot et al., 2019). However, large uncertainty remains regarding the response of ice shelves to the globally rising temperatures and to the resulting changes in the atmospheric circulation.
On 25 September 2019, the Amery Ice Shelf – the third-largest ice shelf in Antarctica – calved iceberg D28 (1636 km2, 210 m thick), which was the largest calving event since the early 1960s (Fig. 1). The Amery Ice Shelf is a key drainage channel in East Antarctica (Fricker et al., 2002), draining roughly 16 % of the East Antarctic Ice Sheet (Galton-Fenzi et al., 2012). It is in balance with its surroundings (King et al., 2009; Galton-Fenzi et al., 2012; Li et al., 2020), despite experiencing strong surface melt in summer. However, over the past 20 years, a large system of rifts (a precursor to calving) in the Amery Ice Shelf, known as the Loose Tooth rift system, has been developing (Fricker et al., 2005; Bassis et al., 2008; Darji et al., 2018). Recent studies have shown that the propagation rate of the rifts has been decreasing since 2005 due to increasing thickness of melange ice filling in the rifts and speculated that forward propagation of the western rift might even stop (e.g., Zhao et al., 2013). Satellite images of the Amery Ice Shelf (Fig. 1) show the largest rift extending in the same direction of the ice flow, widening toward the edge of the ice shelf and from this main rift, with radial rifts extending to the west (T1) and east (T2). Earlier studies predicted that the Amery Ice Shelf would not experience a major calving until around 2025 or later (e.g., Fricker et al., 2002) and that the portion that was expected to calve first was T2, i.e., the one to the east of the current calving. This highlights the need for an improved understanding of the underlying processes of calving events and the role of atmospheric forcing as a trigger for ice shelf calving.

Figure 1MODIS satellite visible imagery of the Amery Ice Shelf and the Loose Tooth rift system (T1 and T2) at its front. Ice conditions are shown before the calving on 17 and 23 September 2019, during the calving on 25 September 2019, and few days after the detachment of the new iceberg, D28. Image credit: NASA Worldview.
Indeed, most of the mass loss from the Antarctic Ice Sheet – the largest uncertainty for future sea level projections – takes place at the fronts of ice shelves and glacier tongues, via iceberg calving and surface and basal melt (e.g., Pritchard et al., 2012; Shepherd et al., 2018). Compared to melting, rifting and subsequent calving are the fastest way by which marine-terminating glaciers lose mass to the ocean and contribute therefore to sea level rise (e.g., Smith et al., 2019). Despite being floating ice (i.e., changes in their mass due to calving do not have a direct contribution to sea level rise), ice shelves in general act to buttress inland ice by blocking the flow of ice from the interior (Scambos et al., 2008). This restrictive force decreases when ice shelves thin or calve. For example, on the Antarctic Peninsula, such events have been shown to increase 8-fold the rate of ice flow inland (Rignot et al., 2004; Scambos et al., 2004, 2014). This leads to more ice discharge into the oceans and a consequent increase in the ice sheet contribution to global sea level rise (Hogg and Gudmundsson, 2017). Ocean-driven thinning was also detected at key ice shelves of the East Antarctic Ice Sheet including the Amery Ice Shelf (Greenbaum et al., 2015; Smith et al., 2019), suggesting that this region is also susceptible to rapid and large-scale ice loss (Aitken et al., 2016) and could contribute to future sea level rise (DeConto et al., 2016; Rignot et al., 2019). Therefore, there is a need to assess the sensitivity of East Antarctic ice shelves to atmospheric forcing and to understand the calving processes and their triggers in order to be able to model the future evolution of ice shelves.
Beyond being part of a natural glaciological process, calving events at Antarctic ice shelves have been attracting much attention recently (e.g., Liu et al., 2015; Benn and Astrom 2018), as they were found to trigger, in some cases, the total disintegration of the parent ice shelf (Cook and Vaughan 2010; Liu et al., 2015; Jeong et al., 2016; Bassis and Ma, 2015; Massom et al., 2018). These events have been attributed mainly to an enhanced regional warming (Vaughan et al., 2012; Pitchard et al., 2012), which increases surface and basal melt, as well as to ocean forcing involving intense crevassing and rifting along multiple lines of weakness, such as radial crevasses (Liu et al., 2015; Jeong et al., 2016; Bassis and Ma, 2015); to earthquakes and tsunamis (Brunt et al., 2011); and to regional loss of pack ice in the shelf-front area, which allows storm-generated ocean swell to flex the outer margins of the shelves and lead to their calving (Massom et al., 2018). However, atmospheric-dynamics forcing during calving events, particularly the wind mechanical action on rift widening via wind-induced tides and ocean slope, remains unexplored, and this is the objective of this study.
Of particular importance is the impact on Antarctic ice shelves of the poleward shift of extratropical storm tracks (Tamarin and Kaspi, 2017) and the observed increase in the number and intensity of cyclones around Antarctica over the last few decades (Rudeva et al., 2015; Wei and Qin 2016). The poleward shift of extratropical cyclones was found in reanalysis data of recent years (Fyfe, 2003; Son et al., 2008), and models (e.g., Neu et al., 2013) project an estimated poleward shift of cyclone genesis 1 to 2∘ in latitude on average under enhanced greenhouse gas concentrations (Bengtsson et al., 2009; Barnes and Polvani, 2013). Importantly, this poleward shift was found to be particularly pronounced in the Southern Hemisphere (Pezza et al., 2007; Chang et al., 2012), and the mean intensity of cyclones and the number of extreme cyclones are projected to increase under a warmer climate scenario (Lambert and Fyfe, 2006; Ulbrich et al., 2013; Chang, 2017).
Changes in cyclone tracks, numbers and intensity may have significant impacts on Antarctic sea ice and land ice (e.g., Uotila et al., 2011). In fact, weather systems (i.e., cyclones and blocks) resulting from the larger-scale circulation (e.g., Pope et al., 2017) are identified as the main driver of the observed trends in sea ice variability (Matear et al., 2015; Schemm, 2018; Turner et al., 2017; Eayrs et al., 2019). Furthermore, cyclones and their associated atmospheric rivers can induce sea ice melt (Francis et al., 2020) and ice shelf surface melt (Wille et al., 2019) by virtue of their associated anomalous moisture and heat transport to high latitudes which increase the downward longwave radiation at the ice surface (Woods and Caballero, 2016; Lee et al., 2017; Grieger et al., 2018; Francis et al., 2020). Additionally, cyclones can cause significant sea ice drift (Kwok et al., 2017; Francis et al., 2019a) due to the strong surface winds they carry (Schemm, 2018). Severe storms can generate energetic waves (up to 8 m) in the Southern Ocean capable of penetrating hundreds of kilometers into the sea-ice-covered ocean (Kohout et al., 2014; Vichi et al., 2019; Squire, 2020). Concomitantly, the sea ice cover acts as a buffer and attenuates the wave energy over distance (wave amplitude is reduced by several orders of magnitude within 10 km of the sea ice edge), reducing therefore the impact of storms on ice shelves (Dolatshah et al., 2018; Massom et al., 2018).
An extreme situation in cyclogenesis is the formation of explosive cyclones. These are developing cyclones for which the central pressure decreases by at least 24 hPa in 24 h (Sanders and Gyakum, 1980). Explosively developing cyclones are deeper and longer-lasting compared to ordinary cyclones, and they are found to be more intense in the Southern Hemisphere than in the Northern Hemisphere (Reale et al., 2019). In particular, explosive cyclones in the Indian Ocean sector of the Southern Ocean (close to South Africa) are stronger and express higher deepening rates than elsewhere around Antarctica (Reale et al., 2019). This same region (between 45 and 90∘ E and poleward of 40∘ S) – encompassing the Amery Basin – stands out in a climatological study (Allen et al., 2010) as one of three main regions for explosive cyclogenesis around Antarctica, where explosive cyclones are characterized by a 20 hPa mean pressure depth relative to the surrounding pressure field. A climatological study of explosive cyclones (Lim and Simmonds, 2002) found that the number of explosive cyclones increased in both hemispheres during 1979–1999 and that positive trends of such systems are statistically significant in the Southern Hemisphere. On average, the study identified 26 explosive cyclones per year in the Southern Hemisphere and found that explosive cyclones exhibit greater mean intensity and depth relative to the entire population of ordinary cyclonic systems. A more recent climatological study over a longer period (1979–2013) reported similar findings, with an increase in the frequency of explosive cyclones in the band of 45–55∘ S during winter and early spring (Wei and Qin, 2016).
The spatial distribution of these cyclones was found to have a close association with that of strong baroclinicity. In general, the preferred region for cyclogenesis is where both a strong temperature gradient and an upper-level trough are present (e.g., Shimada et al., 2014). While high baroclinic instability associated with the horizontal temperature gradient is crucial for the formation and the intensification of cyclones (Davies, 1997; Uccellini, 1990), cyclogenesis occurs only at the entrance and exit regions of upper-level troughs (e.g., Shimada et al., 2014). Around Antarctica, the strongest temperature gradient is found during late winter and early spring along the fringes of the ice pack, making the sea ice edge a preferred region for cyclogenesis (e.g., Schlosser et al., 2011; Stoll et al., 2018). However, the location of the temperature gradient relative to the ice edge depends strongly on the atmospheric circulation at larger scale, where a strong temperature gradient can occur poleward of the ice edge (i.e., closer to the ice shelves) during an enhanced zonal wave number three (ZW3) pattern (Irving and Simmonds, 2015). This pattern is characterized by the alternation of three troughs and three ridges around Antarctica. Strong poleward transport of heat and moisture occurs in the ascending branch of troughs, and strong equatorward transport of cold air occurs in the descending branch of ridges (e.g., Raphael, 2007). This zonally alternating pattern of cold and warm air masses creates temperature differences between the different sectors, fuels frontogenesis, and promotes the development of explosive cyclones close to the ice shelves and over the sea ice cover.
Another aspect of the ZW3 pattern is the impact of the ridges on the propagation speed of the cyclones. In the troughs, the extratropical cyclones and the associated moisture and heat fluxes are directed poleward; once they reach the Antarctic coast they are blocked by the ridges to their east (Francis et al., 2019a, 2020). This results in stationary cyclones over the same region for 1–2 d, which in turn induces pronounced impact on the sea ice (e.g., Francis et al., 2019a) and waves (Vichi et al., 2019). The same scenario can happen at the front of ice shelves during winter–spring if the cyclones form closer to the coast and/or the sea ice extent decreases under a warmer climate. Interestingly, the Antarctic sea ice extent has been decreasing since 2015 (Swart et al., 2018), and the ZW3 index has been the most positive on record during the same period (Schlosser et al., 2018; Francis et al., 2019a). Increased warm-air advection toward Antarctica was found to be at the origin of the observed negative anomaly in Antarctic sea ice extent in recent years (Schlosser et al., 2018). Given the dual impact of ZW3 circulation on both explosive cyclogenesis (location and intensity) and sea ice extent, this combination may result in a more pronounced impact of extreme cyclones on ice shelves.
Another extreme situation in cyclogenesis is the formation of twin cyclones during which the resulting effect of the mutually interacting cyclones is twice as strong as the individual cyclones (e.g., Moustaoui et al., 2002). To our knowledge, the formation of explosively developing twin cyclones has been, to date, only observed and studied in the tropics (Ferreira et al., 1996; Moustaoui et al., 2002), in the mid latitudes (Yokoyama and Yamamoto, 2019) and in the Arctic (Renfrew et al., 1997). In this study, we report for the first time, the formation of polar twin cyclones near Antarctica during two consecutive events: one on 19–20 September 2019 at 60∘ E and the second on 23–24 September 2019 at 85∘ E.
Despite the observed poleward shift of extratropical cyclones, the increasing number and intensity of explosive cyclones around Antarctica and the decline in sea ice extent in recent years, the impact of extreme cyclones on ice shelves instability has not been investigated to date.
Building on previous studies that investigated these patterns separately, we aim in this study to assess the impact of extreme cyclone activity during the largest calving event since 1963 at the Amery Ice Shelf. Using satellite data and atmospheric reanalyses, we investigate the role of atmospheric forcings in this calving event which occurred under a ZW3-like situation. The development of the explosive cyclones and their impact on sea ice and land ice conditions are addressed in Sect. 2. Section 3 discusses our findings. The data and methods used in this study are described in Sect. 4.
2.1 Explosive twin cyclones during 18–22 September 2019 – preconditioning
In September 2019, the synoptic conditions exhibited an amplified zonal wave number 3 (ZW3) pattern characterized by three trough and ridge systems associated with anomalies of low/high mean sea level pressure (MSLP). Compared to all Septembers in the 1979–2019 period, the broad-scale MSLP anomaly indicates that, for September 2019, there was below-average pressure over much of the Antarctic continent and above-average pressure to the north (Fig. 2a). In the Indian Ocean sector, the MSLP anomalies exceeded 1 standard deviation from the mean over large areas with the strongest troughing over the Cooperation and Davis seas (Fig. 2a). To the west of this low-pressure anomaly, the South Atlantic ridge exhibited strong positive anomalies exceeding 2 standard deviations from the mean (Fig. 2a). To the east of the low-pressure anomaly around the Amery Ice Shelf, another pronounced ridge encompassing southern Australia and the Mawson Sea with positive MSLP anomalies exceeded 1 standard deviation from the climatological mean (Fig. 2a).
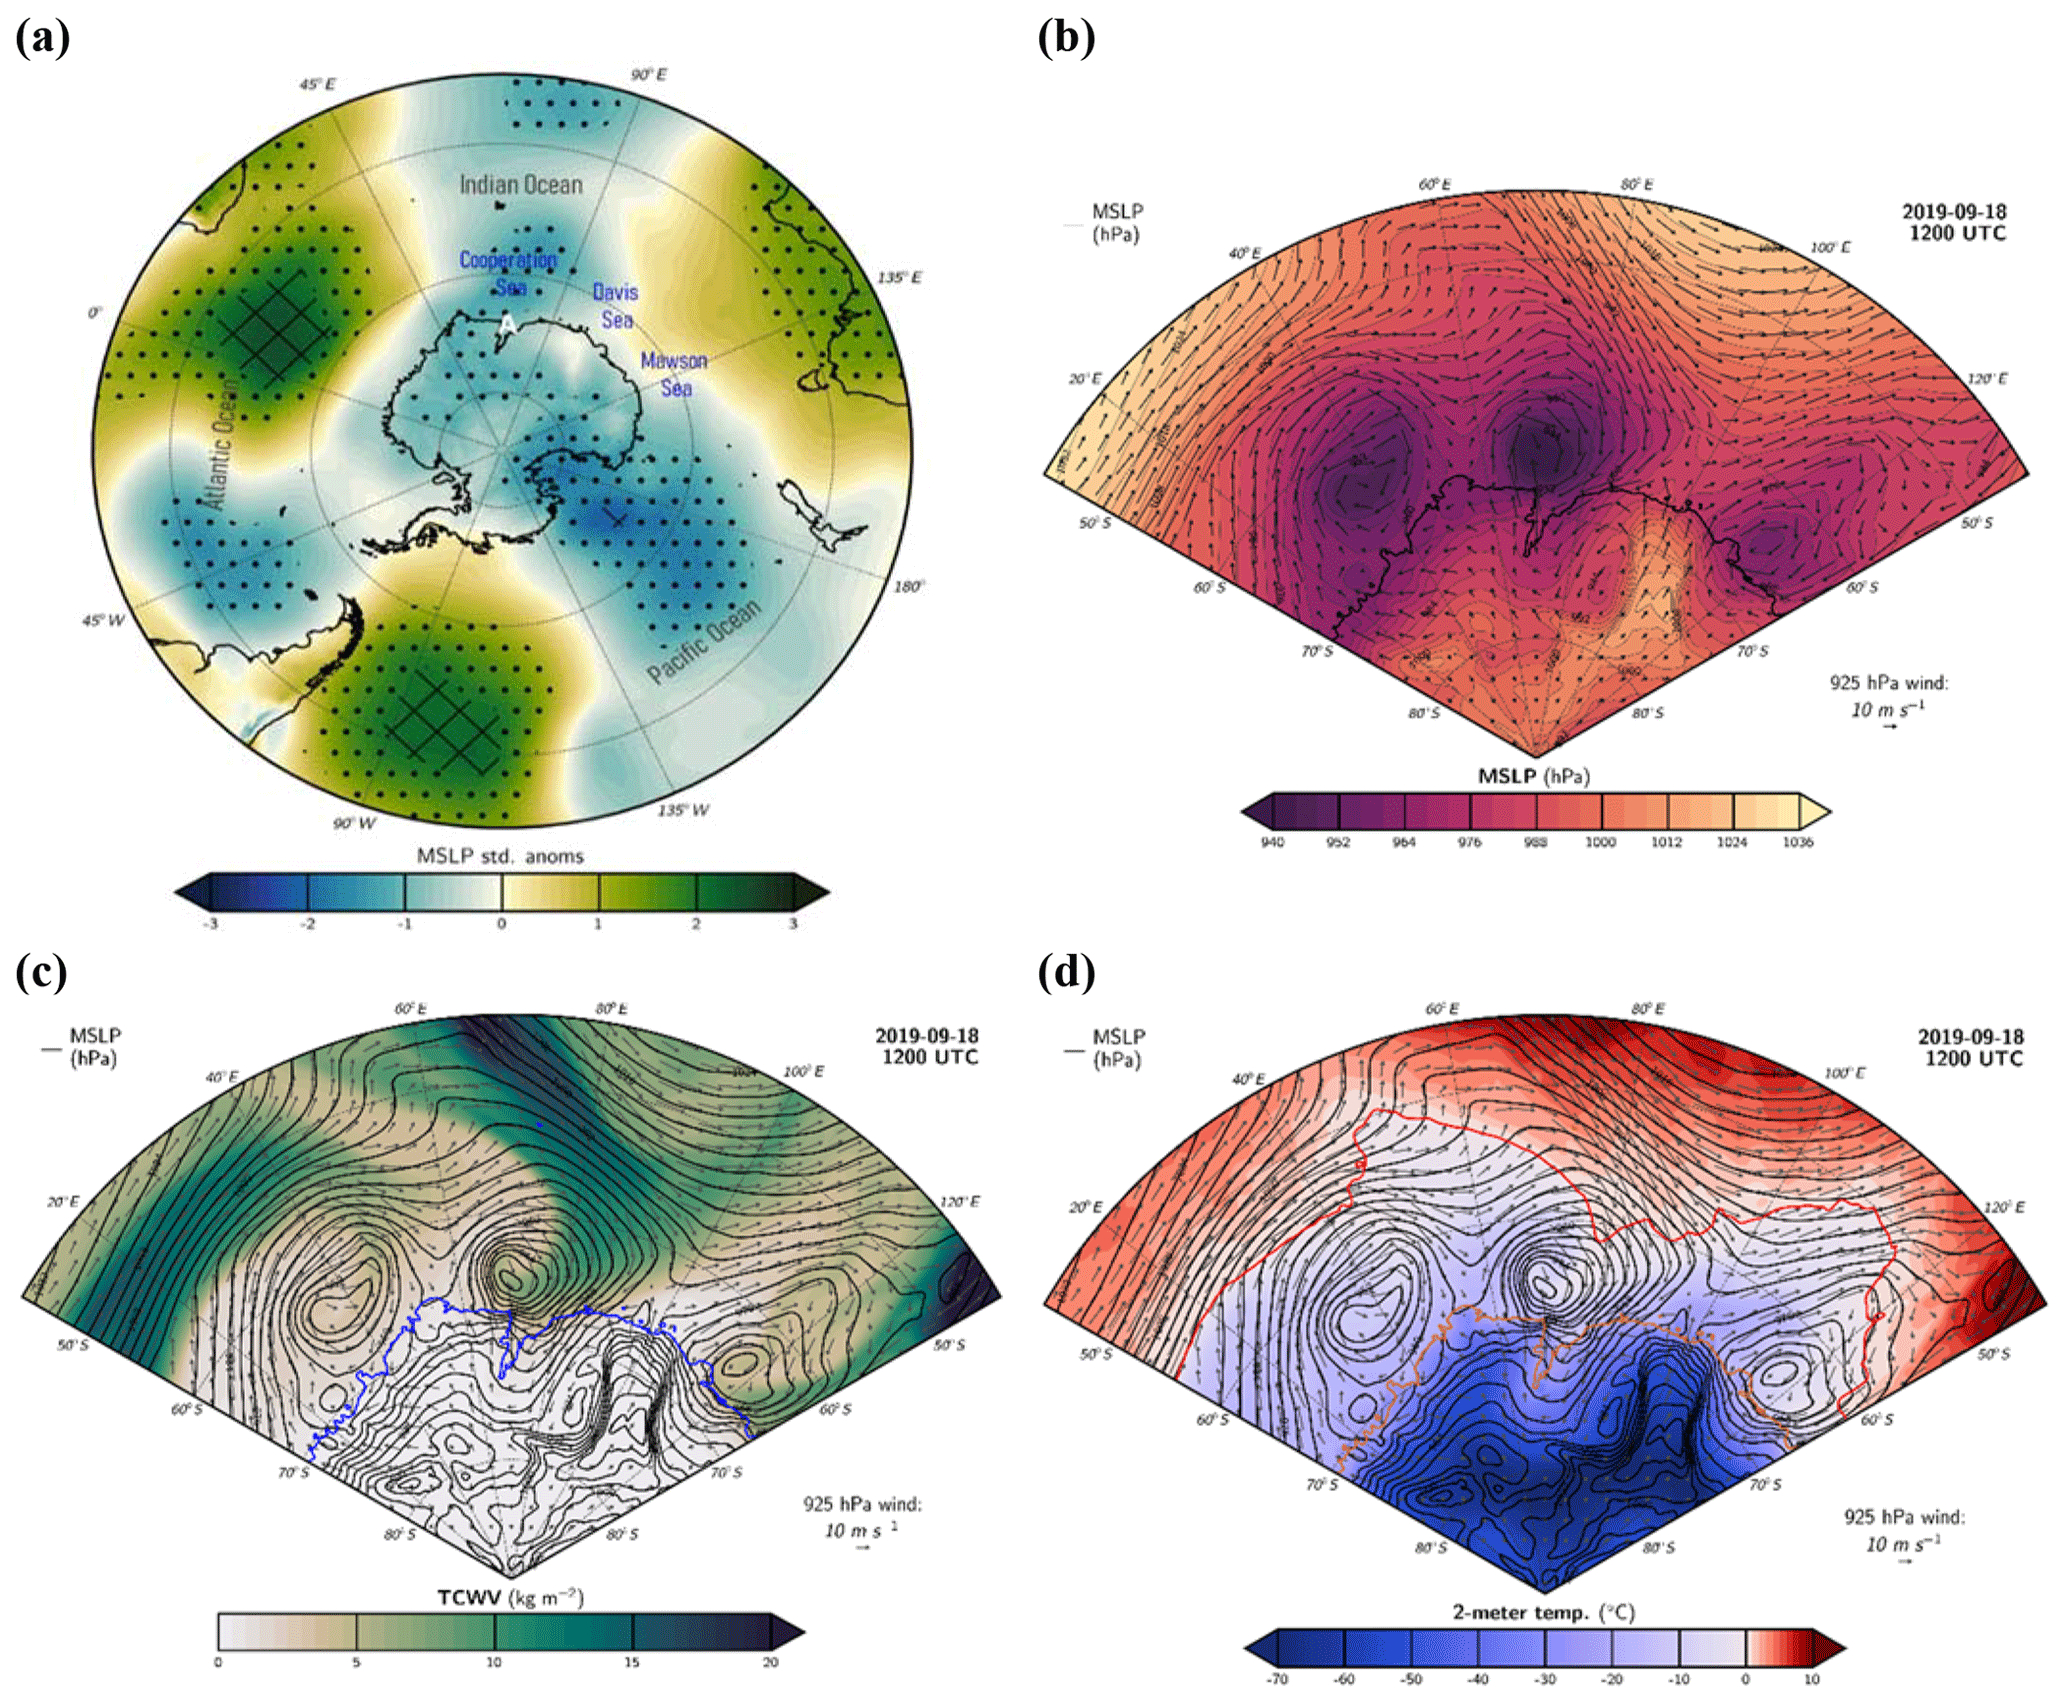
Figure 2Standardized anomalies (std. anoms) of mean sea level pressure (MSLP) for September 2019 relative to the 1979–2019 September climatology. Black dots are regions where the standardized anomalies are larger than 1 standard deviation from the mean, and black squares are regions where the normalized anomalies are larger than 2 standard deviations from the mean. The letter A in white indicates the location of the Amery Ice Shelf. (b) MSLP (shaded) and winds at 925 hPa (vectors) on 18 September 2019 at 12:00 UTC; (c) same as (b) but for the total column water vapor (TCWV) in colors, with winds at 925 hPa in vectors and MSLP in black contours; (d) same as (c) but for 2 m temperature (in colors), with winds at 925 hPa in vectors, MSLP in black contours and 0 ∘C contour in red. Please note that the date format used in this figure is year month day (yyyy-mm-dd).
On a daily scale, the aforementioned synoptic setting was synonym of frequent and extreme weather systems. On 17 September 2019 at 02:00 UTC, an extratropical cyclone associated with a 968 hPa low pressure at its center and located at 60∘ S, 40∘ E started to deepen while moving poleward and eastward. It reached the western side of Cooperation Sea on 18 September 2019 at 02:00 UTC with a 940 hPa minimum pressure and remained over this region the entire day (Fig. 2b); it then decayed on 19 September, with 980 hPa central pressure by 13:00 UTC. The rapid deepening of the low pressure is characteristic of explosive cyclones (e.g., Sanders and Gyakum, 1980). The explosive cyclone on 18 September 2019 was associated with significant poleward transport of moisture (Fig. 2c) and heat (Fig. 2d) carried by an atmospheric river propagating poleward adjacent to the low-pressure center. The atmospheric river was associated with integrated water vapor transport (IVT) greater than 500 kg m−1 s−1 at its core, with IVT values around 100 kg m−1 s−1 over Prydz Bay exceeding the 99th percentile of September climatology in this region (Fig. 3a). The moisture and heat carried by the atmospheric river over the ice sheet may have caused warming at the surface due to condensation (released heat) as well as an increase in downward longwave radiation (e.g., Francis et al., 2020).
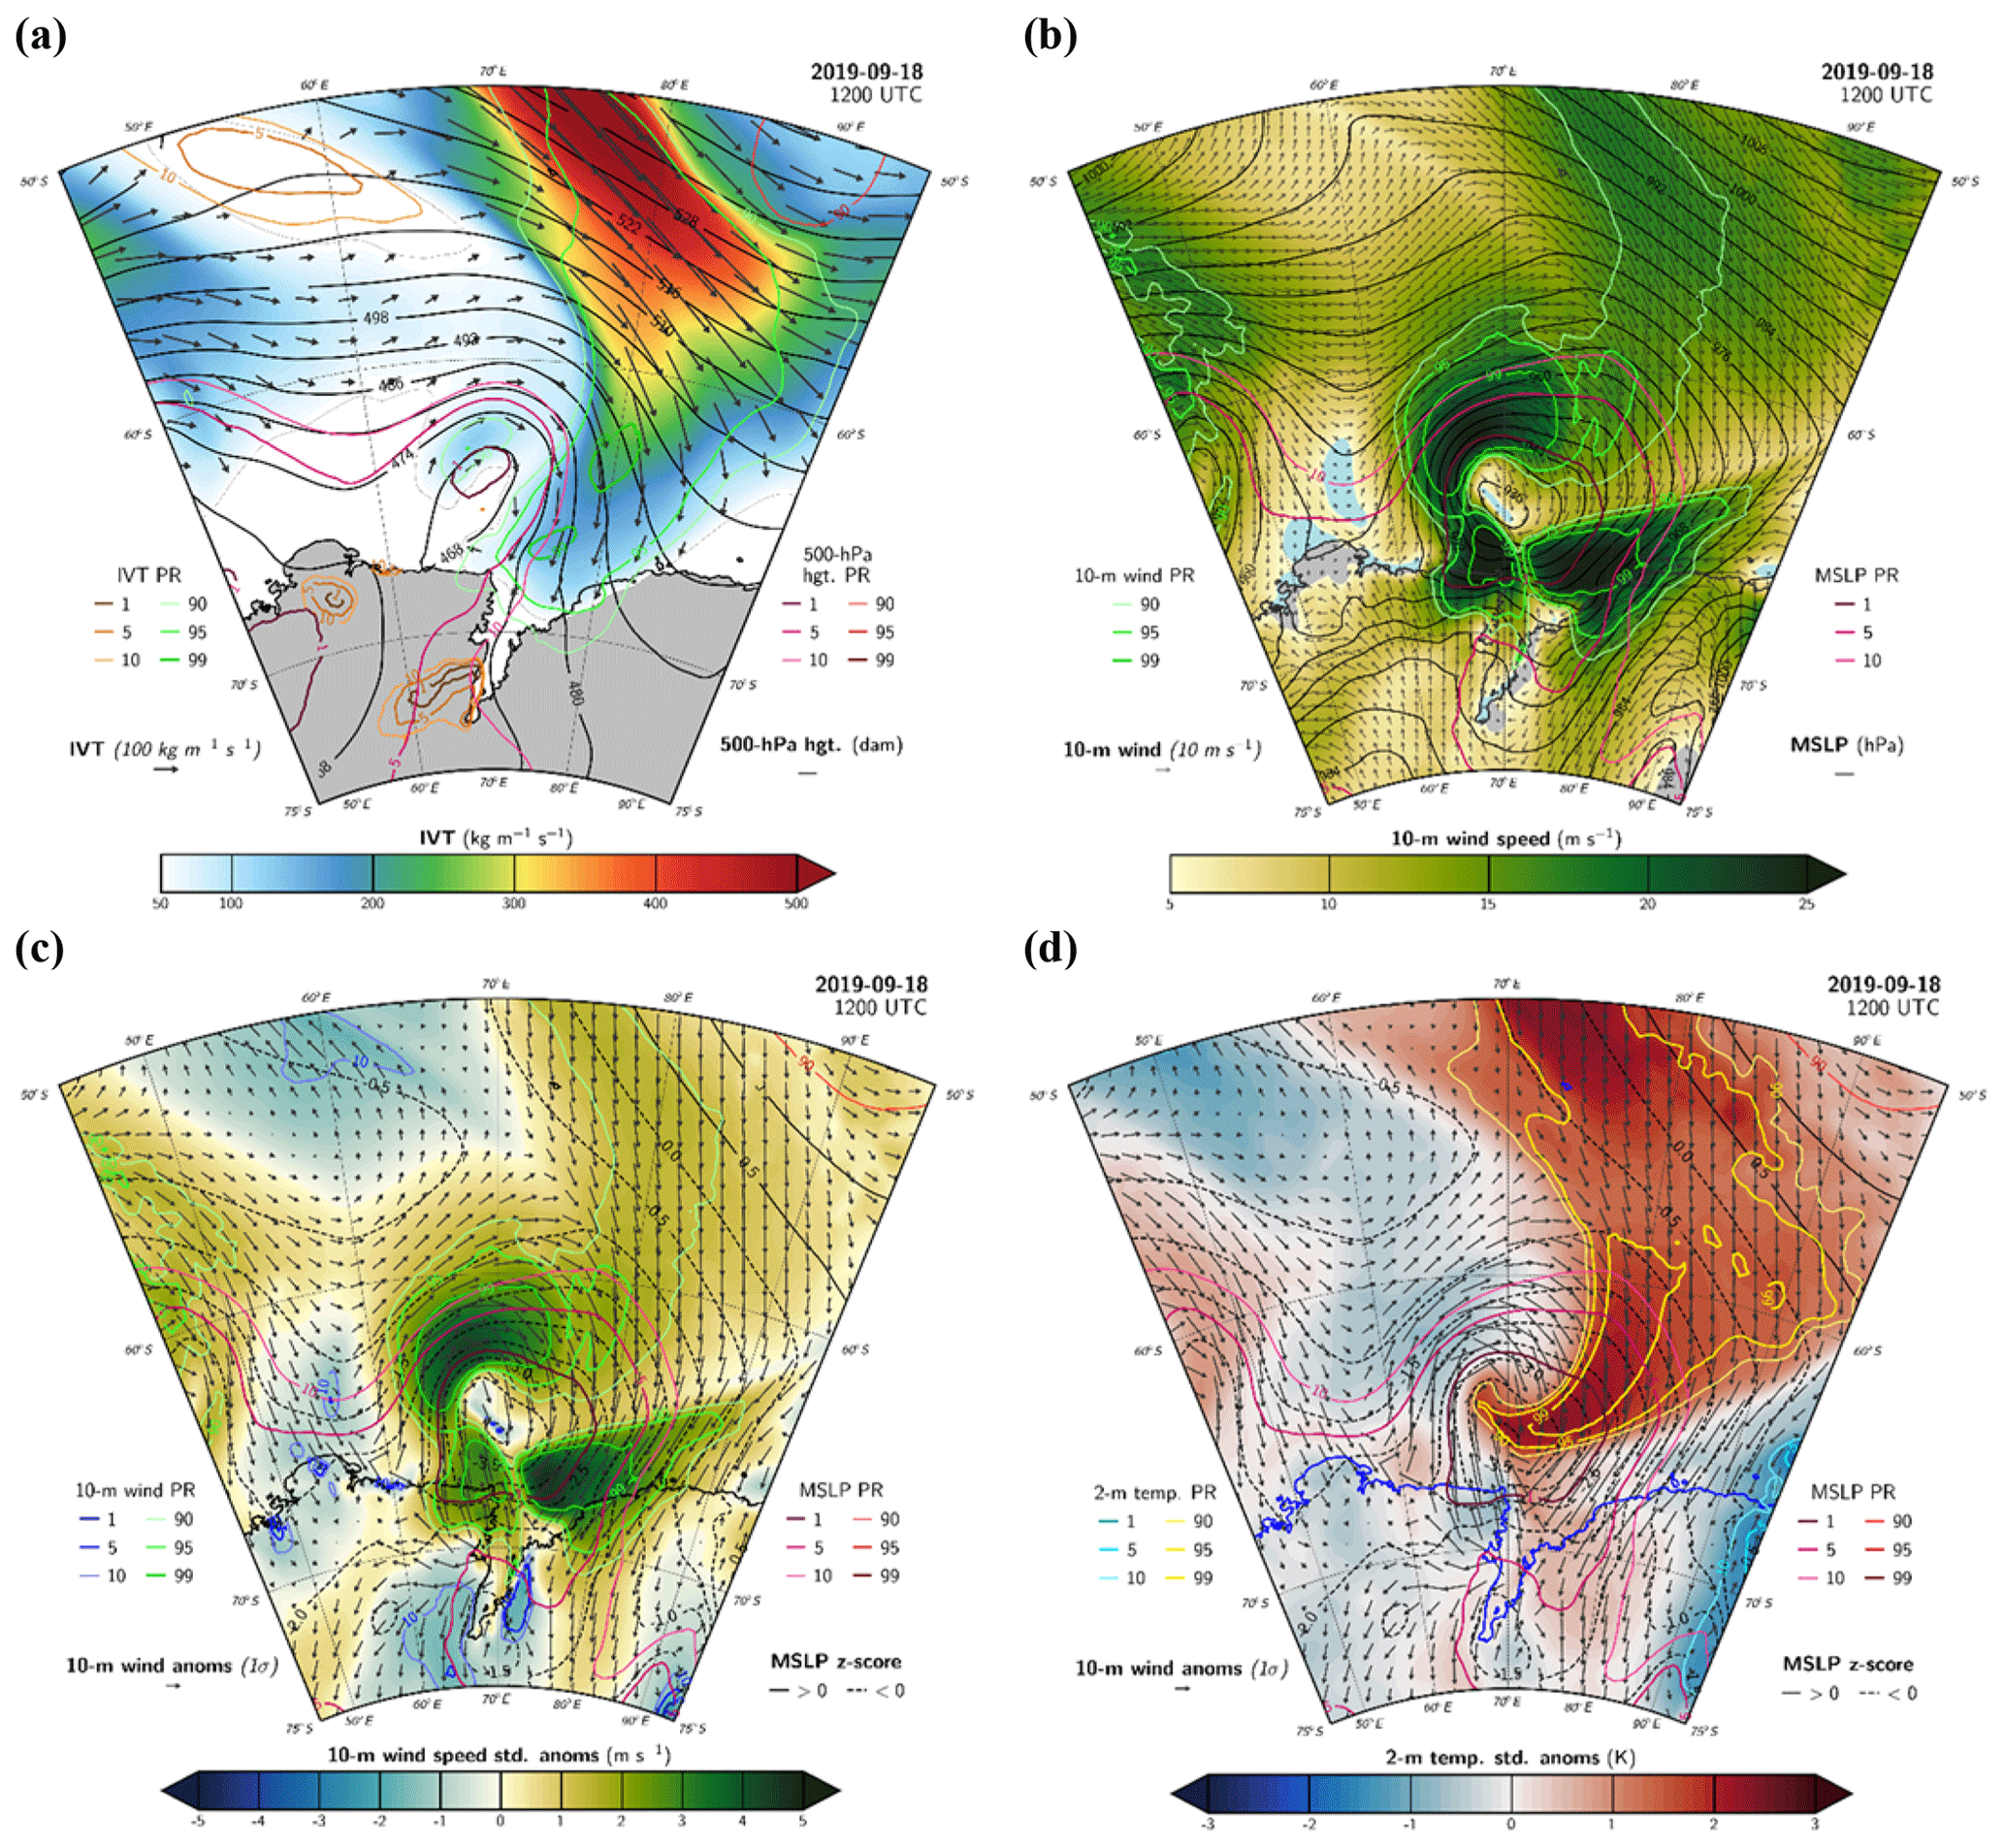
Figure 3Maps on 18 September 2019 at 12:00 UTC of (a) geopotential heights (hgt) shaded by integrated water vapor transport (IVT) at 500 hPa in black contours and IVT direction in black vectors; (b) 10 m wind speed in colors, with 10 m wind direction in black vectors and MSLP in black contours. (c) Standardized 10 m wind speed anomalies (wind speed std. anoms) relative to the full September record (1979–2019); (d) same as (c) but for 2 m temperature. Colored contour lines show percentile rank (PR) extremes (1st, 5th and 10th as well as 90th, 95th and 99th percentile ranks) of the corresponding quantities indicated on the plots. On (c) and (d): vectors show 10 m wind anomalies; black contours show positive MSLP anomalies; and dashed black contours show negative MSLP anomalies. Please note that the date format used in this figure is year month day (yyyy-mm-dd).
In the Southern Hemisphere, where cyclonic winds spin clockwise, the highest wind speed occurs along the bent-back front of the cyclone, i.e., to the west of the low-pressure center of the cyclone (e.g., Wagner et al., 2011; Watanabe and Niino, 2014). This was observed during the explosive cyclone on 18 September 2019 which generated extremely strong surface winds to the west of its center exceeding 20 m s−1 (Fig. 3b). Being stationary over Cooperation Sea but to the west of the Amery Basin, this extreme cyclone generated a sustained northeasterly wind stress over the northern part of the ice shelf (Fig. 3b), as well as strong poleward warm- and moist-air advection (Figs. 2c, d and 3a). The combination of warm temperatures brought by the cyclone/AR (atmospheric river) and strong easterly/northeasterly wind speeds was unusual (Fig. 3). MSLP anomalies during this event were in excess of −4 standard deviations (Fig. 3b), with MSLP values below the 1st percentile of September climatology over a large area along and to the north of the ice shelf margin (Fig. 3b). Extreme wind anomalies exceeding the 99th percentile over the central and eastern ice shelf margin were associated with this cyclone from 18 September through 19 September 2019 (Fig. 3c). Surface winds of 25 m s−1, relative to the 99th percentile (5 standard deviations above the climatological mean), were registered during this event (Fig. 3b and c). Likewise, there were sustained positive 2 m temperature anomalies throughout the period exceeding 2 standard deviations from the climatological mean (Fig. 3d).
The first explosive cyclone on 18 September 2019 was followed immediately by a second explosive cyclone which approached Cooperation Sea from the west on 19 September at 14:00 UTC with a deep low of 952 hPa. At 20:00 UTC, this deep cyclone widened and evolved into two twin polar cyclones over the same region (Fig. 4a). The twin cyclones exhibited 960 hPa low pressure at their respective centers and remained active to the west of the Amery Ice Shelf for 3 consecutive days (Fig. 4a). Their signatures dissipated in the pressure field on 22 September 2019 at 00:00 UTC. The poleward transport of heat (Fig. 4b) and moisture (Fig. 4c) towards the Amery Ice Shelf continued during this event together with extreme wind stress exceeding the 99th percentile (Fig. 4d). Being stationary to the west of the Amery Ice Shelf (Fig. 4a), the twin cyclones induced extreme easterly winds across the ice shelf, with u-wind anomalies exceeding −5 standard deviations of September climatology over the western ice shelf from 19 September 2019 at 19:00 UTC through 20 September at 11:00 UTC (Fig. 4d) and below the 1st percentile u-wind values over the whole lower ice shelf area (Fig. 4d). When compared with the climatology for all months during 1979–2019, many hourly wind speeds over the ice shelf front during 18–20 September were substantially greater than the 99th percentile of climatology, with the most anomalous wind speeds on 18 September (Fig. 6e).

Figure 4ERA5 reanalysis of (b) MSLP in colors and winds at 925 hPa in vectors on 19 September 2019 at 22:00 UTC; (b) 2 m temperature in colors, with winds at 925 hPa in vectors, MSLP in black contours and 0 ∘C contour in red on 19 September at 22:00 UTC; (c) total column water vapor (TCWV) in colors, with winds at 925 hPa in vectors and MSLP in black contours on 20 September 2019 at 00:00 UTC; (d) standardized anomalies (std. anoms) relative to the full record (1979–2019) of 10 m u-wind values on 20 September 2019 at 00:00 UTC. Vectors show 10 m wind anomalies; black contours show positive MSLP anomalies; and dashed black contours show negative MSLP anomalies. Colored contour lines show percentile rank (PR) extremes (1st, 5th and 10th as well as 90th, 95th and 99th percentile ranks) of the corresponding quantities indicated on the plots; (e) 2 m temperature in colors, with 10 m winds in vectors, MSLP in black contours and 0 ∘C contour in red dashed-line on 21 September at 06:00 UTC. (f) MODIS visible imagery on 21 September 2019; image credit: NASA Worldview. (g) Sentinel-3A and Sentinel-3B observations of wave height on 22 September 2019 at 00:00 UTC; image credit: ESA Ocean Virtual Laboratory. Please note that the date format used in this figure is year month day (yyyy-mm-dd).
On 21 September 2019, the twin cyclones merged and moved to the area in front of the Amery Ice Shelf (Fig. 4e), resulting in a deep cyclone associated with MSLP at its center below the 5th percentile. The remnant cyclone slowly moved along the northern margin of Prydz Bay and decayed on 22 September 2019. Anomalously warm air masses were brought by this cyclone over the margins of the Amery Ice Shelf exceeding the 90th percentile (Fig. 4e). MODIS satellite imagery on this day showed a swirling cyclone at the mouth of the Amery Ice Shelf (Fig. 4f). Sentinel-3A and Sentinel-3B observations on 22 September 2019 at 00:00 UTC (i.e., during the decay of the cyclones) show elevated sea surface at the ice shelf front area reaching 6 m significant wave height (Fig. 4g). Given the easterly direction of the winds associated with the storm during this episode, the observed elevation of sea surface indicates that storm tide occurred at the ice shelf front. Furthermore, waves and tides generated by the cyclones during the 18–21 September 2019 period, when easterly wind speeds were stronger, may have been substantially higher. Unfortunately, sentinel observations are not available during this period over the area of interest to check this.

Figure 5(a) MSLP in colors and winds at 925 hPa in vectors on 23 September 2019 at 00:00 UTC; (b) integrated water vapor transport (IVT) in colors, with geopotential heights (hgt. (gpm)) at 500 hPa in black contours and 1000–700 hPa mean winds in black vectors on 23 September 2019 at 00:00 UTC; (c) MSLP in colors and winds at 925 hPa in vectors on 24 September 2019 at 00:00 UTC; (d) total column water vapor (TCWV) in colors, with winds at 925 hPa in vectors, precipitation (precip.) rate in green contours and MSLP in black contours on 24 September 2019 at 00:00 UTC; (e) 2 m temperature in colors, with winds at 925 hPa in vectors, MSLP in black contours and 0 ∘C contour in red on 24 September at 00:00 UTC; (f) same as (e) but at 06:00 UTC. Please note that the date format used in this figure is year month day (yyyy-mm-dd).

Figure 6(a) Standardized anomalies (std. anoms) relative to the full September record (1979–2019) of 10 m wind speed (colors) on 23 September 2019 at 18:00 UTC. (b) Same as (a) but with the u component of 10 m wind as filled contours on 24 September 2019 at 00:00 UTC. Vectors show 10 m wind anomalies; black contours show positive MSLP anomalies; and dashed black contours show negative MSLP anomalies. Colored contour lines show percentile rank (PR) extremes (1st, 5th and 10th as well as 90th, 95th and 99th percentile ranks) of the corresponding quantities indicated on the plots. (c) Temperature at 2 m in colors, with winds at 925 hPa in vectors, MSLP in black contours and 0 ∘C contour on a red dashed line on 23 September at 21:00 UTC. (d)Wind speed at 10 m in colors, with 10 m wind direction in black vectors and MSLP in black contours on 24 September 2019 at 10:00 UTC. (e) Histogram showing the distribution of hourly 10 m wind speed for all months during 1979–2019, spatially averaged over 70–65∘ S and 70–75∘ E. The colored vertical lines correspond to hourly values during the 18–25 September 2019 period. Each given day in September 2019 has 24 hourly values plotted in the same color. Please note that the date format used in this figure is year month day (yyyy-mm-dd).
Surface melt during this event may have occurred briefly due to the anomalous warm and moist air masses. However, the inspection of daily satellite images of Sentinel-1 backscatter coefficient, MODIS ice surface temperature and AMSR2 (Advanced Microwave Scanning Radiometer 2) brightness temperature did not show any prolonged nor significant surface melt at the Amery Ice Shelf during this event.
In summary, an extended period of strong cyclonic activity from 18 to 22 September 2019 resulted in an exceptional period of strong easterly/northeasterly winds over the western side of the Amery Ice Shelf where the climatology shows a positive zonal component. These exceptional winds generated a significant storm surge onto the ice shelf and helped in preconditioning the break-off as will be discussed in Sect. 2.3.
2.2 Twin polar cyclones during 23–24 September 2019 – calving
Following the extended period of extreme cyclones in Cooperation Sea, an explosive cyclone started to develop on 21 September 2019 centered at 45∘ E and 60∘ S. The pressure at its center deepened from 976 hPa on 21 September at 19:00 UTC to 952 hPa on 22 September 2019 at 19:00 UTC (not shown). On 23 September 2019, the large explosive cyclone entered Cooperation Sea from the west with a deep low of 940 hPa (Fig. 5a). It was accompanied by an intense atmospheric river exhibiting core IVT greater than 800 kg m−1 s−1 and stretching from mid latitudes towards Antarctica (Fig. 5b). The explosive cyclone was stationary over Cooperation Sea during the whole day on 23 September 2019, being trapped between two far-south-reaching blocking highs: the first to the west of it and the second to its east (Fig. 5a and c). The cyclone intensified, increased in size and evolved into twin cyclones on 24 September 2019 at 00:00 UTC associated with 952 hPa low pressure at their respective centers (Fig. 5c and d). The mutual interaction between the two cyclones appeared as co-rotation and an eastward translation of the binary pair by the ambient flow. The interplay between the cyclones lasted for 1 d, after which the twins merged and decayed on 25 September 2019.
To the south of the twin cyclones, a cold high pressure (1036 hPa) developed over the ice sheet as a result of the accumulation of cold air due to the blocking ridge to the northeast (Fig. 5c). The high pressure advected very cold air (2 m temperature below −40 ∘C) into the twin-cyclone system (Fig. 5e and f), which may have fostered baroclinicity and frontogenesis, hence sustaining the twin cyclones for a longer period of time.
The atmospheric river continued to advect large amounts of moisture, and precipitation occurred over a large area (Fig. 5d). Sustained advection of exceptionally warm air masses was observed during this event as well (Fig. 5e and f). Air masses characterized by 0 ∘C 2 m temperatures were seen to penetrate further south, reaching 66∘ S over the region to the east of the twin cyclones during the whole day on 24 September 2019 (Fig. 5e and f).
During 23–24 September, the deep twin polar cyclones were stationary to the east of the Amery Ice Shelf (Fig. 5) associated with MSLP anomalies at their centers below the 5th percentile (Fig. 6a and c). They induced extreme westerlies (10 m wind speed on the order of 17 m s−1) across the ice shelf with positive 10 m wind anomalies exceeding 2 standard deviations from the climatological mean (Fig. 6a). The direction of the winds was also exceptional with u-wind values above the 99th percentile over the western ice shelf margin from 23 September 2019 at 18:00 UTC (Fig. 6b) through 24 September 2019 at 12:00 UTC and below the 5th percentile u-wind values over the lower eastern ice shelf area (Fig. 6a and b). Weaker but still significant (95th percentile) westerly wind anomalies lingered during the remainder of the day on 24 September 2019 and through midday on 25 September 2019 with wind speed at 10 m reaching 15 m s−1 at the front of the ice shelf (Fig. 6d). Sustained positive 2 m temperature anomalies were observed throughout the twin cyclone event over the eastern side of Prydz Bay. Warm-air advection by the twin cyclones brought 95th percentile rank temperatures over the eastern side of the Amery Ice Shelf and Prydz Bay on 23 and 24 September 2019 and 90th percentile rank temperatures inland over Princess Elizabeth Land (Fig. 6c). These episodes of poleward advection of warm air masses may explain the observed positive trend in surface temperatures during winter and spring seasons at Prydz Bay reported by Heil (2006) using measurements from ground stations.
The distribution of hourly 10 m wind speed for all months in 1979–2019 over the Amery Ice Shelf front is shown in the histogram in Fig. 6f. The winds during the 18–22 September 2019 period were exceptionally unusual compared to the record. The winds during the 23–25 September 2019 period were strong but not unusually extreme. This suggests that the first extreme cyclones' event had an important role in preconditioning the ice shelf front for break-off, while the offshore winds during the second event triggered the calving along the T1 rift.
2.3 The calving
The anomalous atmospheric conditions during the extended period of strong cyclonic activity occurring over the ice cover in the Cooperation and Davis seas (i.e., south to the sea ice edge) impacted the state of the ocean in front of and around the Amery Ice Shelf. The storm surge caused by the first twin cyclones (i.e., Fig. 4g) was followed by an oceanward slope induced by the second episode of cyclones. Figure 7a shows a clear increase in maximum ocean slope close to the Amery Ice Shelf in the period prior to the calving (0.05∘ slope anomaly). The wind pattern of 23–24 September induced a significant slope on the ocean surface at/near the ice front. This oceanward slope tugs on the ice front, placing extensional stress on the pre-existing rift. The SAR (synthetic-aperture radar) satellite image on 23 September 2019 together with the ice-displacement velocity (rate and direction in vectors) relative to 11 September 2019 are shown in Fig. 7b. The displacement vectors indicate that the iceberg-to-be was rotating in the period 11–23 September 2019 prior to the calving. Wind-induced ocean slope caused a leftward (relative to the rift T1) splitting movement of the future iceberg prior to break-off on 25 September 2019. This caused rapid opening of the crack and subsequent movement of the iceberg away from the ice shelf (Fig. 8a).
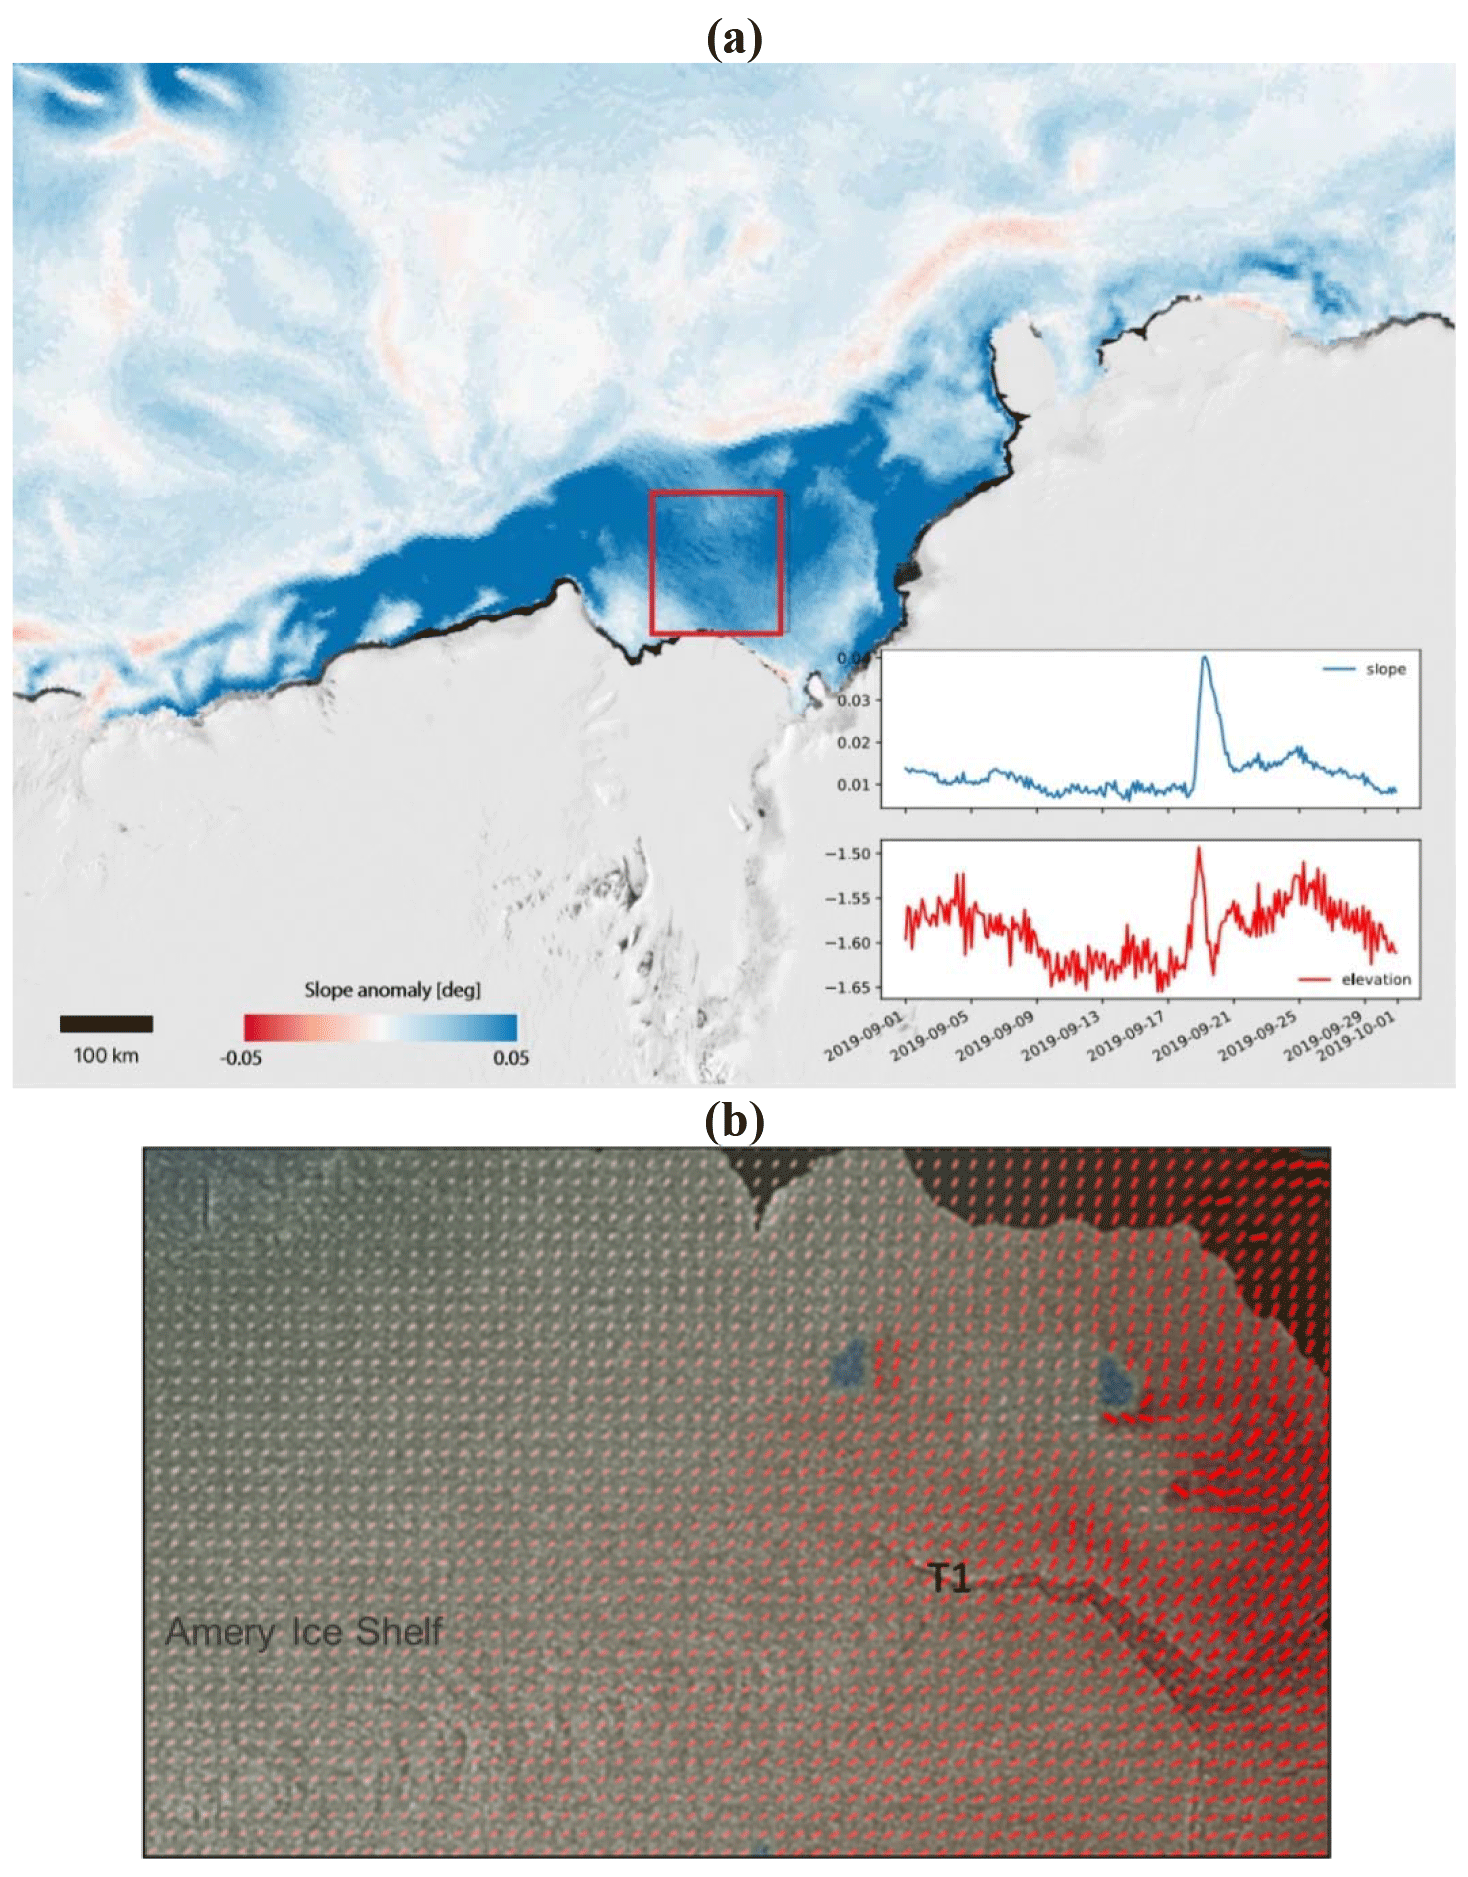
Figure 7(a) Two-dimensional map of maximum ocean slope anomaly derived from the HYCOM (HYbrid Coordinate Ocean Model) reanalysis dataset during the period 17–20 September 2019 relative to September 2019 mean and time series of slope and surface elevation over the red bounding box showed on the map. (b) SAR image of the Amery Ice Shelf on 23 September 2019. The red vectors correspond to the ice displacement on 23 September 2019 (both velocity and direction) relative to 11 September 2019. Please note that the date format used in this figure is year month day (yyyy-mm-dd).
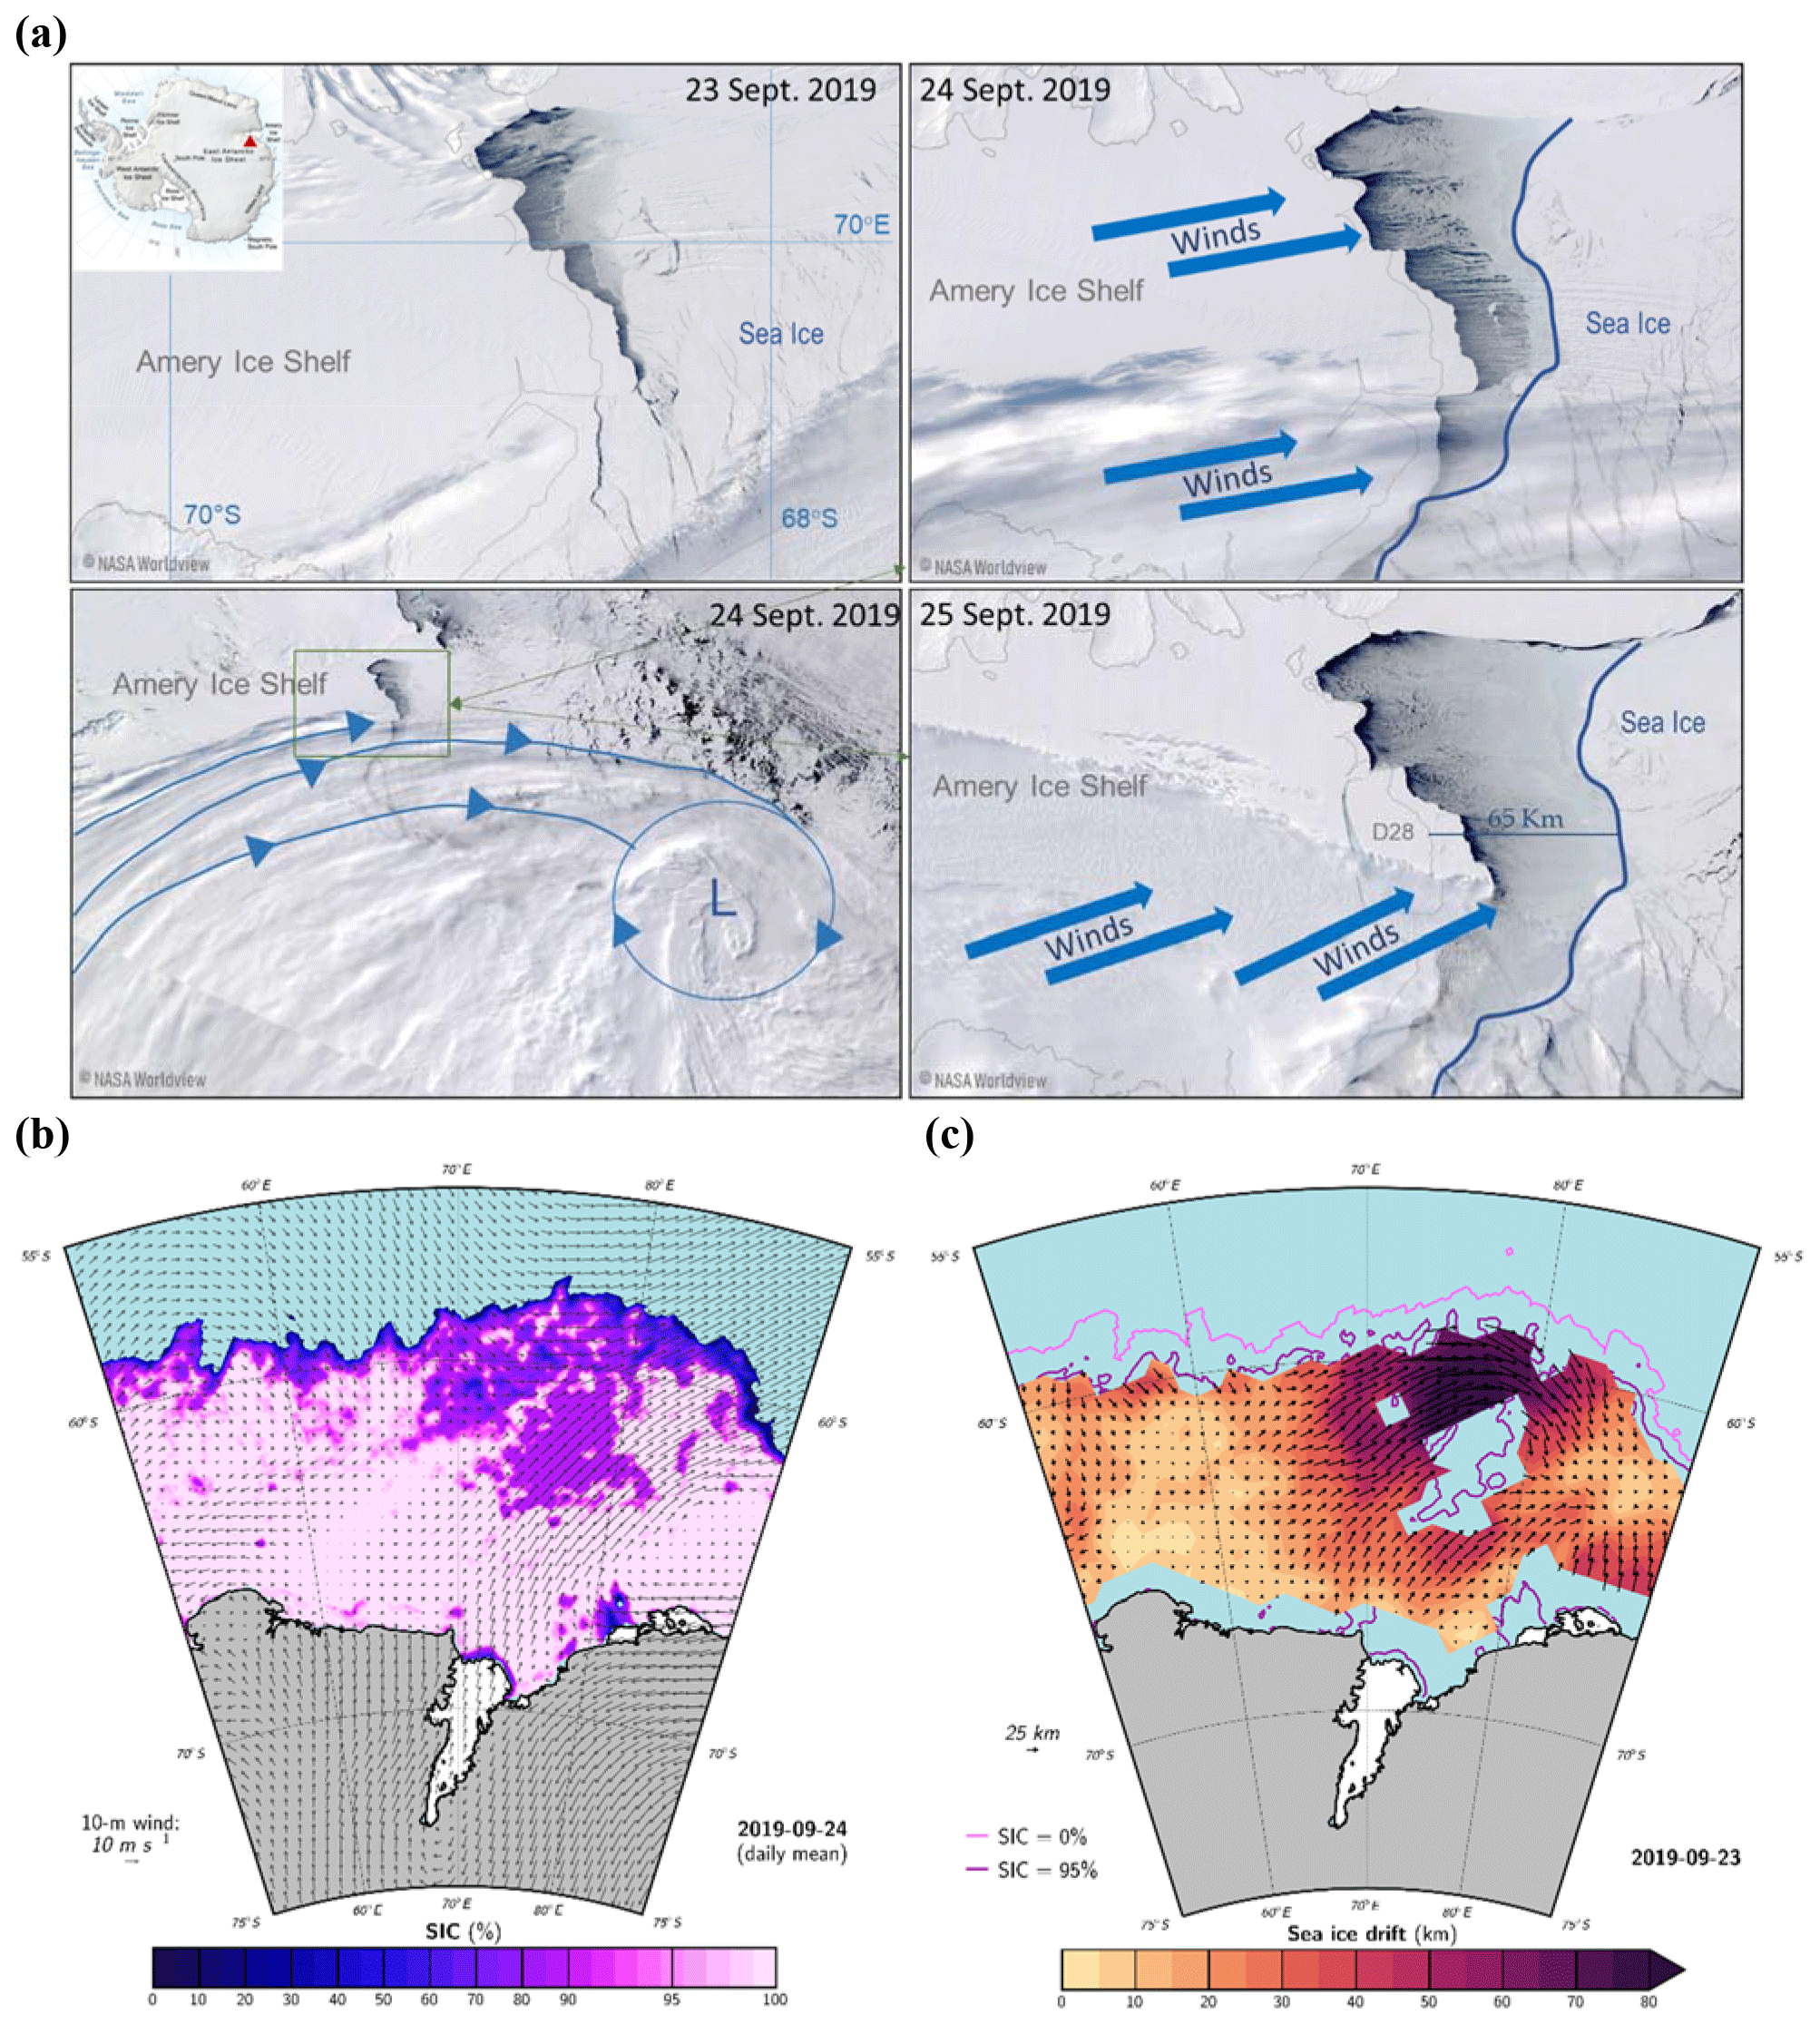
Figure 8(a) MODIS satellite visible imagery of the Amery Ice Shelf showing the ice shelf before the calving on 23 September 2019 and during the calving on 24–25 September 2019. Image credit: NASA Worldview. (b) Satellite-derived sea ice concentration (SIC) and ERA5-derived daily mean 10 m winds in vectors over 55–75∘ S and 50–90∘ E on 24 September 2019 at 00:00 UTC. (c) Satellite-derived daily sea ice drift velocity in colors and direction in vectors on 23 September 2019. The solid pink contour is the 0 % sea ice concentration contour, and the solid purple contour is the 95 % sea ice concentration contour.
The extreme nature and long duration of the cyclones during both cyclones' episodes resulted in sustained tides and oceanward slope of the sea surface, consecutively. Between the previous storm event and the 23–24 September storm, there was a rapid change from a shoreward surge to ocean slope away from the ice front. This put strain on the pre-existing rift at the front of the Amery Ice Shelf, leading to rift growth and calving.
2.4 Sea ice conditions
The action of strong winds on sea ice removal from the area at the mouth of the Amery Ice Shelf was visible in MODIS imagery as well as in the satellite observations of sea ice concentration and drift (Fig. 8). During the period of the twin polar cyclones on 23–24 September 2019, the sea ice was pushed about 65 km away from the ice shelf front in just a 2 d period of time (Fig. 8a). The ice-free region in front of the ice shelf presented an asymmetric shape where the sea ice in front of the western side of the ice shelf was pushed further away compared to the sea ice in front of the eastern side (Fig. 8a). This may have made the western side more vulnerable to the winds and associated tide/ocean slope induced by the consecutive explosive cyclones.
Moreover, sea ice concentration in Cooperation Sea and at the Amery Ice Shelf front area was reduced to below 60 %, reaching 40 % in some places (Fig. 8b and c). By the end of the intense cyclonic-activity period, areas of open water formed especially at the locations of the strongest surface winds, i.e., to the west of the twin cyclones' centers (Fig. 8b and c). Significant reduction in sea ice concentration was also observed along the sea ice edge associated with wind-driven currents and waves (Fig. 8b).
Significant sea ice drift was observed at the mouth of the Amery Ice Shelf associated with the exceptional westerlies generated by the twin cyclones on 23–24 September 2019 (Fig. 8c). The sea ice drift velocity during this period reached 50 km d−1 on average, and the sea ice drifted away from the Amery Ice Shelf towards the east and northeast (Fig. 8c).
Sea ice loss in the vicinity of weakened or flooded shelves is considered to be a contributing factor to rapid ice shelf calving (e.g., Massom et al., 2018). The removal of the protective buffer represented by sea ice for ice shelves (e.g., Massom et al., 2018) may have increased the effect of the oceanward slope on the outer ice shelf western margin and helped in the gravitationally induced calving.
Explosive cyclones crossing the sea ice zone around Antarctica can generate waves of up to 8 m in height that are capable of propagating more than 100 km into the sea ice cover (Vichi et al., 2019). The consecutive deep cyclones under scrutiny impacted immediately the Amery Ice Shelf front, since they were found very close to the coast. During the first period of explosive twin cyclones, the cyclones were sitting to the west of the Amery Ice Shelf, which directed anomalous warm and moist easterlies towards it. This situation caused shoreward storm surge and tide immediately at the shelf front (Fig. 4g). This was then followed by additional extreme atmospheric forcing brought by the second event of explosive twin cyclones, producing strong offshore winds, sea ice removal and oceanward sea surface slope. This combination of factors weakened the ice shelf front and made it more vulnerable, resulting in amplification of the fractures along the pre-existing rifts and leading ultimately to its calving.
Previous studies (Holdsworth and Glynn, 1978; Squire et al., 1994) have shown that calving ice shelves can be triggered by wind-induced waves which impose flexural strains on the ice shelves, with the potential to induce crevasse and rift propagation and calving (Robinson and Haskell, 1992; Bromirski et al., 2010). This effect can be even maximized by the loss of the protective sea ice pack at the front of the ice shelves (Massom et al., 2018). Here we have shown that the series of intense cyclones provided ideal conditions for both sea ice reduction, wind tides and ocean slope and ultimately triggered the calving on 25 September 2019.
In this study, the role of atmospheric extremes in the recent calving of the Amery Ice Shelf in September 2019 is addressed by investigating the atmospheric conditions in combination with the ice and ocean state. During the month of September 2019, the circulation around Antarctica was characterized by, anomalously pronounced, three ridges and three troughs with the Indian sector of the Southern Ocean being under the influence of troughing and surrounded by two blocking ridges: one over the South Atlantic to the west and one over Davis Sea and southern Australia to the east.
During the second half of September 2019, a series of explosive polar cyclones, evolving into stationary twin polar cyclones, impacted the region of the Amery Ice Shelf. The first explosive cyclone occurred on 18 September 2019 and evolved into two stationary twin polar cyclones on 19–22 September 2019, sitting to the west of the ice shelf. The second explosive cyclone formed on 23 September 2019 and evolved into two stationary twin polar cyclones on 24–25 September 2019, sitting, this time, to the east of the Amery Ice Shelf. Both explosive-cyclone episodes were accompanied by intense atmospheric rivers bringing anomalous warm and moist air masses poleward. The stationary aspect of the deep cyclones had a large impact on the ice conditions, as it subjected the ice to sustained stress and strain. The main difference between the two episodes is the location at which the twin cyclones were stationary, relative to the Amery Ice Shelf, which determined the characteristics of the air masses and the wind direction that affected the ice shelf. This position of the cyclones relative to the Amery Ice Shelf was, in turn, determined in each episode by the location of the blocking ridges in the general circulation.
During the first episode, anomalous warm, moist and easterly winds impacted the ice shelf and surrounding sea ice, whereas during the second episode, the ice shelf and surrounding sea ice were under the influence of anomalous westerlies. The first episode resulted in a shoreward storm surge at the front of the ice shelf. During the second episode, anomalously strong offshore winds resulted in an oceanward slope and an ice-free area in front of the western side of the ice shelf. The sustained strong winds and associated sea surface slope toward the open ocean maintained a strain on the shelf front and amplified the fracture along the pre-existing rift, leading to the calving.
The detached iceberg after calving followed a northeasterly motion, being dragged by the prevailing winds and associated ocean currents. This drifting direction was similar to the one followed by the sea ice 1 d before and gave an indication of the impact of the wind direction on this process. Given the east-exposed orientation of the crack at the ice shelf front, the direction of the sustained strong westerly winds was deterministic for the calving.
In summary, atmospheric forcings by the explosive twin polar cyclones induced a gravitationally driven calving at the Amery Ice Shelf in September 2019 via storm tide and subsequent oceanward sea surface slope.
The analysis of this unique event could help better explain the underlying factors triggering the calving of ice shelves and hence improve the modeling capabilities of ice shelf future evolution regarding their possible contribution to sea level rise. Our analysis highlights the need for ice sheet models, used to project sea level rise, to account for atmospheric forcing at high resolution, in addition to sea ice and ocean waves, if they were to simulate accurately the changes occurring in the ice sheet and glaciers and their contribution to sea level rise.
In fact, important changes in the atmospheric circulation are being observed in the Southern Hemisphere. For instance, between 1979 and 2010 the subtropical jet streams moved poleward by 6.5 ± 0.2∘ in the Southern Hemisphere (Hudson, 2012), and the westerlies strengthened and shifted poleward (Fogt and Marshal, 2020). The observed poleward movement over the past few decades represents a significant change in the position of the subtropical jet stream, which should lead to significant latitudinal shifts in the global weather patterns, the hydrological cycle and their impact on Antarctic ice shelves.
The variability of the polar jet front in the Southern Hemisphere and whether behavior similar to the polar jet in the Northern Hemisphere is underway around Antarctica need to be investigated in future work. Several studies have shown evidence for a wavier jet stream in response to rapid Arctic warming and reported a weakening of the polar jet as a result of a reduced temperature gradient between high and mid latitudes due to the increased temperatures in the Arctic (e.g., Francis and Vavrus, 2015; Coumou et al., 2015; Mann et al., 2017). Such a change in the polar jet, which acts as an isolation boundary between high and mid latitudes, would lead to more interactions and spark feedback mechanisms between the Antarctic system and mid latitudes as happened to be the case in the Arctic (Francis et al., 2018, 2019b).
The poleward shift of the cyclones together with the decrease in sea ice extent in recent years makes it more urgent to assess the impact of cyclones on Antarctic-wide maritime-terminating ice shelves, as higher numbers of large cyclones could be expected to reach further south and therefore affect ice shelves' dynamics. If extreme polar cyclones are to form or reach more frequently ice shelves due to climate change, their destructive effect may have important consequences and needs to be accounted for in models used for sea level and Antarctic Ice Sheet mass balance projections.
The atmospheric analysis is based on data from the ERA5 reanalysis (Hersbach et al., 2020). For the period 16–25 September 2019, hourly maps of mean sea level pressure (MSLP), winds, 2m temperature and total column water vapor (TCWV) were analyzed. Furthermore, in order to investigate the anomalous character of the atmospheric conditions, we calculated, for the same period and quantities listed above, hourly standardized anomalies and percentile ranks relative to all hourly ERA5 September values during the full record (1979–2019) over the area 45–95∘ E, 50–75∘ S. In addition, a histogram analysis has been performed over a smaller domain limited to the ice shelf front area and adjacent mouth of Prydz Bay (i.e., 70–65∘ S and 70–75∘ E). The histograms represent the distribution of hourly values spatially averaged over this domain, for all months during 1979–2019.
Daily sea ice extent and concentration data are derived from the AMSR-E/AMSR2 (Advanced Microwave Scanning Radiometer for EOS, NASA's Earth Observing System) unified record (Meier et al., 2018) at 12.5 km spatial resolution (https://nsidc.org/data/AU_SI12/versions/1, last access: 15 May 2020). To check the motion in the sea ice field in the Amery Basin, we used the low-resolution sea ice drift product of the EUMETSAT (European Organisation for the Exploitation of Meteorological Satellites) Ocean and Sea Ice Satellite Application Facility (OSI SAF, http://www.osi-saf.org, last access: 10 June 2020). This is a 48 h average gridded ice drift dataset processed on a daily basis and made available on a 62.5 km polar stereographic grid (e.g., Kwok et al., 2017). Ice motion vectors are estimated by an advanced cross-correlation method on pairs of satellite images (Lavergne et al., 2010). It uses the multi-sensor spatial covering product that combines SSMIS (Special Sensor Microwave Imager/Sounder, 91 GHz H and V polarization) on board DMSP (Defense Meteorological Satellite Program) platform F17, ASCAT (Advanced SCATterometer, C-band backscatter) on board EUMETSAT platform MetOp-A (Meteorological Operational satellite) and AMSR-2 on board JAXA (Japan Aerospace Exploration Agency) platform GCOM-W (Global Change Observation Mission – Water). Due to atmospheric noise and surface melting these data are only available for the Southern Hemisphere winter (1 April to 31 October).
Visible imagery of the Amery Ice Shelf and surrounding area are taken from MODIS/VIIRS (Visible Infrared Imaging Radiometer Suite) land products (ORNL DAAC, 2018) using the NASA Worldview application (https://worldview.earthdata.nasa.gov, last access: 10 May 2020).
Sentinel-1 data have been used to determine potential surface melt (e.g., Datta et al., 2019) and to track ice velocity over the Amery Ice Shelf prior to the D28 iceberg calving by using feature tracking in ESA's SNAP (Sentinel Application Platform) Sentinel-1 toolbox. Sentinel-3A and Sentinel-3B data were used via the ESA Ocean Virtual Laboratory application to determine the wave height at the front of the Amery Ice Shelf.
The ocean slope and elevation are taken from the Hybrid Coordinate Ocean Model (HYCOM, https://www.hycom.org/, last access: 20 October 2020). HYCOM (Cummings and Smedstad, 2013) is a data-assimilative hybrid isopycnal-sigma-pressure (generalized) coordinate ocean model of which we downloaded elevation from the Google Earth Engine at a 0.08∘ latitude–longitude grid. Based on this elevation dataset, the surface slope was derived as the local gradient using the four-connected neighbors of each pixel.
All data needed to evaluate the conclusions in the paper are present in the paper. Correspondence and requests for materials should be addressed to Diana Francis (diana.francis@ku.ac.ae).
DF conceived the study and wrote the initial manuscript. KSM analyzed the satellite and reanalysis data. SL analyzed satellite data. MT and PH provided input on the result analysis. All authors interpreted results and provided input to the final manuscript.
The authors declare that they have no conflict of interest.
We acknowledge the use of imagery from the NASA Worldview application (https://worldview.earthdata.nasa.gov), part of the NASA Earth Observing System Data and Information System (EOSDIS).
This research has been supported by Masdar, Abu Dhabi Future Energy Company, United Arab Emirates (grant no. 8434000221). The contribution of Petra Heil was supported by the Australian government's Australian Antarctic Partnership Program and contributes to AAS project 4506.
This paper was edited by Nicolas Jourdain and reviewed by two anonymous referees.
Allen, J. T., Pezza, A. B., and Black, M. T.: Explosive cyclogenesis: a global climatology comparing multiple reanalyses, J. Clim., 23, 6468–6484, 2010.
Aitken, A., Roberts, J., and Ommen, T.: Repeated large-scale retreat and advance of Totten Glacier indicated by inland bed erosion, Nature, 533, 385–389 https://doi.org/10.1038/nature17447, 2016.
Barnes, E. A. and Polvani, L.: Response of the midlatitude jets, and of their variability, to increased greenhouse gases in the CMIP5 Models, J. Clim., 26, 7117–7135, 2013.
Bassis, J. N. and Ma, Y.: Evolution of basal crevasses links ice shelf stability to ocean forcing, Earth Planet. Sc. Lett., 409, 203–211, https://doi.org/10.1016/j.epsl.2014.11.003, 2015.
Bassis, J., Fricker, H., Coleman, R., and Minster, J.: An investigation into the forces that drive ice-shelf rift propagation on the Amery Ice Shelf, East Antarctica, J. Glaciol., 54, 17–27, https://doi.org/10.3189/002214308784409116, 2008.
Bengtsson, L., Hodges, K. I., and Keenlyside, N.: Will extratropical storms intensify in a warmer climate?, J. Clim., 22, 2276–2301, 2009.
Benn, D. I. and Åström, J. A.: Calving glaciers and ice shelves, Adv. Phys. X, 3, 1, https://doi.org/10.1080/23746149.2018.1513819, 2018.
Bromirski, P. D., Sergienko, O. V., and MacAyeal, D. R.: Transoceanic infragravity waves impacting Antarctic ice shelves, Geophys. Res. Lett., 37, L02502, https://doi.org/10.1029/2009GL041488, 2010.
Brunt, K., Okal, E., and MacAyeal, D.: Antarctic ice-shelf calving triggered by the Honshu (Japan) earthquake and tsunami, March 2011, J. Glaciol., 57, 785–788, https://doi.org/10.3189/002214311798043681, 2011.
Chang, E. K. M.: Projected Significant Increase in the Number of Extreme Extratropical Cyclones in the Southern Hemisphere, J. Clim., 30, 4915–4935, https://doi.org/10.1175/JCLI-D-16-0553.1, 2017.
Chang, E. K. M., Guo, Y., and Xia, X.: CMIP5 multimodel ensemble projection of storm track change under global warming, J. Geophys. Res., 117, D23118, https://doi.org/10.1029/2012JD018578, 2012.
Cook, A. J. and Vaughan, D. G.: Overview of areal changes of the ice shelves on the Antarctic Peninsula over the past 50 years, The Cryosphere, 4, 77–98, https://doi.org/10.5194/tc-4-77-2010, 2010.
Coumou, D., Lehmann, J., and Beckmann, J.: The weakening summer circulation in the Northern Hemisphere mid-latitudes, Science, 348, 324–327, https://doi.org/10.1126/science.1261768, 2015.
Cummings, J. A. and Smedstad, O. M.: Variational data analysis for the global ocean, in: Data Assimilation for Atmospheric, Oceanic and Hydrologic Applications, edited by: Park, S. K. and Xu, L., Vol. II., Springer-Verlag Berlin Heidelberg, https://doi.org/10.1007/978-3-642-35088-7_13, 2013.
Darji, S., Oza, S.R., Shah, R. D., Rathore, B. P., and Bahuguna, I. M.: Rift assessment and potential calving zone of Amery Ice Shelf, East Antarctica, Curr. Sci., 115, 1799–1804, https://doi.org/10.18520/cs/v115/i9/1799-1804, 2018.
Datta, R. T., Tedesco, M., Fettweis, X., Agosta, C., Lhermitte, S., Lenaerts, J. T. M., and Wever, N.: The Effect of Foehn-Induced Surface Melt on Firn Evolution Over the Northeast Antarctic Peninsula, Geophys. Res. Lett., 46, 3822–383, https://doi.org/10.1029/2018GL080845, 2019.
Davies, H. C.: Emergence of the mainstream cyclogenesis theories, Meteorol. Z., 6, 261–274, 1997.
DeConto, R. and Pollard, D.: Contribution of Antarctica to past and future sea-level rise, Nature, 531, 591–597, https://doi.org/10.1038/nature17145, 2016.
Dolatshah, A., Nelli, F., Alberello, A., Bruneau, L., Bennetts, L. G., Meylan, M. H., Monty, J. P., and Toffoli, A.: Wave Attenuation due to Ice Cover: An Experimental Model in a Wave-Ice Flume, Proceedings of the ASME 2017 36th International Conference on Ocean, Offshore and Arctic Engineering, Vol. 8, Polar and Arctic Sciences and Technology; Petroleum Technology, Trondheim, Norway, 25–30 June 2017, V008T07A016, ASME, https://doi.org/10.1115/OMAE2017-61548, 2017.
Eayrs, C., Holland, D. M., Francis, D., Wagner, T. J. W., Kumar, R., and Li, X.: Understanding the seasonal cycle of Antarctic sea ice extent in the context of longer-term variability, Rev. Geophys., 57, 1037–1064, https://doi.org/10.1029/2018RG000631, 2019.
Ferreira, R. N., Schubert, W. N., and Hack, J. J.: Dynamical aspects of twin tropical cyclones associated with the Madden–Julian oscillation, J. Atmos. Sci., 53, 929–945, 1996.
Francis, D., Eayrs, C., Chaboureau, J.-P., Mote, T., and Holland, D.: Polar jet associated circulation triggered a Saharan cyclone and derived the poleward transport of the African dust generated by the cyclone, J. Geophys. Res.-Atmos., 123, 11899–11917, https://doi.org/10.1029/2018JD029095, 2018.
Francis, D., Eayrs, C., Cuesta, J., and Holland, D.: Polar cyclones at the origin of the reoccurrence of the Maud Rise Polynya in austral winter 2017, J. Geophys. Res.-Atmos., 124, 5251–5267, https://doi.org/10.1029/2019JD030618, 2019a.
Francis, D., Eayrs, C., Chaboureau, J.-P., Mote, T., and Holland, D.: A meandering polar jet caused the development of a Saharan cyclone and the transport of dust toward Greenland, Adv. Sci. Res., 1, 1–8, https://doi.org/10.5194/asr-16-49-2019, 2019b.
Francis, D., Mattingly, K. S., Temimi, M., Massom, R., and Heil, P.: On the crucial role of atmospheric rivers in the two major Weddell Polynya events in 1973 and 2017 in Antarctica, Sci. Adv., 6, eabc2695, https://doi.org/10.1126/sciadv.abc2695, 2020.
Francis, J. A. and Vavrus, S. J.: Evidence for a wavier jet stream in response to rapid Arctic warming, Environ. Res. Lett., 10, 014005, https://doi.org/10.1088/1748-9326/10/1/014005, 2015.
Fricker, H., Young, N., Allison, I., and Coleman, R.: Iceberg calving from the Amery Ice Shelf, East Antarctica, Ann. Glaciol., 34, 241–246, https://doi.org/10.3189/172756402781817581, 2002.
Fricker, H. A., Young, N. W., Coleman, R., Bassis, J. N., and Minster, J.-B.: Multi-year monitoring of rift propagation on the Amery Ice Shelf, East Antarctica, Geophys. Res. Lett., 32, L02502, https://doi.org/10.1029/2004GL021036, 2005.
Fogt, R. L. and Marshall, G. J.: The Southern Annular Mode: Variability, trends, and climate impacts across the Southern Hemisphere, WIREs, Climate Change, 11, e652, https://doi.org/10.1002/wcc.652, 2020.
Fyfe, J. C.: Extratropical Southern Hemisphere cyclones: Harbingers of climate change?, J. Clim., 16, 2802–2805, 2003.
Galton-Fenzi, B. K., Hunter, J. R., Coleman, R., Marsland, S. J., and Warner, R. C.: Modeling the basal meltingand marine ice accretion of the Amery Ice Shelf, J. Geophys. Res., 117, C09031, https://doi.org/10.1029/2012JC008214, 2012.
Greenbaum, J., Blankenship, D., and Young, D.: Ocean access to a cavity beneath Totten Glacier in East Antarctica, Nat. Geosci., 8, 294–298, https://doi.org/10.1038/ngeo2388, 2015.
Grieger, J., Leckebusch, G. C., Raible, C. C., Rudeva, I., and Simmonds, I.: Subantarctic cyclones identified by 14 tracking methods, and their role for moisture transports into the continent, Tellus A, 70, 1–18, https://doi.org/10.1080/16000870.2018.1454808, 2018.
Heil, P.: Atmospheric conditions and fast ice at Davis, East Antarctica: A case study, J. Geophys. Res., 111, C05009, https://doi.org/10.1029/2005JC002904, 2006.
Hersbach, H., Bell, B., Berrisford, P., et al.: The ERA5 global reanalysis, Q. J. Roy. Meteor. Soc., 146, 1999–2049, https://doi.org/10.1002/qj.3803, 2020.
Hogg, A. and Gudmundsson, G.: Impacts of the Larsen-C Ice Shelf calving event, Nat. Clim. Change, 7, 540–542, https://doi.org/10.1038/nclimate3359, 2017.
Holdsworth, G. and Glynn, J.: Iceberg calving from floating glaciers by a vibration mechanism, Nature, 274, 464–466, 1978.
Hudson, R. D.: Measurements of the movement of the jet streams at mid-latitudes, in the Northern and Southern Hemispheres, 1979 to 2010, Atmos. Chem. Phys., 12, 7797–7808, https://doi.org/10.5194/acp-12-7797-2012, 2012.
Irving, D. and Simmonds, I.: A Novel Approach to Diagnosing Southern Hemisphere Planetary Wave Activity and Its Influence on Regional Climate Variability, J. Clim., 28, 9041–9057, 2015.
Jeong, S., Howat, I. M., and Bassis, J. N.: Accelerated ice shelf rifting and retreat at Pine Island Glacier, WestAntarctica, Geophys. Res. Lett., 43, 11720–11725, https://doi.org/10.1002/2016GL071360, 2016.
King, M. A., Coleman, R., Freemantle, A.-J., Fricker, H. A., Hurd, R. S., Legrésy, B., Padman, L., and Warner R.: A 4-decade record of elevation change of the Amery Ice Shelf, East Antarctica, J. Geophys. Res., 114, F01010, https://doi.org/10.1029/2008JF001094, 2009.
Kohout, A., Williams, M., Dean, S., and Meylan, M. H.: Storm-induced sea-ice breakup and the implications for ice extent, Nature, 509, 604–607, https://doi.org/10.1038/nature13262, 2014.
Kwok, R., Pang, S. S., and Kacimi, S.: Sea ice drift in the Southern Ocean: Regional patterns, variability and trends, Elem. Sci. Anth., 5, 1–16, https://doi.org/10.1525/elementa.226, 2017.
Lambert, S. J. and Fyfe, J. C.: Changes in winter cyclone frequencies and strengths simulated in enhanced greenhouse warming experiments: Results from the models participating in the IPCC diagnostic exercise, Clim. Dynam., 26, 713–728, 2006.
Lavergne, T., Eastwood, S., Teffah, Z., Schyberg, H., and Breivik, L.-A.: Sea ice motion from low-resolution satellite sensors: An alternative method and its validation in the Arctic, J. Geophys. Res., 115, C10032, https://doi.org/10.1029/2009JC005958, 2010.
Lee, S., Gong, T., Feldstein, S. B., Screen, J. A., and Simmonds, I.: Revisiting the cause of the 1989–2009 Arctic surface warming using the surface energy budget: Downward infrared radiation dominates the surface fluxes, Geophys. Res. Lett., 44, 10654–10661, https://doi.org/10.1002/2017GL075375, 2017.
Li, T., Liu, Y., and Cheng, X.: Recent and imminent calving events do little to impair Amery ice shelf's stability, Acta Oceanol. Sin., 39, 168–170, https://doi.org/10.1007/s13131-020-1600-6, 2020.
Lim, E. and Simmonds, I.: Explosive Cyclone Development in the Southern Hemisphere and a Comparison with Northern Hemisphere Events, Mon. Weather Rev., 130, 2188–2209, https://doi.org/10.1175/1520-0493(2002)130<2188:ECDITS>2.0.CO;2, 2002.
Liu, Y., Moore J. C., Cheng, X., Gladstone, R. M., Bassis, J. N., Liu, H., Wen, J., and Hui, F.: Iceberg calving of Antarctic ice shelves, P. Natl. Acad. Sci. USA, 112, 3263–3268, https://doi.org/10.1073/pnas.1415137112, 2015.
Mann, M. E., Rahmstorf, S., Kornhuber, K., Steinman, B. A., Miller, S. K., and Coumou, D.: Influence of Anthropogenic Climate Change on Planetary Wave Resonance and Extreme Weather Events, Sci Rep., 7, 45242, https://doi.org/10.1038/srep45242, 2017.
Massom, R. A., Scambos, T. A., Bennetts, L. G., Reid, P., Squire, V. A., and Stammerjohn, S. E.: Antarctic ice shelf disintegration triggered by sea ice loss and ocean swell, Nature, 558, 383–389, https://doi.org/10.1038/s41586-018-0212-1, 2018.
Matear, R., O'Kane, T., Risbey, J., and Chamberlain, M.: Sources of heterogeneous variability and trends in Antarctic sea-ice, Nat. Commun., 6, 8656, https://doi.org/10.1038/ncomms9656, 2015.
Meier, W. N., Markus, T., and Comiso, J. C.: AMSR-E/AMSR2 Unified L3 Daily 12.5 km Brightness Temperatures, Sea Ice Concentration, Motion and Snow Depth Polar Grids, Version 1 [Antarctica], Boulder, Colorado USA, NASA National Snow and Ice Data Center Distributed Active Archive Center, https://doi.org/10.5067/RA1MIJOYPK3P, 2018.
Moustaoui, M., Teitelbaum, H., Basdevant, C., and Boughaleb, Y.: Linked behavior of twin tropical cyclones, J. Geophys. Res., 107, 4378, https://doi.org/10.1029/2000JD000066, 2002.
Neu, U., Akperov, M. G., Bellenbaum, N., Benestad, R., Blender, R., Caballero, R., Cocozza, A., Dacre, H. F., Feng, Y., Fraedrich, K., Grieger, J., Gulev, S., Hanley, J., Hewson, T., Inatsu, M., Keay, K., Kew, S. F., Kindem, I., Leckebusch, G. C., Liberato, M. L. R., Lionello, P., Mokhov, I. I., Pinto, J. G., Raible, C. C., Reale, M., Rudeva, I., Schuster, M., Simmonds, I., Sinclair, M., Sprenger, M., Tilinina, N. D., Trigo, I. F., Ulbrich, S., Ulbrich, U., Wang, X. L., and Wernli, H.: IMILAST: A Community Effort to Intercompare Extratropical Cyclone Detection and Tracking Algorithms, Bull. Am. Meteorol. Soc., 94, 529–547, 2013.
ORNL DAAC: MODIS and VIIRS Land Products Global Subsetting and Visualization Tool, ORNL DAAC, Oak Ridge, Tennessee, USA, Subset obtained for MOD13Q1 product over the Amery Ice Shelf – Antarctica, https://doi.org/10.3334/ORNLDAAC/1379, 2018.
Pezza, A. B., Simmonds, I., and Renwick, J. A.: Southern hemisphere cyclones and anticyclones: recent trends and links with decadal variability in the Pacific Ocean, Int. J. Climatol., 27, 1403–1419, https://doi.org/10.1002/joc.1477, 2007.
Pope, J. O., Holland, P. R., Orr, A., Marshall, G. J., and Phillips, T.: The impacts of El Niño on the observed sea ice budget of West Antarctica, Geophys. Res. Lett., 44, 6200–6208, https://doi.org/10.1002/2017GL073414, 2017.
Pritchard, H. D., Ligtenberg S. R., Fricker H. A., Vaughan D. G., van den Broeke, M. R., and Padman, L.: Antarctic ice-sheet loss driven by basal melting of ice shelves, Nature, 484, 502–505, 2012.
Reale, M., Liberato, M. L. R., Lionello, P., Pinto, J. G., Salon, S., and Ulbrich, S.: A Global Climatology of Explosive Cyclones using a Multi-Tracking Approach, Tellus A, 71, 1, https://doi.org/10.1080/16000870.2019.1611340, 2019.
Raphael, M. N.: The influence of atmospheric zonal wave three on Antarctic sea ice variability, J. Geophys. Res., 112, D12112, https://doi.org/10.1029/2006JD007852, 2007.
Renfrew, A. I., Moore, G. W. K., and Clerk, A. A.: Binary interactions between polar lows, Tellus A, 49, 577–594, https://doi.org/10.3402/tellusa.v49i5.14823, 1997.
Rignot, E., Casassa, G., Gogineni, P., Krabill, W., Rivera, A., and Thomas, R.: Accelerated ice discharge from the Antarctic Peninsula following the collapse of Larsen B ice shelf, Geophys. Res. Lett., 31, L18401, https://doi.org/10.1029/2004gl020697, 2004.
Rignot, E., Mouginot, J., Scheuchl, B., van den Broeke, M., van Wessem, M. J., and Morlighem, M.: Four decades of Antarctic Ice Sheet mass balance from 1979–2017, P. Natl. Acad. Sci. USA, 116, 1095–1103, doi10.1073/pnas.1812883116, 2019.
Robinson, W. and Haskell, T. G.: Travelling flexural waves in the Erebus Glacier Tongue, McMurdo Sound, Antarctica, Cold Reg. Sci. Technol., 20, 289–293, 1992.
Rudeva, I. and Simmonds, I.: Variability and trends of global atmospheric frontal activity and links with large-scale modes of variability, J. Clim., 28, 3311–3330, 2015.
Sanders, F. and Gyakum, J. R.: Synoptic-Dynamic Climatology of the “Bomb”, Mon. Weather Rev., 108, 1589–606, https://doi.org/10.1175/1520-0493(1980)108<1589:SDCOT>2.0.CO;2, 1980.
Scambos, T., Ross, R., Bauer, R., Yermolin, Y., Skvarca, P., Long, D., Bohlander, J., and Haran, T.: Calving and ice-shelf break-up processes investigated by proxy: Antarctic tabular iceberg evolution during northward drift, J. Glaciol., 54, 579–591, 2008.
Scambos, T. A., Bohlander, J. A., Shuman, C. A., and Skvarca, P.: Glacier acceleration and thinning after ice shelf collapse in the Larsen B embayment, Antarctica, Geophys. Res. Lett., 31, 1–4, 2004.
Scambos, T. A., Berthier, E., Haran, T., Shuman, C. A., Cook, A. J., Ligtenberg, S. R. M., and Bohlander, J.: Detailed ice loss pattern in the northern Antarctic Peninsula: widespread decline driven by ice front retreats, The Cryosphere, 8, 2135–2145, https://doi.org/10.5194/tc-8-2135-2014, 2014.
Schemm, S.: Regional trends in weather systems help explain Antarctic sea ice trends, Geophys. Res. Lett., 45, 7165–7175, https://doi.org/10.1029/2018GL079109, 2018.
Schlosser, E., Powers, J. G., Duda, M. G., and Manning, K. W.: Interaction between Antarctic sea ice and synoptic activity in the circumpolar trough: implications for ice-core interpretation, Ann. Glaciol., 52, 9–17, https://doi.org/10.3189/172756411795931859, 2011.
Schlosser, E., Haumann, F. A., and Raphael, M. N.: Atmospheric influences on the anomalous 2016 Antarctic sea ice decay, The Cryosphere, 12, 1103–1119, https://doi.org/10.5194/tc-12-1103-2018, 2018.
Shepherd, A., Fricker, H. A., and Farrell, S. L.: Trends and connections across the Antarctic cryosphere, Nature, 558, 223–232, 2018.
Shimada, U., Wada, A., Yamazaki, K., and Kitabatake, N.: Roles of an upper-level cold vortex and low-level baroclinicity in the development of polar lows over the Sea of Japan, Tellus A, 66, 1, https://doi.org/10.3402/tellusa.v66.24694, 2014.
Smith, J. A., Graham, A. G. C., Post, A. L., Hillenbrand, C.-D., Bart, P. J., and Powell, R. D.: The marine geological imprint of Antarctic ice shelves, Nat. Commun., 10, 5635, https://doi.org/10.1038/s41467-019-13496-5, 2019.
Son, S.-W., Polvani, L. M., Waugh, D. W., Akiyoshi, H., Garcia, R., Kinnison, D., Pawson, S., Rozanov, E.T., Shepherd, G., and Shibata, K.: The impact of stratospheric ozone recovery on the Southern Hemisphere westerly jet, Science, 320, 1486–1489, 2008.
Squire, V. A.: Ocean wave interactions with sea ice: a reappraisal, Annu. Rev. Fluid Mech., 52, 37–60, 2020.
Squire, V. A., Robinson, W. H., Meylan, M. H., and Haskell, T. G.: Observations of flexural waves in the Erebus Glacier Tongue, McMurdo Sound, Antarctica, and nearby sea ice, J. Glaciol., 40, 377–385, 1994.
Stoll, P. J., Graversen, R. G., Noer, G., and Hodges, K.: An objective global climatology of polar lows based on reanalysis data, Q. J. R. Meteorol. Soc., 144, 2099–2117, https://doi.org/10.1002/qj.3309, 2018.
Swart, S., Cambell, E. C., Heuze, C. H., Johnson, K., Lieser, J. L., Masson, R., Mazloff, M., Meredith, M., Reid, P., Sallee, J.-B., and Stammerjohn, S.: Litmus or sea ice anomaly? Sidebar, State of the Climate, BAMS, 99, S188–S189, https://doi.org/10.1175/BAMS-D-18-0173.1, 2018.
Tamarin, T. and Kaspi, Y.: The poleward shift of storm tracks under global warming: A Lagrangian perspective, Geophys. Res. Lett., 44, 10666–10674, https://doi.org/10.1002/2017GL073633, 2017.
Turner, J., Harangozo, S. A., Marshall, G. J., King, J. C., and Colwell, S. R.: Anomalous atmospheric circulation over the Weddell Sea, Antarctica during the Austral summer of 2001/02 resulting in extreme sea ice conditions, Geophys. Res. Lett., 29, 2160, https://doi.org/10.1029/2002GL015565, 2002.
Uccellini, L. W.: Processes Contributing to the Rapid Development of Extratropical Cyclones, in: Extratropical Cyclones, edited by: Newton, C. W. and Holopainen, E. O., American Meteorological Society, Boston, MA, 1990.
Ulbrich, U., Leckebusch, G. C., Grieger, J., Schuster, M., Akperov, M., Bardin, M. Y., Feng, Y., Gulev, S., Inatsu, M., Keay, K., Kew, S. F., Liberato, M. L. R., Lionello, P., Mokhov, I. I., Neu, U., Pinto, J. G., Raible, C. C., Reale, M., Rudeva, I., Simmonds, I., Tilinina, N. D., Trigo, I. F., Ulbrich, S., Wang, X. L., and Wernli, H.: Are greenhouse gas signals of Northern Hemisphere winter extra-tropical cyclone activity dependent on the identification and tracking algorithm?, Meteorol. Z., 22, 61–68, 2013.
Uotila, P., Vihma, T., Pezza, A. B., Simmonds, I., Keay, K., and Lynch, A. H.: Relationships between Antarctic cyclones and surface conditions as derived from high-resolution numerical weather prediction data, J. Geophys. Res., 116, D07109, https://doi.org/10.1029/2010JD015358, 2011.
Vaughan, D. G., Corr, H. F. J., Bindschadler, R. A., Dutrieux, P., Gudmundsson, G. H., Jenkins, A., Newman, T., Vornberger, P., and Wingham, D. J.: Subglacial melt channels and fracture in the floating part of Pine Island Glacier, Antarctica, J. Geophys. Res., 117, F03012, https://doi.org/10.1029/2012JF002360, 2012.
Vichi, M., Eayrs, C., Alberello, A., Bekker, A., Bennetts, L., and Holland, D.: Effects of an explosive polar cyclone crossing the Antarctic marginal ice zone, Geophys. Res. Lett., 46, 5948–5958, https://doi.org/10.1029/2019GL082457, 2019.
Wagner, J. S., Gohm, A., Dörnbrack, A., and Schäfler, A.: The mesoscale structure of a polar low: airborne lidar measurements and simulations, Q. J. R. Meteorol. Soc., 137, 1516–1531, https://doi.org/10.1002/qj.857, 2011.
Watanabe, S. I. and Niino, H.: Genesis and Development Mechanisms of a Polar Mesocyclone over the Japan Sea, Mon. Weather Rev., 142, 2248–2270, https://doi.org/10.1175/MWR-D-13-00226.1, 2014.
Wei, L. and Qin, T.: Characteristics of cyclone climatology and variability in the Southern Ocean, Acta Oceanol. Sin., 35, 59–67, https://doi.org/10.1007/s13131-016-0913-y, 2016.
Wille, J. D., Favier, V. Dufour, A., Gorodetskaya, I. V., Turner, J., Agosta, C., and Codron, F.: West Antarctic surface melt triggered by atmospheric rivers, Nat. Geosci., 12, 911–916, https://doi.org/10.1038/s41561-019-0460-1, 2019.
Woods, C. and Caballero, R.: The Role of Moist Intrusions in Winter Arctic Warming and Sea Ice Decline, J. Clim., 29, 4473–4485, https://doi.org/10.1175/JCLI-D-15-0773.1, 2016.
Yokoyama, Y. and Yamamoto, M.: Influences of surface heat flux on twin cyclone structure during their explosive development over the East Asian marginal seas on 23 January 2008, Weather Clim. Extrem., 23, 100198, https://doi.org/10.1016/j.wace.2019.100198, 2019.
Zhao, C., Cheng, X., Liu, Y., Hui, F., Kang, J., Wang, X., and Cheng, C.: The slow-growing tooth of the Amery Ice Shelf from 2004 to 2012, J. Glaciol., 59, 592–596, https://doi.org/10.3189/2013JoG12J225, 2013.
The requested paper has a corresponding corrigendum published. Please read the corrigendum first before downloading the article.
- Article
(27103 KB) - Full-text XML