the Creative Commons Attribution 4.0 License.
the Creative Commons Attribution 4.0 License.
 | 10 Mar 2021
Buoyant calving and ice-contact lake evolution at Pasterze Glacier (Austria) in the period 1998–2019
Andreas Kellerer-Pirklbauer
Michael Avian
Douglas I. Benn
Felix Bernsteiner
Philipp Krisch
Christian Ziesler
Rapid growth of proglacial lakes in the current warming climate can pose significant outburst flood hazards, increase rates of ice mass loss, and alter the dynamic state of glaciers. We studied the nature and rate of proglacial lake evolution at Pasterze Glacier (Austria) in the period 1998–2019 using different remote-sensing (photogrammetry, laser scanning) and fieldwork-based (global navigation satellite system – GNSS, time-lapse photography, geoelectrical resistivity tomography – ERT, and bathymetry) data. Glacier thinning below the spillway level and glacier recession caused flooding of the glacier, initially forming a glacier-lateral to supraglacial lake with subaerial and subaquatic debris-covered dead-ice bodies. The observed lake size increase in 1998–2019 followed an exponential curve (1998 – 1900 m2, 2019 – 304 000 m2). ERT data from 2015 to 2019 revealed widespread existence of massive dead-ice bodies exceeding 25 m in thickness near the lake shore. Several large-scale and rapidly occurring buoyant calving events were detected in the 48 m deep basin by time-lapse photography, indicating that buoyant calving is a crucial process for the fast lake expansion. Estimations of the ice volume losses by buoyant calving and by subaerial ablation at a 0.35 km2 large lake-proximal section of the glacier reveal comparable values for both processes (ca. 1×10⁶ m3) for the period August 2018 to August 2019. We identified a sequence of processes: glacier recession into a basin and glacier thinning below the spillway level; glacio-fluvial sedimentation in the glacial–proglacial transition zone covering dead ice; initial formation and accelerating enlargement of a glacier-lateral to supraglacial lake by ablation of glacier ice and debris-covered dead ice forming thermokarst features; increase in hydrostatic disequilibrium leading to destabilization of ice at the lake bottom or at the near-shore causing fracturing, tilting, disintegration, or emergence of new icebergs due to buoyant calving; and gradual melting of icebergs along with iceberg capsizing events. We conclude that buoyant calving, previously not reported from the European Alps, might play an important role at alpine glaciers in the future as many glaciers are expected to recede into valley or cirque overdeepenings.
- Article
(27629 KB) - Full-text XML
-
Supplement
(10666 KB) - BibTeX
- EndNote


Ongoing recession of mountain glaciers worldwide reveals dynamic landscapes exposed to high rates of geomorphological and hydrological changes (Carrivick and Heckmann, 2017). In suitable topographic conditions, proglacial lakes may form, including ice-contact lakes (physically attached to an ice margin) and ice-marginal lakes (lakes detached from or immediately beyond a contemporary ice margin) (Benn and Evans, 2010; Carrivick and Tweed, 2013). Such lakes have increased in number, size, and volume around the world due to climate-warming-induced glacier melt (Carrivick and Tweed, 2013; Otto, 2019). Buckel et al. (2018) for instance studied the formation and distribution of proglacial lakes since the Little Ice Age (LIA) in Austria revealing a continuous acceleration in the number of glacier-related lakes particularly since the turn of the 21st century.
The formation of proglacial lakes is important because they can pose significant outburst flood hazards (e.g. Richardson and Reynolds, 2000; Harrison et al., 2018), increase rates of ice mass loss, and alter the dynamic state of glaciers (e.g. Kirkbride and Warren, 1999; King et al., 2018, 2019; Liu et al., 2020). However, detailed descriptions of proglacial lake formation and related subaerial and subaquatic processes are still rare. Carrivick and Heckmann (2017) pointed out that there is an urgent need for inventories of proglacial systems including lakes to form a baseline from which changes could be detected.
The evolution of proglacial lakes is commonly linked to the subsurface, particularly to changes in the distribution of debris-covered dead ice (defined here as any part of a glacier which has ceased to flow) and permafrost-related ground ice bodies (Bosson et al., 2015; Gärtner-Roer and Bast, 2019) affecting lake geometry and areal expansion.
Water bodies at the glacier surface form initially as supraglacial lakes which might be either perched lakes (i.e. above the hydrological base level of the glacier) or base-level lakes (spillway controlled). The former type is prone to drainage if the perched lake connects to the englacial conduit system (Benn et al., 2001). Rapid areal expansion of such lakes is controlled by waterline and subaerial melting of exposed ice cliffs and calving (Benn et al., 2001). Furthermore, supraglacial lakes may transform into proglacial lakes lacking any ice core (full-depth lakes) through melting of lake-bottom ice. However, this is a slow process in which energy is conducted from the overlying water and cannot account for some observed instances of fast lake-bottom lowering with rates exceeding 10 m yr−1 (Thompson et al., 2012). It has been argued that fast lake-bottom lowering could occur by buoyant calving (Dykes et al., 2010; Thompson et al., 2012), but the rare and episodic nature of such events means that little is known about how buoyant calving might contribute to the transformation of supraglacial lakes into full-depth lakes.
Buoyant calving occurs where ice is subject to net upward buoyant forces sufficient to overcome its tensile strength. Such forces can develop where either ice thinning (e.g. via surface ablation) or water deepening (e.g. rises in lake level) cause the ice to become buoyant. If the ice is unable to adjust its geometry to achieve hydrostatic equilibrium, it can become super-buoyant (Benn et al., 2007), creating tensile stresses at the ice base. If these stresses become sufficiently high, the ice will fracture and calve, as described by Holdsworth (1973), Warren et al. (2001), and Boyce et al. (2007). Detailed models of super-buoyancy and buoyant calving have been presented by Wagner et al. (2016) and Benn et al. (2017). Hydrostatic disequilibrium caused the sudden disintegration of debris-covered dead ice in the proglacial area of Pasterze Glacier in September 2016 (Fig. 2). This event was briefly described in Kellerer-Pirklbauer et al. (2017) and was one of the main motivations for the present study.
In this study, we analysed rates and processes of glacier recession and formation and evolution of an ice-contact lake at Pasterze Glacier, Austria, over a period of 22 years. The aims of this study are (i) to examine glaciological and morphological changes at the highly dynamic glacial–proglacial transition zone of the receding Pasterze Glacier and (ii) to discuss related processes which formed the proglacial lake named Pasterzensee (See is German for lake) during the period 1998–2019. Regarding the latter, we focus particularly on the significance of buoyant calving. In doing so, we consider subaerial, subsurface, and aquatic, as well as subaquatic, domains applying fieldwork-based and remote-sensing techniques.
The study area comprises the glacial–proglacial transition zone of Pasterze Glacier, Austria. This glacier covered 26.5 km2 during the LIA maximum in around 1850 and is the largest glacier in the Austrian Alps with an area of 15.4 km2 in 2019 (Fig. 1). The glacier is located in the Glockner Mountains, the Hohe Tauern range, at 47∘05′ N, 12∘43′ E (Fig. 1b). The gently sloping, 4.5 km long glacier tongue is connected to the upper part of the glacier by an icefall named Hufeisenbruch (meaning horseshoe icefall in German) attributed to its former shape in plan view. This icefall disintegrated and narrowed substantially during the last few decades, attributed to the decrease in ice replenishment from the upper to the lower part of the glacier (Kellerer-Pirklbauer et al., 2008; Kaufmann et al., 2015).
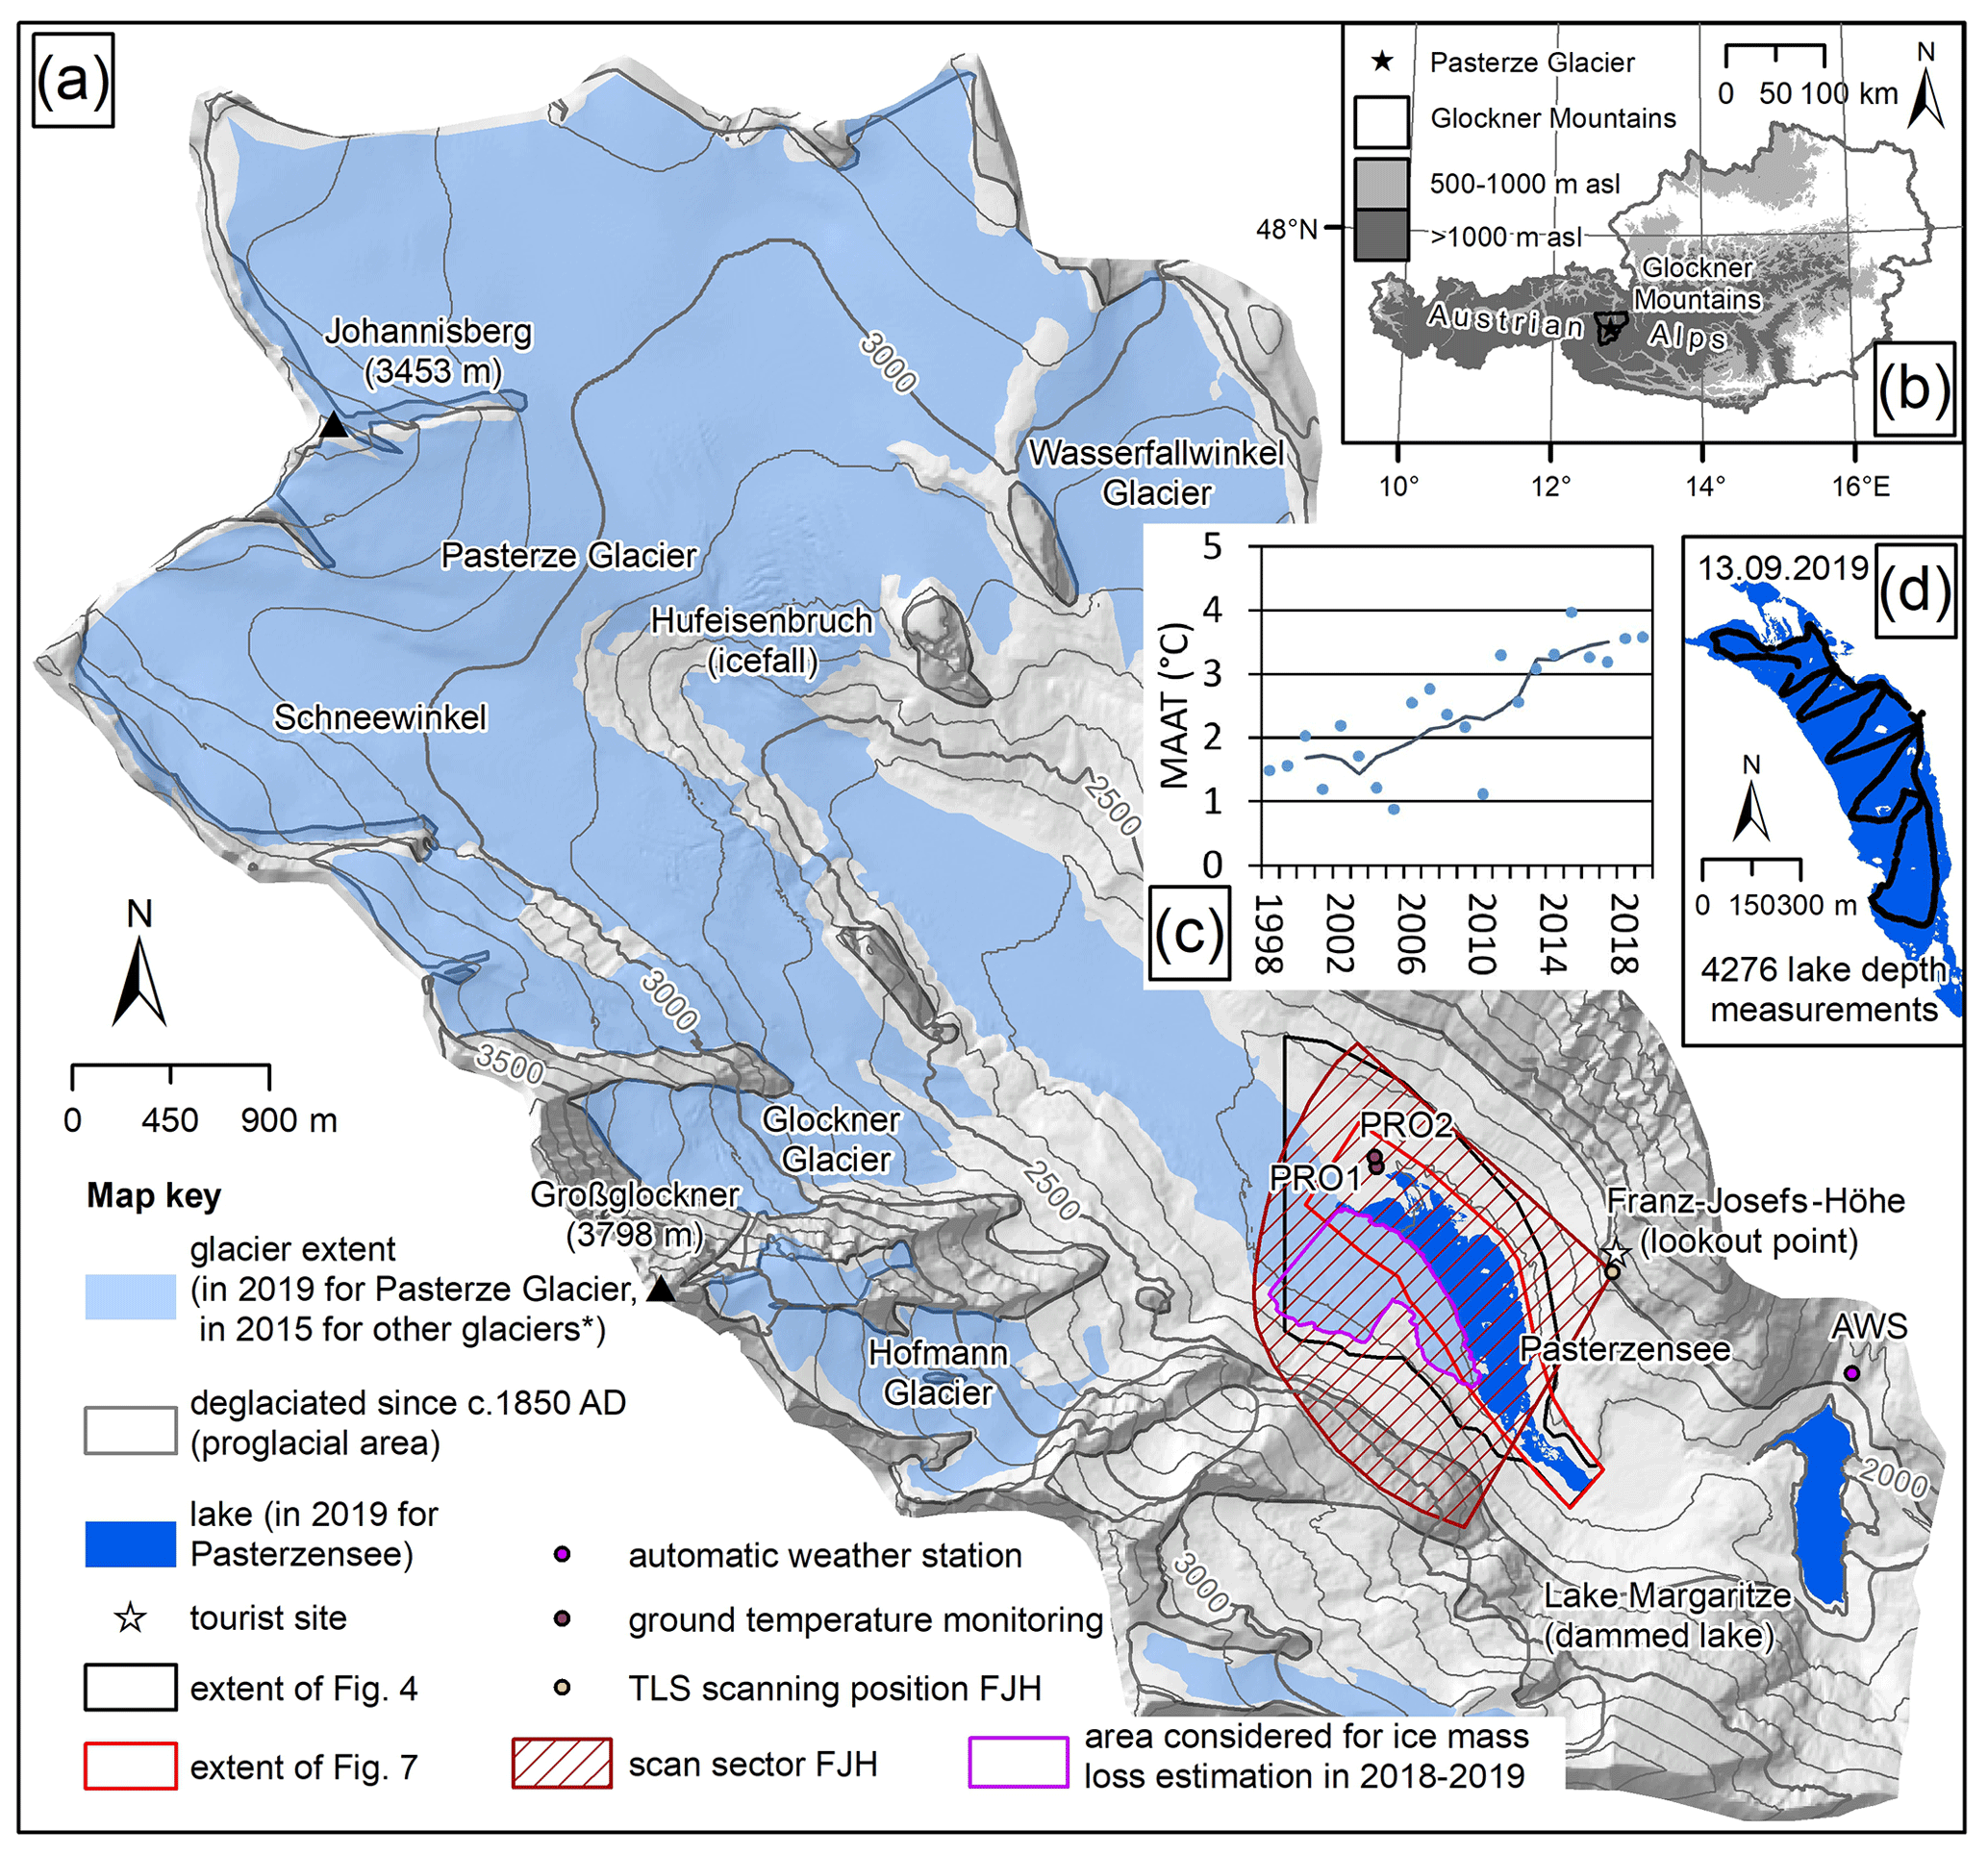
Figure 1Pasterze Glacier. (a) Location of Pasterze Glacier at the foot of Großglockner (3798 ). Relevant sites are indicated. (b) Location of the study area within Austria. (c) Mean annual air temperature (MAAT) at the automatic weather station (AWS) Margaritze in 1998–2019 (single years and 5-year running mean). (d) Position of 4276 lake depth measurements carried out on 13 September 2019. Hillshade in the background of (a) from 2012 source KAGIS. Extent of glacier and lake in 2019 this study. Glacier extent of 2015 (*) based on Buckel and Otto (2018). Glacier extent of ca. 1850 based on own mapping.

Figure 2Evolution of the proglacial area at Pasterze Glacier during a period of only 40 min (20 September 2016, from 09:15 to 09:55 CEST (UTC + 2), due to loss of hydrostatic disequilibrium and buoyancy as depicted by an automatic time-lapse camera (a–e) and observed in the field a few hours after the event (f–h). Note the sudden fracturing between 09:50 and 09:55. (a–e) Provided by GROHAG; (f–h) provided by Konrad Mariacher, 20 September 2016. See Supplement for a related animation.
The longest time series of length changes at Austrian glaciers has been compiled for Pasterze Glacier. Measurements at this glacier were initiated in 1879 and have been interrupted in only three of the years since. Furthermore, annual glacier flow velocity measurements and surface elevation changes at cross sections were initiated in the 1920s with almost continuous measurements since then (Lieb and Kellerer-Pirklbauer, 2018, Sect. 4.2 therein). Technical details of the measurement can be found in Kellerer-Pirklbauer et al. (2008) and Lieb and Kellerer-Pirklbauer (2018). Minor glacier advances at Pasterze Glacier have occurred in only seven of the years since 1879, the most recent of which was in the 1930s. Even during wetter and cooler periods (1890s, 1920s, and 1965–1980), the glacier did not advance substantially, which can be attributed to the long response time of the glacier (Zuo and Oerlemans, 1997). In 1959–2019, Pasterze Glacier receded by 1550 m, 3 times the mean value for all Austrian glaciers (520 m), related to its large size. Today, Pasterze Glacier is characterized by annual mean recession rates in the order of magnitude of 40 m yr−1 (Lieb and Kellerer-Pirklbauer, 2018) causing a rather high pace of glacial to proglacial landscape modification favouring paraglacial response processes (Ballantyne, 2002; Avian et al., 2018).
Analyses of brittle and ductile structures at the surface of the glacier tongue revealed that many of these structures are relict and independent from current glacier motion (Kellerer-Pirklbauer and Kulmer, 2019). The glacier tongue is in a state of rapid decay and thinning and thus prone to fracturing by normal fault formation. Englacial and subglacial melting of glacier ice caused the formation of circular collapse structures with concentric crevasses, which form when the ice between the glacier surface and the roof of water channels decreases. Kellerer-Pirklbauer and Kulmer (2019) concluded that the tongue of the Pasterze Glacier is currently turning into a large dead-ice body characterized by a strong decrease in ice replenishment from further up-glacier, movement cessation, accelerated thinning and ice disintegration by supra-, en- and subglacial ablation, allowing normal fractures and circular collapse features to develop. This rapid deglaciation and decrease in activity are favourable for dead ice and proglacial lake formation.
An automatic weather station is located close to the study area operated by VERBUND Hydro Power GmbH since 1982 (AWS in Fig. 1a). The coldest calendar year in the period 1998–2019 was 2005 with a mean annual air temperature (MAAT) of 0.9 ∘C whereas the warmest year was 2015 with 4.0 ∘C (range 3.1 ∘C, mean of the 22-year period 2.4 ∘C; Fig. 1c). Interannual variation is high although a warming trend is clear. A MAAT value >3 ∘C was calculated for 8 of the 9 years between 2011 and 2019. No such high MAAT values were recorded for the entire previous 28-year period 1982–2010 indicating significant recent atmospheric warming. Two ground temperature monitoring sites were installed near the lake in fluvio-glacial sediments in 2018 (PRO1 – one sensor at the surface; PRO2 – three sensors at the surface and at 10 and 40 cm depths; for location see Fig. 1a) using a GeoPrecision data logger equipped with PT1000 temperature sensors (accuracy of ±0.05 ∘C) and logging hourly. Positive mean values for a 363 d long period (13 September 2018–10 September 2019) were recorded for both sites (PRO1 2.6 ∘C, PRO2 3.7–3.9 ∘C) suggesting permafrost-free conditions in the proglacial area and unfavourable conditions for long-term dead-ice conservation even below a protecting sediment cover.
3.1 GNSS data
The terminus position of Pasterze Glacier was measured directly in the field by global navigation satellite system (GNSS) techniques in 14 years between 2003 and 2019 (annually between 2003 and 2005, in 2008, and annually between 2010 and 2019). Direct measurements of the subaerial glacier limit are essential in areas where debris cover obscures the glacier margin, hindering the successful application of remote-sensing techniques (e.g. Kaufmann et al., 2015; Avian et al., 2020). GNSS measurements were mostly carried out in September of the above-listed years, thus, close to the end of the glaciological years of mid-latitude mountain regions. Until 2013, a conventional GNSS technique was applied using different handheld Garmin devices (geometric accuracy in the range of metres). Afterwards, a real-time kinematics (RTK) technique was used, where correction data from the base station whose location is precisely known are transmitted to the rover (geometric accuracy in the range of centimetres). We utilized a Topcon HiPer V differential GPS system. Either the base station was our own local station (base-and-rover setup), or we obtained correction signals from a national correction-data provider (EPOSA, Vienna).
3.2 Airborne photogrammetry and land cover classification
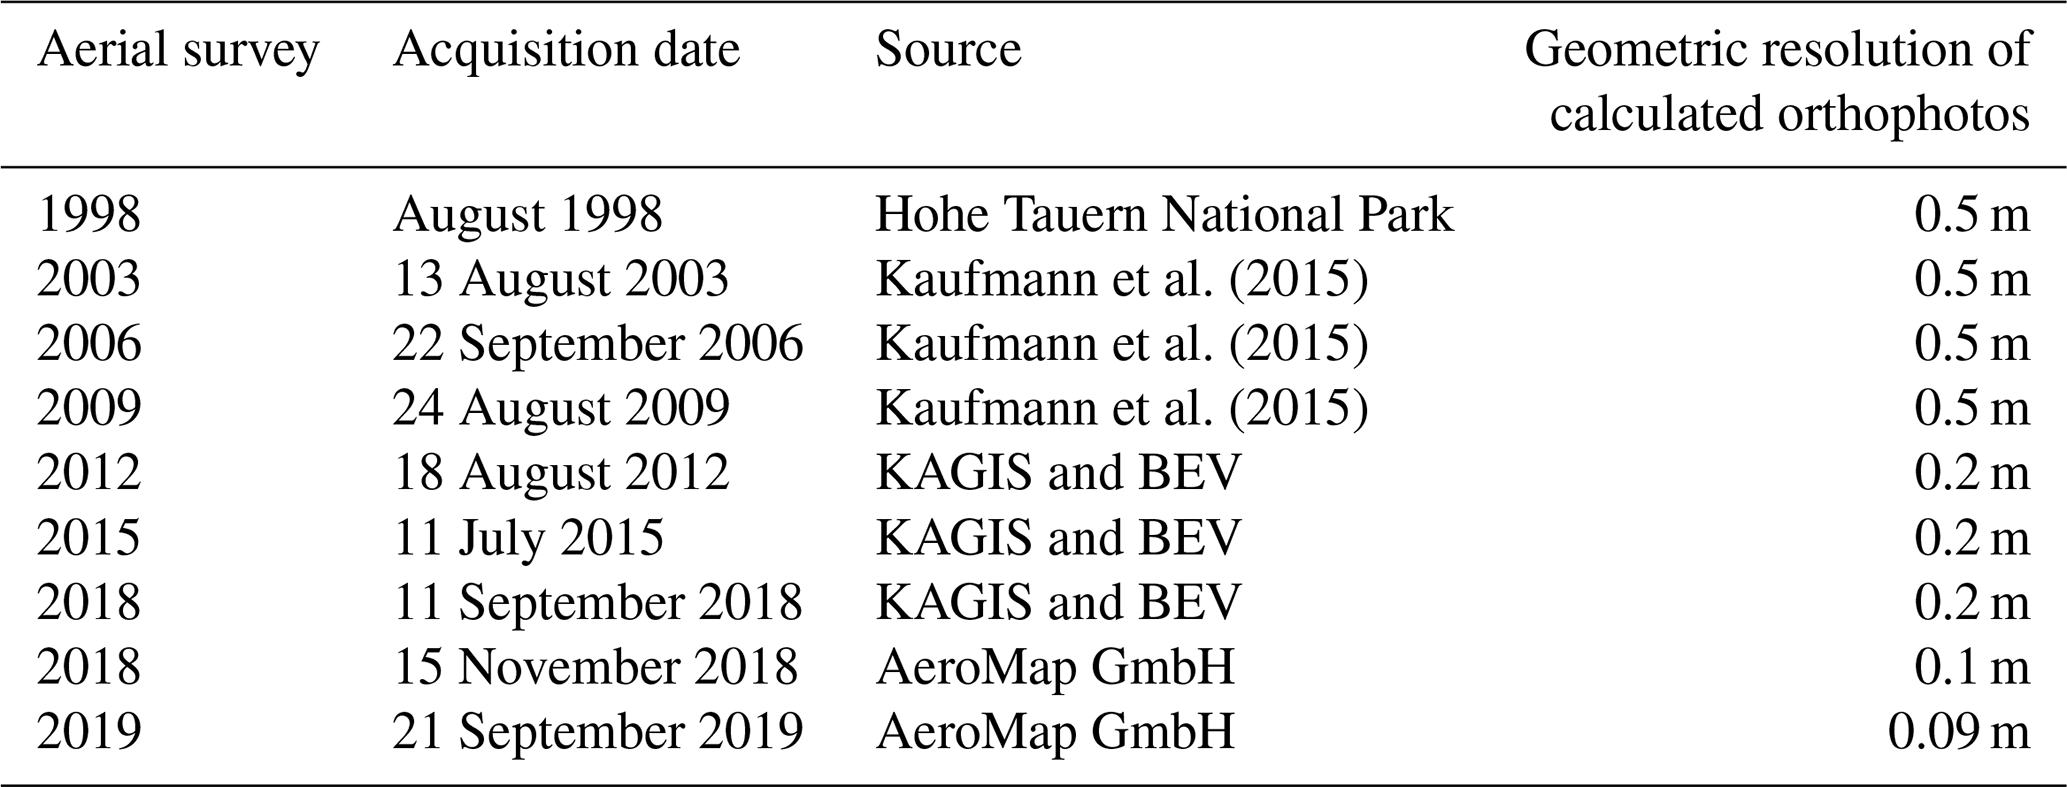
Nine sets of high-resolution optical images with a geometric resolution of 0.09–0.5 m derived from aerial surveys between 1998 and 2019 (Table 1) were available for land cover analyses. For the years 2003, 2006, and 2009, the planimetric accuracy of single-point measurements is better than ±20 cm (Kaufmann et al., 2015). Comparable planimetric accuracies can be expected for the other stages. The optical data sets were used for visual classification using a hierarchical interpretation key following a scheme developed for Pasterze Glacier by Avian et al. (2018) for laser-scanning data and modified later for optical data by Krisch and Kellerer-Pirklbauer (2019, Table 2 therein). Land cover classification was accomplished at a scale of 1:300 (for the stages 1998–2015; data based on Krisch and Kellerer-Pirklbauer, 2019) or 1:200 (2018/19; this study). The classification results for a 1.77 km2 area at Pasterze Glacier were published earlier by Krisch and Kellerer-Pirklbauer (2019, Fig. 3 therein) for 1998, 2003, 2006, 2009, 2012, and 2015. For a 0.37 km2 area, manual land cover classification was accomplished in this study for 2018 and 2019 using the same mapping key.
3.3 Terrestrial laser scanning
The glacial–proglacial transition zone of Pasterze Glacier has been monitored by terrestrial laser scanning (TLS) since 2001 from the scanning position Franz-Josefs-Höhe (FJH). The area of interest in the scan sector covers 1.2 km2 (Fig. 1a). Using scanning position FJH, one minor limitation of TLS-based data for glacier lake delineation is the oblique scan geometry causing data gaps due to scan-shadowed areas (Avian et al., 2018, 2020). Until 2009 the Riegl LPM-2K system was used followed by the Riegl LMS-Z620 system since then. Technical specifications regarding the two Riegl laser-scanning systems as well as the configuration of the geodetic network (scanning position and reference points) can be found in Avian et al. (2018). Processing and registration of the TLS data (point clouds) was performed in Riegl RiSCAN; subsequently digital terrain models (DTMs) (with 1 or 0.5 m grid resolution) were calculated in Golden Software Surfer. In this study we used the DTMs to delineate the water bodies in the scan sector manually (for details see Avian et al., 2020) supported by GNSS data (see above) for the glacier boundary. In addition, the point clouds acquired by TLS were used to quantify lake-level variations (see Sect. 3.4). TLS data from 2010 to 2019 (13 September 2010, 27 September 2011, 7 September 2012, 24 August 2013, 9 September 2014, 12 September 2015, 27 August 2016, 22 September 2017, 13 September 2018, and 3 August 2019) were analysed.
Table 1Technical parameters of aerial surveys between 1998 and 2019 used in this study. For 2003, 2006, and 2009 see also Kaufmann et al. (2015). KAGIS is the GIS Service of the Regional Government of Carinthia; BEV is the Federal Office of Metrology and Surveying.
Furthermore, we quantified changes in ice-surface elevation of Pasterze Glacier near the proglacial lake using TLS data from 13 September 2018 and 3 August 2019. This was done to assess ice volume losses by ablation at the lake-proximal part of the glacier in relation to ice mass losses by buoyant calving for the period of (roughly) August 2018 to August 2019 (see below). Although this data set does not cover an entire glaciological year, at least information about the order of magnitude of the spatially distributed direct ice mass losses by subaerial ablation near the shores of Pasterzensee is gained. The emergence velocity as well as the general glacier motion at the glacier terminus is close to zero (Kellerer-Pirklbauer et al., 2008; Kellerer-Pirklbauer and Kulmer, 2019) apart from ice movement related to crevasses or more steeply sloping areas (Seier et al., 2017). Therefore, we can assume that surface elevation changes at the glacier terminus between the two stages basically equal glacier ablation.
3.4 Time-lapse photography
At Pasterze Glacier six remote digital cameras (RDCs) are installed to monitor mainly glaciological processes with a very high temporal resolution (see Avian et al., 2020, overview regarding the six cameras). One time-lapse camera was operated by the Großglockner Hochalpenstraße AG (GROHAG) using a Panomax system. The model used is a Roundshot Livecam Generation 2 (Seitz, Switzerland) with a recording rate of mostly 5 min during daylight. Time specification is local time, i.e. CET (UTC + 1) during winter (October–March) and CEST (UTC + 2) during summer (April–September). Local time is used in the entire paper. The camera is installed at the Franz-Josefs-Höhe lookout point (Fig. 1a) at an elevation of 2380 and, thus, 310 m above the present lake level of Pasterzensee. Based on this optical data, Kellerer-Pirklbauer et al. (2017) reported a sudden ice-disintegration event at the glacier lake in September 2016 where tilting, lateral shifting, and subsidence of the ground accompanied by complete ice disintegration of a debris-covered ice body occurred. For this study, we visually checked all available Panomax images from 2016 to 2019. Four large-scale and rapidly occurring ice-breakup events (IBEs) were detected in the period September 2016 to October 2019 (IBE1 20 September 2016, IBE2 9 August 2018, IBE3 26 September 2018, IBE4 24 October 2018). The effects on the proglacial landscape during these four IBEs were quantitatively analysed as follows.
For the orthorectification process of the Panomax images (7030×2048 px) it is necessary to find a suitable mathematical model. To obtain the necessary parameters for this model, control points are needed which are visible in both the Panomax images and pre-existing orthophotos used for the orthorectification process. We applied an interpolation approach using the rubber-sheeting model in ERDAS IMAGINE 2018. This model calculates a triangulated irregular network (TIN) for all control points at the reference orthophoto and at the Panomax image and transforms the calculated triangles of the oblique images in such a way that they equal the ones of the reference orthophoto. First-degree polynomials were used for the transformation within the triangles. Only control points at the lake level were utilized to achieve a maximum accuracy for lake-level objects. Reasons for minor geometric errors in the analysed orthorectified images were changes in the lake level or an offset of the camera (maximum of 5 px).
To assess the potential effect of lake-level changes on geometric errors in the orthorectified images, we quantified lake-level variations by using GNSS and TLS data. We compared lake-level data from nine different GNSS campaigns over a 5-year period (17 September 2015–22 September 2020, all from the period between 11:00 and 15:00). Geometric accuracy is in the range of centimetres based on comparison with stable points. Results yield a mean elevation of 2069.54 ranging from 2069.87 (17 September 2015) to 2069.19 (22 September 2020) and thus a range of 0.68 m with a tendency towards lake-level lowering over time (Fig. 4c). In addition, we measured the elevation of small and fresh-looking lake terraces next to the glacier terminus on 14 September 2020 with GNSS yielding an elevation range of 0.59 m. This small elevation range is also in accordance with the lake-level elevations measured by GNSS during two consecutive field campaigns on 14 and 22 September 2020 with a difference of 0.53 m. TLS-based lake-level estimation was accomplished for six dates in the period 2014–2019 (see Sect. 3.3) by identifying the lowest level of the point cloud at the lake shore (mean elevation of lowermost measurement points at the lake shore). Based on TLS data we observed a lake-level variation on the order of 0.8 m and a trend in lake-level lowering during this period. Therefore, as judged from our long-term as well as short-term GNSS and TLS data, we demonstrate rather stable lake-outflow as well as lake-level conditions at least for the period 2015–2020 with a lake-level lowering trend. The assumption of long-term lake-level variations of <1 m during the summer months (seasonal amplitude) is further supported by field observations made during the last few years with the shape (stepped geometry) and size (<1 m vertical extent) of thermo-erosional notches at the waterline. Therefore, the potential effect of lake-level changes on geometric errors in the orthorectified images should be small.
Three groups of control points were generated using the three pre-existing orthophotos of 11 July 2015, 11 September 2018, and 15 November 2018 (Table 1) and suitable Panomax images from the same days. For the IBE1 we used the model of 11 July 2015, for IBE2 and IBE3 the model of 11 September 2018, and for IBE 4 the one of 15 November 2018. The calculated orthorectified images have a geometric resolution of 0.2 m. ArcGIS 10.5 was subsequently used to analyse landform changes.
3.5 Quantification of ice mass losses by buoyant calving
A quantification of ice losses by buoyant calving was attempted by using the Panomax images. Three of the large-scale ice-breakup events occurred between August and September 2018 (IBE2 to IBE4). For these events we estimated the volume of the newly emerging icebergs and the volume of uplifted ice masses detaching from the subaquatic glacier ice. The latter was accomplished by comparing the calculated volume of a given ice mass (e.g. a debris-covered ice slab) before and after the ice-breakup event. For volumetric calculations we applied the following approach. The horizontal extent of affected (newly emerged or uplifted) ice masses was transferred back to and drawn into the original webcam images. A maximum iceberg height was also drawn as a line in the original webcam image. The length of this line was then quantified by using the ratio between the quantified horizontal extent and the marked line. The iceberg height was then obtained by applying a correction calculation for the camera distortion produced by an incidence angle of 25∘ (calculated by a height difference of 310 m and a horizontal distance of approx. 650 m).
The volume of individual icebergs was approximated by assuming that all ice bodies above the waterline have the form of a truncated pyramid, where A2 is 20 % (for dome-shaped iceberg), 50 % (for mixed iceberg type), or 80 % (for tabular iceberg) of A1. The volume of a truncated pyramid (iceberg above the waterline) with an irregular base is given by
with A1 being area at the waterline (larger base), A2 being area of the top face (smaller base, in our cases 20 %, 50 %, or 80 % of A1 depending on iceberg type), and h being the maximum height of the iceberg or truncated pyramid (Harris and Stöcker, 1998). With this approach we quantified the volume of nine icebergs for IBE2 (9 August 2018), eight for IBE3 (26 September 2018), and two for IBE4 (24 October 2018). The volume above the waterline was then multiplied by 10 to calculate the total iceberg volume. Significant uncertainties in this quantification attempt are the visual and thus subjective estimation of the iceberg height and the fact that only large icebergs are considered. Therefore, results of this approach must be seen only as orders of magnitude of ice mass losses by buoyant calving in the period 9 August to 24 October 2018.
3.6 Electrical resistivity tomography
Electrical resistivity tomography (ERT) and seismic refraction (SR) were applied in the study area between 2015 and 2019. For space reasons, we focus only on selected aspects of the ERT results in this paper. Electrical resistivity is a physical parameter related to the chemical composition of a material and its porosity, temperature, and water and ice content (Kneisel and Hauck, 2008). For ERT a multielectrode and multichannel system (GeoTom 2D system, Geolog, Germany) and two-dimensional data inversion (RES2DINV) using finite-difference forward modelling and quasi-Newton inversion techniques (Loke and Parker, 1996) was applied. ERT was carried out at a total of 43 profiles (3 in 2015, 4 in 2016, 4 in 2017 – Fig. 3a and b, 5 in 2018, and 27 in 2019 – Fig. 3c) with 2 or 4 m electrode spacing and profile lengths of 80–196 m. Saltwater was sometimes used at the electrodes to improve electrical contact. RTK GNSS was applied to measure the position of each electrode and thus the course of the profile (Fig. 3b). We applied in most cases both the Wenner and the Schlumberger arrays (Kneisel and Hauck, 2008). Focus is given here on the Wenner results, which are more suitable for layered structures (Kneisel and Hauck, 2008). ERT data from 2015 and 2016 were taken from Hirschmann (2017) and Seier et al. (2017). The apparent resistivity data were inverted in RES2DINV using the robust inversion modelling. ERT data were checked before processing for abnormally high or low resistivity values. Abnormal values are commonly related to measurement errors and/or bad electrode contact usually visible at all depths. Such “bad datum points” were excluded manually (Kneisel and Hauck, 2008). The number of iterations was stopped when the change in the RMSE between two iterations was small.
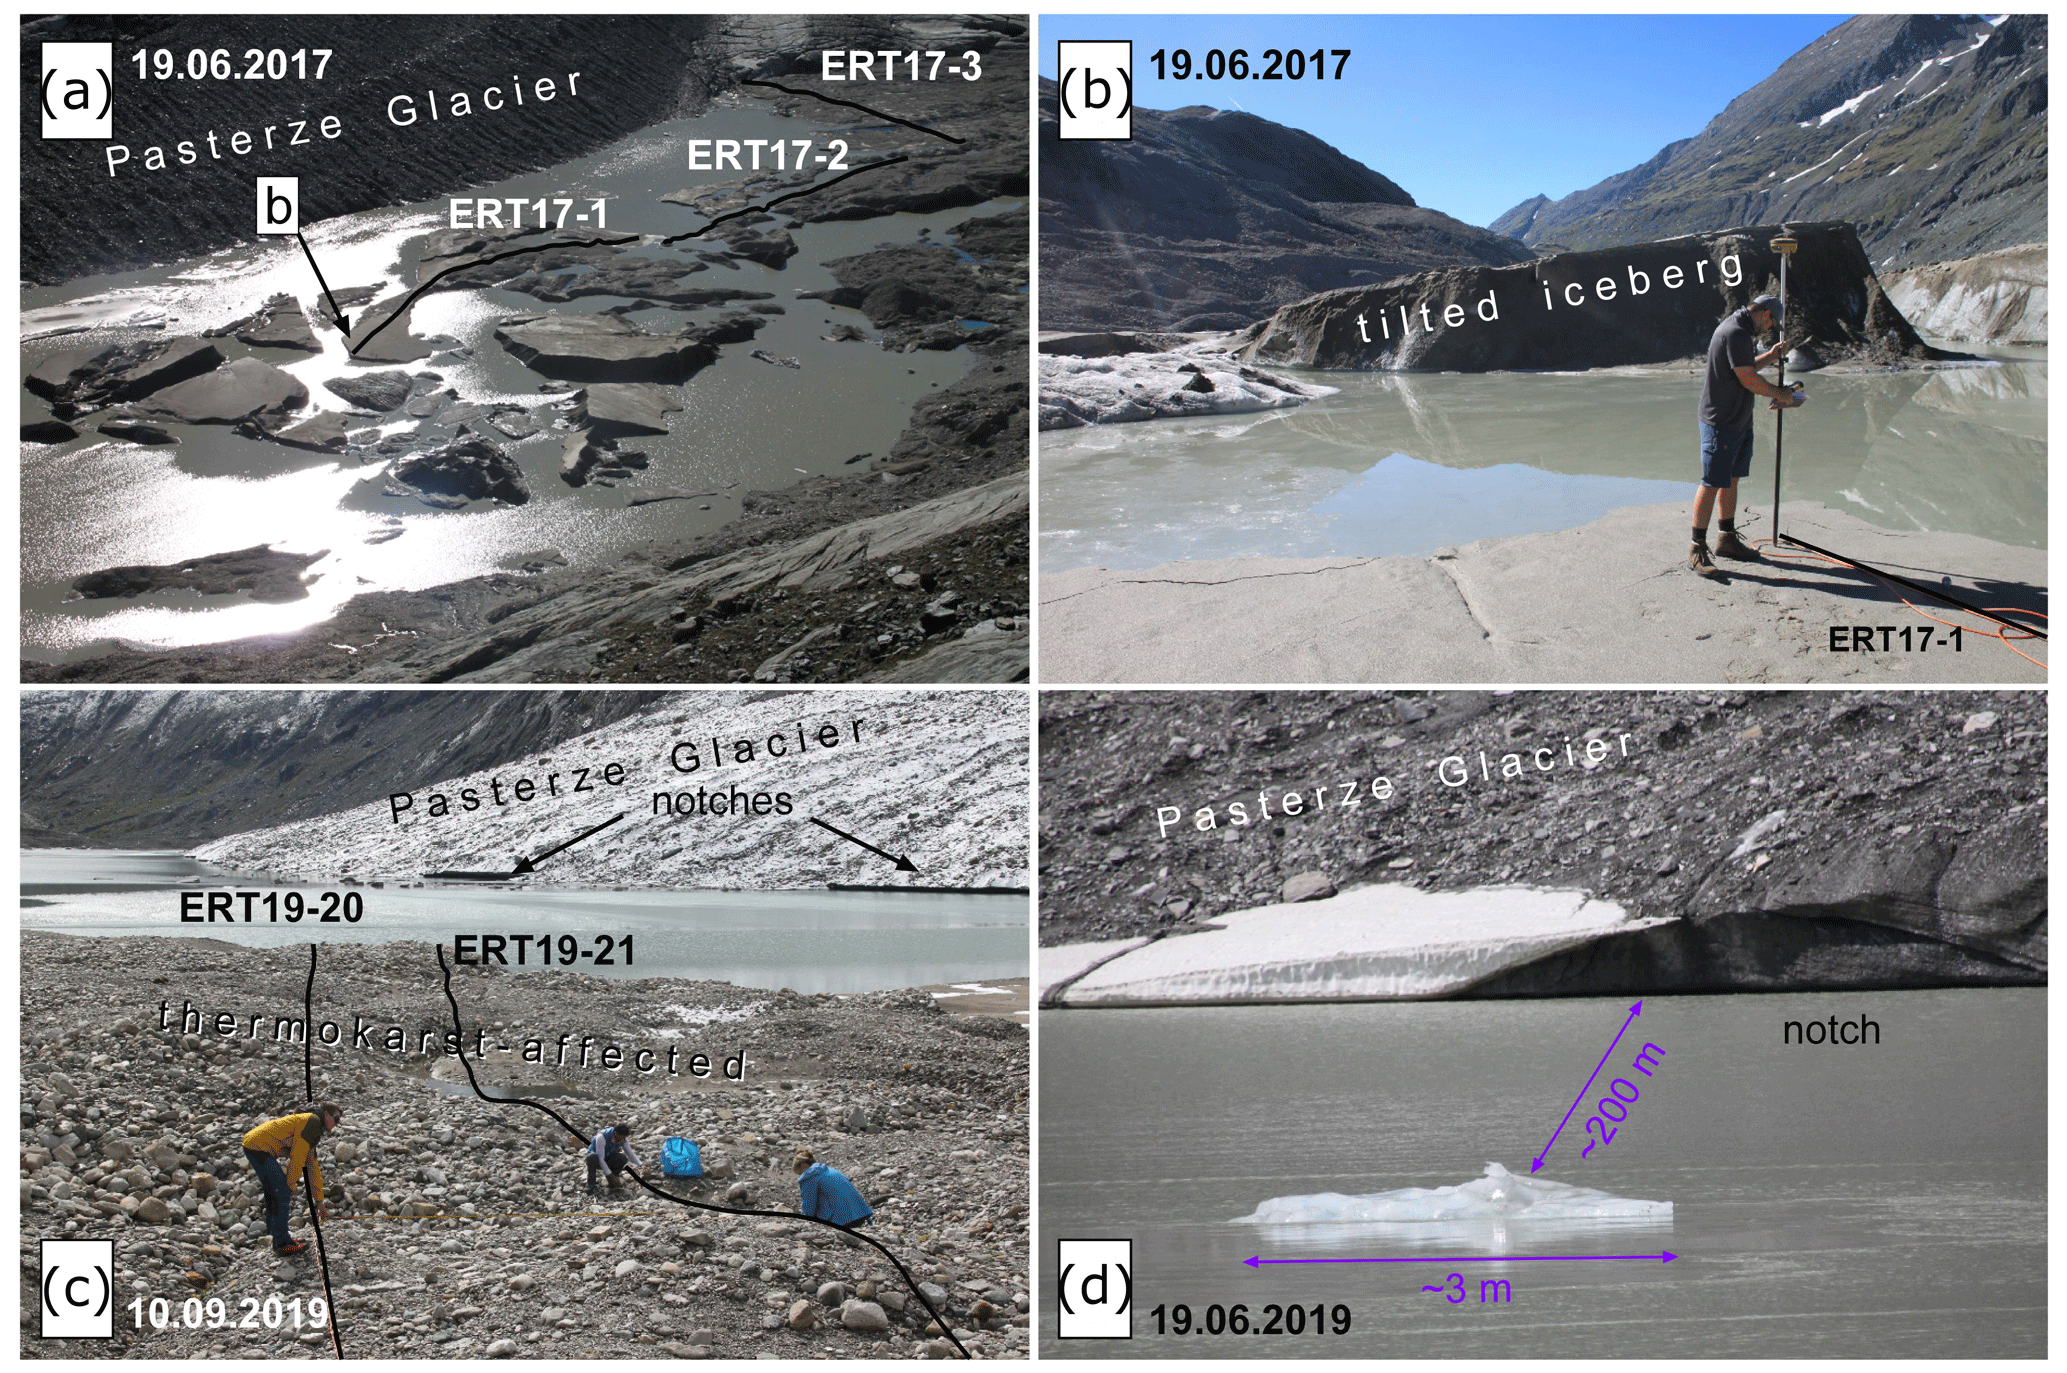
Figure 3Field impressions of the ice-contact lake and its close surrounding: (a) overview image depicting the distribution of water bodies, icebergs, and debris-covered dead-ice bodies on 19 June 2017. Courses of ERT profiles presented in Fig. 9 are shown. (b) Starting point of ERT17-1 surveyed by GNSS. (c) Thermokarst-affected area with courses of two ERT profiles on 10 September 2019. Note Pasterze Glacier and thermo-erosional notches at the lake level. (d) Buoyant calving of a small iceberg (“shooter”) ca. 200 m from the subaerial glacier front observed during fieldwork (all photographs by Andreas Kellerer-Pirklbauer).
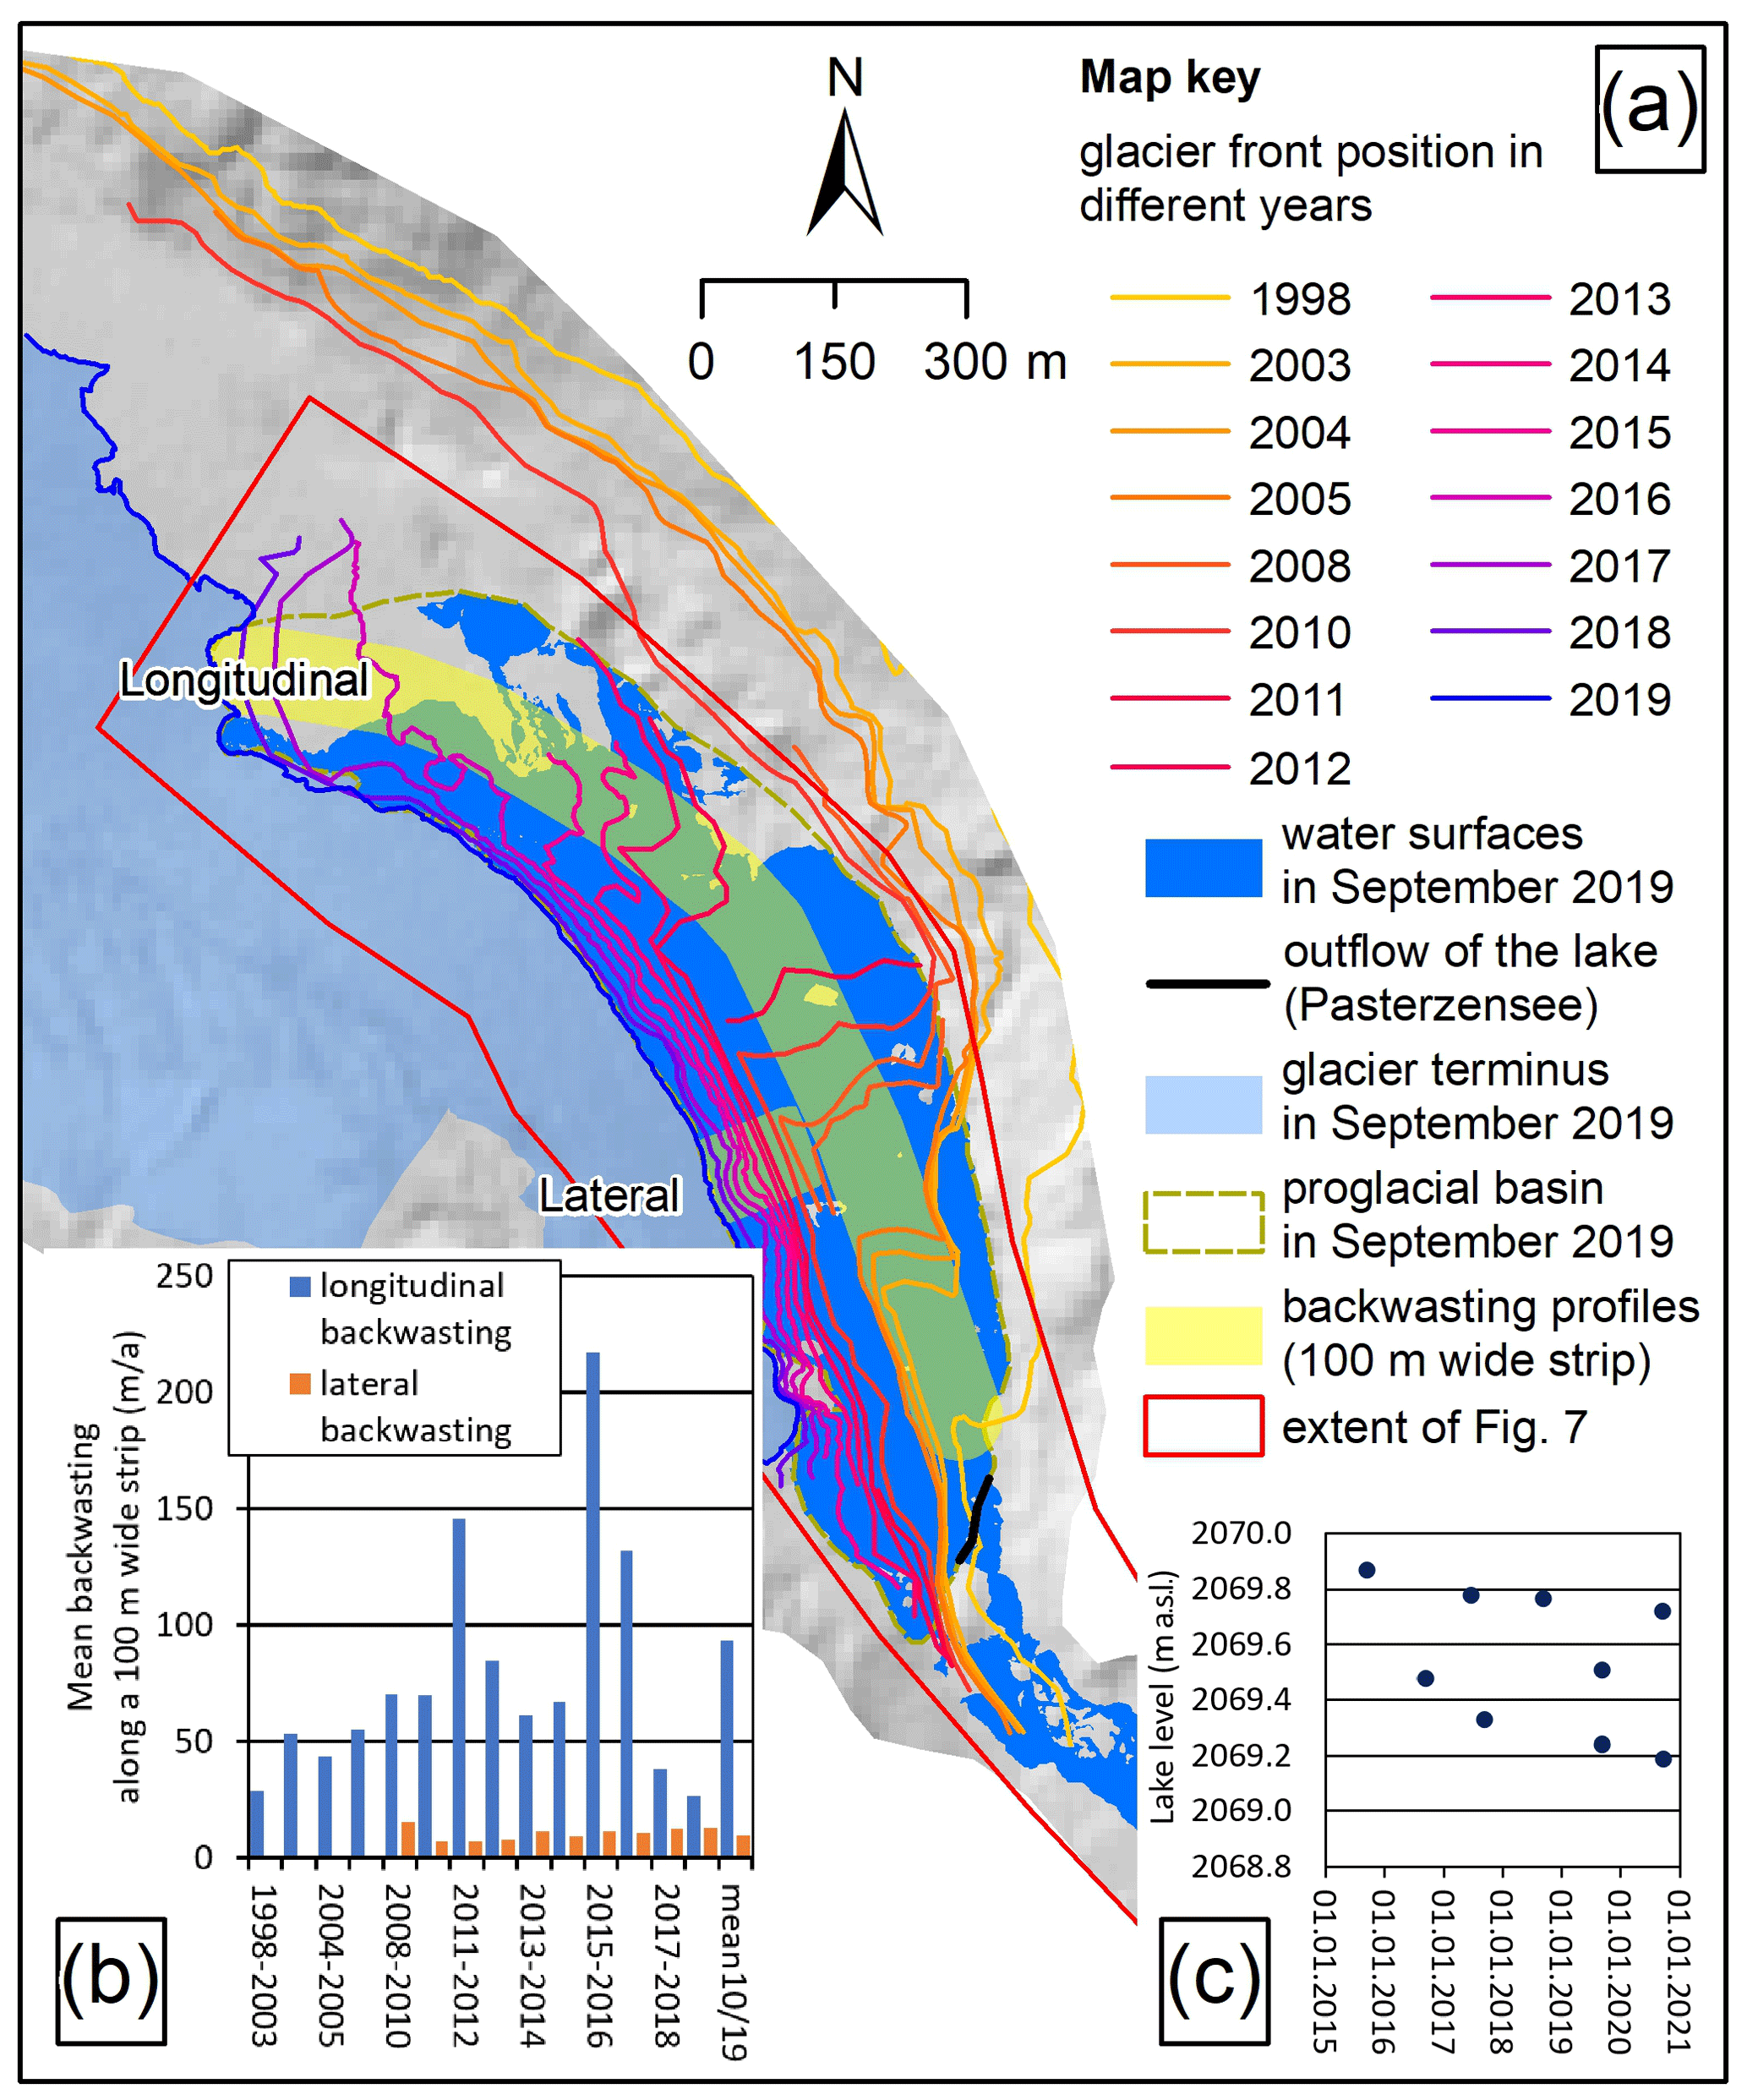
Figure 4Terminus position of Pasterze Glacier for the period 1998 to 2019 and lake-level variability in Pasterzensee in the period 2015 to 2020 derived mainly from sequential GNSS data. (a) The extent of water surfaces including Pasterzensee and the delineation of the proglacial basin is shown for September 2019. The 100 m wide profiles (lateral and longitudinal) used for backwasting calculations are indicated. Backwasting results are depicted in (b) (background hillshade based on 10 m DTM, KAGIS). (c) Lake-level elevations for nine stages between 17 September 2015–22 September 2020 (all between 11:00 and 15:00).
3.7 Bathymetry
Sonar measurements were carried out at Pasterzensee on 13 September 2019. Water depth in the lake was measured with a Deeper Smart Sonar CHIRP+ system (depth range 0.15–100 m) consisting of an echo-sounding device (single-beam echo sounder) and a GNSS positioning sensor. CHIRP stands for compressed high-intensity radar pulse. We measured with 290 kHz (cone angle 16∘) and a sonar scan rate of up to 15 s−1. According to the producer, the 16∘ beam angle of the 290 kHz frequency results in a ground footprint of 0.28 m at 1 m water depth, of 2.81 m at 10 m water depth, and of 11.24 m at 40 m water depth. These footprint values are not optimal for resolving small-scale features at large water depths. However, as it was intended in this study, the footprint values are acceptable for obtaining an overview of the lake geometry.
The accuracy of raw water-depth measurements depends on the device used, beam angle, sonar stability, bottom composition, and structure. Bandini et al. (2018) compared the Deeper Smart Sensor PRO+ system (precursor of CHIRP+) against the ground truth. Their results indicate a mean absolute error of 0.52 m for water depths of up to 30 m with almost perfect fit (ground truth vs. sonar) at shallow sites. The tested PRO+ system underestimated the water depth attributed to the beam diameter as it tends to take the shallowest point in the beam as the depth reading when going over holes or slopes. No such comparative studies are published for the CHIRP+ system. However, according to the producer the absolute error should be lower for the CHIRP+ system (personal communication by the technical support of Deeper, 16 December 2020). In conclusion, the estimated accuracy of raw water-depth measurements should be less than 0.1 m at shallow (<5 m) and flat sites but might be as high as 0.5 m for deeper and sloping locations.
The CHIRP+ system was mounted on a Styrofoam platform for stability reasons and dragged behind a small (and rather unstable) inflatable canoe operated by two people. Altogether 4276 water-depth measurements along a 4.3 km long route were accomplished (Fig. 1d). Because icebergs and wind cause boat instability, the canoe was not navigated along a regular shore-to-shore route but rather in a zigzag mode starting in the northwest of the lake and ending in the southeast. GNSS and water-depth data were imported into ArcGIS for further analysis. To compute the lake geometry, the measured lake depth values and a lake mask of September 2019 were combined using the Topo to Raster interpolation tool to calculate a digital terrain model (DTM) with a 5 m grid resolution. Lake volume was calculated using the functional surface toolset.
4.1 Glacier recession and areal expansion of the lake
Figure 4a depicts the terminus positions between 1998 and 2019 as well as the proglacial water surfaces including Pasterzensee and the proglacial basin as defined for September 2019 (area of 0.365 km2). The glacier steadily receded into the current proglacial basin over a longitudinal distance of about 1.4 km. In detail, however, this recession was not evenly distributed along the glacier margin due to differential ablation below the uneven supraglacial debris. The east part of the glacier tongue receded up-valley beyond the proglacial basin. The west part of the glacier tongue is still in contact with the proglacial lake and changed morphologically rather little during the last 2 decades. Figure 4a also depicts 100 m wide strips where mean values for longitudinal and lateral backwasting were calculated. Results are shown in Fig. 4b. The longitudinal backwasting rate was between 29.0 and 217.2 m yr−1, 2 to 19 times larger than the lateral backwasting rate of 7.3 to 13.2 m yr−1. High annual longitudinal backwasting rates were measured in most years when the glacier was in the basin. Since 2017, this rate has drastically dropped, presumably due to the detachment of the glacier from the lake.
Figure 5 illustrates glacier recession and the evolution of proglacial water bodies for the period 1998–2019 in relation to the 0.365 km2 proglacial basin as defined for September 2019. An animation showing the general evolution of the proglacial lake between 2010 and 2020 is published in the Supplement. In 1998 only 0.5 % of the basin was covered by water (Fig. 5a). Up to 2006, water surfaces still covered less than 5 % of the basin (Fig. 5c). By 2009, this value increased to 11.2 % (Fig. 5d) and was rather constant until 2 years later (Fig. 5f). By 2016, more than 50 % of the basin was covered by water (Fig. 5k), and in 2019 water surfaces in the basin covered 83.2 % (Fig. 5n). The increase in water surface areas in the basin since 1998 follows an exponential curve (Fig. 6a). However, in single years this areal increase follows a distinct pattern with enlargement of water surfaces during summer and a decrease in autumn due to lake-level lowering as revealed by field observations. The exceptionally low value of November 2018 (62.4 %) in relation to September 2018 (73.2 %) is related to the widespread existence of ice floes. Figure 6a also depicts the extent of icebergs in the proglacial basin with values below 1 % in most cases. High percentage values were only mapped for 15 November 2018 (7.3 %) followed by rapid iceberg loss during the ablation season in 2019.
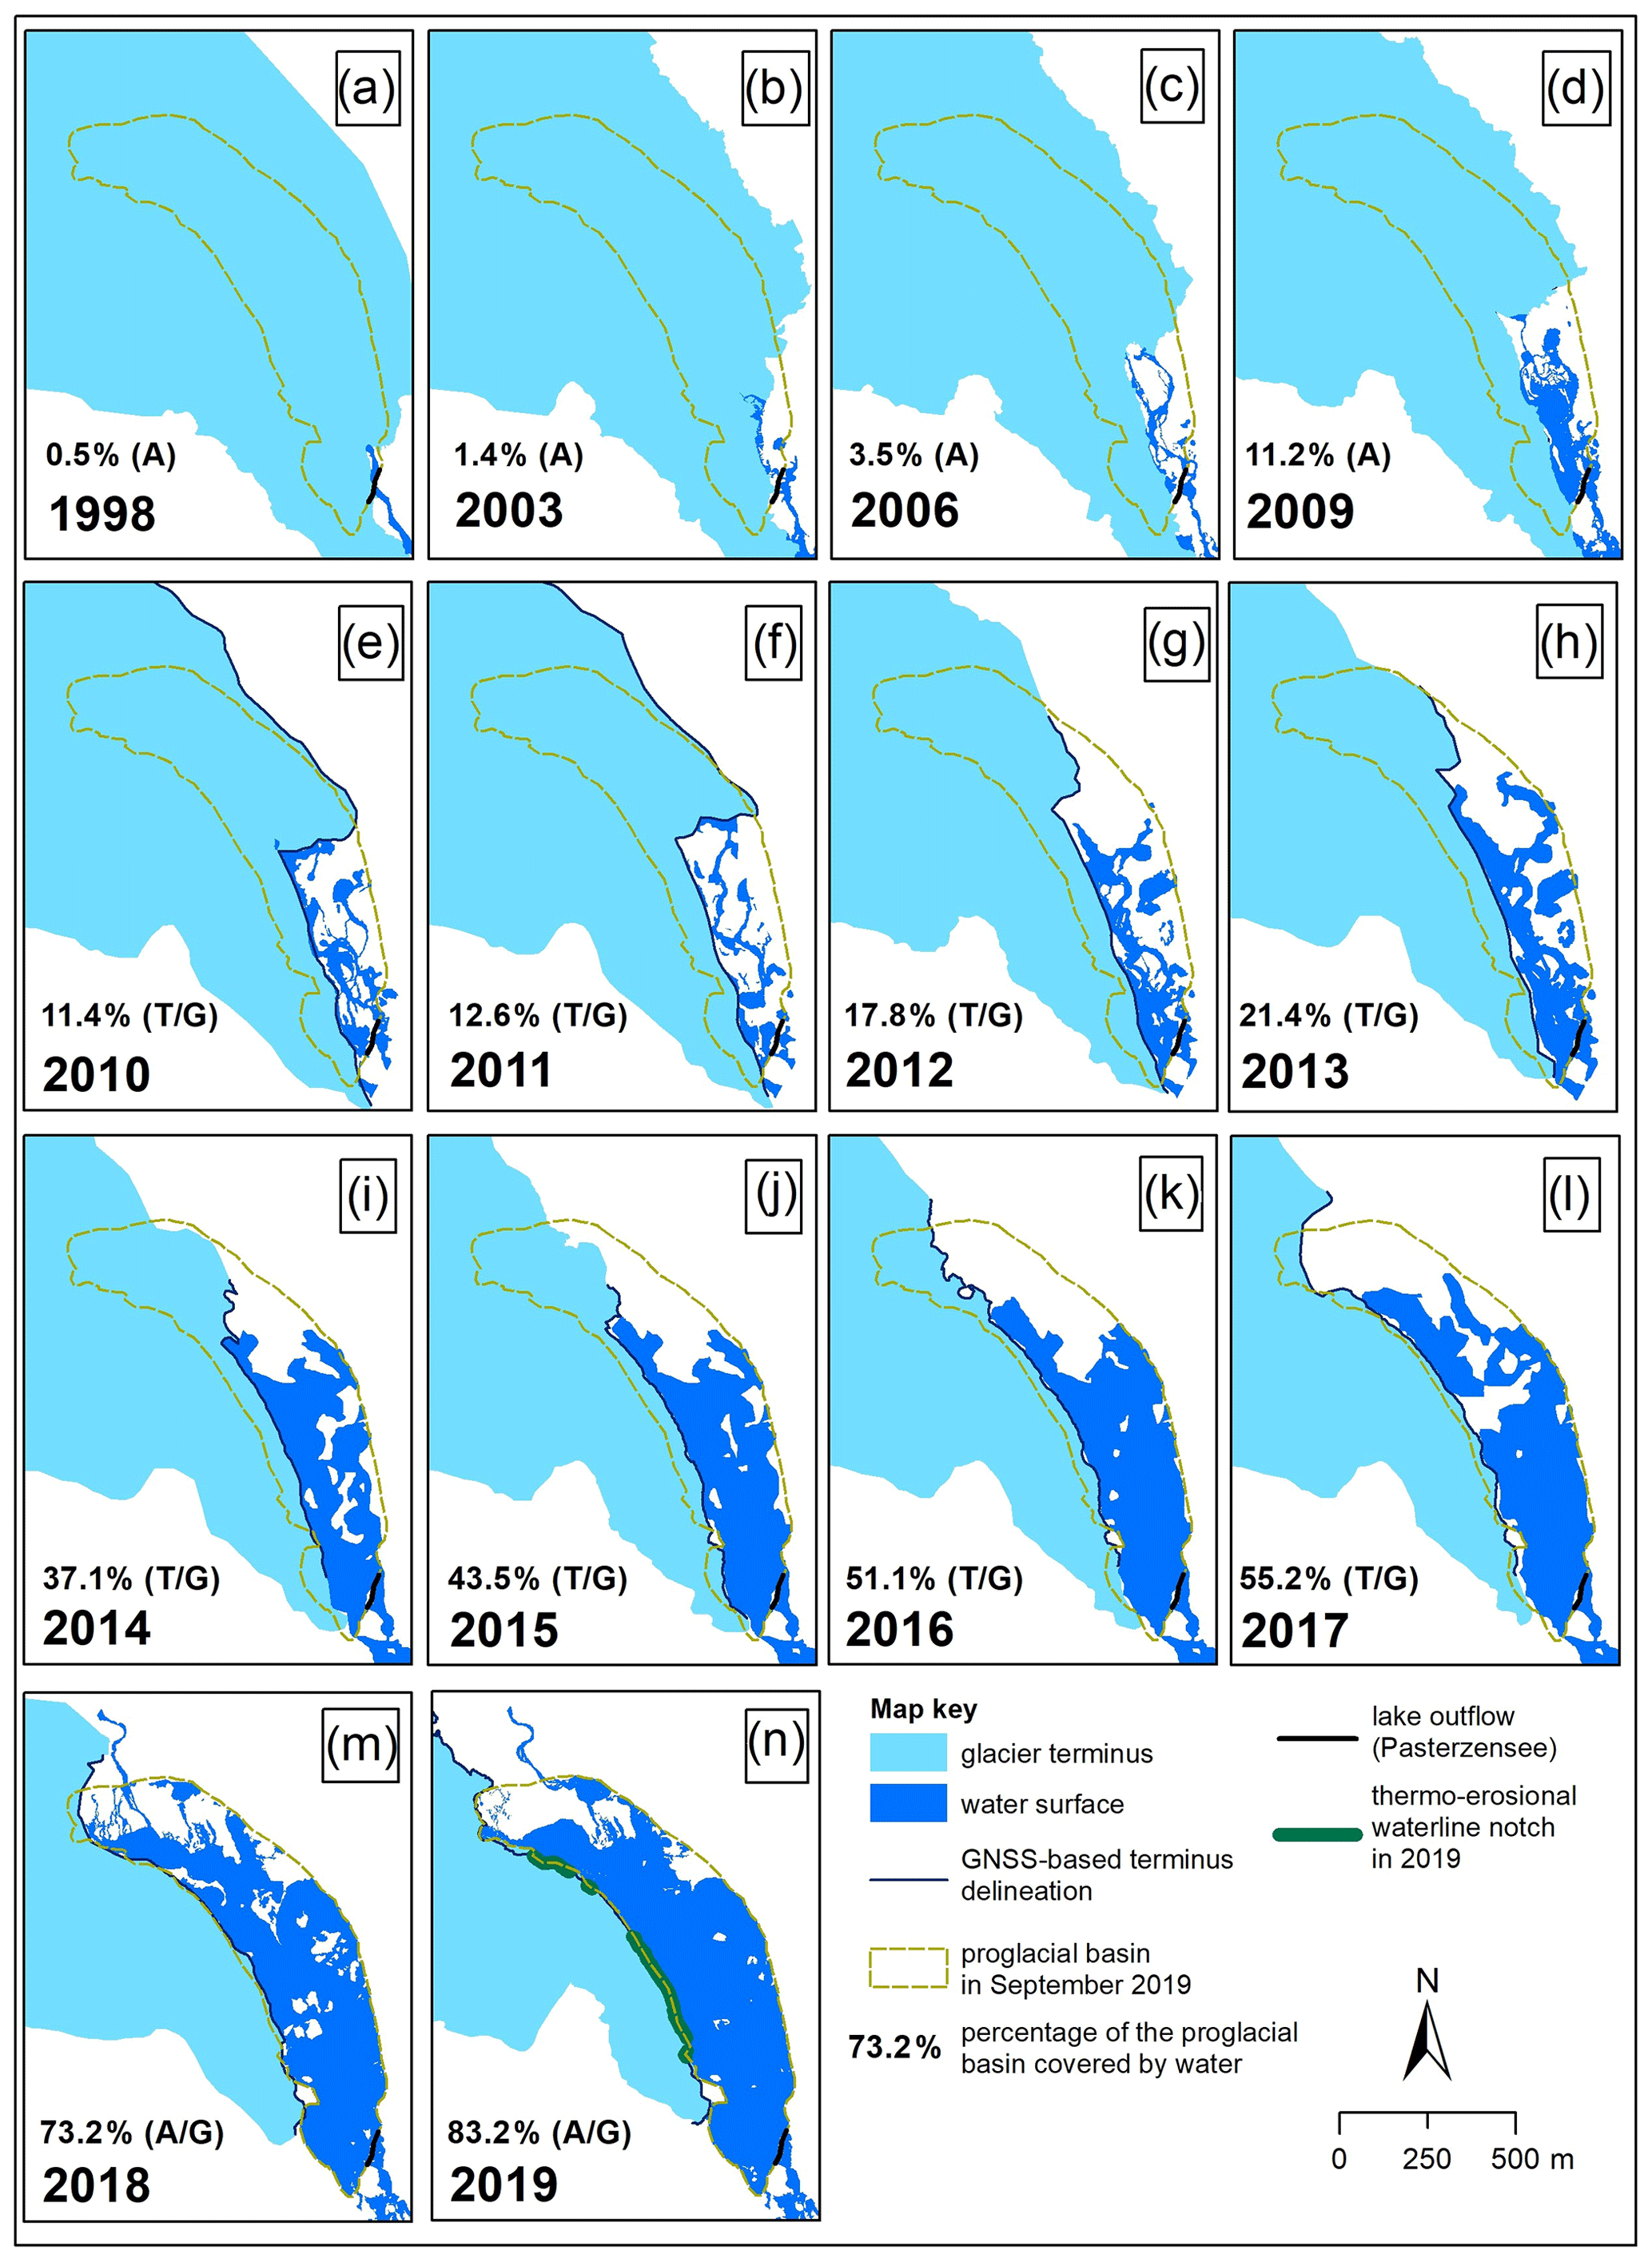
Figure 5Glacier recession and evolution of proglacial water surfaces since 1998 at Pasterze Glacier. The proglacial basin as defined for September 2019 is depicted on all maps for comparison. For data sources refer to text and Table 1. A is airborne photogrammetry; T is terrestrial laser scanning; G is GNSS.
4.2 Land cover change in the lake-proximal surrounding since 1998
Different glacial and proglacial surface types and landforms were mapped for a 0.76 km2 area in the glacial–proglacial transition zone for nine different stages between 1998 and 2019 (Fig. 7). The visual landform classification gives a more detailed picture on landform changes in the area of interest. Figure 6b quantitatively summarizes the relative changes in different surface types in this transition zone. Debris-poor, rather clean ice covered 58 % of the area in 1998, decreased to 9.3 % until 2015, and vanished afterwards from the area. In contrast, debris-rich glacier parts covered in all nine stages between 20.5 % (2019) and 33.4 % (2015) of the transition zone. For this class, areal losses due to glacier recession were partly compensated for by areal gains due to an increase in supraglacial debris-covered areas. Water surfaces increased from 2.1 % in 1998 to 45.5 % in 2019. The low value for 15 November 2018 is related to ice floes (3.4 %), and data gaps (4.1 %), as well as to high values for both debris-rich (2.1 %) and debris-poor (1.5 %) icebergs. Areas covered by bedrock and vegetation were always around 4 %. Areas covered by fine-grained sediments reached a maximum in 2012, decreasing substantially afterwards (mainly due to lake extension). Areas covered by coarse-grained sediments increased from 3.3 % in 1998 to about 26 %–27 % in 2018 and 2019 and are located at the northern and eastern margin of the basin. Finally, dead-ice holes were mapped for all stages, but their spatial extent was always very small (maximum in 2012 with a total area of 618 m2) and covered less than 0.1 % of the basin.

Figure 6Glacial–proglacial transition zone: (a) evolution of water surfaces and icebergs in the proglacial basin (100 %=0.37 km2; Fig. 5 for delineation) of Pasterze Glacier since 1998 based on airborne photogrammetry (A) or terrestrial laser-scanning (T) data. Icebergs only based on airborne photogrammetry (A). (b) Summarizing graph depicting relative changes in different surface types in the glacial–proglacial zone (100 %=0.76 km2; extent as shown in Fig. 7) since 1998.
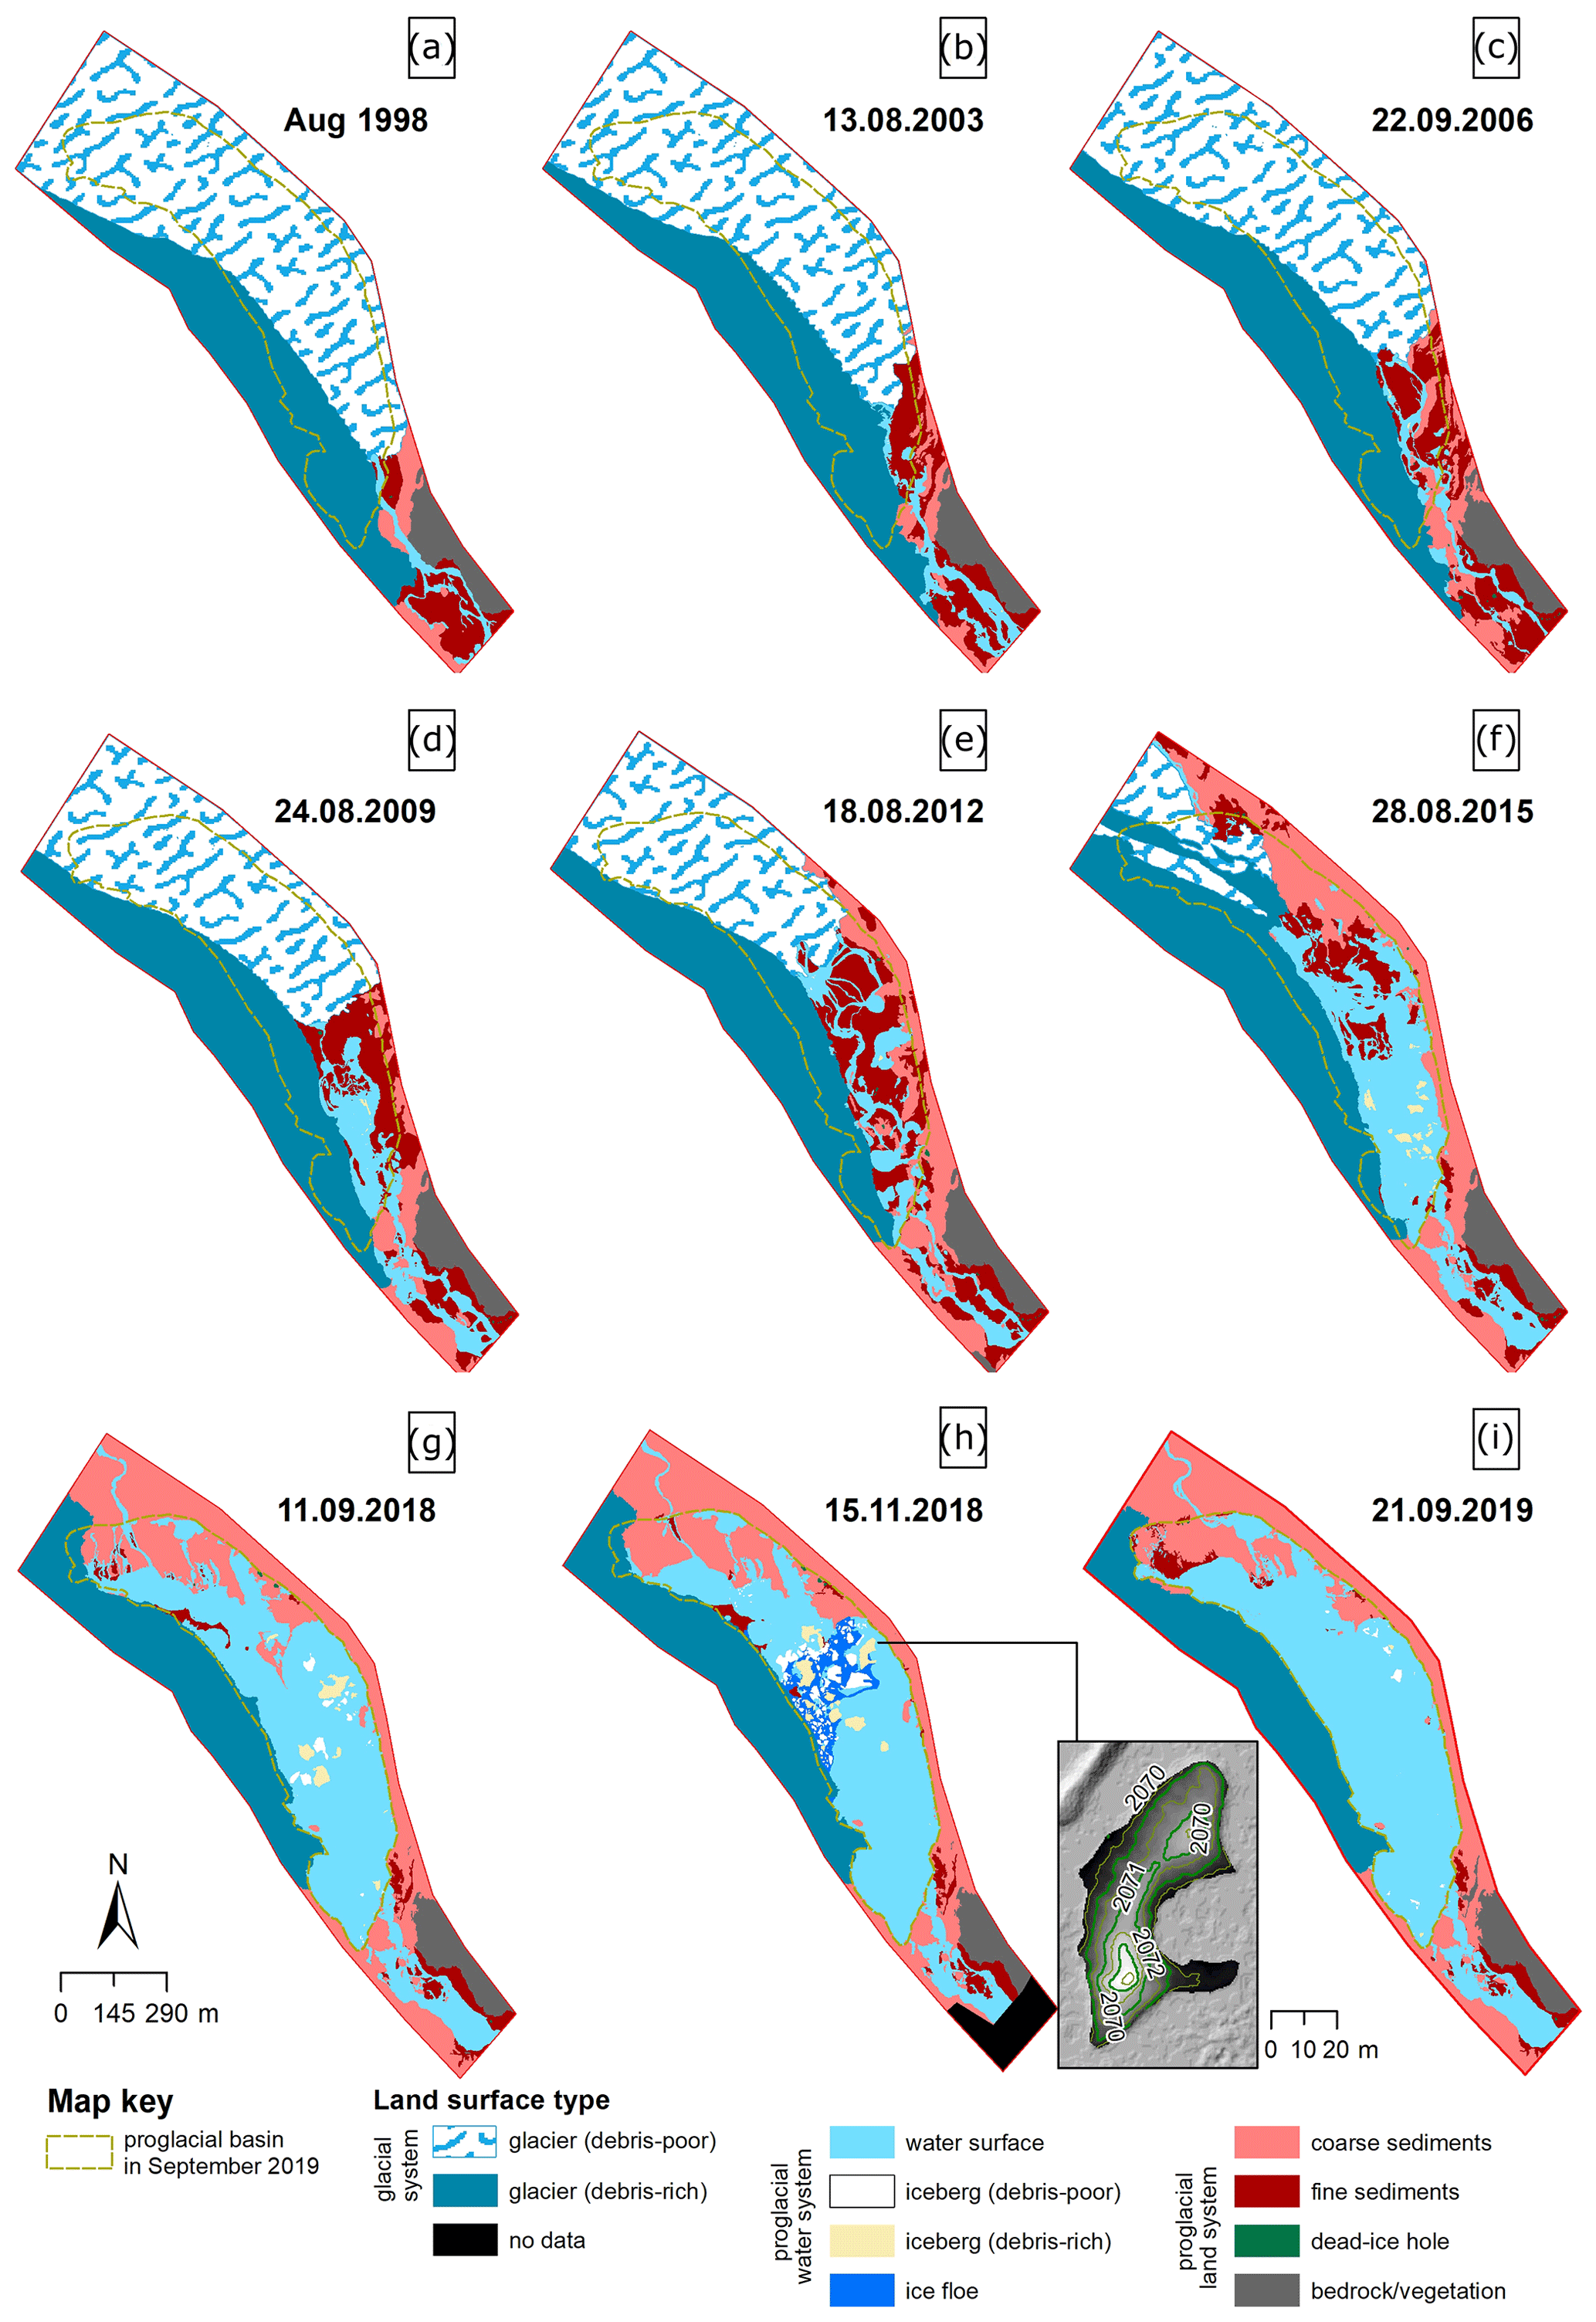
Figure 7Land cover evolution in the glacial–proglacial transition zone (0.76 km2) of Pasterze Glacier between 1998 and 2019 based on visual landform classification. The proglacial basin as defined for September 2019 is depicted in all maps for comparison. For data sources refer to text and Table 1. Inset map in (h) depicts a digital elevation model and contour lines (0.5 m interval) of iceberg IB1.
4.3 Buoyant calving at the ice-contact lake
Four large-scale ice-breakup events (IBEs) related to buoyancy were detected for the period September 2016 to October 2019 (IBE1 20 September 2016, IBE2 9 August 2018, IBE3 26 September 2018, and IBE4 24 October 2018). Twelve smaller to mid-sized iceberg-tilting or capsize events were additionally documented by the Panomax images (27 May 2017, 28 May 2017, 9 June 2017, 11 June 2017, 20 June 2017, 5 July 2017, 19 July 2017, 25 September 2017, 22 June 2018, 23 September 2018, 26 September 2018, and 30 October 2018).
IBE1 occurred on 20 September 2016. Figure 8a presents two ortho-images from this event at its beginning (09:00) and its end (11:15). The latter also indicates the position of the geoelectric profile ERT17-1 for orientation. Figure 2 visualizes the same event. An animation depicting this ice-breakup event is published in the Supplement. Different processes occurred as indicated by the capital letters in Fig. 8a: limnic transgression (A and F) of water due to tilting of ice slabs, uplift of a debris-covered ice slab (B and G), formation of a massive crevasse (C), complete ice disintegration (D), ice disintegration and lateral displacement of several ice slabs (E), and drying out of a meltwater channel (H). All processes apart from the limnic transgressions ended by 11:15; the latter terminated at 15:30. The formation of the large crevasse started at 09:30, followed by a rapid widening until 09:45 (crack width 3.5 m), steady conditions until 10:45, and a second widening phase (crack width 5.5 m) until 10:50 (see inset graph in Fig. 8a). The morphologically most distinct event happened between 09:50 (Fig. 2d) and 09:55 (Fig. 2e) when the total collapse of a 1700 m2 large ice slab occurred accompanied by lateral shift and tilting of neighbouring ice slabs by lateral push (E) and lowering of the surface of previously tilted slabs (B).
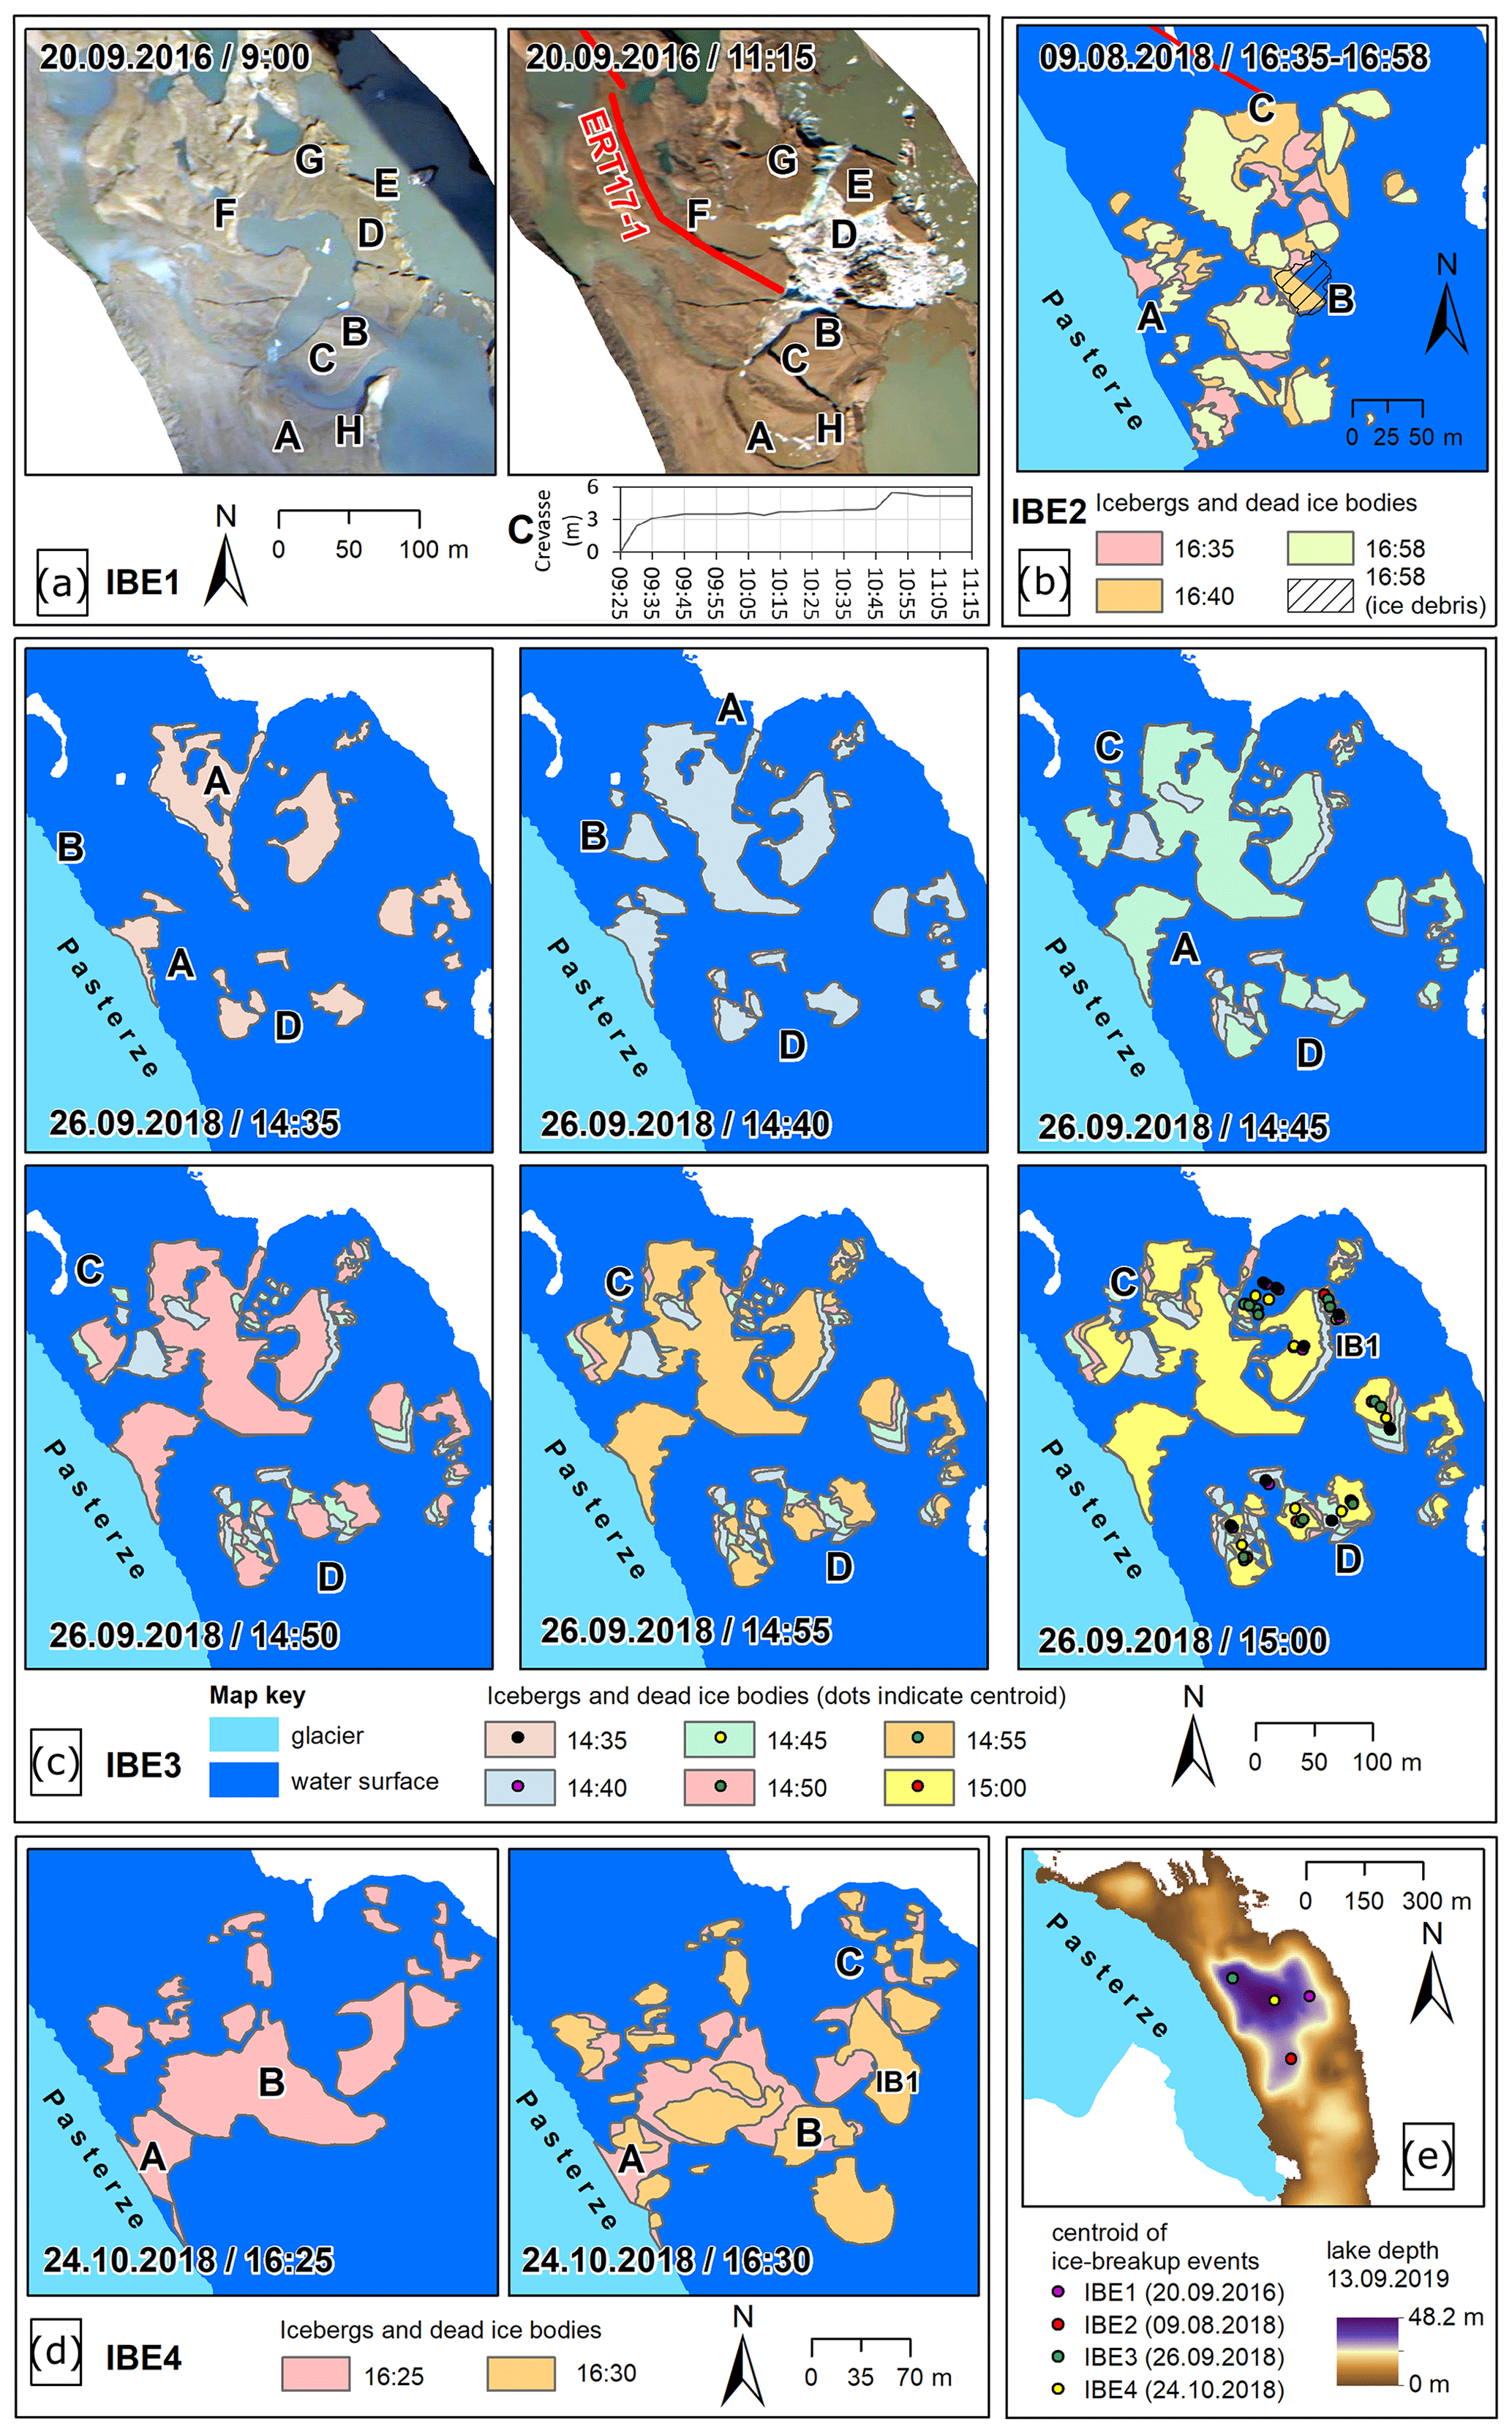
Figure 8Ice-breakup events (IBEs) at the ice-contact lake Pasterzensee monitored by time-lapse photography: (a) IBE1 20 September 2016; (b) IBE2 9 August 2018; (c) IBE3 26 September 2018; (d) IBE 4 24 October 2018; (e) overview map of the events. Capital letters on the maps indicate different processes (for details see text).
IBE2 happened on 9 August 2018. Figure 8b depicts the changes that occurred between 16:35 and 16:58. At this event three different processes were identified: (A) detachment of a debris-covered ice peninsula (945 m2) from Pasterze Glacier at the western lakeshore and separation into four icebergs (total area 1054 m2) and (B) emergence of a 1035 m2 large iceberg (16:35–16:40) followed by capsizing and partial disintegration of this iceberg into ice debris (16:40–16:58) pushing away other icebergs which causes (C) lateral iceberg displacement of up to 65.6 m as well as a clockwise iceberg rotation of 95∘.
IBE3 occurred on 26 September 2018. This event involved four main processes as visualized in Fig. 8c: (A) uplift of debris-covered ice bodies increasing the surface area from 6820 to 13 245 m2 in only 10 min (at 14:35–14:45), (B) emergence of a new iceberg between 14:35 and 14:40 which capsized a few minutes afterwards, (C) limnic transgression, and (D) lateral iceberg displacement (both C and D at 14:35–15:00). At the southern part of the affected area, icebergs moved away from the uplifting area (push effect). In contrast, at the eastern part of the affected area icebergs moved towards the uplifting area possibly due to compensatory currents causing a suction effect. A large iceberg (IB1 in Fig. 7c) was hardly moving at all suggesting grounding conditions.
The last major IBE took place on 24 October 2018 (IBE4) spanning only 5 min (Fig. 8d). Like IBE2, a debris-covered ice peninsula (1933 m2) detached from Pasterze Glacier at the western lakeshore and separated into several icebergs (A). Furthermore, (B) ice disintegration and (C) lateral iceberg displacement were observed during the event. The large iceberg IB1 experienced a lateral offset of 22 m accompanied by a clockwise rotation by 43∘. The spatial extent, volume, and freeboard of this iceberg were calculated based on a high-resolution DTM derived from the aerial survey dating to 15 November 2018 (see Table 1). The subaerial volume of iceberg IB1 was 3271 m3 on 15 November 2018, which should be around 10 % of the entire iceberg. Hence, approximately 29 500 m3 (90 %) was below the lake level during that time. Maximum freeboard of IB1 was 3.7 m with a mean freeboard value of 1.4 m. If we assume the same surface area of the iceberg below the lake level (2287 m2), we could further assume a mean ice thickness of the iceberg of 14.3 m (12.9 m draft, 1.4 m freeboard). Therefore, in order to have a freely moveable iceberg, a water depth exceeding 13 m is needed.
No large buoyant calving events were detectable in the time-lapse images after 24 October 2018. However, at least the occurrence of small-sized buoyant calving events which are hardly detectable by the time-lapse camera can be assumed. During fieldwork in June 2019, we observed buoyant calving of a small, ca. 3 m long iceberg (“shooter” according to Benn and Evans, 2010) ca. 200 m from the subaerial glacier front (Fig. 3d). The whole event took only few minutes and was hardly visible in the time-lapse images of that particular day.
4.4 Ice mass loss by buoyant calving and subaerial ablation
The quantification of the ice loss by buoyant calving for the three events IB2 to IB4 approximated by ice detachment, uplift, and emergence processes revealed the following results. The sums of movement-affected ice masses (without lateral displacement) during the three ice-breakup events were 55 717 m3 for IBE2, 445 257 m3 for IBE3, and 537 604 m3 for IBE4, summing up to 1 038 578 m3 (Table 2). As no other substantial ice-breakup events occurred afterwards, we can therefore assume that ice loss by buoyant calving in the period August 2018 to August 2019 at Pasterze Glacier was at least on the order of 1×10⁶ m3.
Table 2Affected ice masses during the three ice-breakup events IBE2 (9 August 2018), IBE3 (26 September 2018), and IBE4 (24 October 2018). For approach see text. Numbers in bold are not considered for the total volume calculation. Lateral displacement of icebergs is not considered.
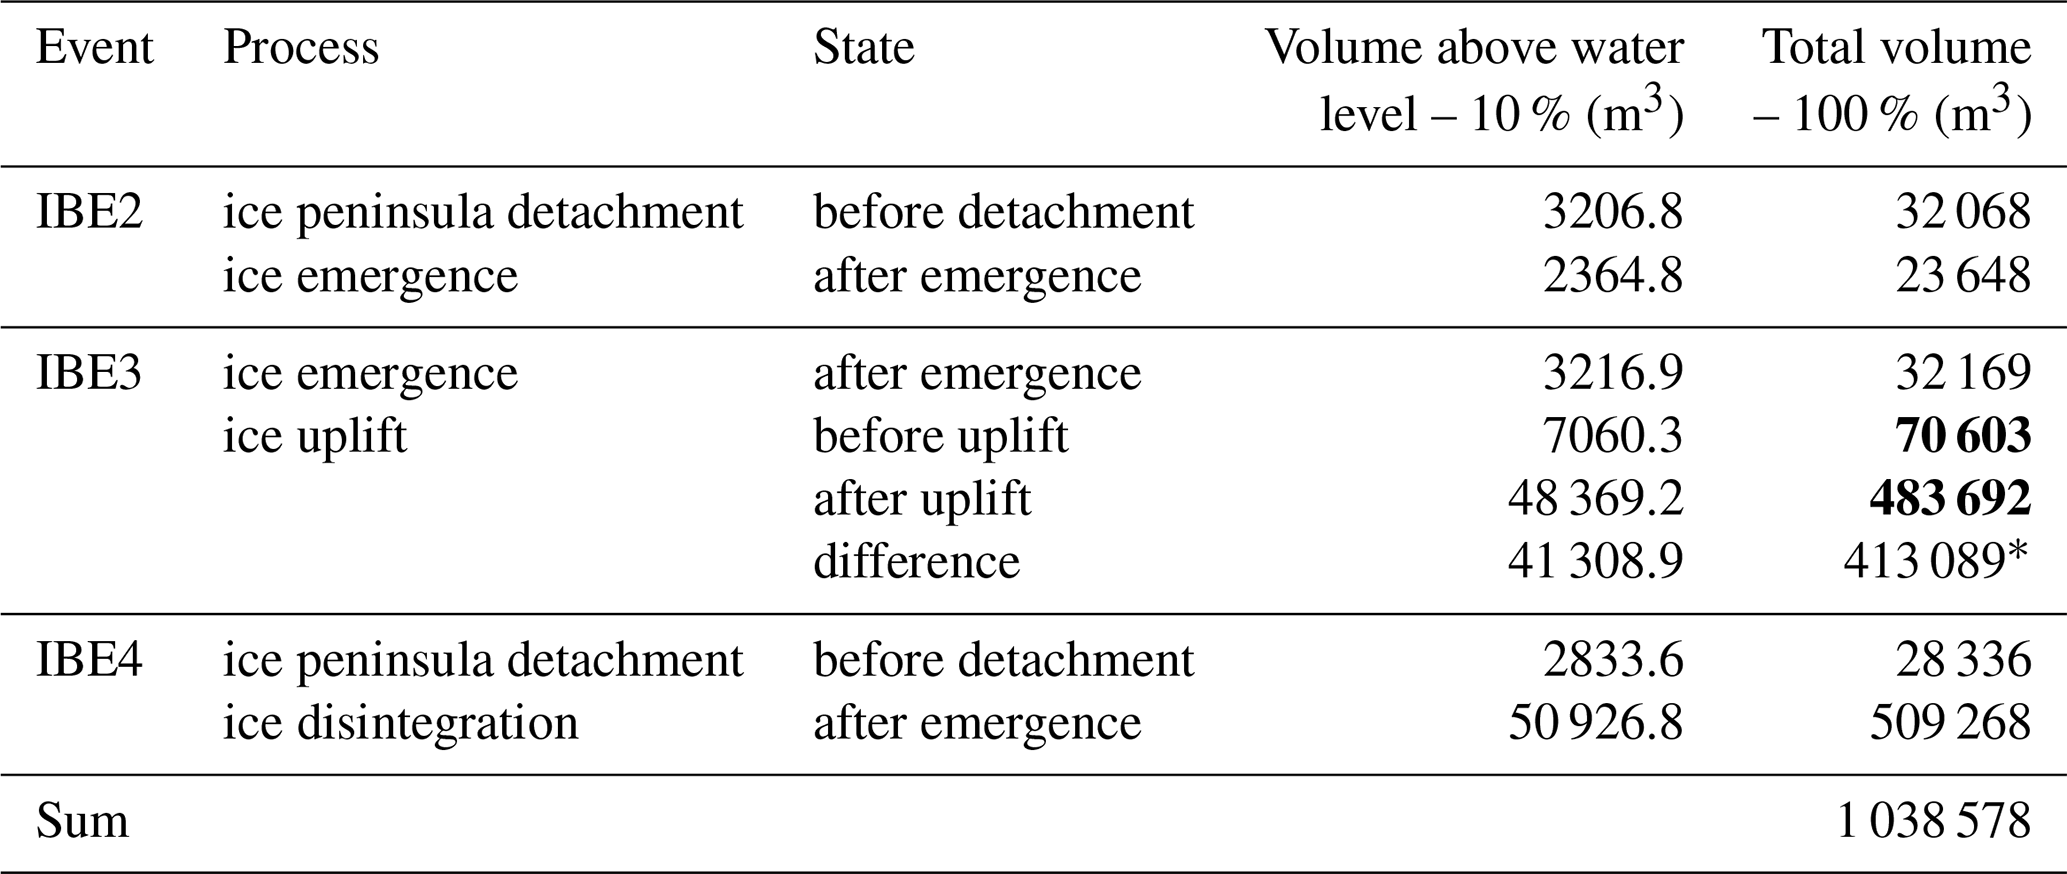
* Difference considered in the total.
The comparison of the two sets of TLS data from 13 September 2018 and 3 August 2019 revealed surface elevation changes and thus more or less glacier ice ablation of up to 5 m between the two stages. It was not within the scope of this paper to analyse ablation rates at the terminus of Pasterze Glacier in detail. However, for a rough estimate we can calculate for the lowest part of the glacier tongue next to the proglacial lake (see Fig. 1, ca. 0.35 km2) the total ice loss for the period September 2018 to August 2019. Mean ablation rates of 2.5 or 3.0 m for this area would yield total ice losses by ablation for this area of 870 000 and 1 050 000 m3, respectively.
4.5 Ground ice conditions at the lake basin and its proximity
Altogether 43 ERT profiles were measured in the proglacial area between 2015 and 2019 with profile lengths of between 80 and 196 m. In this study we focus on the quantification of sediment-buried dead-ice bodies detected by ERT. A detailed discussion on the ERT results will be presented elsewhere. Resistivity values of >20 000 Ωm indicate buried glacier ice, and water-saturated glacial sediments show values of <3000 Ωm (Pant and Reynolds, 2000). Clay and sand have resistivity values in the ranges of 1–100 and 100–5000 Ωm, respectively. Temperate glacier ice may exceed 1×10⁶ Ωm (Kneisel and Hauck, 2008). We used the 20 000 Ωm-boundary in the interpretation to estimate the maximum ice thickness for each profile as depicted in Fig. 9 which shows three profiles from 2017. In many cases, ice thickness exceeded the depth of ERT penetration. Therefore, we were only able to calculate “minimum ice thickness estimates” based on the ERT data.
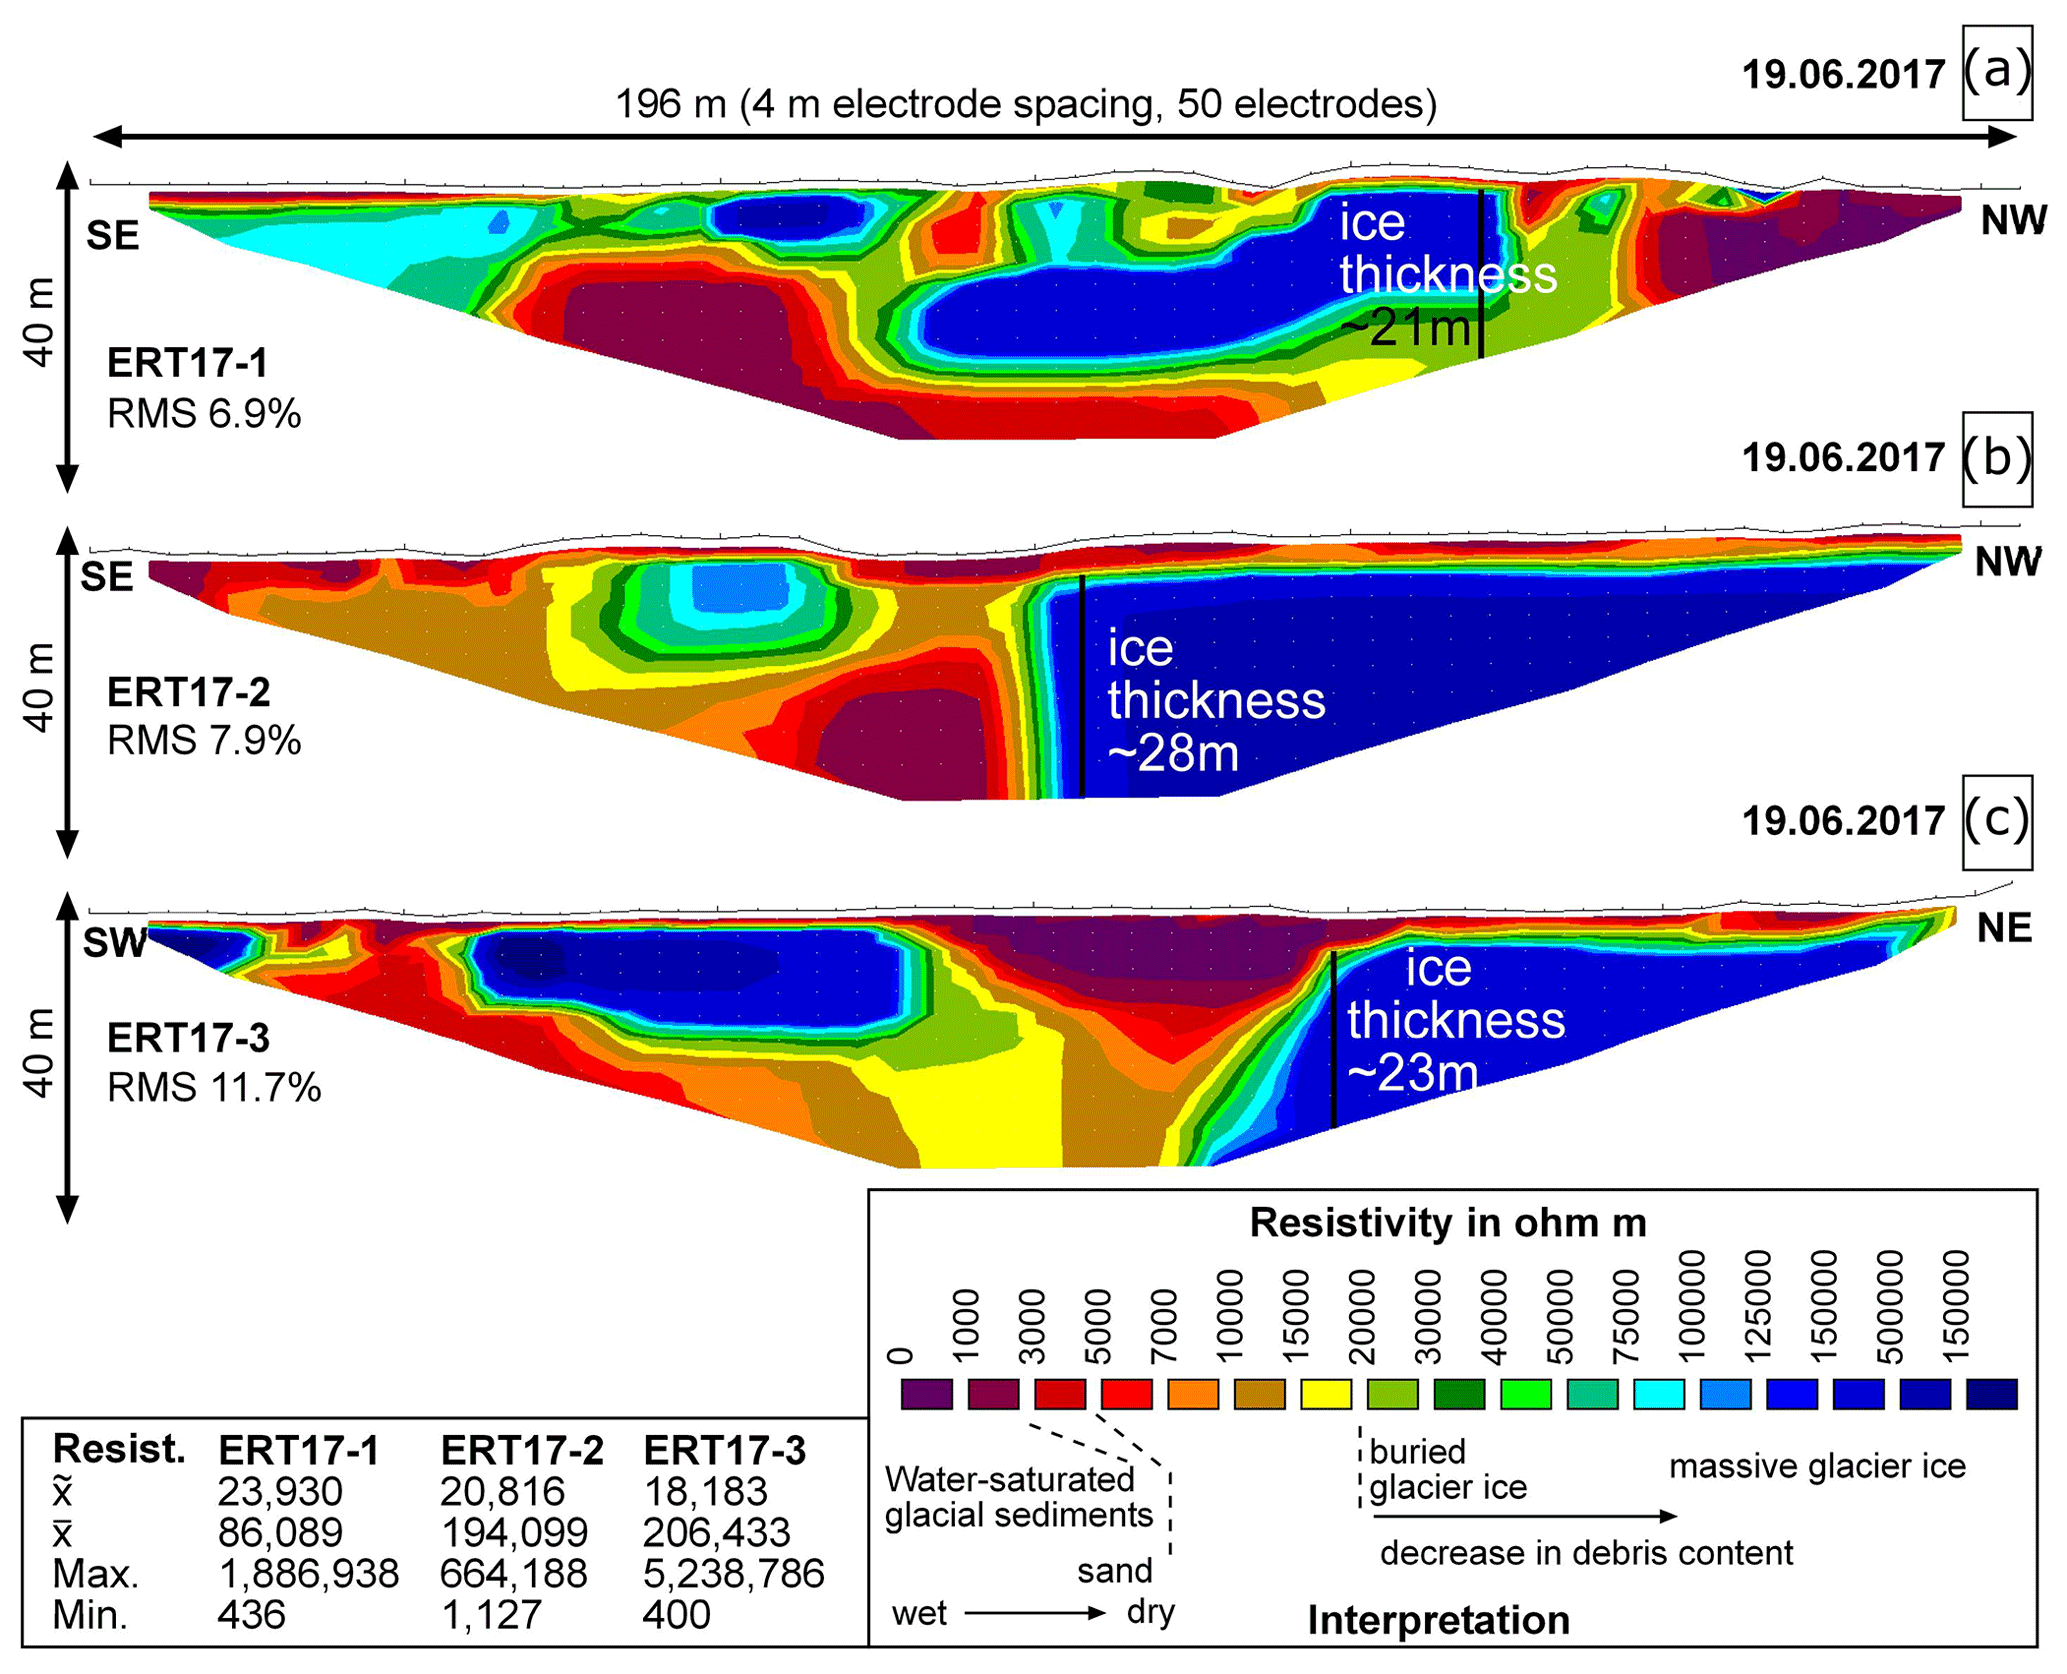
Figure 9ERT results (Wenner array) and interpretation of three profiles (50 electrodes, 4 m spacing, length 196 m) measured in the proglacial area of Pasterze Glacier on 19 June 2017 (location: Figs. 3 and 10). Summary statistics in the inset table: (a) ERT17-1 – ice lens with a thickness of ca. 21 m, (b) ERT17-2 – ice thickness ca. 28 m, and (c) ERT17-3 – ice thickness ca. 23 m. For (b) and (c) – ice thickness exceeded the depth of ERT penetration.
Figure 10 summarizes the results of the surveys for 2015, 2016, 2017, 2018, and September 2019. Two of the three ERT profiles measured in 2015 (ERT15-1, ERT15-2) revealed only very thin ice lenses. Both are located outside the proglacial basin as defined in September 2019 (Fig. 10a). The profile in the basin had an estimated ice thickness of 14 m (ERT15-3). The profiles measured in 2016 revealed minimum ice thickness values of 8–10 m (Fig. 10b). The four profiles measured in 2017 in the central part of the proglacial area revealed minimum ice thicknesses of between 13 (ERT17-4) and 28 m (ERT17-2) (Fig. 10c) confirming the existence of massive dead ice beneath a thin veneer of debris (Fig. 9).
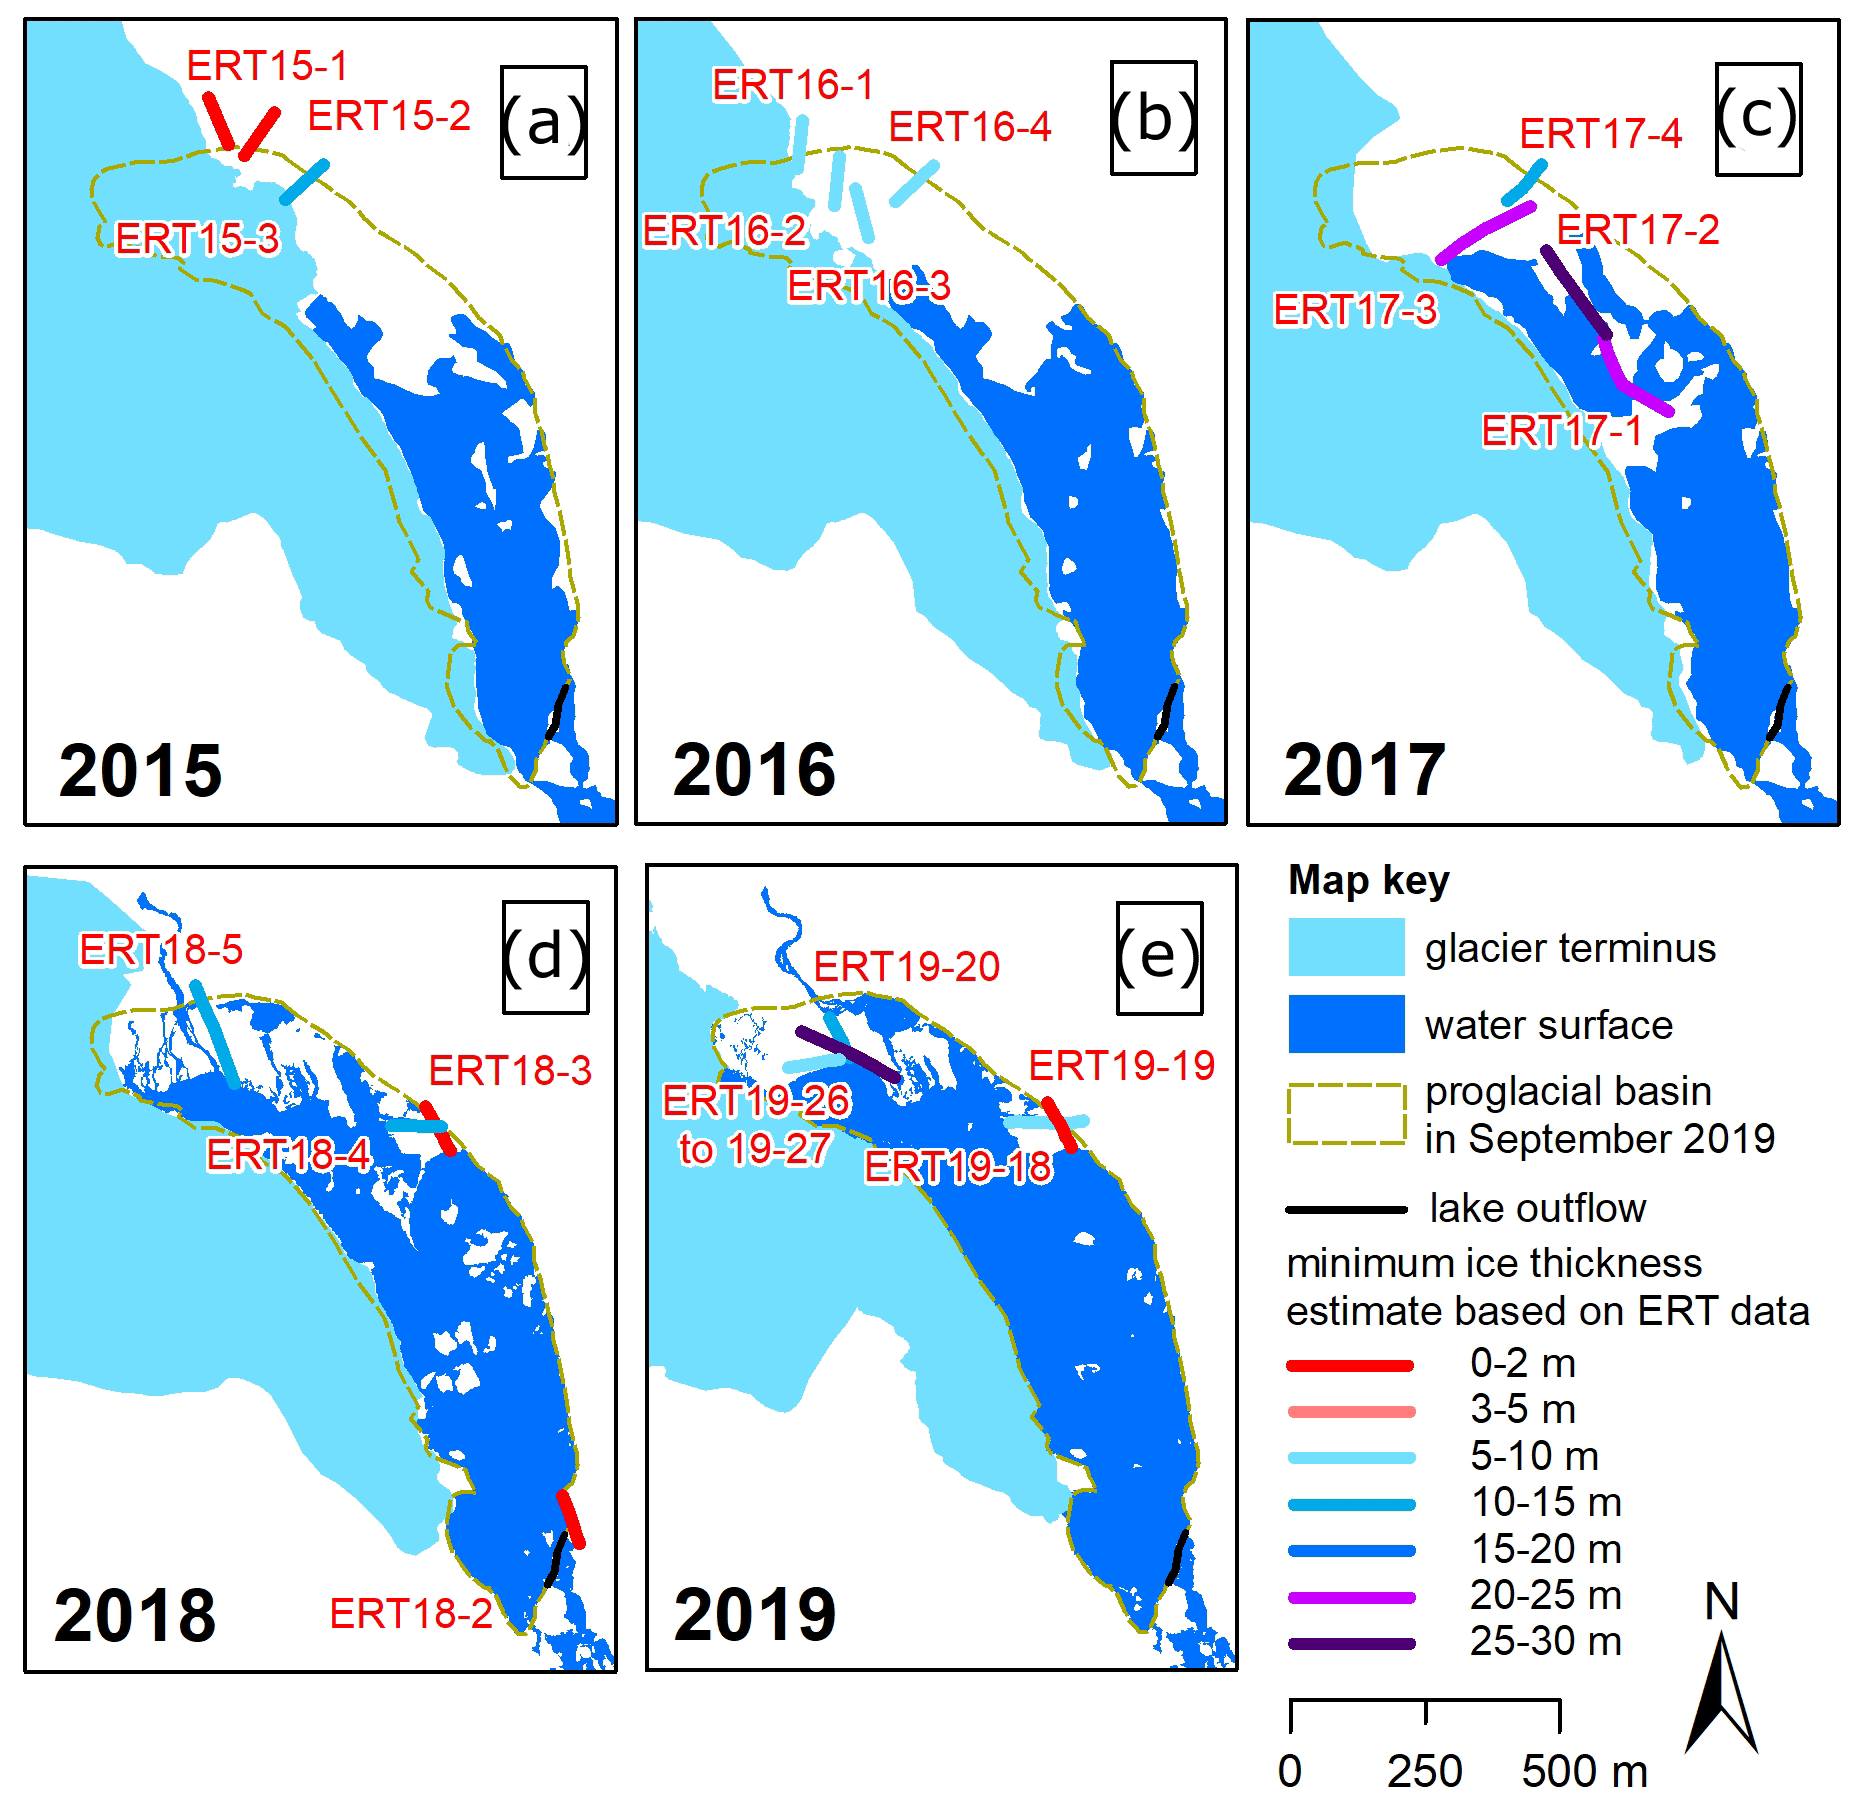
Figure 10Interpreted minimum ice thicknesses based on electrical resistivity tomography (ERT) data (for estimation approach see Fig. 9) in the proglacial area of Pasterze Glacier for (a) 30 September 2015, (b) 13 September 2016, (c) 19 June 2017, (d) 13 September 2018, and (e) 9 September 2019 as well as 10 September 2019. “Minimum” means in this case that the base of the ice core was commonly below the depth of ERT penetration.
The interpretations of four profiles measured in 2018 are shown in Fig. 10d. Profiles ERT18-2 and ERT18-3 are free of ice located outside the basin or at its margin. ERT18-4 and ERT18-5 were both located in the basin and revealed minimum ice thicknesses of 13 (ERT18-5) and 14 m (ERT18-4). The September-2019 measurements supported earlier measurements (Fig. 10e). The profiles at the eastern margin of the basin showed again a thin layer (ERT19-18, 8 m ice) or only very small occurrences of glacier ice (ERT19-19, 1 m ice). The three profiles near the northwestern shore of the lake revealed minimum ice thickness estimates of up to 26 m (ERT19-26). In summary, ERT profiles outside the proglacial basin typically showed few buried dead-ice remnants, whereas profiles in the basin (particularly at its northwestern part) typically yielded resistivity values consistent with widespread massive dead ice.
4.6 Bathymetry of the lake basin
Lake-bottom geometry and the water volume of Pasterzensee were calculated based on 4276 sonar measurements (Fig. 1d). Measured water depths ranged from 0.35 to 48.2 m yielding an arithmetic mean of 13.4 m and a median of 10.7 m. During the time of bathymetric measurements, the lake level was 2069.1 implying that the lowest point at the lake bottom was 2020.9 (Fig. 11). Several sub-basins (marked as A–D in Fig. 11a) were identified along the 1.2 km long and up to 300 m wide lake basin. One small sub-basin (A) was detected close to the southern end of the lake with maximum measured water depths exceeding 20 m (maximum 24.1 m, 2045 ), an E–W extent of 160 m, and a N–S dimension of 140 m. A second sub-basin (B) is slightly less deep (max 20.5 m) but seems to be broader compared to basin (A). The third sub-basin (C) is by far the deepest, the largest, and the most complex one with a maximum water depth of 48.2 m and a secondary basin in the south reaching a measured maximum depth of 31.0 m. In this sub-basin, water depths exceeding 30 m were calculated for a 34 000 m2 large area in the central part of the entire lake basin. The lake basin becomes generally shallower towards the northwest. Finally, a fourth sub-basin (D) was identified at the northwestern end of Pasterzensee where a broad basin is located with a maximum measured depth of 17.7 m. Based on our gridded DTM for the lake bottom, the estimated water volume of the 299 496 m2 large lake Pasterzensee in September 2019 was 4×10⁶ m3. The gradient from the deep basin (C) to the shore seems to be rather gradual at the eastern margin of the lake. In contrast, at the western margin of the lake basin where Pasterzensee is in ice contact, the gradient is steep in most areas (e.g. at sub-basin C – horizontal distance between sonar measurement location and glacier margin 19 m vs. water depth 26.1 m) suggesting a steep glacier margin with a pronounced ice foot.
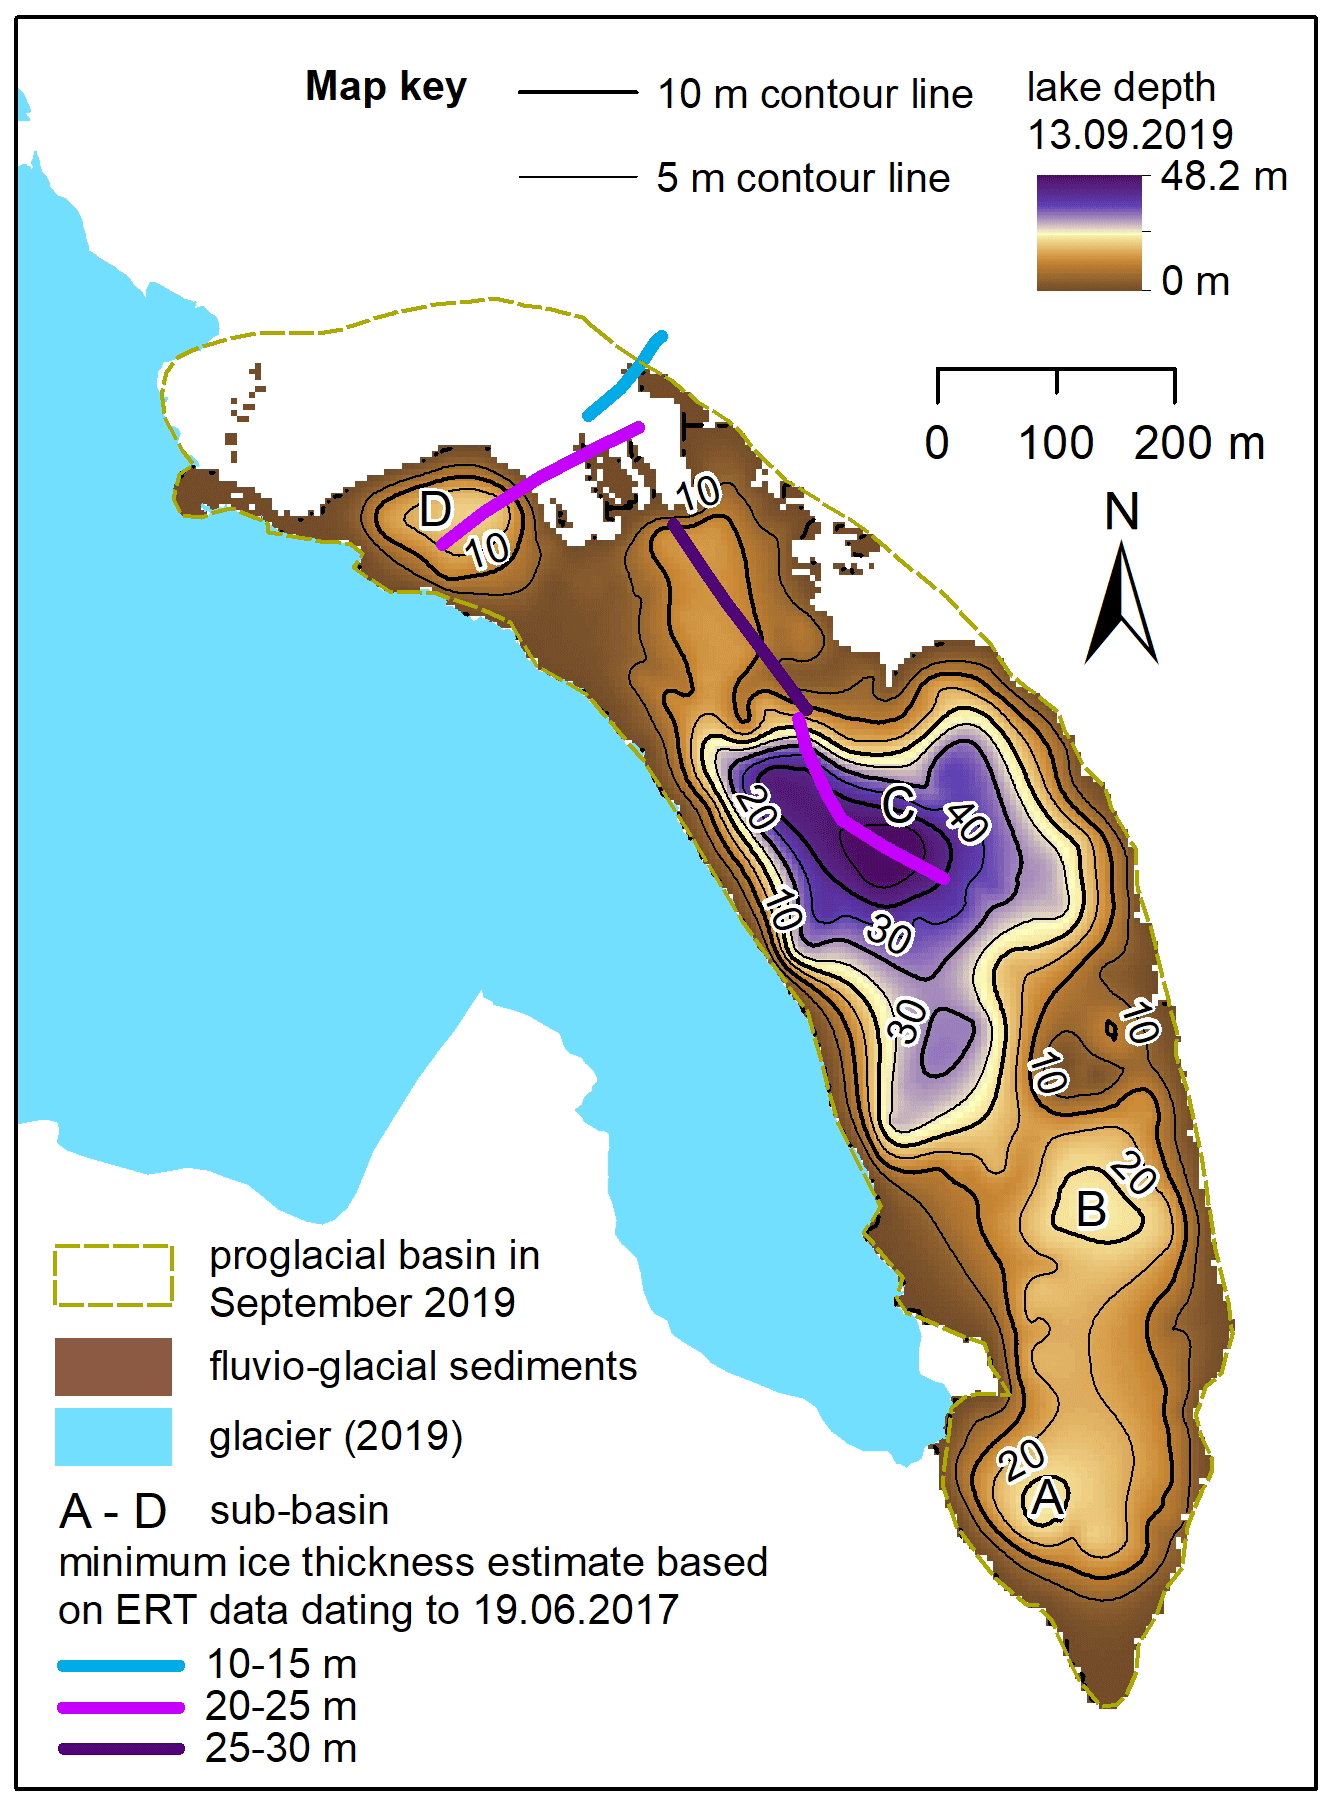
Figure 11Lake bathymetry based on echo-sounding data acquired in 2019 and its relationship to the ERT data from 2017: glacier extent and lake bathymetry in September 2019 (5 m grid resolution); the extent of the proglacial basin as defined for September 2019 is drawn on the map for orientation.
5.1 Glacial-to-proglacial landscape modification
Pasterze Glacier receded by some 1.4 km between 1998 and 2019 thereby causing the formation of a bedrock-dammed lake in an over-deepened glacial basin. During these 2 decades, the glacier decelerated, fractured (Kellerer-Pirklbauer and Kulmer, 2019), and lost the connection to the lake at its eastern part. In contrast, at the western shore, the lake was still in ice contact with the glacier in 2019. This ice-contact difference is related to an unequal recession pattern of the eastern and western part of the glacier tongue caused by an uneven distribution of the supraglacial debris cover (Kellerer-Pirklbauer, 2008). The debris cover distribution pattern promotes differential ablation (Kellerer-Pirklbauer et al., 2008). Rapid deglaciation as well as glacier thinning is much more intensive at the debris-poor part of the glacier affecting the stress and strain field and modifying the flow directions of the ice mass (Kaufmann et al., 2015). Therefore, the proglacial lake predominantly developed in areas where debris-poor ice was located before.
At the waterline, thermo-erosional undercutting causes the formation of notches (cf. Röhl, 2006). Such notches are frequent features at Pasterze Glacier and were first reported in 2004 (Kellerer-Pirklbauer, 2008). GNSS measurements at the glacier margin on 13 September 2019 showed that waterline notches occurred during that time at 53 % of the 935 m long ice-contact line between Pasterze Glacier and Pasterzensee (Fig. 5n). Notches observed at Pasterze Glacier during several September field campaigns during the last few years had a stepped geometry due to lake-level drop. The amplitude of water-level fluctuations at Pasterzensee in the period 2015 to 2020 was less than a metre based on GNSS and TLS data, indicating rather stable lake-outflow conditions. However, GNSS and TLS data both show a lake-level lowering trend since 2015.
Stepped geometries have also been observed at other alpine lakes (e.g. Röhl 2006). Rates of notch formation and, thus, of thermo-erosional undercutting at Pasterze Glacier are unknown. However, if we consider the annual lateral backwasting rates derived from GNSS data (Fig. 4) indicative of thermo-erosional undercutting, a mean melt rate of about 10 m yr−1 for the period 2010–2019 can be assumed. This is about one-third of the values quantified for Tasman Glacier (Röhl, 2006). The difference is possibly related to cooler (higher-elevation) and more shaded (NE-facing) conditions at Pasterze Glacier. Outward toppling of undercut ice masses due to thermal erosion, a process potentially relevant for calving at ice-contact lakes (Benn and Evans, 2010), was not observed at Pasterze Glacier. Lateral backwasting at Pasterze Glacier is mainly controlled by ice melting either beneath supraglacial debris or at bare ice cliffs above notches where the slope is too steep to sustain debris cover, and thus the rock material slides into the lake (see Fig. 10 in Kellerer-Pirklbauer, 2008).
The analysis of the relationship between glacier recession and the evolution of proglacial water surfaces showed drastic changes in 1998–2019. The spatial extent of water surfaces in the 0.37 km2 proglacial basin followed an exponential curve with 0.5 % in 1998, 21 % by 2013, 51 % by 2016, and 83 % by 2019. On an annual timescale water surface changes follow a distinct pattern with enlargement during summer due to glacier and dead-ice ablation in lake-contact locations, causing lake transgression and a shrinkage in size in autumn due to lake-level lowering. This annual pattern at Pasterzensee has also been detected and quantified by Sentinel-1 and Sentinel-2 data (Avian et al., 2020).
Carrivick and Tweed (2013) discuss the enhanced ablation at ice-contact lakes via mechanical and thermal stresses at the glacier–water interfaces. They report increasing lake sizes in the proglacial area of Tasersuaq Glacier, west Greenland, for four different stages between 1992 and 2010. An exponential increase in lake size, as observed at Pasterze Glacier, was however not observed at Tasersuaq Glacier as judged from their provided map in the paper. More general, detailed studies of increasing lake size on an annual basis are rare, impeding the comparison of our results with other studies accomplished in similar topoclimatical settings. Some comparative observations are, however, as follows.
Schomacker and Kjær (2008) report from a glacier in Svalbard that an ice-contact lake increased near-exponentially in size during a period of 40 years due to dead-ice melting. Schomacker (2010) reports from enlargement of proglacial lakes at Vatnajökull in Iceland where the lake Jökulsárlón enlarged by 40 % in only 9 years (2000–2009). For the same lake, Canas et al. (2015) revealed an enlargement by 74 % for the period 1999–2014. Stokes et al. (2007) report an 57 % increase in the surface area of supra- and proglacial lakes in the Caucasus Mountains in the period 1985–2000. Loriaux and Casassa (2012) described the evolution of glacial lakes from the Northern Patagonian Ice Field reporting a total lake area increase of 64.9 % in a 66-year period (1945–2011). Gardelle et al. (2011) detected for the eastern Himalaya an enlargement of glacial lakes by 20 % to 65 % between 1990 and 2009. To conclude, the numbers summarized here clearly show that the increase in lake size at Pasterze Glacier is particularly high although this relative increase in area at Pasterzensee is likely biased by the very small initial size of the lake in 1998.
Landscape changes were quantified for a 0.76 km2 large transition zone between Pasterze Glacier and its foreland for the period 1998–2019. Apart from rapid deglaciation and lake size increase, areas covered by coarse-grained glacio-fluvial sediments increased in their extent. Furthermore, icebergs in the lake were mapped for the first time in 2015 (0.7 % of the 0.76 km2 large area) and reached their maximum extent in 2018 (3.5 %). By the end of the ablation season in 2019, the areal extent of icebergs decreased dramatically to only 0.3 %, attributed to high melt rates in a warm summer 2019 (Fig. 1c; the MAAT in 2019 was the second highest in the period 1998–2019). After 2015, an alluvial fan with a lake delta developed at the northern end of the lake because the glacier receded at this location from the lake basin, connecting the main glacial stream directly with the lake (Fig. 7f and g). This recession was, however, only superficial, and huge amounts of dead ice remained in the basin – as detected by ERT measurements – and were covered by fluvio-glacial sediments.
5.2 Dead-ice conditions and changes
Subsurface conditions at the proglacial area of Pasterze Glacier were studied by measuring electrical resistivity along 43 profiles distributed over the entire proglacial area between 2015 and 2019. Our measurements showed that dead-ice bodies covered by sediments were absent outside the proglacial basin as defined for September 2019. In contrast, all ERT measurements carried out in the basin revealed very high maximum and median resistivity values (e.g. Fig. 9) indicative of buried ice. Long-term air temperature data from a nearby automatic weather station as well as two ground temperature data series directly from the proglacial area clearly suggest that permafrost is absent at the shores of Pasterzensee due to permafrost-unfavourable thermal conditions (MAAT has always been >2.5 ∘C since 2011). Furthermore, a distinct warming trend occurred in the period 1998–2019 at Pasterze Glacier enhancing ice ablation and deglaciation processes at the surface in more recent years.
In addition to the geomorphic observations made at the surface, such as dead-ice holes (Figs. 6b and 7) or cracks (Fig. 2) in hummocky fluvio-glacial sediments (Fig. 3c), our subsurface data clearly suggest substantial and rapid dead-ice degradation at present. Gärtner-Roer and Bast (2019) conclude that only a few attempts have been made to describe and analyse the occurrence, distribution, and dynamics of ground ice in recently deglaciated areas. However, due to the rapid increase in proglacial areas at present, these authors point out that there is increasing interest in research for both geomorphologists and hydrologists. With the presented geophysical data from Pasterze Glacier, we have proved the widespread existence of debris-covered dead-ice bodies in a proglacial basin of an alpine valley glacier and, thus, have contributed to this emerging topic.
5.3 Ice-breakup and buoyant calving
Four remarkable ice-breakup events (IBEs) with horizontal extents on the order of hundreds of metres occurred in the period September 2016 to October 2018. No comparable events were observed before 20 September 2016 (Kellerer-Pirklbauer et al., 2017), and no comparable event happened between 25 October 2018 and (at least) 30 November 2020. Only smaller buoyant calving events can be assumed for the latter period as suggested by a fortuitously observed event (Fig. 3d). Approximations of the ice volume lost by buoyant calving as well as by ablation through subaerial melting at the lowest part of Pasterze Glacier have been on the same order of magnitude (ca. 1 ×10⁶ m3) in almost identical periods (for buoyant calving – August 2018 to August 2019, for subaerial melting – September 2018 to August 2019). However, as the period August to October 2018 was very unusual in terms of larger ice-breakup events (three of the four large events occurred in this period), we can clearly conclude that multiannual glacier ice losses by buoyant calving are substantially smaller compared to subaerial ablation rates.
Our field observations show that sediment is present on top of dead ice, particularly at the northwestern end of the lake where the main glacial stream enters the lake. Sediment cover will affect the buoyant weight of the ice column, potentially offsetting buoyant forces and inhibiting calving. It is not possible to quantify this effect, due to limited data on sediment and ice thicknesses. It is clear, however, that although sediment cover will have delayed the onset of buoyant calving, it was insufficient to prevent it in this case.
Thanks to high-resolution (both spatial and temporal) time-lapse photography overlooking the glacial–proglacial transition zone, different ice-related processes can be clearly distinguished. Common features of the IBEs are (a) limnic transgression due to ice slab lowering or tilting; (b) drying out of meltwater channels due to slab uplift or tilting of ice slabs; (c) uplift – and therefore enlargement – of previously existing ice-cored terraces or icebergs; (d) crack and crevasse formation at previously stable-looking terraces; (e) sudden disintegration within minutes of ice masses (i.e. collapsing ice masses) into ice debris; (f) lateral displacement of icebergs (either pushed away or dragged towards uplifting icebergs); (g) emerging new icebergs previously not mapped due to buoyant calving; (h) capsizing of new icebergs; and (i) detachment of “ice peninsulas” attached to Pasterze Glacier at the western lakeshore and subsequent fragmentation into several icebergs and disintegration into small, mainly floating icebergs. Regarding emergence of new icebergs, our observations suggest both buoyant calving of small ice masses (suggested by emerging small icebergs, e.g. Fig. 3d) and also full-thickness ice calving (suggested by the large ice-breakup events; Fig. 8).
All these processes are related to hydrostatic disequilibrium of the glacier margin or subaquatic dead ice which becomes super-buoyant and subject to net upward buoyant forces (Benn et al., 2007). Buoyant glacier margins can slowly move back into equilibrium by ice creep or can fracture catastrophically as described for instance for Nef Glacier in Chile by Warren et al. (2001). At Pasterze, creep rates are very low at the glacier margin with only a few metres per year near the terminus (Kellerer-Pirklbauer and Kulmer, 2019); therefore only the latter option for a renewed hydrostatic equilibrium is feasible. A floating process of the glacier terminus was, however, not observed at Pasterze Glacier (Boyce et al., 2007). Our buoyant calving observations as well as the bathymetric data suggest the existence of an ice foot at the west shore of the ice-contact lake. Such a presence of an ice foot below the water level of tidewater ice cliffs of temperate glaciers has been debated for more than 120 years (Hunter and Powell, 1998). At Pasterze Glacier only small ice cliffs above thermo-erosional notches exist. However, the existence of an ice foot at the western shore is very likely. This assumption is supported by the occurrence of the ice-breaking events with buoyant-calving-related processes.
In summary, we identified the following sequence of processes at Pasterze Glacier: (a) glacier recession into an overdeepened basin and glacier thinning below the spillway level; (b) glacio-fluvial sedimentation in the glacial–proglacial transition zone covering dead ice; (c) initial formation and accelerating enlargement of a glacier-lateral to supraglacial lake by ablation of glacier ice and debris-covered dead ice forming thermokarst features; (d) increase in hydrostatic disequilibrium leading to general glacier ice instability; (e) destabilization of debris-buried ice at the lake shore expressed by fracturing, tilting, and disintegration due to buoyancy; (f) emergence of new icebergs due to buoyant calving; and (g) gradual melting of icebergs along with iceberg capsizing events. This sequence of processes is visualized in a conceptual model depicted in Fig. 12. Our observations suggest that buoyant calving, previously not reported from the European Alps, might play an important role at alpine glaciers in the future as many glaciers are expected to recede into valley overdeepenings or cirques.
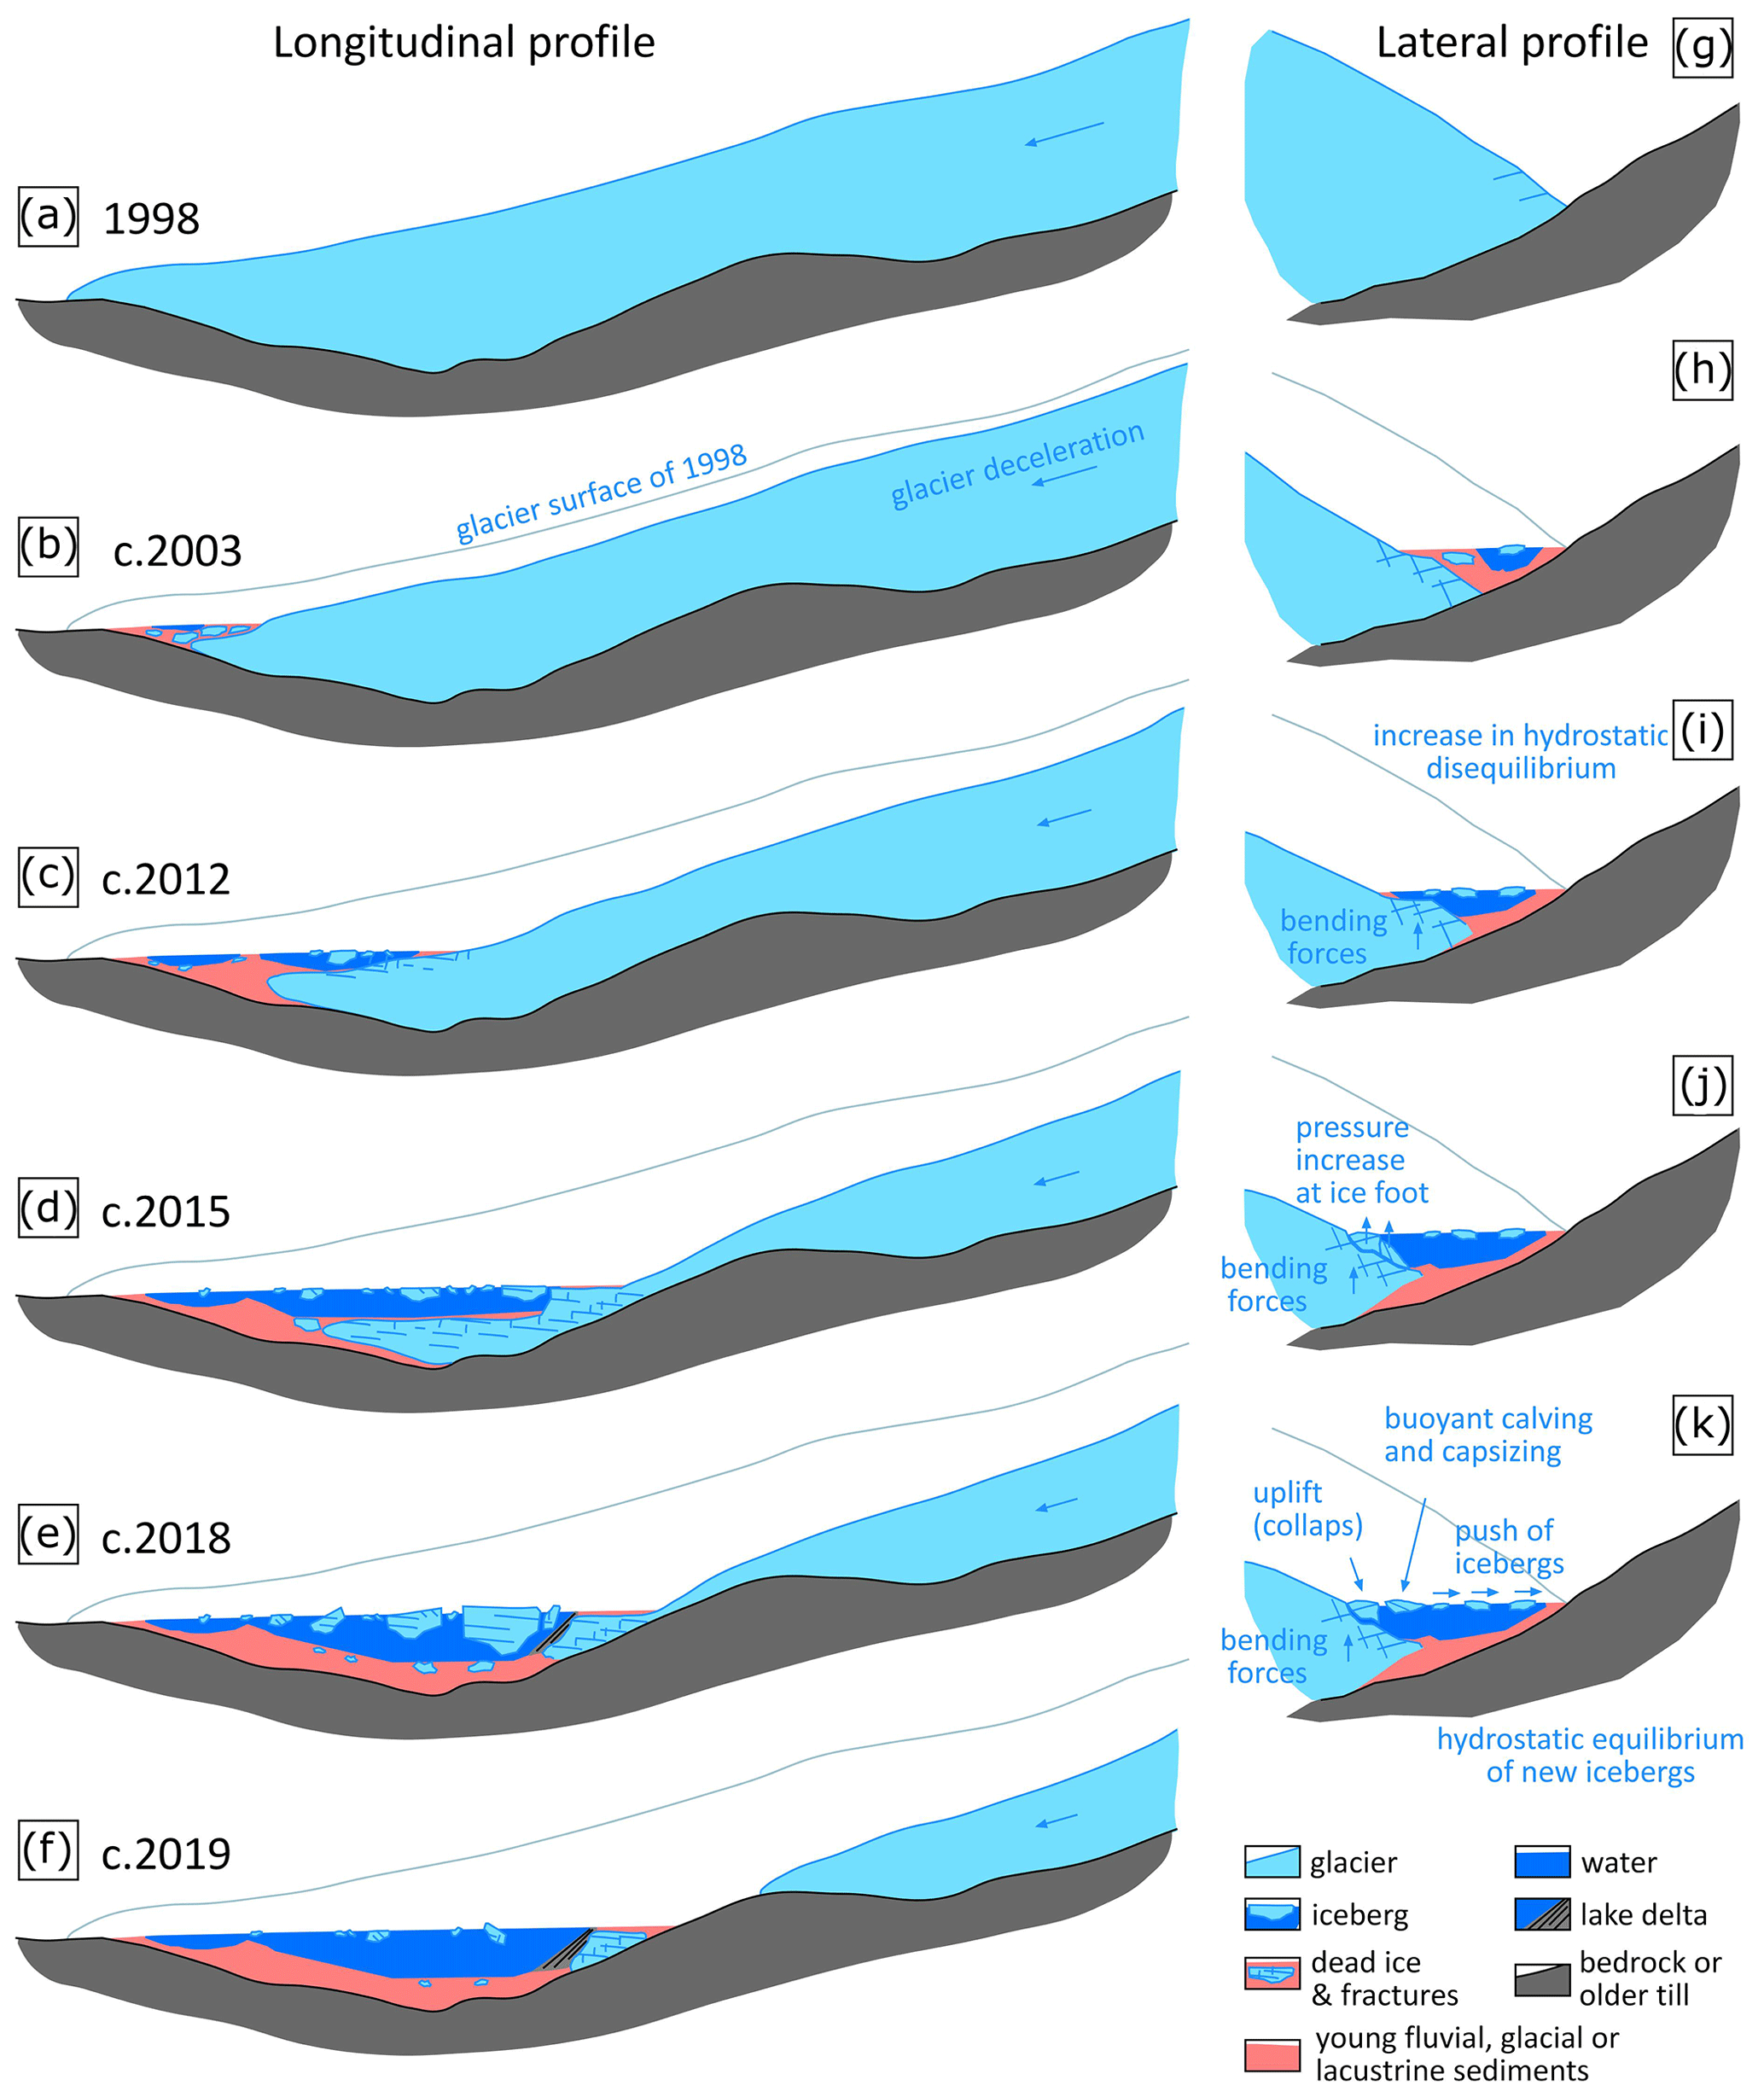
Figure 12Conceptual model of the evolution of the glacial–proglacial transition zone at Pasterze Glacier since 1998 behind a bedrock threshold: (a) to (f) depict changes along a longitudinal profile at the east side (supraglacial debris-poor) of the glacier tongue; (g) to (k) visualize lateral changes and related processes. See Supplement for related animations.
We studied the glacial-to-proglacial landscape transformation at the largest glacier in Austria during the period 1998 to 2019 focusing on ice-contact lake evolution and buoyant calving processes in an overdeepened basin. The main conclusions which can be drawn from this study are the following:
-
High annual backwasting rates were measured in most years when the glacier terminated in the basin. The detachment of the glacier from the lake at the east side drastically reduced backwasting rates.
-
Detailed studies of increasing lake size on an annual basis are rare. We showed that the increase in water surfaces in the basin since 1998 has followed an exponential curve (1998 – 1900 m2, 2019 – 0.3 km2). The increase in lake size is particularly high although this pattern is likely biased by the very small initial size of the lake in 1998. In single years this areal increase follows a distinct pattern with enlargement of water surfaces during summer and a decrease in autumn due to lake-level lowering, supporting earlier satellite-based studies (Avian et al., 2020).
-
Icebergs in the up to 48.2 m deep lake were observed for the first time in 2015 and reached their maximum extent in 2018. By the end of the ablation season in 2019, the areal extent of icebergs decreased dramatically, attributed to high melt rates in a warm summer in 2019.
-
Both geomorphic observations made at the surface and geophysical data from the subsurface clearly suggest widespread existence of debris-covered dead-ice bodies in the proglacial basin which is substantially and rapidly affected by dead-ice degradation at present due to permafrost-unfavourable ground temperature conditions.
-
Previously, little was known about how buoyant calving might contribute to the transformation of supraglacial lakes into full-depth lakes lacking any ice at the lake bottom. Thanks to time-lapse images and photogrammetric data analysis, we were able to analyse four large-scale ice-breakup events related to ice buoyancy for the period September 2016 to October 2018. However, no large buoyant calving events were detectable in the time-lapse images after 24 October 2018 and until (at least) 30 November 2020.
-
Ice volumes lost by buoyant calving and by ablation through subaerial melting at the lowest part of Pasterze Glacier revealed only for the period of (roughly) August 2018 to August 2019 comparable values (ca. 1×10⁶ m3). In all other years, ice loss by buoyant calving was substantially less important compared to subaerial ablation in terms of volumetric effect. Although buoyant calving is not the most important ablation term in the long term, it can result in large losses of ice and rapid geometric changes in the short term. Buoyant calving can bring about a rapid transition of a lake from supraglacial to full-depth and in some settings might cause a switch in the ablation regime, from subaerial melt-dominated to full-depth calving-dominated.
-
Different ice-related processes related to hydrostatic disequilibrium have been identified: limnic transgression due to ice slab lowering or tilting, drying out of meltwater channels due to slab uplift or tilting of ice slabs, uplift and enlargement of ice-cored terraces or icebergs, crack formation at previously stable-looking terraces, sudden disintegration of ice masses into ice debris, lateral displacement or rotation of icebergs, emergence of new icebergs due to buoyant calving, capsizing of icebergs, and detachment of ice peninsulas attached to the glacier and subsequent fragmentation into several icebergs.
-
Our observations suggest that buoyant calving, previously not reported from the European Alps, might play an important role at alpine glaciers in the future as many valley and cirque glaciers are expected to recede into valley overdeepenings or corries.
Terminus position of Pasterze Glacier for the period 1998 to 2019, extent of proglacial water surfaces between 1998 and 2019, and lake depth data from 13 September 2019 are available in the Supplement.
The Supplement consists of three data sets and four animations. The data sets are (1) terminus position of Pasterze Glacier for the period 1998 to 2019, (2) extent of proglacial water surfaces between 1998 and 2019, and (3) lake depth data based on echo sounding acquired on 13 September 2019. The animations are (1) general evolution of the proglacial lake between 2010 and 2020 based on webcam images, (2) ice-breakup event which occurred on 20 September 2016, and evolution of the glacial–proglacial transition zone at Pasterze Glacier since 1998 along longitudinal (3) and lateral (4) profiles based on Fig. 12. The supplement related to this article is available online at: https://doi.org/10.5194/tc-15-1237-2021-supplement.
The study was designed by AKP. Fieldwork and analysis were carried out by AKP (GNSS, geophysics, bathymetry), MA (laser scanning), FB (time-lapse photography), PK (land cover mapping), and CZ (geophysics, bathymetry). DIB contributed to the introduction and discussion. AKP prepared the manuscript with contributions from all co-authors.
The authors declare that they have no conflict of interest.
This study was funded by different projects over the years (see below). Meteorological data were kindly provided by VERBUND Hydro Power GmbH. Aerial surveys of 2018 and 2019 (AeroMap) were funded by project (c) and the Institute of Geography and Regional Science, University of Graz (supported by Wolfgang Sulzer). Matthias Wecht, Gernot Seier, and Wolfgang Sulzer are very much thanked for supporting the aerial-photograph analysis of the two AeroMap flight campaigns in 2018 and 2019. Correction signals for real-time kinematics measurements were kindly provided free of charge by EPOSA, Vienna. Fieldwork was supported during numerous field trips by several colleagues and numerous students especially Michael Bliem, Stefan Brauchart, Alexander Dorić, Iris Hansche, Matthias Lichtenegger, Christian Lieb, Gerhard Karl Lieb, Matthias Rathofer, Rupert Schwarzl, and Daniel Winkler. Melina Frießenbichler is kindly acknowledged for processing TLS data. Finally, the authors acknowledge the financial support by the University of Graz.
This research has been supported by the Austrian Science Fund (grant no. FWF P18304-N10), the Hohe Tauern National Park authority (several projects), the Glockner-Öko-Fonds (GROHAG 2018), and the Austrian Alpine Association (through the annual glacier monitoring programme).
This paper was edited by Christian Haas and reviewed by two anonymous referees.
Avian, M., Kellerer-Pirklbauer, A., and Lieb, G. K.: Geomorphic consequences of rapid deglaciation at Pasterze Glacier, Hohe Tauern Range, Austria, between 2010 and 2013 based on repeated terrestrial laser scanning data, Geomorphology, 310, 1–14, https://doi.org/10.1016/j.geomorph.2018.02.003, 2018.
Avian, M., Bauer, C., Schlögl, M., Widhalm, B., Gutjahr, K. H., Paster, M., Hauer, C., Frießenbichler, M., Neureiter, A., Weyss, G., Flödl, P., Seier, G., and Sulzer, W.: The status of earth observation techniques in monitoring high mountain environments at the example of Pasterze Glacier, Austria: data, methods, accuracies, processes, and scales, Remote Sens.-Basel, 12, 1251, https://doi.org/10.3390/rs12081251, 2020.
Ballantyne, C. K.: Paraglacial geomorphology, Quaternary Sci. Rev., 21, 1935–2017, https://doi.org/10.1016/S0277-3791(02)00005-7, 2002.
Bandini, F., Olesen, D., Jakobsen, J., Kittel, C. M. M., Wang, S., Garcia, M., and Bauer-Gottwein, P.: Technical note: Bathymetry observations of inland water bodies using a tethered single-beam sonar controlled by an unmanned aerial vehicle, Hydrol. Earth Syst. Sci., 22, 4165–4181, https://doi.org/10.5194/hess-22-4165-2018, 2018.
Benn, D. I. and Evans, D. J. A.: Glaciers and Glaciation, 2nd edn. Hodder/Arnold Publication, London, UK, 2010.
Benn, D. I., Wiseman, S., and Hands, K. A.: Growth and drainage of supraglacial lakes on the debris-mantled Ngozumpa Glacier, Khumbu Himal, Nepal, J. Glaciol., 47, 626–638, https://doi.org/10.3189/172756501781831729, 2001.
Benn, D. I., Warren C. R., and Mottram R. H.: Calving processes and dynamics of calving glaciers, Earth-Sci. Rev., 83, 143–179, https://doi.org/10.1016/j.earscirev.2007.02.002, 2007.
Benn, D. I., Åström, J. A. N., Zwinger, T., Todd, J., Nick, F. M., Cook, S., Hulton, N. R., and Luckman, A.: Melt-under-cutting and buoyancy-driven calving from tidewater glaciers: new insights from discrete element and continuum model simulations, J. Glaciol., 63, 691–702, https://doi.org/10.1017/jog.2017.41, 2017.
Bosson, J. B., Deline, P., Bodin, X., Schoeneich, P., Baron, L., Gardent, M., and Lambiel, C.: The influence of ground ice distribution on geomorphic dynamics since the Little Ice Age in proglacial areas of two cirque glacier systems, Earth Surf. Proc. Land., 40, 666–680, https://doi.org/10.1002/esp.3666, 2015.
Boyce, E. S., Motyka, R. J., and Truffer, M.: Flotation and retreat of a lake-calving terminus, Mendenhall Glacier, southeast Alaska, USA, J. Glaciol., 53, 211–224, https://doi.org/10.3189/172756507782202928, 2007.
Buckel, J. and Otto J. C.: The Austrian Glacier Inventory GI 4 (2015) in ArcGis (shapefile) format, Pangaea, https://doi.org/10.1594/PANGAEA.887415, 2018.
Buckel, J., Otto, J. C., Prasicek, G., and Keuschnig, M.: Glacial lakes in Austria – distribution and formation since the Little Ice Age, Global Planet. Change, 164, 39–51, https://doi.org/10.1016/j.gloplacha.2018.03.003, 2018.
Canas, D., Chan, W. M., Chiu A., Jung-Ritchie L., Leung M., Pillay L., and Waltham B.: Potential environmental effects of expanding Lake Jökulsárlón in response to melting of Breiðamerkurjökull, Iceland, Cartographica, 50, 204–213, https://doi.org/10.3138/cart.50.3.3197G, 2015.
Carrivick J. L. and Heckmann T.: Short-term geomorphological evolution of proglacial systems, Geomorphology, 287, 3–28, https://doi.org/10.1016/j.geomorph.2017.01.037, 2017.
Carrivick, J. L. and Tweed F. S.: Proglacial lakes: character, behaviour and geological importance, Quaternary Sci. Rev., 78, 34–52, https://doi.org/10.1016/j.quascirev.2013.07.028, 2013.
Dykes, R. C., Brook, M. S., and Winkler, S.: The contemporary retreat of Tasman Glacier, Southern Alps, New Zealand, and the evolution of Tasman proglacial lake since AD 2000, Erdkunde, 64, 141–154, https://doi.org/10.3112/erdkunde.2010.02.03, 2010.
Gardelle, J., Arnaud, Y., and Berthier, E.: Contrasted evolution of glacial lakes along the Hindu Kush Himalaya mountain range between 1990 and 2009, Global Planet. Change, 75, 47–55, https://doi.org/10.1016/j.gloplacha.2010.10.003, 2011.
Gärtner-Roer, I. and Bast, A.: (Ground) Ice in the proglacial zone: landform and sediment dynamics in recently deglaciated alpine landscapes, in: Geomorphology of proglacial systems, Geography of the Physical Environment, edited by: Heckmann, T. and Morche D., Springer, Berlin, Heidelberg, Germany, 85–98, https://doi.org/10.1007/978-3-319-94184-4_6, 2019.
Harris, J. and Stöcker, H.: Handbook of Mathematics and Computational Science, Springer, New York, USA, 1998.
Harrison, S., Kargel, J. S., Huggel, C., Reynolds, J., Shugar, D. H., Betts, R. A., Emmer, A., Glasser, N., Haritashya, U. K., Klimeš, J., Reinhardt, L., Schaub, Y., Wiltshire, A., Regmi, D., and Vilímek, V.: Climate change and the global pattern of moraine-dammed glacial lake outburst floods, The Cryosphere, 12, 1195–1209, https://doi.org/10.5194/tc-12-1195-2018, 2018.
Hirschmann, S.: Die glaziale und proglaziale Übergangszone im Bereich zweier Gletscher in den Hohen Tauern, Master Thesis, University of Graz, Graz, 106 pp., available at: https://unipub.uni-graz.at/obvugrhs/content/titleinfo/1962752 (last access: 30 June 2020), 2017.
Holdsworth, G.: Ice calving into the proglacial Generator Lake, Baffin Island, NWT, Canada, J. Glaciol., 12, 235–250, 1973.
Hunter L. E. and Powell R. D.: Ice foot development at temperate tidewater margins in Alaska, Geophys. Res. Lett., 25, 1923–1926, https://doi.org/10.1029/98GL01403, 1998.
Kaufmann, V., Kellerer-Pirklbauer, A., Lieb, G. K., Slupetzky, H., and Avian, M.: Glaciological studies at Pasterze Glacier (Austria) based on aerial photographs 2003-2006-2009, in: Monitoring and Modelling of Global Changes: A Geomatics Perspective, edited by: Yang, X. and Li, J., Springer, Berlin, Heidelberg, Germany, 173–198, https://doi.org/10.1007/978-94-017-9813-6_9, 2015.
Kellerer-Pirklbauer, A.: The supraglacial debris system at the Pasterze Glacier, Austria: spatial distribution, characteristics and transport of debris, Z. Geomorphol. Supp., 52, Suppl. 1, 3–25, https://doi.org/10.1127/0372-8854/2008/0052S1-0003, 2008.
Kellerer-Pirklbauer, A. and Kulmer, B.: The evolution of brittle and ductile structures at the surface of a partly debris-covered, rapidly thinning and slowly moving glacier in 1998–2012 (Pasterze Glacier, Austria), Earth Surf Processes, 44, 1034–1049, https://doi.org/10.1002/esp.4552, 2019.
Kellerer-Pirklbauer, A., Lieb, G. K., Avian, M., and Gspurning, J.: The response of partially debris-covered valley glaciers to climate change: The Example of the Pasterze Glacier (Austria) in the period 1964 to 2006, Geogr Ann A, 90 A/4, 269–285, https://doi.org/10.1111/j.1468-0459.2008.00345.x, 2008.
Kellerer-Pirklbauer, A., Avian, M., Hirschmann, S., Lieb, G. K., Seier, G., Sulzer, W., and Wakonigg, H.: Sudden disintegration of ice in the glacial-proglacial transition zone of the largest glacier in Austria, EGU General Assembly, Vienna, Austria, 23–28 April 2017, EGU2017-12069, 2017.
King, O., Dehecq, A., Quincey, D., and Carrivick, J.: Contrasting geometric and dynamic evolution of lake and land-terminating glaciers in the central Himalaya. Global Planet Change, 167, 46–60, https://doi.org/10.1016/j.gloplacha.2018.05.006, 2018.
King, O., Bhattacharya, A., Bhambri, R., and Bolch, T.: Glacial lakes exacerbate Himalayan glacier mass loss, Sci Rep, 9, 18145, https://doi.org/10.1038/s41598-019-53733-x, 2019.
Kirkbride, M. P. and Warren, C. R.: Tasman Glacier, New Zealand: 20th-century thinning and predicted calving retreat, Global Planet Change, 22, 11–28, https://doi.org/10.1016/S0921-8181(99)00021-1, 1999.
Kneisel, C. and Hauck, C.: Electrical methods, in: Applied Geophysics in Periglacial Environments, edited by: Hauck, C. and Kneisel, C., Cambridge University Press, Cambridge, UK, 3–27, https://doi.org/10.1017/CBO9780511535628, 2008.
Krisch, P. and Kellerer-Pirklbauer, A.: Landschaftsdynamik im glazialen-proglazialen Übergangsbereich der Pasterze im Zeitraum 1998–2015, Carinthia II, 209/129, 565–580, 2019.
Lieb, G. K. and Kellerer-Pirklbauer, A.: Die Pasterze, Österreichs größter Gletscher und seine lange Messreihe in einer Ära massiven Gletscherschwundes, in: Gletscher im Wandel – 125 Jahre Gletschermessdienst des Alpenvereins, edited by: Fischer, A., Patzelt, G., Achrainer, M., Groß, G., Lieb, G. K., Kellerer-Pirklbauer, A., and Bendler, G., Springer, Heidelberg, Germany, 31–51, https://doi.org/10.1007/978-3-662-55540-8, 2018.
Liu, Q., Mayer, C., Wang, X., Nie, Y., Wu, K., Wei, J., and Liu, S.: Interannual flow dynamics driven by frontal retreat of a lake-terminating glacier in the Chinese Central Himalaya, Earth Planet. Sc. Lett, 546, 116450, https://doi.org/10.1016/j.epsl.2020.116450, 2020.
Loke, M. H. and Barker, R. D.: Rapid least-squares inversion of apparent resistivity pseudosections using a quasi-Newton method, Geophys. Prospect., 44, 131–152, https://doi.org/10.1111/j.1365-2478.1996.tb00142.x, 1996.
Loriaux, T. and Casassa, G.: Evolution of glacial lakes from the Northern Patagonia Icefield and terrestrial water storage in a sea-level rise context, Global Planet. Change, 102, 33–40, https://doi.org/10.1016/j.gloplacha.2012.12.012, 2012.
Otto, J. C.: Proglacial Lakes in High Mountain Environments, in: Geomorphology of proglacial systems, Geography of the Physical Environment, edited by: Heckmann, T. and Morche D., Springer, Berlin, Heidelberg, Germany, 231–247, https://doi.org/10.1007/978-3-319-94184-4_14, 2019.
Pant, S. R. and Reynolds J. M.: Application of electrical imaging techniques for the investigation of natural dams: an example from the Thulagi Glacier Lake, Nepal, J. Nepal Geolog. Soc., 22, 211–218, 2000.
Richardson, S. D. and Reynolds, J. M.: An overview of glacial hazards in the Himalayas, Quatern. Int., 65/66, 31–47, https://doi.org/10.1016/S1040-6182(99)00035-X, 2000.
Röhl, K.: Thermo-erosional notch development at fresh-water-calving Tasman Glacier, New Zealand, J. Glaciol., 52, 203–213, https://doi.org/10.3189/172756506781828773, 2006.
Seier, G., Kellerer-Pirklbauer, A., Wecht, W., Hirschmann, S., Kaufmann, V., Lieb, G. K., and Sulzer, W.: UAS-based change detection of the glacial and proglacial transition zone at Pasterze Glacier, Austria, Remote Sens.-Basel, 9, 549, 1–19, https://doi.org/10.3390/rs9060549, 2017.
Schomacker, A.: Expansion of ice-marginal lakes at the Vatnajökull ice cap, Iceland, from 1999 to 2009, Geomorphology, 119, 232–236, https://doi.org/10.1016/j.geomorph.2010.03.022, 2010.
Schomacker, A. and Kjær, K. H.: Quantification of dead-ice melting in ice-cored moraines at the high-Arctic glacier Holmströmbreen, Svalbard, Boreas, 37, 211–225, https://doi.org/10.1111/j.1502-3885.2007.00014.x, 2008.
Stokes, C. R., Popovnin, V., Aleynikov, A., Gurney, S. D., and Shahgedanova, M.: Recent glacier retreat in the Caucasus Mountains, Russia, and associated increase in supraglacial debris cover and supra-/proglacial lake development, Ann. Glaciol., 46, 195–203, https://doi.org/10.3189/172756407782871468, 2007.
Thompson, S. S., Benn, D. I., Dennis, K., and Luckman, A.: A rapidly growing moraine-dammed glacial lake on Ngozumpa Glacier, Nepal, Geomorphology, 145–146, 1–11, https://doi.org/10.1016/j.geomorph.2011.08.015, 2012.
Wagner, T. J., James, T. D., Murray, T., and Vella, D.: On the role of buoyant flexure in glacier calving, Geophys. Res. Lett., 43, 232–240, https://doi.org/10.1002/2015GL067247, 2016.
Warren, C., Benn, D. I., Winchester V., and Harrison, S.: Buoyancy-driven lacustrine calving, Glaciar Nef, Chilean Patagonia, J. Glaciol., 47, 135–146, https://doi.org/10.3189/172756501781832403, 2001.
Zuo Z. and Oerlemans J.: Numerical modelling of the historic front variation and the future behaviour of the Pasterze Glacier, Austria, Ann, Glaciol,, 24, 234–241, https://doi.org/10.3189/S0260305500012234, 1997.